AIChE Journal, Volume 42, No. 5, pp. 1425-1433, May 1996 PREPRINT 1 Surface Tension Prediction for Pure Fluids Joel Escobedo and G. Ali Mansoori* University of Illinois at Chicago (M/C 063) Chicago, IL 60607-7052 Abstract In this paper we propose the following expression for surface tension of organic compounds: = [P . ( l - v )] 4 where P = P o . (1-T r ) 0.37. T r . Exp(0.30066/T r + 0.86442 . T r9 ) In this equation ρ l and ρ v are the molar densities of liquid and vapor, respectively, T r =T/T c , Po is a temperature-independent compound-dependent constant similar to the Sugden's parachor. This new expression, originally derived from the statistical-mechanics is shown to represent the experimental surface tension data of 94 different organic compounds within 1.05 AAD%. We also propose P o = 39.6431.[0.22217 - 2.91042 x 10 -3 .(R*/T br2 )].Tc 13/12 / Pc 5/6 as a corresponding states expression to correlate the temperature-independent parameter Po for various compounds. In this equation R * = R m /R m,ref , R m is the molar refraction, R m,ref is the molar refraction of the reference fluid (methane), and T br is the reduced normal boiling point. When this generalized expression is used surface tensions for all the 94 compounds can be predicted within 2.57 AAD% for all temperatures investigated. ______________________________________________________________________________ (*) Corresponding author, email: m[email protected]

Welcome message from author
This document is posted to help you gain knowledge. Please leave a comment to let me know what you think about it! Share it to your friends and learn new things together.
Transcript
AIChE Journal, Volume 42, No. 5, pp. 1425-1433, May 1996 PREPRINT
1
Surface Tension Prediction for Pure Fluids Joel Escobedo and G. Ali Mansoori*
University of Illinois at Chicago (M/C 063) Chicago, IL 60607-7052
Abstract
In this paper we propose the following expression for surface tension of organic compounds:
= [P.(l - v)]4
where P = Po.(1-Tr)0.37.Tr.Exp(0.30066/Tr + 0.86442.Tr9)
In this equation ρl and ρv are the molar densities of liquid and vapor, respectively, Tr=T/Tc, Po is a temperature-independent compound-dependent constant similar to the Sugden's parachor. This new expression, originally derived from the statistical-mechanics is shown to represent the experimental surface tension data of 94 different organic compounds within 1.05 AAD%. We also propose
Po = 39.6431.[0.22217 - 2.91042 x 10⁻³.(R*/Tbr2)].Tc13/12/Pc5/6
as a corresponding states expression to correlate the temperature-independent parameter Po for
various compounds. In this equation R* = Rm/Rm,ref, Rm is the molar refraction, Rm,ref is the molar refraction of the reference fluid (methane), and Tbr is the reduced normal boiling point. When this generalized expression is used surface tensions for all the 94 compounds can be predicted within 2.57 AAD% for all temperatures investigated.
______________________________________________________________________________
(*) Corresponding author, email: [email protected]

PREPRINT
2
Surface Tension Prediction for Pure FluidsAIChE Journal, Volume 42, No. 5, pp. 1425-1433, May 1996 Introduction
One of the most striking demonstrations of the intermolecular forces is the tension at the
surface of a liquid. At the molecular level, one may consider the boundary layer at the liquid-vapor
interface to be a third phase with properties intermediate between those of a liquid and its vapor.
From a qualitative point of view, a plausible explanation of this phenomenon would be that at the
interface there are unequal forces acting upon the molecules. At low densities the molecules
experience a sidewise attraction and toward the bulk liquid, however, they experience less attraction
toward the bulk vapor phase. Therefore, there is always a tendency for the surface layer to
minimize its area according to the total mass, constraints posed by the container, and external
forces.
The surface tension (), generally employed as a quantitative index of this tension, is
defined as the force exerted in the plane of the surface per unit length (e.g. dynes/cm). Numerous
methods have been proposed to estimate the surface tension of pure liquids and liquid mixtures. An
extensive revision of these methods is given by Hirschfelder, et al. (1964). One of the simplest is
the empirical formula proposed by Macleod (1923). It expresses the surface tension of a liquid in
equilibrium with its own vapor as a function of the liquid- and vapor-phase densities as:
= K( l - v)4 (1)
where K is a constant which is independent of temperature but is characteristic of the liquid under
consideration. Sugden (1924) modified this expression as follows:
= [P.(l - v)]4 (2)
where P = K1/4, Sugden called this temperature-independent parameter (P) the parachor, and
indicated a way to estimate it from molecular structure. Quayle (1953) used experimental surface
tension and density data for numerous compounds to calculate the parachors of hydrocarbons. He
was able to suggest an additive procedure to correlate P with structural contribution.
The right-hand side of Equation 2 implies that surface tension is very sensitive to the value
of the parachor and liquid density. It has been shown that the parachor is a weak function of
temperature for a variety of fluids and within wide ranges of temperature (Macleod, 1923; Sugden,
1924; Quayle, 1953), and thus it is generally assumed to be a constant. Equation 2 has been shown
to be good for surface tension prediction, so long as experimental data for the parachor and
equilibrium densities are employed. Thus, it may be considered as an equation of state for the
interface (Boudh-Hir and Mansoori, 1990).
The good performance and extreme simplicity of its analytical form have made Equation 2 a
Surface Tension Prediction for Pure FluidsAIChE Journal, Volume 42, No. 5, pp. 1425-1433, May 1996 PREPRINT
3
very popular method for surface tension calculation (Weinaug and Katz, 1943; Lee and Chien,
1984; Hugill and van Welsenes, 1986; Gasem et al., 1989; Fanchi, 1985, 1990; Ali, 1994).
Nevertheless, there are various shortcomings on the use of this equation: (i) The parachor P is
actually a temperature-dependent parameter whose functional form with temperature was not
known, (ii) the empirical nature of the parachor poses difficulty in deriving a more accurate
expression for it, and (iii) the absolute average percent deviation (AAD%) in surface tension
prediction increases with increasing complexity of the molecular structure of the fluid under
consideration. These observations are important both from the fundamental and practical point of
view. Knowledge of the statistical-mechanical basis of Equation 1 may allow modifications to this
expression for the purpose of improving its accuracy and/or extending its use to the calculation of
interfacial tension.
Development
Macleod's empirical expression for surface tension calculation, as mentioned above, has
proven to work very well for many substances and over a wide range of temperature. Nonetheless,
deviations with respect to temperature are generally observed. Thus, efforts have been made to
derive the functionality of surface tension with respect to temperature (van der Waals, 1894; Lovett,
et al., 1973; Guggenheim, 1945). The surface tension of Argon, nitrogen, and xenon has been
measured over a very large range of temperature (Croxton, 1974). Cahn and Hilliard (1958) arrived
at a power law expression for the temperature dependence of surface tension in the critical region.
It should be pointed out, however, that a simple power law is not guaranteed to hold right for all
temperatures down to the triple point. In fact, its applicability is confined to hold valid for the
critical region (Levelt Sengers and Sengers, 1981) and for molecules of high symmetry (Croxton,
1974). Based on the principle of corresponding states, Brock and Bird (1955) developed an
expression for nonpolar liquids utilizing the power law concept applicable to temperatures away
from the critical point. The accuracy of their expression is similar to that of Equation 1. Hakim et
al.(1971) modified Brock and Bird's expression to include polar liquids. However, the general
reliability of their expression is not known since the values of the constants appearing in the
equation are known only for a few substances. Sivaraman et al. (1984) developed a correlation for
surface tension prediction of organic compounds within 0.45 < Tr < 0.97. This correlation,
however, is very sensitive to the values of the acentric factor, critical temperature, and critical
pressure. Somayajulu (1988) has proposed a three-parameter generalized equation for surface
tension from the triple point to the critical point. Although this empirical expression is very
accurate, it involves three different compound-specific parameters which are known only for the
compounds analyzed. Lopez-Perez et al. (1992) used the gradient theory to predict the surface

PREPRINT
4
tensions of nonpolar, qadrupolar, polar, and nonpolar. Their predictions are good, however, the
absolute average percent deviations observed are rather large for all the compounds that they
investigated.
In spite of the various efforts made to describe the functionality of surface tension with
respect to temperature, there is still a need for an analytic expression which would be applicable
over a larger range of temperature and valid for a variety of compounds.
From the statistical-mechanical basis of Macleod's formula it is feasible to modify this
expression in order to increase its accuracy as well as the temperature range of its applicability.
There have been a number of efforts made to justify the success of Macleod's formula from
theoretical basis (Fowler, 1937; Green, 1969; Henderson, 1980). These start from the classical
thermodynamic expression which relates the surface tension and the surface internal energy (i.e. us
= S{ - T( /∂T)]. However, the use of certain simplifying statistical-mechanical approximations
(Green, 1969; Henderson, 1980) in these approaches leads to results different from the Macleod's
equation. Thus, the temperature-dependence of surface tension is not easily observed.
Starting with the statistical-mechanical definition of the surface tension, Boudh-Hir and
Mansoori (1990) have shown that this property, as a first approximation, is given by the Macleod
formula. As a result, the law in power four of the difference in densities is obtained. However,
they have shown that the constant, K, which depends on the nature of the fluid under consideration
is not entirely independent of temperature. The only simplification to be made is to consider the
particles to interact via a generalized additive pairwise potential. This interaction, however, is
considered to depend on the position and orientations of the molecules (i.e. the particles are not
spherical and the potential is not necessarily a radial function).
The statistical-mechanical expression for surface tension derived by Boudh-Hir and
Mansoori (1990) is,
= (kT/ 4)4-2g(z/zc) (, l, v) (l - v)4
(3)
where,
(, l, v) = z1(1; )ec(1; )z2(2; )ec(2; )c(1,2)(r122 - z12
2 )dz1d1dr2d2
(3a)
In these equations, k is the Boltzmann constant; T is the temperature of the system under
consideration; =(1-Tr); g is an exponent; z = 2mkT/h2 1/2e /kT is the activity; the subscript c
denotes the value of the activity at the critical temperature (i.e. zc = 2mkTc / h2 1/2e / kTc ); µ is
the chemical potential; h is the Plank's constant; c(i; ) = c(i) ; c is the critical density; ∆c(i) =
[c(i)-cc(i)] (i.e. the value of the one-particle direct correlation function at the temperature of interest
Surface Tension Prediction for Pure FluidsAIChE Journal, Volume 42, No. 5, pp. 1425-1433, May 1996
PREPRINT
5
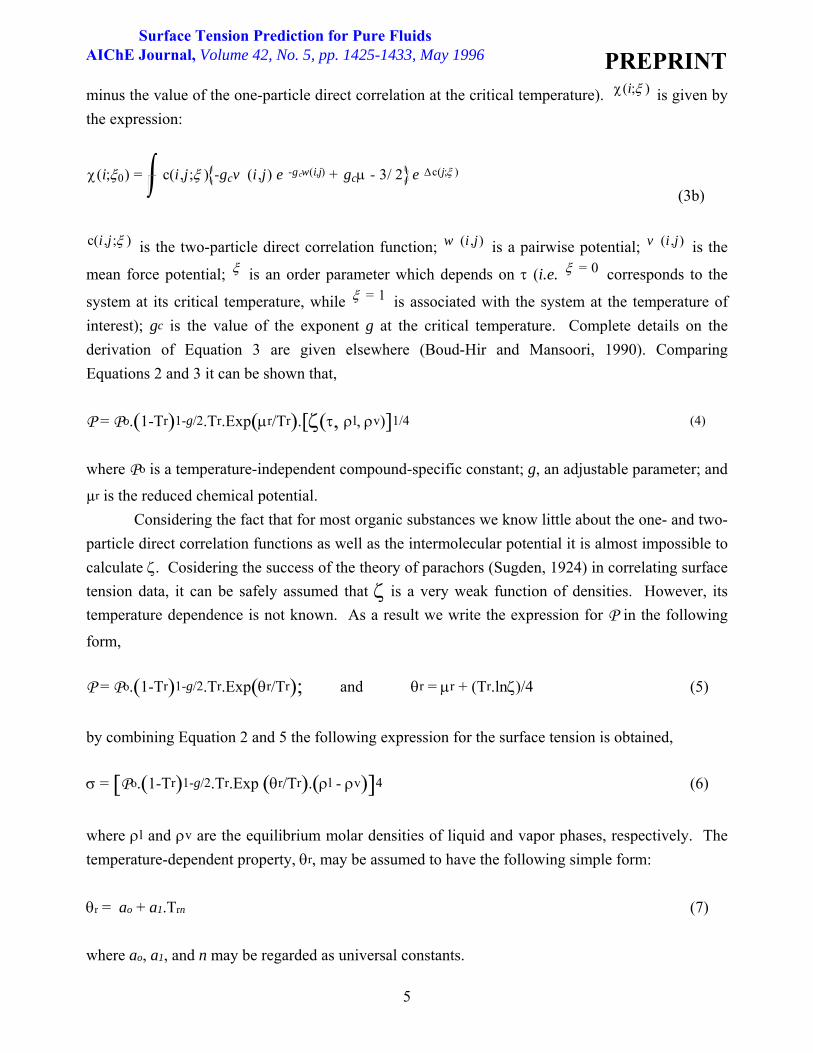
minus the value of the one-particle direct correlation at the critical temperature). (i; ) is given by
the expression:
(i;0) = c(i,j; ) -gcv (i,j) e -gcw(i,j) + gc - 3/ 2 e c(j; )
(3b)
c(i,j; ) is the two-particle direct correlation function; w (i ,j) is a pairwise potential; v (i ,j) is the
mean force potential; is an order parameter which depends on (i.e. = 0 corresponds to the
system at its critical temperature, while = 1 is associated with the system at the temperature of
interest); gc is the value of the exponent g at the critical temperature. Complete details on the
derivation of Equation 3 are given elsewhere (Boud-Hir and Mansoori, 1990). Comparing
Equations 2 and 3 it can be shown that,
P = Po.(1-Tr)1-g/2.Tr.Exp(r/Tr).[(, l, v)]1/4 (4)
where Po is a temperature-independent compound-specific constant; g, an adjustable parameter; and
µr is the reduced chemical potential.
Considering the fact that for most organic substances we know little about the one- and two-
particle direct correlation functions as well as the intermolecular potential it is almost impossible to
calculate . Cosidering the success of the theory of parachors (Sugden, 1924) in correlating surface
tension data, it can be safely assumed that is a very weak function of densities. However, its
temperature dependence is not known. As a result we write the expression for P in the following
form,
P = Po.(1-Tr)1-g/2.Tr.Exp(r/Tr); and r = r + (Tr.ln)/4 (5)
by combining Equation 2 and 5 the following expression for the surface tension is obtained,
= [Po.(1-Tr)1-g/2.Tr.Exp (r/Tr).(l - v)]4 (6)
where l and v are the equilibrium molar densities of liquid and vapor phases, respectively. The
temperature-dependent property, r, may be assumed to have the following simple form:
r = ao + a1.Trn (7)
where ao, a1, and n may be regarded as universal constants.
Surface Tension Prediction for Pure FluidsAIChE Journal, Volume 42, No. 5, pp. 1425-1433, May 1996

PREPRINT
6
The temperature correction term in Equation 6 thus derived should be valid for all
temperatures and for all compounds.
In order to evaluate the constants in Equations 6 and 7 reliable experimental data over a
wide range of temperature are needed. Recently, Grigoryev, et al.(1992) have reported
experimental surface tension data for n-Pentane, n-Hexane, n-Heptane, and n-Octane which cover
the entire temperature range from the triple point to the critical point. Thus, these data were
considered to be appropriate. After analysis of these data it was concluded that the most complete
sets of data were those of n-Hexane and n-Heptane for they cover the entire temperature range more
completely. From Equation 6 it is noticed that data for the equilibrium densities are also needed for
the analysis to be completed. Considering the fact that for most substances experimental data for
equilibrium densities may not be readily available, we decided to use an accurate equation of state
for the purpose of evaluating the constants a0, a1, and n appearing in Equation 7. This is important
since in this way we eliminate the need for experimental equilibrium density data.
Calculation of Equilibrium Densities
Recently, Riazi and Mansoori (1993) proposed a simple equation of state (R-M EOS) that
accurately predicts fluid densities. This equation is a modification of that originally proposed by
Redlich and Kwong, (1949) such that,
P = RT/(1-b) - a 2/[T 1/2.(1+b)]; b = (0.08664 RTc/Pc)•(R*,T/Tc) (8)
These authors consider the fact that for liquid systems, in which the free space between the
molecules decreases, the role of parameter b becomes more important than that of parameter a. For
this reason, "a" is considered to be constant and given by: a=0.42748RTc/Pc. Parameter b,
however, was modified using the molecular theories of perturbations and refractive index such that b=(0.08664 RTc/Pc)•(R*,Tr); R is the universal gas constant; Tc and Pc are the critical temperature
and pressure respectively; is a temperature-dependent parameter given by:
-1 = 1+{0.02[1 - 0.92.exp(- 1000 |Tr- 1|)]-0.035(Tr - 1)}(R* - 1); R* = Rm/Rm,ref
R* is a dimensionless molar refraction; Rm is the molar refraction and Rm,ref is the molar refraction
of a reference fluid which in this case is methane with a value of 6.987. Rm may be calculated
using the Lorentz-Lorenz function:
Rm = (4NA/3)[ + µ2.f(T)] = (1/)(n2-1)/(n2+2)
Surface Tension Prediction for Pure FluidsAIChE Journal, Volume 42, No. 5, pp. 1425-1433, May 1996

PREPRINT
7
NAis the Avogadro's number; is the polarizability; µ is the dipole moment; is the molar density;
and n is the sodium-D light refractive index of a liquid at 20°C and 1 atm. In this derivation, it is
considered the fact that the molar refraction is, as a first approximation, independent of temperature. Furthermore, R* is even less sensitive to temperature.
This equation was selected for density calculation and compared its predictions against the
available experimental data (Hall, 1986) for the compounds of interest. These results are reported
in Table 1 along with the properties of 94 organic compounds. From this table it can seen that
density predictions using this equation of state are good for most compounds except for those
whose molecular structure are highly assymetric and/or are polar.
The necessary vapor pressures are calculated using a recently proposed (Edalat and
Mansoori, 1993) generalized vapor pressure equation for various fluids. This new expression is as
follows,
ln (P/Pc) = [a(). + b().1.5 + c().3 + d().6] /(1 - ) (9)
In this equation,
a() = -6.1559 - 4.0855. b() = 1.5737 - 1.0540. - 4.4365 x 103.d();
c() = 0.8747 - 7.8874. d() = (-0.4893 - 0.9912. + 3.1551.2)-1; = 1- Tr
Ps is the saturation pressure, and is the acentric factor. In Table 1 shows the absolute average
percent deviation (AAD%) in the calculation of the saturation pressure at the normal boiling for all
94 compounds. It is observed that the saturation pressure at the normal boiling point is represented
within an overall AAD% of 1.76.
Results and Discussion
Equilibrium densities for n-Hexane and n-Heptane were calculated by predicting first the
saturation pressure from Equation 9 and then using Equation 8 to predict the vapor- and liquid-
phase densities. These were used along with the experimental surface tension data of Grigoryev, et
al., (1992) to evaluate the universal constants appearing in Equation 7. The values for the constants
thus obtained are: a0 = 0.30066, a1 = 0.86442, and n = 10. By introducing Equation 7 into Equation
6 using the constants just found the following new expression for the surface tension of a fluid was
obtained,
Surface Tension Prediction for Pure FluidsAIChE Journal, Volume 42, No. 5, pp. 1425-1433, May 1996
PREPRINT
8
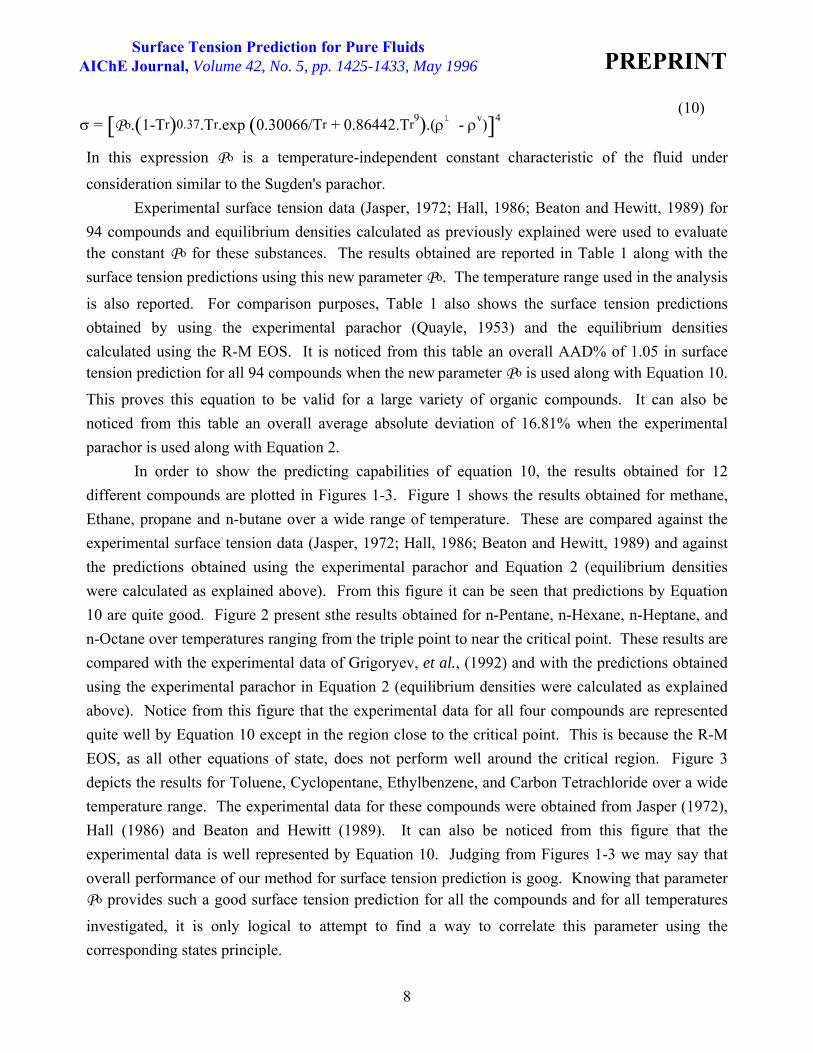
σ = [Po.(1-Tr)0.37.Tr.exp (0.30066/Tr + 0.86442.Tr9).(ρl - ρv)]4
(10)
In this expression Po is a temperature-independent constant characteristic of the fluid under
consideration similar to the Sugden's parachor.
Experimental surface tension data (Jasper, 1972; Hall, 1986; Beaton and Hewitt, 1989) for
94 compounds and equilibrium densities calculated as previously explained were used to evaluate the constant Po for these substances. The results obtained are reported in Table 1 along with the
surface tension predictions using this new parameter Po. The temperature range used in the analysis
is also reported. For comparison purposes, Table 1 also shows the surface tension predictions
obtained by using the experimental parachor (Quayle, 1953) and the equilibrium densities
calculated using the R-M EOS. It is noticed from this table an overall AAD% of 1.05 in surface tension prediction for all 94 compounds when the new parameter Po is used along with Equation 10.
This proves this equation to be valid for a large variety of organic compounds. It can also be
noticed from this table an overall average absolute deviation of 16.81% when the experimental
parachor is used along with Equation 2.
In order to show the predicting capabilities of equation 10, the results obtained for 12
different compounds are plotted in Figures 1-3. Figure 1 shows the results obtained for methane,
Ethane, propane and n-butane over a wide range of temperature. These are compared against the
experimental surface tension data (Jasper, 1972; Hall, 1986; Beaton and Hewitt, 1989) and against
the predictions obtained using the experimental parachor and Equation 2 (equilibrium densities
were calculated as explained above). From this figure it can be seen that predictions by Equation
10 are quite good. Figure 2 present sthe results obtained for n-Pentane, n-Hexane, n-Heptane, and
n-Octane over temperatures ranging from the triple point to near the critical point. These results are
compared with the experimental data of Grigoryev, et al., (1992) and with the predictions obtained
using the experimental parachor in Equation 2 (equilibrium densities were calculated as explained
above). Notice from this figure that the experimental data for all four compounds are represented
quite well by Equation 10 except in the region close to the critical point. This is because the R-M
EOS, as all other equations of state, does not perform well around the critical region. Figure 3
depicts the results for Toluene, Cyclopentane, Ethylbenzene, and Carbon Tetrachloride over a wide
temperature range. The experimental data for these compounds were obtained from Jasper (1972),
Hall (1986) and Beaton and Hewitt (1989). It can also be noticed from this figure that the
experimental data is well represented by Equation 10. Judging from Figures 1-3 we may say that
overall performance of our method for surface tension prediction is goog. Knowing that parameterPo provides such a good surface tension prediction for all the compounds and for all temperatures
investigated, it is only logical to attempt to find a way to correlate this parameter using the
corresponding states principle.
Surface Tension Prediction for Pure FluidsAIChE Journal, Volume 42, No. 5, pp. 1425-1433, May 1996

PREPRINT
9
Following the principle of corresponding states (Hirschfelder, 1964) a reduced surface
tension may be defined and expected to be a universal function of the reduced temperature, as
follows,
r = /[Pc 2/3.(kTc)1/3] (11)
From Equations 10 and 11 it can be shown that a reduced parameter Pr can be expressed as follows,
Pr = Po.Pc 5/6/(39.6439 Tc
13/12) (12)
According to the principle of corresponding states, it is expected that a reduced parameter thus defined would be a universal function of the acentric factor. The calculated values of Pr for all 94
compounds listed in Table 1 were plotted against the acentric factor in Figure 4. From this figure
one may notice a trend as a function of acentric factor. However, the scattering of the data is rather large. Therefore, we concluded that attempts to correlate our reduced parameter (Pr) to acentric
factor would not be a feasible approach. From the Lorentz-Lorenz function for molar refraction (Rm) defined earlier in this paper,
one may notice that this quantity (Rm) depends on the polarizability of the molecule and the dipole
moment. Furthermore, the molar refraction provides an approximate measure of the actual volume
(without free space) of the molecules per unit mole (Hirschfelder, 1964). Therefore it implicitly accounts for the asymmetry of the molecules. This fact gave the authors confidence that Rm would
be useful in finding a good correlation for Pr. It has also been found that substances with higher
polarities have higher viscosities, normal boiling and freezing points. Therefore, Rm and the
normal-boiling-point temperature could be useful for the purposes at hand. In Figure 2 the reduced parachor Pr (value at the normal boiling point, Tb) versus R*/Tbr
2
have been plotted. R* as previously defined and Tbr is the reduced normal boiling point
temperature. Judging from Figure 5 it may be said that there is a clear relationship between Pr and
R*/Tbr2. Thus, the following simple correlation for Pr was obtained,
Pr = 0.22217 - 2.91042 x 10⁻³.( R*/Tbr2) (13)
Therefore, the new expression proposed to predict parameter Po in equation 10 is the following,
Po = 39.6431.[0.22217 - 2.91042 x 10⁻³.( R*/Tbr2)].Tc
13/12/ Pc5/6 (14)
Equations 10 and 14 were used along with the Riazi-Mansoori equation to predict the surface
tension for the 94 compounds of interest. These results are reported in Table 1 from which it can
Surface Tension Prediction for Pure FluidsAIChE Journal, Volume 42, No. 5, pp. 1425-1433, May 1996

PREPRINT
10
seen that the predictions obtained from these new equations are quite good. The experimental
surface tension data for all 94 compounds can be represented within an absolute average deviation
(AAD%) of 2.57% for all temperatures investigated.
Hugill and van Welsenes, (1986) proposed the following correlation for the prediction of the
Sugden's parachor:
P = 40.1684.(0.151 - 0.0464.). Tc 13/12/ Pc5/6. (15)
For comparison purposes this correlation was used to predict the surface tension for the compounds
of interest using Equation 2 and calculating the densities as explained above. These results are also
reported in Table 1. From this table it may be noticed an overall absolute average deviation of
16.75% for all temperatures investigated for this correlation.
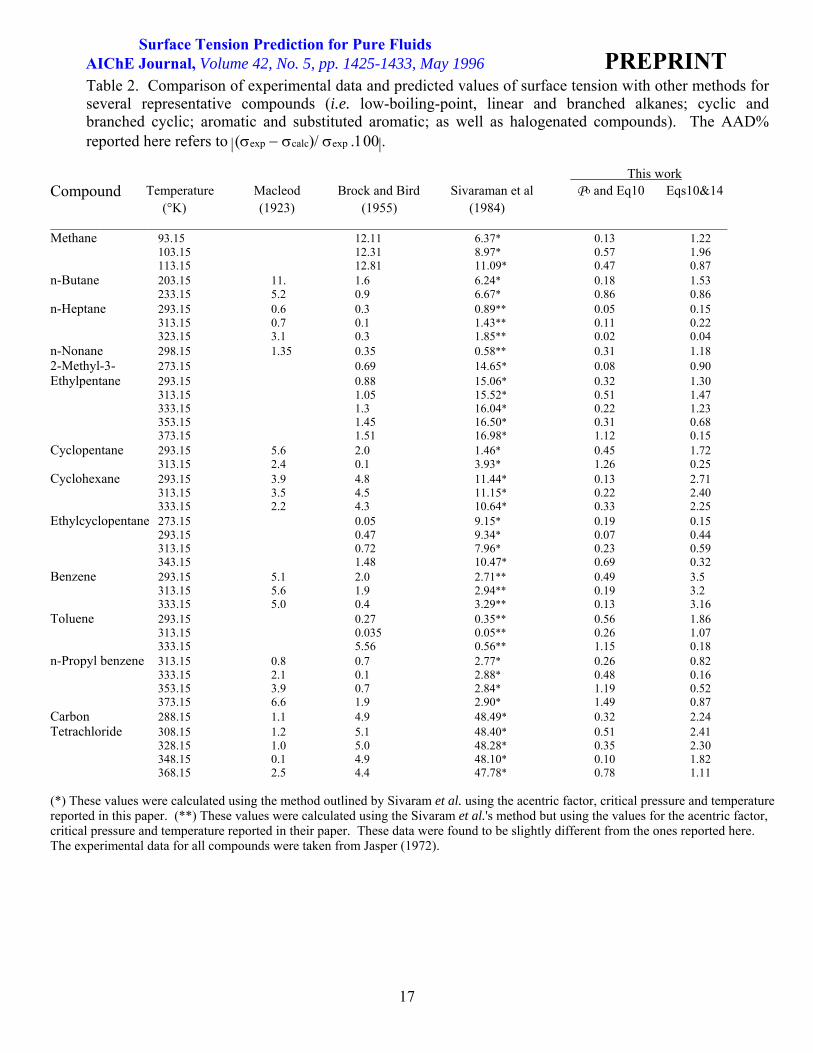
Table 2 contains the comparisons made between the experimental surface tension data and
the values predicted by the present method and by other methods (Macleod, 1923; Brock and Bird,
1955; Sivaraman, 1984). This table shows that the method proposed in this paper for surface
tension calculation performs better than the other methods. It can also be noticed that it performs
equally well for all representative compounds (i.e. low-boiling-point, linear and branched alkanes,
cyclic and branched cyclic, aromatic and alkyl-substituted aromatic, as well as halogenated
compounds). It should be pointed out that the method proposed by Sivaram et al. (1984) was found
to be very sensitive to the values of acentric factor employed and to a lesser extent to the values of
the critical pressure and temperature. On the other hand, the method proposed in this work is not
very sensitive to the value of these physical properties.
CONCLUSIONS
This paper presents a new expression for surface tension which contains a temperature
correction term derived from statistical mechanics. It also introduces a corresponding-states correlation to predict the parameter Po in this new equation as a function of molar refraction and
normal boiling point temperature. This represents an accurate and generalized expression to predict
surface tensions of pure fluids of industrial interest.
Acknowledgement
This research is supported by the National Science Foundation, Grant No. CTS-9108395.
Surface Tension Prediction for Pure FluidsAIChE Journal, Volume 42, No. 5, pp. 1425-1433, May 1996
PREPRINT
11
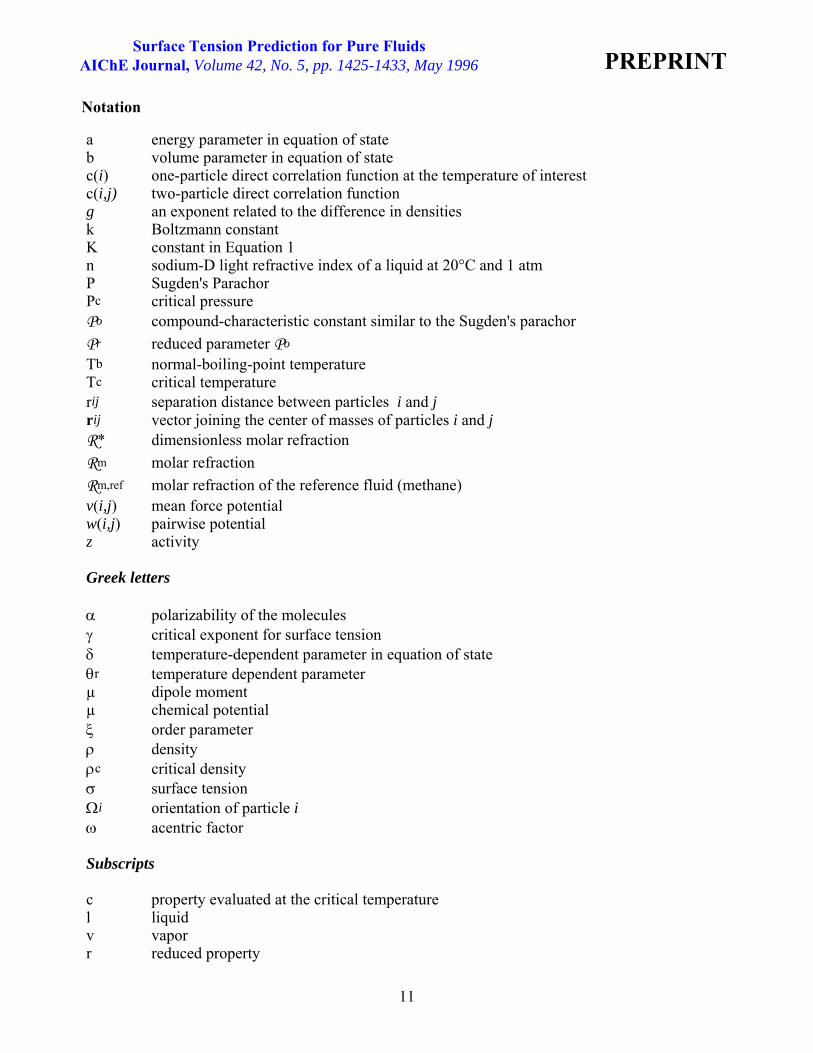
Notation
a energy parameter in equation of state b volume parameter in equation of state c(i) one-particle direct correlation function at the temperature of interest c(i,j) two-particle direct correlation function g an exponent related to the difference in densities k Boltzmann constant K constant in Equation 1 n sodium-D light refractive index of a liquid at 20°C and 1 atm P Sugden's Parachor Pc critical pressure Po compound-characteristic constant similar to the Sugden's parachor
Pr reduced parameter Po Tb normal-boiling-point temperature Tc critical temperature rij separation distance between particles i and j rij vector joining the center of masses of particles i and j R* dimensionless molar refraction
Rm molar refraction
Rm,ref molar refraction of the reference fluid (methane) v(i,j) mean force potential w(i,j) pairwise potential z activity
Greek letters
polarizability of the molecules critical exponent for surface tension temperature-dependent parameter in equation of state r temperature dependent parameter µ dipole moment µ chemical potential order parameter density c critical density surface tension i orientation of particle i acentric factor
Subscripts
c property evaluated at the critical temperature l liquidv vapor r reduced property
Surface Tension Prediction for Pure FluidsAIChE Journal, Volume 42, No. 5, pp. 1425-1433, May 1996

PREPRINT
12
Literature Cited
Ali, J.K., "Prediction of Parachors of Petroleum Cuts and Pseudocomponents," Fluid Phase Equil.,
95, 383 (1994).
Beaton, C.F., and G.F. Hewitt, Physical Property Data for the Design Engineer; Hemisphere
Publishing Corp., New York, NY, (1989).
Boudh-Hir, M.E., and G.A. Mansoori, "Statistical Mechanics Basis of Macleod's Formula," J.
Phys. Chem., 94, 8362 (1990).
Brock, J.R., and R.B. Bird, "Surface Tension and the Principle of Corresponding States," AIChE
J., 1, 174 (1955).
Cahn, J.W., and J.E. Hilliard, "Free Energy of a Nonuniform System. I. Interfacial Free Energy,"
J. Chem. Phys., 28, 258 (1958).
Croxton, C.A., Liquid State Physics - A Statistical Mechanical Introduction, Cambridge University
Press, Cambridge, pp. 141-189 (1974).
Croxton, C.A., Fluid Interfacial Phenomena, John Wiley & Sons, New York, NY (1986).
Edalat, M., R.B. Bozar-Jomehri, and G.A. Mansoori, "Generalized Equation predicts vapor
pressure of hydrocarbons," Oil and Gas J., Feb. 1, 39 (1993).
Fanchi, J.R., "Calculation of Parachors for Compositional Simulation," SPE J., November, 2049
(1985).
Fanchi, J.R., Calculation of Parachors for Compositional Simulation: An Update," SPE Reservoir
Eng. J., August, 433 (1990).
Fowler, R.H., "A Tentative Statistical Theory of Macleod's Equation for Surface Tension, and the
Parachor," Proc. R. Soc., A159, 229 (1937).
Green, H.S., The Molecular Theory of Fluids, Dover Publications, New York, NY, p. 194, (1969).
Surface Tension Prediction for Pure FluidsAIChE Journal, Volume 42, No. 5, pp. 1425-1433, May 1996

PREPRINT
13
Gasem, K.A.M., P.B. Dulcamara, B.K. Dickson, and R.L. Robinson, Jr., "Test of Prediction
Methods for Interfacial Tensions of CO2 and Ethane in Hydrocarbon Solvents," Fluid Phase
Equil., 53, 39 (1989).
Grigoryev, B.A., B.V. Nemzer, D.S. Kurumov, and J.V. Sengers, "Surface Tension of Normal
Pentane, Hexane, Heptane, and Octane," Int. J. Thermophys., 13, 453 (1992).
Guggenhein, E.A., "The Principle of Corresponding States," J. Chem. Phys., 13, 253 (1945).
Hakim, D.I., D. Steinberg, and L.I. Stiel, "Generalized Relationship for the Surface Tension of
Polar Fluids," Ind. Eng. Chem. Fundam., 10, 174 (1971).
Hall, K.R. (Ed.) TRC Thermodynamic Table - Hydrocarbons, Thermodynamic Research Center,
Texas A&M University System, (1986).
Henderson, J.R., "Surface Tension Compressibility Relation," Mol. Phys., 39, 709 (1980).
Hirschfelder, J.O., C.F. Curtiss, and R.B. Bird, Molecular Theory of Gases and Liquids. John
Wiley & sons, New York, NY, pp. 336-356, 271, 870-888 (1964).
Hugill, J.A., and A.J. van Welsenes, "Surface Tension: A Simple Correlation for Natural Gas +
Condensate Systems," Fluid Phase Equil., 29, 383 (1986).
Jasper, J.J., "The Surface Tension of Pure Liquid Compounds," J. Phys. Chem. Ref. Data, 1, 841
(1972).
Lee, S.-T., and M.C.H. Chien, "A New Multicomponent Surface Tension Correlation Based on
Scaling Theory," SPE/DOE 12643. Paper presented at SPE/DOE 4th Symp. on EOR. Tulsa, OK,
April 15-18, (1984)
Levelt-Sengers, J.M.H., and J.V. Sengers, in Perspectives in Statistical Physics, North Holland,
Amsterdam, The Netherlands, p. 239, (1981).
Lovett, R.A., P.W. DeHaven, J.J. Vieceli, and F.P. Buff, "Generalized van der Waals Theories for
Surface Tension and Interfacial Width," J. Chem. Phys., 58, 1880 (1973).
Surface Tension Prediction for Pure FluidsAIChE Journal, Volume 42, No. 5, pp. 1425-1433, May 1996

PREPRINT
14
Macleod, D.B,. "Relation Between Surface Tension and Density," Trans. Faraday Soc., 19, 38
(1923).
Perez-Lopez, J.H., L.J. Gonzales-Ortiz, M.A. Leiva, and J.E. Puig, "Estimation of Surface Tension
of Pure Fluids Using the Gradient Theory," AIChE J., 38, 753 (1992).
Quayle, O.R., "Surface Tension and Parachor of Hydrocarbons," Chem. Rev., 53, 439 (1953).
Reid, C.R., J.M. Prausnitz,and B.F. Poling, The Properties of Gases and Liquids. McGra-Hill, 4th Edition, New York, NY, pp. 632-655 (1988).
Sugden, S., "The Variation of Surface Tension with Temperature and some Related Functions," J.
Chem. Soc., 125, 32 (1924).
Riazi, M.R., and G.A. Mansoori, "Simple Equation of State Accurately Predicts Hydrocarbon
Densities," Oil and Gas J., July 12, 108 (1993).
Sivaraman, A., J. Zega, and R. Kobayashi, "Correlation for Prediction of Interfacial Tensions of
Pure Alkane, Naphthenic, and Aromatic Compounds between their Freezing and Critical Points,"
Fluid Phase Equil., 18, 225 (1984)
Somayajulu, G.R., "A Generalized Equation for Surface Tension from the Triple Point to the
Critical Point," Int. J. Thermophys., 9, 559 (1988).
van der Waals, J.D., Thermodynamische Theorie der Kapillarität unter Voraussetzung stetiger
Dichteänderung," Z. Physik. Chem., 13, 657 (1894).
Weeks, J.D., and W. van Saarlos, "Implications of the Triezenberg-Zwanzig Surface Tension
Formula for Models of Interface Structure." J. Phys. Chem., 93, 6969 (1989).
Weinaug, C.F., and D.L. Katz, "Surface Tensions of Methane-Propane Mixtures," Ind. Eng.
Chem., 35, 239 (1943).
Wertheim, M.S., "Correlations in the Liquid-Vapor Interface," J. Phys. Chem., 65, 2377 (1976).
Surface Tension Prediction for Pure FluidsAIChE Journal, Volume 42, No. 5, pp. 1425-1433, May 1996

PREPRINT
15
Table 1. Properties of organic compounds and comparisons against experimental data for density and surface tension over the temperature ranges indicated. The comparisons of saturation pressure at the normal boiling point are also shown in this table.
Compound Tc Pc R* Tb P P0 Temp. AAD% AAD% AAD%, Surface Tension (°K) (bar) (°K) Range (°K) Prediction using
density Psat (Tb) Po Exp P Calc Po Calc P Eq10 Eq.2 Eqs10,14 Eqs.2,15
Methane 190.4 46. 1.0 0.011 111.6 72.6 102.31 90 - 170 0.90 1.74 3.39 5.52 3.96 7.57 Ethane 305.4 48.8 1.620 0.099 184.6 110.5 158.50 113 - 280 1.10 0.87 3.18 11.54 4.00 8.16 Propane 369.6 42.5 2.259 0.153 231.1 150.8 215.23 143 - 330.7 1.40 1.06 4.38 10.05 4.52 8.21 n-Butane 425.2 38. 2.929 0.199 272.7 190.3 270.21 173.- 385 1.10 0.50 1.86 6.72 6.72 6.23 Ethylene 282.4 50.4 1.504 0.089 169.3 100.2 143.20 113 - 173 1.30 0.09 1.64 4.05 1.88 1.87 Iso-butane 408.2 36.5 2.955 0.183 261.4 * 266.81 173 - 283 1.40 0.05 0.60 ** 1.90 7.41 n-pentane 469.7 33.7 3.616 0.251 309.2 231.5 327.75 156 - 440 1.22 0.11 2.30 4.53 2.33 5.68 Iso-Pentane 460.4 33.9 3.620 0.227 301.0 230.0 318.29 273- 313 1.50 0.35 0.67 5.98 0.93 5.62 n-Hexane 507.4 30.1 4.281 0.299 341.9 270.4 387.60 175.12 - 4501.46 0.16 1.55 7.30 2.84 4.26 2-Methylpentane 497.5 30.1 4.286 0.278 333.4 270.0 376.96 273 - 343 0.57 0.11 0.84 2.60 0.82 4.61 3-Methylpentane 504.5 31.2 4.265 0.272 336.4 267.7 370.33 273 - 343 1.64 0.19 0.26 6.57 0.83 6.84 2,2-Dimethylbutane 488.8 30.8 4.289 0.232 322.8 266.4 358.62 273 - 303 4.83 0.26 0.62 18.79 2.95 16.60 2,3-Dimethylbutane 500. 31.3 4.267 0.247 331.1 266.2 363.54 273 - 333 2.93 0.12 0.51 12.24 2.52 13.25 n-Heptane 540.3 27.4 4.945 0.349 371.6 310.8 441.60 183.21 - 5080.49 0.03 3.87 4.99 3.74 4.84 2-Methylhexane 530.4 27.3 4.951 0.329 363.2 309.2 431.63 273 - 333 0.83 0.11 0.42 3.18 0.40 4.32 3-Methylhexane 535.3 28.1 4.932 0.323 365.0 307.4 424.71 283 - 313 2.10 0.31 0.31 7.64 0.57 6.14 n-Octane 568.8 24.9 5.608 0.398 398.8 351.2 500.25 218.15 - 5200.49 0.06 2.86 6.11 3.81 3.84 2-Methylheptane 559.6 24.8 5.614 0.378 390.8 348.8 487.74 273 - 333 0.84 0.11 0.27 3.16 0.45 4.58 3-Methylheptane 563.7 25.5 5.596 0.370 392.1 347.7 480.19 273 - 333 1.99 0.17 0.18 8.53 0.27 5.99 4-methylheptane 561.7 25.4 5.599 0.371 390.9 347.4 479.88 273 - 333 2.01 0.08 0.17 8.38 0.27 5.82 n-Nonane 594.6 22.9 6.274 0.445 424.0 391.1 551.20 273 - 343 0.14 0.30 0.59 0.86 0.95 0.50 Cyclopentane 511.7 45.1 3.310 0.196 322.4 205.0 284.50 273 - 470 1.81 0.04 3.66 8.82 4.70 8.96 Methylcyclopentane 532.7 37.8 3.984 0.231 345.0 242.8 336.09 273 - 343 2.14 0.12 0.31 6.76 0.29 11.54 Cyclohexane 553.5 40.7 3.966 0.212 353.8 241.7 330.37 273 - 343 3.81 0.33 0.30 12.82 2.40 13.56 1,1-Dimethylcyclopentane
547. 34.4 4.648 0.273 361.0 281.2 364.11 273 - 343 + 1.70 0.21 39.90 3.82 17.96 Methylcyclohexane 572.2 34.7 4.652 0.236 374.1 281.3 379.74 273 - 343 4.55 0.01 1.27 19.14 2.36 24.45 Ethylcyclopentane 569.4 34. 4.637 0.271 376.6 283.3 387.56 273 - 343 3.06 0.00 0.23 12.90 0.54 14.64 1,1-Dimethylcyclohexane
591. 29.6 5.302 0.238 392.7 318.8 446.73 273 - 333 + 0.40 0.43 3.36 2.52 27.56 1,2-Dimethylcyclohexane Cis
606. 29.6 5.273 0.236 402.9 317.4 462.23 273 - 333 + 1.57 0.90 11.04 4.73 24.87 1,2-Dimethylcyclohexane Trans
596. 29.6 5.314 0.242 396.6 320.3 448.75 273 - 333 + 0.78 0.33 3.58 0.66 29.43 1,3-Dimethylcyclohexane Cis
591. 29.6 5.338 0.224 393.3 321.3 441.06 273 - 333 + 6.08 0.62 12.24 2.31 36.76 1,3-Dimethylcyclohexane Trans
598. 29.7 5.297 0.189 397.6 318.7 451.19 273 - 333 + 16.38 0.68 0.60 2.35 36.32 1,4-Dimethylcyclohexane Cis
598. 29.7 5.224 0.234 397.5 318.8 451.56 273 - 333 + 2.28 0.42 0.83 1.73 28.07 1,4-Dimethylcyclohexane Trans
587.7 29.7 5.339 0.242 392.5 322.7 437.27 273 - 333 + 4.99 0.75 18.11 2.72 33.28 Ethylcyclohexane 609.0 30. 5.297 0.243 404.9 320.6 456.63 273 - 343 0.85 0.95 1.12 2.94 2.60 26.69 Benzene 562.2 48.9 3.748 0.212 353.2 206.14 289.59 283 - 343 0.20 0.43 0.55 1.42 2.77 11.87 Toluene 591.8 41. 4.450 0.263 383.8 245.9 348.29 273 - 550 + 0.17 2.20 6.13 3.34 11.59 o-Xylene 630.3 37.3 5.124 0.310 417.6 283.3 394.89 273 - 343 1.26 0.02 0.62 6.39 0.65 16.90 m-Xylene 617.1 35.4 5.147 0.325 412.3 284.3 404.15 273- 343 0.56 0.11 0.87 1.98 0.94 13.00 p-Xylene 616.2 35.1 5.153 0.320 411.5 283.8 405.92 293 - 343 0.75 0.12 0.70 4.37 0.71 14.27 Ethylbenzene 617.2 36. 5.118 0.302 409.3 284.3 398.69 273 - 593 0.70 0.26 1.18 6.83 1.43 12.46 1,2,3-Trimethylbenzene 664.5 34.5 5.790 0.366 449.3 317.8 437.30 273 - 373 2.81 0.32 0.88 12.09 1.63 17.46 1,2,4-Trimethylbenzene 649.2 32.3 5.824 0.376 442.5 320.4 452.94 273 - 343 0.27 0.36 0.58 1.02 0.58 13.78 1,3,5-Trimethylbenzene 627.3 31.3 5.842 0.399 437.9 * 457.05 273 - 343 0.23 0.11 0.74 ** 0.74 8.63 n-Decane 617.7 21.2 6.915 0.489 447.3 431.15 602.86 273 - 393 0.74 1.06 1.28 3.65 1.28 0.55 n-Undecane 638.8 19.7 7.962 0.535 469.1 470.5 646.66 273 - 393 2.76 1.11 1.31 11.77 1.37 4.30 n-Tridecane 676. 17.2 8.935 0.619 508.6 550.55 757.61 283 - 393 2.80 0.40 1.32 11.62 1.31 1.34 2,2-Dimethylhexane 549.9 25.3 5.618 0.338 380.0 346.05 467.32 273 - 323 4.50 0.01 0.83 17.83 1.88 13.02
Surface Tension Prediction for Pure FluidsAIChE Journal, Volume 42, No. 5, pp. 1425-1433, May 1996

PREPRINT
16
Table 1. Continued...
Compound Tc Pc R* Tb P P0 Temp. AAD% AAD% AAD%, Surface Tension (°K) (bar) (°K) Range (°K) Prediction using
density Psat (Tb) Po Exp P Calc Po Calc P Eq10 Eq.2 Eqs10,14 Eqs.2,15
2,4-DimethylHexane 553.5 25.6 5.600 0.343 382.6 345.2 466.63 273 - 323 4.47 0.19 0.71 17.85 1.57 11.75 2,5-Dimethylhexane 550.1 24.9 5.620 0.356 382.3 346.3 475.67 273 - 373 2.74 0.13 0.82 10.10 1.19 8.49 3,3-Dimethylhexane 562. 26.5 5.583 0.320 385.1 343.05 458.96 273 - 323 5.57 0.10 0.69 22.61 2.31 17.52 3,4-Dimethylhexane 568.9 26.9 5.561 0.338 390.9 342.5 461.68 273 - 333 4.82 0.12 0.54 19.15 0.99 12.48 2-Methyl-3-Ethylpentane 567.1 27. 5.589 0.330 388.8 338.3 458.16 273 - 323 5.47 0.16 0.40 16.90 1.08 14.18 3-Methyl-3-Ethylpentane 576. 28.1 5.542 0.303 391.4 340.1 448.01 273 - 323 7.28 0.02 0.46 30.86 2.77 22.13 2,2,4-Trimethylpentane 544. 25.7 5.620 0.303 372.4 344.3 451.63 273- 363 7.00 0.07 0.62 32.36 4.30 23.08 2,2-Dimethylheptane 576.8 23.5 6.286 0.390 405.9 373.1 513.69 283 - 323 5.34 0.17 0.67 10.48 3.48 14.79 2,2,4-Trimethylhexane 573.7 23.5 6.304 0.321 399.7 381.6 505.73 283 - 333 5.91 6.31 0.21 28.53 2.80 27.53 2,2,5-Trimethylhexane 568. 23.7 6.288 0.357 397.2 383.9 507.84 283 - 333 5.84 0.02 0.19 29.34 3.26 20.81 3,3-Diethylpentane 610. 26.7 6.172 0.338 419.3 * 488.40 273 - 333 8.28 0.50 0.48 ** 3.25 26.84 2,2,3,4-Tetramethylpentane
592.7 26. 6.279 0.313 406.1 378.65 481.35 283 - 323 10.9 25.41 0.24 52.68 0.24 33.55 n-Propylcyclopentane 603. 30. 5.307 0.335 404.1 * 450.04 273 - 373 1.21 14.81 0.60 ** 0.59 12.74 Iso-propylcyclopentane 601. 30. 5.297 0.240 399.6 * 446.28 273 - 373 + 1.85 0.89 ** 1.09 30.55 n-Propylcyclohexane 639. 28. 5.965 0.258 429.9 360.4 499.48 273 - 343 2.49 2.20 0.40 9.10 2.08 35.50 Iso-butylcyclohexane 659. 31.2 6.635 0.319 444.5 397.7 442.55 273 - 373 + 0.60 2.08 161.78 15.91 60.92 Sec-butylcyclohexane 669. 26.7 6.593 0.264 452.5 397.5 533.01 273- 373 + 1.37 1.37 24.42 1.38 48.08 Tert-butylcyclohexane 659. 26.6 6.599 0.252 444.7 394.65 524.52 273 - 373 + 1.79 1.62 28.64 1.63 51.89 1-Hexene 504. 31.7 4.181 0.285 336.6 * 437.18 273 - 333 1.54 0.52 0.71 ** 0.68 2.59 1-Octene 566.7 26.2 5.550 0.386 394.4 * 472.71 273 - 373 0.76 0.30 0.25 ** 0.45 2.77 1-Decene 615. 22. 6.880 0.558 486.5 * 581.81 273 - 373 1.70 0.10 0.79 ** 0.80 0.72 1-Dodecene 657. 318.5 8.206 0.558 486.5 * 704.61 273 - 373 0.29 0.60 0.94 ** 1.97 0.54 n-Propylbenzene 638.2 32. 5.790 0.344 432.4 323.35 448.29 273 - 373 2.01 0.25 1.04 8.14 1.05 17.58 Iso-propylbenzene (Cumene)
631.1 32.1 5.786 0.326 425.6 321.1 440.06 273 - 373 3.19 0.16 1.22 13.07 1.22 22.16 2-EthylToluene 651. 30.4 5.790 0.294 438.3 320.0 483.96 273 - 373 6.50 1.51 1.10 23.41 6.11 20.17 3-Ethyltoluene 637. 28.4 5.816 0.360 434.5 322.15 503.41 273 - 373 9.58 7.98 1.73 32.43 6.93 6.76 4-Ethyltoluene 640. 29.4 5.833 0.322 435.2 323.3 486.78 273 - 373 6.15 1.52 1.57 22.29 3.93 16.98 n-Butylbenzene 660.5 28.9 6.455 0.393 456.5 362.9 497.21 273 - 373 3.08 0.04 1.74 13.95 1.89 18.91 Iso-Butylbenzene 650. 31.4 6.471 0.380 445.9 360.3 445.77 273 - 373 + 3.13 1.01 70.96 9.33 32.28 Sec-Butylbenzene 664. 29.4 6.445 0.274 442.3 359.95 488.71 273 - 373 + 2.25 1.22 18.24 1.21 45.00 Tert-Butylbenzene 660. 29.6 6.440 0.265 442.3 356.8 481.45 273 - 373 + 1.78 1.31 21.10 1.39 48.27 1,4-Diethylbenzene 657.9 28. 6.518 0.404 456.9 361.45 509.95 273 - 373 + 0.31 1.44 1.28 1.45 15.53 1-Methylnaphthalene 772. 36. 6.980 0.310 517.9 353.8 483.33 273 - 303 3.81 0.11 0.60 17.63 5.39 44.00 1-Tetradecene 689. 15.6 9.471 0.644 524.3 * 839.84 293 - 373 2.12 8.15 0.94 ** 3.31 4.94 Carbon Tetrachloride 556.4 49.6 3.784 0.193 349.9 219.68 279.37 288 - 525 + 8.95 2.62 42.64 2.73 15.50 Chloroform 536.4 53.7 3.071 0.218 334.3 183.4 260.02 288 - 348 + 1.88 0.76 3.29 1.98 1.49 1,1,2-Tricloroethane 606. 51.4 3.701 0.2598 386.7 223.8 304.39 288 - 378 + 5.76 0.65 15.34 4.57 0.84 1-Chlorobutane 542. 36.8 3.641 0.218 351.6 230.3 359.96 283 - 343 + 3.23 0.41 34.34 5.96 1.68 Fluorobenzene 560.1 45.5 3.742 0.244 357.9 214.15 306.62 283 - 353 + 0.07 0.21 5.92 1.40 6.24 Chlorobenzene 632.4 45.2 4.458 0.249 404.9 244.4 344.11 283 - 403 + 0.05 0.69 0.84 2.85 15.98 Bromobenzene 670. 45.2 4.858 0.251 429.2 258.32 359.26 283 - 423 + 0.11 1.20 6.25 1.34 25.58 Iodobenzene 721. 45.2 5.602 0.249 461.6 279.19 378.58 283 - 433 + 0.11 1.26 18.48 1.66 41.41 Acetone 508.1 47. 2.316 0.304 329.2 161.22 297.03 293 - 333 + 0.27 2.71 66.20 18.89 35.07 Benzonitrile 699.4 42.2 4.500 0.362 464.3 * 414.43 293 - 363 + 0.21 0.53 ** 6.70 6.072 Dibutylether 580. 25.3 5.866 0.502 413.4 * 493.37 283 - 393 + 2.37 0.11 ** 0.22 12.64 Cyclooctane 647.2 35.6 5.255 0.236 422.0 315.15 417.11 283 - 393 + 0.26 1.82 29.38 1.87 34.57 OVERALL AAD% 2.80 1.76 1.05 16.81 2.57 16.75
(*) The experimental parachor for these substances was not available (+) Experimental densities for these compounds are not readily available (**) These values could not be calculated since there are no experimental parachor data available. Experimental densities were taken from Hall, 1986; experimental surface tensions from Jasper (1972), Hall (1986), Grigiryev et al. (1992), Beaton and Hewitt (1989); the physical properties Tc, Pc, , and Tb from Reid et al. (1988). R* = Rm/Rm,ref, Rm data were taken from Hall (1986) or calculated using the Lorentz-Lorenz function, Rm,ref = 6.987 for the reference fluid (methane). Experimental parachor data were taken from Quayle (1953).
Surface Tension Prediction for Pure FluidsAIChE Journal, Volume 42, No. 5, pp. 1425-1433, May 1996
PREPRINT
17
Table 2. Comparison of experimental data and predicted values of surface tension with other methods for several representative compounds (i.e. low-boiling-point, linear and branched alkanes; cyclic and branched cyclic; aromatic and substituted aromatic; as well as halogenated compounds). The AAD% reported here refers to (expcalcexp
This workCompound Temperature Macleod Brock and Bird Sivaraman et al Po and Eq10 Eqs10&14
(°K) (1923) (1955) (1984) _____________________________________________________________________________________________________ Methane 93.15 12.11 6.37* 0.13 1.22
103.15 12.31 8.97* 0.57 1.96 113.15 12.81 11.09* 0.47 0.87
n-Butane 203.15 11. 1.6 6.24* 0.18 1.53 233.15 5.2 0.9 6.67* 0.86 0.86
n-Heptane 293.15 0.6 0.3 0.89** 0.05 0.15 313.15 0.7 0.1 1.43** 0.11 0.22 323.15 3.1 0.3 1.85** 0.02 0.04
n-Nonane 298.15 1.35 0.35 0.58** 0.31 1.18 2-Methyl-3- 273.15 0.69 14.65* 0.08 0.90 Ethylpentane 293.15 0.88 15.06* 0.32 1.30
313.15 1.05 15.52* 0.51 1.47 333.15 1.3 16.04* 0.22 1.23 353.15 1.45 16.50* 0.31 0.68 373.15 1.51 16.98* 1.12 0.15
Cyclopentane 293.15 5.6 2.0 1.46* 0.45 1.72 313.15 2.4 0.1 3.93* 1.26 0.25
Cyclohexane 293.15 3.9 4.8 11.44* 0.13 2.71 313.15 3.5 4.5 11.15* 0.22 2.40 333.15 2.2 4.3 10.64* 0.33 2.25
Ethylcyclopentane 273.15 0.05 9.15* 0.19 0.15 293.15 0.47 9.34* 0.07 0.44 313.15 0.72 7.96* 0.23 0.59 343.15 1.48 10.47* 0.69 0.32
Benzene 293.15 5.1 2.0 2.71** 0.49 3.5 313.15 5.6 1.9 2.94** 0.19 3.2 333.15 5.0 0.4 3.29** 0.13 3.16
Toluene 293.15 0.27 0.35** 0.56 1.86 313.15 0.035 0.05** 0.26 1.07 333.15 5.56 0.56** 1.15 0.18
n-Propyl benzene 313.15 0.8 0.7 2.77* 0.26 0.82 333.15 2.1 0.1 2.88* 0.48 0.16 353.15 3.9 0.7 2.84* 1.19 0.52 373.15 6.6 1.9 2.90* 1.49 0.87
Carbon 288.15 1.1 4.9 48.49* 0.32 2.24 Tetrachloride 308.15 1.2 5.1 48.40* 0.51 2.41
328.15 1.0 5.0 48.28* 0.35 2.30 348.15 0.1 4.9 48.10* 0.10 1.82 368.15 2.5 4.4 47.78* 0.78 1.11
(*) These values were calculated using the method outlined by Sivaram et al. using the acentric factor, critical pressure and temperature reported in this paper. (**) These values were calculated using the Sivaram et al.'s method but using the values for the acentric factor, critical pressure and temperature reported in their paper. These data were found to be slightly different from the ones reported here. The experimental data for all compounds were taken from Jasper (1972).
Surface Tension Prediction for Pure FluidsAIChE Journal, Volume 42, No. 5, pp. 1425-1433, May 1996

PREPRINT
18
Figure 1. Surface Tension, s, as a function of temperature for low-boiling-point compounds. The filled circles indicate the experimental data (Jasper, 1972; Hall, 1986; Beaton and Hewitt, 1989). The solid line represent the values calculated with Equation 10, whereas the broken line represents the values calculated using the experimental parachor along with Equation 2.
Surface Tension Prediction for Pure FluidsAIChE Journal, Volume 42, No. 5, pp. 1425-1433, May 1996

PREPRINT
19
Figure 2. Surface Tension, s, of normal paraffins as a function of temperature from the triple point to the critical point. The filled circles indicate the experimental data (Grigoryev, et al., 1992) The solid line represents the values calculated with Equation 10, whereas the broken line represents the values calculated using the experimental parachor along with Equation 2.
Surface Tension Prediction for Pure FluidsAIChE Journal, Volume 42, No. 5, pp. 1425-1433, May 1996

PREPRINT
20
Figure 3. Surface Tension, s, as a function of temperature for various compounds. The filled circles indicate the experimental data(Jasper, 1972; Hall, 1986; Beaton and Hewitt, 1989). The solid line represent the values calculated with Equations 10, whereas the broken line represents the values calculated using the experimental parachor along with Equations 2.
Surface Tension Prediction for Pure FluidsAIChE Journal, Volume 42, No. 5, pp. 1425-1433, May 1996

PREPRINT
21
Figure 4. Reduced parameter (Pr) versus acentric factor ().
Figure 5. Reduced Parameter (Pr) versus (R*/Tbr2), R* is the dimensionless molar refraction defined as
R* = Rm/Rm,ref, Rm is the molar refraction and Rm,ref is the molar refraction of the reference substance which in our case is methane with a value of 6.987. Tbr is the reduced normal-boiling-point.
Surface Tension Prediction for Pure FluidsAIChE Journal, Volume 42, No. 5, pp. 1425-1433, May 1996
Related Documents