LBL-38117 TA-352 ASHRAE Transactions 1996, V. 102 PT. 2. Surface Temperatures of Insulated Glazing Units: Infrared Thermography Laboratory Measurements Brent T. Griffith, Daniel Türler, and Dariush Arasteh Building Technologies Program Energy and Environment Division Lawrence Berkeley National Laboratory University of California Berkeley, CA 94720 USA December 1995 This work was supported by the Assistant Secretary for Energy Efficiency and Renewable Energy, Office of Building Technologies, Building Systems and Materials Division of the U.S. Department of Energy under Contract No. DE-AC03-76SF00098.

Welcome message from author
This document is posted to help you gain knowledge. Please leave a comment to let me know what you think about it! Share it to your friends and learn new things together.
Transcript

LBL-38117TA-352
ASHRAE Transactions 1996, V. 102 PT. 2.
Surface Temperatures of Insulated Glazing Units: InfraredThermography Laboratory Measurements
Brent T. Griffith, Daniel Türler, and Dariush ArastehBuilding Technologies Program
Energy and Environment DivisionLawrence Berkeley National Laboratory
University of CaliforniaBerkeley, CA 94720 USA
December 1995
This work was supported by the Assistant Secretary for Energy Efficiency andRenewable Energy, Office of Building Technologies, Building Systems and MaterialsDivision of the U.S. Department of Energy under Contract No. DE-AC03-76SF00098.

1
Surface Temperatures of Insulated Glazing Units: InfraredThermography Laboratory Measurements
Brent T. Griffith, Daniel Türler, and Dariush ArastehBuilding Technologies Program
Energy and Environment DivisionLawrence Berkeley National Laboratory
University of CaliforniaBerkeley, CA 94720 USA
Abstract
Data are presented for the distribution of surface temperatures on the warm-sidesurface of seven different insulated glazing units. Surface temperatures are measuredusing infrared thermography and an external referencing technique. This techniqueallows detailed mapping of surface temperatures that is non-intrusive. The glazingswere placed between warm and cold environmental chambers that were operated atconditions corresponding to standard design conditions for winter heating. Thetemperatures conditions are 21.1°C (70°F) and -17.8°C (0°F) on the warm and coldsides, respectively. Film coefficients varied somewhat with average conditions ofabout 7.6 W/m²⋅K (1.34 Btu/h⋅ft²⋅°F) for the warm-side and 28.9 W/m²⋅K (5.1 Btu/h⋅ft²⋅°F) for the cold-side. Surface temperature data are plotted for the vertical distributionalong the centerline of the IG and for the horizontal distribution along the centerline.This paper is part of larger collaborative effort that studied the same set of glazings.
Introduction
The condensation resistance of insulating glazing (IG) units is strongly influenced bythe warm-side surface temperatures present while heat is flowing through the IG.These temperatures are determined by the environmental conditions that the IG issubjected to, the overall design of the glazing system, and the complex thermalinteraction between spacer materials and convecting gases within the edge region ofthe IG. Low conductance spacers provide warmer surface temperatures around theperimeter of the IG by reducing thermal bridging between the two outermost panes ofglass. Convection occurring within the IG also affects surface temperatures, causingcooler temperatures at the lower portion of the window. This internal convective effectvaries with the width of the gap between glazing layers and the temperaturedifferences across the gap as well as the number of layers used in the design.

2
Computer models are useful for predicting the heat flow through windows and areconsidered necessary for efforts to rate and label windows because of the wide varietyof window products and the costs involved in testing each product. Models that canaccurately predict the condensation characteristics of an IG need to predict thedistribution of surface temperatures rather than the overall heat flow which has beenthe focus of most prior models. Thus, condensation resistance models should take intoaccount the combined effects of internal convection and edge conduction, as well asthe overall design of the glazing. The development and validation of such computermodels can benefit from detailed experimental data on the surface temperatures foundon IGs under standard environmental conditions.
This paper presents data on the distribution of surface temperatures for a set of IGs thatwere subjected to winter heating conditions in a laboratory. The data were gatheredusing infrared thermography which is a non-destructive method of mapping surfacetemperatures by measuring the thermal radiation emanating from the object (Arasteh etal. 1992). The seven different specimens were mounted between warm and coldenvironmental chambers and measured under steady state conditions that closelyapproximate standard ASHRAE conditions for winter heating. This paper is closelyassociated with additional papers by other authors that have either measured ormodeled the same set of IGs (Sullivan et. al.1996; de Abreu et al.1996; Elmahdy 1996;Zhao et al. 1996).
Apparatus and Procedures
Insulating Glazing Specimens
Seven different IG specimens were obtained from a manufacturer of a glazingcomponent. Six of the specimens had commercial silicone foam spacers while onespecimen had a common aluminum spacer. The reduced thermal bridging of the foamspacers allows better isolation of the effects of internal convection. All the IGs wereair filled and fitted with breather tubes to avoid fluctuations in gas concentration andpressure. The IGs are all 508 mm (20 in.) by 406 mm (16 in.) in size with thicknessvarying from 12.2 mm (0.48 in.) to 33.4 mm (1.32 in.).
Table 1 lists the specimens by their designation used in this paper and describes thedesign of each glazing system, the overall thickness of the IGs, and the thickness ofthe foam used to mount the specimens between the environmental chambers.Specimens were mounted in extruded polystyrene foam mask walls that have aconstant thickness and a close fit around the IG. The warm side surfaces of the IG andthe foam are flush to each other; the cold side surface of the IG is recessed from thefoam surface to make up for

3
TABLE 1 Test Specimen Descriptions and Mounting
IGdesignation
type ofglazing
nominalgap
thicknessmm (inch)
spacermaterial
overall IGthicknessmm (inch)
mask wallthicknessmm (inch)
IGU#1A Double, clear 12.5 (0.5) foam 18.0 (0.71) 20.0 (0.79)
IGU#1B Double, clear 12.5 (0.5) foam 18.0 (0.71) 39.4 (1.55)
IGU#2 Double, clear 12.5 (0.5) aluminum 18.5 (0.72) 20.0 (0.79)
IGU#3 Double, clear 6.4 (0.25) foam 12.2 (0.48 20.0 (0.79)
IGU#4 Double, clear 19 (0.75) foam 25.0 (0.98) 26.2 (1.03)
IGU#5 Double, low-e 12.5 (0.5) foam 18.3 (0.72) 20.0 (0.79)
IGU#6 Triple, clear 12.5 (0.5) ea. foam 33.4 (1.32) 39.4 (1.55)
IGU#7 Triple, clear 6.4 (0.25) ea. foam 21.7 (0.86) 26.2 (1.03)
the smaller thickness of the IG compared to the foam. Three different thicknesses offoam mask walls were used to more closely achieve the desired flush mounting on thecold side as well as the warm side in order to have a more uniform flow of cold air.The IG/foam interface was sealed, on both sides, with vinyl tape that covered theglazing spacer region to the sightline. One of the IGs (IGU#1) was tested with twothicknesses of mask wall to help determine the effect of the mounting; this results intwo data sets (IGU#1A and IGU#1B) for this glazing. Thin stripes of aluminum tapeare adhered to the warm side of the foam mask wall along the horizontal and verticalcenterlines of the IG; these are used to identify IG centerlines in the thermographicimage.
Warm and Cold Environmental Chambers
Environmental chambers are used to generate steady-state heat flow across the testspecimens. Figure 1 diagrams the chambers. The size of the opening between thewarm and cold chambers is 1200 mm (48 in.) square.
The cold chamber is a commercial food freezer modified for parallel upward plenumairflow. Temperature is controlled using pulse-switched heaters in three zones. Controlstability over time and variations across the width of the airflow are both within ±0.1°C (0.2°F). Airflow plenum depth is adjusted to 100 mm (4 in.). A custom-built

4
Cold Chamber
Warm Chamber
Figure 1 Infrared Thermography Laboratory Environmental Chambers
Adjustable Belows
Scanner with Viewport
Back Plane
Test Section
tangential blower drives air flow at velocities ranging from 3.9 to 5.2 m/s (8.7 to 11.6mph) during the measurements reported here. Air velocity fluctuation at a given timeis less than 0.2 m/s (0.4 mph). The variation in velocity from test to test is believed toarise from the gradual accumulation of ice in the air flow path.
The warm chamber is a special purpose apparatus developed for infraredthermography. Typical environmental chambers used for hot box type measurementsuse a plenum to direct warm air; however, this plenum would not allow viewing of thespecimen. Therefore, the chamber has an unobstructed volume of air between thespecimen and the IR scanner viewing port. An adjustable bellows allows locating theIR scanner from 1.5 m to 4.0 m (5 ft to 13 ft) away from the specimen. Airtemperature is controlled in a recirculation zone within the subfloor. Air enters thesubfloor at the base of the specimen and leaves at the rear of the subfloor. Airrecirculates through a cooling coil and then across three zones of pulse-switchedheaters. Variable fans allow airflow rates to change within the subfloor, so the airexchange rate the main chamber can change for some control of warm-side convectivesurface resistance.

5
Environmental Data Acquisition
The environmental chambers are controlled and monitored by a computer-based dataacquisition system. The plug-in computer card has 16 channels with 12 bit analog todigital conversion, and is managed by its own operating system running on a 80486processor. The 16 channels are multiplexed to a total of 128 single-ended analoginputs. Digital output capabilities operate solid-state relays used to switch heaters fortemperature control. The processing card allows data to be preprocessed and reducedbefore it is fed to the regular computer data bus. Special software allows real-timedisplay of data in graphs and tables. During normal operation, 72 channels are read tomeasure air temperatures, air velocities, mask wall surface temperatures, specimensurface temperatures, enclosure surface temperatures, relative humidity, thermocouplejunction box temperature, and ground. Temperature probes include linear thermistornetworks and type-T thermocouples. Figure 2 shows the location of some of theimportant sensors. Thermocouple junction temperature is compensated for by usingthree thermistors to measure temperature inside the insulated, isothermal zone boxconstructed of 12 mm (0.5 in.) aluminum plate. Thermocouple readings are adjusted tocompensate for deviations found in prior calibrations of the system .
Tair,w
Tair,c
vc
Cooling Coil
Heater
Crossflow FanFan Rack
Cooling CoilHeater
vw
Side View of the Environmental Chambers
Specimen
Front View of Cold Side
Tair,c
vc
Figure 2 Schematic of Chambers with Sensor Locations
Cold Chamber Warm Chamber
Adjustable Bellows
Scanner
6
The data acquisition system collects 24 samples per second for each measurementwhich are averaged and then converted to engineering units. These averaged valuesare then passed to the PC every second and displayed in real time in order to monitorchamber performance. Data are stored in the computer for later postprocessing using asecond averaging routine which takes the values averaged for each second andaverages them again to yield one value per minute.
Thermistor measurements are used for temperature control in six separate zones, threein each chamber. These data are used to update individualproportional/integral/derivative (PID) controlling routines at a rate of six values persecond. These routines output a series of pulse-width-modulation commands thatcontrol the on/off pattern of six heaters. Both chambers are cooled continuously andreheated in three zones to maintain the desired air temperature. The zones ofconditioned air span across the width of the test section but are not physicallyseparated. The controlling thermistor sensors are located in the air stream where the airbegins to encounter the specimen.
A separate thermometer with two channels is used to continually verify the accuracyof air temperature measurements. This thermometer also measures the temperature ofa custom infrared referencing target used in the thermographic measurements. Thisreference thermometer measures 100 Ω platinum resistance thermometer (PRT) probesusing a 4-wire technique with a system accuracy of 0.01°C (0.02°F) (AC 1992). Thesystem’s calibration is traceable to the National Institute of Standards and Technologyand uses the 1990 International Temperature Scale.
Infrared Thermography Equipment
A scanning-type, infrared (IR) imaging radiometer (scanner) was used to measuresurface temperatures of the glazings. The IR scanner used here is a long-wave (8-12µm), high-speed imager that uses a single detector (mercury/cadmium/telluride) tomeasure radiosity of the test specimen and reference targets (II 1989). The internalreference target located within the scanner head is complemented with two externalreference targets located near the test specimen. These two external reference targetsare separately controlled and measured for temperature. One is a commercial extendedarea blackbody with a well characterized emissivity that averages 0.97 and iscontrolled by thermoelectric elements (CIS 1992). The other reference target is acustom device with a glass surface and is controlled by circulating water through acopper plate. The IR scanner performs better as a relative temperature measurementdevice than as an absolute temperature measurement device. Therefore the addition ofexternal referencing targets to the IR measurement system enables improvement in theabsolute accuracy of the temperature measurements. The IR scanner data is fed into acomputer which captures and averages frames of data in order to gather data for

7
postprocessing and to reduce noise in the measurements. The specified accuracy of thebase IR scanner is ±2.0°C (3.6°F), however with external referencing and detailedprocedures this accuracy is improved to ±0.5°C (0.9°F) (Griffith 1995). This referencecontains a more detailed discussion of thermography and issues associated with itsaccuracy.
Infrared Thermography Procedures and Data Processing
This section describes the procedures used to gather the IR data presented in thispaper. IR measurements are conducted at a minimum of four hours after the chambershave reached steady conditions. Humidity on the warm side is reduced so thatspecimens can be measured without condensation. The side-to-side thermal pattern onthe specimen is monitored with the IR scanner prior to actual measurements to assureuniform conditions are present. The imaging distance was 1.5 m (3.2 ft.) which allowsviewing the external reference targets and just over half the width of the specimen.The two external targets are located just left of the specimen at about the middle of theheight. The image is focused on the specimen rather than the reference emitters whichare closer by about 400 mm (16 in.). Emissivity is set at 0.86 for glass. This value forthe emissivity of glass differs from the usual 0.84 and is generated by analyzingspectral data for glass and the response of the detector over only the 8-12 µmwavelengths; this value is also confirmed by measuring glass radiosity relative toknown surfaces (e = 0.90) held at the same temperature. The background radiationlevel is quantified with an equivalent temperature by imaging a mirror before and afterthe measurements. This value is input into the thermography software to correct foremissivity and background reflections. The background level was between 20.6°C(69.1°F) and 21.5°C (70.7°F) for all the measurements. View angles are selected toavoid the scanner reflection. The environmental chambers are designed for a uniformbackground radiation scene.
The overall data for a tested specimen are gathered from two sets of measurementswhere each set is a close-up view. The first set of images is of the top and left quadrantof the IG specimen and the two external reference targets. The second set of images isof the bottom and left quadrant of the IG specimen and the two reference emitters. Setsof images are captured from each view with different scanner control settings for spanand center temperature. Within a set of images there are geometry overlays that arecaptured uniformly with each image. The geometry overlays are narrow outlinesoriented along the horizontal and vertical centerlines of the specimen and are used forlater postprocessing of the temperature data. The span setting of the IR scannerdetermines the range, or bandwidth, of temperatures resolved by the scanner. Thelowest span measurement (5°C) is the most accurate because the available resolution(8 bit) of the thermographic data is divided across the span being measured. Each setof images from a particular view includes one 20°C (36°F) span image, one or two

8
10°C (18°F) span image(s), and two or more 5°C (9°F) span images where the numberof multiple images depends on the range of temperatures present on the specimen. Themultiple images of 5°C span data, with different center temperatures, allow coveringthe range of temperatures on the specimen with the better resolution measurements. Inmost instances the data reported are generated from compiled 5°C (9°F) span data,however the reference emitter has a minimum setpoint of 5.0°C (41°F) necessitatingthe use of 10°C (18°F) data when the coldest temperatures are much below 0°C(32°F).
Postprocessing of the temperature data involves extracting text data from thethermography software and then adjusting and combining data on a spreadsheet. Thethermography software is used to process individual images in order to generate textdata for the temperature profiles along the centerlines of the specimen. Thesetemperature profiles extend halfway across the specimen for each image and areaveraged over the width direction (about 25 mm [1 in.]) of the outline overlays inorder to reduce noise in the data. The temperatures measured by the thermographysystem for the two reference targets are recorded and are used for scaling absolutetemperature values. The final data are combined on a spreadsheet by first correctingthe IR data for absolute value, then combining data from different images that have thesame span but different ranges, and finally combining data from the top and thebottom close-up views. The geometric locations of the temperature data aredetermined by linearly distributing the data values across the overall length that theoriginal outline overlay should correspond to on the actual specimen. The typicalresolution in distance for the temperature data is less than 2 mm (0.08 in.) but theuncertainty in distance values is higher, about 3.7 mm (0.15 in.), because of the lowerresolution of the actual IR scans, the readout resolution, and the aberrations resultingfrom viewing optics and perspective.
Test Conditions Analysis
This section presents the methods used to generate environmental data for eachseparate test. While the environmental chambers are controlled to provide nominallyrepeatable conditions and steady state heat transfer, the actual conditions for aparticular test will vary from one test to another and will also deviate from the targetedstandard design conditions. The environmental conditions are summarized in a conciseway by reporting air temperatures and surface heat transfer coefficients, or filmcoefficients (see table 3 below). While film coefficients reported here are averagedvalues for the whole specimen surface, it is important to note that film coefficientsactually have significant local variation. The radiative and convective components ofthe total film coefficient are reported for the warm side, while only the total is reportedfor the cold side.

9
The environmental data are deduced from the measurements recorded by the dataacquisition system (described above) for air temperatures, specimen surfacetemperatures, mask wall surface temperatures, enclosure surface temperatures, and airspeeds. These data are gathered in one minute bins of averaged values. These oneminute values are then averaged over the time it takes to complete the thermographicmeasurements which typically requires 20 to 30 minutes. The warm side airtemperature, Tair,w, is a spatial average of three thermocouples which are located about120 mm (5 in.) off the mask wall and above the specimen. This is also the location ofthe controlling thermistors and is intended to measure the air supplied to the top ofspecimen before it is cooled by the specimen as it moves down. The cold side airtemperature, Tair,c, is a spatial average of seventeen thermocouples which are locatedabout 75 mm (3 in.) off the mask wall and throughout the middle of the test section.
Calibrated Transfer Standard Measurements
Prior experiments with the environmental chambers were conducted using a CalibratedTransfer Standard (CTS) (ASTM-1199 1990). These tests were run with the samechamber operation settings as were used for the IG measurements. The CTSmeasurements are used here to qualify a calculational model used to describeconditions during subsequent IG measurements. This film coefficient model combinesan iterative analysis of the convection and a form factor analysis of the thermalradiation. The CTS measurements provide film coefficient data but it is difficult toapply these values directly to the IG tests because the overall heat flow is much lower(by a factor of 2 to 3) resulting in different surface temperatures and hence different airand radiation flows. Also the geometry of the CTS (900 mm (36 in.) square) does notmatch the IG specimens. Table 2 presents the results of measurements conducted withthe CTS along with results of calculations using the warm-side film coefficient modeldescribed below.
TABLE 2 Comparison of Results from Warm-Side Film Coefficient Model andMeasurements of Calibrated Transfer Standard (CTS)
Dataset
Warm-SideMeasured Warm-Side Modeled
Cold-SideMeasured
htot,wW/m²·K
htot,wW/m²·K
hconv,wW/m²·K
hrad,wW/m²·K
difftot htot,cW/m²·K
1 8.42 8.02 3.25 4.77 -4.7% 35.12 8.11 7.76 3.28 4.48 -4.3% 30.13 8.06 7.78 3.28 4.50 -3.5% 29.8

10
Warm-Side Film Coefficient Model
A calculational model of the surface heat transfer coefficient was developed in order toprovide film coefficient data for the warm side. Many alternative methods wereevaluated to arrive at a model that had the most accuracy compared to the CTS data.The model has two parts, a convective part and a radiative part.
Convection. The convective part of the warm-side film coefficient is calculated usinga literature correlation for natural convection with constant heat flux, equation (1)(Holman 1986). Figure 3 shows the heat flow situation and geometry. The analysis isoriented along the vertical center line of the specimen (x - axis in fig.3). The totalheight used in the analysis, L, is the sum of the height of the specimen, HIG, and thepart of the mask wall above the specimen which is exposed to the warm side air flow.Equation (1) originates from an expression for the local film coefficient that has beenintegrated over the length, L.
conv ww conv w
w avk
qk
g,
,
/
/.h L=
54
0 60
1 5
4 5βν
(1)
The convective heat flux ,qconv, in equation (1) is also related to the convectivecoefficient, hconv,w, by the definition show in equation (2). The air temperatures, Tair,w,and the mask wall temperatures, Tmw,w, are measured by the data acquisition system;TIG,w is measured by the thermography system and is an average of the IG surface datapresented here (includes edge-of-glass). The mask wall above the specimen is includedbecause the heat flow through it has an influence on the test conditions.
conv,w conv,w air,w surf,wq h T T = ( - ) (2)
where, ( )surf,w
IG IG, mw,w IGTH T T L H
L=
+ −w
Equations (1) and (2) form a system of equations and were solved by numericaliteration using a spreadsheet.

11
HIG
xTsmpl,w
Tair,wTair,c
Tsmpl,c
qsmpl
htot,w
htot,c
vair,c
Tplenum,c
Tmw,w
Foam mask wall
Test Specimen
Plenum
Cross Section View Front View
.
..
x=0.
L
Figure 3 Geometry and Variables for Film Coefficent Analysis
Cold Side Warm Side
Radiation. The radiative part of the warm side film coefficient is calculated using adetailed form factor analysis. The radiation surface coefficient will change because ofvariations in the surface temperatures of the enclosure surfaces as well as thespecimen. The calculation is based on form factor analysis and assumes opaque,diffuse, gray-body surfaces. The IG specimens are specular, but since they are onlyslightly (16%) reflective, this complicating fact is ignored. A complete description ofthe specific radiative model is beyond the scope of this paper. Hence, only the basicequations are discussed in this paper.
The model of the warm chamber consists of 12 flat rectangular surfaces with area An.Form factors, Fn-m, determine the fraction of the total radiosity, Jn, leaving surface nand arriving at surface m. For a complete enclosure the sum of all form factorsassociated with a single surface equals one. A total of 144 such form factors have beendetermined for the twelve surfaces of the warm chamber enclosure. The assumption ofopaque surfaces neglects transmission effects, so the reflectivity, ρρ, may be expressedas ρρ = 1 - εε.

12
The net radiative heat flux, qrad,n, for each surface, n, is described by equation (3). Theincoming radiative heat flow, Gn, for each surface, n, is described by equation (4). Theoutgoing radiative heat flow, Jn, for each surface, n, is described by equation (5).Equations (3), (4), and (5) were solved simultaneously by numerical iteration using aspreadsheet.
q = (G - J ) / Arad,n n n n (3)
G = J F + J F + ... + J Fn 1 1-n 2 2-n 12 12-n(4)
Jn= ε Anσ Tn4 + ρ Gn (5)
The total radiative heat flux, qrad,w , is calculated with equation (6). This equation takesthe total radiation arriving at the colder specimen and subtracts the reflected andemitted portions.
q G / A G / A Trad,w 1 IG I 1 IG IG IG,w4= − −ρ ε σG (6)
The radiative part of the warm side film coefficient is then defined as shown inequation (7). This definition compares the heat flux to the temperature differencebetween the warm side air and the specimen surface.
h = q
T Trad,wrad,w
air,w IG,w−(7)
Equations (1) and (7) are combined to provide the overall film coefficient for thespecimen surface on the warm side shown as equation (8).
htot,w = hconv,w + hrad,w (8)
Cold-Side Film Coefficient
The model developed for the warm side is difficult to apply to the cold side becausecomparatively little surface temperature data are gathered for the cold side surfaces.For this reason it becomes necessary to use correlations for the cold-side coefficientthat are derived from the CTS measurements. The cold side air velocity varies and thishas a significant effect on the film coefficient which is dominated by the convectivepart. The cold-side film coefficient estimates shown in table 3 are derived frominterpolating between CTS measurements based on the air velocities.

13
Results
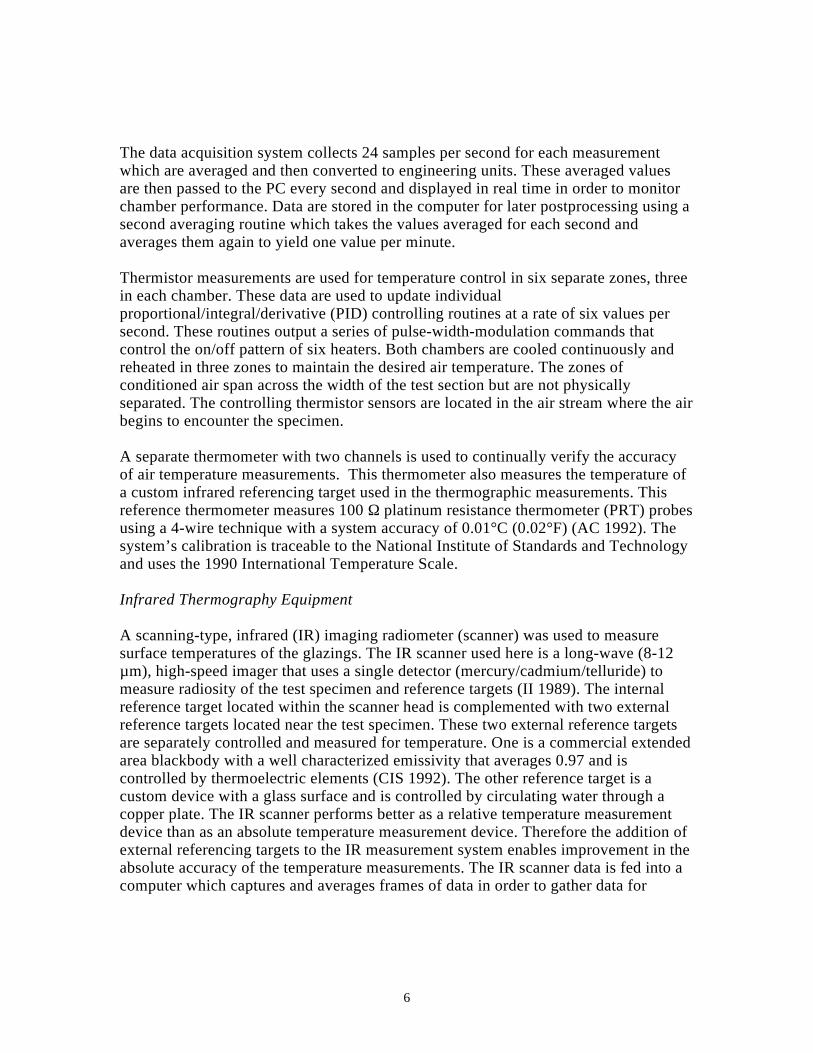
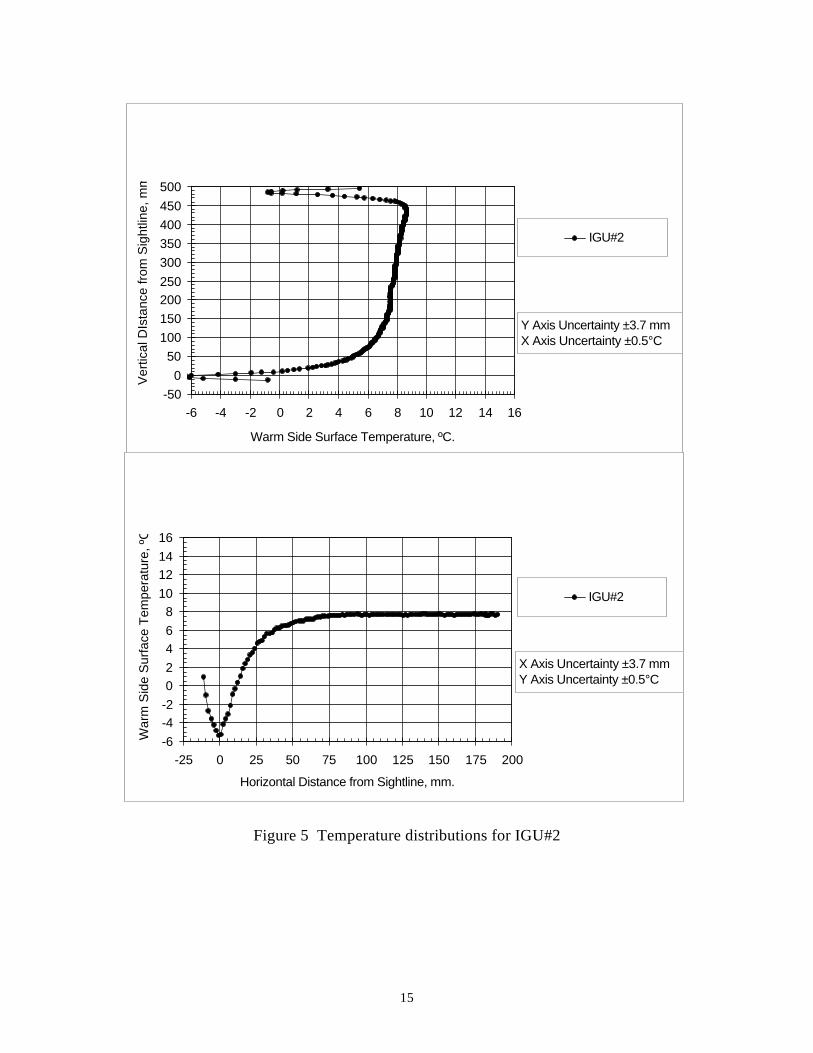
Figures 4 through 10 show the results of surface temperature measurements for theeight sets of measurements of the seven different specimens. Each of these figures isplotted on the same scale for purposes of comparison. The upper plot is the verticaldistribution of temperatures along the centerline of the IG. The lower plot is thehorizontal distribution of temperatures along the centerline of the IG from the left edgeto the middle of the IG. Interested readers may obtain computer files containing thedata pairs directly from the authors (seehttp://eande.lbl.gov/BTP/WDG/IRlab/IRlab.html). The vertical data sets have about270 pairs of data; the horizontal data sets have about 120 pairs of data. Uncertainty inthe surface temperature is estimated at ±0.5°C (0.9°F). Uncertainty in the location datais estimated at ±3.7 mm (0.15 in.).
Table 3 shows the environmental conditions at the time of each of the eight tests.Uncertainty in the temperature measurements shown in Table 3 is estimated at ± 0.05°C (0.1°F). The cold-side film coefficients are estimated to be accurate to within about11%. The warm-side film coefficients are estimated to be accurate to within about7%.
The experimental data presented are most useful as part of a larger collaborative studyof the IG specimens. The reader is thus encouraged to compare the results presentedhere with the results of others who have measured or modeled the same IGs.
Figure 4 shows the results from tests IGU#1A and IGU#1B which have different maskwall thicknesses. IGU#1B has the thicker mask wall which should result in reducedlocal film coefficients on the cold side at the edge due to the stepped change in surfacegeometry. The data show sill and jamb temperatures to be about 1.5 C (3F) warmer forthis specimen at the coldest parts of these edge regions while there is little difference atthe header edge region.

14
-500
50100150200250300350400450500
-6 -4 -2 0 2 4 6 8 10 12 14 16
Warm Side Surface Temperature, ºC.
Ver
tical
DIs
tanc
e fro
m S
ight
line,
mm
IGU#1A IGU#1B
Y Axis Uncertainty ±3.7 mmX Axis Uncertainty ±0.5°C
-6-4-202468
10121416
-25 0 25 50 75 100 125 150 175 200
Horizontal Distance from Sightline, mm.
War
m S
ide
Sur
face
Tem
pera
ture
, ºC
IGU#1A IGU#1B
X Axis Uncertainty ±3.7 mmY Axis Uncertainty ±0.5°C
Figure 4 Temperature Distributions for IGU#1 tested with two differentmask wall thicknesses
15
-500
50100150200250300350400450500
-6 -4 -2 0 2 4 6 8 10 12 14 16
Warm Side Surface Temperature, ºC.
Ver
tical
DIs
tanc
e fro
m S
ight
line,
mm
IGU#2
Y Axis Uncertainty ±3.7 mmX Axis Uncertainty ±0.5°C
-6-4-202468
10121416
-25 0 25 50 75 100 125 150 175 200
Horizontal Distance from Sightline, mm.
War
m S
ide
Sur
face
Tem
pera
ture
, ºC
IGU#2
X Axis Uncertainty ±3.7 mmY Axis Uncertainty ±0.5°C
Figure 5 Temperature distributions for IGU#2

16
-6-4-202468
10121416
-25 0 25 50 75 100 125 150 175 200
Horizontal Distance from Sightline, mm.
War
m S
ide
Sur
face
Tem
pera
ture
, ºC
IGU#3
X Axis Uncertainty ±3.7 mmY Axis Uncertainty ±0.5°C
-500
50100150200250300350400450500
-6 -4 -2 0 2 4 6 8 10 12 14 16
Warm Side Surface Temperature, ºC.
Ver
tical
DIs
tanc
e fro
m S
ight
line,
mm
IGU#3
Y Axis Uncertainty ±3.7 mmX Axis Uncertainty ±0.5°C
Figure 6 Temperature distributions for IGU#3

17
-500
50100150200250300350400450500
-6 -4 -2 0 2 4 6 8 10 12 14 16
Warm Side Surface Temperature, ºC.
Ver
tical
DIs
tanc
e fro
m S
ight
line,
mm
IGU#4
Y Axis Uncertainty ±3.7 mmX Axis Uncertainty ±0.5°C
-6-4-202468
10121416
-25 0 25 50 75 100 125 150 175 200
Horizontal Distance from Sightline, mm.
War
m S
ide
Sur
face
Tem
pera
ture
, ºC
IGU#4
X Axis Uncertainty ±3.7 mmY Axis Uncertainty ±0.5°C
Figure 7 Temperature distributions for IGU#4
18
-500
50100150200250300350400450500
-6 -4 -2 0 2 4 6 8 10 12 14 16
Warm Side Surface Temperature, ºC.
Ver
tical
DIs
tanc
e fro
m S
ight
line,
mm
IGU#5
Y Axis Uncertainty ±3.7 mmX Axis Uncertainty ±0.5°C
-6-4-202468
10121416
-25 0 25 50 75 100 125 150 175 200
Horizontal Distance from Sightline, mm.
War
m S
ide
Sur
face
Tem
pera
ture
, ºC
IGU#5
X Axis Uncertainty ±3.7 mmY Axis Uncertainty ±0.5°C
Figure 8 Temperature distributions for IGU#5

19
-500
50100150200250300350400450500
-6 -4 -2 0 2 4 6 8 10 12 14 16
Warm Side Surface Temperature, ºC.
Ver
tical
DIs
tanc
e fro
m S
ight
line,
mm
IGU#6
Y Axis Uncertainty ±3.7 mmX Axis Uncertainty ±0.5°C
-6-4-202468
10121416
-25 0 25 50 75 100 125 150 175 200
Horizontal Distance from Sightline, mm.
War
m S
ide
Sur
face
Tem
pera
ture
, ºC
IGU#6
X Axis Uncertainty ±3.7 mmY Axis Uncertainty ±0.5°C
Figure 9 Temperature distributions for IGU#6

20
-500
50100150200250300350400450500
-6 -4 -2 0 2 4 6 8 10 12 14 16
Warm Side Surface Temperature, ºC.
Ver
tical
DIs
tanc
e fro
m S
ight
line,
mm
IGU#7
Y Axis Uncertainty ±3.7 mmX Axis Uncertainty ±0.5°C
-6-4-202468
10121416
-25 0 25 50 75 100 125 150 175 200
Horizontal Distance from Sightline, mm.
War
m S
ide
Sur
face
Tem
pera
ture
, ºC
IGU#7
X Axis Uncertainty ±3.7 mmY Axis Uncertainty ±0.5°C
Figure 10 Temperature distributions for IGU#7

21
TABLE 3 Temperature Conditions and Film Coefficients for Specimen Measurements
Warm-side Cold-side
Tair,w°C
htot,wW/m²·K
hconv,wW/m²·K
hrad,wW/m²·K
Tair,c°C
htot,cW/m²·K
IGU#1A 21.12 7.65 3.19 4.46 -17.78 28.6
IGU#1B 21.11 7.58 3.07 4.51 -17.77 29.3
IGU#2 21.08 7.70 3.20 4.49 -17.78 29.0
IGU#3 21.12 7.69 3.26 4.43 -17.77 28.4
IGU#4 21.11 7.57 3.12 4.44 -17.78 30.8
IGU#5 21.23 7.72 2.97 4.76 -17.74 26.0
IGU#6 21.14 7.58 2.82 4.76 -17.77 29.5
IGU#7 21.10 7.47 2.94 4.48 -17.78 29.5
A number of interesting observations may be made by comparing the results fordifferent glazings, however a thorough discussion is beyond the scope of this paper.Table 4 provides a summary of the results by listing various statistics of thetemperature data sets gathered for each glazing. Averages are listed for the wholeglazing (including the spacer region) and for the “center-of-glass” region based on theASHRAE 63.5 mm (2.5 inch) definition for edge-of-glass. Gradient data are calculatedfor a 100 mm. (4 inch) distance about the center point of the glazing and are providedto give an indication of the strength of convection within the glazings. Note that thisgradient is also driven by the localized nature of the warm side surface heat transfercoefficient.
Conclusions
Experimental data can be generated from infrared thermography that characterizes thedistribution of surface temperatures on glazing systems under heat flow. This wasdone for a set of seven glazings and the data are useful for determining thecondensation resistance of these glazing units as they were tested. The data are alsouseful for efforts to validate and develop computer simulation tools that modelconvection and edge conduction in glazing systems.

22
Table 4 Summary of Glazing Surface Temperature Measurement Results
IGdesignatio
n
Averagefor totalglazing
(°C)
Minimum
(°C)
Maximum
(°C)
Centerpoint
(°C)
Verticalgradient formiddle 100
mmDT/Dx(°C/m)
Average“center-of-glass” w/standardedge defn.
(°C)
IGU#1A 6.6 0.0 9.7 7.2 3.6 7.1
IGU#1B 7.1 1.5 10.1 7.5 3.0 7.5
IGU#2 6.1 -6.5 8.7 7.7 2.5 7.4
IGU#3 4.8 -1.9 6.9 5.7 2.0 5.6
IGU#4 6.8 1.0 11.4 7.2 7.2 7.0
IGU#5 10.6 1.8 13.4 11.8 2.0 11.6
IGU#6 11.8 6.9 14.1 12.2 2.0 12.2
IGU#7 9.7 4.7 10.7 10.6 2.5 10.4
The experimental measurements conducted here require careful procedures anddetailed post processing of data in order to generate useful data. This makes itgenerally impractical to perform widespread measurements using these techniques forthe direct testing of numerous different glazing products.
Acknowledgments
This work was supported by the Assistant Secretary for Energy Efficiency andRenewable Energy, Office of Building Technologies, Building Systems and MaterialsDivision of the U.S. Department of Energy under Contract No. DE-AC03-76SF00098.The authors wish to thank Michael Glover and Dave Sergeant of Edgetech IG, Ltd. forproviding the specimens used in the testing.

23
Nomenclature
An = area of surface n (m²)CTS = calibrated transfer standarddifftot = difference between model and measured, %e, εε = emmissivityFn-m = form factor between surfaces n and mg = gravitational constant (m/s²)Gn = incoming radiosity (W)hconv,w = warm-side convection coefficient (W/m²·K)hrad,w = warm-side radiation coefficient (W/m²·K)htot,c
= cold-side total film coefficient (W/m²·K)htot,w
= warm-side total film coefficient (W/m²·K)HIG = height of specimen (m)IG = insulating glazingIGU#1 = IG specimen tested, designations 1 through 7IR = infraredJn = outgoing radiosity (W)k = thermal conductivity of air (W/m·K)L = overall length of convection (m)PRT = platinum resistance thermometerqconv,w = heat flux due to convection, warm side (W/m²)qrad,n = heat flux due to radiation leaving surface n (W/m²)qrad,w = heat flux due to radiation, warm side (W/m²)Tair,c = cold-side bulk air temperature (K)Tair,w = warm-side bulk air temperature (K)TIG,w = warm-side average surface temperature of specimen (K)Tmw,w = warm-side surface temperature of mask wall (K)Tn = temperature of surface n (K)Tsurf,w = warm-side surface temperature of specimen and mask wall (K)
Greek Symbols
wβ volume coefficient of expansion (1/K)
ρ reflectivityΩ ohm, nominal resistanceσ Stefan-Boltsman constant (W/m²·K4)
avν kinematic viscosity of air (m²/s²)

24
References
AC. 1992. Operation and maintence Instructions: A1011 Precision RTD Thermometer.Azonix Document F19-100257. Billerica, MA.: Azonix Corporation.
Arasteh, D.K., F. Beck, B.T. Griffith, N. Byars, and M. Acevedo-Ruiz. 1992. Usinginfrared thermography to study building heat transfer. ASHRAE Journal 34(10):34-38.
ASTM.1990b. ASTM C 1199, Standard test method for measuring the steady statethermal transmittance of fenestration systems using hot box methods. Annual Book ofASTM Standards, vol. 04.06: 671-682. Philadelphia, PA: American Society forTesting Materials.
CIS. 1992. SR 80 extended area infrared radiation source operation manual. AgouraHills, CA.: CI Systems, Inc.
de Abreu, P., Fraser, R.A., Sullivan , H.F. and Wright, J.L., 1996. A study of insulatedglazing unit surface temperature profiles using two-dimensional computer simulation.accepted for ASHRAE Transactions Vol. 102, Pt. 2.
Elmahdy, H. 1996 Surface temperature measurement of insulated glass units usinginfrared thermography. Accepted for ASHRAE Transactions Vol. 102, Pt. 2.
Griffith, B.T. F. Beck, D. Arasteh, and D. Turler. 1995. Issues associated with the useof infrared thermography for experimental testing of insulated systems. Proceedings ofthe Thermal Performance of the Exterior Envelopes of Buildings VI Conference.Atlanta, GA.:American Society of Heating, Refrigerating and Air-ConditioningEngineers.
Holman, J. P. 1986. Heat transfer. p 334 - 336. McGraw Hill.
II. 1989. Model 600L operator’s manual. N. Billerica, MA.: Inframeterics, Inc.
Sullivan, H.F., Wright, J.L. and Fraser, R.A. 1996. Overview of a project to determinethe surface temperatures of insulated glazing units: thermographic measurement and 2-D simulation. accepted for ASHRAE Transactions Vol. 102, Pt. 2.
Zhao, Y., D. Curcija, and W.P. Goss. 1996. Condensation resistance validation project- Detailed computer simulations using finite element methods. ASHRAE TransactionsVol. 102, Pt. 2.
Related Documents