1. TITLE Surface Roughness Measurement 2. OBJECTIVE a) To obtain the value of roughness of a specimen by the CENTER LINE AVERAGE (CLA) or ROUGHNESS AVERAGE (Ra) method by using a Computerized Roughness Measuring Machine. b) To compare the value of roughness of a specimen by the Center Line Average (CLA) and average roughness (Ra) method. c) To study the causes of different value of roughness of a specimen between CLA and Ra method. d) To study the necessary precaution needed for this experiment. 1

Welcome message from author
This document is posted to help you gain knowledge. Please leave a comment to let me know what you think about it! Share it to your friends and learn new things together.
Transcript
1. TITLE
Surface Roughness Measurement
2. OBJECTIVE
a) To obtain the value of roughness of a specimen by the CENTER LINE
AVERAGE (CLA) or ROUGHNESS AVERAGE (Ra) method by using a
Computerized Roughness Measuring Machine.
b) To compare the value of roughness of a specimen by the Center Line Average
(CLA) and average roughness (Ra) method.
c) To study the causes of different value of roughness of a specimen between CLA
and Ra method.
d) To study the necessary precaution needed for this experiment.
1
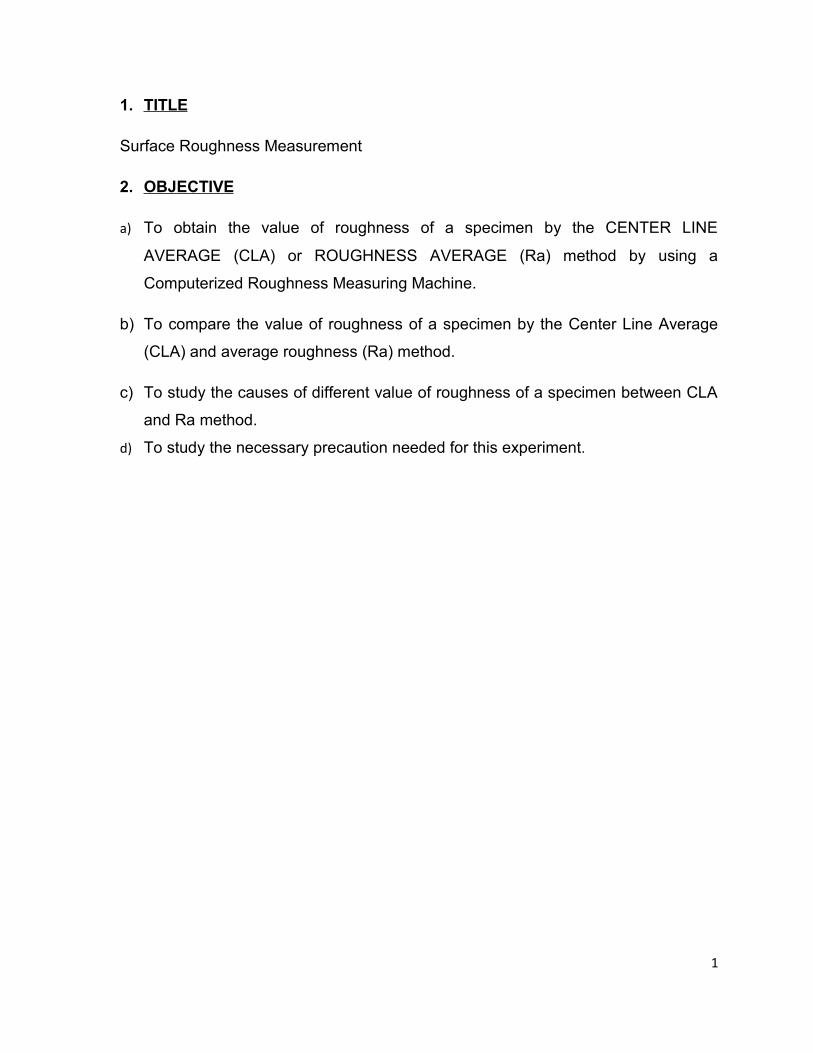
3. INTRODUCTION
Figure 1: Sketch depicting how a probe stylus travels over a surface
Roughness is a measure of the texture of a surface. A surface can never be
perfectly smooth and will always have two components of surface texture namely
roughness and waviness as shown in figure above. They may vary from fine to coarse
according to the machine process used. Roughness is quantified by the vertical
deviations of a real surface from its ideal form. If these deviations are large, the surface
is rough; if they are small the surface is smooth. Roughness is typically considered to
be the high frequency, short wavelength component of a measured surface.
Roughness plays an important role in determining how a real object will interact
with its environment. Rough surfaces usually wear more quickly and have higher friction
coefficients than smooth surfaces. Although roughness is usually undesirable, it is
difficult and expensive to control in manufacturing. Decreasing the roughness of a
surface will usually increase exponentially its manufacturing costs.
In some cases, the physical geometry of the measuring instrument may have a
large effect on the data. This is especially true when measuring very smooth surfaces.
2
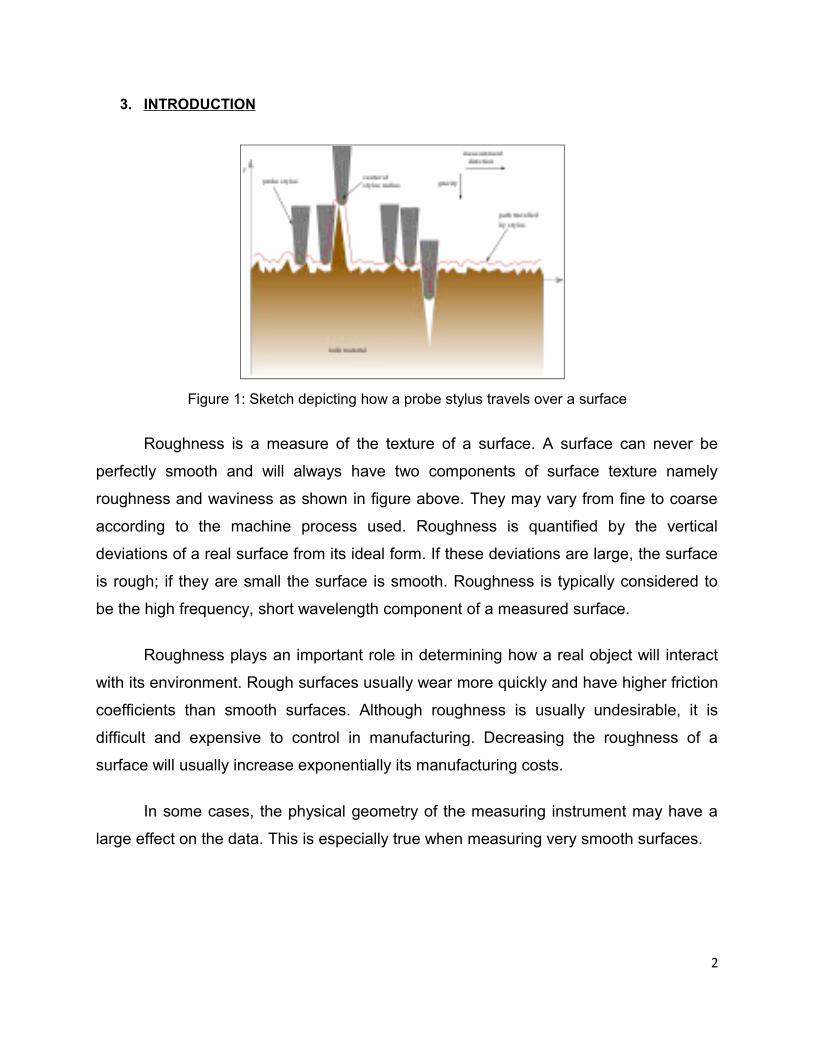
4. SPECIMEN & EQUIPMENT
a) Specimen – piston cylinder
b) A computerized Surface Roughness Machine
c) Digital planimeter
5. PROCEDURES
Machining Processes
1. A cut off wavelength of 0.8mm by 8 sections were selected on the machine. The
machine were set to a vertical magnification to auto and horizontal magnification
too 100.
2. The component is placed on the auto leveling table at a suitable position such
that when pick up head is lowered, its stylus contacts the surface of the
specimen.
Figure 2: Computerized Surface Roughness machine
3
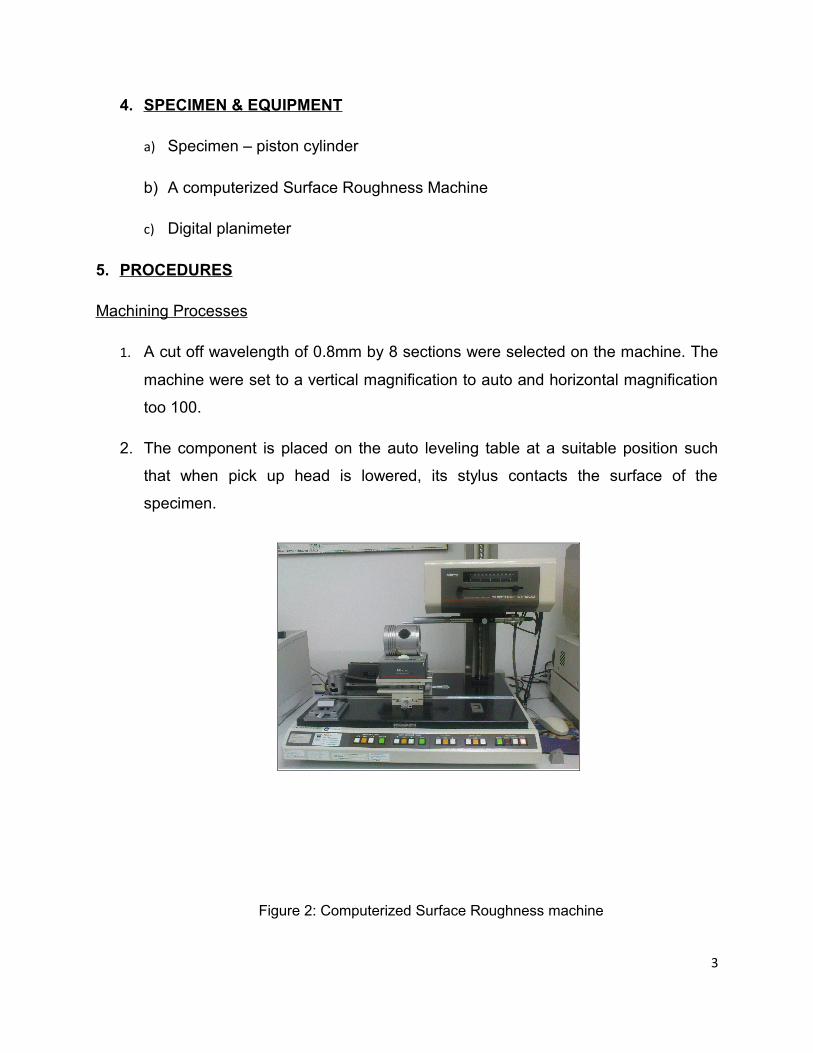
L
5. The machine was set; the measurement is ready to be recorded.
6. The roughness profile graph for the specimen was obtained.
Manual Processes
Figure 3: Roughness Profile
1. Three peaks on the profile graph were selected.
2. Two vertical lines were drawn for the three peaks.
4
CLA Line
L
CLA Line
3. A centerline (CLA) line was drawn.
4. The areas above and below the CLA line was measured using a digital
planimeter. Three measurements were taken and the average of the
measurements was calculated.
5. The value of CLA was calculated.
6. The computerized result for CLA was compared with the manual result.
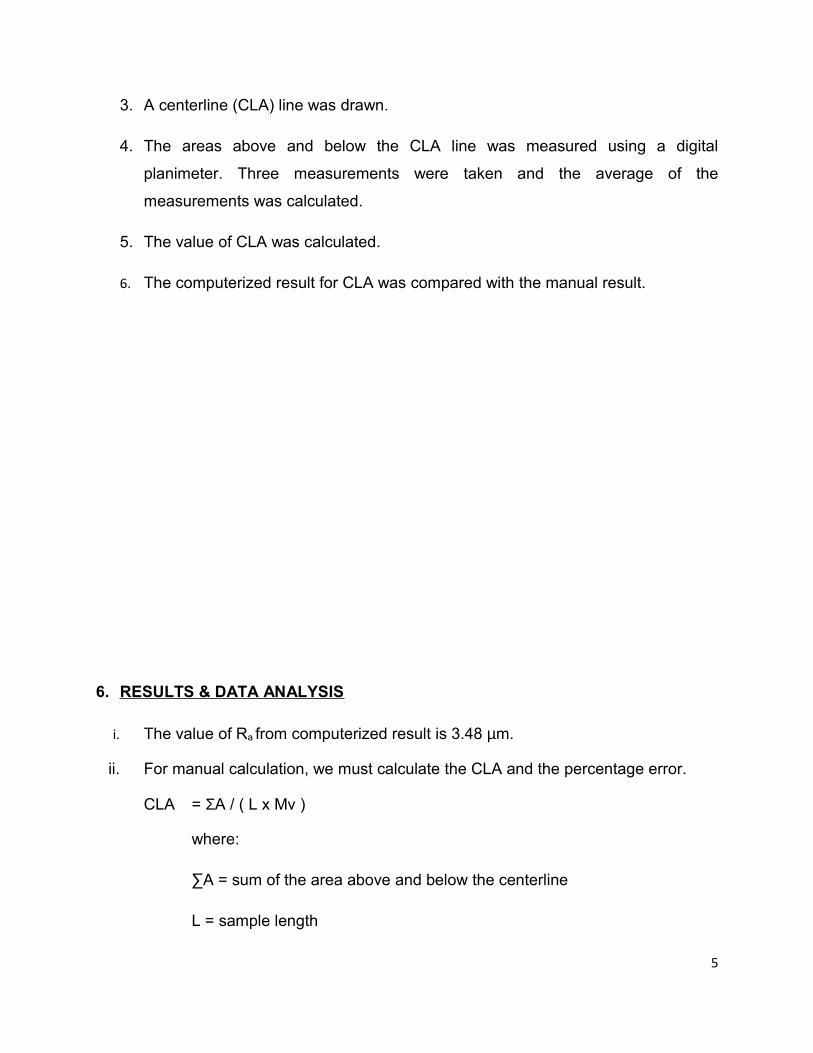
6. RESULTS & DATA ANALYSIS
i. The value of Ra from computerized result is 3.48 µm.
ii. For manual calculation, we must calculate the CLA and the percentage error.
CLA = ΣA / ( L x Mv )
where:
∑A = sum of the area above and below the centerline
L = sample length
5
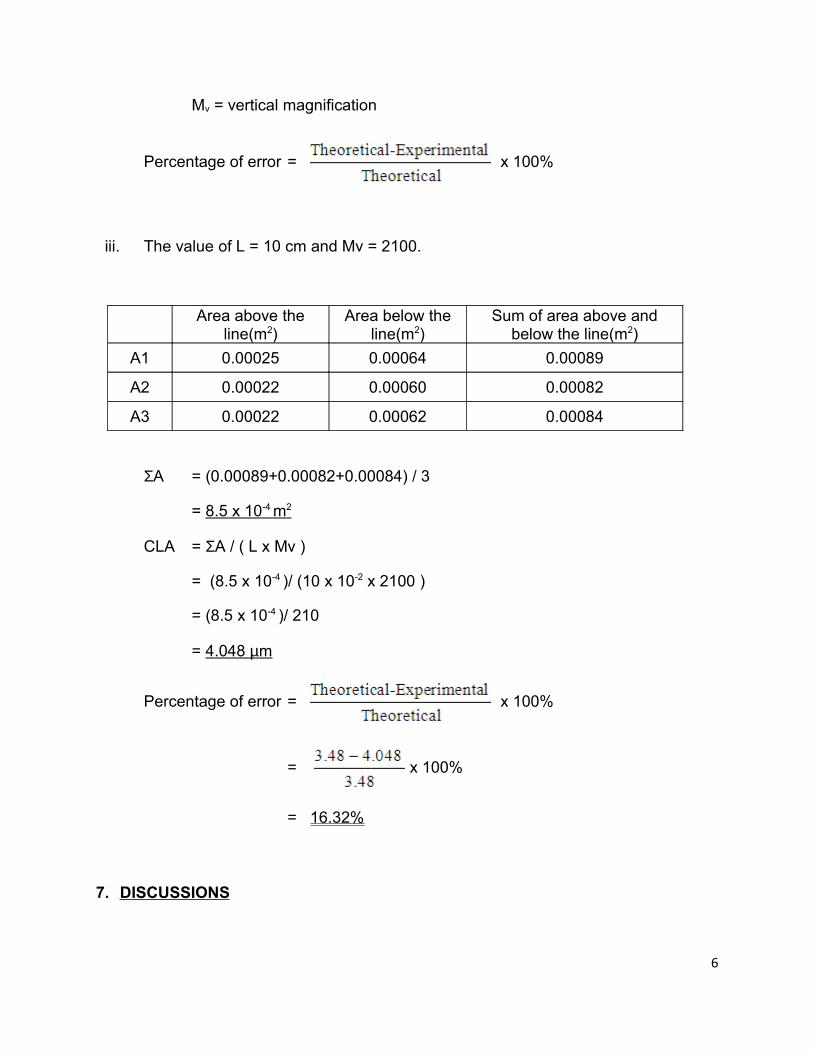
Mv = vertical magnification
Percentage of error = x 100%
iii. The value of L = 10 cm and Mv = 2100.
Area above the line(m2)
Area below the line(m2)
Sum of area above and below the line(m2)
A1 0.00025 0.00064 0.00089
A2 0.00022 0.00060 0.00082
A3 0.00022 0.00062 0.00084
ΣA = (0.00089+0.00082+0.00084) / 3
= 8.5 x 10 -4 m 2
CLA = ΣA / ( L x Mv )
= (8.5 x 10⁻⁴ )/ (10 x 10-2 x 2100 )
= (8.5 x 10⁻⁴ )/ 210
= 4.048 µ m
Percentage of error = x 100%
= x 100%
= 16.32%
7. DISCUSSIONS
6
From the result, the roughness value that we get using Center Line Average
(CLA) method is 4.048µm and the percentage of error is 16.32%. The percentage of
error that we get is acceptable since the value is still below 20%. If the value of
percentage of error is above 20%, the error is considered large. There are some errors
that occur during the experiment which caused the percentage of error value equal to
16.32% which is the inconsistent of hand movement. When the hand movement is not
consistent, the result will be affected. The inconsistent of the hand movement cannot be
controlled since it is normal for each people. In our opinion, we believe that the value of
Ra is depends on the peak value and how often the peak is occur. If the peak occurs in
many time and high, it will affect the value of area and directly affect the value of
roughness that we get from manual calculation. Since the value of Ra is get from the
computer, we know that it will give the most accurate value compare to the manual
result. The manual result will give us more error since it can be affected by environment
factor.
One of the causes of incorrect measurement is the selection of the wrong cutoff
wavelength. Selecting the incorrect cutoff length could make the values appear larger or
smaller than the desired values. The cutoff wavelength must be at the centre wave or
close to the center of wave. The tracing speed of the person who is conducting this
experiment is also not the same. In this experiment, we use three different people to
measure the profile of the surface roughness. So, the speed between the three of us is
not the same. It may differ according to the method of our group members. If the trace
speed is too high, it will effect the measurement data because it will cause the data
recorded is not exactly as the exact value. It also will cause the distortion to occur when
the tracing speed is too high.
Other than that, one of our group member was used the left hand to measure the
profile of surface roughness. It will affect the result because the instrument is more
suitable for people who use the right hand to handle this instrument. When handling this
instrument, suddenly we stop the measuring process and will proceed the process to
complete the measurement. So, when we proceed the process, some mistakes will
7
occur during the proceeding the process. The instrument may not stay in contact with
the surface continuously. So, when this happen it will cause the error to occur.
The environment condition also will influence the reading of the result. During the
measurement process, if the table or papers are move during measurement, the error
will occur. The digital planimeter is the sensitive instrument, so it must be carefully
handle to avoid the error from occur. Finally, the error may occur if the surface to put the
graph paper has dirt. If there any dirt appeared, the accuracy of measurement for area
above and below centerline will decrease. This is because of the sensitivity of the digital
planimeter.
There are several precautions that should be taken and considered to ensure
accurate data and result is obtained. Firstly, students should ensure that the profile
graph paper is clean from any dirt and positioned correctly and neatly on the table.
Other than that, students should handle the digital planimeter carefully and not to touch
the screw at the back of the planimeter. This is because it will affect our reading. To
obtain accurate results, students should consider taking three measurements and
calculating the average. Also, students should make sure that the person who is in
charge of measuring the graph area has steady hands and of the same person to get
accurate and consistent results.
8. CONCLUSION
From this experiment, we found that the value of the roughness of the specimen
by using CLA method is greater than the Roughness Average (Ra) method. The error is
acceptable since the percentage of error is less than 20%. To overcome this error, we
should do the experiment carefully by considered the precaution in this experiment.
Other than that, in order to get the result that is close to the Ra method, we must take at
least three times reading. The more reading that we take, the more accurate value we
will achieved. Besides, we also must know the error that might occur in this experiment
to prevent the mistake occur in the next time.
8
As a conclusion, the objective of this experiment is successfully achieved since
we had got the value of roughness by using CLA method or Ra method. We also have
succeeded to determine the error and the method to overcome the error in this
experiment.
9. RECOMMENDATION
Students should take measurements using the digital planimeter at least three
times and calculate its average. This is to ensure accurate data and result is obtained. It
is also recommended that the students should pick the suitable place on the table to put
the roughness profile graph so that the person who is going to use the digital planimeter
is comfortable when measuring. Students should handle the equipment with care
especially the digital planimeter as it is a very sensitive equipment. The screw below the
digital planimeter should not be disturbed to ensure exact and accurate measurements
were taken. It is recommended that the same student who measures the area of the
graph using the digital planimeter should also calculate the area of the graph
themselves.
Nowadays, the quality of product is very important in manufacturing area since
many companies are competing with each other. Usually, the product which has rough
surface is undesirable. This problem is difficult and expensive to control in
manufacturing. So, we must have a machine that can measure the roughness of the
product. The Computerized Roughness measuring machine are recommended because
it can reduce the problem error and faster than manual method. This machine is also
more accurate than manual method. We suggest that each company has this kind of
machine so they can determine their product surface roughness and improve of it from
time to time.
10.REFERENCES9
a) http://claymore.engineer.gvsu.edu/~jackh/eod/manufact/manufact-84.html
b) http://www.mfg.mtu.edu/cyberman /quality/sfinish/terminology.html
ASSIGNMENT: Roundness
Objective
1. To calibrate a Dial Gauge using Calibration Tester
2. To find the error on each reading of the dial Gauge
3. To obtain the accuracy of the gauge
10
Introduction
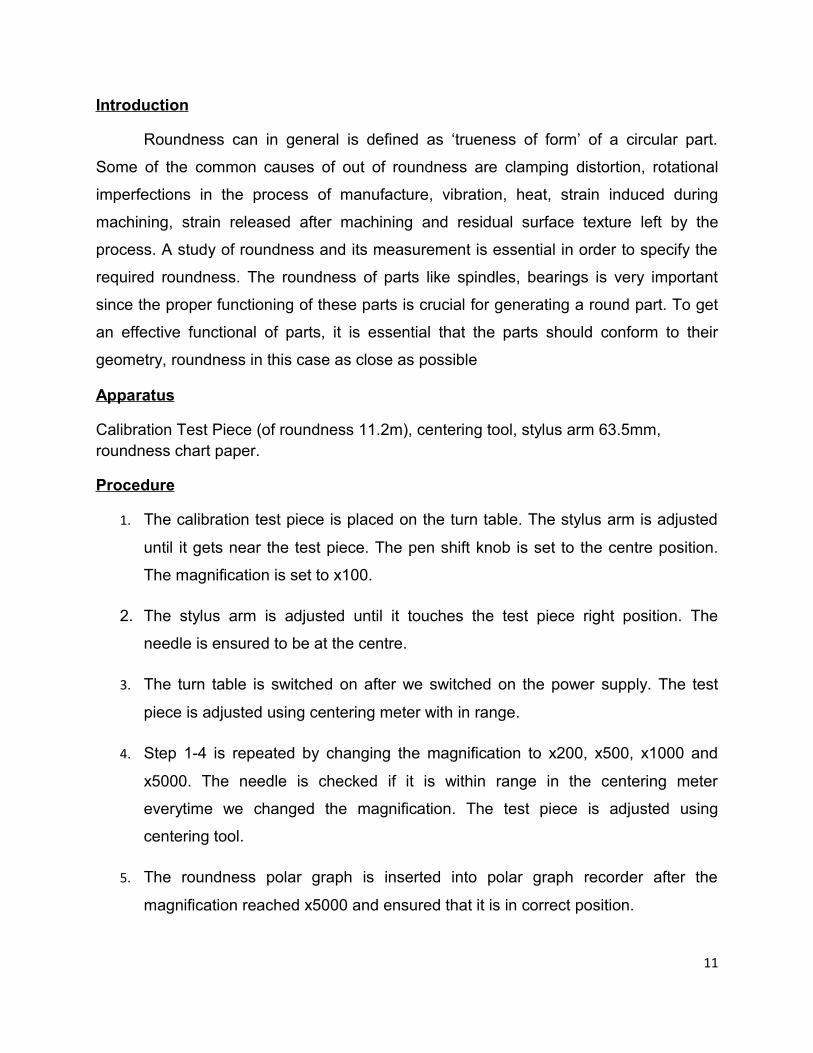
Roundness can in general is defined as ‘trueness of form’ of a circular part.
Some of the common causes of out of roundness are clamping distortion, rotational
imperfections in the process of manufacture, vibration, heat, strain induced during
machining, strain released after machining and residual surface texture left by the
process. A study of roundness and its measurement is essential in order to specify the
required roundness. The roundness of parts like spindles, bearings is very important
since the proper functioning of these parts is crucial for generating a round part. To get
an effective functional of parts, it is essential that the parts should conform to their
geometry, roundness in this case as close as possible
Apparatus
Calibration Test Piece (of roundness 11.2m), centering tool, stylus arm 63.5mm, roundness chart paper.
Procedure
1. The calibration test piece is placed on the turn table. The stylus arm is adjusted
until it gets near the test piece. The pen shift knob is set to the centre position.
The magnification is set to x100.
2. The stylus arm is adjusted until it touches the test piece right position. The
needle is ensured to be at the centre.
3. The turn table is switched on after we switched on the power supply. The test
piece is adjusted using centering meter with in range.
4. Step 1-4 is repeated by changing the magnification to x200, x500, x1000 and
x5000. The needle is checked if it is within range in the centering meter
everytime we changed the magnification. The test piece is adjusted using
centering tool.
5. The roundness polar graph is inserted into polar graph recorder after the
magnification reached x5000 and ensured that it is in correct position.
11
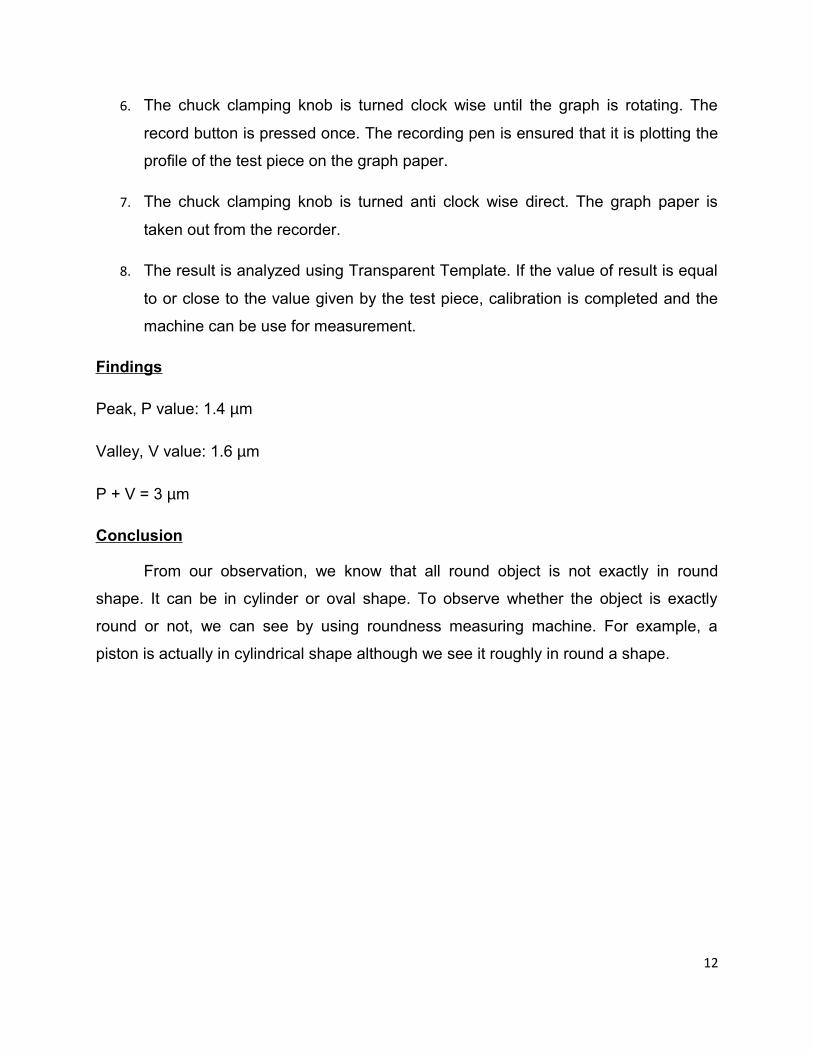
6. The chuck clamping knob is turned clock wise until the graph is rotating. The
record button is pressed once. The recording pen is ensured that it is plotting the
profile of the test piece on the graph paper.
7. The chuck clamping knob is turned anti clock wise direct. The graph paper is
taken out from the recorder.
8. The result is analyzed using Transparent Template. If the value of result is equal
to or close to the value given by the test piece, calibration is completed and the
machine can be use for measurement.
Findings
Peak, P value: 1.4 µm
Valley, V value: 1.6 µm
P + V = 3 µm
Conclusion
From our observation, we know that all round object is not exactly in round
shape. It can be in cylinder or oval shape. To observe whether the object is exactly
round or not, we can see by using roundness measuring machine. For example, a
piston is actually in cylindrical shape although we see it roughly in round a shape.
12
Related Documents