Vision Research 46 (2006) 2636–2644 www.elsevier.com/locate/visres 0042-6989/$ - see front matter © 2006 Elsevier Ltd. All rights reserved. doi:10.1016/j.visres.2006.02.011 Surface orientation, modulation frequency and the detection and perception of depth deWned by binocular disparity and motion parallax Mark F. Bradshaw a , Paul B. Hibbard b,¤ , Andrew D. Parton a , David Rose a , Keith Langley c a Department of Psychology, University of Surrey, Guildford, Surrey, GU2 7XH, UK b School of Psychology, University of St. Andrews, St. Mary’s College, South Street, St. Andrews, Fife, KY16 9JP, UK c Department of Psychology, University College London, Gower Street, London WC1E 6BT, UK Received 21 September 2004; received in revised form 10 February 2006 Abstract Binocular disparity and motion parallax provide information about the spatial structure and layout of the world. Descriptive similari- ties between the two cues have often been noted which have been taken as evidence of a close relationship between them. Here, we report two experiments which investigate the eVect of surface orientation and modulation frequency on (i) a threshold detection task and (ii) a supra-threshold depth-matching task using sinusoidally corrugated surfaces deWned by binocular disparity or motion parallax. For low frequency corrugations, an orientation anisotropy was observed in both domains, with sensitivity decreasing as surface orientation was varied from horizontal to vertical. In the depth-matching task, for surfaces deWned by binocular disparity the greatest depth was seen for oblique orientations. For surfaces deWned by motion parallax, perceived depth was found to increase as surface orientation was varied from horizontal to vertical. In neither case was perceived depth for supra-threshold surfaces related to threshold performance in any sim- ple manner. These results reveal clear diVerences between the perception of depth from binocular disparity or motion parallax, and between perception at threshold and supra-threshold levels of performance. © 2006 Elsevier Ltd. All rights reserved. Keyword: Disparity motion parallax depth processing 1. Introduction Binocular disparity and retinal motion are powerful visual cues to the three-dimensional structure of surfaces in our environment. This has been demonstrated by measur- ing depth sensitivity functions for sinusoidal modulations deWned by binocular disparity or motion parallax (Brad- shaw & Rogers, 1999; Rogers & Graham, 1982; Tyler, 1974, 1983). In both domains, sensitivity to horizontally oriented depth corrugations diVers as a function of modulation fre- quency where both functions peak at frequencies around 0.2–0.4 cpd, and decrease at both higher and lower frequen- cies. Although primarily descriptive, these sensitivity func- tions based on depth corrugations have proved useful in predicting perceptual outcomes in certain circumstances. For example, our susceptibility to the Craik–O’Brien– Cornsweet illusion, deWned by disparity or motion parallax, can be explained in terms of our relative insensitivity to low frequency information, as revealed by the disparity or motion parallax sensitivity functions (Anstis, Howard, & Rogers, 1978; Rogers & Graham, 1983). An important factor determining our perception of depth from binocular disparity or motion parallax is the direction in which it varies. Typically, variations in binocu- lar disparity in the vertical direction (which lead, for exam- ple, to the perception of slant or curvature around a horizontal axis) are more readily perceived than the equiva- lent variations in the horizontal direction. This orientation anisotropy is evident at threshold, and also aVects perceived depth magnitude and the time required for depth to be * Corresponding author. Fax: +44 01334 46 3042. E-mail address: [email protected] (P.B. Hibbard).

Welcome message from author
This document is posted to help you gain knowledge. Please leave a comment to let me know what you think about it! Share it to your friends and learn new things together.
Transcript
Vision Research 46 (2006) 2636–2644www.elsevier.com/locate/visres
Surface orientation, modulation frequency and the detection and perception of depth deWned by binocular disparity and motion parallax
Mark F. Bradshaw a, Paul B. Hibbard b,¤, Andrew D. Parton a, David Rose a, Keith Langley c
a Department of Psychology, University of Surrey, Guildford, Surrey, GU2 7XH, UKb School of Psychology, University of St. Andrews, St. Mary’s College, South Street, St. Andrews, Fife, KY16 9JP, UK
c Department of Psychology, University College London, Gower Street, London WC1E 6BT, UK
Received 21 September 2004; received in revised form 10 February 2006
Abstract
Binocular disparity and motion parallax provide information about the spatial structure and layout of the world. Descriptive similari-ties between the two cues have often been noted which have been taken as evidence of a close relationship between them. Here, we reporttwo experiments which investigate the eVect of surface orientation and modulation frequency on (i) a threshold detection task and (ii) asupra-threshold depth-matching task using sinusoidally corrugated surfaces deWned by binocular disparity or motion parallax. For lowfrequency corrugations, an orientation anisotropy was observed in both domains, with sensitivity decreasing as surface orientation wasvaried from horizontal to vertical. In the depth-matching task, for surfaces deWned by binocular disparity the greatest depth was seen foroblique orientations. For surfaces deWned by motion parallax, perceived depth was found to increase as surface orientation was variedfrom horizontal to vertical. In neither case was perceived depth for supra-threshold surfaces related to threshold performance in any sim-ple manner. These results reveal clear diVerences between the perception of depth from binocular disparity or motion parallax, andbetween perception at threshold and supra-threshold levels of performance.© 2006 Elsevier Ltd. All rights reserved.
Keyword: Disparity motion parallax depth processing
1. Introduction
Binocular disparity and retinal motion are powerfulvisual cues to the three-dimensional structure of surfaces inour environment. This has been demonstrated by measur-ing depth sensitivity functions for sinusoidal modulationsdeWned by binocular disparity or motion parallax (Brad-shaw & Rogers, 1999; Rogers & Graham, 1982; Tyler, 1974,1983). In both domains, sensitivity to horizontally orienteddepth corrugations diVers as a function of modulation fre-quency where both functions peak at frequencies around0.2–0.4 cpd, and decrease at both higher and lower frequen-cies. Although primarily descriptive, these sensitivity func-
* Corresponding author. Fax: +44 01334 46 3042.E-mail address: [email protected] (P.B. Hibbard).
0042-6989/$ - see front matter © 2006 Elsevier Ltd. All rights reserved.doi:10.1016/j.visres.2006.02.011
tions based on depth corrugations have proved useful inpredicting perceptual outcomes in certain circumstances.For example, our susceptibility to the Craik–O’Brien–Cornsweet illusion, deWned by disparity or motion parallax,can be explained in terms of our relative insensitivity to lowfrequency information, as revealed by the disparity ormotion parallax sensitivity functions (Anstis, Howard, &Rogers, 1978; Rogers & Graham, 1983).
An important factor determining our perception ofdepth from binocular disparity or motion parallax is thedirection in which it varies. Typically, variations in binocu-lar disparity in the vertical direction (which lead, for exam-ple, to the perception of slant or curvature around ahorizontal axis) are more readily perceived than the equiva-lent variations in the horizontal direction. This orientationanisotropy is evident at threshold, and also aVects perceiveddepth magnitude and the time required for depth to be
M.F. Bradshaw et al. / Vision Research 46 (2006) 2636–2644 2637
perceived (Bradshaw & Rogers, 1999; Bradshaw, Hibbard,& Gillam, 2002; Hibbard, Bradshaw, Langley, & Rogers,2002; Mitchison & McKee, 1990; Wallach & Bacon, 1976).Similarly, for a monocular observer making horizontalhead movements while viewing a surface shape deWned bythe motion parallax arising from these head movements, asimilar orientation anisotropy exists which aVects thresholdperception and perceived depth magnitude (Allison, Rog-ers, & Bradshaw, 1978; Cornilleau-Peres & Droulez, 1993;De Vries & Werkhoven, 1995; Rogers & Graham, 1983).
Evidence from both domains therefore suggests that thevisual system’s ability to use binocular disparity or motionparallax to recover depth information depends on the spa-tial structure of depth variations as well as their magnitude.In particular, the direction in which the change in disparityor motion is greatest is an important factor determining theextent to which this information can be used. It is perhapssurprising therefore that empirical research has concen-trated almost exclusively on surfaces in which the visualcues change along the cardinal directions only (Bradshaw& Rogers, 1999). Indeed, for parallax deWned surfaces thereare no published data which deWne the sensitivity functionfor vertically oriented surfaces as a function of modulationfrequency. We provide these data here. Moreover, the ques-tion that naturally arises in this context is what happens tothreshold and supra-threshold perception at intermediateorientations between horizontal and vertical. In the case ofstimuli deWned by luminance contrast, sensitivity toobliquely oriented stimuli cannot be predicted from sensi-tivity to stimuli at cardinal orientations, and accounting forthese diVerences has placed important constraints on mod-els of visual encoding (Essock, DeFord, Hansen, & Sinai,2003; Hansen & Essock, 2004). It is similarly important tounderstand the inXuence of orientation of surface corruga-tions on the perception of depth from binocular disparityor motion parallax.
The aim of this paper therefore is to address this ques-tion and to establish the eVect of corrugation orientationand spatial frequency on both (i) a threshold detection taskand (ii) a supra-threshold depth-matching task on surfacesdeWned by binocular disparity (Experiments 1a and b) andmotion parallax (Experiments 2a and b).
In collecting the range of data that we present here, forsurfaces deWned by binocular disparity and motion paral-lax, we provide a comprehensive description of how theperception of depth from cues is aVected by orientation andspatial frequency. In addition, the data also allow for adescriptive comparison between the cues. Marked similari-ties between the processing of binocular disparity andmotion parallax have often been noted. For example, theshapes of their depth sensitivity functions are similar over arange of spatial frequencies for horizontally oriented sur-faces (Rogers & Graham, 1982). Such similarities may bemanifest in a range of circumstances and add weight to theclaim that information from the two domains comestogether at some stage in the visual system. The fact thatsimilar simultaneous and successive contrast eVects can be
created in both domains, and that cross adaptation is possi-ble, adds to this idea (Bradshaw & Rogers, 1996; Nawrot &Blake, 1991; Rogers & Collett, 1989; Rogers & Graham,1984). The data presented here will allow a more compre-hensive comparison of the two cues in relation to diVerentdependent variables and when threshold and supra-thresh-old tasks are employed.
2. Experiment 1a—binocular disparity detection thresholds
This experiment determined detection thresholds forcorrugated surfaces deWned by binocular disparity and howthey varied with the (i) orientation and (ii) modulation fre-quency of the surface corrugation.
2.1. Observers
Four observers (ADP, PBH, SJW and MFB) who hadnormal, or corrected to normal, visual acuity and stereoacuity of <20� participated in the experiment.
2.2. Stimuli
The stimuli were random dot stereograms depicting sur-faces that were sinusoidally corrugated in depth. Each stim-ulus subtended a circular region with a diameter of 10°. Thecentral corrugation of the surface was marked by two thinlines, 1.5° in length, oVset by 1° from either side of the stim-ulus at the orientation of the corrugations. A Wxation crossand nonius lines were presented in the centre of the screenbetween each trial to enable observers to maintain steadyWxation. Dots were presented on the surface with a densityof 37.7 dots deg¡2. Each dot had a Gaussian luminance pro-Wle with a standard deviation of 1.78�; the luminous inten-sity of a dot was 7.0£10¡5 cd. Individual dots werepositioned with subpixel accuracy. The background lumi-nance of the screen was 0.15 cdm¡2. Disparity thresholdswere measured for four corrugation frequencies (0.1, 0.2, 0.4and 0.8 cpd) and Wve surface orientations (0°, 22.5°, 45°,67.5° and 90°), where 0° refers to a horizontally orientedcorrugation in which binocular disparity is modulated in avertical direction.
2.3. Apparatus
Stimuli were generated on an Apple Macintosh 7500computer and presented using two 12 in. monochromeApple monitors arranged in a standard Wheatstone conWg-uration and viewed through two Wrst-surface mirrors set at§45° to the median plane. The luminance output of eachmonitor was linearised. The viewing distance was 95 cm; atthis distance, each pixel subtended 1.2�.
2.4. Procedure
The method of constant stimuli was used to determinethreshold performance. The observer’s task was to report
2638 M.F. Bradshaw et al. / Vision Research 46 (2006) 2636–2644
whether the corrugation at the centre of the dot pattern,and marked by the two white lines, was concave (atrough) or convex (a peak), by pressing one of tworesponse keys. It should be noted that this task does notrequire the overall shape of the corrugation to be identi-Wed, merely that the sign of a non-zero disparity in thecentre of the stimulus be correctly detected. On each trial,the disparity signal was randomly chosen from seven pos-sible values corresponding to ¡3, ¡2, ¡1, 0, 1, 2 or 3 timesthe “step size”. The sign of the disparity determinedwhether the central corrugation was a peak or a trough.The step size for each condition was chosen in pilot trials.An experimental session consisted of 280 trials (in fourblocks), corresponding to 40 trials at each of the sevendisparity levels. Frequency of seeing plots were generatedfrom each data set and the best-Wtting cumulative Gauss-ian curve was determined using the probit technique (Fin-ney, 1971). The 75% point on the psychometric functionwas taken as the threshold value. Prior to commencingeach block the observer viewed a supra-threshold surface(with a simulated peak-to-trough depth modulation ofbetween 200 and 600�) of the same orientation and corru-gation frequency as the test stimuli. Each stimulus waspresented for 2 s. The experiment was run over severaldays with the order of presentation of stimulus blocksrandomised.
2.5. Results
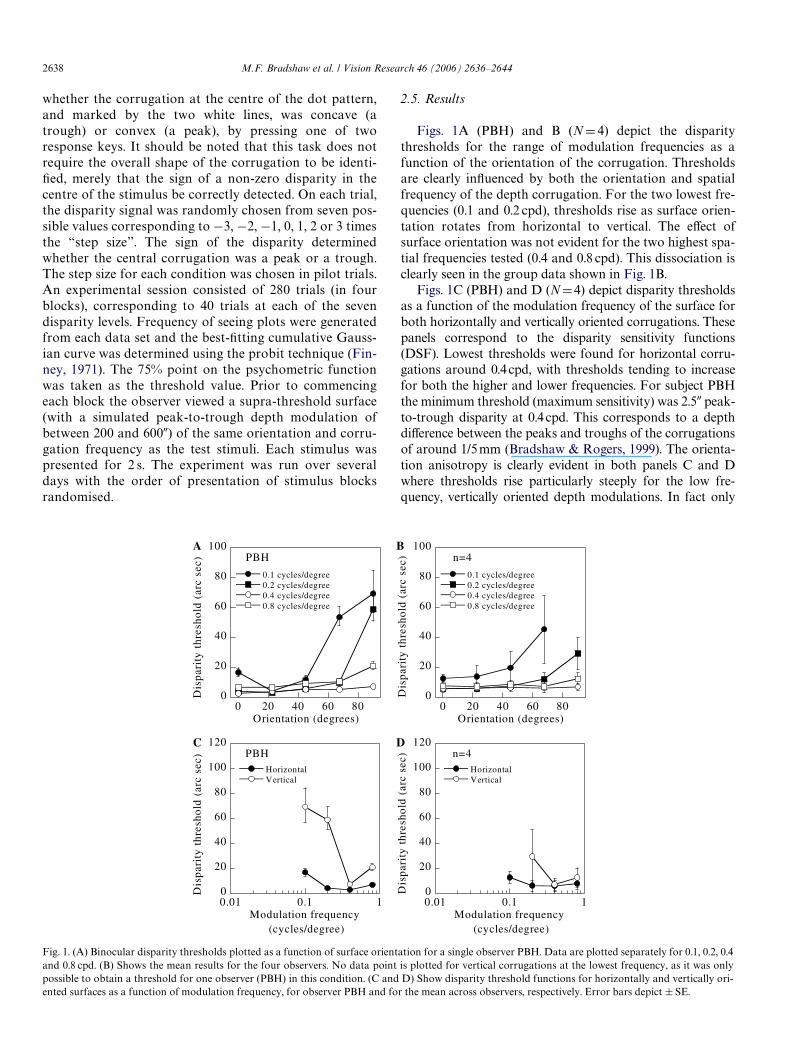
Figs. 1A (PBH) and B (ND4) depict the disparitythresholds for the range of modulation frequencies as afunction of the orientation of the corrugation. Thresholdsare clearly inXuenced by both the orientation and spatialfrequency of the depth corrugation. For the two lowest fre-quencies (0.1 and 0.2 cpd), thresholds rise as surface orien-tation rotates from horizontal to vertical. The eVect ofsurface orientation was not evident for the two highest spa-tial frequencies tested (0.4 and 0.8 cpd). This dissociation isclearly seen in the group data shown in Fig. 1B.
Figs. 1C (PBH) and D (ND4) depict disparity thresholdsas a function of the modulation frequency of the surface forboth horizontally and vertically oriented corrugations. Thesepanels correspond to the disparity sensitivity functions(DSF). Lowest thresholds were found for horizontal corru-gations around 0.4 cpd, with thresholds tending to increasefor both the higher and lower frequencies. For subject PBHthe minimum threshold (maximum sensitivity) was 2.5� peak-to-trough disparity at 0.4 cpd. This corresponds to a depthdiVerence between the peaks and troughs of the corrugationsof around 1/5 mm (Bradshaw & Rogers, 1999). The orienta-tion anisotropy is clearly evident in both panels C and Dwhere thresholds rise particularly steeply for the low fre-quency, vertically oriented depth modulations. In fact only
Fig. 1. (A) Binocular disparity thresholds plotted as a function of surface orientation for a single observer PBH. Data are plotted separately for 0.1, 0.2, 0.4and 0.8 cpd. (B) Shows the mean results for the four observers. No data point is plotted for vertical corrugations at the lowest frequency, as it was onlypossible to obtain a threshold for one observer (PBH) in this condition. (C and D) Show disparity threshold functions for horizontally and vertically ori-ented surfaces as a function of modulation frequency, for observer PBH and for the mean across observers, respectively. Error bars depict § SE.
0
20
40
60
80
100
0 20 40 60 80
PBH
0.1 cycles/degree0.2 cycles/degree0.4 cycles/degree0.8 cycles/degree
)ces cra( dlohserht ytira
psiD
Orientation (degrees)
0
20
40
60
80
100
0 20 40 60 80
n=4
0.1 cycles/degree0.2 cycles/degree0.4 cycles/degree0.8 cycles/degree
)ces cra( dl ohser ht ytira
psiD
Orientation (degrees)
0
20
40
60
80
100
120
0.01 0.1 1
PBHHorizontalVertical
)ces cra( dlohserht
ytirapsiD
Modulation frequency (cycles/degree)
0
20
40
60
80
100
120
0.01 0.1 1
n=4HorizontalVertical
)ces cra( dloh se rh t
yt ir ap siD
Modulation frequency (cycles/degree)
A
C
B
D
M.F. Bradshaw et al. / Vision Research 46 (2006) 2636–2644 2639
PBH recorded a reliable threshold for vertical corrugationsat 0.1 cpd, which further illustrates the profound insensitivityto low frequency vertical oriented depth modulations of mostsubjects (Hibbard et al., 2002). In other respects, results weresimilar for all observers. Interestingly, the other three observ-ers produced thresholds of similar magnitude to PBH whenthe surface was oriented near vertical (67.5°).
3. Experiment 1b—binocular disparity depth matching
This experiment assessed whether the magnitude ofdepth perceived in supra-threshold corrugated surfacesdeWned by binocular disparity varies with the orientationand the spatial frequency of the corrugation.
3.1. Observers
Ten observers participated in the experiment. All observ-ers had normal, or corrected to normal, visual acuity andstereo acuity of <20�.
3.2. Stimuli and apparatus
The random dot stimuli were identical to those used inExperiment 1a. The apparatus was also the same asdescribed for Experiment 1a.
3.3. Procedure
The observer’s task was to adjust the magnitude of thedepth in a horizontally oriented reference surface corruga-tion until it appeared to match that of a test surface. The ref-erence and test surfaces were shown in alternation, with eachdisplayed for 2 s. There was no time limit for a trial (the refer-ence and test being presented alternately until the observerhad made a Wnal match) and observers were instructed toperform the task as accurately as possible. The test surfacehad a Wxed peak-to-trough disparity of 300� and an orienta-tion selected at random from one of Wve angles (0°, 22.5°, 45°,67.5° and 90°). Four settings were made for each orientationand for two diVerent corrugation frequencies (0.2 and0.8 cpd). The experiment was run in two blocks (one for each
corrugation frequency) with the order of presentation of theblocks randomised across observers.
3.4. Results
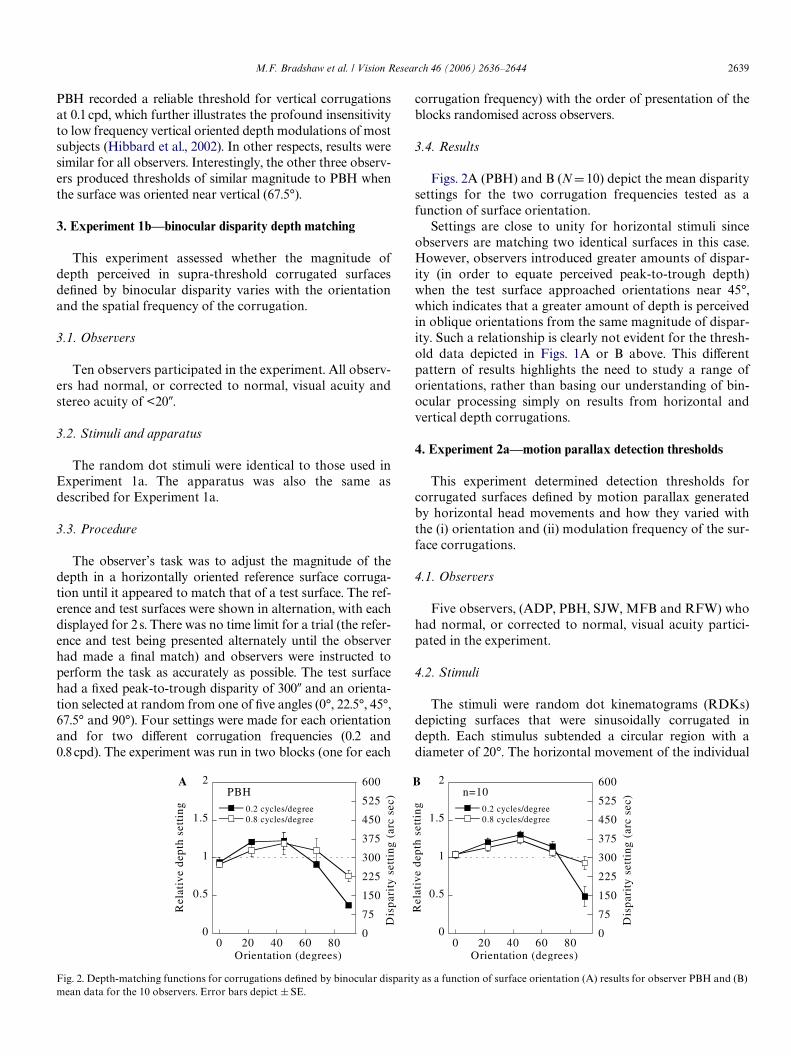
Figs. 2A (PBH) and B (ND10) depict the mean disparitysettings for the two corrugation frequencies tested as afunction of surface orientation.
Settings are close to unity for horizontal stimuli sinceobservers are matching two identical surfaces in this case.However, observers introduced greater amounts of dispar-ity (in order to equate perceived peak-to-trough depth)when the test surface approached orientations near 45°,which indicates that a greater amount of depth is perceivedin oblique orientations from the same magnitude of dispar-ity. Such a relationship is clearly not evident for the thresh-old data depicted in Figs. 1A or B above. This diVerentpattern of results highlights the need to study a range oforientations, rather than basing our understanding of bin-ocular processing simply on results from horizontal andvertical depth corrugations.
4. Experiment 2a—motion parallax detection thresholds
This experiment determined detection thresholds forcorrugated surfaces deWned by motion parallax generatedby horizontal head movements and how they varied withthe (i) orientation and (ii) modulation frequency of the sur-face corrugations.
4.1. Observers
Five observers, (ADP, PBH, SJW, MFB and RFW) whohad normal, or corrected to normal, visual acuity partici-pated in the experiment.
4.2. Stimuli
The stimuli were random dot kinematograms (RDKs)depicting surfaces that were sinusoidally corrugated indepth. Each stimulus subtended a circular region with adiameter of 20°. The horizontal movement of the individual
Fig. 2. Depth-matching functions for corrugations deWned by binocular disparity as a function of surface orientation (A) results for observer PBH and (B)mean data for the 10 observers. Error bars depict § SE.
0
0.5
1
1.5
2
0 20 40 60 80
PBH
0.2 cycles/degree0.8 cycles/degree
0
75
150
225
300
375
450
525
600
gnittes htped evitale
R
Orientation (degrees)
A B
)ces cra( gnittes ytirapsi
D
0
0.5
1
1.5
2
0 20 40 60 80
n=10
0.2 cycles/degree0.8 cycles/degree
0
75
150
225
300
375
450
525
600
gnittes htp ed evitale
R
Orientation (degrees)
)ces cra( gni ttes yti rapsi
D
2640 M.F. Bradshaw et al. / Vision Research 46 (2006) 2636–2644
dots in the RDKs was linked to the observers’ side-to-sidehead movements, so as to be consistent with the motion thatwould be observed from a real three-dimensional surface ina similar manner to that described by Rogers and Graham(1979). The individual elements of the RDKs were blobswith a Gaussian luminance proWle, with a standard devia-tion of 1.78� and a maximum luminance of 23 cdm¡2. Thebackground luminance of the screen was 0.15 cdm¡2. Themean density of the elements was 37.7 dotsdeg¡2. Motionparallax depth discrimination thresholds were measured forWve diVerent corrugation frequencies (0.05, 0.1, 0.2, 0.4 and0.8 cycles/degree) and Wve diVerent surface orientations (0°,22.5°, 45°, 67.5° and 90°). Horizontal head motion was usedto make the information provided by motion parallax (hori-zontal retinal motion) as similar as possible to the informa-tion provided by binocular viewing (horizontal binoculardisparities). One remaining diVerence is that, in the motionparallax condition, the velocities of individual dots variedover time, providing additional information that is notavailable in the binocular condition. The stimuli used in thebinocular disparity and motion parallax conditions were onthe whole identical in terms of their dot density, and the ori-entations and spatial frequencies tested. An exception to thiswas that an additional low spatial frequency (0.05 cycles/degree) was added in the motion parallax condition. Thesize of the stimuli was increased in the motion parallax con-dition to accommodate this frequency.
4.3. Apparatus
Stimuli were generated on an Apple Macintosh G3computer and presented on a 21 in. monochrome Radiusmonitor. The luminance output of the monitor was linear-ised. The observer viewed the stimuli monocularly via aheadrest that was free to move horizontally side-to-sidethrough a distance of §6.5 cm, in a direction parallel tothe monitor screen. When the headrest was in its centralposition the centre line of the stimuli was aligned with theobserver’s dominant eye. The viewing distance was 66 cm.At this distance, one pixel on the monitor subtended 1.9�.The horizontal position of the observer’s head was moni-tored using a potentiometer and an ADC (NationalInstruments PCI 1200) to select a precomputed stimulusframe presented to the observer, which was determined byhead position. Observers moved their head from side-to-side at a rate of 1 Hz paced by a metronome. All observersreported an impression of solid depth when viewingsupra-threshold stimuli in this fashion (Hogervorst, Brad-shaw, & Eagle, 2000).
4.4. Procedure
The method of constant stimuli was used to determinethreshold performance. The procedure was identical to thatdescribed in Section 2.4.
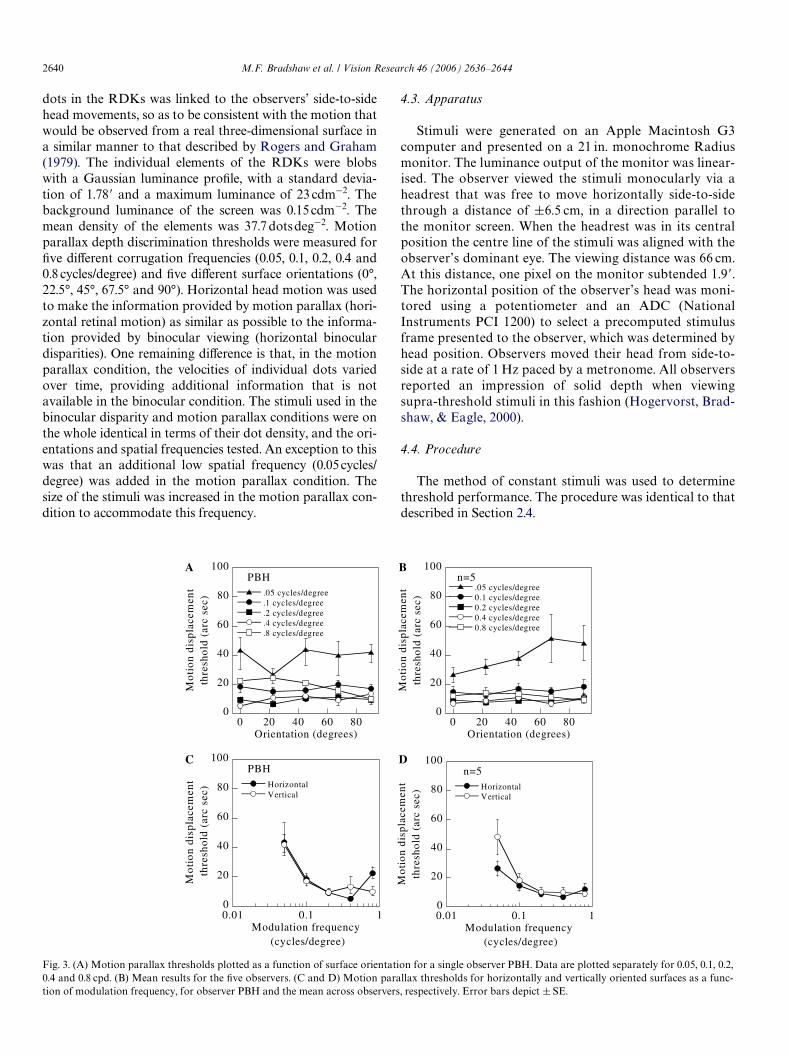
Fig. 3. (A) Motion parallax thresholds plotted as a function of surface orientation for a single observer PBH. Data are plotted separately for 0.05, 0.1, 0.2,0.4 and 0.8 cpd. (B) Mean results for the Wve observers. (C and D) Motion parallax thresholds for horizontally and vertically oriented surfaces as a func-
0
20
40
60
80
100
0 20 40 60 80
PBH.05 cycles/degree.1 cycles/degree.2 cycles/degree.4 cycles/degree.8 cycles/degree
tne
mecalpsid n
oito
M)ces cra( dl
ohserht
Orientation (degrees)
0
20
40
60
80
100
0 20 40 60 80
n=5.05 cycles/degree0.1 cycles/degree0.2 cycles/degree0.4 cycles/degree0.8 cycles/degree
tne
mecalpsid n
oito
M)ces cra( dl
ohserht
Orientation (degrees)
0
20
40
60
80
100
0.01 0.1 1
PBHHorizontalVertical
tnemecalpsid n
oito
M)ces cra(
dlohserht
Modulation frequency (cycles/degree)
0
20
40
60
80
100
0.01 0.1 1
n=5HorizontalVertical
tnemecalpsid n
oito
M)ces c ra( dl
ohserht
Modulation frequency (cycles/degree)
A B
C D
tion of modulation frequency, for observer PBH and the mean across observers, respectively. Error bars depict § SE.
M.F. Bradshaw et al. / Vision Research 46 (2006) 2636–2644 2641
4.5. Results
Motion parallax thresholds were computed as thediVerence in the total displacement for two dots posi-tioned at a peak and trough of the corrugation as theobserver makes one complete movement through§6.5 cm.
Figs. 3A (PBH) and B (ND5) depict motion parallaxthresholds for the range of modulation frequencies as afunction of orientation. Thresholds were inXuenced bymodulation frequency, increasing as the frequency wasdecreased. EVects of the orientation of the corrugation werealso evident. Thresholds for the 0.05 cpd corrugationincreased as orientation varied from horizontal to verticalwhereas thresholds were invariant to orientation at othermodulations frequencies (0.1–0.8 cpd).
Figs. 3C (PBH) and D (ND 5) depict motion parallaxthresholds as a function of the modulation frequency ofthe surface for both horizontally (0°) and vertically (90°)oriented surfaces. These panels correspond to the Wrstreported motion parallax sensitivity functions for bothhorizontally and vertically oriented depth corrugationsand so any orientation anisotropy typical of binoculardisparity processing can be established. Thresholdstended to increase with decreasing modulation frequency,and showed little evidence of an orientation anisotropy,except at the very lowest spatial frequency tested. Theselatter results should be interpreted with some caution, asat this frequency the display contained just a single cycleof the depth modulation. However, Bradshaw and Rogers(1999) found little eVect of the number of cycles of a stim-ulus on depth thresholds. The lowest threshold (maximumsensitivity) recorded for observer PBH was 5�, which wasfor horizontal corrugations with a spatial frequency of0.4 cpd.
5. Experiment 2b—motion parallax depth matching
This experiment assessed whether the amount of depthperceived in a supra-threshold corrugated surface deWnedby motion parallax varies with the orientation and the spa-
tial frequency of the corrugation. The design is the same asdescribed for Experiment 1b.
5.1. Observers
Five observers took part in the experiment. All observershad normal, or corrected to normal, visual acuity.
5.2. Stimuli and apparatus
Stimuli and apparatus were the same as those describedfor Experiment 2a (Section 4.2) and the procedure was thesame as that used in Experiment 1b (Section 3.2). Depthmatches were made between surfaces with diVerent orienta-tions for three spatial frequencies of depth modulation: 0.1,0.2, and 0.8 cpd.
5.3. Results
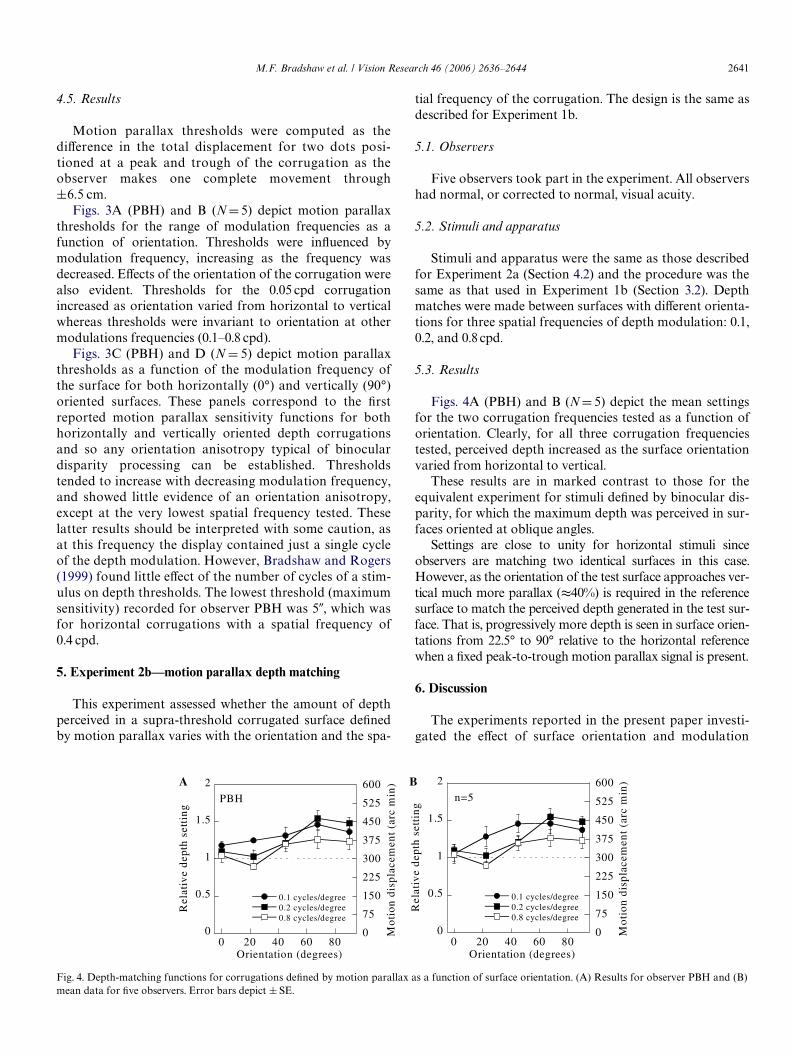
Figs. 4A (PBH) and B (ND 5) depict the mean settingsfor the two corrugation frequencies tested as a function oforientation. Clearly, for all three corrugation frequenciestested, perceived depth increased as the surface orientationvaried from horizontal to vertical.
These results are in marked contrast to those for theequivalent experiment for stimuli deWned by binocular dis-parity, for which the maximum depth was perceived in sur-faces oriented at oblique angles.
Settings are close to unity for horizontal stimuli sinceobservers are matching two identical surfaces in this case.However, as the orientation of the test surface approaches ver-tical much more parallax (t40%) is required in the referencesurface to match the perceived depth generated in the test sur-face. That is, progressively more depth is seen in surface orien-tations from 22.5° to 90° relative to the horizontal referencewhen a Wxed peak-to-trough motion parallax signal is present.
6. Discussion
The experiments reported in the present paper investi-gated the eVect of surface orientation and modulation
Fig. 4. Depth-matching functions for corrugations deWned by motion parallax as a function of surface orientation. (A) Results for observer PBH and (B)mean data for Wve observers. Error bars depict § SE.
0
0.5
1
1.5
2
0 20 40 60 80
PBH
0.1 cycles/degree0.2 cycles/degree0.8 cycles/degree
0
75
150
225
300
375
450
525
600
gnittes htpe
d evitale
R
Orientation (degrees)
)ni
m cra( tne
mecalpsid noitoM 0
0.5
1
1.5
2
0 20 40 60 80
n=5
0.1 cycles/degree0.2 cycles/degree0.8 cycles/degree
0
75
150
225
300
375
450
525
600
gnittes htpe
d evitale
R
Orientation (degrees)
)ni
m cra( tne
mecalp sid no i toM
A B
2642 M.F. Bradshaw et al. / Vision Research 46 (2006) 2636–2644
frequency on a threshold detection task and a supra-threshold depth-matching task for corrugated surfacesdeWned by binocular disparity and motion parallax. Mod-ulation frequency and orientation aVected performance inboth tasks.
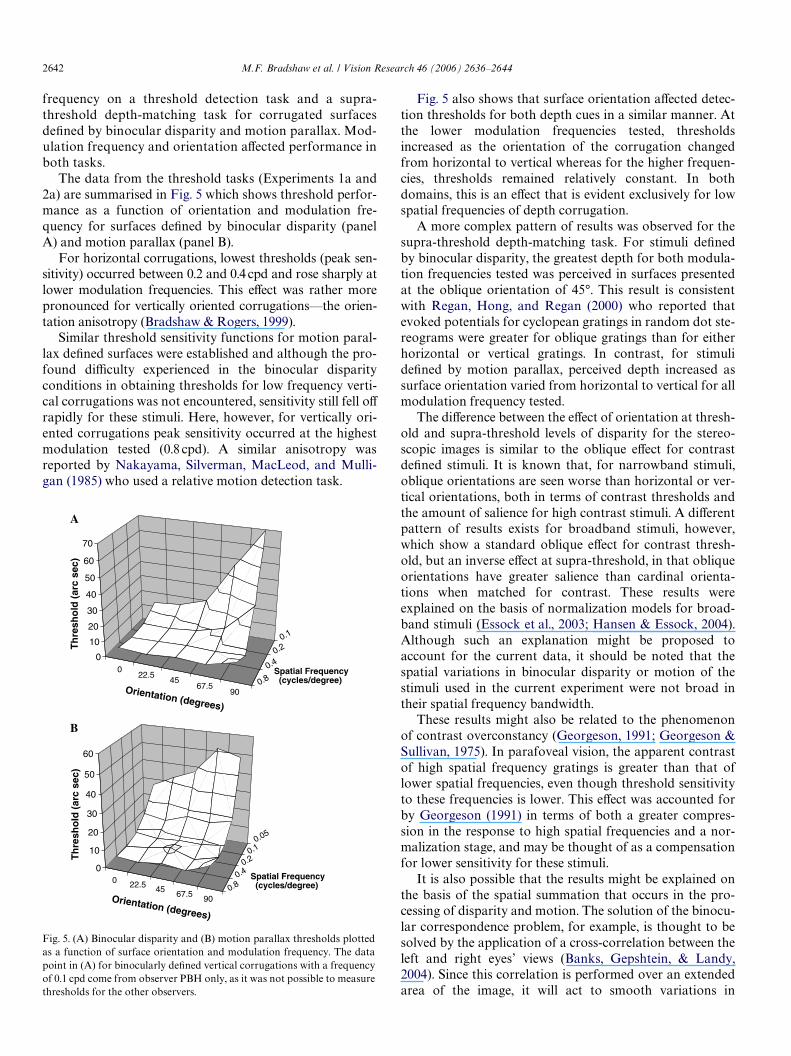
The data from the threshold tasks (Experiments 1a and2a) are summarised in Fig. 5 which shows threshold perfor-mance as a function of orientation and modulation fre-quency for surfaces deWned by binocular disparity (panelA) and motion parallax (panel B).
For horizontal corrugations, lowest thresholds (peak sen-sitivity) occurred between 0.2 and 0.4 cpd and rose sharply atlower modulation frequencies. This eVect was rather morepronounced for vertically oriented corrugations—the orien-tation anisotropy (Bradshaw & Rogers, 1999).
Similar threshold sensitivity functions for motion paral-lax deWned surfaces were established and although the pro-found diYculty experienced in the binocular disparityconditions in obtaining thresholds for low frequency verti-cal corrugations was not encountered, sensitivity still fell oVrapidly for these stimuli. Here, however, for vertically ori-ented corrugations peak sensitivity occurred at the highestmodulation tested (0.8 cpd). A similar anisotropy wasreported by Nakayama, Silverman, MacLeod, and Mulli-gan (1985) who used a relative motion detection task.
Fig. 5. (A) Binocular disparity and (B) motion parallax thresholds plottedas a function of surface orientation and modulation frequency. The datapoint in (A) for binocularly deWned vertical corrugations with a frequencyof 0.1 cpd come from observer PBH only, as it was not possible to measurethresholds for the other observers.
022.5
4567.5
900.8
0.40.2
0.1
0
10
20
30
40
50
60
70
Th
resh
old
(ar
c se
c)
Orientation (degrees)
Spatial Frequency (cycles/degree)
0 22.5 45 67.590
0.80.4
0.20.1
0.05
0
10
20
30
40
50
60
Th
resh
old
(ar
c se
c)
Orientation (degrees)
Spatial Frequency (cycles/degree)
A
B
Fig. 5 also shows that surface orientation aVected detec-tion thresholds for both depth cues in a similar manner. Atthe lower modulation frequencies tested, thresholdsincreased as the orientation of the corrugation changedfrom horizontal to vertical whereas for the higher frequen-cies, thresholds remained relatively constant. In bothdomains, this is an eVect that is evident exclusively for lowspatial frequencies of depth corrugation.
A more complex pattern of results was observed for thesupra-threshold depth-matching task. For stimuli deWnedby binocular disparity, the greatest depth for both modula-tion frequencies tested was perceived in surfaces presentedat the oblique orientation of 45°. This result is consistentwith Regan, Hong, and Regan (2000) who reported thatevoked potentials for cyclopean gratings in random dot ste-reograms were greater for oblique gratings than for eitherhorizontal or vertical gratings. In contrast, for stimulideWned by motion parallax, perceived depth increased assurface orientation varied from horizontal to vertical for allmodulation frequency tested.
The diVerence between the eVect of orientation at thresh-old and supra-threshold levels of disparity for the stereo-scopic images is similar to the oblique eVect for contrastdeWned stimuli. It is known that, for narrowband stimuli,oblique orientations are seen worse than horizontal or ver-tical orientations, both in terms of contrast thresholds andthe amount of salience for high contrast stimuli. A diVerentpattern of results exists for broadband stimuli, however,which show a standard oblique eVect for contrast thresh-old, but an inverse eVect at supra-threshold, in that obliqueorientations have greater salience than cardinal orienta-tions when matched for contrast. These results wereexplained on the basis of normalization models for broad-band stimuli (Essock et al., 2003; Hansen & Essock, 2004).Although such an explanation might be proposed toaccount for the current data, it should be noted that thespatial variations in binocular disparity or motion of thestimuli used in the current experiment were not broad intheir spatial frequency bandwidth.
These results might also be related to the phenomenonof contrast overconstancy (Georgeson, 1991; Georgeson &Sullivan, 1975). In parafoveal vision, the apparent contrastof high spatial frequency gratings is greater than that oflower spatial frequencies, even though threshold sensitivityto these frequencies is lower. This eVect was accounted forby Georgeson (1991) in terms of both a greater compres-sion in the response to high spatial frequencies and a nor-malization stage, and may be thought of as a compensationfor lower sensitivity for these stimuli.
It is also possible that the results might be explained onthe basis of the spatial summation that occurs in the pro-cessing of disparity and motion. The solution of the binocu-lar correspondence problem, for example, is thought to besolved by the application of a cross-correlation between theleft and right eyes’ views (Banks, Gepshtein, & Landy,2004). Since this correlation is performed over an extendedarea of the image, it will act to smooth variations in
M.F. Bradshaw et al. / Vision Research 46 (2006) 2636–2644 2643
disparity within the window, thus reducing the magnitudeof the disparities detected and therefore the perceiveddepth. The amount of smoothing will depend on the size ofthe window. Tyler and Kontsevich (2001) showed that spa-tial summation occurs over a greater region for the detec-tion of horizontally oriented stimuli than for verticallyoriented stimuli. This, they argued, might relate to the sta-tistical properties of natural images. Since disparity infor-mation is expected to covary with luminance informationto some degree, variations in disparity will be accompaniedby variations in luminance. While vertically oriented lumi-nance variations might play a role in the detection of verti-cal disparity edges, this would not be possible forhorizontally oriented edges, which cannot convey informa-tion about binocular disparity in the same way. Tyler andKontsevich (2001) proposed that the increased spatial sum-mation that they observed could act to compensate for thislimitation. This extended spatial summation might accountfor the increased sensitivity to horizontal stimuli for ran-dom dot stimuli such as those used here, where there is nocovariation between luminance and disparity information,and therefore no diVerence in the information provided fordiVerent orientations of stimuli.
This diVerence in the shape and size of the summationwindow for diVerent orientations of surface modulationwould not however predict any diVerence in the amount ofdepth seen. Since for horizontal modulation a summationwindow is proposed that is elongated in a direction parallelto contours of constant depth, no increase in spatial averag-ing, and consequent reduction in perceived depth, is pre-dicted. On the basis of the data presented in the currentstudy, one might expect a summation window for motionparallax that decreases in its extent in a direction orthogo-nal to contours of constant depth as the orientation of suchcontours varies from horizontal to vertical. For binoculardisparity, the summation window would have its minimumextent in this direction for oblique orientations. This isinconsistent with the prediction of Tyler and Kontesvich.However, it should be borne in mind that the underlyingWlters may have diVerent optimal parameters at thresholdand supra-threshold depth magnitudes. As the local varia-tion in depth or motion increases (i.e., as depth magnitude,or the spatial frequency of depth corrugations increases),the area over which spatial summation occurs shoulddecrease (Kanade & Okutomi, 1994; Langley, 2005). Simi-larly, it is also possible that the optimal orientation and fre-quency tuning of the Wlters (Hibbard & Langley, 1998) maybe aVected by such changes in the stimuli. It is therefore notnecessary for the results for the supra-threshold task to bedirectly predictable from the results for the threshold task.
One potentially useful way to describe the supra-thresh-old data for stereoscopic stimuli is that the amount of per-ceived depth is a weighted sum of the amount of sheardisparity (vertical gradients of horizontal disparity) andexpansion–compression disparity (horizontal gradients ofhorizontal disparity). The pattern of results observed iswhat would be predicted if the weight given to shear dispar-
ity was greater than the weight given to expansion–com-pression disparity. The results for motion parallax deWnedstimuli would then be what would be predicted if expan-sion–compression, rather than shear, were the more domi-nant component.
Other diVerences in the results for the two types of stim-ulus suggest that processing of motion information occursover a relatively coarse spatial scale. This is evident Wrst inthe threshold data for the motion deWned stimuli. Both theorientation anisotropy and the increase in thresholds withlower spatial frequencies are only clearly evident for thelowest modulation frequency tested, a frequency that wasnot tested for stimuli deWned by binocular disparity. Thisshift of the trends observed for motion stimuli is also evi-dent in the supra-threshold data, where the only hint of aninverse oblique eVect again occurs only for the lowest fre-quency tested. The results for disparity and motion demon-strate the same trends, but these occur at diVerent spatialscales, although it should be noted that the same pattern ofresults was observed for supra-threshold disparity stimuliat both low and high spatial frequencies.
Why this shift in the spatial scale of processing mightoccur is not clear, although one possibility is the diVerencein the information provided by the two cues. Horizontalhead movements were used to make the information avail-able from disparity and motion as similar as possible, how-ever one diVerence between the two cues is that the velocityof an individual dot for motion parallax stimuli will varyover time. If this information were to be used, then integra-tion over an extended period of time (and therefore a hori-zontally extended region of space) would be necessary,which may account for the coarser spatial scale of process-ing found for motion parallax stimuli.
It is important to consider the implications of suchdiVerences between the processing of depth deWned by thetwo cues for models of depth cue combination. Simpleweighted averaging of depth speciWed by stereo and motionhas been observed in some studies (Rogers & Collett, 1989;Tittle & Braunstein, 1993). The implications of the diVer-ences found in the current study for such averaging areminimal, since they are restricted to diVerences in sensitivityto the two cues, or to the amount of perceived depth. Thiswould be expected to inXuence the relative weights attrib-uted to the two cues, and the individual estimates that areto be averaged, and would therefore be expected to inXu-ence the amount of depth perceived from a combined-cuestimulus, but not the perceived relief structure of the sur-face.
In summary, this paper provides a comprehensive set ofdata on the eVects of orientation and modulation frequencyon the perception of depth from binocular disparity andmotion parallax. At threshold, results from both domainssuggest that for low frequency modulations, thresholdsincrease as surface orientation approaches vertical. Peaksensitivity for disparity deWned surfaces occurs around0.4 cycles/degree whereas for vertical corrugations deWnedby parallax peak sensitivity occurred at the highest
2644 M.F. Bradshaw et al. / Vision Research 46 (2006) 2636–2644
frequency tested. In the supra-threshold task, resultsshowed that for disparity deWned surfaces, maximum depthwas perceived for oblique corrugations, whereas for paral-lax deWned surfaces maximum depth was perceived for ver-tical corrugations. These functions were manifest at allmodulation frequencies tested.
Acknowledgments
The data reported here are contained in A. Parton (2000,University of Surrey, Unpublished Ph.D. Thesis) and wasreported in preliminary form at ECVP (Parton, Bradshaw,Rogers, & Davies, 1996).
References
Allison, R. S., Rogers, B. J., & Bradshaw, M. F. (1978). Geometric andinduced eVects in binocular stereopsis and motion parallax. VisionResearch, 43, 1879–1893.
Anstis, D. M., Howard, I. P., & Rogers, B. J. (1978). A Craik–Cornsweetillusion for visual depth. Vision Research, 18, 213–217.
Banks, M. S., Gepshtein, S., & Landy, M. L. (2004). Why is spatial stereo-resolution so low? Journal of Neuroscience, 24, 2077–2089.
Bradshaw, M. F., & Rogers, B. J. (1996). The combination of stereo andmotion information. Vision Research, 36, 3457–3468.
Bradshaw, M. F., & Rogers, B. J. (1999). Sensitivity to horizontal and verti-cal corrugations deWned by binocular disparity. Vision Research,39(18), 3049–3056.
Bradshaw, M. F., Hibbard, P. B., & Gillam, B. (2002). Perceptual latenciesto discriminate surface orientation in stereopsis. Perception and Psy-chophysics, 62, 32–40.
Cornilleau-Peres, V., & Droulez, F. (1993). Stereo-motion cooperation andthe use of motion disparity I the perception of 3-D structure. Percep-tion and Psychophysics, 54, 223–239.
De Vries, S. C., & Werkhoven, P. (1995). Cross-modal slant and curvaturematching of stereo- and motion-induced surfaces. Perception and Psy-chophysics, 57, 1175–1186.
Essock, E. A., DeFord, J. K., Hansen, B. C., & Sinai, M. J. (2003). Obliquestimuli are seen best (not worst!) broad-band stimuli: A horizontaleVect. Vision Research, 43, 1329–1335.
Finney, D. J. (1971). Probit analysis. London: Cambridge University Press.Georgeson, M. A. (1991). Contrast overconstancy. Journal of the Optical
Society of America A, 8, 579–586.Georgeson, M. A., & Sullivan, G. D. (1975). Contrast overconstancy:
Deblurring in human vision by spatial frequency channels. Journal ofPhysiology (London), 252, 627–656.
Hansen, B. C., & Essock, E. A. (2004). A horizontal bias in human visualprocessing of orientation and its correspondence to the structural com-ponents of natural scenes. Journal of Vision, 4, 1044–1060.
Hibbard, P. B., Bradshaw, M. F., Langley, K., & Rogers, B. J. (2002). Thestereoscopic anisotropy—individual diVerences and underlying mecha-
nisms. Journal of Experimental Psychology. Human Perception and Per-formance, 28, 469–476.
Hibbard, P. B., & Langley, K. (1998). Plaid slant and inclination thresholdscan be predicted from components. Vision Research, 38, 1073–1084.
Hogervorst, M. A., Bradshaw, M. F., & Eagle, R. A. (2000). Spatial fre-quency tuning for 3-D corrugations from motion parallax. VisionResearch, 40, 2149–2158.
Kanade, T., & Okutomi, M. (1994). A stereo matching algorithm with anadaptive window—theory and experiment. IEEE Transactions on Pat-tern Analysis and Machine Intelligence, 16, 920–932.
Langley, K. (2005). Temporal adaptability and the inverse relationship tosensitivity: A parameter identiWcation model. Spatial Vision, 18,461–481.
Mitchison, G. J., & McKee, S. P. (1990). Mechanisms underlying theanisotropy of stereoscopic tilt perception. Vision Research, 30, 1781–1791.
Nakayama, K., Silverman, G. H., MacLeod, D. I. A., & Mulligan, J. (1985).Sensitivity to shearing and compressive motion in random dots. Per-ception, 14, 225–238.
Nawrot, M., & Blake, R. (1991). The interplay between stereopsis andstructure from motion. Perception and Psychophysics, 49, 230–244.
Parton, A. D., Bradshaw, M. F., Rogers, B. J., & Davies, I. R. L. (1996). TheeVect of surface orientation on the perception of stereoscopic corruga-tions. Perception, 25, 67.
Regan, M. P., Hong, X. H., & Regan, D. (2000). An inverted oblique eVectfor cyclopean gratings. Investigative Ophthalmology and Visual Science,41, S948.
Rogers, B. J., & Collett, T. S. (1989). The appearance of surfaces speciWedby motion parallax and binocular disparity. Quarterly Journal ofExperimental Psychology, 41A, 697–717.
Rogers, B. J., & Graham, M. E. (1979). Motion parallax as an independentcue for depth perception. Perception, 8, 125–134.
Rogers, B. J., & Graham, M. E. (1982). Similarities between motion paral-lax and stereopsis in human depth perception. Vision Research, 22,216–270.
Rogers, B. J., & Graham, M. E. (1983). Anisotropies in the perception ofthree-dimensional surfaces. Science, 221, 1409–1411.
Rogers, B. J., & Graham, M. E. (1984). AftereVects from motion parallaxand stereoscopic depth. In L. Spillmann & B. R. Wooten (Eds.), Sen-sory experience adaptation and perception (pp. 603–619). New York:Erlbaum.
Tittle, J. S., & Braunstein, M. L. (1993). Recovery of 3-D shape from binoc-ular disparity and structure from motion. Perception and Psychophys-ics, 54, 157–169.
Tyler, C. W. (1974). Depth perception in disparity gratings. Nature, 251,140–142.
Tyler, C. W. (1983). Sensory processing of binocular disparity. In M. C.Schor & K. J. CiuVreda (Eds.), Vergence eye movements: Basic and clin-ical aspects (pp. 199–296). Boston: Buttorworth.
Tyler, C. W., & Kontsevich, L. L. (2001). Stereoprocessing of cyclopeandepth images: Horizontally elongated summation Welds. VisionResearch, 41, 2235–2243.
Wallach, H., & Bacon, J. (1976). Two forms of retinal disparity. Perceptionand Psychophysics, 19, 375–382.
Related Documents