Surface melting of nanoscopic epitaxial films P. M€ uller * , R. Kern Centre de Recherche sur les M ecanismes de la Croissance Cristalline(Associ e aux Universit es Aix-Marseille II et III.), Campus de Luminy, case 913, Marseille Cedex 9 F-13288, France Received 22 October 2002; accepted for publication 12 December 2002 Abstract By introducing finite size surface and interfacial excess quantities, interactions between interfaces are shown to modify the usual surface premelting phenomenon. It is the case of surface melting of a thin solid film s deposited on a planar solid substrate S. More precisely to the usual wetting condition of the solid s by its own melt l, necessary for premelting (wetting factor U < 0), is adjoined a new quantity C describing the interactions of the l/s interface with the s/ S interface. When C > 0 this interface attraction boosts the premelting so that a two stage boosted surface premelting is foreseen: a continuous premelting, up to roughly half the deposited film, is followed by an abrupt first order premelting. When C < 0 these interfaces repell each other so that premelting is refrained and the film remains partly solid above the bulk melting point (overheating) what is called astride melting. Elastic stress modifies both types of melting curves. Bulk and surface stresses have to be distinguished. For coherent epitaxial layers the natural misfit determining the strain and the elastic energy density (independent of the thickness of the solid) only shifts the melting curves to lower temperature, up to thicknesses where strain relief happens. Surface stress, as a finite size surface excess quantity, modifies the wetting factor U and the coefficient C, therefore the wetting properties and thus the melting curves are slightly modified. For perfect glissile epitaxies things are more complex since bulk strain and elastic energy density (now induced by surface stress) varies with the film thickness. The melting curves are thus distorted on their initial part (either in the sense of assisted or refrained premelting) de- pending upon the set of interfacial stresses. Lastly there is a z-inhomogeneity of stress due to the interactions between the bulk of the various material layers. This leads to measurable strain gradients in the film but only distorts the final part of the melting curve. Some of these theoretical results have been experimentally illustrated in the C < 0 case where then useful interfacial data, adhesion energies and interfacial stress data have been collected but the C > 0 case remains fully open to future exploration. Ó 2003 Elsevier Science B.V. All rights reserved. Keywords: Surface energy; Surface melting; Wetting; Surface stress; Epitaxy; Interface states 1. Introduction It is now well-known that when a solid surface is wetted by its own melt, in equilibrium condi- tions, a liquid phase may cover this surface at a temperature below its bulk melting point T m . As * Corresponding author. Tel.: +33-4-91172800; fax: +33-4- 91418916. E-mail address: [email protected] (P. M€ uller). 0039-6028/03/$ - see front matter Ó 2003 Elsevier Science B.V. All rights reserved. doi:10.1016/S0039-6028(03)00055-4 Surface Science 529 (2003) 59–94 www.elsevier.com/locate/susc

Welcome message from author
This document is posted to help you gain knowledge. Please leave a comment to let me know what you think about it! Share it to your friends and learn new things together.
Transcript

Surface melting of nanoscopic epitaxial films
P. M€uuller *, R. Kern
Centre de Recherche sur les M�eecanismes de la Croissance Cristalline(Associ�ee aux Universit�ees Aix-Marseille II et III.),
Campus de Luminy, case 913, Marseille Cedex 9 F-13288, France
Received 22 October 2002; accepted for publication 12 December 2002
Abstract
By introducing finite size surface and interfacial excess quantities, interactions between interfaces are shown to
modify the usual surface premelting phenomenon. It is the case of surface melting of a thin solid film s deposited on a
planar solid substrate S. More precisely to the usual wetting condition of the solid s by its own melt l, necessary for
premelting (wetting factor U < 0), is adjoined a new quantity C describing the interactions of the l/s interface with the s/
S interface. When C > 0 this interface attraction boosts the premelting so that a two stage boosted surface premelting is
foreseen: a continuous premelting, up to roughly half the deposited film, is followed by an abrupt first order premelting.
When C < 0 these interfaces repell each other so that premelting is refrained and the film remains partly solid above the
bulk melting point (overheating) what is called astride melting. Elastic stress modifies both types of melting curves. Bulk
and surface stresses have to be distinguished.
For coherent epitaxial layers the natural misfit determining the strain and the elastic energy density (independent of
the thickness of the solid) only shifts the melting curves to lower temperature, up to thicknesses where strain relief
happens. Surface stress, as a finite size surface excess quantity, modifies the wetting factor U and the coefficient C,
therefore the wetting properties and thus the melting curves are slightly modified. For perfect glissile epitaxies things are
more complex since bulk strain and elastic energy density (now induced by surface stress) varies with the film thickness.
The melting curves are thus distorted on their initial part (either in the sense of assisted or refrained premelting) de-
pending upon the set of interfacial stresses.
Lastly there is a z-inhomogeneity of stress due to the interactions between the bulk of the various material layers.
This leads to measurable strain gradients in the film but only distorts the final part of the melting curve.
Some of these theoretical results have been experimentally illustrated in the C < 0 case where then useful interfacial
data, adhesion energies and interfacial stress data have been collected but the C > 0 case remains fully open to future
exploration.
� 2003 Elsevier Science B.V. All rights reserved.
Keywords: Surface energy; Surface melting; Wetting; Surface stress; Epitaxy; Interface states
1. Introduction
It is now well-known that when a solid surface
is wetted by its own melt, in equilibrium condi-
tions, a liquid phase may cover this surface at a
temperature below its bulk melting point Tm. As
* Corresponding author. Tel.: +33-4-91172800; fax: +33-4-
91418916.
E-mail address: [email protected] (P. M€uuller).
0039-6028/03/$ - see front matter � 2003 Elsevier Science B.V. All rights reserved.
doi:10.1016/S0039-6028(03)00055-4
Surface Science 529 (2003) 59–94
www.elsevier.com/locate/susc
the increasing temperature of the solid approaches
Tm from below the thickness of the liquid film in-
creases continuously and diverges asymptotically
at T ¼ Tm. Such a phenomenon has been called
surface premelting or surface induced melting and
has been thoroughly studied both from an experi-mental and a theoretical view-point (for reviews
see [1–4]). The reverse phenomenon, the formation
of crystalline layers on the surface of its liquid
above the melting temperature Tm, has also been
reported [5,6]. The generic term of surface induced
freezing has thus been proposed to describe a
continuous transition in which a more-ordered
surface phase grows on a less-ordered bulk phase.In Fig. 1 are shown schematically the two cases of
surface melting (Fig. 1a) and surface freezing (Fig.
1b).
Concerning surface melting, most of the studies
concern the surface premelting of semi-infinite
solids [7,8] and interesting peculiarities have been
discovered: (i) two successive asymptotic laws for
approaching Tm [9–11]; (ii) incomplete premelting(at T < Tm premelting stops its progression up to
Tm where the usual first order melting takes place).
(iii) incomplete wetting and premelting (at Tw <Tm some wetting layers suddenly appear. Their
thickness then asymptotically increases towards
Tm). Both phenomena (ii) and (iii) received their
theoretical framework by the concept of surface-
induced layering in liquids [12,13] opposing tosurface-induced disordering leading to the usual
type of premelting. Distinction between surface
melting and surface roughening has been clearly
done by [14].
Only a few papers concern the case of finite size
solids. Due to the finite size some new effects should
be expected and are discussed in this paper. It is thecase of the surface induced melting of nanometric
solid particles for which furthermore the melting
temperature of the bulk depends upon the size of
the particle. In this case the number of liquid
layers increases continuously with temperature
until the core of the particle melts suddenly at its
curvature-dependent melting point [15–17]. Finite
size effects of the solid phase can also be put inevidence in the case of thin films. Bienfait, Dash
and their collaborators [18–23] have studied by
various methods the surface premelting of depos-
ited adsorbed simple gases forming thin solid films
with some strain. They speak of strain assisted
premelting and infer that substrate interaction
may retain solid layers near to the substrate in-
terface. A model of melting of several solid layershas been proposed by Petterson et al. [24] and then
by [23] trying to formalise the various observed
effects. Lastly Sakai [25] recently showed theoret-
ically that a free thin slab may exhibit a two stage
melting transition. In a first stage the equilibrium
thickness of the premelted liquid continuously in-
creases with temperature, then below some critical
temperature Tc < Tm and thickness dc < d of thesolid the slab melts completely (first order transi-
tion). The transition temperature of the second
stage was associated with the thickness of the slab.
The aim of this paper is to revisit the surface
premelting of epitaxially deposited films. More
precisely we want to elucidate both the size effect
and the strain effect when the epitaxial layers are
pseudomorphous (or not) to their substrate S (seeFig. 2a). For this purpose in Section 2 we define
our model with special care on the necessary as-
sumptions. Let us underline that surface freezing
(Fig. 2b) can be simply obtained from surface
melting (Fig. 2a) by interchanging the liquid l and
solid s. Therefore, all the following results on
surface melting remain valid for surface freezing
by interchanging in the formulae and diagrams theindices s and l and changing the latent melting
entropy DSm in DSfreez ¼ �DSm the latent freezing
Fig. 1. Schematic drawing of surface induced melting (a) of a
semi-infinite solid s and (b) of the surface induced freezing of
the semi-infinite liquid l. The conditions are given in terms
of temperature T in respect to the melting temperature Tm, of
surface energy ci and adhesion energy bij so that in (a) the liquid
wets the solid s or the reverse s wets the liquid l in (b).
60 P. M€uuller, R. Kern / Surface Science 529 (2003) 59–94

entropy. However we do not concentrate on sur-
face freezing which concerns in fact relatively ex-
otic material as liquid crystals [5,6]. In Section 3
we write the free enthalpy of such a system (Fig.
2a), then in Section 3.1 we seek for equilibrium
and stability conditions, Section 3.2 leading to two
different new surface melting regimes. In case of
coherent epitaxies, both regimes are identically
scaled in temperature by the strain energy. The
two regimes are
i(i) continuous partial premelting relayed by dis-
continuous first order melting (boosted pre-
melting),(ii) continuous premelting relayed by continuous
overheating (astride melting).
In both cases the usual wetting condition of the
solid s by its melt l is fulfilled but a new parameter
determines whether the l/s interface is attracted (i)
or repelled by the substrate S in what case (ii) the
last solid layers resist to melting. For thick solidfilms the two melting regimes go over to the usual
asymptotic surface melting.
In Section 4 we discuss the two regimes nu-
merically, look at their possible occurrence in
Section 4.2, propose some possible experiments to
measure independently adhesion energies and treat
an example of well studied astride surface melting
in Section 4.4. In Section 5 we introduce the notion
of surface stress, we neglected in Section 3, and
show that its consideration may be a valid cor-
rection for coherent epitaxies. Its contribution ishowever crucial in the case of incoherent glissile
epitaxy we treat in Section 6 where an experi-
mental example is given. In Section 7 we consider
how the epitaxial layer becomes inhomogeneously
strained by the substrate field and discuss how it
acts on the foregoing effects. Finally in Section 8
we conclude and give an outlook about what
would be of interest to investigate by experimentsin view of our predictions.
2. Model of surface-induced melting of pseudomor-
phous films
For that purpose we consider a semi-infinite
planar substrate S of material B supposed to bechemically inert in respect to the deposit A. The
melting point of S ðTsÞ is much higher that the
melting point Tm of A so that experiments can be
done around Tm without alteration of B and A.
Material A is either elemental or a defined
compound with congruent melting so that the
solid s has the same composition as its liquid l and
has a defined melting point Tm.Substrate S of material B bears a lattice-
mismatched composite material A (s + l) of ns solid
layers and nl liquid layers (Fig. 2a). The ns layers
are in pseudomorphous contact and epitaxially
stressed by S whereas its nl upper layers A are in
the liquid state. For the sake of simplicity, mate-
rials A and B are supposed to be cubic of respec-
tive parameters a and b. Their surfaces (0 0 1) arein contact with parallel orientation of the in-plane
axis a and b. The in-plane natural misfit therefore
is m ¼ ðb� aÞ=a. 1
Fig. 2. Schematic drawing of surface induced melting in (a) of a
solid thin film s supported by a thick substrate S. Similar case of
surface induced freezing in (b) of a thin liquid film l supported
by S. In the first line are given wetting conditions of l/s (or (s/l)
as in Fig. 1. In the second line are written the stability condi-
tions for having a uniform film, s/S when preparing these films.
When the deposits s is molten this second relation reads
2cl � bls < 0.
1 Epitaxy is however not limited to the regular overgrowth of
cubic species with parallel axis. Its realm is much more rich and
its crystallographic rules less degenerated: two species whatever
their chemical nature and symmetries may gather two lattice
planes and in theses planes one or two pairs of lattice rows. See
for a review [26].
P. M€uuller, R. Kern / Surface Science 529 (2003) 59–94 61

In the case of this coherent epitaxy we study
in the following sections, the solid s is homo-
geneously in-plane strained by the amount
exx ¼ eyy ¼ m with m ¼ ðb� aÞ=a the natural misfit
of the contact which becomes equal to the in-plane
strain when A(0 0 1) is rendered coherent withB(0 0 1). In Section 7 inhomogeneous strained
layers are considered. Partial strain relaxation or
loss of coherence is only considered as event ap-
pearing at some greater thickness disrupting the
process we describe. The case of non-coherent but
glissile epitaxies is considered in Section 6.
The (0 0 1) bare surface of A and B as well as the
various interfaces are supposed to be morpholog-ically stable. They do not suffer facetting. There-
fore these surfaces and interfaces have in their own
orientation an inward cusp in their c-plot. These
faces are usually so-called F or singular faces. In
summary the system, even when strained, remains
planar at microscopic and mesoscopic scale during
a raise of temperature up to Tm.
The last but essential point is that our model ofsurface melting uses the notion of finite size sur-
face and interfacial specific energies. It is known
that Landau�s theory of phase transitions has
predicted surface-melting [27,28] in very general
terms of order parameter. However relations of
quantitative interest could only be obtained by
adjoining models. A two parabola model [8] leads
to temperature dependent order parameter profilesand finally to an explicit minimal surface free en-
ergy. Pluis et al. [8] could identify the model pa-
rameters so that the surface free energy of the
system becomes thickness dependent. Two terms
describe the creation of the film l of thickness hon the dry surface of s: the positive bulk melting
free energy proportional to h vanishing at T ¼ Tm
and the surface energy change of wetting Dc�expð�2h=fÞ with Dc ¼ cs � cl � csl > 0 where f is a
correlation length in the liquid but otherwise non-
precised. When Dc > 0, not only the melt wets its
solid but both free energies oppose so that some
equilibrium thickness heq is installed. One can
speak also [8] in terms of thermodynamic forces or
effective forces opposing each other. This effective
force interpretation can be directly extended tofinite-size liquids and finite-size solids as in Fig. 2
so that now appear forces between the interfaces
l=s � l=v; l=v � s=S and l=s � s=S. In Appendix C
this is done in details for some planar systems. Let
us remark that this effective force interpretation in
surface melting has been introduced in 1968 by
Bolling [29,30] for grain boundary melting and in
1972 for the specific case of surface melting of iceby Lacmann and Stranski [31,32].
3. Free energy of the system
Our purpose being to seek for the equilibrium
number of liquid layers as a function of tempera-
ture, we have to minimise a thermodynamic po-
tential of the composite system constituted of
liquid and solid layers of A sitting on a semi-infi-nite substrate S (see Fig. 2a). We will note this
system l=s=S. Since the ns layers are epitaxially
strained by S, the liquid submitted eventually to
hydrostatic pressure P , we have to use a good
thermodynamic potential. In Appendix A follow-
ing [33] and [34] it is shown that the Gibbs free
energy per unit area of S is pertinent for the solid s
and the liquid l provided correct boundary stress–strain conditions are applied at the surface and
interface. In Appendix B are written the mechan-
ical boundary conditions of the coherent epitaxial
system. Therefore we have to minimise:
G ¼ NsGs þ NlGl þ Gsurf ð1Þ
where Gs is the Gibbs free energy per solid mole
(number of moles Ns per unit area), Gl the Gibbsenergy per liquid mole (number of moles Nl per
unit area) and Gsurf the excess energy due to sur-
face and interfaces. The total number of moles of
material A thus is
N ¼ Ns þ Nl ð2Þ
In (1) Gsurf is the surface excess enthalpy of the
system of Fig. 2a. In spite of its areal constancy it
is size dependent since it is thickness dependent for
nanoscopic thicknesses and then must read Gsurf
ðns; nlÞ where ns and nl are the number of solid and
liquid layers respectively, n being the total number
of layers
n ¼ ns þ nl ð3Þ
62 P. M€uuller, R. Kern / Surface Science 529 (2003) 59–94

Note that the relation between Ni and ni is:
ns ¼ NsðvSÞ2=3 ¼ NsðvsÞð1 þ mÞ2;
nl ¼ NlðvlÞ2=3 ð4Þ
where vI are the atomic volumes of s, l and S and mthe natural misfit as defined in Section 2. Ac-
cording to Appendix A (formula (A.3)) the freeenthalpy of the liquid (supposed to be under zero
hydrostatic pressure P ¼ 0 since its vapour pres-
sure around the melting point is negligible in re-
spect to the epitaxial stress r11 by a factor of 10�5)
reads:
GlðT ; 0Þ ¼ U lðT ; 0Þ � TS lðT ; 0Þ ð5Þ
At the same that one of the coherent solid reads
(see Appendix A, formula (A.2) and Appendix B,
formula (B.1)):
GsðT ; rijÞ ¼ U sðT ; 0Þ � TSsðT ; 0Þ þ V s Em2
1 � mð6Þ
Ui and Si are the molar internal energy and en-
tropy of the solid and the liquid i ¼ s; l at zeropressure, V s the molar volume of the solid at zero
stress, E and m the Young�s modulus and Poisson�sratio of the solid s in the proper orientation (see
footnote of Appendix B). All quantities are defined
at temperature T even the natural misfit m ¼ðb� aÞ=a that may be sensibly temperature de-
pendent via the in-plane differential dilatation of s
and S.We have now to write the surface free energy
contribution Gsurf of (1). For the planar system
(Fig. 2a) we consider, there are three interfaces. As
stated at the end of Section 2, the corresponding
free energies are thickness-dependent for thin film
of l and s (size effect). For illustration let us take a
thin slab of ni layers of body i. When creating such
a slab by extraction from an infinite body of i(bringing both remaining semi-infinite bodies
again together), the two created surfaces of the
slab have a total surface free energy 2ciðniÞ func-
tion of ni. When this slab becomes thick ni ! 1this energy has to tend towards the macroscopic
surface free energy one defines usually by separa-
tion of an infinite body i in two semi-infinite bodies
that is 2cið1Þ. When extracting only a monolayer,the other limiting value of surface energy is 2cið1Þ.
The value cið1Þ is therefore also the work of
binding a monolayer of unit area with all
j ¼ 1; 2; . . ., 1 underlying layers of the semi-infi-
nite body i. In the hypothetical case there are only
first neighbours interactions with these layers, the
binding work of a bilayer would be cið2Þ ¼ cið1Þsince the second layer of the bilayer does not feel
the substrate layers. More generally one has
ciðniÞ ¼ cð1Þ, ð16 ns < 1Þ that means there is
no size effect. However second, third and so on
layers-interactions exist even if small and rapidly
decreasing in condensed matter. A convenient for-
malisation is to write ciðniÞ ¼ cið1Þf ðniÞ with f ðniÞa continuous decreasing function with f ð1Þ ¼ 1and 0 < f ð1Þ < 1. The exponential dependence
f ðniÞ ¼ 1 � e�ni=fi is of that type (with fi a char-
acteristic of phase (i)) and may have some physical
meaning. In Appendix C we justify this analytical
expression and give the free enthalpy per unit
substrate area of the l/s/S system of Fig. 2a as a
function of the number of layers nl and ns.
Gsurfðns; nlÞ ¼ Navo½2cs þ ð2cl � bl=sÞð1 � e�nl=flÞþ ð2cs � bs=SÞð1 � e�ns=fsÞþ ðbl=s � bl=SÞe�ns=fsð1 � e�nl=flÞ ð7Þ
ci and bi=j are the surface and adhesion energies of
i¼ l, s, S or i=j ¼ l=s, l=S, s=S of the macroscopic
phases. fl and fs give a measure of finiteness of the
interactions of the liquid and of the solid, Navo the
Avogadro number.
Let us remark here that according to (1), and(5)–(7) using the Gibbs procedure we divided G in
bulk and surface excess quantities. The surface
excess quantities (7) therefore bear the finite size
effects and not the bulk quantities (5) and (6). It
would be inconsistent to introduce for these bulk
quantities some finite size properties.
Let us stress some limiting remarks: (i) we
should remind that the solid part of the film wasbrought into coincidence with substrate S by uni-
axial e11 ¼ e22 ¼ m deformation but we do not
change the surface energy term (7). Therefore we
have to amend it. For easiness this will be done
only in Section 5 concerning surface stress. (ii) we
should mention too that due to the finiteness of the
film, surface excess (7) implies that there is an ex-
cess potential inside the layers l and s so that they
P. M€uuller, R. Kern / Surface Science 529 (2003) 59–94 63
become elastically inhomogeneous. Again for
easiness we will treat it only in Section 7.
3.1. Equilibrium conditions
The stationary number of liquid layers can beobtained by the condition oG=oNljN ¼ 0 with (1)
and (5)–(7). For essentialness, we use (4) by ne-
glecting the size differences of vs and vl and sup-
pose fs ¼ fl ¼ f, thus oG=oNljN ;T ¼ 0 reads:
DUmðT Þ � TDSmðT Þ �V sEm2
1 � m
þ Navo
b2
f½Ue�nl=f � Ce�ns=f ¼ 0 ð8Þ
where DUm ¼ U l � U s, DSm ¼ Sl � Ss are themelting energy and entropy respectively. The
quantities U and C read:
U ¼ 2cl � bl=s � cl þ cls � cs ð9Þ
C ¼ ð2cs � bs=SÞ þ ðbl=S � bl=sÞ� csS þ cls � clS ð10Þ
where all specific energies are those of the macro-scopic phases with planar surfaces ci, cij or bi=j.
They are slightly temperature dependent as E, V s
are, so that we consider the value they take in
the following near Tm. In (9) and (10) the first
expressions are written in terms of surface and
adhesion energies. The second expressions are
obtained by using Dupr�ee� equation (See (C.3) in
Appendix C) in terms of surface and interfacialenergies. These factors U and C will play an es-
sential role in the further classification of the pre-
dicted phenomena.
Since at the bulk melting point Tm (without
stress) there is DUmðTmÞ ¼ TmDSmðTmÞ, neglecting
the heat capacity change at constant pressure DCm
one has not too far from the melting point the
linear dependence:
DUmðT Þ � TDSmðT Þ DSmðTmÞðTm � T Þ ð11Þ
where DSmðTmÞ is the latent melting entropy at the
melting point Tm which according to Matignon�rule amounts to DSmðTmÞ ¼ 2–3 cal mole�1 deg�1
for most elements. In the following we will note
the latent melting entropy DSm. 2
The equilibrium condition (8) using (11) is
splitted in two parts by defining the melting point
T 0m of the strained film:
T 0m ¼ Tm � Em2
1 � mV s
DSm
ð12Þ
and the reduced melting curve:
T 0m � T ¼ �Navo
DSm
b2
f½Ue�nl=f � Ce�ns=f ð12
0 Þ
Relation (12) implies since DSm > 0 for melting
that an epitaxial coherent strained film melts at a
lower temperature than a strain-free film. There is a
shift of temperature which in the framework ofelasticity theory is proportional to the misfit
square m2. This shift may be important: taking
typical values for semi-conductors and metals,
E ¼ 1011 erg cm�3, m ¼ 1=3, V s ¼ 20 cm3 mole�1
the shift is 3.7, 15, 60 K for misfits of 1%, 2% or
4% respectively. For molecular deposits E ¼ 1010
erg cm�3 these values are ten times smaller.
At this point let us warn about some simplifiedtreatments of the melting of stressed solids. For
calculating (P ; T ) diagrams one uses the very valid
procedure where the melting equilibrium s $ l is
given as a function of T and P the hydrostatic
pressure surrounding both liquid and solid. One
seeks for the solutions of the equation DGðT ; P Þ ¼DUmðT Þ � TDSmðT Þ þ PbV lðT ; PÞ � V sðT ; PÞc ¼ 0
or with the approximation Dcm ¼ 0 (see footnote2) T 0
m ¼ Tm � PbV sðT ; P Þ � V lðT ; P Þc=DSm where
T 0m is the melting point at pressure P , Tm that one at
P ¼ 0. Some authors [36–40] extend this approach
to stressed solids by defining (i) a real hydrostatic
pressure P ¼ P l exerted on the liquid, (ii) a hypo-
thetic ‘‘mean pressure’’ on the solid Ps ¼ �1
3dijrij
where rij is the stress tensor, (iii) they write
2 A better approximation of (11) is when DCm 6¼ 0 but
independent on T . Thus the following quadratic term [35] �DCm
ðT � TmÞ � DCmT l nðT=TmÞ �DCmðTm � T Þ2=2Tm þ O3ðDT Þadds to (11). Since Cg
p < Clp < Cs
p for monoatomic elements one
has at the high temperature limit 5R=2 < Clp < 3R so that
a medium value of DCm is )1/2 cal mole�1 deg�1. Neglecting
this second order term brings for DT=Tm ¼ 0:1 an error of 2%
and for DT=Tm ¼ 0:5 roughly 6%.
64 P. M€uuller, R. Kern / Surface Science 529 (2003) 59–94

DSmT 0m ¼ DSmTm � P
sV pðT ; P sÞ þ P lV lðT ; P lÞ. In
the case the solid film s is epitaxially strained
(Appendix B) by e11 ¼ e22 ¼ m so that appears in s
an in-plane stress r11 ¼ r22 ¼ Em=ð1 � mÞ and a
normal stress r33 ¼ �P l one has when P l ¼ 0 and
Ps ¼ �2Em=3ð1 � mÞ:
T 0m ¼ Tm þ 2
3
E1 � m
mV sðT ; 0Þ
DSm
1
�þ 2m
1 � 2m1 � m
� ��From this result one sees that the second rhs
term is composed of a leading term in m and a m2
correcting term for Poisson effect. The same nu-
merical data as above produce for a compressive
misfit m ¼ �1% a shift of roughly 240 K of the
melting point towards lower temperature instead of
3.7 K with (12). Misfits of )3% would bring layers(as Ge/Si(1 0 0)) to melt at room temperature or for
systems with m > 0 (tensile misfit) to become fire
proof! In [36–39] such values are seriously dis-
cussed for the system InAs/GaAs ðm ¼ �7%Þ and
in [40] for the strain effect in surface melting of Ge/
Si(1 0 0). In fact these predictions are wrong since
the definition of the ‘‘mean pressure’’ in a solid has
no physical meaning. More precisely such a ‘‘meanpressure’’ does not work during the melting process
contrary to what is written in the above-mentioned
point (iii).
Coming back to relation (120) at equilibrium, it
means that some liquid layers can exist below or
above T 0m according to the sign of the second
member of (120) that implies either premelting,
overheating or both.
3.1.1. Melting of semi-infinite solids (Fig. 1a):
‘‘Asymptotic premelting’’
This is the well known usual case performed
without straining the solid so that m ¼ 0 and
ns ! 1 so that T 0m ¼ Tm from (12). From (120) the
number of equilibrium layers as a function of
temperature (or melting curve (mc)) thus reads:
neql
f ln
�� Navob2
DSm
UT 0
m � T
�ð13Þ
Thus the equilibrium number of liquid layers in-
creases asymptotically when T ! Tm ¼ T 0m. This
solution has only sense for U < 0 that means (from
(9)) when the solid surface is wetted by its own melt
or, in terms of effective forces, that interface l/s is
pushed away from the liquid surface. This is a
stable equilibrium since from (8) o2G=oN 2l jT ¼
�Navob2U=f is positive.
From (13) the surface remains dry neql ¼ 0 up to
Ts ¼ Tm � ððNavob2Þ=ðDSmÞÞðjUj=fÞ. In the case of
Pb or Cu, U ¼ �20 erg cm�2, b ¼ 3 � 10�8 cm [8].
When f ¼ 1 there is Tm � Ts ¼ 100 K and the
successive liquid monolayers n install at 100e�n
that means 37 K for one monolayer, 13 K for two
layers and a very close approach to Tm (4� 10�3
K) for 10 monolayers. Shifting Tm to T 0m by
straining the solid s, see (12), may be a useful tool.Coherent epitaxy of s on a substrate S may be the
most convenient practical solution but requires
thin stable films where new proximity effects occur,
which we approach in Section 3.2.
3.1.2. Variant: one side interfacial premelting
For several experimental reasons it may be de-sirable to put on the surface of the thick solid s a
cover glass (cg). Optical thickness measurements
of premelted layers have been done by this means
[9,41,42]. Since the interfaces are different the
surface free enthalpy (7) has to be changed. In
Appendix C we derive formula (C.10) which gives
this new function of nl for a thick coverglass.
Operating as in Section 3.1 instead of (13) oneobtains the melting curve (mc):
neql =fl ¼ ln
�� Navob2
DSm
U � ðbl=cg � bs=cgÞT 0
m � T
�ð13
0 Þ
that means the wetting factor U is changed by the
adhesion properties of the coverglass.� In the case U < 0 and when the liquid layer l
adheres more on the coverglass that does the solid
s, that means bl=cg > bs=cg the number of equilib-
rium premelted layers neql according to (130) in-
creases compared to the free liquid surface (13). In
the glass covered surface melting studies of
diphenyl [9] and ice [41] high number of liquid
layers have been detected.� In the case of U > 0 where the solid is
not wetted by its liquid, provided bl=cg � bs=cg > Upremelting takes place and the stability criterion
o2G=oN 2l jT > 0 is satisfied. Here owing to the
presence of the coverglass the liquid l has been
P. M€uuller, R. Kern / Surface Science 529 (2003) 59–94 65

‘‘forced to wett’’ its own solid. Let us remark that
such forced wetting extends interestingly the realm
where surface melting can be studied by changing
the nature of the cover glass. In [42] the coverglass
has been grinded and its wettability has also been
changed by surfactants.This premelting is in fact an interfacial pre-
melting in between two condensed phases but since
the atoms of the coverglass do not participate di-
rectly in the melting process one should qualify it
as one-sided. Grain boundary melting is an inter-
facial melting where both sides participate in the
melting process.
3.2. Melting of a finite size solid (Fig. 2a)
The full expression (8) in which the term in Cbecomes thus important the solid film is thin is
now required to obtain the number of equilibrium
layers. By continuity we leave U < 0 but consider
the two cases C > 0 and C < 0.
U < 0 as said in Section 3.1.1 represents an ef-fective repulsion force of the liquid surface upon
the interface l/s. Now C represents the interaction
of l/s with the interface s/S where S is the epitaxial
substrate. According to the definition (10) C < 0
may be written cl þ cls þ csS < cl þ clS what means
that the l/s/S system is preferred to the l/S one.
Therefore if U < 0 and C < 0 the interface l/s is
pushed away from both the liquid surface and thesubstrate S. These two forces thus may balance
each other. In the case U < 0 and C > 0 the two
effective forces act in the same sense so that there is
no balance and the l/s interface must be attracted
to the substrate S. Clearly at each temperature Tthe third effective force of melting adds to the
former ones. We will see that the case U < 0 and
C < 0 leads to a continuous increase of the numberof liquid layers with temperature whereas in the
case U < 0 and C > 0 some instability from con-
tinuous to discontinuous behaviour occurs.
Consider the second derivative of G in respect
to Nl at constant T and N :
o2G=oN 2l jT ;N ¼�Navob2
f2½Ue�nl=f þCe�n=fenl=f ð14Þ
There follows the two new premelting cases we
analyse more clearly in Sections 3.2.1 and 3.2.2.
3.2.1. U < 0 and C < 0: the surface induced con-
tinuous premelting and superheating:‘‘astride melt-
ing’’
From (14) there is o2G=oN 2l jT ;N > 0 for all val-
ues of nl, so that in all the domain 0 < nl < n, thereis continuous stable melting from the dry point Ts
to Tl the temperature where the last solid layer
melted. From relation (120) there is with nl ¼ 0,
ns ¼ n:
Ts ¼ T 0m þ Navo
DSm
b2
f½U � Ce�n=f
T 0m � Navo
DSm
b2
fjUj ð15Þ
the approximation being secured for a thick en-
ough film for which thus Ts does not depend uponC but only upon the wetting U.
At the same, from relation (120) with now
ns ¼ 0, nl ¼ n there is:
Tl ¼ T 0m þ Navo
DSm
b2
f½Ue�n=f � C
T 0m þ Navo
DSm
b2
fjCj ð16Þ
Thus for a thick enough film Tl only depends upon
C.From (15) and (16) there is Ts < Tm < Tl. The
domain of continuous melting thus has to be called
premelting when T < T 0m or overheating when
T > T 0m. (This situation remains for non-strained
layers, m ¼ 0, where then Tm ¼ T 0m according to
(12).)
This continuous melting at astride T 0m is ex-
plicitly calculated by solving the quadratic equa-tion obtained from (120) and (3):
Ue�2nl=f þ DSmfNavob2
ðT 0m � T Þe�nl=f � Ce�n=f ¼ 0 ð17Þ
At T ¼ T 0m from above there is
nljT¼T 0m¼ n
2� f
2ln
CU
� �and
dnl=dT jT¼T 0m¼ DSmf2
Navob2
expðn=2fÞ2ffiffiffiffiffiffiffiUC
p ð170 Þ
This inflexion point is close to half the number oftotal layers n and its positive slope increases
exponentially with the total number of layers. In
66 P. M€uuller, R. Kern / Surface Science 529 (2003) 59–94

Fig. 3 this melting curve of continuous astride
melting is schematically drawn.
3.2.2. U < 0 and C > 0: the surface induced two
stage premelting: ‘‘boosted premelting’’
In this case, it can be seen from (14) that
o2G=oN 2l jT ;N may have positive or negative values
and that o2G=oN 2l jT ;N ¼ 0 for:
n�l ¼n2� f
2ln
CjUj
� �where dnl=dT jn�
l¼ 1
ð18ÞThis singular value of nl can be smaller or greater
than n=2 according to the value of C=jUj. More
precisely n�l < nl (resp. n�l > nl) for C=jUj > e�n=f
(resp. C=jUj < e�n=f).
� For 0 < nl < n�l , Eq. (17) has two solutions.
A stable one nstablel < n�l where o2G=oN 2
l jT ;N > 0
and an unstable one nunst:l P n�l where there is o2G=
oN 2l jT ;N 6 0. In Fig. 6 (left to T 0
m) the two branches,
the stable and the unstable one (dotted) are re-
ported. They continuously meet close at nstablel ¼
nunst: ¼ n�l that means at the temperature
T � ¼ T 0m � Navob2
DSmf2ffiffiffiffiffiffiffiffiffiffijUCj
pe�n=2f ð19Þ
obtained by injecting (18) in (120) and (3).
Since at this point o2G=oN 2l jT ;N ¼ 0 any further
increase of temperature produces an irreversible
first order melting at T � < T 0m as given in Fig. 3 by
the heavy curve. Therefore when U < 0, C > 0
there is a two stage premelting. The first stage
roughly concerns half the film which continuously
melts. The second half corresponds to a first order
melting at T � < T 0m, T � being given by (19).
� For n�l > n, the unstable solution nunst:l P
n�l > n obviously has no more meaning and there is
only a stable one according to (17) correspondingthus to a continuous premelting from Ts given by
(15) to Tl given by (16). Such a case could be en-
countered for systems with vanishing C. In this case
the solution of the Eq. (120) is nothing else than
(13). The number of equilibrium liquid layers thus
is the same that for semi-infinite solids but obvi-
ously limited to neql ¼ n. Thus for C ¼ 0 the curve
neql ðT Þ fits the curve obtained for semi-infinite sol-
ids but is truncated at neql ¼ n (see the middle curve
in Fig. 3a and the arrow at nl ¼ n). As a conse-
quence, the ns solid layers become all liquid for
Tl ¼ T 0m� ððNavob2Þ=ðDSmfÞÞjUje�n=f < T 0
m whereas
for a semi-infinite solid all the solid layers only melt
at T ¼ T 0m.
4. Discussion
4.1. Premelting–overheating
The energetic interaction of the l/s interface
located in between the interfaces v/l and s/S (see
Fig. 4) is characterised by U and C. The effective
forces on l/s read from (7)
fls ¼ � oGsurf
onl
����ns
!¼ � U
fl
e�nl=fl
�� C
fs
e�ns=fs
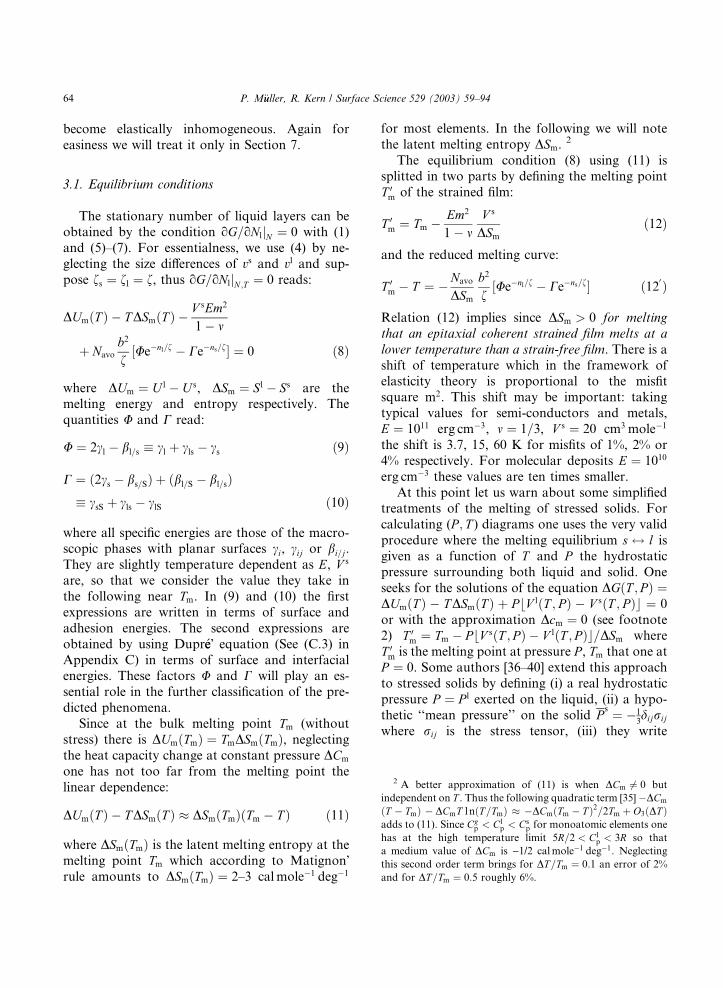
�In Fig. 4a where U < 0 and C < 0 they oppose
each other, in Fig. 4b they work in synergy. Two
melting regimes depicted in Fig. 3 result.
When the forces oppose (U < 0 and C < 0)premelting starts at Ts < T 0
m (15) but slows down
nl
n
nl*
Ts T’mT* T
n = ∞
Γ>0
Γ<0Γ=0
Fig. 3. Stable premelting curves of system Fig. 2a with nl the
number of liquid layers versus T . T 0m the bulk melting point of
the coherent stressed solid. Four cases with the same wetting
parameter U < 0. (1) Premelting of a thick solid (ns ¼ 1)
reaching asymptotically T 0m. (2) Thin solid of n layers. C ¼ 0:
same premelting curve as (1) but ending in nl ¼ n. (3) Case
C < 0 n-finite, melting astride T 0m with its overheating zone
T > T 0m (4) C > 0, n-finite, premelting going over continuously
at T � < T 0m, nl n=2 in first order premelting. All curves have a
common leading edge e�nl=f at T < T 0m.
P. M€uuller, R. Kern / Surface Science 529 (2003) 59–94 67
when progressing in temperature (in respect with
curve 1 in Fig. 3 where n ! 1 drawn for com-
parison). Roughly half of the solid layers does not
melt at T T 0m (170), several resist to melt up at T
close to Tl. There is a tendency to retain solid
layers s near to the substrate S. Reversing the
pathway, starting from a liquid film at Tl > T 0m
(what requires that the liquid l wets S), epitaxial
solidification of s/S starts at Tl and proceeds re-
versibly, passing T 0m and completes at T ¼ Ts. In
Fig. 5 we illustrate numerically for a ten layers
system, how U and C act on the melting curves allastride T 0
m.
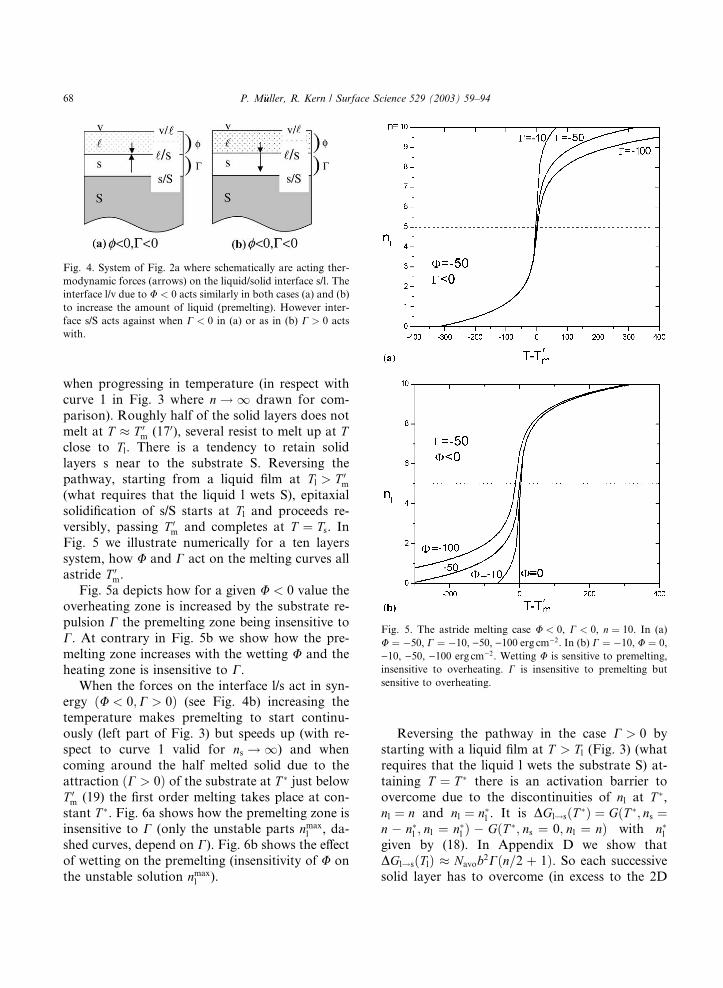
Fig. 5a depicts how for a given U < 0 value the
overheating zone is increased by the substrate re-
pulsion C the premelting zone being insensitive to
C. At contrary in Fig. 5b we show how the pre-
melting zone increases with the wetting U and the
heating zone is insensitive to C.
When the forces on the interface l/s act in syn-ergy ðU < 0;C > 0Þ (see Fig. 4b) increasing the
temperature makes premelting to start continu-
ously (left part of Fig. 3) but speeds up (with re-
spect to curve 1 valid for ns ! 1) and when
coming around the half melted solid due to the
attraction ðC > 0Þ of the substrate at T � just below
T 0m (19) the first order melting takes place at con-
stant T �. Fig. 6a shows how the premelting zone isinsensitive to C (only the unstable parts nmax
l , da-
shed curves, depend on C). Fig. 6b shows the effect
of wetting on the premelting (insensitivity of U on
the unstable solution nmaxl ).
Reversing the pathway in the case C > 0 bystarting with a liquid film at T > Tl (Fig. 3) (what
requires that the liquid l wets the substrate S) at-
taining T ¼ T � there is an activation barrier to
overcome due to the discontinuities of nl at T �,
nl ¼ n and nl ¼ n�l . It is DGl!sðT �Þ ¼ GðT �; ns ¼n � n�l ; nl ¼ n�l Þ � GðT �; ns ¼ 0; nl ¼ nÞ with n�lgiven by (18). In Appendix D we show that
DGl!sðTlÞ Navob2Cðn=2 þ 1Þ. So each successivesolid layer has to overcome (in excess to the 2D
Fig. 4. System of Fig. 2a where schematically are acting ther-
modynamic forces (arrows) on the liquid/solid interface s/l. The
interface l/v due to U < 0 acts similarly in both cases (a) and (b)
to increase the amount of liquid (premelting). However inter-
face s/S acts against when C < 0 in (a) or as in (b) C > 0 acts
with.
Fig. 5. The astride melting case U < 0, C < 0, n ¼ 10. In (a)
U ¼ �50, C ¼ �10, )50, )100 erg cm�2. In (b) C ¼ �10, U ¼ 0,
)10, )50, )100 erg cm�2. Wetting U is sensitive to premelting,
insensitive to overheating. C is insensitive to premelting but
sensitive to overheating.
68 P. M€uuller, R. Kern / Surface Science 529 (2003) 59–94

nucleation barrier) the barrier Dgl!sðT �Þ=kT ¼32Cb2=kT � due to the substrate S repulsion since
C > 0. Even for C ¼ 100 erg cm�2 and T ¼ 1000K this barrier has a high probability to be jumped.
4.2. Which system exhibits which melting pheno-
mena
We have to precise U and C characteristics of
existing systems.
4.2.1. U values: their determination
U values only concern the deposit and its self-
wetting ability by its liquid secured when U < 0.
Pluis et al. [11] in their paper have called U ¼ �Dcand have collected semi-quantitative data fromMiedema et al. [43–45] upon cs, cl and csl at the
melting point for pure metals. They are empirical
and average data ignoring anisotropy effects which
in fact are small for metals (less than 4%) what we
know from the equilibrium shape of metals [46].
Miedema et al. [43–45] collects first surface ener-
gies at Tm [43] of roughly 30 clean liquid metals,
the only clear measurable quantity and finds thatthey scale linearly with the vaporisation energy per
unit molecular surface. For more general type of
bonding this relation is called Stefan�s rule (see
Wolf [47]) amended by Skapsky [48]). By elec-
tronic empirical considerations, Miedema [44] finds
that at 0 K there is the mean value relation
ðcsV2=3
s Þ0 K ¼ 1:13ðclV2=3
l Þ0 K. The cl and cs values
are listed in Pluis et al. [11]. For non-metals wegive in Appendix E a rationalisation of the ratio
ðcs=clÞTmwe will use when the necessary data are
needed.
The other quantity necessary for having insight
how the liquid wets its solid is csl or ðbslÞ. For this
purpose Miedema et al. [45] follows Ewing�elegant
procedure [49,50] where csl is said to be the sum of
an enthalpy term cIsl ¼ kðTmDSm=V 2=3Þ and a con-
figurational entropy term cIIsl ¼ �TmDSc=V 2=3. The
first enthalpic term is just a fraction k of the areal
transition enthalpy across the sl interface, k ¼ðZ � zÞ=2Z being the fraction of liquid molecules a
surface atom sees with Z the bulk coordination
and z the in-plane coordination in the surface layer
of the solid. For the second term DSc < 0 is the
deficit of entropy of the liquid near the surface dueto its layering ability. This second term thus de-
scribes how molecular disorder of the liquid differs
when approaching the solid surface (supposed to
be perfectly flat). Ewing [49,50] calculates this en-
tropy deficit from the radial distribution function
in the bulk liquid experimentally determined by X-
ray scattering. At a last resort this simplification is
probably not too bad for the atoms considered inthe compact crystal face since measurements on
real surfaces have not really be done yet system-
atically. The entropy deficit listed in [45] Table 2
Fig. 6. The boosted premelting. When U < 0, C > 0, n ¼ 10 the
stable branches (full lines) are only sensitive to U (see (a)). The
unstable branches (dotted) are only sensitive to C (see (b)). At
the end-points n�, the intersection of the curves with a vertical
line, starts the first order premelting.
P. M€uuller, R. Kern / Surface Science 529 (2003) 59–94 69
lies inside )0.8 cal mole�1 < DSc < �0:3 cal mole�1.
The csl values with their cIsl and cII
sl components are
listed in Table 3 and taken over by Pluis et al. [11].
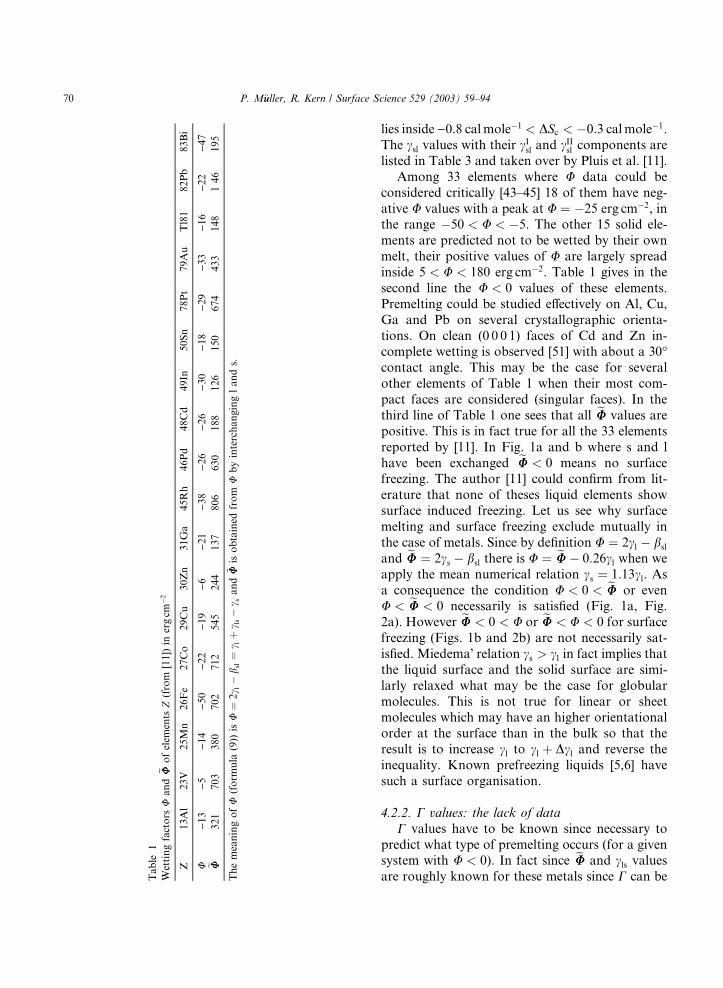
Among 33 elements where U data could be
considered critically [43–45] 18 of them have neg-
ative U values with a peak at U ¼ �25 erg cm�2, inthe range �50 < U < �5. The other 15 solid ele-
ments are predicted not to be wetted by their own
melt, their positive values of U are largely spread
inside 5 < U < 180 erg cm�2. Table 1 gives in the
second line the U < 0 values of these elements.
Premelting could be studied effectively on Al, Cu,
Ga and Pb on several crystallographic orienta-
tions. On clean (0 0 0 1) faces of Cd and Zn in-complete wetting is observed [51] with about a 30�contact angle. This may be the case for several
other elements of Table 1 when their most com-
pact faces are considered (singular faces). In the
third line of Table 1 one sees that all eUU values are
positive. This is in fact true for all the 33 elements
reported by [11]. In Fig. 1a and b where s and l
have been exchanged eUU < 0 means no surfacefreezing. The author [11] could confirm from lit-
erature that none of theses liquid elements show
surface induced freezing. Let us see why surface
melting and surface freezing exclude mutually in
the case of metals. Since by definition U ¼ 2cl � bsl
and eUU ¼ 2cs � bsl there is U ¼ eUU � 0:26cl when we
apply the mean numerical relation cs ¼ 1:13cl. As
a consequence the condition U < 0 < eUU or evenU < eUU < 0 necessarily is satisfied (Fig. 1a, Fig.
2a). However eUU < 0 < U or eUU < U < 0 for surface
freezing (Figs. 1b and 2b) are not necessarily sat-
isfied. Miedema� relation cs > cl in fact implies that
the liquid surface and the solid surface are simi-
larly relaxed what may be the case for globular
molecules. This is not true for linear or sheet
molecules which may have an higher orientationalorder at the surface than in the bulk so that the
result is to increase cl to cl þ Dcl and reverse the
inequality. Known prefreezing liquids [5,6] have
such a surface organisation.
4.2.2. C values: the lack of data
C values have to be known since necessary to
predict what type of premelting occurs (for a givensystem with U < 0). In fact since eUU and cls values
are roughly known for these metals since C can beTab
le1
Wet
tin
gfa
cto
rsU
an
de UUof
elem
ents
Z(f
rom
[11])
iner
gcm
�2
Z13A
l23V
25M
n26F
e27C
o29C
u30Z
n31G
a45R
h46P
d48C
d49In
50S
n78P
t79A
uT
l81
82P
b83B
i
U)
13
)5
)14
)50
)22
)19
)6
)21
)38
)26
)26
)30
)18
)29
)33
)16
)22
)47
e UU321
703
380
702
712
545
244
137
806
630
188
126
150
674
433
148
146
195
Th
em
ean
ing
ofU
(fo
rmu
la(9
))is
U¼
2c l�
b sl¼
c lþ
c ls�
c san
d~ UU
iso
bta
ined
fro
mU
by
inte
rch
an
gin
gl
an
ds.
70 P. M€uuller, R. Kern / Surface Science 529 (2003) 59–94

written C ¼ eUU þ blS � bsS ¼ cls þ csS � clS the only
missing data are blS � bsS or ðcsS � clSÞ characte-
rising the adhesion (or interfacial) energies of bi-
nary systems A/B. The subscripts l and s are valid
for material A which is the deposit and S the
subscript for material B. In the case eUU > 0 (orcsl > 0) since blS � bsS < 0 (or csS � clS < 0) which
is the very general property that a liquid A adheres
less on a substrate S than does the solid A espe-
cially when the interface sS is coherent. ThereforeeUU and blS � bsS compete each other so that C is
either positive or negative. However the approxi-
mations to calculate such differences have to be
handled with care.Following Miedema� scheme [45] four succes-
sive approximations are made. (i) interfacial en-
ergy cAB is divided in three parts, the two ‘‘physical
parts’’ defined above cIAB, cII
AB and the third one the
‘‘chemical part’’ cIIIAB making the very distinction of
the two components of the binary system AB with
cIIIAA ¼ 0. Writing explicitly with evident notations:
C ¼ ðcI þ cIIÞlsAA
þ ðcI þ cII þ cIIIÞsSAB
� ðcI þ cII þcIIIÞ
lSAB
. Further simplifications are made: (ii) the
chemical parts coming from the heat of solution of
alloys, the distinction between sS and lS can hardly
be made, the best is to write cIII
sSAB
¼ cIII
lSAB
. (iii) the
configurational entropy part of a liquid A meetingthe solid surface A being taken from the bulk ra-
dial distribution of A the true nature of the surface
A or B is of no matter and cII
sSAA
¼ cII
lSAB
. Further-
more cII
sSAB
¼ 0 for a coherent interface. (iv) the
physical enthalpy parts making no distinction
about A and B one writes cI
lSAB
¼ cI
lSBB
. Further-
more cI
sSAB
¼ 0 per essence. Finally all these crude
approximations lead to:
C ¼ cI
lsAA
� cI
lSBB
¼ Z � z2Z
TmDSm
V 2=3
� �A
�� TmDSm
V 2=3
� �B
�so that one infers that mostly, C < 0 since pre-
melting of A can be done only on a substrate B
when TmjB > TmjA. The weakest points of these
approximations are (i) tripartition, then points (ii)
and (iv) so that some hope remains to meet sys-
tems with C > 0.
4.2.3. C determination: a proposal
May be the best solution is to trust on direct
experiments, either on the premelting experiments
where U and C data can be collected (see in this
paper Sections 4.4, 7.3 and 6.3 as experimental
examples) or on direct measurements of some in-
gredients of C. Supposing that from above eUU (or
cls) is known their remains to know blS; bsS (or clS,
csS). To know the values of 2cs � bsS and 2cl � blS
would be as helpful as well as the necessary Uvalue so that surface melting occurs when all these
quantities are negative (see Fig. 2a). As a conse-
quence neither contact angle measurements of the
liquid l on the substrate S are of any help, contact
angle being zero, nor measurements of 3D equi-
librium shapes of crystals on S since the only stable
states are the 2D wetting layers of s on S.
We propose that the determination of 2cs �bsS < 0 has to be done by measuring directly the
thickness of the solid wetting layers. One puts in a
closed isothermal empty volume the solid of sur-
face S at the same horizontal level as the solid s. At
T < T sm where the vapour pressure of s is high
enough ns molecules transfer on S as successive
monolayers of s. When no mixing of s and S takes
place the free enthalpy balance is written easily.Considering the coherent epitaxy on s/S, the es-
sential limitation of the number of equilibrium
layers is the strain energy surface density Eam2=ð1 � mÞ per layer (see formula (36) we apply in
Section 7.3). When measuring the number of lay-
ers ns at equilibrium:
j2cs � bsSj ¼Em2
1 � m
�þ 2qg
�nsaens=fs
When m ! 0, the potential energy difference
2qgnsa in the gravity field of the final surfaces s
and S of equal area becomes leading and very
great thickness are expected. The parameter fs may
be approached by using the fact that misfit is the
most sensible parameter versus temperature. Forglissile epitaxies (see Section 6) where strain is
motivated by surface stress ðss þ ssSÞ equilibrium
strain eeq decreases as n�1s according to (27). The
above-mentioned relation is valid when to m2
P. M€uuller, R. Kern / Surface Science 529 (2003) 59–94 71

constant is substituted e2eq / n�2
s . For a same
2cs � bsS value a much greater number of equilib-
rium wetting layers are obtained. For a glissile
system, this number is however smaller than for
the case where gravity is the only limiting factor.The determination of 2cl � blS < 0 can be de-
termined with a similar isothermal transfer system
but at T > T sm. Clearly gravity is only the factor
limiting the thickness (see [52]).
4.3. van der Waals interacting interfaces
Up to now we considered the exponential decayof neighbour interactions of layers. Let us consider
other interactions. Suppose all species interact
according to r�6 dispersion forces which owing to
the fluctuating electromagnetic field are quite very
general asymptotic forces valid for r � a in con-
densed matter [52]. The surface excess free enth-
alpy for our planar system (Fig. 2a) given by (C.5)
in Appendix C reads instead of (7):
Gsurfðns;nlÞ
¼ Navo 2cs
(þ ð2cl � blsÞa
Xnl
1
n�3
þ ð2cs � bsSÞaXns
1
n�3
þ ðbls � blSÞaXns
1
n�3
�Xn
1
n�3
!)ð70 Þ
After some simplifications (as in Section 3.1) the
first discrete derivative of (70) at constant n ¼ns þ nl brings to the melting curve similar to (120):
DSmðT 0m � T Þ þ Navob2a½Un�3
l � Cðn� nlÞ�3 ¼ 0
ð1200Þwith nl ¼ nljeq and U, C having the same meaning
as in (9) and (10). Stability condition o2G=on2l jn > 0
thus requires (instead of (14)):
ððn� nlÞ=nlÞ4< �C=U ð14
0 ÞOne distinguishes the same two stable premelt-
ing behaviour U < 0, C70 we called previously
boosted premelting for C > 0 (Section 3.2.2) andastride melting for C < 0 (Section 3.2.1) both cases
degenerating in the usual asymptotic premelting
when the solid s becomes thick ns ! 1.
The melting curves are similar to those sche-
matically given in Fig. 3 and Figs. 5 and 6 for the
exponential interaction with fP 1 excepted there
is no more finite temperature Ts 6¼ 0. Below some
temperature Ts the surface should be dry nl ! 0
but the asymptotic n�3 law does not allow it. This isquite unphysical and contradicts experiments and
molecular simulations specially valid at low cov-
erage [53]. A similar inaptitude happens at the
other end of the melting curve (1200) where for the
astride melting C < 0 the last ‘‘solid atoms’’ do not
transform in liquid ones. For these reasons we
maintain the formulation (12) with exponentials
where one may add asymptotic r�3 tails if required.Experiments where size effects could be ap-
proached through the force of circumstances are
those of epitaxial adsorbed gases [18–23] that
means precisely so-called van der Waals systems.
Studied still in the fifties [54–56] such systems show
step adsorption isotherms characteristic of well
defined surfaces and which are the sign of layer by
layer growth. A discrete succession n of first ordergas-solid 2D condensation at constant T takes
place at well defined reduced chemical potentials
of the vapour kT lnðPn=P1Þ < 0 that means at un-
dersaturation P < P1. Such a behaviour is well
assessed for spherical or quasi-spherical molecules
(noble gases, CH4, CF4, etc.) on lamellar crystals
whose dominant surface is ideally flat and perfect
as graphite, MoS2, CdI2, etc. Solid epitaxial filmsof tunable thicknesses are then equilibrated with
their vapour pressure. Approaching their melting
point Tm surface premelting could be observed [20].
4.4. An example: coherent CH4/MgO epitaxial
system of astride melting
A series of studies [19,21,22,56–58] on CH4
(CD4), melting point Tm ¼ 90:7 K (89.7 K) epi-
taxially grown on (0 0 1) MgO as fcc (0 0 1) CH4
layers with 2[1 1 0] MgO in parallel orientation
with [1 0 0] CH4 (CD4). Up to five or more solidmonolayers can grow. Beyond 3D crystals appear
either due to inavoidable capillary condensation
on the powder or due to some epitaxial strain. The
natural misfit m ¼ ðaMgO
ffiffiffi2
p� aCH4;3DÞ=aCH4;3D var-
ies in the temperature range 50–90 K from nearly
zero to )1.5% essentially due to the thermal ex-
72 P. M€uuller, R. Kern / Surface Science 529 (2003) 59–94

pansion of the deposit (that one of MgO being 30
times smaller). We take aMgO ¼ 4:207 �AA, aCH4;3D ¼5:865ð1 þ 3:3 � 10�4 T) �AA [22]. At roughly 50 K a
thick solid film would be therefore non-strained
when commensurate with MgO. If temperature goes
up to 90 K, if the deposit remains coherent, itbecomes strained up to ek ¼ �1:5%. In fact the
measured expansion of the film is constant within
the error bars 0.003�AA so that one has to conclude
that the film is at least coherent with MgO(1 0 0) in
all this temperature range. Its maximal compres-
sive strain due to its hindered dilation varies
linearly from ek ¼ 0 to ek ¼ �1:5% in the temper-
ature range of 50–90 K. Taking E=ð1 � mÞ 1:9�1010 erg cm�3 (with m ¼ 0:4) 3 the maximal strain
energy density is 4.2� 106 erg cm�3. With V s ¼ 33
cm3 mole�1 at 90 K, DSm ¼ 2:48 cal mole�1 [60]
relation (12) exhibits a maximal melting point shift
T 0m � Tm ¼ �1:8 K. Thus data of CH4 and CD4
can be roughly reported on the same temperature
plot as done by [21,22]. Now another point can be
discriminated: the formation of 3D-CH4 crystals[21] mostly at 50 K and less at higher temperatures
up to 90 K is not due to strain (much too small)
which excludes a Stranski–Krastanov transition
(also called dewetting transition) but they are due
to spurious capillary condensation in-between the
grains of the MgO powder.
The quantities nl and ns have been measured by
neutron diffraction [22] as a function of tempera-ture in the range 50 < T < 95 K. Solid layers have
been detected at 5 degrees above the melting point:
ns ¼ 2:5 for a n ¼ 5:8 thick film. This is very con-
vincingly confirmed by quasi elastic neutron scat-
tering (QENS) where from a broad pedestal of the
liquid signal emerges a narrow peak due to the
solid layers [21]. The 2D liquid layers have a mo-
lecular mobility as large as the molecules of thebulk liquid at the same temperature. Authors
[21,22] claim that the solid layers, probably closest
to the substrate and most influenced by its field,
therefore persist above the melting point Tm. This is
clearly what we call the astride melting with C < 0 in
Section 3.2.1. The above-mentioned authors used
the term of ‘‘presolidification’’ or ‘‘prefreezing’’
which is at least incomplete since there is forgotten
the associated premelting. It is confusing too sinceby prefreezing there is now defined in literature
what we represented in Figs. 1b and 2b. Surprising
for the same authors was also to find a good log-
arithmic law [21,22] instead of some expected
power law for van der Waals systems
nl ¼ �2:14 logTm � T
Tm
� �� 0:73 with
Tm ¼ 90 K; T < Tm
The measured points of both neutron techniques
are essentially present inside 0 < nl < 4. Of course
only those points for T < Tm could be considered
in this log type representation. The total numberof layers in the film lies around 6 < n < 8 for the
various experiments where unfortunately they
could not be really kept constant by increasing T(molecules go over the vapour phase or in 3D
crystals or 3D liquids in capillars). Nevertheless
writing the previous relation in the exponential
form
expð�nl=0:93Þ ¼ 2:44 � 10�2ðTm � T Þ
we compare with (120), taking the small tempera-ture shift correction T 0
m ¼ Tm � 1:8 K:
expð�nl=fÞ ¼DSmf
Navob2jUj ðT0m � T Þ
þ CjUj expð�ðn� nlÞ=fÞ ð12
000 Þ
and identifies f ¼ 0:93. When nl � n is small en-
ough the first rhs term is the leading term so that
one identifies U ¼ �3:7 � 0:2 erg cm�3. We took
DSm ¼ 2:48 cal mole�1 deg�1, b2 ¼ ð6ffiffiffi2
p=2 � 10�8Þ2
cm2 the area occupied by one molecule and T 0m ¼
88:2 K one obtains the dry temperature Ts 47 K
which lies close to a point of measurement0 < nl < 0:2 at 46 K. Parameter C has to be found
among the measurements at T > T 0m. Since above
the melting point at T ¼ 95 K, nl ¼ 3:3, ns ¼ 2:5
3 For CH4 no measurements are available but for isomor-
phous rare gases we know C11 and C12 [59] so that we
considered the value m ¼ 0:4 and vs ¼ 3ð1 � 2mÞ=E and vl are
volumetric compressibilities of s or l. There is at Tm, vl=vs 3
for Ar and for CH4 there is vl ¼ 1:6 10�10 erg�1 cm3 [60] so that
if we take the same ratio vs ¼ 0:5 10�10 deducing E=ð1 � mÞ.
P. M€uuller, R. Kern / Surface Science 529 (2003) 59–94 73

[21] so that one obtains C ¼ �10:6 � 1:0 erg cm�2.
With the so-obtained data f, U and C we plot in
Fig. 7 the melting curve (full line) according the
two exponential representation (12). For clarity we
do not put for T < T 0m the experimental points
[21,22] on Fig. 7 which obviously lie on the fullcurve. However for T > T 0
m we put as bars the
observed persisting solid layers ns up to the highest
point of measurement. We infer following the full
line that at 140 K there persists about one solid
layer probably splitting then in 2D islands we es-
timate to disappear at Tl ¼ ðT 0m � ðCNavob2Þ=
ðDSmfÞÞ 204 K. On Fig. 7 is also plotted with the
same data the melting curve calculated with theasymptotic power law n�3 but, as seen, gives a bad
representation at low and high temperature. At
low and at high temperature where there are re-
spectively a few liquid and a few solid layers the
n�3 law is no more valid.
In Section 7 we come back to this example of
coherent epitaxy to calculate the local strain ezz in
the solid layers and compare it with that one de-termined experimentally by [22].
5. Surface stress effect on coherent epitaxy
The expressions (1) and (7) of the Gibbs free
energy have been established without any consid-
eration of surface stress. In other words we haveneglected the energy spent to deform surfaces and
interfaces before accommodation of A (s + l) onto
its lattice mismatched substrate S. Let us recall
that the work of deformation of an isotropic pla-
nar surface of orientation n, at constant number of
surface atoms, may be written dWdef ¼ Asndewhere sn is the surface stress (here a scalar) of the
surface n of area A and de is the isotropic in-planedeformation. 4 In the following we omit index nsince we have to do here only with one type of
orientation. However having to do with various
interfaces of same orientations n but different na-
ture i, j we will substitute such labels. The surface
stress effect can thus be easily taken into account
by adding to the Gibbs free energy of the system
(1) the work of deformation of the solid surfaceand interfaces during accommodation of the
solid + liquid film onto the substrate S.
At this point of the study it is very important to
stress on the reference state used for the definition
of the surface and interface quantities (Refer to
Appendix F). In the Gibbs free energy ((1),(5)–(7))
the reference is written in Lagrangian coordinates,
that means the reference state is the non-deformedone. Therefore (see Appendix F) according to
Shuttelworth� equation in Lagrangian coordinates
there is si ¼ oci=oe [63]. The supplement of surface
energy is 2mðoGsurfÞ=ðoeÞje¼m where Gsurf ¼ Navogsurf
is given by (7) and m ¼ exx ¼ eyy the in-plane de-
formation. The adhesion energies bij within (7) have
to be converted by Dupr�ee� relation (Appendix C,
formula (C.3)) so that (7) reads (with f ¼ fl ¼ fs)
gsurf ¼ ðcl � cs þ cslÞð1 � e�nl=fÞþ ðcs � cS þ csSÞð1 � e�ns=fÞþ ðcs � cS þ clS � cslÞe�ns=fð1 � e�nl=fÞ þ 2cS
Fig. 7. The melting curve of CH4/MgO. Continuous curve: the
calculated (12) one U ¼ �3:7, C ¼ �10:6 erg cm�2 (the misfit
dependence with temperature has been taken into account but
in this specific case, due to its weakness, is negligible). From Ts
to T 0m (90 K) this curve fits well the experimental measurements
[20]. They are not reported here. However the measured values
at T > T 0m typical for astride melting are given with their error
bars. The dotted curve is that one (120) corresponding to van
der Waals interaction.
4 For s > 0 the surface layers tend to contract themselves and
s is said to be tensile. For s < 0 the surface layers tend to
expand themselves and s is said to be compressive. For a recent
tutorial paper on surface stress see [61] and for a comprehensive
review [62].
74 P. M€uuller, R. Kern / Surface Science 529 (2003) 59–94

Applying si ¼ oci=oe ði; s; l; S; sS; slSÞ but noticing
that ocl=oe ¼ 0 since a liquid surface cannot be
deformed at constant number of atoms, and no-
ticing that ocs=oe ¼ 0 since the very thick substrate
S does not work during accommodation, there is:
ogsurf
oe¼ ½U0ð1 � e�nl=fÞ þ C0
1ð1 � e�ns=fÞ
þ C02ð1 � e�n=fÞ ð20Þ
with
U0 ¼ ssl � ss; C01 ¼ ssS þ sls � slS and
C02 ¼ ss � sls þ slS ð20
0 Þ
Then surface and interfacial stresses only modify
the factors U and C in formulae (8)–(10) and the
subsequent being concerned that now reads:
UI ¼ U þ 2mU0 and C1 ¼ C þ 2mC01 ð21Þ
A short discussion can be done on the qualitative
effect of surface stress. First let us recall thatconstant misfit, whatever its sign, increases the
elastic energy of the film and shifts, as discussed in
Section 3.1 the melting curves to lower tempera-
ture without altering their shape. Surface stress as
shown by (21) acts on the shape of the neql ðT Þ curve
by means of UI and CI and depends upon the sign
of the misfit m. From Section 3.2 one knows that
UI < 0 determines the premelting zone (Figs. 5band 6b) and that CI when negative determines the
overheating zone (Fig. 5a). From (21) it can be
seen how misfit acts as a correcting term. In gen-
eral surface stress si is a positive quantity of the
order of surface free energy ci (in absence of for-
eign adsorption) [62,64]. Interfacial free energies
of solid/liquid roughly are five times smaller than
the corresponding surface energies. Interfacial s/lstress is supposed to behave similarly. As a result
of these estimates in (21) the corrective factors
read U0 ¼ �ss þ OðslsÞ and C0 ¼ ssS þ OðslsÞ so that
from (21) there is:
UI U � 2mss and CI C þ 2mssS ð22Þ
Positive misfit thus will increase the premeltingzone and eventually if U > 0 and small it will
render wetting possible UI < 0. Negative misfit at
the contrary decreases the premelting zone ren-
dering eventually UI > 0 and thus annihilating
premelting. Notice that for U ¼ �20 erg cm�2,
ss ¼ 103 dyn cm�1 (Cu, Pb) [64] UI �40 or UI 0
ergcm�2 for respectively m¼1% and m¼�1%.
Interfacial stress has an opposite but smaller effect
(ssS<ss) on CI and thus on the overheating zonewhen C<0 and U<0. One should come back to
Figs. 5b and 6b where the melting curves are
drawn for decreasing U up to U¼0 and C¼cte.
U 0 typically is a case where no premelting but
only overheating prevails when C<0. When there
is C>0 nothing special happens at the surface
around T 0m.
6. Non-coherent epitaxies: glissile epitaxies
The coherent epitaxial films we treated inSections 3–5 when acquiring a great enough
thickness may release their elastic energy. Many
type of defects may produce such a relaxation. The
most studied defects are misfit dislocations. It is
well known that above some critical thickness ncs ,
roughly depending upon the inverse of the misfit mand some stiffness ratio, dislocations suddenly in-
troduce leaving the semi-coherent film with a re-sidual misfit m0 < m. The melting curves are thus
shifted to a higher melting point T 0m < T 0
m0 . If dis-
locations are not too much hindered kinetically
close to melting point their entrance is continuous,
the residual misfit drops as n�1s and the melting
point T 0m comes back to Tm as n�2
s .
Non-coherent epitaxies act in a very different
way. An extreme situation is the perfectly glissile
epitaxy where no elastic accomodation in between
the deposited film and its substrate is supposed to
take place. The epitaxial films have not their nat-
ural crystallographic parameter and therefore are
strained. When surface and interfacial stresses are
properly taken into account the in-plane crystal-
lographic parameter of the film is thickness de-
pendent as well as the so-generated deformation eand stress r. Such kind of homogeneous models
have been introduced for discussing wetting–
non-wetting behaviour [65], mechanical properties
of thin films [66] and asymptotic stress of thin films
[67]. They differ from the inhomogeneous models
[23,68,69] ignoring surface stress but considering
that the substrate strains inhomogeneously the
P. M€uuller, R. Kern / Surface Science 529 (2003) 59–94 75

solid film. We consider latter one consequently in
Section 7.
For our system (Fig. 2a) where the natural
misfit m does not determine the strain, we intro-
duce a virtual in-plane deformation e of the glissile
film, the Gibbs energy reads:
GðT ; eÞ ¼ Ns Gsð0Þ�
þ V s E1 � m
e2
�þ NlGlðOÞ
þ NavogsurfðciðeÞÞ ð23Þ
The equilibrium strain thus is obtained by mini-
mising (23) in respect with e. Thus there is
eeq ¼ � 1 � m2Ea
1
ns
ogsurfðns; nlÞoe
ð24Þ
where we took ns ¼ Nsa2 since the film is non-
coherent. The partial derivative has been calcu-
lated in (20) as a combination of surface stresses.
The slab therefore is homogeneously in-plane
strained (24) and e? ¼ �ðð2mÞ=ð1 � mÞÞeeq butvarying with size ns and nl.
For calculating the equilibrium number of liq-
uid layer nl, one proceeds as in Section 3.1, in-
jecting (24) in (23) and derivating in respect to Nl
at constant number N of atoms. When using inside
gsurfðciðeeqÞÞ the development of surface energies
with respect to strain under the form:
ciðeeqÞ ¼ cið0Þ þZ eeq
0
Z eeq
0
ocioexx
dexx
�þ ocioeyy
deyy
�¼ cið0Þ þ 2eeqsi ð25Þ
From (23) calculating oGðT ; eeqÞ=oNl ¼ 0 one
obtains similarly to (8), using (24) and (20) for the
derivative oe=onl and Navob2a ¼ V s, the meltingcurve:
DSmðTm � T Þ � 3V s E1 � m
e2eq
þ Navo
b2
fU�h
þ 3eeqU0�
e�nl=f
� ðC þ 3eeqC0Þe�ns=f
i¼ 0 ð26Þ
where eeq is given by (24), (20) and reads
e ¼ � 1 � m2Ea
1
ns
U0ð1h
� e�nl=fÞ þ C01ð1 � e�ns=fÞ
þ C02ð1 � e�n=fÞ
ið26
0 Þ
The definition of U and C are given in (9) and (10)
in term of surface energies at zero strain and U0, C01
and C02 in (200) as a combination of surface stres-
ses. Latter quantities are strain independent in
contrast to volumetric stresses for which Hooke�slaw holds [70]. 5 We used this property by writing
(25).
Since to Eq. (26) is associated (260) the melting
curves are distorded by the strain eeqðnl; nsÞ in very
a complex manner. For coherent epitaxies we have
seen in (12) there is only a melting point shift to-
wards lower temperatures and surface stress (see
Section 5) shifted only the U, C characteristics.
6.1. Strain behaviour during melting
Let us see this more closely, looking first at the
eðns; nÞ behaviour with (24) and (20). In Fig. 8 we
draw eðns=nÞ for different thicknesses n ¼ 10–100
taking sls ¼ slS ¼ ssS ¼ 200 and typically ss ¼ 103
dyn cm�1 scaling with E ¼ 1011 erg cm�3 accordingto the rule 3s=Ea ¼ 1. eðns=nÞ is compressive when
surface stress is positive. It is greater when the
surface is dry (ns=n ¼ 1) and also when there re-
mains only a few residual solid layers. In between,
the compressive strain has a minimum.
Let us notice that the curves of Fig. 8 have been
interrupted at the left for ns < 2; 3 since there
surface stress defined as a macroscopic quantitylooses its physical meaning. Nevertheless a film of
n ¼ 10 layers has a strain �1:5% < e < �0:7% a
ten times thicker ones n ¼ 100, �0:15% < e <�0:05%.
Interesting aspects around ns ¼ n are revealed.
For the dry film one has
eeqðns ¼ nÞ ¼ � 1 � m2Ea
1
ns
ðss þ ssSÞ ð27Þ
By thinning mechanically this film its com-
pressive in-plane strain would increase hyperboli-
cally (see Fig. 8 dashed for n ¼ 10 on the rhs).However when becoming slightly wet its com-
pressive strain decreases strongly. From (24) and
(20) there is
5 When non-linear elasticity has to be used then surface
stress becomes strain dependent.
76 P. M€uuller, R. Kern / Surface Science 529 (2003) 59–94
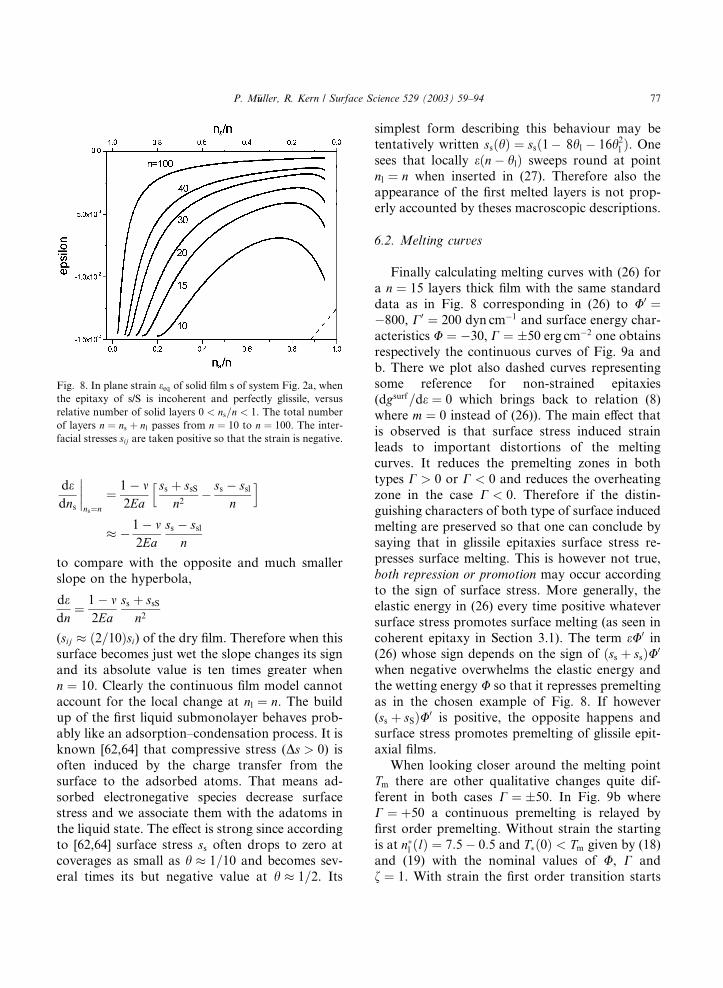
dedns
����ns¼n
¼ 1 � m2Ea
ss þ ssS
n2
h� ss � ssl
n
i � 1 � m
2Eass � ssl
n
to compare with the opposite and much smaller
slope on the hyperbola,
dedn
¼ 1 � m2Ea
ss þ ssS
n2
(sij ð2=10Þsi) of the dry film. Therefore when this
surface becomes just wet the slope changes its sign
and its absolute value is ten times greater whenn ¼ 10. Clearly the continuous film model cannot
account for the local change at nl ¼ n. The build
up of the first liquid submonolayer behaves prob-
ably like an adsorption–condensation process. It is
known [62,64] that compressive stress (Ds > 0) is
often induced by the charge transfer from the
surface to the adsorbed atoms. That means ad-
sorbed electronegative species decrease surfacestress and we associate them with the adatoms in
the liquid state. The effect is strong since according
to [62,64] surface stress ss often drops to zero at
coverages as small as h 1=10 and becomes sev-
eral times its but negative value at h 1=2. Its
simplest form describing this behaviour may be
tentatively written ssðhÞ ¼ ssð1� 8hl � 16h2l Þ. One
sees that locally eðn� hlÞ sweeps round at point
nl ¼ n when inserted in (27). Therefore also the
appearance of the first melted layers is not prop-erly accounted by theses macroscopic descriptions.
6.2. Melting curves
Finally calculating melting curves with (26) for
a n ¼ 15 layers thick film with the same standard
data as in Fig. 8 corresponding in (26) to U0 ¼�800, C0 ¼ 200 dyn cm�1 and surface energy char-
acteristics U ¼ �30, C ¼ �50 erg cm�2 one obtains
respectively the continuous curves of Fig. 9a and
b. There we plot also dashed curves representing
some reference for non-strained epitaxies(dgsurf=de ¼ 0 which brings back to relation (8)
where m ¼ 0 instead of (26)). The main effect that
is observed is that surface stress induced strain
leads to important distortions of the melting
curves. It reduces the premelting zones in both
types C > 0 or C < 0 and reduces the overheating
zone in the case C < 0. Therefore if the distin-
guishing characters of both type of surface inducedmelting are preserved so that one can conclude by
saying that in glissile epitaxies surface stress re-
presses surface melting. This is however not true,
both repression or promotion may occur according
to the sign of surface stress. More generally, the
elastic energy in (26) every time positive whatever
surface stress promotes surface melting (as seen in
coherent epitaxy in Section 3.1). The term eU0 in(26) whose sign depends on the sign of ðss þ ssÞU0
when negative overwhelms the elastic energy and
the wetting energy U so that it represses premelting
as in the chosen example of Fig. 8. If however
(ss þ sSÞU0 is positive, the opposite happens and
surface stress promotes premelting of glissile epit-
axial films.
When looking closer around the melting pointTm there are other qualitative changes quite dif-
ferent in both cases C ¼ �50. In Fig. 9b where
C ¼ þ50 a continuous premelting is relayed by
first order premelting. Without strain the starting
is at n�l ðlÞ ¼ 7:5 � 0:5 and T�ð0Þ < Tm given by (18)
and (19) with the nominal values of U, C and
f ¼ 1. With strain the first order transition starts
Fig. 8. In plane strain eeq of solid film s of system Fig. 2a, when
the epitaxy of s/S is incoherent and perfectly glissile, versus
relative number of solid layers 0 < ns=n < 1. The total number
of layers n ¼ ns þ nl passes from n ¼ 10 to n ¼ 100. The inter-
facial stresses sij are taken positive so that the strain is negative.
P. M€uuller, R. Kern / Surface Science 529 (2003) 59–94 77

earlier at n� ¼ 5:3, T � < T �ð0Þ being given by the
single zero of the second derivative of G,
o2G=on2l jn� ¼ 0. In Fig. 9a where C ¼ �50 things
suffer qualitative changes. The reference curve
(dashes) shows the continuous premelting–over-
heating behaviour. The strain induced by the sur-face stress induces a first order melting starting at
n�l ¼ 5, T � < Tm where obviously the second de-
rivative o2G=on2l jn� ¼ 0. However this second de-
rivative G00 (see insert Fig. 9a) also vanishes for n��l
where ends this first order premelting which then is
again relayed by a continuous overheating. At T �
in between n�l and n��l the free enthalpy is flat but at
T < T � exhibits a maximum between both minima
at n�l and n��l . Therefore in Fig. 9a at T � between n�land n��l we substitute dots to the equilibrium curve.
Clearly this peculiar behaviour is due to the com-
plex changes (see Fig. 7) in the solid part of the
film acting on U, C and their derivatives with re-
spect to strain e (see (26), (24) and (20)). For more
negative values of U than in Fig. 9 the behaviour
close to Tm becomes qualitatively that of the ref-
erence curve.
6.3. Krypton/graphite: a glissile epitaxy
At low temperature Kr grows from the vapour
layer by layer on the basal plane (0 0 0 1) of
graphite [71]. In the range T ¼ 16 K to Tt ¼ 114:75
K the epitaxial orientation is (1 1 1)Kr k (0 0 0 1) gr
with [1 1 0] aKr
ffiffiffi2
p=2k½210agr
ffiffiffi3
p. No Stranski–
Krastanov transition is observed by RHEED up to
tens of monolayers [71] that means layer by layer
growth is not relayed by three dimensional growth.
This is the sign that the film is not severely
strained. In the monolayer range around 55 K
however the layer suffers a solid–solid transition of
second order [72] interpreted as a 2D rotational
static distortion (see [73] for such 2D diagrams).However when the second layer builds up the un-
derlying Kr atoms move out from the graphite
bonding sites and the film becomes quasi-autono-
mous, having its own crystallographic in-plane
parameters attested by a distinct diffraction pat-
tern with respect to the graphite. This is what is
called an incoherent Kr-graphite interface (not a
semi-coherent interface with dislocations). Never-theless it is an epitaxial film since as above men-
tioned there is a strict azimuthal orientation. When
comparing the in-plane parameters of the 3D
juxtaposed phases in the epitaxial orientation, a
mismatch m ¼ ðagr
ffiffiffi3
p� aKr
ffiffiffi2
p=2Þ=aKr
ffiffiffi2
p=2 can
be defined. Because of the thermal dilatation of Kr
in this temperature range (the graphite parameter
agr
ffiffiffi3
p¼ 4:256 �AA remains quasi constant in this
temperature range but a16 KKr
ffiffiffi2
p=2 ¼ 3:991 �AA,
a115 KKr
ffiffiffi2
p=2 ¼ 4:124 �AA) this mismatch m is tem-
Fig. 9. Melting curves (full) of a glissile epitaxy of n ¼ 15 layers
with the same elastic strain as in Fig. 8. For comparison (dot-
ted) the system without strain. In (a) astride melting U ¼ �30,
C ¼ �50 erg cm�2; in (b) boosted premelting U ¼ �30, C ¼ 50
erg cm�2. In this examples when ðss þ ssSÞU0 < 0 the premelting
zone is repressed.
78 P. M€uuller, R. Kern / Surface Science 529 (2003) 59–94

perature dependent. Let us note that m is a mea-
sure of the in-plane strain only for coherent epi-
taxies and not for incoherent ones. Here the film
glides rigidly over the substrate by a temperature
change so that one call it glissile epitaxy. The de-
nomination floating phase is sometimes used butin this context is misleading since the epitaxial
orientation is strictly preserved during the gliding.
The solid film is quasi-autonomous, so that its
temperature and thickness-dependent strain has to
be determined by precise X-ray parameter deter-
minations what has not yet be done up to now.
Indirect strain evaluation however has been done.
Dash and coworkers [20,23] observed heat capac-ity anomalies just beneath the melting point of Kr
grown as multilayers on graphite. The heat ca-
pacity curves (hcc) plotted versus the reduced
temperature t ¼ ðT � TmÞ=Tm (after subtraction
of the blank and normal heat capacities) scales
with derivatives of the melting curves (mc),
CðtÞ ¼ Kðdn‘=dtÞjn at constant number of layers
n ¼ ns þ nl so that to the maximum of a hcc cor-responds the inflexion point of the mc. Experimen-
tally systematic shifts of the different premelting
curves towards lower temperature are observed
(Fig. 11a). The peaks behave as a nest of dolls,
each peak shifting according the total number of
atoms n. The authors [20,23] identified this be-
haviour as ‘‘strain assisted premelting’’. Strain
energy calculations were modelled by a substrate z-attraction. In Section 7 we also analyse such in-
homogeneous normal-strain but show that it is
only a supplementary effect. Here we re-evaluate
the authors [20,23] experimental results as due to
homogeneous in-plane strain motivated by the
four intrinsic interfacial stresses ss, ssl, ssS, slS. With
the U and C parameters this is too much to come
to a clear result so that we proceed in a heuristicmanner. In former Section 6.2 we had a general
discussion about mc of glissile epitaxies (Fig. 9a
and b). In Fig. 9a where U, C < 0 astride melting
happens with a S-shaped mc so that a more or less
symmetric hcc results. From Fig. 1 of [23] the
measured hcc for Kr/graphite for respectively a
total number of layers n ¼ 7:2, 8.7, 10.3, 11.8 show
(Fig. 11a) that the peaks (i) are fairly symmetric sothat we infer U ¼ C < 0, (ii) are not distorted so
that U0 ¼ C0 ¼ 0, (iii) can be brought back to ori-
gin. Owing to these simplifications (26), (260) can
be rewritten in reduced variables DtnðxÞ ¼ tðxÞ�telð0Þ where x ¼ n=2 � nl:
DtnðxÞ ¼ �A0e�n=2fshðx=fÞ ð2600Þ
with
A0 ¼2Navob2jUjDSmTmf
and
telð0Þ ¼3Navo
DSmTm
1 � mE
ðC02Þ
2 1 � e�n=f
n
� �2
ð26000 Þ
the shift depending upon n. C02 ¼ ssS þ ssl is the
interfacial stress (210) which creates the elastic en-
ergy, the other quantities ss and sls do not act
independently since the imposed condition U0 ¼C0 ¼ 0 leads to sls ¼ ssS þ ssl and ss ¼ ssl. The sh
term in (2600) gives a S-shape mc leading to a
symmetric hcc. Now one can calculate the hcc as a
function of the reduced variable t. Inverting (2600)
gives:
x ¼ �fsh�1 en=2f
A0
DtðxÞ� �
so that the hcc becomes:
CnðDtÞ ¼ Kdnl
dt
����n
¼ KfA0
en=2f
� � ffiffiffiffiffiffiffiffiffiffiffiffiffiffiffiffiffiffiffiffiffiffiffiffiffiffiffiffiffiffiffi1 þ en=f
DtA0
� �2s,
ð27Þ
where A0 is given by (26000). This is a symmetricpeak centered around Dt ¼ 0 given by (26000). The
peak values Cnð0Þ ¼ ðKf=ðA0ÞÞen=2f taken from
Fig. 1 [23] reported in Fig. 11a when semi-log
plotted versus n gives a fair straight line (see Fig.
10a and stars) whose slope brings f ¼ 2:75 and an
intercept Cn¼0ð0Þ ¼ Kf=A0 ¼ 7:07 J K�1. The peak
width 2Dt1=2ðnÞ at half peak height is Dt1=2 ¼ffiffiffi3
pA0e
�n=2f. From Dash�results one gains thenumber ratio A0 ¼ 7:8 � 10�3 and with (26000) an
estimate of U ¼ C ¼ �ð0:17 � 0:06Þ erg cm�2. We
took the values b ¼ 4:124 �AA, Tm ¼ 116 K,
DSm ¼ 3:37 cal mole�1 deg�1 [60]. The scaling fac-
tor is K ¼ 2 � 10�2 J K�1 but unfortunately cannot
lead to an independent estimation of U since the
unit area is not specified in the experimental work
[23].
P. M€uuller, R. Kern / Surface Science 529 (2003) 59–94 79

One has to evaluate also the peak shift telð0Þaccording to (26000). Fig. 10b shows the appropriate
fit giving a straight line passing by the origin.
Using the value E=ð1 � mÞ ¼ 4:4 � 1010 erg cm�3
for a (1 1 1) plane (Appendix B) from the elastic
constants at 116 K [59] one earns the interfacialstress jssS þ sslj ¼ 80 � 10 dyn cm�1.
Finally in Fig. 11b our calculated hcc� facing the
experimental one (Fig. 11a) shows a nice resem-
blance.
Let us collect and discuss shortly the physicalquantities we deduced from our analysis. The
number f ¼ 2:75 refers to the (1 1 1) stacking so to
a correlation length of some 9 �AA lying in between
third and fourth nearest neighbour distance in Kr.
The wetting factor U which is very small leads (10)
to the adhesion energy bsl ¼ 32:6 � 1 erg cm�2
since at T ¼ 117 K there is cl ¼ 16:40 � 0:02
erg cm�2 [60]. In Appendix E we evaluate the ratiofrom an isotropic model at the melting point
Fig. 10. Kr/graphite: (a) The peak values of the experimental
curves of [22] versus n the number of Kr layers fit an expo-
nential law (stars). They fit too a power law (dots and upper
abscissae) but with a power 1.4 instead of four meaningful for
van der Waals interactions. (b) The experimental peak shifts of
[22] satisfy a ð1 � e�n=fÞ=n square law typical for a glissile
epitaxy.
Fig. 11. (a) Experimental excess CðtÞ heat capacity [23] with
reduced temperature t ¼ ðT � TmÞ=Tm. (b) Calculated one ac-
cording to the formulation for glissile epitaxy. For (a) and (b)
the curves correspond to n ¼ 11:8; 10.3; 8.7; 7.2 the different
total Kr coverages. CðtÞ in J/K units.
80 P. M€uuller, R. Kern / Surface Science 529 (2003) 59–94

(cs=clÞT¼116 K ¼ 1:30 so that cs ¼ 21:3 erg cm�2.
There are calculations of two authors agreeing
within �1% for noble gas crystals [64] where good
potentials were available. For Kr, cð1 1 1Þ ¼ 52:8erg cm�2, for (1 0 0) and (1 1 0) faces the values are
respectively 4% and 8% greater so that one has ameasure of the anisotropy. These values are valid
at O K so that at higher temperatures several
surface contributions reduce it. Zero point energy
(5%), vibrational entropy (15%) and mostly sur-
face roughness may reduce it all together by 40%
(see for such temperature effects [46]).
Since U ¼ C one has from (10) bsS � blS ¼ 9:8erg cm�2 but we have not access to the separateadhesion energies. That solid Kr adheres better on
graphite than liquid Kr does is quite expected from
configurational entropy higher in the lS interface
than in the sS interface even when latter is inco-
herent (see for more discussion Section 7.2). Fi-
nally the sum of interfacial stresses we deduced
jssS þ sslj ¼ 80 � 10 dyn cm�1 is probably close to
jssSj since sls ¼ ss and if small. The argument is thatcalculations on Kr(1 0 0) at 0 K [64,74] give
sð1 0 0Þ ¼ �6 dyn cm�1 that means a small value
which may be similar for sð1 1 1Þ.
Lastly we derive the in-plane strain as induced
by the surface stress of the Kr layers. With (260)
there is with the above Kr data at half melting
ns ¼ n=2 with (200) e1=2ðnÞ ¼ �4:7 � 10�2ðð1�e�n=fÞ=nÞ that means a quasi hyperbolic n-depen-dence as soon as n > 2. For the four increasing
layer numbers n ¼ 7:2; 8.7; 10.3 and 11.8 there is
respectively e1=2 ¼ 6:0� 10�3; 5:2� 10�3; 4:4� 10�3
and 3:9� 10�3. When the solid becomes dry, these
strains have to be divided by two. Clearly such
glissile systems neither undergo a Stranski–Kras-
tanov transition as quoted earlier in Section 6.3
nor have the tendency to dislocation-introductionduring the growth since the strain induced by
surface stress decreases with the thickness of the
solid film.
7. z-inhomogeneity due to the finiteness of the film
In the foregoing sections we have seen thatsurface melting of finite size solids is governed by
the wetting factors U and C defining effective non-
zero thermodynamic forces between the various
interfaces when thermodynamical equilibrium is
not reached ((8) and Fig. 4). Due to theses excess
energies of the interfaces also mechanical body
forces act on each elementary slice of the slabs l and
s. Up to now we have neglected these forces es-pecially in Appendix A and B where we wrote the
mechanical equilibrium conditions ignoring them.
In a Gibbs treatment these forces have to be ac-
counted for. Similarly to gravitational forces, these
forces modify the mechanical equilibrium and
create inhomogeneous stress and strain in the
slabs. We will see that though very localised at the
interfaces s/S and l/s, this strain inhomogeneity inthe solid is measurable. However we will see that
the premelting curves we discussed before are not
sensibly modified by this strain inhomogeneity.
In order to justify the wetting–unwetting tran-
sition of noble gases film, inhomogeneous model
slabs have still been treated by different ap-
proaches [23,68,69] and the so stored elastic energy
calculated.In the following we will define first the inter-
facial field, then the body forces which lead to in-
homogeneous stress and strain, then calculate the
elastic energy components with a clear distinction
between coherent and glissile epitaxies. For this
purpose we proceed in two steps.
� At first we calculate the excess field XiðzÞ felt
by a solid ði ¼ sÞ or a liquid ði ¼ lÞ layer located ata distance z above the substrate S in respect to the
field felt by the same solid (or liquid) layer in a
continuous solid (or liquid) material. The calcu-
lations, developed in Appendix G, give for ns ! 1(see formulae (G.4) and (G.7) for the slab of Fig.
2a):
XlðzÞ ¼ ð2cl � bl=sÞe�ðz�nsÞ=f þ ðbl=s � bl=SÞe�z=f
for ns < z < ns þ nl
XsðzÞ ¼ ð2cs � bs=SÞe�z=f
�ð2cs � bs=lÞe�ðns�zÞ=fð1 � e�nl=fÞfor 0 < z < ns
XSðzÞ ¼ ðbl=S � bs=SÞe�ðjzjþnsÞ=f
þð2cs � bl=SÞe�ðjzjþnsþnlÞ=f
�ð2cs � bs=SÞe�jzj=f for �1 < z < 0
8>>>>>>>>>>>>>><>>>>>>>>>>>>>>:ð28Þ
P. M€uuller, R. Kern / Surface Science 529 (2003) 59–94 81

We see that the ingredients of these fields are
surface and adhesion energies of l/s/S similar to
those appearing in excess surface energy (7).
� In a second step we calculate the stress field
induced by this excess field. For this purpose weassume that the previous excess field induces a
body force field given by af iðzÞ ¼ dXiðzÞ=dz. The
so induced stress is thus obtained by integration
of the usual mechanical equilibrium equation
oriaz=oz ¼ f i
aðzÞ (see [33,75] and Appendix A) with
appropriate boundary conditions, that means
ri¼lzz ðz ¼ ns þ nlÞ ¼ 0 at the free surface of the liq-
uid (zero external pressure P is considered). Sincethere cannot be any excess of normal stress at the
interfaces, ri¼szz ðz ¼ nsÞ ¼ ri¼l
zz ðz ¼ nsÞ. Thus after a
straightforward calculation there is:
v1=3l rl
zzðzÞ ¼ ðe�z=f � e�n=fÞbð2cl � bl=sÞens=f
þ ðbl=s � bl=SÞc for ns 6 z6ns þ nl ¼ n
ð290 Þ
v1=3s rs
zzðzÞ ¼ ð2cs � bs=SÞðe�z=f � e�ns=fÞ
þ ð2cs � bs=lÞð1 � e�nl=fÞð1 � e�ðns�zÞ=fÞ
þ arlzzðz ¼ nsÞ for 06 z6 ns ð2900Þ
In (2900) one sees that there are two inhomoge-
neous and one homogeneous contributions to the
solid stress. The homogeneous part (the last term)is the pressure the liquid exerts on the underlying
solid layers.
7.1. Coherent epitaxy
The corresponding strains are given by Hookes
law [75] applied to the epitaxial coherent strained
solid s:
eszzðzÞ ¼
ð1 þ mÞð1 � 2mÞEð1 � mÞ rs
zzðzÞ �2m
1 � mm and
esxxðzÞ ¼ es
yyðzÞ ¼ m ð30Þ
Due to the coherency, in the solid therefore de-
velops an in-plane stress:
rsxxðzÞ ¼ rs
yyðzÞ ¼E
1 � mmþ m
1 � mrszzðzÞ ð31Þ
At the same there is in the liquid:
elzzðzÞ ¼
vl
3rlzzðzÞ and el
xxðzÞ ¼ elyyðzÞ ¼ 0 ð32Þ
where vl is the volumic compressibility of the liq-
uid.
Most easy to discuss is the case in absence of
any liquid (nl ¼ 0). Indeed rszzðzÞ contains only the
first term of (2900) so that the strain along z ac-
cording to (30) can be separated in two contribu-
tions a homogeneous one and a inhomogeneous
one eszzðzÞ ¼ es;in
zz ðzÞ þ es;homzz ðzÞ with:
es;inzz ðzÞ ¼ ð1 þ mÞð1 � 2mÞ
Eað1 � mÞ ð2cs � bs=SÞ
�ðe�z=f � e�ns=fÞa for 0 < z < ns
es;homzz ðzÞ ¼ � 2m
1�mm; es;homxx ¼ es;hom
yy ¼ m
8>>><>>>: ð33Þ
Thus if the solid wets the substrate, 2cs � bs=S < 0,
es;inzz ðzÞ is negative so that obviously the attraction
field of the s/S interface contracts inhomoge-
neously the solid layers s but mostly the substrate
nearest ones (we rule out the case 2cs � bs=S > 0
since then a s/S slab is no more stable but a 3D
Volmer–Weber topology takes place [76–78]).
If there is some liquid on top of s then eszzðzÞ is
changed (see (30), (29)), mainly by we call the field
induced pressure of the liquid on the solid repre-
sented by the last term of (2900) say rlzzðnsÞ and
explicitly from (290):
rlzzðnsÞ ¼ ½ð2cl � bl=sÞ þ e�ns=fðbl=s � bl=SÞ
� ð1 � e�nl=fÞv�1=3l ð34Þ
This pressure on top of the solid s P ¼ �rzzðnsÞ is
increasing with nl. It is leaded by the U ¼ 2cl �bls < 0 wetting term when the substrate is faraway. This positive pressure is however changed
by the differential adhesion energy bl=s � bl=S term
when the solid s becomes thin.
7.2. Coherent epitaxy CH4(0 0 1)/MgO(1 0 0)
(refer also to Section 4.4)
Let us illustrate these in-homogeneities withan accessible experimental example. Authors [22]
measured also by neutron diffraction the mean
lattice spacing (0 0 2) of the CH4 (CD4 for higher
contrast) solid film on MgO substrate.
82 P. M€uuller, R. Kern / Surface Science 529 (2003) 59–94
At 50 K the film is dry (nl ¼ 0) with ns ¼5 � 0:15 and a mean inter-plane lattice parameter
hd2Di ¼ 2:85 � 0:03 �AA is measured. At the same
temperature bulk CH4 has a (0 0 2) spacing (mea-
sured on the same sample) d3D ¼ 2:98 � 0:01 �AA.
The mean lagrangian deformation is hezziexp ¼ðhd2Di � d3DÞ=d3D ¼ �ð4:3 � 1:3Þ � 10�2 which is
clearly a measurable compression. Notice that at
50 K there is zero misfit strain (see Section 4.4) so
that this value is the genuine inhomogeneous mean
strain. In principle we can deduce from this value
over ns layers with (30) the value: 2cs � bs=S with
measurements of a much better precision, let us
say 10�3. Here let us use other experimental andtheoretical data for 2cs � bs=S and calculate hezzicalc.
First from [43,44] rule reconsidered in Appendix G
at Tm ¼ 90 K one has cs ¼ 1:18cl ¼ 22:2 � 0:2erg cm�2 where cl ¼ 18:87 erg cm�2 comes from
measurements [60]. Then from adsorption iso-
therms CH4/MgO in the first solid monolayer there
is the isosteric heats of adsorption qs ¼ 148 � 10
meV [57] and qs ¼ 158 � 2 meV [79]. The calcu-lated value considering CH4 as a hindered rotator
at 90 K [80] gives qs ¼ 152 meV with a mean field
lateral imbedding energy x ¼ 22 meV [80]. The
adsorption energy of the single molecule therefore
is qad ¼ 130 meV. In our scheme the bonding en-
ergy for the molecules closest to the substrate there
is qad ¼ bs=Sa2ð1 � e�1=fÞ so that we can deduce
bs=S ¼ 197 � 10 erg cm�2 (1 meV ¼ 1:6 � 10�15 erg)therefore 2cs � bs=S ¼ �152 � 10 erg cm�2. From
(30) and the necessary elastic data in Section 4.4
then we calculate for ns ¼ 5 the quantity hezzicalc ¼�ð3:5 � 0:4Þ � 10�2. Such a negative value corre-
sponds to a compression as shown by experiments
but with a smaller value likely due to both the
experimental and thermoelastic data uncertainties.
The unknown adhesion energies can then be ob-tained from the collected data in Section 4.4, C ¼ð2cs � bs=SÞ � ðbl=s � bl=SÞ ¼ �10:6 � 1 erg cm�2,
U¼ 2cl �bl=S ¼�37�0:2 ergcm�2 (see Section
4.3). There is bl=S ¼ 41:4�0:2 ergcm�2; bl=S ¼183�10 ergcm�2 and bs=S ¼ 197�10 ergcm�2.
We see that all adhesion energies are positive as
it should be. That one of the liquid on its own solid
is much smaller than hetero-adhesion l/S and s/Sdue to the strong ‘‘chemical binding’’ with MgO.
Furthermore as a general rule for simple systems
the adhesion energy of liquid (here CH4) on any
clean substrates should be smaller than the co-
herent adhesion of its solid on this substrate (here
(0 0 1) CH4 on (0 0 1) MgO) so that, bl=S < bs=S.
Indeed across a l/S interface compared to the s/S
one there is not only a small deficit of bond energybut essentially there are many supplementary pos-
sible configurations (entropy). [43–45,49,50]. The
so-obtained values satisfy this inequality but with
some uncertainties due to the error bars.
At 89.5 K according to data [21] the solid CH4
film becomes wetted. On ns ¼ 3:8 � 0:15 solid lay-
ers there are nl ¼ 4:4 � 0:2 liquid layers and there
was measured hd2Di ¼ 2:90 � 0:03 �AA very similarto the foregoing dry case. At that temperature the
bulk (0 0 2) spacing of CH4 is d3D ¼ 3:02 � 0:01 �AAso that the mean strain hezziexp ¼ �ð4:0 � 1:1Þ% is
similar to the previous one (dry case) but including
the homogeneous ezz component of the misfit is
ehomzz ¼ �ðð2mÞ=ð1 � mÞÞm ¼ þð2:0 � 0:15Þ%. That
means the measured part devoided of the misfit
hezzi0exp ¼ �ð6:0 � 0:1Þ% which is quite greaterthan in the dry case.
It is instructive to look at the different compo-
nents of this strain. For this purpose let us calcu-
late the field pressure the liquid exerts on the top of
the solid film using (34). One finds rszzðns ¼ 3:8;
nl ¼ 4:4Þ �ð1:1 � 0:2Þ � 108 dynes cm�2 that
means about P ¼ þ102 bars. Doubling the liquid
thickness would increase this pressure by only 1%,however decreasing the number of solid layers by a
factor 2 would increase this pressure by a factor 3
via the differential adhesion in (34) which gains a
more important negative value. This illustrates
how closely to the interfaces l/s and s/S are loca-
lised the induced inhomogeneities for f 1.
Finally calculating the mean strain with (30)
and (290,2900,34), and the formerly obtained dataexcluding also the contribution of the in-plane
misfit strain in (30) one finds for ns ¼ 3:8 and
nl ¼ 4:4; hezzi0calc ¼ ð�3:5 þ 0:08 � 0:7Þ � 10�2 ¼�ð4:1 � 0:7Þ � 10�2.
This value of the wet case is also a contraction
but greater than in the dry case. However it is
smaller than the measured one (�6:0 � 0:1)%.
There may be a systematic error but we cannot tellwhere it is residing in the measurements, the cal-
culations or both.
P. M€uuller, R. Kern / Surface Science 529 (2003) 59–94 83

Let us note that the sequence of numbers in the
expression of heszzicalc corresponds to the successive
factors of (2900). The last one is due to the field
pressure in the liquid. The two first terms are the
inhomogeneous contributions. The leading term is
due to the substrate field characterized by 2cs � bs=S
whereas the smallest term is due to eUU ¼ 2cs �bs=l ¼ 1 � 0:2 erg cm�2, the non-wetting factor of
the liquid by its solid. Let us stress that even small
but positive, this term in fact guarantees that solid
CH4 does premelt at T < Tm at the interface s/v
and not in the interface s/S since U < 0 < eUU. (Such
an interfacial premelting could in principle happen
for eUU < U < 0 (see Section 4.2)).Fig. 12 as an illustration of the half wetted
system ns ¼ nl ¼ 4 gives the inhomogeneous strain
ezz in the solid and the supernatant liquid (ingre-
dients of the calculations are those of CH4/MgO
but with zero misfit m ¼ 0). At the solid/liquid
interface ðz ¼ 4Þ there is a strain discontinuity.
Obviously to this inhomogeneous compressive
contribution (because 2cs � bs=S < 0) must be ad-ded the homogeneous contribution of the misfit mthat can be positive or negative according to the
system (for CH4/MgO, m ¼ �1:5% at 90 K).
7.3. Inhomogeneity effect on melting curves
Using (30), (290) and (2900) for strain and stress
in the film it is easy to write down the elastic en-
ergy of the deposited material A (ns þ nl) per unitsurface of S
Wel ¼1
2b2
Zri
abeiab dV
¼ Eam2
1 � mns þ
Ysa2
Z ns
0
½rszzðzÞ
2dz
� vlv1=3l
6
Z ns
n¼nsþnl
½rlzzðzÞ
2 ð35Þ
with Ys ¼ ðð1 þ mÞð1 � 2mÞÞ=ð1 � mÞE and vl=3 re-
spectively the linear compressibility of solid and
liquid.
The inhomogeneous distributions of normal
stress in liquid and solid in the integrals are given
by (290) and (2900). However we must remember
that rszzðzÞ contains a homogeneous contribution
(see last term of (2900)). The situation is complex
however so that the effect on the melting curve will
be only numerically treated. In Fig. 13 we consider
the case of CH4/MgO where Tm ¼ 90 K and n ¼ 8.
In the upper insert of Fig. 13 are shown the misfit
strain energy and the total elastic energy of the film
(ns þ nl) calculated at 90 K. Obviously the misfit
energy (dotted curve) is a straight line whereas dueto the inhomogeneity contribution the total elastic
energy is quite concentrated in the first two layers
of the solid s. The contribution of the elastic en-
ergy of the liquid is so small that it can be ne-
glected. However the field induced pressure (34)
exerted by the liquid l on the solid s contributes to
the total energy. It is given by the difference in
between the linear parts of the total and the misfitenergy.
The right side insert of Fig. 13 gives the melting
temperature shift along the melting curve due to
the elastic energy in the solid s and the melting
temperature shift due to the misfit energy. For the
dry solid (ns ¼ 8, nl ¼ 0) only the misfit energy
contributes to the shift, whereas because of the
strong inhomogeneity of the total elastic energythe temperature shift strongly deviates from the
usual one when only a few solid layers remain on
the substrate S. For the example of CH4/MgO
Fig. 12. Solid (s) of four layers (0 < z < 4) adheres on substrate
(S) on the left. Deposit s is covered by four layers of its melt (l)
(4 < z < 8) which wets it perfectly. The field induced by the
substrate S due to 2cs � bsS < 0 compresses ezz < 0 mostly the
nearest layers of s on S. The liquid feels less this field but that of
s so that since 2cs � bsl < 0 this liquid is also inhomogeneously
compressed by this field. The data used are those of CH4/MgO
at 90 K.
84 P. M€uuller, R. Kern / Surface Science 529 (2003) 59–94

there is an exact compensation and thus no moretemperature shift for ns ¼ 3.
Finally let us consider the inhomogeneity effect
on the melting curve. In the main part of Fig. 13
the full curve is that one of Fig. 8 where inho-
mogeneity effects have not be taken into account.
The dotted curve is that one calculated when in-
homogeneity effects are taken into account. It is
important to note that elastic inhomogeneities only
distort the final part of the melting curve when only
a few solid layers resist to melting. This behaviour
only described for the CH4 /MgO system is general
for coherent astride premelting (U < 0, C < 0): the
misfit energy shifts the melting curve towards
lower temperature (see Section 3.1) and inhomo-
geneous strain due to the interfacial fields distorts
the melting curve at temperature higher than T 0m
towards higher temperature. In the case of coher-
ent boosted premelting (U < 0, C > 0) there can be
no detectable effect of the field inhomogeneity
since all the melting curve is located at T < T 0m.
Incidentally let us remark that for coherent
epitaxies the maximum number of equilibrium
solid layers is given at undersaturation by the
solid/solid wetting factor 2cs � bs=S < 0, see [81,82]
ns=f ¼ lnj2cs � bs=Sj
Enam2=ð1 � mÞ
� �ð36Þ
For the above treated case CH4/MgO (Section 7.2)
where we earned the values f ¼ 1 and 2cs � bs=S ¼�152 erg cm�2 there is 6 < ns < 7 which is quite in
agreement with the limiting numbers of steps
observed in the adsorption isotherms [57,58,79].
Beyond this number of layers 3D Stranski–Kras-tanov crystals may build up.
Finally for glissile epitaxies where surface stress
produces an homogeneous in-plane stress of the
solid s motivating in-plane and normal to plane
strains, regardless of natural misfit as stated in
Section 6, body forces we discussed in this section
produce of course supplementary z-inhomogene-
ities and of course a small in-plane strain contri-bution. The effect on the melting curve is given by
the same terms of (35) excepted the first term has
to be replaced by (24) and (20). Thus to the dis-
torsion of the melting curve due to the inhomo-
geneity has to be added the distorsion due to the
surface stress. As for coherent epitaxy we treated
here in detail, these effects can be neglected at
T 6 Tm along the melting curve but play some roleat T > Tm that means the melting of the last solid
layers.
8. Conclusion and outlook
We have treated the surface melting of epitaxial
films that means surface melting of a finite size
solid A overgrowing in a regular way onto a lattice
mismatched substrate B. We have shown that fi-
nite size and epitaxial contact both lead to new
surface premelting properties different from the
well-known surface premelting properties of semi-
infinite solids.
The size effects can be simply taken into account
in a macroscopic approach of surface melting inwhich usual surface and interfacial excess quanti-
ties are expressed in terms of short range chemi-
cal interactions duly extended by longer range
Fig. 13. The melting curve of a coherently bond epitaxial layer
is not appreciably changed by considering the inhomogeneous
z-strain due to the interfacial fields excepted for the last melting
layers. The curves represent the system CH4/MgO: full curve
reference, dotted curve with inhomogeneous effect. The left
hand insert gives the total elastic energy (full curve) and misfit
energy (dotted) as a function of solid layers ns. The remainder
n� ns ¼ nl is the number of liquid layers. Here n ¼ 8. The right
hand insert gives the melting point distortion versus ns (full
curve), dashed the shift due to the misfit.
P. M€uuller, R. Kern / Surface Science 529 (2003) 59–94 85
interactions. Apart the usual coefficient U < 0
(wetting factor) characterising also the interaction
between the v/l and l/s interfaces, a new coefficient
C describing the interactions in between l/s and s/S
interfaces introduces naturally. According to the
sign of C two types of surface melting can bepredicted. They are independant of the type of
long range interactions we consider, as illustrated
with screened interactions or van der Waals in-
teractions. When C > 0 the l/s–s/S interfaces at-
traction boost the premelting which then occurs in
two steps: a continuous premelting followed by a
first order transition. When C < 0 the repulsion of
these interfaces refrains the premelting so that apart of the deposited solid remains solid above its
melting point. A very serious lack of interfacial
thermodynamical data limits the predictive effec-
tiveness of the theory. However careful analysis of
experimental melting curves with other data from
separate analytical tools allows to extract these
data. We could illustrate this with the CH4/MgO
system where neutron and electronic diffraction,inelastic neutron scattering and adsorption iso-
therms have been used. This system belongs to the
astride type where premelting and overheating
occurs. All interfacial energies could be deter-
mined.
Because of epitaxial contact a new ingredient,
the elastic energy stored in the epitaxial layer has
to be introduced. It can be divided in two contri-butions: a bulk contribution and a surface con-
tribution.
The bulk contribution essentially originates from
the lattice mismatch between the deposit and its
substrate. Obviously it is all the more important
the epitaxy is coherent and the misfit high. The
homogeneous elastic energy so induced only shifts
at constant misfit the melting curve to lower tem-perature. However, to this homogeneous contri-
bution adds an inhomogeneous bulk elastic energy
due to the interaction in between the bulk of the
various material layers (another type of size ef-
fects). Though measurable (and measured in the
CH4/MgO example) this localised strain only
produces some distortion in the final part of the
melting curve.The surface contribution originates from the
intrinsic surface and interfacial stresses considered
as excess quantities and, coupled with bulk strain,
modifies U and C. Obviously this contribution is
all the more important the misfit is great in the
case of coherent epitaxy. In the experimental case
of CH4/MgO, due to the small and even vanishing
misfit (according to temperature), this effect ishardly measurable. This contribution is however
dominant for glissile epitaxies where strain is in-
duced by the surface stress itself. It distorts the
initial part of the melting curves. As for the in-
terfacial energy the lack of surface and interfacial
stress data limits effective predictions of the theory
for case studies. We could show that the system
Kr/graphite approached by heat capacity studies,enters in this category of epitaxies. The U, C < 0
data could be extracted as well as the interfacial
stress ssS of the Kr/graphite interface. Even not yet
measured directly by experiments it is possible to
calculate the in-plane strain in the successive Kr
layers nearest the graphite substrate.
We could not find in literature studies of surface
melting of thin metal films on metals, metals filmson compounds (oxides) or organic crystals on any
stable substrate. This is an unexplored field where
surface melting studies could bring not only the Uand C (interfacial energies) data from the melting
curves or their strain derivatives that means in-
terfacial stresses. Furthermore may be that the
case of boosted premelting could be find in the
future on systems where C > 0.We have shown how useful and, up to now,
unknown data can be obtained provided that these
measurements are connected with careful surface
studies with X-ray diffraction and scattering need-
ing in these cases the use of synchrotron radiation,
adsorption measurements with Auger or mass
spectrometry. To these essential auxiliary studies
we added at the end of Section 4.2 some proposalsto determine interfacial energy or adhesion energy
by measuring isothermal transfer of wetting layers.
The proposals would hold too for the measure-
ment of interfacial stress by the method of curva-
ture [62,64]. Both measurements, energy and stress
may be done simultaneously in the same isother-
mal vessel. Let us recall that due to the various
influences of elastic bulk and interfacial elasticenergies we showed, that candidates of couples s/S
for surface melting studies have first to be char-
86 P. M€uuller, R. Kern / Surface Science 529 (2003) 59–94

acterised fully as epitaxial couples for several
thicknesses and temperatures. The bulk phases,
deposit and substrate, have to be stable, without
any intermixing. (Our predictions are not valid
when alloying occurs.) Furthermore the surface
and interfaces have to be stable intrinsically (ori-entations along cusps of the c-plot) during their
elaboration and during temperature raise. Inelastic
relaxations when occurring spoil or change the
melting curves. Concerned are dislocation intro-
duction and Stranski–Krastanov transitions for
coherent epitaxies. Let us recall that real glissile
epitaxies are not subject to these relaxations up to
great thicknesses due to their non-increasing strainenergy. Their practical interest is clear for these
reasons however up to now this field has not been
really explored. In electronic applications, where
the activity is the more important, only degenerate
epitaxies are used yet (see footnote 1) excepted
some brilliant examples as MnAs/GaAs where the
prism face of hexagonal MnAs meets the cube face
of GaAs [83] and where in the contact plane thereis a multiple coincidence lattice. Metals on oxides
system belong to the same type of non-degenerated
epitaxies [84] where perfect films can be grown and
may be good candidates for surface melting studies
of nanoscopic films.
Appendix A. General equilibrium conditions ofstressed solids in contact with a fluid
The general equilibrium conditions of fluid/
solid systems have been established by Gibbs [33]
then became tractable by Larch�ee and Cahn [34].
The equilibrium conditions so obtained by varia-
tional calculus can be splitted in thermal, me-
chanical and chemical equilibria and associatedboundaries conditions. For a stressed solid s (stress
tensor rij) in equilibrium with a fluid (hydrostatic
pressure P ) the mechanical and chemical equilib-
rium reads successively:
• orij=oxj ¼ 0 (in absence of any body forces as
gravity or others) with rijnj ¼ �Pnjdij at the
solid/fluid interface characterised by the normalvector ni. Of course we neglect gravity forces,
mostly negligible for thin films (see the end of
Section 4.2). However in Appendix F we con-
sider the body forces induced in s and l by the
finite size effect.
• U s � TSs þ PV s ¼ lfN s where Ns is the number
of moles transferred from the solid to the fluid,U s and Ss the internal energy and entropy den-
sity of the solid and V s its molar volume. lf is
the chemical potential of the fluid. Let us note
that Gibbs avoids to define a chemical potential
for one component solids. Further discussion
can be found in [34].
The previous chemical equilibrium conditioncan also be written
GsðT ; rijÞ ¼ lfN s ðA:1Þ
where GsðT ; rijÞ is the Gibbs free energy of the
stressed solid at temperature T .
In absence of any stress–chemical interaction,
what is obviously the case for a pure solid, the
elastic energy behaves as an excess energy [34] so
that the Gibbs energy (A.1) of the solid in equi-
librium with a fluid may be written in the frame-work of linear elasticity:
GsðT ; rijÞ ¼ GsðT ; 0Þ þ 12SijklrijrklV s ¼ lfN s ðA:2Þ
where Sijkl are the usual elastic compliances andV s the molar volume of the solid under zero
stress.
At the same the Gibbs free energy of a fluid
(hydrostatic pressure P ) in equilibrium with a solid
can be written
GfðT ; PÞ ¼ GfðT ; 0Þ � 12vP 2V f ¼ lfN f ðA:3Þ
where now N f is the number of moles of liquid
transferred to the solid and v is the compressibility
of the fluid, V f its molar volume at zero pres-
sure. Let us note that when capillary effects are
neglected the Gibbs energy change due to thesolid/fluid transformation reads DG ¼ GfðT ; PÞ�GsðT ; rijÞ ¼ lfðN f � N sÞ. Thus the solid melts
when N f � N s < 0 that means for DG < 0. The
equilibrium state is thus described by DG ¼ 0, and
G thus is the appropriate thermodynamic poten-
tial for studying the solid/fluid transition under
stress.
P. M€uuller, R. Kern / Surface Science 529 (2003) 59–94 87

Appendix B. Mechanical equilibrium of homoge-
neously strained slab
In the case of a biaxially strained cubic solid
slab (0 0 1) (e11 ¼ e22 ¼ m) covered by a fluidcharacterised by its hydrostatic pressure P the
strain and stress tensors of the solid s read:
½e ¼m 0 0
0 m 0
0 0 e33
0B@1CA and
½r ¼r11 0 0
0 r11 0
0 0 r33
0B@1CA
where owing to mechanical equilibrium conditions
(see Appendix A) at the fluid/solid interface there
is r33 ¼ �P . No body forces are considered(see remark in Appendix A). The unknown data
e33 and r11 may be obtained from Hooke�s law
[75]: e11 ¼ 1E ½r11 � mðr11 þ r33Þ and e33 ¼ 1
E ½r33 �mðr11 þ r11Þ with E the Young�s modulus and m the
Poisson�s ratio in the (0 0 1) plane. 6 Thus using
e11 ¼ m and r33 ¼ �P one obtains:
e33 ¼ � 2mm1 � m
� PE
1 � m � 2m2
1 � m
and
r11 ¼Em� mP
1 � m
Thus the free elastic energy density 12rijeij reads:
Wel ¼Em2
1 � mþ P 2
2Eð1 þ mÞð1 � 2mÞ
1 � mðB:1Þ
At the same the strained volume
V sdef ¼ V sð1 þ eiiÞ
¼ V s 1
�þ 2m
1 � 3m1 � m
� PEð1 þ mÞð1 � 2mÞ
1 � m
�ðB:2Þ
where V s is the undeformed molar volume of the
solid. One distinguishes clearly in (B.1) and (B.2)
the effect of misfit strain m and that of hydrostatic
pressure P where there are no cross terms. Notice
that when units of E are in erg cm�3 and 1010 <E < 1012 as usually, since 1bar ¼ 1:033 Atm ¼ 106
erg cm�3, there is for P ¼ 1 bar P=E ¼ 10�4–10�6 avery small correction to all quantities e33; rk, Eqs.
(B.1) and (B.2).
Appendix C. Surface energy, adhesion energy and
interfacial energy of finite size planar slabs
Consider not only short range ‘‘chemical in-teractions’’ but also longer ranged ones as �r�6
dispersion forces or ð�1=rÞe�r=fa for screened
Coulomb forces [86]. To the chemical bonding
between the layers of a slab of thickness d there
adds a d�3 or a e�d=fa contribution. A slab of ni
layers squeezed between two semi-infinite parts of
the same matter i and extracted from there has
thus an excess energy equal to twice the surfaceenergy 7 ci of the finite slab and which reads for
example for screened Coulomb forces
ciðniÞ ¼ Ki
Xni�1
n¼0
e�n=fi ¼ Ki1 � e�ni=fi
1 � e�1=fi
The material constant Ki characterising the
chemical interactions can be obtained from as-
ymptotic considerations since when the slab be-comes very thick its excess energy has to tend
towards the usual surface energy c1i . Thus there
is Ki=ð1 � e�1=fiÞ ¼ c1i so that the specific surface
energy of a thin slab of material i (ni layers) reads
[67,82,87]
ciðniÞ ¼ c1i ð1 � e�ni=fiÞ ðC:1Þ
6 The biaxial modulus for this (0 0 1) slab reads
E=ð1 � mÞjð1 0 0Þ ¼ C11 þ C12 � 2ðC212=C11Þ; mjð1 0 0Þ ¼ C12=ðC11 þ
C12Þ, Cij being the elastic moduli. For a (1 1 1) slab on a (1 1 1)
surface with ek ¼ m there is to substitute above E=ð1 � mÞjð1 1 1Þ ¼ð6ðC11 þ 2C12ÞC44Þ=ðC11 þ 2C12 þ 4C44Þ; mjð11 1Þ ¼ ðC11 þ 2C12 �2C44Þ=ð2ðC11 þC12 þC44ÞÞ [85]. Notice that for cubic crystals
the elastic moduli Cij are connected to the compliances moduli
Sij by C11 ¼ ðS11 þ S12Þ=ðS11 � S12ÞðS11 þ 2S12Þ, C12 ¼�S12=
ðS11 � S12ÞðS11 þ 2S12Þ and C44 ¼ 1=S44.
7 When there is only one index ci it means the interfacial
energy of i in respect to v (its vapour or vacuum).
88 P. M€uuller, R. Kern / Surface Science 529 (2003) 59–94

For r�6 dispersion forces one obtains similarly
ciðniÞ ¼Ki
2
Xni1
n�3 ¼ ac1iXni�1
1
n�3 with
1=a ¼X1
1
n�3 ¼ 1:202
A similar expression has been obtained for the
adhesion energy bi=j (the work for separating a
body i from a body j producing an unit area of iand j) of ni layers of material i coherently bond on
nj layers of material j [67]
bi=jðni; njÞ ¼ b1i=jð1 � e�ni=fiÞð1 � e�nj=fjÞ ðC:2Þ
Notice that the interfacial energy cijðni; njÞ between
the slab i and the slab j cannot be calculated di-rectly but has to be deduced from surface energies
ciðniÞ and adhesion energy bi=jðni; njÞ by the Dupr�eerelation [89]
cijðni; njÞ ¼ ciðniÞ þ cjðnjÞ � bi=jðni; njÞ ðC:3Þ
obtained by means of an energy cycle [78].For our purpose (see Fig. 2a where i ¼ l, j ¼ s
and k ¼ S) it is necessary to calculate the adhesion
energy bi=jk of a material i (ni layers) over a com-
posite slab constituted by nj layers of material jover nk layers of material k noted iðniÞ=jðnjÞ=kðnkÞ.Such an adhesion energy can be obtained by a
same straightforward summation procedure. Nev-
ertheless it can also be obtained more easily bymeans of a thermodynamic process where the
three composite slab iðniÞ=jðnjÞkðnkÞ is obtained as
a combination of single 2-composite slabs as:
iðniÞ=jðnjÞkðnkÞ ¼ iðniÞ=jðnjÞ þ iðni þ njÞ=kðnkÞ
� iðnjÞ=kðnkÞ
with relations of type (C.2) valid for binary slabs.
Thus there is
bi=jkðni; nj; nkÞ ¼ b1i=jð1 � e�ni=fiÞð1 � e�nj=fjÞ
þ b1i=kð1 � e�ðni=fjþnj=fjÞÞð1 � e�nk=fk Þ
� b1i=kð1 � e�nj=fjÞð1 � e�nk=fk Þ
This expression can be rearranged and thus reads:
bi=jkðni; nj; nkÞ ¼ b1i=jð1 � e�ni=fiÞð1 � e�nj=fjÞ
þ b1i=ke
�nj=fjð1 � e�ni=fiÞ
� ð1 � e�nk=fk Þ ðC:4Þ
Notice that relation (C.4) is written for the se-
quence i=jk so that the total surface and interfacial
free enthalpies written in the same sequence read
for the three composite slab:
gsurfðni; nj; nkÞ ¼ ciðniÞ þ ci=jkðni; nj; nkÞþ cj=kðnj; nkÞ þ ckðnkÞ ðC:5Þ
where ci=jkðni; nj; nkÞ is the interfacial energy of
material i (ni layers) onto the composite material
jðnjÞ=kðnkÞ and cj=kðnj; nkÞ the interfacial energy of
jðnjÞ onto kðnkÞ. Using Dupr�ee�s Eq. (C.3) under theform
ci=jkðni; nj; nkÞ ¼ ciðniÞ þ cjðnjÞ � bi=jkðni; nj; nkÞðC:6Þ
cj=kðnj; nkÞ ¼ cjðnjÞ þ ckðnkÞ � bj=kðnj; nkÞ ðC:7Þand relations of type (C.4), (C.2) and (C.1) one
obtains for the total free enthalpy (C.5) of the
three component slab:
gsurfðni; nj; nkÞ ¼ ð2c1i � b1i=jÞð1 � e�ni=fiÞ
þ ð2c1j � b1j=kÞð1 � e�nj=fjÞ
þ b1i=je
�nj=fjð1 � e�ni=fiÞþ b1
j=ke�nk=fk ð1 � e�nj=fjÞ
� b1i=ke
�nj=fjð1 � e�ni=fiÞ� ð1 � e�nk=fk Þþ 2c1k ð1 � e�nk=fk Þ ðC:8Þ
Finally for the system of Fig. 2a, identifying the
phases l, s, S respectively by i ¼ l, j ¼ s, k ¼ S and
putting nk ! 1 there is
gsurfðnl; nsÞ ¼ 2cs þ ð2cl � bl=sÞð1 � e�nl=flÞþ ð2cs � bs=SÞð1 � e�ns=fsÞþ ðbl=s � bl=SÞe�ns=fsð1 � e�nl=flÞ
ðC:9Þ
We omit in (C.9) and the following the subscript1 but all the surface energies ci and adhesion
P. M€uuller, R. Kern / Surface Science 529 (2003) 59–94 89

energies bij are meant to be the usual macroscopic
quantities. Relation (C.9) is used in Section 3
formula (7). Notice that when solid s becomes
thick (Fig. 1a) then (C.9) is only finite size de-
pendent upon the liquid film nl=fl and formula(C.9) reduces to:
gsurfðnl; ns ¼ 1Þ ¼ ð2cl � blsÞð1 � e�nl=flÞ þ Cte
ðC:10ÞA useful planar system is when i is a thick cover
glass (cg) over the melt of thickness nj ¼ nl of the
solid k ¼ s of the semi-infinite crystal nk ¼ns ! 1. Making these transformations in (C.8)
there is:
gsurfðnl; ns ¼ 1Þ ¼ ð2ccg � bl=cgÞ
þ ð2cl � bl=SÞð1 � e�nl=flÞ
þ bl=cge�nl=fl � bs=cge
�nl=fl þ Cte
ðC:11Þ
Relation (C.9) is used in Section 3.1.1 formula
(130).
The general relation (C.8) when i ¼ k and
ni ¼ nk 6¼ nj gives also the surface free enthalpy of
a non-supported solid slab j ¼ s of thickness ns
covered on both faces by a liquid i ¼ k ¼ l of nl
layers so that the total number of layers is
n ¼ ns þ 2nl. Thus there is:
Gsurfðnl; ns; nlÞ ¼ 4clð1 � e�nl=flÞ
þ 2csð1 � e�ns=fsÞ
� 2bl=sð1 � e�nl=flÞð1 � e�ns=fsÞ
� 2c‘e�ns=fsð1 � e�nl=flÞ2 ðC:12Þ
Notice that when the solid vanishes ns ! 0,
Gsurfðnl; 0; nlÞ ¼ 2clð1 � e�n=flÞ, when the slab is drynl ! 0, Gsurfð0; ns; 0Þ ¼ 2csð1 � e�n=fsÞ what is quite
consistent. Relation (C.7) has to be used for cal-
culations of the type Saka€ıı [25] we mentioned in
the introduction.
It may be that such a thin free standing slab is
not easy to handle. Putting a thick cover glass on
each face (C.7) has to be changed by substituting
only cl by ccg=l; cs by ccg=s and adding 2ccg.
Appendix D. Crystallising back a finite layer of
liquid on a substrate (Fig. 2a)
The activation barrier for crystallisation (we
discuss in Section 4.1) at T ¼ Tl reads
DGl!sðT ¼ TlÞ ¼ GðTl; ns ¼ n� nl;max; nl ¼ nl;maxÞ� GðTl; ns ¼ 0; nl ¼ nÞ ðD:1Þ
where Tl, the temperature beyond which the ma-terial A is completely melted, is given by (16) and
nl;max the number of liquid layer at T ¼ Tl is given
by (13). Incorporating then expressions (14a) and
(13) in the expression of the activation barrier
DGl!sðT ¼ TlÞ yields:
DGl!sðT ¼ TlÞ ¼Navoa2
�� n
2
�þ ln
UC
� ���ðC�Ue�nÞ�Ue�n þU
Ce�n=2
þðbl=s �bl=SÞf ðnÞ� ð2cs � csSÞgðnÞ�
where
f ðnÞ ¼ 1 � e�n � CU
e�n=2 � CU
� �2
e�ðn=2Þ2
and
gðnÞ ¼ 1 � CU
e�n=2
and where furthermore we use DUm ¼ �TmDSm.
Thus for great enough values of n so that e�n � 1,
ðU=CÞe�n=2 � 1 and ðC=UÞe�n=2 � 1, there is:
DGl!sðT ¼ TlÞ / Navob2Cn2
�þ 1�
ðD:2Þ
Appendix E. Surface energy of a solid and its melt
of simple substances
Miedema et al. [43–45] have computed on manyexamples of simple pure metals a useful empirical
relation between the mean surface energy of a solid
and its liquid at zero K and Pluis et al. [11] near
the melting point. Surface energies of metals are
anisotropic but only about 2–3% and surface en-
ergy of liquid are easily measured. We give here a
general approximate derivation for non-metals.
Condensed phases i ¼ l; s have surface specific
90 P. M€uuller, R. Kern / Surface Science 529 (2003) 59–94

energies ci;v in respect to their very diluted vapour
v defined according to Born and Stern [88] by
ci;v ¼ Wi;v=2Siv that means the reversible work of
separation Wiv along a planar surface Siv in two
parts. This work represents also bonds to be bro-
ken so that Wiv ¼ kDUiv is proportional to thephase transition energy DUiv ¼ Uv � Ui of atoms
leaving from i ¼ s; l to the vapour v. Therefore
cs=cl ¼ ðDUsv=DUlvÞðVl=VsÞ2=3where Vl and Vs are
the molar volumes of the condensed phases s and l,
DUsv the sublimation energy of the solid and DUlv
the vaporisation energy of the liquid. Since one has
DUsv ¼ DUsl þ DUlv ¼ DUm þ DUvap where m and
vap means melting and vaporisation, at a commontemperature T ¼ Tm (the melting temperature) one
has:
cs=cljTm¼ ð1 þ DUmðTmÞ=DUvapðTmÞÞðVl=VsÞ2=3
Tm
ðE:1Þ
relation which contains in principle known bulk
data.With some less accuracity this relation may
become a numerical rule. At the melting point
DUm ðTmÞ ¼ TmDSmðTm) where positional melting
entropy is according to the Matignon�s rule
2 < DSmðTmÞ6 3 cal mole�1 deg�1 and DUðTbÞ ¼TbDSðTbÞ, with according to the Trouton�s rule
DSvapðTbÞ ¼ 22 cal mole�1 deg�1 at the boiling
point Tb (where the vapour pressure is 1 Atm).Since DUvapðTmÞ ¼ DUvapðTbÞ �
R TbTm
Dcvap dT with
Dcvap ¼ cvapp � cs
p �R=2 in the high temperature
limit, even for Tm < Tb < 2Tm taken as extrema this
correction only amounts to less than 4% and can
be neglected. Simple usual substances increase
their volume by 5–10% when melting. From these
extrema one has with (E.1)
cs=cljTm¼ ð1 þ TmDSmðTmÞ=TbDSvapðTmÞÞðVl=VsÞ2=3
ðE:2Þ
or numerically 1:09 < cs=cl < 1:17.
For explicit calculations and when data are
available we will use relation (E.2). For example
for CH4 at Tm ¼ 90 K there is from [60]
DSmðTmÞ ¼ 2:48, DSvapðTmÞ ¼ 17:4 calmole�1 deg�1,
Tb ¼ 112 K, VlðTmÞ ¼ 36:5 and VsðTmÞ ¼ 32:4cm3 mole�1 so that cs=cljTm
¼ 1:18.
For Kr at Tm ¼ 116 K there is from [60]
DSmðTmÞ¼3:37, DSvapðTmÞ¼18:01 calmole�1 deg�1,
Tb¼120 K, VlðTmÞ¼34:7 and VsðTmÞ¼ 29:8cm3 mole�1 so that cs=cljTm
¼1:30.
Appendix F. Shuttleworth� relations and reference
state
The work necessary to create a surface (area
A0) of a material A (of surface energy cA and
surface stress sA) then to deform this surface from
A0 to A reads DF ¼ cAA0 þ sAðA�A0Þ. De-
fining then the isotropic in-plane strain e byA¼A0ð1þeÞ2
, one obtains DF ¼ðcAþ2esAÞA0 ðcAþ2eðsA�cAÞÞA. The first expression of DF is
said to be written in Lagrangian coordinates that
means in the non-deformed reference state. Within
this reference state the Shuttleworth relation reads
oci=oe¼si. The second expression is written in
Eulerian coordinates that means in the deformed
reference state. In this case the Shuttleworth re-lation reads oci=oe¼si�ci (see [63,74] for more
details).
Appendix G. Inhomogeneous body fields in the
composite slab
The excess field felt by a layer in a compositematerial (l/s/S) in respect to the same layer in a
continuous material can be obtained from the
difference of interactions between a layer located
at the distance z from the substrate S on which is
deposited the composite slab (s/l) and a equivalent
layer located at the same level but in a continuous
material. Since the so-called z-layer can be in the
liquid or in the solid part of the composite slab,there are two excess fields XlðzÞ and XsðzÞ ac-
cording to the nature (liquid or solid) of the z-layer.
These long range interactions between a layer
and the whole of the material can be calculated as
in Appendix C by summation of screened Cou-
lomb or van der Waals forces. Nevertheless we
have to distinguish two cases according to the lo-cation of the z-layer.
P. M€uuller, R. Kern / Surface Science 529 (2003) 59–94 91

• For a liquid layer (z > ns) the summation of all
the involved interactions reads (with fs ¼ fl ¼ f):
xlðzÞ ¼ � Kll
Xz�ns
0
e�i=f
"þ Kls
Xz
z�ns
e�i=f
þ KlS
Xzþns
z
e�i=f
#þ Kll
Xnlþns�z
0
e�i=f ðG:1Þ
where the first term corresponds to the total
interaction between the z-layer and all the un-
derneath layers (liquid for 0 < i < z� ns, solid
for z� ns < i < z and substrate for z < i <zþ ns), the constants Kab describing the chemi-
cal interaction between materials a and b(a; b ¼ S, s or l). The last term corresponds to
the interaction between the z-layer and the
upper liquid layers. Since the attraction by the
upper layers and the underneath layers are in
opposite directions, these two terms have not
the same sign. In other words there is some
compensation in between the upper and the
underneath attraction.This interaction field has to be compared to the
interaction field xl;0ðzÞ felt by a liquid layer at z in
a continuous liquid environment having the same
geometry (ns þ nl þ nS layers). This field can sim-
ply be obtained by writing Kab ¼ Kll in formula
(G.1) so that there is:
xl;0ðzÞ ¼ �Kll
Xzþns
0
e�i=f þ Kll
Xnlþns�z
0
e�i=f ðG:2Þ
The excess field felt by the liquid z-layer in the
composite slab ðS=s=lÞ in respect to the same layer
in a continuous liquid material (ns þ ns þ nl layers)
can thus be written XlðzÞ ¼ xlðzÞ � xl;0ðzÞ. Calcu-
lating thus the summation and using the sameprocedure as in Appendix C to identify the mate-
rial constant Kab, that gives:
Kaa=ð1 � e�1=fÞ ¼ 2c1a and
Kab=ð1 � e�1=fÞ ¼ �b1a=b ðG:3Þ
there is:
XlðzÞ ¼ e�z=fb2clðens=f � e�ns=fÞ � bl=sð1 � ens=fÞ� bl=Sðe�ns=f � 1Þc; ns < z < ns þ nl
ðG:4Þ
Where for the sake of simplicity we omit the 1subscripts.
• For a solid layer ðz < nsÞ the summation of the
interactions between the z-layer and the whole
of the material reads:
xsðzÞ ¼ � Kss
Xz
0
e�i=f
"þ KsS
Xzþns
z
e�i=f
#
þ Kss
Xns�z
0
e�i=f
"þ Ksl
Xnsþnl�z
ns�z
e�i=f
#ðG:5Þ
where the first term again corresponds to the
interaction with all the underneath layers (s for0 < i < z, S for z < i < zþ ns). It opposes to the
second term which corresponds to the inter-
action with all the upper layers (solid for
0 < i< ns � z, liquid for ns � z< i< ns þ nl � z).The field felt by the same z-layer in a continu-
ous solid material having ns þ ns þ nl layers
again is simply obtained by substituting Kss for
Kab in (G.5) and thus reads:
xs;0ðzÞ ¼ �Kss
Xnsþnl�z
0
e�i=f þ Kss
Xzþns
0
e�i=f ðG:6Þ
The excess field felt by the solid z-layer in the
composite slab (S/s/l) in respect to the same
layer in a continuous solid material (ns þ ns þ nl
layers) can thus be written XsðzÞ ¼ xsðzÞ�xs;0ðzÞ which gives after summation and iden-
tification of the material constant:
XsðzÞ ¼ ð2cs � bs=SÞe�z=fð1 � e�ns=fÞ�ð2cs � bs=lÞe�ðns�zÞ=fð1 � e�nl=fÞ
XSðzÞ ¼ ðbl=S � bs=SÞe�ðjzjþnsÞ=f
þð2cs � bl=SÞe�ðjzjþnsþnlÞ=f
�ð2cs � bl=SÞe�jzj=f
8>>>>>>><>>>>>>>:ðG:7Þ
References
[1] J.F. van der Veen, B. Pluis, A.W. Denier, van der Gon, in:
R. Vanselov, R.F. Hove (Eds.), Chemistry and Physics of
Solid Surfaces, vol. 7, Springer, Berlin, 1998, p. 455.
[2] J.W. Frenken, H.M. van Pinxteren, The chemical physics
of solid surfaces and heterogeneous catalysis, in: D. King,
92 P. M€uuller, R. Kern / Surface Science 529 (2003) 59–94

D.P. Woodruff (Eds.), Phase Transitions and Adsorbate
Restructuring and Metal surfaces, vol. 7, Elsevier, Am-
sterdam, 1993, Chapter 7.
[3] J.G. Dash, Contemp. Phys. 30 (1989) 89.
[4] D. Nenow, Prog. Crystal Growth Charact. 9 (1984) 185.
[5] B.D. Swanson, H. Stragier, D.Y. Tweet, L.B. Sorensen,
Phys. Rev. Lett. 62 (1989) 909.
[6] X.Z. Wu, E.B. Sirota, S.K. Sinha, B.M. Ocko, M. Deutsch,
Phys. Rev. Lett. 70 (1993) 958.
[7] B. Pluis, A.W. Denier van der Gon, J.F. van der Veen, A.J.
Riemersme, Surf. Sci. 239 (1990) 265.
[8] B. Pluis, D. Frenkel, J.F. van der Veen, Surf. Sci. 239
(1990) 282.
[9] A.A. Chernov, V.A. Yakolev, Langmuir 3 (1987) 635.
[10] D.-M. Zhu, J.G. Dash, Phys. Rev. Lett. 60 (1988) 432.
[11] B. Pluis, A.W. Denier van der Gon, J.F. van der Veen,
Phys. Rev. B 40 (1989) 1353.
[12] A.A. Chernov, L.V. Mikhev, Phys. Rev. Lett. 60 (1988)
2488.
[13] A.A. Chernov, L.V. Mikhev, Physica A 157 (1989) 1042.
[14] A. Pavlovska, D. Dobrev, E. Bauer, Surf. Sci. 314 (1994)
341.
[15] R. Kofman, P. Cheyssac, R. Garnigas, Y. Lerah, G.
Deutscher, Physica A 157 (1989) 631.
[16] R. Kofman, P. Cheyssac, A. Aouay, Y. Lereah, G.
Deutscher, T. Ben-David, J.M. Pernisson, A. Bourret,
Surf. Sci. 303 (1994) 231.
[17] H. Saka€ıı, Surf. Sci. 351 (1996) 285.
[18] D.M. Zhu, J.G. Dash, Phys. Rev. Lett. 57 (1986) 2959.
[19] M. Bienfait, Europhys. Lett. 4 (1987) 79.
[20] D.M. Zhu, J.G. Dash, Phys. Rev. B 38 (1988) 11673.
[21] M. Bienfait, J.M. Gay, H. Blank, Surf. Sci. 204 (1988) 331.
[22] J.M. Gay, J. Suzanne, J.M. Coulomb, Phys. Rev. B 41
(1990) 11346.
[23] D.B. Pengra, D.-M. Zhu, J.G. Dash, Surf. Sci. 245 (1991)
125.
[24] M.S. Peterson, M.J. Lysenkand, D.L. Goodstein, Phys.
Rev. B 40 (1989) 4938.
[25] H. Saka€ıı, Surf. Sci. 348 (1996) 387.
[26] R. Kern, in: H. Arend, J. Hulliger (Eds.), Crystal Growth
in Science and Technology, Plenum Press, New York,
London, 1989, pp. 143–165.
[27] R. Lipowsky, W. Speth, Phys. Rev. B 28 (1983) 3983.
[28] R. Lipowski, Ferroelectrics 73 (1987) 69.
[29] G.F. Bolling, Acta. Met. 16 (1968) 1147.
[30] J.K. Kristensen, R.M. Cotterill, Phil. Mag. 36 (1977) 437.
[31] R. Lacmann, I.N. Stranski, J. Cryst. Growth 13/14 (1972)
236.
[32] T. Kuroda, R. Lacmann, J. Cryst Growth 56 (1952) 189.
[33] J.W. Gibbs, in: Scientific Papers, vol. 1, Longman,
London, 1906, pp. 184–218.
[34] F.C. Larch�ee, J.W. Cahn, Acta. Met. 33 (1985) 331.
[35] J. Bohm, Cr. Res. Tech. 16 (1981) 275.
[36] D.J. Bottomley, Jpn. J. Appl. Phys. 36 (1997) 1464.
[37] D.J. Bottomley, Appl. Phys. Lett. 72 (1998) 783.
[38] D.J. Bottomley, J. Vac. Sci. Tecnol. B 17 (2) (1999) 259.
[39] D.J. Bottomley, Jpn. J. Appl. Phys. 39 (2000) 4604.
[40] F. Rosei, P. Raitern, Appl. Surf. Sci. 1950 (2002) 16.
[41] Y. Furukava, I. Ishirakawa, J. Cryst. Growth 128 (1993)
1137.
[42] D. Beaglehole, P. Wilson, J. Phys. Chem. 98 (1994) 8096.
[43] A.R. Miedema, R. Boom, Z Metallk. 69 (1978) 183.
[44] A.R. Miedema, Z. Metallk. 69 (1978) 287.
[45] A.R. Miedema, R.J.A. den Broeder, Z. Metallk. 70 (1979)
14.
[46] R. Kern, in: I. Sunagawa (Ed.), Morphology of Crystals,
Part A, Reidel Publishing Co., 1987, pp. 79–206.
[47] K.A. Wolf, in: Physik and Chemie der Oberfl€aacken, vols. I
and II, Springer, Berlin, 1957.
[48] A.S. Skapski, Acta Met. 4 (1956) 576.
[49] R.H. Ewing, J. Cryst. Growth 11 (1971) 221.
[50] R.H. Ewing, Phil. Mag. 23 (1942) 779.
[51] B. Mutaftschiev, J. Zell, Surf. Sci. 12 (1968) 317.
[52] P.G. deGennes, Rev. Modern Phys. 57 (3, Part 1) (1985)
827.
[53] P. Stolze, J.K. Norskov, W. Landman, Surf. Sci. Lett. 289
(1989) L693.
[54] J.H. Singleton, G.D. Halsey, J. Chem. Phys. 52 (1954)
1011.
[55] A. Thomy, X. Duval, J. Chem. Phys. (Fr) 66 (1969) 1966.
[56] Proceedings of CNRS Colloq. Two Dimensional Phases,
J. Phys. C4, 1977.
[57] K. Madih, Thesis University Aix Marseille III, 1986.
[58] K. Madih, B. Croset, J.P. Coulomb, H.J. Lauter, Euro-
phys. Lett. 8 (1989) 459.
[59] P. Korpi, E. L€uuscher, R. Crawford, in: M.L. Klein, J.A.
Venables (Eds.), Rare Gas Solids, vol. II, Academic Press,
New York, 1977, p. 815.
[60] Hdb, Encycl. Gas, Air Liquide, Elsevier, 1976.
[61] P. M€uuller, R. Kern, in: M. Hanb€uucken, J.P. Deville (Eds.),
Stress and strain in epitaxy: theoretical concepts, measure-
ments and applications, Elsevier, 2001, pp. 3–61.
[62] H. Ibach, Surf. Sci. Rep. 29 (1997) 193.
[63] J.W. Cahn, Acta Metall. 28 (1980) 1333.
[64] D. Sander, H. Ibach, Surface free energy and surface stress,
in: H. Bonzel (Ed.), Landolt-B€oornstein New Series vol. III
42 Physics of Covered Surfaces, 2002 (Chapter 4.4).
[65] D.A. Huse, Phys. Rev. B 29 (1984) 6985.
[66] R.C. Cammarata, Prog. Surf. Sci. 46 (1994) 1.
[67] P. M€uuller, O. Thomas, Surf. Sci. 465 (2000) L764.
[68] F.T. Gittes, M. Schick, Phys. Rev. B 30 (1984) 209.
[69] J. Krim, J.G. Dash, Surf. Sci. 162 (1985) 421.
[70] A.F. Andreev, Y.A. Kosevitch, J.E.T.P. 84 (1981) 761.
[71] J.A. Venables, J.L. Seguin, J. Suzanne, M. Bienfait, Surf.
Sci. 145 (1984) 345.
[72] J.A. Venables, P.S. Schabe-Retchkiman, J. de, Phys.
Colloq. C 4 (38) (1997) 105.
[73] M. Bienfait, in: Landolt-B€oornstein new series, vol. III 42 A,
Springer-Verlag, 2002, pp. 117–130.
[74] R. Shuttleworth, Proc. Roy. Soc. A 63 (1950) 444.
[75] L. Landau, E. Lifschitz, Th�eeorie de l��ee lasticit�ee, Mir
Moscou, 1967.
[76] E. Bauer, Z. Krist 110 (1958) 372.
[77] E. Bauer, Z. Krist 110 (1958) 395.
P. M€uuller, R. Kern / Surface Science 529 (2003) 59–94 93

[78] R. Kern, J.J. M�eetois, G. LeLay, in: Kaldis (Ed.), Current
Topics in Material Science, vol. 3, North Holland Pub-
lishing, Amsterdam, 1979, p. 140.
[79] A. Freitag, J.Z. Larese, Phys. Rev. B 62 (2000) 8360.
[80] S. Picaud, C. Girardet, T. Dukov, D. Lemoine, Phys. Rev.
B 60 (1999) 8333.
[81] R. Kern, in: B. Mutaftshiev (Ed.), Interfacial Aspects of
Phase Transformations, vol. 97 NATO Adv. Study Series
C, 1982, p. 287.
[82] P. M€uuller, R. Kern, Appl. Surf. Sci. 102 (1996) 6.
[83] K.H. Ploog, J. Cryst. Growth 237–239 (2002) 2028.
[84] Y. Ikuhara, P. Pirouz, A.H. Heuer, S. Yadavalli, C.P.
Flynn, Phil. Mag. A 70 (1944) 75.
[85] D. Sander, Rep. Prog. Phys. 62 (1999) 809.
[86] N.W. Ashcroft, N.D. Mermin, Solid State Physics, Saun-
ders College, Philadelphia, 1976, pp. 340–342.
[87] R. Kern, P. M€uuller, Bulg. Chem. Comm. 27 (1994) 24.
[88] M. Born, O. Stern, Ber. Berliner Akad. 48 (1919) 901.
[89] M. Dupr�ee, Th�eeorie m�eecanique de la chaleur, Gauthier-
Villars, Paris, 1869.
94 P. M€uuller, R. Kern / Surface Science 529 (2003) 59–94
Related Documents