SURFACE IgD PHENOTYPE OF ELECTROPHORETICALLY FRACTIONATED MOUSE LYMPHOID CELLS Francis Dumont,* Robert C. Habbersett, and Aftab Ahmed Department of lrnrnunology Merck, Sharp and Dohrne Research Laboratories Rahway, New lersey 07065 INTRODUCTION Preparative electrophoresis' enables one to physically fractionate cell suspen- sions on the basis of differences in electrophoretic mobility (EPM), a parameter that reflects the net cell-surface charge arising from the overall biochemical ' composition of the plasma membrane.' This technique has been efficiently used to separate mouse B- and T-lymphocytes, the former having on average a lower EPM than the Evidence indicating that the B-lymphocyte compartment is itself electrophoretically heterogeneous has also been obtained. Thus, the electro- phoretic separation of different types of progenitors for antibody-forming cells has been rep~rted.'.~ Also, ontogenetic studies have revealed developmental changes in the electrokinetic properties of B-cells' suggesting that subsets repre- senting stages in the B-cell differentiation pathway can be enriched by electro- phoresis. This report summarizes a series of studies initiated in order to evaluate further the electrophoretic separability of mouse B-cell subsets as defined by their surface phenotype with special reference to sIgD expression. We used single- and dual-parameter flow cytofluorometry (FCF) analyses' to quantitate the cell surface binding of fluorochrome-conjugated antibodies to IgD and to total Ig, IgM and Ia antigen on electrophoretically fractionated cells from mouse spleen and Peyer's patches. By this approach, we could delineate several electrophoretically distinct B-cell subsets differing in their sIgD phenotype and in their organ distribution. The influence of the CBA/N xid mutation" on these subsets in the spleen was also investigated. MATERIALS AND METHODS Mice CBA/J and NZB/BINJ mice were obtained from the Jackson Laboratories (Bar Harbor, Me). CBA/N x DBA/Z (CNDZ) and DBA/Z x CBA/N (DZCN) males were obtained from Dominion Laboratories (Dublin, Va). NZB XY and NZB xid Y (9th to 11th backcross generations) mice were a gift from Dr. Eric Gershwin (Davis University, Ca). *On leave of absence from the Unit of Experimental Cancerology. INSERM U95, Vandoeuvre les Nancy, France. 184 0077-8923/82/0399-0184 $01.75/0 0 1982, NYAS

Welcome message from author
This document is posted to help you gain knowledge. Please leave a comment to let me know what you think about it! Share it to your friends and learn new things together.
Transcript
SURFACE IgD PHENOTYPE OF ELECTROPHORETICALLY FRACTIONATED MOUSE
LYMPHOID CELLS
Francis Dumont,* Robert C. Habbersett, and Aftab Ahmed
Department of lrnrnunology Merck, Sharp and Dohrne Research Laboratories
Rahway, New lersey 07065
INTRODUCTION
Preparative electrophoresis' enables one to physically fractionate cell suspen- sions on the basis of differences in electrophoretic mobility (EPM), a parameter that reflects the net cell-surface charge arising from the overall biochemical ' composition of the plasma membrane.' This technique has been efficiently used to separate mouse B- and T-lymphocytes, the former having on average a lower EPM than the Evidence indicating that the B-lymphocyte compartment is itself electrophoretically heterogeneous has also been obtained. Thus, the electro- phoretic separation of different types of progenitors for antibody-forming cells has been rep~rted.'.~ Also, ontogenetic studies have revealed developmental changes in the electrokinetic properties of B-cells' suggesting that subsets repre- senting stages in the B-cell differentiation pathway can be enriched by electro- phoresis.
This report summarizes a series of studies initiated in order to evaluate further the electrophoretic separability of mouse B-cell subsets as defined by their surface phenotype with special reference to sIgD expression. We used single- and dual-parameter flow cytofluorometry (FCF) analyses' to quantitate the cell surface binding of fluorochrome-conjugated antibodies to IgD and to total Ig, IgM and Ia antigen on electrophoretically fractionated cells from mouse spleen and Peyer's patches. By this approach, we could delineate several electrophoretically distinct B-cell subsets differing in their sIgD phenotype and in their organ distribution. The influence of the CBA/N xid mutation" on these subsets in the spleen was also investigated.
MATERIALS AND METHODS
Mice
CBA/J and NZB/BINJ mice were obtained from the Jackson Laboratories (Bar Harbor, Me). CBA/N x DBA/Z (CNDZ) and DBA/Z x CBA/N (DZCN) males were obtained from Dominion Laboratories (Dublin, Va). NZB XY and NZB xid Y (9th to 11th backcross generations) mice were a gift from Dr. Eric Gershwin (Davis University, Ca).
*On leave of absence from the Unit of Experimental Cancerology. INSERM U95, Vandoeuvre les Nancy, France.
184 0077-8923/82/0399-0184 $01.75/0 0 1982, NYAS
Dumont eta].: Surface IgD Phenotype 185
Preparation of Cell Suspensions
Mice were killed by cervical dislocation. Spleens or Peyer's patches were gently teased in ice-cold RPMI 1640 medium (GIBCO, Grand Island, N.Y.) supplemented with 5% heat inactivated foetal calf serum (RS medium). Cell suspensions were passed through nylon mesh and washed in RS medium.
Cell Separation with Free-Flow Electrophoresis
Cell suspensions were gradually transfered into low ionic strength electropho- resis buffer and filtered through cotton wool. Cells were fractionated in a Hannig's free-flow electrophoresis apparatus model FF48 (Desaga, Heidelberg, Germany) as described elswhere."
4 Fluorescent Staining of the Cells
Rabbit anti-mouse IgD antiserum and rabbit anti-mouse IgM antiserum were obtained from Dr. Fred Finkelman. Monoclonal antibodies against mouse Ig5a (clone 10-4-22) and IaK (clone 11-54?) were purchased from Becton-Dickinson (Mountain View, Ca). Polyvalent rabbit anti-mouse Ig antiserum was obtained from Polysciences (Warrington, Pa). The monoclonal antibody 14G8 was a gift from Dr. Iohn Kung (NIH. Bethesda). These antibodies were either fluorescein (F1)-conjugated or biotin-conjugated. In the latter case, F1-, Rhodamine (Rh)- or Texas red (TxR)-avidin (Becton Dickinson) were used as second-step reagents. All these reagents were ultracentrifuged (100,000 g, 10 min.) immediately before use.
For single-color staining, 10' cells in 100 pl of RS medium containing 0.1% NaN, were incubated on ice for 30 minutes in the presence of saturating amounts of antibody. Cells were washed, and when required, were further incubated for 30 minutes with F1-avidin. Cells were again extensively washed, and were resuspended in phenol red-free Hanks medium (GIBCO) containing 5% foetal calf serum and 0.1% NaN,. For two-color analysis, cells were stained with a first biotinylated antibody as described above, using Rh- or TxR-avidin, and then were incubated with a second F1-conjugated antibody.
Flow Cytofluorometry (FCF) Analysis
Quantitative fluorescence measurements were performed on a FACS IV (Becton Dickinson, FACS Systems, Mountain View, Ca) equipped with two lasers (Models 164-05 and 164-01. Spectra-Physics). Single-parameter or dual-parame- ter (Fluorescence vs. light scatter) analysis of cells stained with F1-conjugated reagents was carried out with the Argon-ion laser operated at 300 mW. For single-color analysis, 20,000 viable cells, as identified by forward light scatter signals, were scored in each sample. The date were collected in 256 channel linear distributions, stored and processed in a PDP 11 computer (Digital Equip- ment, Maynard, Ma). The Krypton-ion laser, exciting at 568 nm and 120 mW was utilized in the two-color fluorescence analyses. Green and red fluorescence intensities were measured simultaneously on 100,000 individual cells. Correlated two parameter data were collected and stored in the computer as cell number in a
186 Annals New York Academy of Sciences
2 K > U
G s ' a LL
-I
d l
1
V
Lu
I-
Lu w 4
ELECTROPHORETIC FRACTION NUMBER FIGURE 1. Electrophoregram of CBA/J splenocytes showing the relative frequency of all
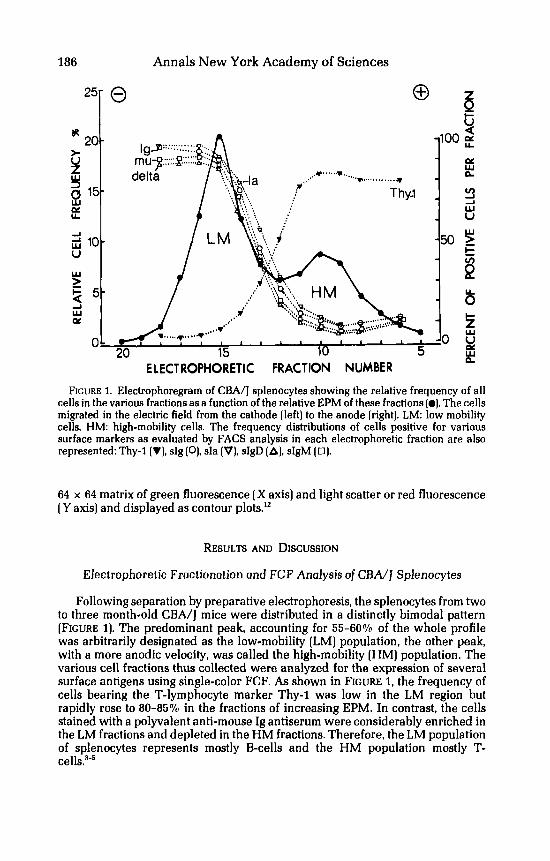
cells in the various fractions as a function of the relative EPM of these fractions (0). The cells migrated in the electric field from the cathode (left) to the anode (right). LM: low mobility cells, HM: high-mobility cells. The frequency distributions of cells positive for various surface markers as evaluated by FACS analysis in each electrophoretic fraction are also represented: Thy-1 (V), sIg (O), sIa [V), sIgD (A]. sIgM (0).
64 x 64 matrix of green fluorescence [ X axis] and light scatter or red fluorescence [ Y axis] and displayed as contour plots."
RESULTS AND DISCUSSION
Electrophoretic Fractionation ond FCF Analysis of CBMJ Splenocytes
Following separation by preparative electrophoresis, the splenocytes from two to three month-old CBA/] mice were distributed in a distinctly bimodal pattern [FIGURE 1). The predominant peak, accounting for 55-6070 of the whole profile was arbitrarily designated as the low-mobility (LM) population, the other peak, with a more anodic velocity, was called the high-mobility [HM] population. The various cell fractions thus collected were analyzed for the expression of several surface antigens using single-color FCF. As shown in FIGURE 1, the frequency of cells bearing the T-lymphocyte marker Thy-1 was low in the LM region but rapidly rose to 80435% in the fractions of increasing EPM. In contrast, the cells stained with a polyvalent anti-mouse Ig antiserum were considerably enriched in the LM fractions and depleted in the HM fractions. Therefore, the LM population of splenocytes represents mostly B-cells and the HM population mostly T-
Dumont eta].: Surface IgD Phenotype 187
Accordingly, cells bearing sIgD were found to segregate in the LM region of the electrophoretic profile. The distribution of these sIgD' cells paralleled that of sIg' cells detected with the polyvalent anti-Ig antiserum but in all fractions there was always 5-109'0 less of the former than of the latter cell type. The electropho- retic distribution of the other Ig isotype known to be expressed on most B-~e l l s , ' ~ i.e. IgM. was also almost identical to that of sIgD. The surface expression of Ia antigen, another B cell marker,I4 was also investigated by FCF analysis. The distribution of sIa+ cells was close to that of sIg' cells although the frequency of sIa+ cells slightly exceeded that of sIg' cells, especially in those fractions intermediate between the LM and HM peaks.
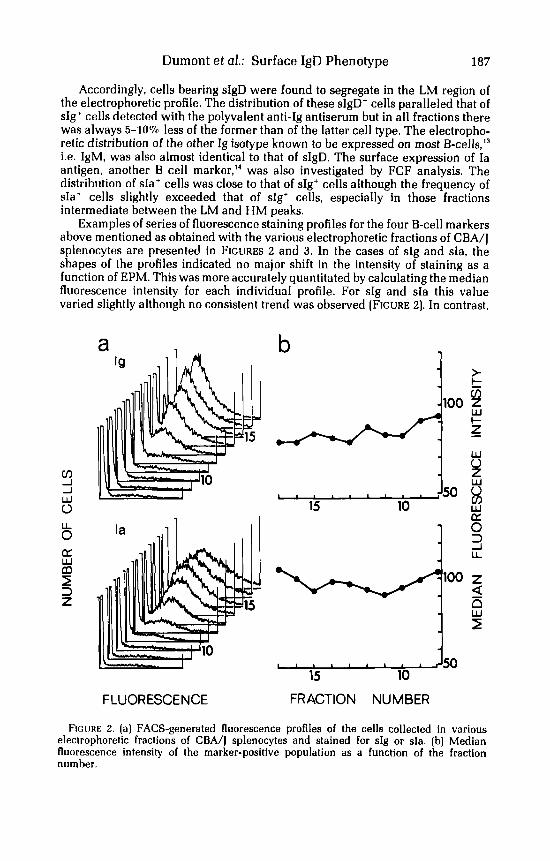
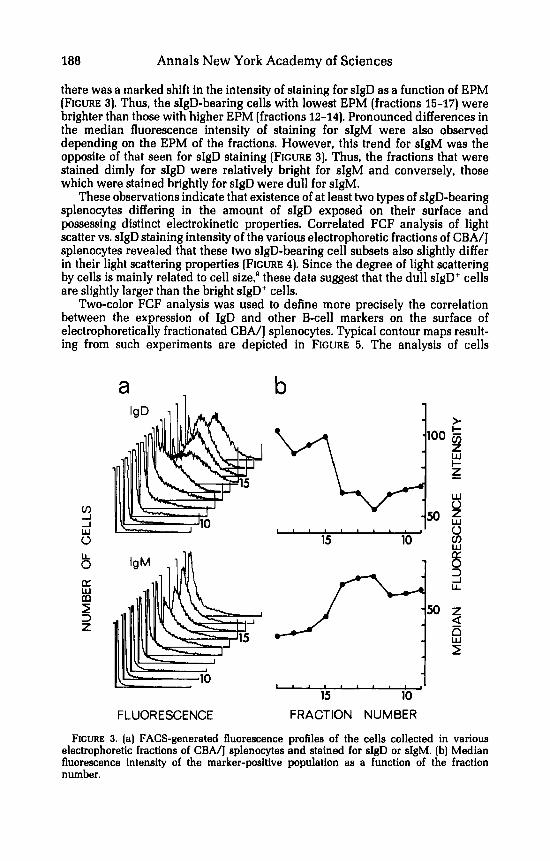
Examples of series of fluorescence staining profiles for the four B-cell markers above mentioned as obtained with the various electrophoretic fractions of CBA/J splenocytes are presented in FIGURES 2 and 3. In the cases of sIg and sIa, the shapes of the profiles indicated no major shift in the intensity of staining as a function of EPM. This was more accurately quantitated by calculating the median fluorescence intensity for each individual profile. For sIg and sIa this value varied slightly although no consistent trend was observed (FIGURE 2). In contrast,
a 1
1 I
b
I I I A50 lf5 15 10 w
15 10
FLUORESCENCE FRACTION NUMBER
F I C ~ I R E 2. (a] FACS-generated fluorescence profiles of the cells collected in various electrophoretic fractions of CBA/j splenocytes and stained for sIg or sIa. (b) Median fluorescence intensity of the marker-positive population as a function of the fraction number.
188 Annals New York Academy of Sciences
there was a marked shift in the intensity of staining for sIgD as a function of EPM [FIGURE 3). Thus, the sIgD-bearing cells with lowest EPM [fractions 15-17) were brighter than those with higher EPM [fractions 12-14). Pronounced differences in the median fluorescence intensity of staining for sIgM were also observed depending on the EPM of the fractions. However, this trend for sIgM was the opposite of that seen for sIgD staining [FIGURE 3). Thus, the fractions that were stained dimly for sIgD were relatively bright for sIgM and conversely, those which were stained brightly for sIgD were dull for sIgM.
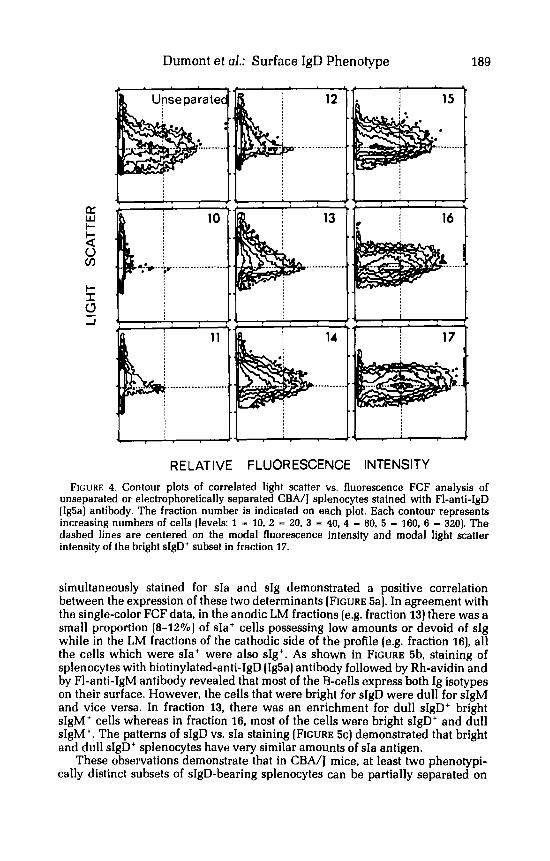
These observations indicate that existence of at least two types of sIgD-bearing splenocytes differing in the amount of sIgD exposed on their surface and possessing distinct electrokinetic properties. Correlated FCF analysis of light scatter vs. sIgD staining intensity of the various electrophoretic fractions of CBA/J splenocytes revealed that these two sIgD-bearing cell subsets also slightly differ in their light scattering properties (FIGURE 4). Since the degree of light scattering by cells is mainly related to cell size,* these data suggest that the dull sIgD' cells are slightly larger than the bright sIgD' cells.
Two-color FCF analysis was used to define more precisely the correlation between the expression of IgD and other B-cell markers on the surface of electrophoretically fractionated CBA/J splenocytes. Typical contour maps result- ing from such experiments are depicted in FIGURE 5. The analysis of cells
a b 1
FLUORESCENCE FRACTION NUMBER
FIGURE 3. (a) FACS-generated fluorescence profiles of the cells collected in various electrophoretic fractions of CBA/J splenocytes and stained for sIgD or sIgM. (b) Median fluorescence intensity of the marker-positive population as a function of the fraction number.
Dumont et al.: Surface IgD Phenotype 189
RELATIVE FLUORESCENCE INTENSITY FIGURE 4. Contour plots of correlated light scatter vs. fluorescence FCF analysis of
unseparated or electrophoretically separated CBA/I splenocytes stained with FI-anti-IgD (Ig5a) antibody. The fraction number is indicated on each plot. Each contour represents increasing numbers of cells (levels: 1 - 10. 2 - 20, 3 - 40, 4 - 80, 5 - 160, 6 - 320). The dashed lines are centered on the modal fluorescence intensity and modal light scatter intensity of the bright sIgD+ subset in fraction 17.
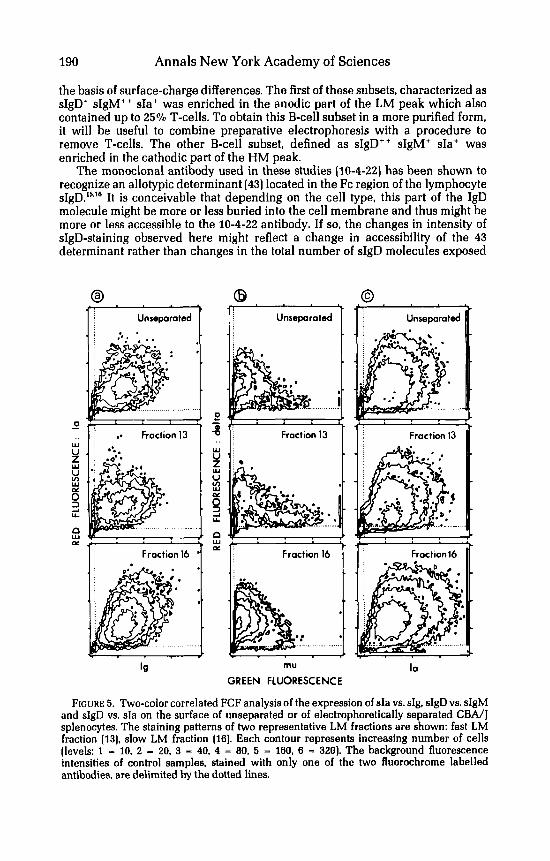
simultaneously stained for sIa and sIg demonstrated a positive correlation between the expression of these two determinants (FIGURE 5a). In agreement with the single-color FCF data, in the anodic LM fractions (eg. fraction 13) there was a small proportion (8-12%) of sIa+ cells possessing low amounts or devoid of sIg while in the LM fractions of the cathodic side of the profile ( e g fraction 161, all the cells which were sIa+ were also sIgt. As shown in FIGURE 5b, staining of splenocytes with biotinylated-anti-IgD (Ig5a) antibody followed by Rh-avidin and by F1-anti-IgM antibody revealed that most of the B-cells express both Ig isotypes on their surface. However, the cells that were bright for sIgD were dull for sIgM and vice versa. In fraction 13, there was an enrichment for dull sIgD' bright sIgM+ cells whereas in fraction 16, most of the cells were bright sIgD' and dull sIgM+. The patterns of sIgD vs. sIa staining (FIGURE 5c) demonstrated that bright and dull sIgD+ splenocytes have very similar amounts of sIa antigen.
These observations demonstrate that in CBA/J mice, at least two phenotypi- cally distinct subsets of sIgD-bearing splenocytes can be partially separated on
190 Annals New York Academy of Sciences
the basis of surface-charge differences. The first of these subsets, characterized as sIgD+ sIgM++ sIa+ was enriched in the anodic part of the LM peak which also contained up to 25% T-cells. To obtain this B-cell subset in a more purified form, it will be useful to combine preparative electrophoresis with a procedure to remove T-cells. The other B-cell subset, defined as sIgD" sIgM+ sIa+ was enriched in the cathodic part of the HM peak.
The monoclonal antibody used in these studies (10-4-22) has been shown to recognize an allotypic determinant (43) located in the Fc region of the lymphocyte SI~D.".'~ It is conceivable that depending on the cell type, this part of the IgD molecule might be more or less buried into the cell membrane and thus might be more or less accessible to the 10-4-22 antibody. If so, the changes in intensity of sIgD-staining observed here might reflect a change in accessibility of the 43 determinant rather than changes in the total number of sIgD molecules exposed
0 - Y V Z Y x 8 3
s
Y
LL
Lu cy
Fraction 16 Froctionl6
lo mu GREEN FLUORESCENCE
FIGURE 5. Two-color correlated FCF analysis of the expression of sIa vs. sIg, sIgD vs. sIgM and sIgD vs. sIa on the surface of unseparated or of electrophoretically separated CBA/J splenocytes. The staining patterns of two representative LM fractions are shown: fast LM fraction (13). slow LM fraction (161. Each contour represents increasing number of cells (levels: 1 - 10. 2 - 20, 3 - 40. 4 = 80, 5 - 160, 6 - 320). The background fluorescence intensities of control samples, stained with only one of the two fluorochrome labelled antibodies, are delimited by the dotted lines.
Dumont et a].: Surface IgD Phenotype 191
LJ z Lu
0' Lu
a L L
A A s
5 0 ; i v
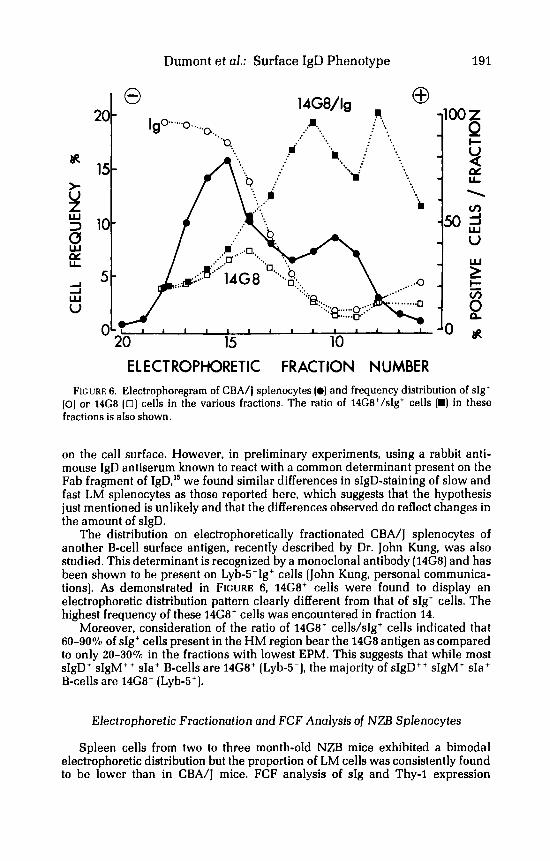
ELECTROPHORETIC FRACTION NUMBER FIGURE 6. Electrophoregram of CBA/J splenocytes (0) and frequency distribution of sIg'
(0) or 14G8 ( 0 ) cells in the various fractions. The ratio of 14G8'/sIg' cells (D) in these fractions is also shown.
on the cell surface. However, in preliminary experiments, using a rabbit anti- mouse IgD antiserum known to react with a common determinant present on the Fab fragment of IgD," we found similar differences in sIgD-staining of slow and fast LM splenocytes as those reported here, which suggests that the hypothesis just mentioned is unlikely and that the differences observed do reflect changes in the amount of sIgD.
The distribution on electrophoretically fractionated CBA/J splenocytes of another B-cell surface antigen, recently described by Dr. John Kung, was also studied. This determinant is recognized by a monoclonal antibody (14G8) and has been shown to be present on Lyb-s-Ig' cells (John Kung, personal communica- tions). As demonstrated in FIGURE 6, 14G8' cells were found to display an electrophoretic distribution pattern clearly different from that of sIg+ cells. The highest frequency of these 14G8' cells was encountered in fraction 14.
Moreover, consideration of the ratio of 14G8' cells/sIg+ cells indicated that 60-90% of sIg' cells present in the HM region bear the 14G8 antigen as compared to only 20-30% in the fractions with lowest EPM. This suggests that while most sIgD+ sIgM' ' sIa' B-cells are 14G8' (Lyb-5-), the majority of sIgD++ sIgM+ sIa+ B-cells are 14G8- (Lyb-5+).
Electrophoretic Fractionation and FCF Analysis of NZB Splenocytes
Spleen cells from two to three month-old NZB mice exhibited a bimodal electrophoretic distribution but the proportion of LM cells was consistently found to be lower than in CBA/J mice. FCF analysis of sIg and Thy-1 expression
192 Annals New York Academy of Sciences
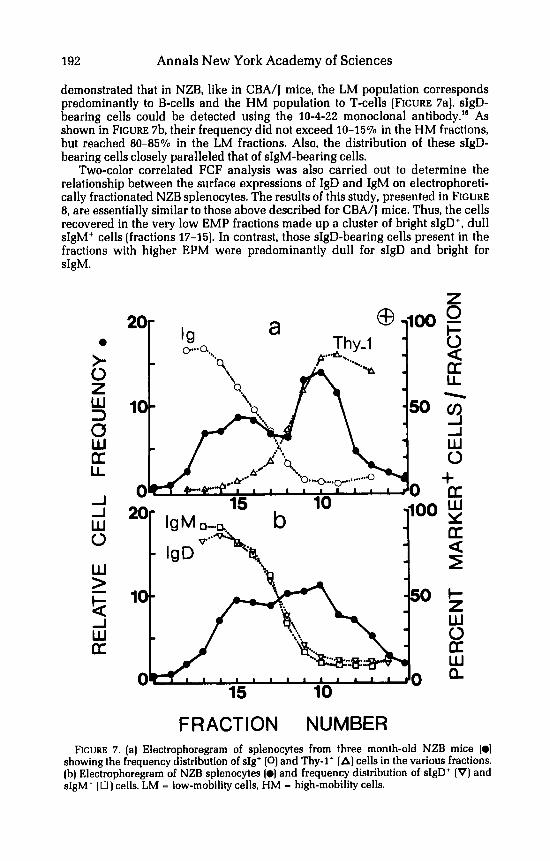
demonstrated that in NZB, like in CBA/J mice, the LM population corresponds predominantly to B-cells and the HM population to T-cells (FIGURE 7al. sIgD- bearing cells could be detected using the 10-4-22 monoclonal antibody." As shown in FIGURE 7b, their frequency did not exceed 10-1570 in the HM fractions, but reached 80-8570 in the LM fractions. Also, the distribution of these sIgD- bearing cells closely paralleled that of sIgM-bearing cells.
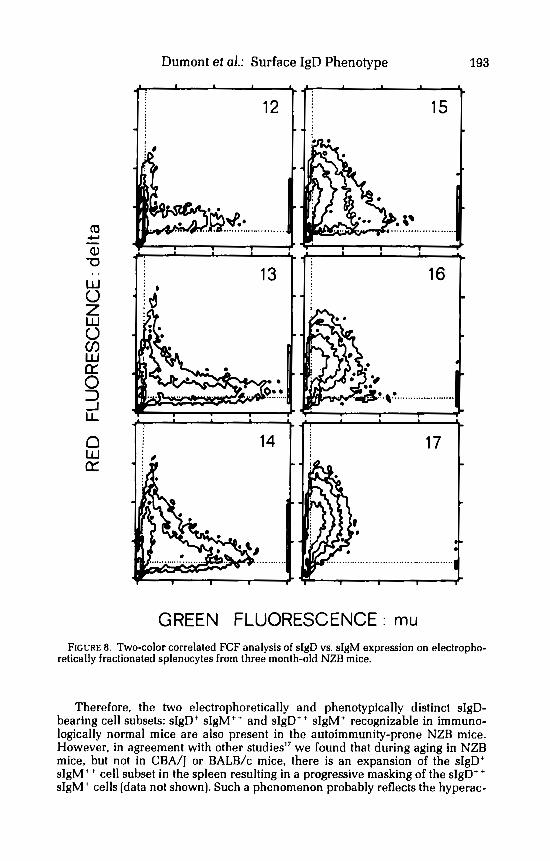
Two-color correlated FCF analysis was also carried out to determine the relationship between the surface expressions of IgD and IgM on electrophoreti- cally fractionated NZB splenocytes. The results of this study, presented in FIGURE 8, are essentially similar to those above described for CBA/J mice. Thus, the cells recovered in the very low EMP fractions made up a cluster of bright sIgD', dull sIgM+ cells (fractions 17-15). In contrast, those sIgD-bearing cells present in the fractions with higher EPM were predominantly dull for sIgD and bright for sIgM.
0
>. 0 z W 3 U w U LL
J J W 0
W >
J W U
- !z
FRACTION NUMBER FIGURE 7. (a] Electrophoregram of splenocytes from three month-old NZB mice (0)
showing the frequency distribution of sIg' (0) and Thy-1' [A) cells in the various fractions. (b) Electrophoregram of NZB splenocytes (01 and frequency distribution of sIgD+ (V) and sIgM' (0 ) cells. LM - low-mobility cells, HM - high-mobility cells.
Dumont et a].: Surface IgD Phenotype 193
.....................
............................
GREEN FLUORESCENCE : mu FIGURE 8. Two-color correlated FCF analysis of sIgD vs. sIgM expression on electropho-
retically fractionated splenocytes from three month-old NZB mice.
Therefore, the two electrophoretically and phenotypically distinct sIgD- bearing cell subsets: sIgD+ sIgM++ and sIgD' + sIgM+ recognizable in immuno- logically normal mice are also present in the autoimmunity-prone NZB mice. However, in agreement with other studied7 we found that during aging in NZB mice, but not in CBA/J or BALB/c mice, there is an expansion of the sIgD+ sIgM' + cell subset in the spleen resulting in a progressive masking of the sIgD+ +
sIgM' cells (data not shown). Such a phenomenon probably reflects the hyperac-
194 Annals New York Academy of Sciences
4 4
2 0. 0 c
L
w a
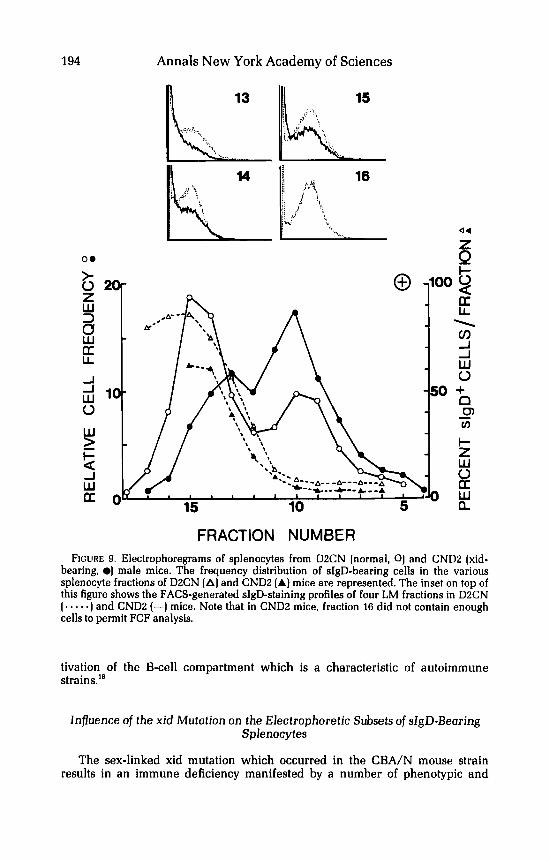
FRACTION NUMBER FIGURE 9. Electrophoregrams of splenocytes from D2CN (normal, 0) and CNDZ (xid-
bearing, 01 male mice. The frequency distribution of sIgD-bearing cells in the various splenocyte fractions of DZCN (A] and CND2 (A] mice are represented. The inset on top of this figure shows the FACS-generated sIgD-staining profiles of four LM fractions in D2CN (. - -. .) and CNDZ (-1 mice. Note that in CNDZ mice, fraction 16 did not contain enough cells to permit FCF analysis.
tivation of the B-cell compartment which is a characteristic of autoimmune strains."
Influence of the xid Mutation on the Electrophoretic Subsets of slgD-Bearing Splenocytes
The sex-linked xid mutation which occurred in the CBA/N mouse strain results in an immune deficiency manifested by a number of phenotypic and
Dumont et a].: Surface IgD Phenotype 195
functional abnormalities of B-cells." In many respects, the B-lymphocyte com- partment of adult mice carrying this mutation behaves like that of neonatal normal mice. Thus, xid mice lack a unique subpopulation of B-cells appearing late during ontogeny in normal mice and characterized by large amounts of sIgD and low amounts of s1gM.l'
In view of the above-mentioned findings indicating a relationship between the EPM of B-cells and their sIgD phenotype, it seemed of interest to investigate the electrokinetic properties of splenocytes from such xid mice. In a first series of experiments, we compared the electrophoretic distribution of splenocytes from xid-bearing CND2 males with that of splenocytes from normal DZCN males. FIGURE 9 demonstrates that while LM cells prevailed (63%) in the spleen of DZCN males, these LM cells accounted for less than 40% of CND2 male splenocytes. Such a decreased frequency of LM cells in CNDX is consistent with the known numerical B-cell deficiency of these mice." Moreover, although in both types of hybrids the HM population (T-cells) appeared electrophoretically similar, in CNDB mice, the LM population was usually shifted by two fractions towards a higher EPM (peak fraction: 13) ascompared to D2CN mice (peak fraction: 15). The evaluation of sIgD-bearing cells by FCF analysis revealed a distribution of these cells in D2CN mice comparable to that observed in CBA/J mice. However, the frequency of these cells in the LM fractions was much lower in CND2 mice than in DXCN mice. Most interestingly, the fractions which were depleted in the xid mice correspond to those containing the bright sIgD' cells, whereas the fractions with proportionally higher cell numbers in CNDB mice than in D2CN mice correspond to those enriched for dull sIgD' cells.
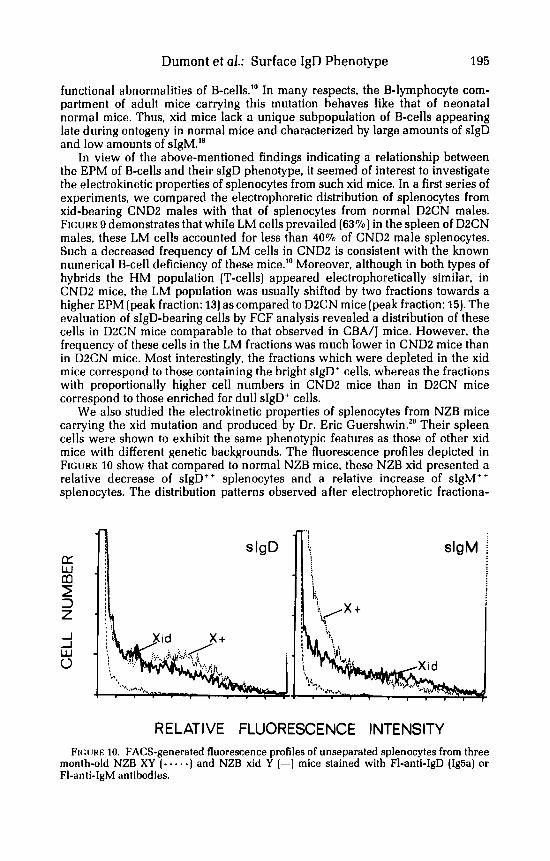
We also studied the electrokinetic properties of splenocytes from NZB mice carrying the xid mutation and produced by Dr. Eric Guershwin.'' Their spleen cells were shown to exhibit the same phenotypic features as those of other xid mice with different genetic backgrounds. The fluorescence profiles depicted in FIGURE 10 show that compared to normal NZB mice, these NZB xid presented a relative decrease of sIgD++ splenocytes and a relative increase of sIgM" splenocytes. The distribution patterns observed after electrophoretic fractiona-
s IgD
RE LATl VE FLUORESCENCE INTENSITY FIG~JRE 10. FACS-generated fluorescence profiles of unseparated splenocytes from three
month-old NZB XY (. . e . a ) and NZB xid Y (-1 mice stained with F1-anti-IgD (IgBa) or FI-anti-IgM antibodies.
196 Annals New York Academy of Sciences
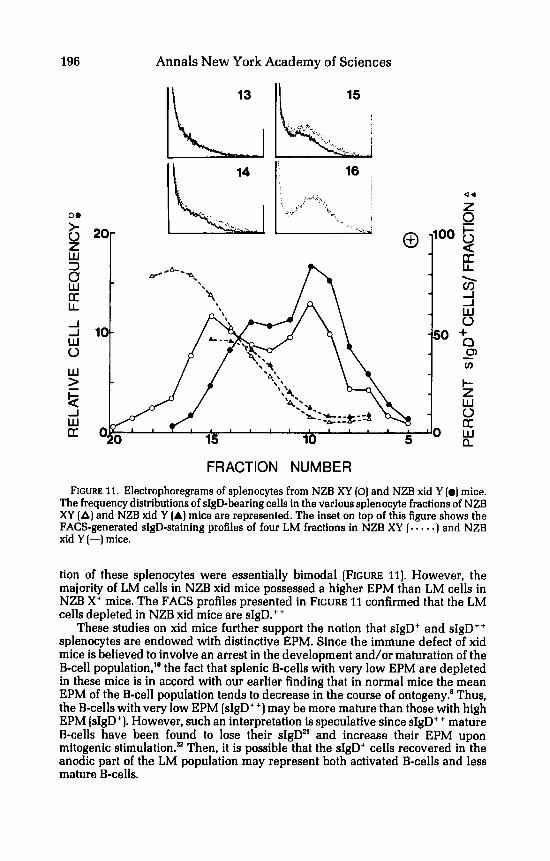
FRACTION NUMBER FIGURE 11. Electrophoregrams of splenocytes from NZB XY (0) and NZB xid Y (0) mice.
The frequency distributions of sIgD-bearing cells in the various splenocyte fractions of NZB XY (A) and NZB xid Y (A) mice are represented. The inset on top of this figure shows the FACS-generated sIgD-staining profiles of four LM fractions in NZB XY (. -. . .) and NZB xid Y (-1 mice.
tion of these splenocytes were essentially bimodal [FIGURE 11). However, the majority of LM cells in NZB xid mice possessed a higher EPM than LM cells in NZB X' mice. The FACS profiles presented in FIGURE 11 confirmed that the LM cells depleted in NZB xid mice are sIgD.++
These studies on xid mice further support the notion that sIgD+ and sIgD" splenocytes are endowed with distinctive EPM. Since the immune defect of xid mice is believed to involve an arrest in the development and/or maturation of the B-cell population," the fact that splenic B-cells with very low EPM are depleted in these mice is in accord with our earlier finding that in normal mice the mean EPM of the B-cell population tends to decrease in the course of ontogeny.' Thus, the B-cells with very low EPM [sIgD++) may be more mature than those with high EPM (sIgD'). However, such an interpretation is speculative since sIgD" mature B-cells have been found to lose their sIgD*' and increase their EPM upon mitogenic stimulation?' Then, it is possible that the sIgD' cells recovered in the anodic part of the LM population may represent both activated B-cells and less mature B-cells.
Dumont et a].: Surface IgD Phenotype
Electrophoretic Fractionation and FCF Analysis of Peyer's Patch Cells from CBMI Mice
197
Peyer's patches (PP] are known to contain a large proportion of mature B-~ells. '~ Since these B-cells have been reported to differ phenotypically and functionally from splenic B - ~ e l l s , ~ ~ - ~ ~ in the context of the present work it appeared of interest to investigate their electrokinetic properties and sIgD staining properties.
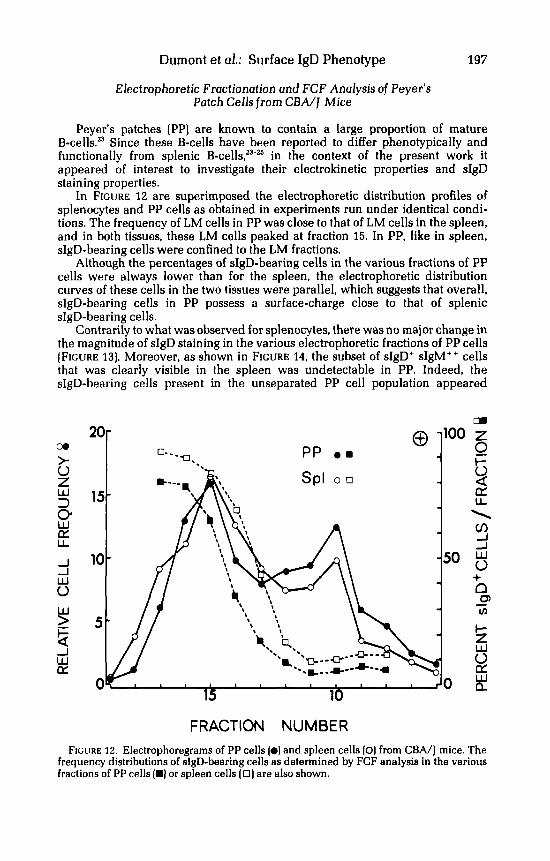
In FIGURE 12 are superimposed the electrophoretic distribution profiles of splenocytes and PP cells as obtained in experiments run under identical condi- tions. The frequency of LM cells in PP was close to that of LM cells in the spleen, and in both tissues, these LM cells peaked at fraction 15. In PP, like in spleen, sIgD-bearing cells were confined to the LM fractions.
Although the percentages of sIgD-bearing cells in the various fractions of PP cells were always lower than for the spleen, the electrophoretic distribution curves of these cells in the two tissues were parallel, which suggests that overall, sIgD-bearing cells in PP possess a surface-charge close to that of splenic sIgD-bearing cells.
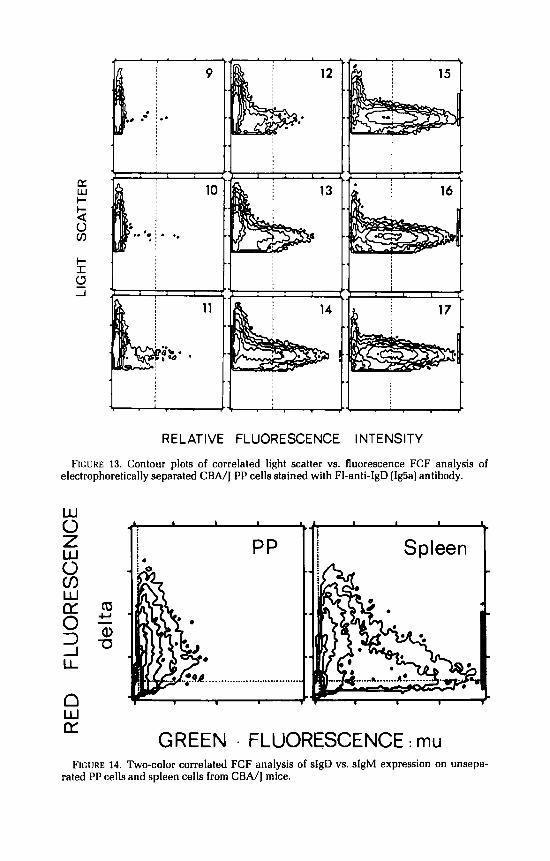
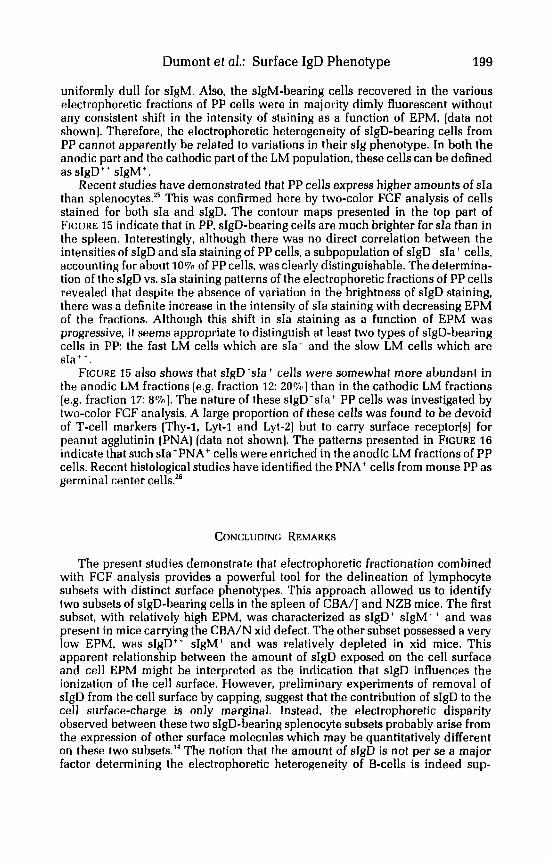
Contrarily to what was observed for splenocytes, there was no major change in the magnitude of sIgD staining in the various electrophoretic fractions of PP cells (FIGURE 13). Moreover, as shown in FIGURE 14, the subset of sIgD' sIgM" cells that was clearly visible in the spleen was undetectable in PP. Indeed, the sIgD-bearing cells present in the unseparated PP cell population appeared
-I w cz
m 20
15
10
5
FRACTION NUMBER FIGURE 12. Electrophoregrams of PP cells (0) and spleen cells [O) from CEA/J mice. The
frequency distributions of sIgD-bearing cells as determined by FCF analysis in the various fractions of PP cells (m) or spleen cells (0 ) are also shown.
E w I-
% 2 I- I
J (3
9
2 : , . :..
10
.. 0. : . .. .:
RELATIVE FLUORESCENCE I NTE NS ITY
FIGURE 13. Contour plots of correlated light scatter vs. fluorescence FCF analysis of electrophoretically separated CBA/I PP cells stained with FI-anti-IgD (Ig5al antibody.
m Q) -0
c.r -
. . . . . . . . . . ... . . . ...... . ... .. .. . .. .
GREEN . FLUORESCENCE : mu FIGURE 14. Two-color correlated FCF analysis of sIgD vs. sIgM expression on unsepa-
rated PP cells and spleen cells from CBA/] mice.
Dumont et a].: Surface IgD Phenotype 199
uniformly dull for sIgM. Also, the sIgM-bearing cells recovered in the various electrophoretic fractions of PP cells were in majority dimly fluorescent without any consistent shift in the intensity of staining as a function of EPM, [data not shown]. Therefore, the electrophoretic heterogeneity of sIgD-bearing cells from PP cannot apparently be related to variations in their sIg phenotype. In both the anodic part and the cathodic part of the LM population, these cells can be defined as sIgD + ' sIgM + .
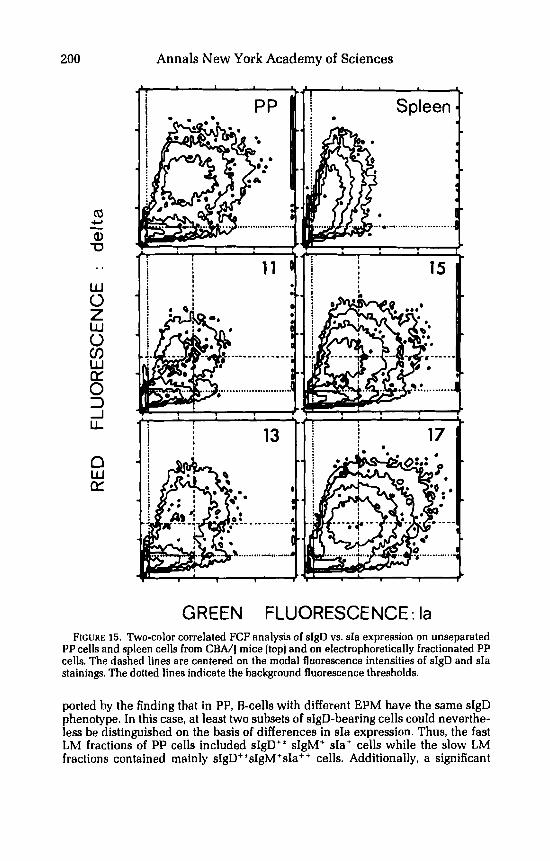
Recent studies have demonstrated that PP cells express higher amounts of sIa than sp lenocy te~ .~~ This was confirmed here by two-color FCF analysis of cells stained for both sIa and sIgD. The contour maps presented in the top part of FIGURE 15 indicate that in PP. sIgD-bearing cells are much brighter for sIa than in the spleen. Interestingly, although there was no direct correlation between the intensities of sIgD and sIa staining of PP cells, a subpopulation of sIgD- sIa+ cells, accounting for about 10% of PP cells, was clearly distinguishable. The determina- tion of the sIgD vs. sIa staining patterns of the electrophoretic fractions of PP cells revealed that despite the absence of variation in the brightness of sIgD staining, there was a definite increase in the intensity of sIa staining with decreasing EPM of the fractions. Although this shift in sIa staining as a function of EPM was progressive, it seems appropriate to distinguish at least two types of sIgD-bearing cells in P P the fast LM cells which are sIa' and the slow LM cells which are sIa+ ' .
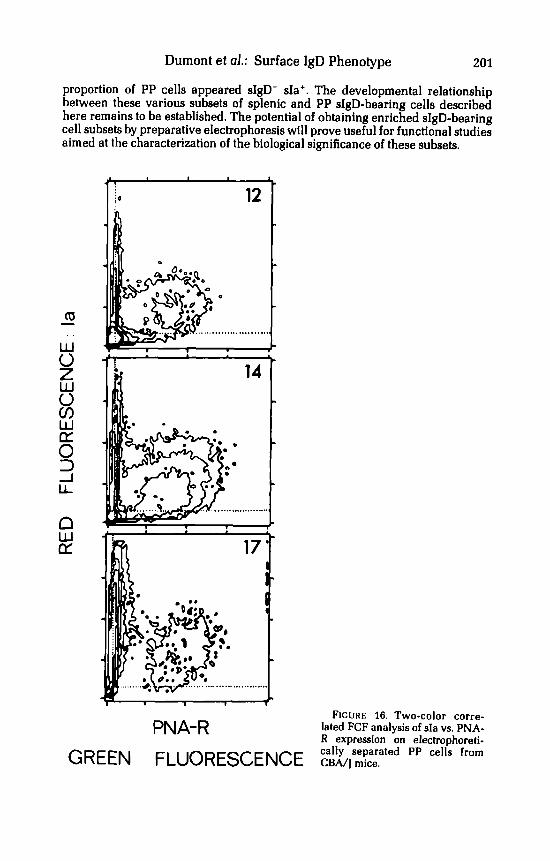
FIGURE 15 also shows that sIgD-sIa+ cells were somewhat more abundant in the anodic LM fractions (eg. fraction 12: 20%) than in the cathodic LM fractions (e.g. fraction 17: 8%]. The nature of these sIgD-sIa+ PP cells was investigated by two-color FCF analysis. A large proportion of these cells was found to be devoid of T-cell markers (Thy-1. Lyt-1 and Lyt-2) but to carry surface receptor[s) for peanut agglutinin [PNA) [data not shown]. The patterns presented in FIGURE 16 indicate that such sIa+PNA+ cells were enriched in the anodic LM fractions of PP cells. Recent histological studies have identified the PNA' cells from mouse PP as germinal center cells.''
CONCLUDING REMARKS
The present studies demonstrate that electrophoretic fractionation combined with FCF analysis provides a powerful tool for the delineation of lymphocyte subsets with distinct surface phenotypes. This approach allowed us to identify two subsets of sIgD-bearing cells in the spleen of CBA/J and NZB mice. The first subset, with relatively high EPM, was characterized as sIgD+ sIgM" and was present in mice carrying the CBA/N xid defect. The other subset possessed a very low EPM, was sIgD++ sIgM+ and was relatively depleted in xid mice. This apparent relationship between the amount of sIgD exposed on the cell surface and cell EPM might be interpreted as the indication that sIgD influences the ionization of the cell surface. However, preliminary experiments of removal of sIgD from the cell surface by capping, suggest that the contribution of sIgD to the cell surface-charge is only marginal. Instead, the electrophoretic disparity observed between these two sIgD-bearing splenocyte subsets probably arise from the expression of other surface molecules which may be quantitatively different on these two subset^.'^ The notion that the amount of sIgD is not per se a major factor determining the electrophoretic heterogeneity of B-cells is indeed sup-
Annals New York Academy of Sciences
................. ... ..... " ......................
.........................
m ............ ...._...
GREEN FLUORESCENCE: la FIGURE 15. Two-color correlated FCF analysis of sIgD vs. sIa expression on unseparated
PP cells and spleen cells from CBA/J mice (top] and on electrophoretically fractionated PP cells. The dashed lines are centered on the modal fluorescence intensities of sIgD and sla stainings. The dotted lines indicate the background fluorescence thresholds.
ported by the finding that in PP, B-cells with different EPM have the same sIgD phenotype. In this case, at least two subsets of sIgD-bearing cells could neverthe- less be distinguished on the basis of differences in sIa expression. Thus, the fast LM fractions of PP cells included sIgD+' sIgM' sIa+ cells while the slow LM fractions contained mainly sIgD+*sIgM'sIa++ cells. Additionally, a significant
Dumont et a].: Surface IgD Phenotype 201
proportion of PP cells appeared sIgD- sIa+. The developmental relationship between these various subsets of splenic and PP sIgD-bearing cells described here remains to be established. The potential of obtaining enriched sIgD-bearing cell subsets by preparative electrophoresis will prove useful for functional studies aimed at the characterization of the biological significance of these subsets.
. . . . . . . . . . . . . . . . . . . h
14
1fh 17'
PNA-R FIGURE 16. Two-color corre-
lated FCF analysis of sIa vs. PNA- R expression on electrophoreti- cally separated PP cells from GREEN FLUORESCENCE CBA/] mice.
202 Annals New York Academy of Sciences
ACKNOWLEDGMENTS
We wish to thank Dr. Alan Rosenthal for scientific support, Dr. Regina Skelly for administrative help and critical reading of the manuscript and Miss Eileen Frees for typing this manuscript.
REFERENCES
1.
2.
HANNIG. K. 1971. Free-flow electrophoresis. In Methods of Microbiology. 1. R. NORRIS & D. W. RIBHONS. Eds.: 5 B 513. Academic Press. London, England.
MEHRISHI, 1. N. 1972. Molecular aspects of the mammalian cell surface. In Progress in Biophysics and Molecular Biology. 1. A. BUTLER & D. NOBLE, Eds.: 25: 1. Pergamon Press. Oxford, England.
3. WIOLAND. M.. D. SAROLOVIC & C. BURG. 1972. Nature New Biol. 237: 274. 4. ANDERSON. L. C.. S. NORDLINC & P. HAYRY. 1973. Cell. Immunol. 8 235. 5. BOEHMER. H. VON. K. SHORTMAN & G. 1. V. NOSSAL. 1974.1. Cell. Physiol. 83: 231. 6. SCHLECEL. R. A.. H. VON BOEHMER & K. SHORTMAN. 1975. Cell. Immunol. 16: 203. 7. ZEILLER. K.. G. PASCHER & K. HANNIG. 1976. Immunology 31: 863. 8. DUMONT, F. & P. BISCHOFF. 1977. Ann. Immunol. 128C 771. 9. HERZENHERG, L. A. & L. A. HERZENBERC. 1979. Analysis and separation using the
fluorescence-activated cell sorter (FACS). In Handbook of Experimental Immu- nology. D. M. WEIR, Ed. 2 2 1. Blackwell Scientific Publications. Oxford, England.
10. SCHER. I. 1981. B. lymphocyte development and heterogeneity. Analysis with the immune-defective CBA/N mouse strain. In Immunologic Defects in Laboratory Animals. M. E. GERSHWIN and B. MERCANT, Eds. Vol. 1: 163. Plenum Press, New York. N.Y.
DUMONT. F. Combination of two physical parameters for the identification and the separation of lymphocyte subsets. In Methods of Cell Analysis. N. CATSIMPOOLAS, Ed.: 1 Plenum Press, New York. N.Y. In press.
12. MILLER. M. H., I . I. POWELL, S. 0. SHARROW & A. R. SCHULTZ. 1978. Rev. Sci. Instrum. 49: 1137.
13. GODINC, J. W. & I. E. LAYTON. 1976. 1. Exp. Med. 144: 852. 14. AHMED. A. & A. H. SMITH. CRC Rev. Immunol. In press. 15. KESSLER. S. W.. V. L. WOODS, F. D. FINKELMAN & I. SCHER. 1979. I . Immunol. 123: 2772. 16. WOODS, V. I., S. W. KESSLER. F. D. FINKELMAN, A. LIEBERMAN, I. SCHER & W. E. PAUL.
17. COHEN. P. L.. F. S. LIGLER. M. ZIFF & E. S. V I T E ~ A . 1978. Arthritis Rheum. 21: 551. 18. IZUI, S.. P. 1. MCCONAHEY & F. 1. DIXON. 1978. J. Immunol. 121: 2213. 19. SCHER, I., A. K. BERNINC. S. KESSLER & F. D. FINKELMAN. 1980.1. Immunol. 125: 1686. 20. OHSUGI, Y.. M. E. GERsHwiN & A. AHMED. 1981.1. Immunogenetics 8. 21. BOURGOIS. A.. K. KITAIIMA. 1. R. HUNTER & B. A. ASKONAS. 1977. Eur. 1. Immunol.
22. DLJMONT. F. 1975. Ann. Immunol. 126C 453. 23. KRCO. C. I., S. 1. CHALLACOMHE. W. P. LAFUSE, C. S. DAVID & T. B. TOMASI. 1981. Cell
24. MATTINCLY. 1. A. & B. H. WAKSMAN. 1978.1. Immunol. 121: 1878. 25. MOND. J. 1.. S. KESSLER, F. D. FINKELMAN. W. E. PAUL & I. SCHER. 1980. 1. Immunol.
26. ROSE. M. & F. MALCHOIDI. 1981. Immunology 42: 583.
11.
1980. 1. Immunol. 125: 2699.
7: 151.
Immunol. 57: 420.
124 1675.
Dumont et a].: Surface IgD Phenotype
DISCUSSION OF THE PAPER
203
P. W. KINCADE: Herima Genucchi in my lab, using NZB mice, has found that there is a very rapid decline in B-cell precursors in the bone marrow. By the time the mice are about 15 weeks old they have virtually no cells in their bone marrow that are identifiable as precursors of B-cells. which might suggest that they aren’t making a lot of B-cells after that time. This is also true for CB and normal mice but these mice need to be over two years old. My question to you and perhaps also to Dr. Vitetta relates to the IgD expression in NZB mice. It seemed to me there was some difference with 12-week-old spleens, between your results and those that she reported earlier regarding the p = 6 expression in these mice. Did you look at NZB Peyer’s patches?
F. DUMONT: Not yet. KINCADE: Has anybody looked at very old normal mice? DUMONT: In NZB mice as they age. a shift in the pattern of sIgD versus sIgM
staining appears. The sIgD bright cells tend to disappear or to be flooded by a large number of sIgD dull cells. Also, in these NZB mice there is actually a lower frequency of B-cells than in other mouse strains. They have about 10 to 15Vr less 9-cells than CBA or DBA2 mice.
KINCADE: And you haven’t looked at very old normal mice? DUMONT: In very old normal mice there is no significant change in the pattern
when the mice are healthy. 1. SCHER: This looks like a very powerful multi-technique for separating out
B-cells and I was just wondering if you had an opportunity to look at the function of these cells separated by this technique in terms of their responses to antigens or their MLS reactivity?
DUMONT: We have preliminary experiments in collaboration with Dr. R. SRelly regarding the response to TNP ficoll and TNP-LPS. The responses appear to correlate with what is known of the response of the B-cells subset to these antigens. That’s all we have done so far.
F. FINKELMAN: You seem to get a good degree of separation of the spleen cell populations hut there is still considerable overlap. If you subject a population that has gone through electrophoresis once to a repeat electrophoresis do you get further separation or do you really have overlap between the p - 6 ratios in different populations?
DUMONT: You cannot get higher resolution. What should be done is associate this with other physical techniques. There is a limitation in the resolution of the separation with the presently available equipment..
FINKELMAN: Can you say anything about the surface p 6 phenotype of the PNA positive cells from spleen or Peyer’s patches?
DUMONT: In the spleen the frequency of these PNA positive cells is very low, on the order of 5%. In the Peyer’s patches it varies between 15 and 25% and there these cells, at least when examined in the FACS on linear amplification, appear completely negative for sIgD. negative for sIgM and very dull for total sIg and it’s possible that they are positive for sIgA. but very dull. And the other markers are Ia and FC receptor.
Related Documents