Surface geometry influences the shape of illusory contours Jacqueline M. Fulvio a , Manish Singh b, * a Department of Psychology, New York University, USA b Department of Psychology and Center for Cognitive Science, Rutgers, New Brunswick, USA Received 26 October 2005; received in revised form 19 February 2006; accepted 24 February 2006 Available online 8 May 2006 Abstract Geometric and neural models of illusory-contour (IC) synthesis currently use only local contour geometry to derive the shape of ICs. Work on the visual representation of shape, by contrast, points to the importance of both contour and surface geometry. We investigated the influence of surface- based geometric factors on IC shape. The local geometry of inducing-contour pairs was equated in stereoscopic IC displays, and the shape of the enclosed surface was varied by manipulating sign of curvature, cross-axial shape width, and medial-axis geometry. IC shapes were measured using a parametric shape-adjustment task (Experiment 1) and a dot-adjustment task (Experiment 2). Both methods revealed large influences of surface geometry. ICs enclosing locally concave regions were perceived to be systematically more angular than those enclosing locally convex regions. Impor- tantly, the influence of sign of curvature was modulated significantly by shape width and medial-axis geometry: IC shape difference between convex and concave inducers was greater for narrow shapes than wider ones, and greater for shapes with straight axis and symmetric contours (diamond versus bowtie), than those with curved axis and parallel contours (bent tubes). Even at the level of illusory ‘‘contours,’’ there is a contribution of region-based geometry which is sensitive to nonlocal shape properties involving medial geometry and part decomposition. Models of IC synthesis must incor- porate the role of nonlocal region-based geometric factors in a way that parallels their role in orga- nizing visual shape representation more generally. Ó 2006 Elsevier B.V. All rights reserved. 0001-6918/$ - see front matter Ó 2006 Elsevier B.V. All rights reserved. doi:10.1016/j.actpsy.2006.02.004 * Corresponding author. Tel.: +1 732 445 6714; fax: +1 732 445 6715. E-mail address: [email protected] (M. Singh). Acta Psychologica 123 (2006) 20–40 www.elsevier.com/locate/actpsy

Welcome message from author
This document is posted to help you gain knowledge. Please leave a comment to let me know what you think about it! Share it to your friends and learn new things together.
Transcript
Acta Psychologica 123 (2006) 20–40
www.elsevier.com/locate/actpsy
Surface geometry influences the shapeof illusory contours
Jacqueline M. Fulvio a, Manish Singh b,*
a Department of Psychology, New York University, USAb Department of Psychology and Center for Cognitive Science, Rutgers, New Brunswick, USA
Received 26 October 2005; received in revised form 19 February 2006; accepted 24 February 2006Available online 8 May 2006
Abstract
Geometric and neural models of illusory-contour (IC) synthesis currently use only local contourgeometry to derive the shape of ICs. Work on the visual representation of shape, by contrast, pointsto the importance of both contour and surface geometry. We investigated the influence of surface-based geometric factors on IC shape. The local geometry of inducing-contour pairs was equated instereoscopic IC displays, and the shape of the enclosed surface was varied by manipulating sign ofcurvature, cross-axial shape width, and medial-axis geometry. IC shapes were measured using aparametric shape-adjustment task (Experiment 1) and a dot-adjustment task (Experiment 2). Bothmethods revealed large influences of surface geometry. ICs enclosing locally concave regions wereperceived to be systematically more angular than those enclosing locally convex regions. Impor-tantly, the influence of sign of curvature was modulated significantly by shape width and medial-axisgeometry: IC shape difference between convex and concave inducers was greater for narrow shapesthan wider ones, and greater for shapes with straight axis and symmetric contours (diamond versusbowtie), than those with curved axis and parallel contours (bent tubes). Even at the level of illusory‘‘contours,’’ there is a contribution of region-based geometry which is sensitive to nonlocal shapeproperties involving medial geometry and part decomposition. Models of IC synthesis must incor-porate the role of nonlocal region-based geometric factors in a way that parallels their role in orga-nizing visual shape representation more generally.� 2006 Elsevier B.V. All rights reserved.
0001-6918/$ - see front matter � 2006 Elsevier B.V. All rights reserved.
doi:10.1016/j.actpsy.2006.02.004
* Corresponding author. Tel.: +1 732 445 6714; fax: +1 732 445 6715.E-mail address: [email protected] (M. Singh).

J.M. Fulvio, M. Singh / Acta Psychologica 123 (2006) 20–40 21
PsycINFO classification: 2323
Keywords: Contour interpolation; Visual completion; Illusory contours; Shape perception; Parts; Part-basedrepresentation; Curvature; Convexity; Medial axis
1. Introduction
The ubiquitous occurrence of occlusion in natural scenes poses a difficult challenge tothe visual computation of objects. Objects can either be partly occluded by an inter-posed object, or be camouflaged by an underlying surface that happens to project thesame color (a problem that is exacerbated in conditions of low illumination). Objectsare also invariably self-occluded: a large portion of each opaque object—its ‘‘back’’ rel-ative to the viewer—has no counterpart in the retinal images. Moreover, occlusion anddisocclusion can take place dynamically, either due to the motion of one of the objects,or that of the observer’s vantage point. Michotte’s work stands out as the first unifiedtreatment of the full range of completion phenomena in both static and kinematic dis-plays—where the visual system fills in missing structure—and a systematic analysis ofthe image cues necessary to initiate processes of visual completion (Michotte, 1950;Michotte, Thines, & Crabbe, 1991). To this day, Michotte’s work continues to motivateresearch into these problems; the articles in this special issue attest to the long-standinginfluence of his insights (see Bertamini & Hulleman, 2006; Van Lier, de Wit, & Koning,2006).
The current paper focuses on the context of ‘‘illusory’’ or ‘‘subjective’’ contours—vividcontours that can be perceived in image regions containing no local contrast (see, e.g.,Fig. 1). Following Michotte et al., this form of interpolation is referred to as modal com-pletion, to emphasize the fact that the percept has the same ‘mode’ as if image contrastwere actually present: ‘‘. . . these additions present the same visual qualities (luminanceand color) as the rest of the configuration . . .’’ (Michotte et al., 1991). It is contrasted withamodal completion—the visual completion of partly occluded contours and surfaces—where no contrast is perceived along the visually interpolated contour, despite a compelling
Fig. 1. An example of illusory contours. Vivid contours are perceived in image regions containing no localcontrast.
22 J.M. Fulvio, M. Singh / Acta Psychologica 123 (2006) 20–40
percept of object unity. Although both forms generate the perception of completed con-tours, the perceptual vividness of illusory contours makes them particularly suitable forinvestigating visual mechanisms of shape completion.
Current geometric and neural models of illusory-contour synthesis take into accountonly the local geometry of inducing contours. Specifically, they encode interpolationgeometry in terms of the relative positions of the physically specified ‘‘inducing’’ contours,and their relative orientations. The commonly used criterion of inducer relatability, forinstance, is defined in terms of whether or not the linear extensions of the inducing con-tours intersect, and whether their interior angle of intersection is obtuse (Kellman & Ship-ley, 1991). (This criterion is equivalent to the existence of a smooth interpolating contourthat contains no inflections, and undergoes a total turning of no more than 90�; Singh &Hoffman, 1999.) Based on these geometric relations, the relatability model predictswhether or not visual interpolation will occur. Similar geometric relations between pairsof oriented edges are also used to predict grouping in the context of contour integration(e.g., Elder & Goldberg, 2002; Field, Hayes, & Hess, 1993; Geisler, Perry, Super, & Gal-logly, 2001; Neumann & Mingolla, 2001).
More directly relevant to the present study, models that predict specific shapes for illu-sory contours also take into account only contour geometry. These models vary a greatdeal in how they generate the interpolated shapes. An important class of models employsthe minimization of a curvature-based functional—such as total curvature (Horn, 1983;Mumford, 1994) or variation in curvature (Kimia, Frankel, & Popescu, 2003). Of all inter-polating shapes possible, such models take the preferred solution to be the one that min-imizes either the squared curvature, or the squared derivative of curvature, integratedalong the length of the interpolating contour. (See Singh & Fulvio, 2005 for an approachthat models the shapes of visually extrapolated contours via a Bayesian interactionbetween the constraints of minimizing curvature and minimizing variation in curvature.)Other models build up the interpolated shape via propagation of local constraints, or localinteractions between oriented edge pairs (Fantoni & Gerbino, 2003; Heitger, von derHeydt, Peterhans, Rosenthaler, & Kubler, 1998; Williams & Jacobs, 1997). Yet others pos-tulate specific geometric forms for the interpolated contours, such as a pair of circular arcs(Ullman, 1976), or the combination of a circular arc and a line segment (Kellman & Ship-ley, 1991), that meet with continuous tangents.
Despite the different approaches adopted by these models, they share one importantcharacteristic: they all formulate the problem of shape completion as one of contour inter-polation. Specifically, interpolation geometry is encoded in terms of the local geometry ofinducing-contour pairs, and the synthesis of the illusory shapes is driven by contour-basedmechanisms—i.e., mechanisms involving 1D constraints applied along contours. Con-straints based on the geometry of the enclosed region or surface are not considered. Thesemodels thus implicitly assume that region-based geometry plays no role in illusory-contoursynthesis. In this article, we test this prevalent assumption: Are the shapes of illusory con-tours in fact determined simply by local contour geometry?
In the context of amodal completion, it has been shown that the perceived shape of apartly occluded object is often governed by global symmetry (e.g., radial or bilateral sym-metry)—which results in a shorter description length for the occluded object—even if itentails a locally more complex shape for the amodally completed contour (De Wit &Van Lier, 2002; Sekuler, Palmer, & Flynn, 1994; Van Lier, Van der Helm, & Leeuwenberg,1994, 1995; Van Lier, 1999). These cases of shape completion are theoretically important,
J.M. Fulvio, M. Singh / Acta Psychologica 123 (2006) 20–40 23
because they show that local contour geometry is not sufficient to predict the perceivedshapes of partly occluded objects. However, such instances appear not to occur with illu-sory contours (see, e.g., Kellman, Guttman, & Wickens, 2001), which are the focus of thecurrent study. More importantly, although this work makes a clear and important distinc-tion between local and global geometry, it does not explicitly distinguish between contourand surface geometry. In its current form, for instance, the local computation of ‘goodcontinuation’ and the computation of description length for the global shape are both con-tour based. (Shape is coded as a chain of contour elements and turning angles; althoughthis scheme may of course be extended to incorporate surface geometry as well.)
Computational and psychophysical work on the visual representation of shape makes aclear distinction between a contour-based description and surface-based (or region-based)description of shape, and the contributions of both have been demonstrated in shape per-ception (see, e.g., Barenholtz & Feldman, 2003; Burbeck & Pizer, 1995; Sebastian &Kimia, 2005; Siddiqi, Tresness, & Kimia, 1996; Siddiqi, Kimia, Tannenbaum, & Zucker,2001; Singh, Seyranian, & Hoffman, 1999). In the next section, we briefly review the role ofthree such region-based geometric factors in shape perception which will be relevant to ourexperiments: sign of curvature, medial-axis geometry, and cross-axial shape width.
2. Contour versus surface geometry in shape representation
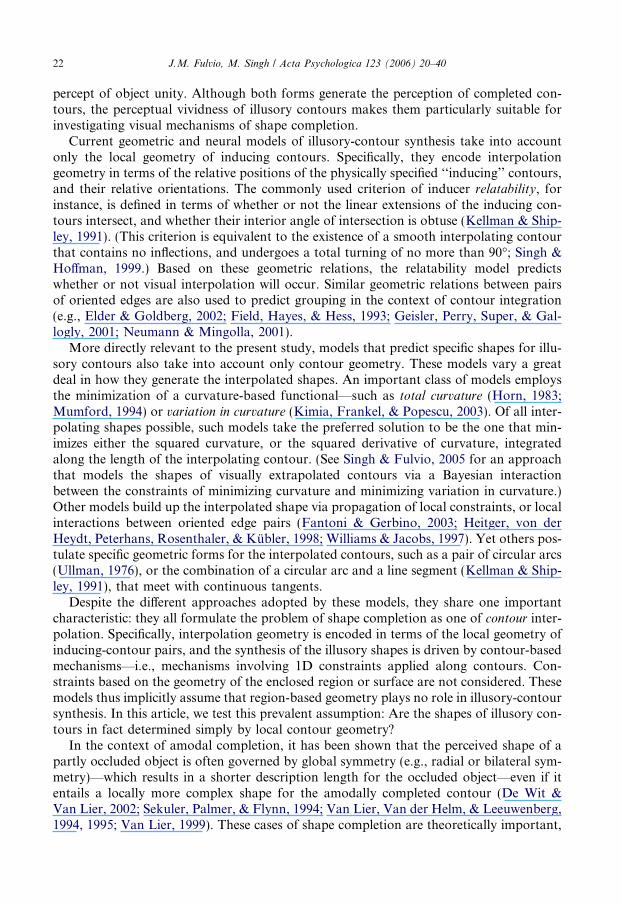
In representing the shape of a closed contour, one may treat it either as a 1-D curve, oras a 2-D region (enclosed by the contour)—i.e., a ‘‘string’’ representation or ‘‘cardboard’’representation. Importantly, the same local contour segment—e.g., the one shown inFig. 2(a)—can bound surfaces with different region-based geometries. Four such examplesare shown in Fig. 2(b)–(e). In Fig. 2(b), the contour segment corresponds to the convexprotuberance of a single-part shape, in Fig. 2(c) it is a concavity corresponding to theboundary between two distinct parts, and in Fig. 2(d) and (e), it corresponds to the convexand concave side, respectively, of a bent tube.
2.1. Sign of curvature
Perhaps the most basic difference in region-based geometry arises from the borderownership of a contour, i.e., the side on which the figural surface lies that ‘owns’ thecontour (Baylis & Driver, 1995; Koffka, 1935; Nakayama, He, & Shimojo, 1995).
(b)(a) (c) (d) (e)
Fig. 2. Demonstrating the distinction between local contour geometry and nonlocal surface geometry. (a) A localcontour segment viewed through an aperture. This segment can result from different surface geometries: (b) aprotruberance on a convex object; (c) a part boundary between the two parts on a bowtie shape; (d) the convexside of a bent tube; and (e) the concave side of a bent tube.
24 J.M. Fulvio, M. Singh / Acta Psychologica 123 (2006) 20–40
Depending on border ownership, the same local contour segment may correspond eitherto a local concavity (hence with negative contour curvature) or to convexity (with posi-tive curvature). The suggestion that local regions of positive and negative curvature playdifferent roles in visual shape representation was made by Koenderink and van Doorn(1982), who noted that regions of positive curvature tend to have a thing-like characterwhereas regions of negative curvature tend to have a glue-like character. Since then, sys-tematic differences based on the sign of curvature have been observed in various behav-ioral tasks including detecting small gaps in contours (Lamote & Wagemans, 1999),visual search (Hulleman, te Winkel, & Boselie, 2000), estimating vertex height (Berta-mini, 2001), and change detection on shapes (Barenholtz, Cohen, Feldman, & Singh,2003; Cohen, Barenholtz, Singh, & Feldman, 2005). An asymmetry in information con-tent arising from the sign of contour curvature has been demonstrated using Shannon’sdefinition of information (Feldman & Singh, 2005). Moreover, single-cell recordings inarea V4 have shown that neurons in this area respond either to convex, or to concave,extrema of curvature—hence displaying a selectivity for the sign of curvature (Pasupathy& Connor, 1999).
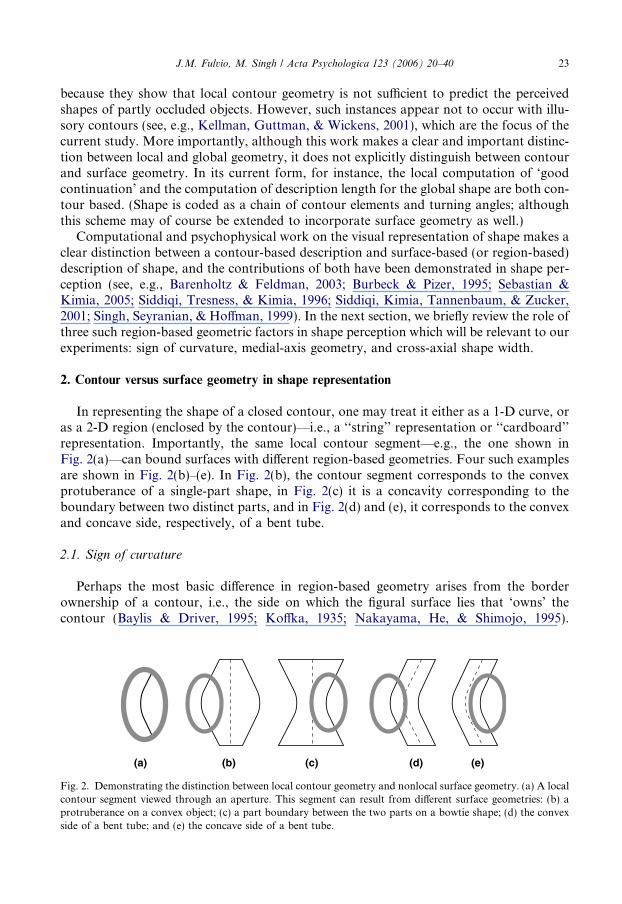
Further evidence for a differential treatment of positive and negative curvature comesfrom the extensive work on part-based representation of shape (Barenholtz & Feldman,2003; Bertamini & Farrant, 2005; Braunstein, Hoffman, & Saidpour, 1989; Baylis & Dri-ver, 1994, 1995; De Winter & Wagemans, 2004, 2006; Hoffman & Richards, 1984; Hoff-man & Singh, 1997; Lamote & Wagemans, 1999; Singh et al., 1999; Xu & Singh, 2002).Consistent with Hoffman and Richards’ minima rule, negative minima of curvature(extrema of curvature in concave regions) are used by the visual system to define candidateboundaries between distinct parts, whereas corresponding extrema in convex regions typ-ically do not play such a role (see Singh & Hoffman, 2001 for a review). An example isshown in Fig. 3, where the same undulating contour appears differently shaped on thetwo half disks (Attneave, 1971). This perceptual difference is readily explained by theswitch in the sign of curvature that accompanies a figure-ground reversal—which in turnalters the locations of the negative minima, and hence part decomposition of the contour.
mn
n
n
m
1
2
2
3
1
Fig. 3. Demonstrating the influence of sign of curvature on shape perception. The same undulating contourappears differently shaped on the two half disks. Changing the figural sidedness of a contour switches its sign ofcurvature. As a result, the negative minima of curvature that define part boundaries switch from locations m1 andm2 on the left half-disk to the locations n1, n2, and n3 on the right half-disk.
J.M. Fulvio, M. Singh / Acta Psychologica 123 (2006) 20–40 25
2.2. Medial axis
Although the sign of curvature is determined by an aspect of surface geometry (namely,the surface sidedness of a contour), it is nevertheless entirely a local property. Indeed, thesame local convexity or concavity may play an altogether different role in a shape’s repre-sentation, depending on more global aspects of its geometry. An important such factor is ashape’s ‘‘skeletal-axis’’ structure, as captured by the medial-axis representation. The geo-metric construction of the medial axis involves expressing a shape as a union of maximaldisks inscribed within the shape (Blum, 1973). The shape is then represented in terms of (i)the medial axis, defined as the locus of the centers of the maximal disks, and (ii) the thick-ness function, defined by the (generally varying) diameters of the maximal disks along themedial axis. Variants of this construction have also been proposed (Brady & Asada, 1984;Leyton, 1988), including more recent algorithms based on curve evolution (Kimia, Tan-nenbaum, & Zucker, 1995; Siddiqi, Kimia, Tannenbaum, & Zucker, 1999).
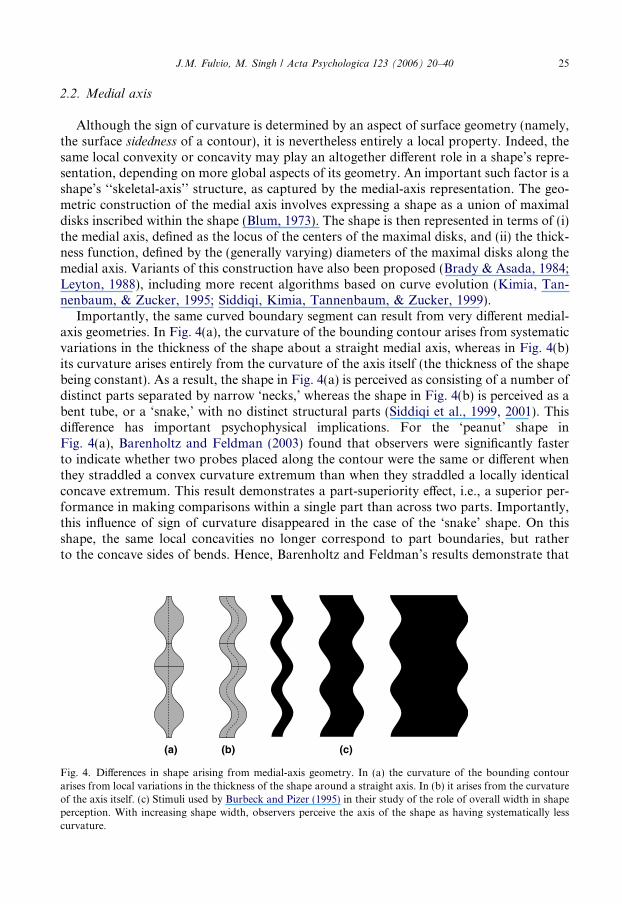
Importantly, the same curved boundary segment can result from very different medial-axis geometries. In Fig. 4(a), the curvature of the bounding contour arises from systematicvariations in the thickness of the shape about a straight medial axis, whereas in Fig. 4(b)its curvature arises entirely from the curvature of the axis itself (the thickness of the shapebeing constant). As a result, the shape in Fig. 4(a) is perceived as consisting of a number ofdistinct parts separated by narrow ‘necks,’ whereas the shape in Fig. 4(b) is perceived as abent tube, or a ‘snake,’ with no distinct structural parts (Siddiqi et al., 1999, 2001). Thisdifference has important psychophysical implications. For the ‘peanut’ shape inFig. 4(a), Barenholtz and Feldman (2003) found that observers were significantly fasterto indicate whether two probes placed along the contour were the same or different whenthey straddled a convex curvature extremum than when they straddled a locally identicalconcave extremum. This result demonstrates a part-superiority effect, i.e., a superior per-formance in making comparisons within a single part than across two parts. Importantly,this influence of sign of curvature disappeared in the case of the ‘snake’ shape. On thisshape, the same local concavities no longer correspond to part boundaries, but ratherto the concave sides of bends. Hence, Barenholtz and Feldman’s results demonstrate that
(a) (b) (c)
Fig. 4. Differences in shape arising from medial-axis geometry. In (a) the curvature of the bounding contourarises from local variations in the thickness of the shape around a straight axis. In (b) it arises from the curvatureof the axis itself. (c) Stimuli used by Burbeck and Pizer (1995) in their study of the role of overall width in shapeperception. With increasing shape width, observers perceive the axis of the shape as having systematically lesscurvature.
26 J.M. Fulvio, M. Singh / Acta Psychologica 123 (2006) 20–40
the role played by a concavity is modulated by nonlocal aspects of surface geometry—fac-tors that determine its part decomposition.
2.3. Shape width
One by-product of the medial-axis representation is that it provides a perceptually nat-ural measure of shape width (i.e., cross-axial thickness). Shape width has been shown toinfluence the perceived curvature of a shape’s axis and the perceptual salience of its parts(Burbeck & Pizer, 1995; Siddiqi et al., 1999). Burbeck and Pizer estimated the perceivedaxis of a ‘snake’ shape (see Fig. 4(c)) using a shape-bisection task: observers indicatedwhether a briefly flashed dot appeared to the left or right of the local center. They foundthat as the width of a shape increases, its axis is perceived to be systematically less curved(having lower amplitude of modulation) even though the sinusoidal bounding contoursare identical. Based on this and other results, Burbeck and Pizer proposed a model inwhich the bounding contours of a shape are detected with systematically weaker precisionwith increasing shape width. This entails that the perceptual salience of a local concavityor convexity on a shape—and hence of a part—decreases systematically with the overallwidth of the shape.
3. Surface geometry and visual completion
Although the influence of region-based geometry is well recognized in shape perception,as noted earlier, models of illusory and partially occluded contours typically take intoaccount only the geometry of local inducing-contour pairs—in particular, the relative loca-tions and orientations of the inducing edges.
Some recent work has pointed to the insufficiency of purely contour based mechanismsin visual completion. Yin, Kellman, and Shipley (2000) showed that surface color and tex-ture can complement contour-based mechanisms of amodal completion, in that two sur-face fragments are more likely to group perceptually when they share a common colorand texture. Recently, a more basic role for surface attributes has been demonstratedby Anderson, Singh, and Fleming (2002). They showed that factors involving the polarityof contrast at junctions, and the border ownership of contours, strongly modulate thevisual completion of surfaces (see their ‘‘serrated edge illusion,’’ Fig. 19). In particular,reversals in the sign of binocular disparity were shown to lead to altogether different visu-ally completed surfaces—with the perceived surface lying on one or the other side of avisually interpolated contour—or, depending on contrast polarity, not being completedat all. Compelling examples of 3D completion displays (e.g., Gerbino, 2003; Tse, 1999a,1999b; Van Lier & Wagemans, 1999) suggest that volumetric representations may alsoplay a role in visual completion. These studies thus point to the insufficiency of purely con-tour-based approaches to visual completion.
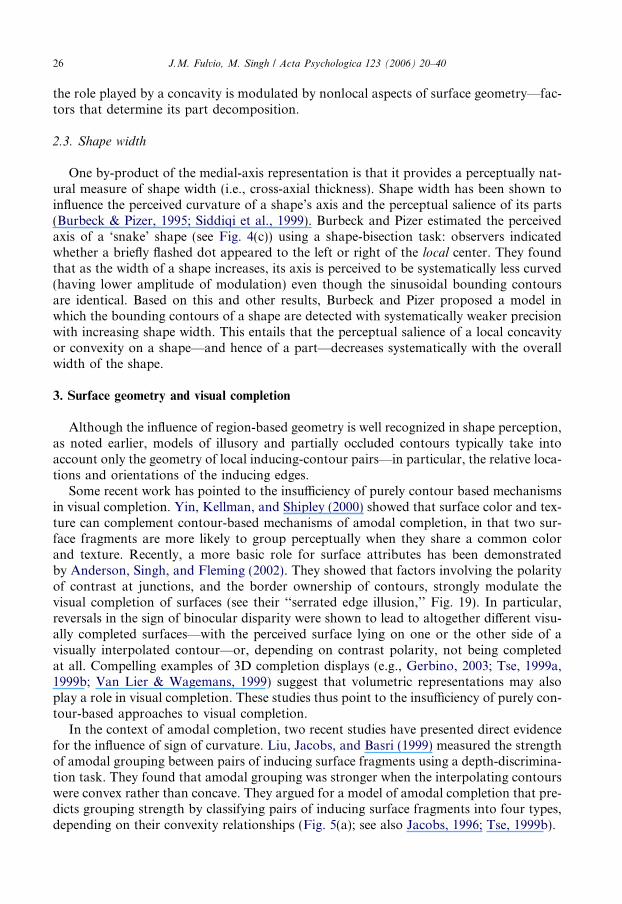
In the context of amodal completion, two recent studies have presented direct evidencefor the influence of sign of curvature. Liu, Jacobs, and Basri (1999) measured the strengthof amodal grouping between pairs of inducing surface fragments using a depth-discrimina-tion task. They found that amodal grouping was stronger when the interpolating contourswere convex rather than concave. They argued for a model of amodal completion that pre-dicts grouping strength by classifying pairs of inducing surface fragments into four types,depending on their convexity relationships (Fig. 5(a); see also Jacobs, 1996; Tse, 1999b).
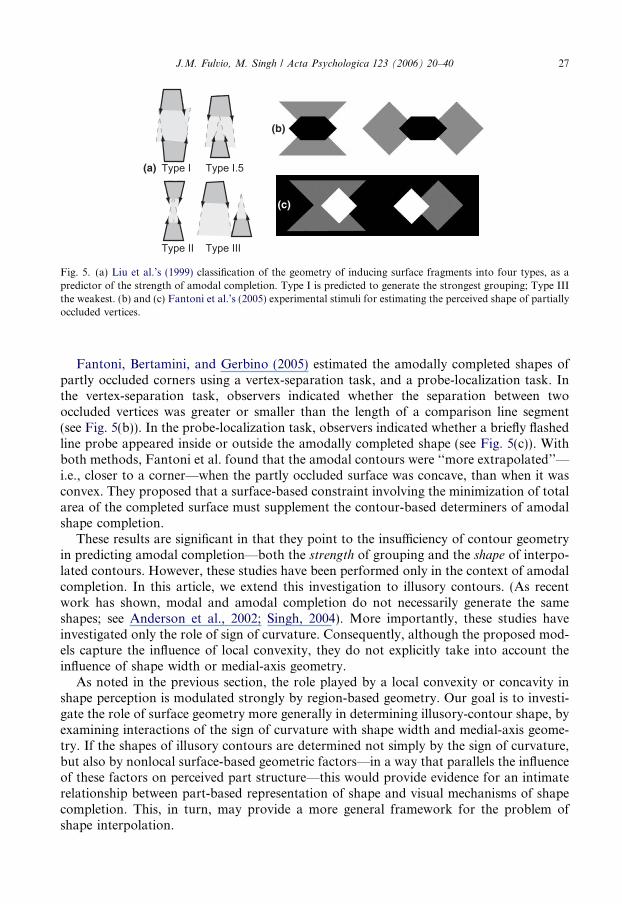
Fig. 5. (a) Liu et al.’s (1999) classification of the geometry of inducing surface fragments into four types, as apredictor of the strength of amodal completion. Type I is predicted to generate the strongest grouping; Type IIIthe weakest. (b) and (c) Fantoni et al.’s (2005) experimental stimuli for estimating the perceived shape of partiallyoccluded vertices.
J.M. Fulvio, M. Singh / Acta Psychologica 123 (2006) 20–40 27
Fantoni, Bertamini, and Gerbino (2005) estimated the amodally completed shapes ofpartly occluded corners using a vertex-separation task, and a probe-localization task. Inthe vertex-separation task, observers indicated whether the separation between twooccluded vertices was greater or smaller than the length of a comparison line segment(see Fig. 5(b)). In the probe-localization task, observers indicated whether a briefly flashedline probe appeared inside or outside the amodally completed shape (see Fig. 5(c)). Withboth methods, Fantoni et al. found that the amodal contours were ‘‘more extrapolated’’—i.e., closer to a corner—when the partly occluded surface was concave, than when it wasconvex. They proposed that a surface-based constraint involving the minimization of totalarea of the completed surface must supplement the contour-based determiners of amodalshape completion.
These results are significant in that they point to the insufficiency of contour geometryin predicting amodal completion—both the strength of grouping and the shape of interpo-lated contours. However, these studies have been performed only in the context of amodalcompletion. In this article, we extend this investigation to illusory contours. (As recentwork has shown, modal and amodal completion do not necessarily generate the sameshapes; see Anderson et al., 2002; Singh, 2004). More importantly, these studies haveinvestigated only the role of sign of curvature. Consequently, although the proposed mod-els capture the influence of local convexity, they do not explicitly take into account theinfluence of shape width or medial-axis geometry.
As noted in the previous section, the role played by a local convexity or concavity inshape perception is modulated strongly by region-based geometry. Our goal is to investi-gate the role of surface geometry more generally in determining illusory-contour shape, byexamining interactions of the sign of curvature with shape width and medial-axis geome-try. If the shapes of illusory contours are determined not simply by the sign of curvature,but also by nonlocal surface-based geometric factors—in a way that parallels the influenceof these factors on perceived part structure—this would provide evidence for an intimaterelationship between part-based representation of shape and visual mechanisms of shapecompletion. This, in turn, may provide a more general framework for the problem ofshape interpolation.
(a) (b)
Fig. 6. (a) Stereoscopic illusory-contour configurations used in Experiment 1. (Cross-fusers should fuse the righttwo images; divergers the left two images.) When fused, the horizontally oriented shape (convex diamond orconcave bowtie) is perceived as completed and floating in front of the vertical rectangle. These stimuli were usedas the ‘‘standard’’ displays; observers adjusted the shape of a comparison figure (see Fig. 8) in order to matchthe shape of the illusory contours in the standard display. (b) Schematic depiction of the perceived depthlayering.
28 J.M. Fulvio, M. Singh / Acta Psychologica 123 (2006) 20–40
4. Experiment 1: Sign of curvature and shape width
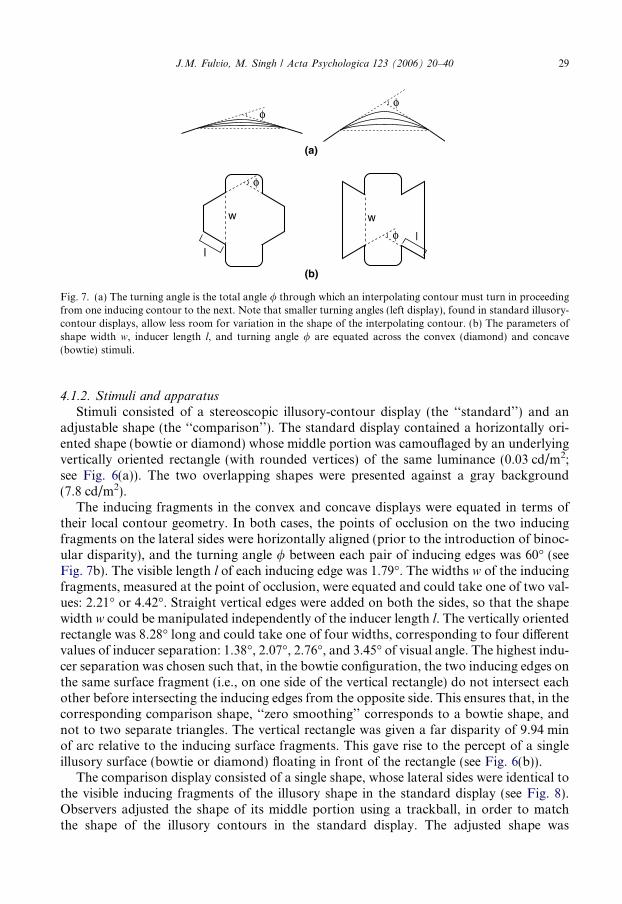
Experiment 1 uses illusory-contour displays that equate the local geometry of inducing-contour pairs, and manipulates the convexity of the enclosed surface. The displays containtwo inducing surface fragments (on the sides of a vertically oriented rectangle; see Fig. 6),rather than three or four inducers, as in the standard Kanizsa-type displays. This config-uration was employed because it forces the illusory contour to turn through a larger anglein proceeding from one inducing contour to the next. Smaller turning angles, as found instandard illusory-contour displays, allow less room for the shapes of the illusory contoursto vary (see Fig. 7(a))—and thereby make it less likely that differences in the shapes of illu-sory contours can be detected (see Singh, 2004). Unlike the standard IC displays, however,this configuration requires binocular disparity to define the relative depth of the illusorycontours, and to produce a vivid percept of their shape.
The two shape types used to manipulate the convexity of the enclosed surface are abowtie with concavities that divide the shape into two distinct parts, and a convexdiamond. Also manipulated are the width of the illusory surface and the separationbetween the inducing fragments. Illusory-contour shapes are measured using a paramet-ric shape-adjustment method, in which observers adjust the shape of a comparison stim-ulus in order to match the shape of the illusory surface in the standard display (Singh,2004).
4.1. Methods
4.1.1. Observers
Seventeen Rutgers University students participated in the experiment in exchange forcourse credit. All were naıve to the purpose of the experiment.
(a)
(b)
l
w
φ
φ
l
w
φ
φ
Fig. 7. (a) The turning angle is the total angle / through which an interpolating contour must turn in proceedingfrom one inducing contour to the next. Note that smaller turning angles (left display), found in standard illusory-contour displays, allow less room for variation in the shape of the interpolating contour. (b) The parameters ofshape width w, inducer length l, and turning angle / are equated across the convex (diamond) and concave(bowtie) stimuli.
J.M. Fulvio, M. Singh / Acta Psychologica 123 (2006) 20–40 29
4.1.2. Stimuli and apparatus
Stimuli consisted of a stereoscopic illusory-contour display (the ‘‘standard’’) and anadjustable shape (the ‘‘comparison’’). The standard display contained a horizontally ori-ented shape (bowtie or diamond) whose middle portion was camouflaged by an underlyingvertically oriented rectangle (with rounded vertices) of the same luminance (0.03 cd/m2;see Fig. 6(a)). The two overlapping shapes were presented against a gray background(7.8 cd/m2).
The inducing fragments in the convex and concave displays were equated in terms oftheir local contour geometry. In both cases, the points of occlusion on the two inducingfragments on the lateral sides were horizontally aligned (prior to the introduction of binoc-ular disparity), and the turning angle / between each pair of inducing edges was 60� (seeFig. 7b). The visible length l of each inducing edge was 1.79�. The widths w of the inducingfragments, measured at the point of occlusion, were equated and could take one of two val-ues: 2.21� or 4.42�. Straight vertical edges were added on both the sides, so that the shapewidth w could be manipulated independently of the inducer length l. The vertically orientedrectangle was 8.28� long and could take one of four widths, corresponding to four differentvalues of inducer separation: 1.38�, 2.07�, 2.76�, and 3.45� of visual angle. The highest indu-cer separation was chosen such that, in the bowtie configuration, the two inducing edges onthe same surface fragment (i.e., on one side of the vertical rectangle) do not intersect eachother before intersecting the inducing edges from the opposite side. This ensures that, in thecorresponding comparison shape, ‘‘zero smoothing’’ corresponds to a bowtie shape, andnot to two separate triangles. The vertical rectangle was given a far disparity of 9.94 minof arc relative to the inducing surface fragments. This gave rise to the percept of a singleillusory surface (bowtie or diamond) floating in front of the rectangle (see Fig. 6(b)).
The comparison display consisted of a single shape, whose lateral sides were identical tothe visible inducing fragments of the illusory shape in the standard display (see Fig. 8).Observers adjusted the shape of its middle portion using a trackball, in order to matchthe shape of the illusory contours in the standard display. The adjusted shape was
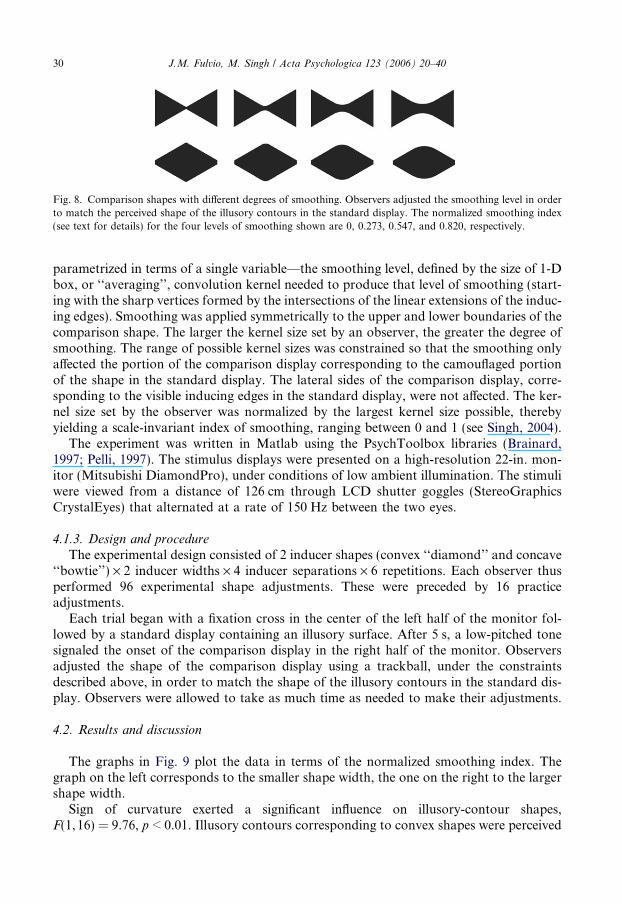
Fig. 8. Comparison shapes with different degrees of smoothing. Observers adjusted the smoothing level in orderto match the perceived shape of the illusory contours in the standard display. The normalized smoothing index(see text for details) for the four levels of smoothing shown are 0, 0.273, 0.547, and 0.820, respectively.
30 J.M. Fulvio, M. Singh / Acta Psychologica 123 (2006) 20–40
parametrized in terms of a single variable—the smoothing level, defined by the size of 1-Dbox, or ‘‘averaging’’, convolution kernel needed to produce that level of smoothing (start-ing with the sharp vertices formed by the intersections of the linear extensions of the induc-ing edges). Smoothing was applied symmetrically to the upper and lower boundaries of thecomparison shape. The larger the kernel size set by an observer, the greater the degree ofsmoothing. The range of possible kernel sizes was constrained so that the smoothing onlyaffected the portion of the comparison display corresponding to the camouflaged portionof the shape in the standard display. The lateral sides of the comparison display, corre-sponding to the visible inducing edges in the standard display, were not affected. The ker-nel size set by the observer was normalized by the largest kernel size possible, therebyyielding a scale-invariant index of smoothing, ranging between 0 and 1 (see Singh, 2004).
The experiment was written in Matlab using the PsychToolbox libraries (Brainard,1997; Pelli, 1997). The stimulus displays were presented on a high-resolution 22-in. mon-itor (Mitsubishi DiamondPro), under conditions of low ambient illumination. The stimuliwere viewed from a distance of 126 cm through LCD shutter goggles (StereoGraphicsCrystalEyes) that alternated at a rate of 150 Hz between the two eyes.
4.1.3. Design and procedure
The experimental design consisted of 2 inducer shapes (convex ‘‘diamond’’ and concave‘‘bowtie’’) · 2 inducer widths · 4 inducer separations · 6 repetitions. Each observer thusperformed 96 experimental shape adjustments. These were preceded by 16 practiceadjustments.
Each trial began with a fixation cross in the center of the left half of the monitor fol-lowed by a standard display containing an illusory surface. After 5 s, a low-pitched tonesignaled the onset of the comparison display in the right half of the monitor. Observersadjusted the shape of the comparison display using a trackball, under the constraintsdescribed above, in order to match the shape of the illusory contours in the standard dis-play. Observers were allowed to take as much time as needed to make their adjustments.
4.2. Results and discussion
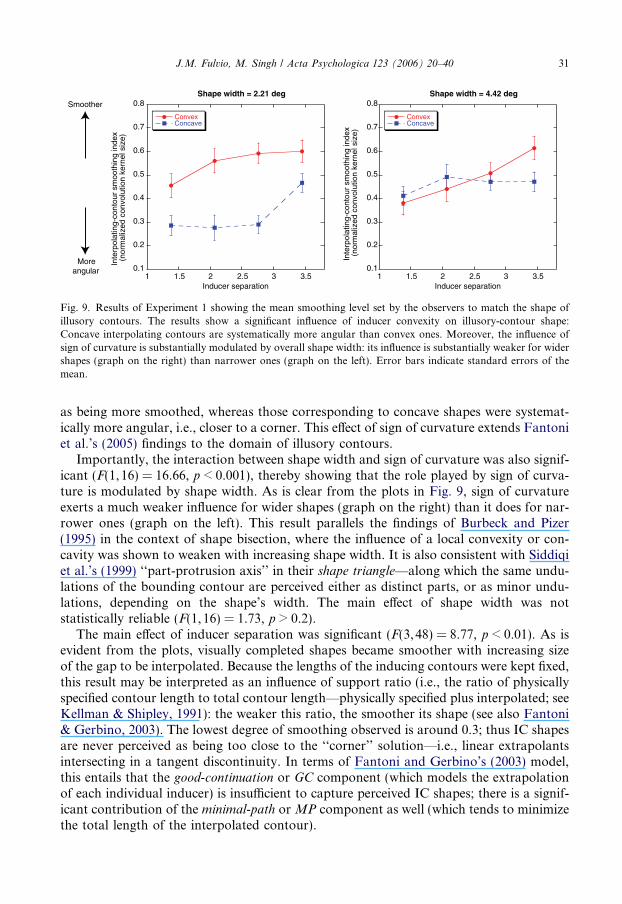
The graphs in Fig. 9 plot the data in terms of the normalized smoothing index. Thegraph on the left corresponds to the smaller shape width, the one on the right to the largershape width.
Sign of curvature exerted a significant influence on illusory-contour shapes,F(1,16) = 9.76, p < 0.01. Illusory contours corresponding to convex shapes were perceived
0.1
0.2
0.3
0.4
0.5
0.6
0.7
0.8
1 1.5 2 2.5 3 3.5
Shape width = 2.21 deg
ConvexConcave
Inte
rpol
atin
g-co
ntou
r sm
ooth
ing
inde
x(n
orm
aliz
ed c
onvo
lutio
n ke
rnel
siz
e)
Inducer separation
0.1
0.2
0.3
0.4
0.5
0.6
0.7
0.8
1 1.5 2 2.5 3 3.5
Shape width = 4.42 deg
ConvexConcave
Inte
rpol
atin
g-co
ntou
r sm
ooth
ing
inde
x(n
orm
aliz
ed c
onvo
lutio
n ke
rnel
siz
e)
Inducer separation
Smoother
Moreangular
Fig. 9. Results of Experiment 1 showing the mean smoothing level set by the observers to match the shape ofillusory contours. The results show a significant influence of inducer convexity on illusory-contour shape:Concave interpolating contours are systematically more angular than convex ones. Moreover, the influence ofsign of curvature is substantially modulated by overall shape width: its influence is substantially weaker for widershapes (graph on the right) than narrower ones (graph on the left). Error bars indicate standard errors of themean.
J.M. Fulvio, M. Singh / Acta Psychologica 123 (2006) 20–40 31
as being more smoothed, whereas those corresponding to concave shapes were systemat-ically more angular, i.e., closer to a corner. This effect of sign of curvature extends Fantoniet al.’s (2005) findings to the domain of illusory contours.
Importantly, the interaction between shape width and sign of curvature was also signif-icant (F(1, 16) = 16.66, p < 0.001), thereby showing that the role played by sign of curva-ture is modulated by shape width. As is clear from the plots in Fig. 9, sign of curvatureexerts a much weaker influence for wider shapes (graph on the right) than it does for nar-rower ones (graph on the left). This result parallels the findings of Burbeck and Pizer(1995) in the context of shape bisection, where the influence of a local convexity or con-cavity was shown to weaken with increasing shape width. It is also consistent with Siddiqiet al.’s (1999) ‘‘part-protrusion axis’’ in their shape triangle—along which the same undu-lations of the bounding contour are perceived either as distinct parts, or as minor undu-lations, depending on the shape’s width. The main effect of shape width was notstatistically reliable (F(1, 16) = 1.73, p > 0.2).
The main effect of inducer separation was significant (F(3, 48) = 8.77, p < 0.01). As isevident from the plots, visually completed shapes became smoother with increasing sizeof the gap to be interpolated. Because the lengths of the inducing contours were kept fixed,this result may be interpreted as an influence of support ratio (i.e., the ratio of physicallyspecified contour length to total contour length—physically specified plus interpolated; seeKellman & Shipley, 1991): the weaker this ratio, the smoother its shape (see also Fantoni& Gerbino, 2003). The lowest degree of smoothing observed is around 0.3; thus IC shapesare never perceived as being too close to the ‘‘corner’’ solution—i.e., linear extrapolantsintersecting in a tangent discontinuity. In terms of Fantoni and Gerbino’s (2003) model,this entails that the good-continuation or GC component (which models the extrapolationof each individual inducer) is insufficient to capture perceived IC shapes; there is a signif-icant contribution of the minimal-path or MP component as well (which tends to minimizethe total length of the interpolated contour).
32 J.M. Fulvio, M. Singh / Acta Psychologica 123 (2006) 20–40
The results of Experiment 1 demonstrate that the local geometry of inducing contours isnot sufficient to predict the shape of illusory contours. In the stimuli used, local contourgeometry was equated across the convex and concave shapes, and across the two shapewidths used. Nevertheless, large differences were observed in illusory-contour shapes: con-vex contours were significantly more smoothed than concave ones, and the influence ofsign of curvature was significantly modulated by the width of the shapes. Surface geometrythus plays an important role in determining the shape of illusory contours.
5. Experiment 2: Sign of curvature and medial-axis geometry
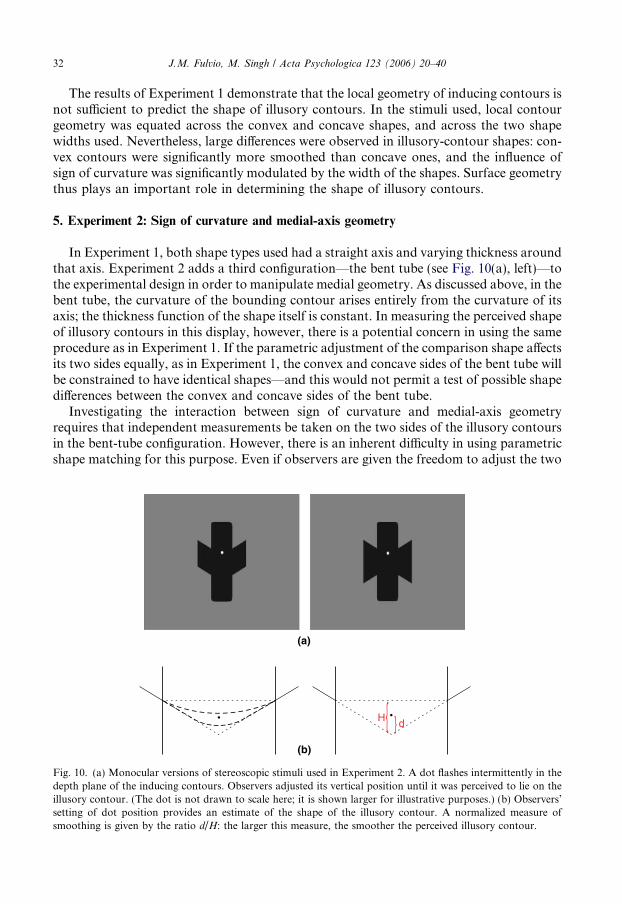
In Experiment 1, both shape types used had a straight axis and varying thickness aroundthat axis. Experiment 2 adds a third configuration—the bent tube (see Fig. 10(a), left)—tothe experimental design in order to manipulate medial geometry. As discussed above, in thebent tube, the curvature of the bounding contour arises entirely from the curvature of itsaxis; the thickness function of the shape itself is constant. In measuring the perceived shapeof illusory contours in this display, however, there is a potential concern in using the sameprocedure as in Experiment 1. If the parametric adjustment of the comparison shape affectsits two sides equally, as in Experiment 1, the convex and concave sides of the bent tube willbe constrained to have identical shapes—and this would not permit a test of possible shapedifferences between the convex and concave sides of the bent tube.
Investigating the interaction between sign of curvature and medial-axis geometryrequires that independent measurements be taken on the two sides of the illusory contoursin the bent-tube configuration. However, there is an inherent difficulty in using parametricshape matching for this purpose. Even if observers are given the freedom to adjust the two
}{dH
(a)
(b)
Fig. 10. (a) Monocular versions of stereoscopic stimuli used in Experiment 2. A dot flashes intermittently in thedepth plane of the inducing contours. Observers adjusted its vertical position until it was perceived to lie on theillusory contour. (The dot is not drawn to scale here; it is shown larger for illustrative purposes.) (b) Observers’setting of dot position provides an estimate of the shape of the illusory contour. A normalized measure ofsmoothing is given by the ratio d/H: the larger this measure, the smoother the perceived illusory contour.
J.M. Fulvio, M. Singh / Acta Psychologica 123 (2006) 20–40 33
sides of the comparison shape separately, there is nevertheless a danger that their shapesetting on one side may interfere with the adjustment of the other—e.g., via a bias towardkeeping the two sides of the comparison shape symmetric or parallel. To circumvent thisproblem, we use a different experimental method to measure the shapes of illusory con-tours—one that does not rely on a separate comparison display for shape measurement(see Anderson & Barth, 1999). (Variants of this method, involving either the adjustmentof a line probe (Fantoni et al., 2005) or dot-localization using a 2AFC method, (Guttman& Kellman, 2004) have also been employed.) A small dot flashes intermittently—its hor-izontal location constrained to be equidistant from the two points of occlusion. Observers’task is to adjust the vertical location of the dot so that it appears to lie on the boundary ofthe illusory surface. The intermittent flashing of the dot minimizes the influence that thepresence of the dot may have on the perceived shape of the illusory contour. The measure-ment of the illusory-contour shape along this vertical cross-section allows for an estima-tion of its degree of smoothness: the closer the setting is to the intersection of the linearextensions of the two inducing edges, the more angular the illusory shape is (seeFig. 10(b)).
Two possible results may be predicted, depending on whether illusory-contour shape isdetermined simply by local convexity and concavity, or influenced by medial geometry aswell. If it is determined simply by local sign of curvature, the shape difference between theconvex and concave illusory contours should be the same, irrespective of whether the con-vexities and concavities belong to a shape with a straight axis and varying thickness (i.e.,diamond or bowtie), or to one with a curved axis and constant thickness (i.e., bent tube).On the other hand, if illusory-contour shape is influenced by nonlocal geometry involvingthe medial axis, then the difference between convex and concave cases should be signifi-cantly smaller in the case of the bent tube. As noted earlier, the medial-axis geometryof bent tube is not consistent with a two-part structure, despite the presence of a concavity(see Siddiqi et al., 1999; Barenholtz & Feldman, 2003).
5.1. Methods
5.1.1. Observers
A new group of 15 undergraduate students from Rutgers University participated in theexperiment in exchange for course credit. All were naıve to the purpose of the experiment.
5.1.2. Stimuli and apparatus
The primary difference from Experiment 1 was the absence of a comparison display.Only the stereoscopic illusory-contour display was presented. As before, the different indu-cer types were equated for the local geometry of the inducing-contour pairs—includingturning angle (60�), visible inducing-contour length (1.79�), and inducing-surface widthat the point of occlusion (2.76�). The vertical rectangle had a fixed length of 8.28�, andone of three possible widths: 1.38�, 2.42�, and 3.45�. The rectangle was given a far disparityof 9.94 min of arc relative to the inducing surface fragments. The viewing conditions andapparatus were the same as in Experiment 1.
5.1.3. Design and procedureThe factorial design was sign of curvature (convex, concave) · medial-axis configura-
tion (straight-axis with varying thickness, curved axis with constant thickness) · 3 inducer
34 J.M. Fulvio, M. Singh / Acta Psychologica 123 (2006) 20–40
separations (1.38�, 2.42�, and 3.45�) · 2 measurement boundaries (upper, lower) · 5 repe-titions. Each observer thus performed 120 experimental adjustments. These were precededby 24 practice adjustments.
A stereoscopic illusory-contour display was presented in the center of the screen. Fol-lowing a 1000 ms delay, a small light-gray dot (22.1 cd/m2) of radius 2 pixels (1.66 min ofarc) began to flash intermittently (on for 200 ms, off for 1200 ms). The dot was placed inthe same depth plane as the inducing contours, and was constrained to lie either in theupper half of the illusory-contour display (for trials measuring the upper boundary) orin its lower half. The dot’s horizontal position was constrained to be equidistant fromthe corresponding points of occlusion on the two sides. Its vertical position was to beadjusted by the observers. Observers’ task was to set its vertical location using a trackball,so that it was perceived to lie on the boundary of the illusory surface.
Observers’ settings were recorded in terms of the vertical distance d from the vertexformed by the intersection of the linear extensions of the two inducing contours (seeFig. 10(b)). This distance was then normalized by the maximal distance permissible—the height H of the triangle formed by the straight-line join of the two points of occlusionand the linear extensions of the two inducing contours. This normalized dot setting pro-vides a scale-invariant measure of the degree of smoothing of the perceived illusory con-tour: the closer the setting is to 0, the more angular is the shape of the illusory contour.
At the beginning of each trial, the dot was initially located at the base of the triangle(d = H). Observers were thus allowed the option of positioning the dot near the base, eventhough this setting does not correspond to a legitimate smooth interpolant—but rather toa straight-line join of the two points of occlusion, generating tangent discontinuities atthose points. (Apart from the fact that no theory of human visual completion predicts this‘‘solution,’’ it is noteworthy that even in Experiment 1, where the parametric shape adjust-ment permitted only smooth interpolating contours, observers’ settings of contoursmoothing remained well below the maximal smoothing allowed; mean settings of smooth-ing index never exceeded 0.75; see Fig. 9.) Because of the more time-consuming nature ofthe task used in Experiment 2—given the pauses between the brief flashes—this portion ofthe range was nevertheless included in order to provide an independent means of assessingwhether or not each observer was performing the experimental task (the observers wereundergraduate students, participating for course credit). Data from observers with morethan a third of their settings within 5% of the distance to the base (i.e., d/H > 0.95) wereexcluded from the analysis. Data from two observers were excluded from the analysisbased on this criterion. (The precise value of the criterion, in fact, makes little difference.The two observers had approximately half of their settings within a few pixels of the base,whereas the average corresponding proportion for the remaining observers was <1%.)
5.2. Results and discussion
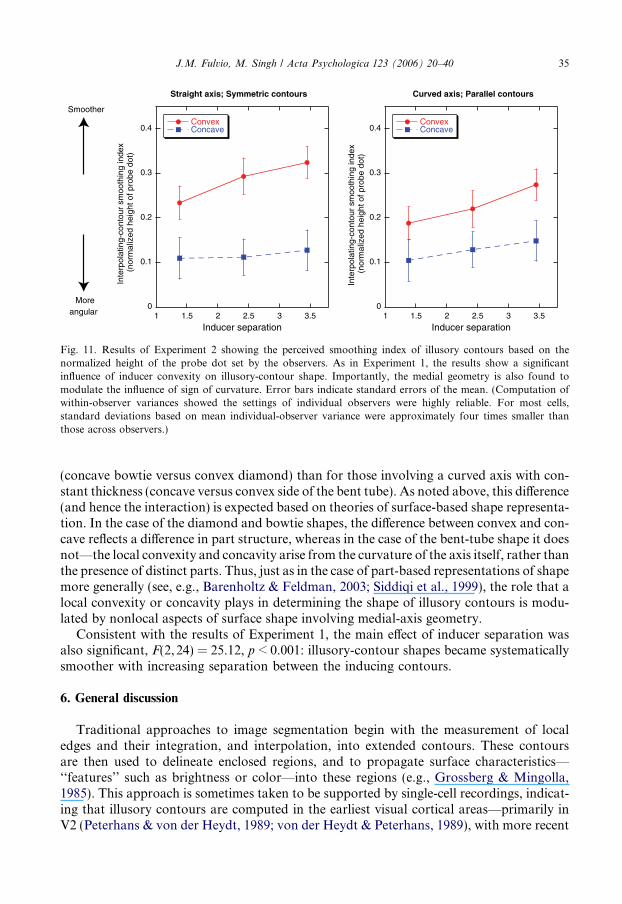
The normalized data for the 13 observers are plotted in Fig. 11. As in Experiment 1, themain effect of convexity was highly significant (F(1, 12) = 47.64, p < 0.001), with illusorycontours being significantly more angular for locally concave contours than for locally con-vex ones. Importantly, the interaction between the sign of curvature and medial-axis geom-etry was also significant (F(1, 12) = 4.97, p < 0.05). As is evident from the graphs in Fig. 11,the difference between the shapes of locally convex and locally concave contours is substan-tially greater for surface geometries involving a straight axis with a varying thickness
0
0.1
0.2
0.3
0.4
1 1.5 2 2.5 3 3.5
Straight axis; Symmetric contours
ConvexConcave
Inte
rpol
atin
g-co
ntou
r sm
ooth
ing
inde
x(n
orm
aliz
ed h
eigh
t of p
robe
dot
)
Inducer separation
0
0.1
0.2
0.3
0.4
1 1.5 2 2.5 3 3.5
Curved axis; Parallel contours
ConvexConcave
Inte
rpol
atin
g-co
ntou
r sm
ooth
ing
inde
x(n
orm
aliz
ed h
eigh
t of p
robe
dot
)
Inducer separation
Smoother
Moreangular
Fig. 11. Results of Experiment 2 showing the perceived smoothing index of illusory contours based on thenormalized height of the probe dot set by the observers. As in Experiment 1, the results show a significantinfluence of inducer convexity on illusory-contour shape. Importantly, the medial geometry is also found tomodulate the influence of sign of curvature. Error bars indicate standard errors of the mean. (Computation ofwithin-observer variances showed the settings of individual observers were highly reliable. For most cells,standard deviations based on mean individual-observer variance were approximately four times smaller thanthose across observers.)
J.M. Fulvio, M. Singh / Acta Psychologica 123 (2006) 20–40 35
(concave bowtie versus convex diamond) than for those involving a curved axis with con-stant thickness (concave versus convex side of the bent tube). As noted above, this difference(and hence the interaction) is expected based on theories of surface-based shape representa-tion. In the case of the diamond and bowtie shapes, the difference between convex and con-cave reflects a difference in part structure, whereas in the case of the bent-tube shape it doesnot—the local convexity and concavity arise from the curvature of the axis itself, rather thanthe presence of distinct parts. Thus, just as in the case of part-based representations of shapemore generally (see, e.g., Barenholtz & Feldman, 2003; Siddiqi et al., 1999), the role that alocal convexity or concavity plays in determining the shape of illusory contours is modu-lated by nonlocal aspects of surface shape involving medial-axis geometry.
Consistent with the results of Experiment 1, the main effect of inducer separation wasalso significant, F(2, 24) = 25.12, p < 0.001: illusory-contour shapes became systematicallysmoother with increasing separation between the inducing contours.
6. General discussion
Traditional approaches to image segmentation begin with the measurement of localedges and their integration, and interpolation, into extended contours. These contoursare then used to delineate enclosed regions, and to propagate surface characteristics—‘‘features’’ such as brightness or color—into these regions (e.g., Grossberg & Mingolla,1985). This approach is sometimes taken to be supported by single-cell recordings, indicat-ing that illusory contours are computed in the earliest visual cortical areas—primarily inV2 (Peterhans & von der Heydt, 1989; von der Heydt & Peterhans, 1989), with more recent
36 J.M. Fulvio, M. Singh / Acta Psychologica 123 (2006) 20–40
studies implicating V1 as well (Bakin, Nakayama, & Gilbert, 2000; Lee & Nguyen, 2001;Sheth, Sharma, Rao, & Sur, 1996).
Recent work in computational vision has adopted an alternative approach in whichsegmentation is informed right from the start by region-based attributes (e.g., Pao, Gei-ger, & Rubin, 1999; Sharon, Brandt, & Basri, 2000; Shi & Malik, 2000). This approachallows for a quick initial—though low-resolution—computation of salient regions in animage, which can guide high-resolution mechanisms of contour detection and integration.Such an approach is supported by recent fMRI studies on the human visual system,where higher cortical regions involved in surface processing, such as the LOC, have beenshown to exhibit an extremely fast response (90–100 ms) to illusory-contour displays(Mendola, Dale, Fischl, Liu, & Tootell, 1999; Murray et al., 2002), thereby making theidea of feedback to V1 and V2 plausible. Moreover, these areas exhibit a response evenwhen the crisply defined illusory contours have been destroyed by rounding off the pac-men inducers in Kanizsa displays (Stanley & Rubin, 2003), thereby indicating that theresponse to coarsely defined salient regions is not contingent upon the prior computationof contours.
Our results support the latter approach to image segmentation and perceptual organi-zation, by demonstrating an influence of surface geometry on the shape of illusory con-tours. Models of visual completion—whether they be geometric, computational, orneural—have traditionally formulated the problem of shape completion as one of contour
interpolation. Indeed, the geometry of visual shape interpolation has typically beenencoded simply in terms of the local geometry of the inducing contours. The synthesisof illusory shapes, in particular, has been presumed to be driven by contour-based mech-anisms—based on 1D constraints or interactions that apply along contours. Constraintsinvolving surface geometry, e.g., the geometry of the region enclosed by these contours,have implicitly been assumed to not play a role.
The reported experiments manipulated a number of factors relating to surface geome-try, while preserving the local geometry of inducing-contour pairs. In both experiments,the data exhibited large and systematic influences of surface geometry on the shape of illu-sory contours. First, locally concave inducers were found to generate systematically moreangular illusory-contour shapes than corresponding locally convex inducers. This firstresult extends recent findings on amodal completion (Fantoni et al., 2005) to the domainof illusory contours. Importantly, however, our results also went beyond sign of curvatureby demonstrating systematic influences of nonlocal surface geometry. The influence of signof curvature on illusory-contour shape was found to be modulated significantly by thewidth of the shape and its medial geometry. Specifically, the shape difference between con-vex and concave illusory contours was systematically (i) greater for narrower shapes thanwider ones, and (ii) greater for shapes whose surface geometry is consistent with a two-partstructure than for those with a curved axis and constant thickness (where the local concav-ity does not correspond to a part boundary). The observed shape difference between theconvex and concave contours in the curved-axis condition is especially pertinent, sinceit suggests that a constraint based on minimizing total surface area (e.g., Fantoni et al.,2005) or on the attenuation of color diffusion with distance from a contour (Grossberg,1987; Grossberg & Mingolla, 1985) is not sufficient by itself to explain the influence of sur-face geometry on illusory-contour shape. Although an area-based measure can explain theobserved difference in illusory-contour shape between the diamond and bowtie configura-tions used here, it cannot account for the shape difference observed between the convex
J.M. Fulvio, M. Singh / Acta Psychologica 123 (2006) 20–40 37
and concave contours in the bent-tube configuration. The area-based support ratio, forinstance, would of course be the same for the two sides of the bent tube.
The influence of sign of curvature, shape width, and medial geometry on illusory-con-tour shape parallels the role that these factors play in visual shape representation moregenerally—in particular, in organizing shapes into parts (Barenholtz & Feldman, 2003;Burbeck & Pizer, 1995; Siddiqi et al., 1999; Singh & Hoffman, 2001). Geometric factorsthat increase the likelihood and salience of a perceptual part boundary (such as the pres-ence of a local concavity, a narrower overall width, and medial geometry being consistentwith a multi-part structure) also result in more angular interpolated shapes. These findingssuggest that the influence of these factors on the shape of illusory contours is intimatelyrelated to (and possibly mediated by) the role they play in visual part decomposition. Adetailed investigation of this relationship remains an important topic for future research.
7. Conclusion
Even at the level of illusory ‘‘contours,’’ there is an early contribution of region-basedgeometry which is sensitive to nonlocal shape properties involving medial-axis representa-tion and part decomposition. Models of illusory-contour synthesis must incorporate therole of region-based geometric factors in a way that parallels their role in organizing visualshape representation more generally.
Acknowledgements
We are grateful to Bart Anderson, Jacob Feldman, Eileen Kowler, and Larry Maloneyfor helpful discussions, and Marco Bertamini and a second anonymous referee, as well asthe editors of the special issue, for their comments and suggestions on the manuscript. Thiswork was supported by NSF grant BCS-0216944.
References
Anderson, B. L., & Barth, H. C. (1999). Motion-based mechanisms of illusory contour synthesis. Neuron, 24,433–441.
Anderson, B. L., Singh, M., & Fleming, R. (2002). The interpolation of object and surface structure. Cognitive
Psychology, 44, 148–190.Attneave, F. (1971). Multistability in perception. Scientific American, 225, 63–71.Bakin, J., Nakayama, K., & Gilbert, C. D. (2000). Visual responses in monkey areas V1 and V2 to three-
dimensional surface configurations. The Journal of Neuroscience, 20, 8188–8198.Barenholtz, E., Cohen, E. H., Feldman, J., & Singh, M. (2003). Detection of change in shape: An advantage for
concavities. Cognition, 89(1), 1–9.Barenholtz, E., & Feldman, J. (2003). Visual comparisons within and between object parts: Evidence for a single-
part superiority effect. Vision Research, 43, 1655–1666.Baylis, G. C., & Driver, J. (1994). Parallel computation of symmetry but not repetition in single visual objects.
Visual Cognition, 1, 377–400.Baylis, G. C., & Driver, J. (1995). Obligatory edge assignment in vision: The role of figure and part segmentation
in symmetry detection. Journal of Experimental Psychology: Human Perception and Performance, 21,1323–1342.
Bertamini, M. (2001). The importance of being convex: An advantage for convexity when judging position.Perception, 30, 1295–1310.
Bertamini, M., & Farrant, T. (2005). Detection of change in shape and its relation to part structure. Acta
Psychologica, 120, 35–54.
38 J.M. Fulvio, M. Singh / Acta Psychologica 123 (2006) 20–40
Bertamini, M., & Hulleman, J. (2006). Amodal completion and visual holes (static and moving). Acta
Psychologica, 123, 55–72.Blum, H. (1973). Biological shape and visual science (Part I). Journal of Theoretical Biology, 38, 205–287.Brady, M., & Asada, H. (1984). Smoothed local symmetries and their implementation. The International Journal
of Robotics Research, 3, 36–61.Brainard, D. H. (1997). The Psychophysics Toolbox. Spatial Vision, 10, 433–436.Braunstein, M. L., Hoffman, D. D., & Saidpour, A. (1989). Parts of visual objects: An experimental test of the
minima rule. Perception, 18, 817–826.Burbeck, C. A., & Pizer, S. M. (1995). Object representation by cores: Identifying and representing primitive
spatial regions. Vision Research, 35(13), 1917–1930.Cohen, E. H., Barenholtz, E., Singh, M., & Feldman, J. (2005). What change detection tells us about the visual
representation of shape. Journal of Vision, 5, 313–321.De Winter, J., & Wagemans, J. (2004). Contour-based object identification and segmentation: Stimuli, norms and
data, and software tools. Behavior Research Methods Instruments and Computers, 36, 604–624.De Winter, J., & Wagemans, J. (2006). Segmentation of object outlines into parts: A large-scale integrative study.
Cognition.De Wit, T., & Van Lier, R. (2002). Global visual completion of quasi-regular shapes. Perception, 31, 969–984.Elder, J. H., & Goldberg, R. M. (2002). Ecological statistics of Gestalt laws for the perceptual organization of
contours. Journal of Vision, 2(4), 324–353.Fantoni, C., Bertamini, M., & Gerbino, W. (2005). Contour curvature polarity and surface interpolation. Vision
Research, 45, 1047–1062.Fantoni, C., & Gerbino, W. (2003). Contour interpolation by vector-field combination. Journal of Vision, 3(4),
281–303.Feldman, J., & Singh, M. (2005). Information along contours and object boundaries. Psychological Review,
112(1), 243–252.Field, D., Hayes, A., & Hess, R. (1993). Contour integration by the human visual system: Evidence for a local
‘‘association field’’. Vision Research, 33(2), 173–193.Geisler, W. S., Perry, J. S., Super, B. J., & Gallogly, D. P. (2001). Edge co-occurrence in natural images predicts
contour grouping performance. Vision Research, 41(6), 711–724.Gerbino, W. (2003). The joint. Acta Psychologica, 114, 331–353.Grossberg, S. (1987). Cortical dynamics of three-dimensional form, color, and brightness perception: II.
Binocular theory. Perception & Psychophysics, 41(2), 117–158.Grossberg, S., & Mingolla, E. (1985). Neural dynamics of form perception: Boundary completion, illusory
figures, and neon color spreading. Psychological Review, 92(2), 173–211.Guttman, S. E., & Kellman, P. J. (2004). Contour interpolation revealed by a dot localization paradigm. Vision
Research, 44, 1799–1815.Heitger, F., von der Heydt, R., Peterhans, E., Rosenthaler, L., & Kubler, O. (1998). Simulation of neural contour
mechanisms: Representing anomalous contours. Image and Vision Computing, 16, 407–421.Hoffman, D. D., & Richards, W. A. (1984). Parts of recognition. Cognition, 18, 65–96.Hoffman, D. D., & Singh, M. (1997). Salience of visual parts. Cognition, 63, 29–78.Horn, B. K. P. (1983). The curve of least energy. ACM Transactions on Mathematical Software, 9(4), 441–460.Hulleman, J., te Winkel, W., & Boselie, F. (2000). Concavities as basic features in visual search: Evidence from
search asymmetries. Perception & Psychophysics, 62, 162–174.Jacobs, D. (1996). Robust and efficient detection of salient convex groups. IEEE Transactions on Pattern Analysis
and Machine Intelligence, 18, 23–37.Kellman, P., & Shipley, T. (1991). A theory of visual interpolation in object perception. Cognitive Psychology, 23,
141–221.Kellman, P., Guttman, S., & Wickens, T. (2001). Geometric and neural models of object perception. In T. Shipley
& P. Kellman (Eds.), From fragments to objects: Segmentation and grouping in vision (pp. 183–245). Oxford,UK: Elsevier Science.
Kimia, B., Frankel, I., & Popescu, A. (2003). Euler spiral for shape completion. International Journal of Computer
Vision, 54(1/2), 157–180.Kimia, B., Tannenbaum, A. R., & Zucker, S. W. (1995). Shapes, shocks, and deformations 1. The components of
two-dimensional shape and the reaction–diffusion space. International Journal of Computer Vision, 15, 189–224.Koenderink, J., & van Doorn, A. (1982). The shape of smooth objects and the way contours end. Perception, 11,
129–137.
J.M. Fulvio, M. Singh / Acta Psychologica 123 (2006) 20–40 39
Koffka, K. (1935). Principles of Gestalt Psychology. London: Lund Humphries.Lamote, C., & Wagemans, J. (1999). Rapid integration of contour fragments: From simple filling-in to parts-
based shape description. Visual Cognition, 6(3/4), 345–361.Lee, T., & Nguyen, M. (2001). Dynamics of subjective contour formation in the early visual cortex. Proceedings of
the National Academy of Sciences, USA, 98, 1907–1911.Leyton, M. (1988). A process-grammar for shape. Artificial Intelligence, 34(2), 213–247.Liu, Z., Jacobs, D., & Basri, R. (1999). The role of convexity in perceptual completion: Beyond good
continuation. Vision Research, 39, 4244–4257.Mendola, J., Dale, A., Fischl, B., Liu, A., & Tootell, R. (1999). The representation of illusory and real contour in
cortical visual areas revealed by fMRI. Journal of Neuroscience, 19, 8560–8572.Michotte, A. (1950). On phenomenal permanence: facts and theories. Acta Psychologica, 7, 293–322.Michotte, A., Thines, G., & Crabbe, G. (1991). Amodal completion of perceptual structures. In G. Thines, A.
Costall, & G. Butterworth (Eds.), Michotte’s experimental phenomenology of perception (pp. 140–167).Hillsdale, NJ: Erlbaum (Originally published in French 1964).
Mumford, D. (1994). Elastica and computer vision. In C. L. Bajaj (Ed.), Algebraic geometry and its applications
(pp. 491–506). New York: Springer-Verlag.Murray, M., Wylie, G., Higgins, B., Javitt, D., Schroeder, C., & Foxe, J. (2002). The spatiotemporal dynamics of
illusory-contour processing: Combined high-density electrical mapping, source analysis, and functionalmagnetic resonance imaging. Journal of Neuroscience, 22, 5055–5073.
Nakayama, K., He, Z., & Shimojo, S. (1995). Visual surface representation: A critical link between lower-leveland higher-level vision. In S. M. Kosslyn & D. N. Osherson (Eds.). Visual Cognition: An invitation to
Cognitive Science (2nd ed.) (Vol. 2, pp. 491–506). Cambridge, MA: MIT Press.Neumann, H., & Mingolla, E. (2001). Computational neural models of spatial integration in perceptual grouping.
In T. Shipley & P. Kellman (Eds.), From fragments to objects: Segmentation and grouping in vision
(pp. 353–400). Oxford, UK: Elsevier Science.Pao, H., Geiger, D., & Rubin, N. (1999). Measuring convexity for figure-ground segmentation. Computer Vision
and Pattern Recognition, Proceedings, 948–955.Pasupathy, A., & Connor, C. E. (1999). Responses to contour features in macaque area V4. Journal of
Neurophysiology, 82, 2490–2502.Pelli, D. G. (1997). The Videotoolbox software for visual psychophysics: Transforming numbers into movies.
Spatial Vision, 10, 437–442.Peterhans, E., & von der Heydt, R. (1989). Mechanisms of contour perception in monkey visual cortex ii.
Contours bridging gaps. Journal of Neuroscience, 9, 1749–1763.Sebastian, T. B., & Kimia, B. B. (2005). Curves vs skeletons in object recognition. Signal Processing, 85, 247–263.Sekuler, A. B., Palmer, S. E., & Flynn, C. (1994). Local and global processes in visual completion. Psychological
Science, 5, 260–267.Sharon, E., Brandt, A., & Basri, R. (2000). Fast multiscale image segmentation. Computer Vision and Pattern
Recognition, Proceedings, 70–77.Sheth, B. R., Sharma, J., Rao, C., & Sur, M. (1996). Orientation maps of subjective contours in visual cortex.
Nature, 274, 2110–2115.Shi, J., & Malik, J. (2000). Normalized cuts and image segmentation. IEEE Transactions on Pattern Analysis and
Machine Intelligence, 22, 888–905.Siddiqi, K., Kimia, B., Tannenbaum, A., & Zucker, S. W. (2001). On the psychophysics of the shape triangle.
Vision Research, 41(9), 1153–1178.Siddiqi, K., Kimia, B. B., Tannenbaum, A., & Zucker, S. W. (1999). Shape, shocks and wiggles. Image and Vision
Computing, 17, 365–373.Siddiqi, K., Tresness, K. J., & Kimia, B. B. (1996). Parts of visual form: Psychophysical aspects. Perception, 25,
399–424.Singh, M. (2004). Modal and amodal completion generate different shapes. Psychological Science, 15, 454–459.Singh, M., & Fulvio, J. M. (2005). Visual extrapolation of contour geometry. Proceedings of the National
Academy of Sciences, USA, 102(3), 939–944.Singh, M., & Hoffman, D. D. (1999). Completing visual contours: The relationship between relatability and
minimizing inflections. Perception & Psychophysics, 61, 636–660.Singh, M., & Hoffman, D. D. (2001). Part-based representations of visual shape and implications for visual
cognition. In T. Shipley & P. Kellman (Eds.), From fragments to objects: Segmentation and grouping in vision.Advances in Psychology (Vol. 130, pp. 401–459). Oxford, UK: Elsevier Science.

40 J.M. Fulvio, M. Singh / Acta Psychologica 123 (2006) 20–40
Singh, M., Seyranian, G., & Hoffman, D. D. (1999). Parsing silhouettes: The short-cut rule. Perception &
Psychophysics, 61, 636–660.Stanley, D. A., & Rubin, N. (2003). fMRI activation in response to illusory contours and salient regions in the
human lateral occipital complex. Neuron, 37, 323–331.Tse, P. U. (1999a). Volume completion. Cognitive Psychology, 39, 37–68.Tse, P. U. (1999b). Complete mergeability and amodal completion. Acta Psychologica, 102, 165–201.Ullman, S. (1976). Filling-in the gaps: The shape of subjective contours and a model for their generation.
Biological Cybernetics, 25, 1–6.Van Lier, R. (1999). Investigating global effects in visual occlusion: From a partly occluded square to the back of
a tree trunk. Acta Psychologica, 102, 203–220.Van Lier, R., de Wit, T. C. J., & Koning, A. (2006). Con-fusing contours & pieces of glass. Acta Psychologica,
123, 41–54.Van Lier, R., Van der Helm, P., & Leeuwenberg, E. (1994). Integrating global and local aspects of visual
occlusion. Perception, 23, 883–903.Van Lier, R., Van der Helm, P., & Leeuwenberg, E. (1995). Competing global and local completions in visual
occlusion. Journal of Experimental Psychology: Human Perception and Performance, 21, 571–583.Van Lier, R., & Wagemans, J. (1999). From images to objects: Global and local completions of self-occluded
parts. Journal of Experimental Psychology: Human Perception and Performance, 25, 1721–1741.von der Heydt, R., & Peterhans, E. (1989). Mechanisms of contour perception in monkey visual cortex. I. Lines of
pattern discontinuity. Journal of Neuroscience, 9, 1731–1748.Williams, L. R., & Jacobs, D. W. (1997). Stochastic completion fields: A neural model of illusory contour shape
and salience. Neural Computation, 9, 837–859.Xu, Y., & Singh, M. (2002). Early computation of part structure: Evidence from visual search. Perception &
Psychophysics, 64, 1039–1054.Yin, C., Kellman, P., & Shipley, T. (2000). Surface integration influences depth discrimination. Vision Research,
40, 1969–1978.
Related Documents