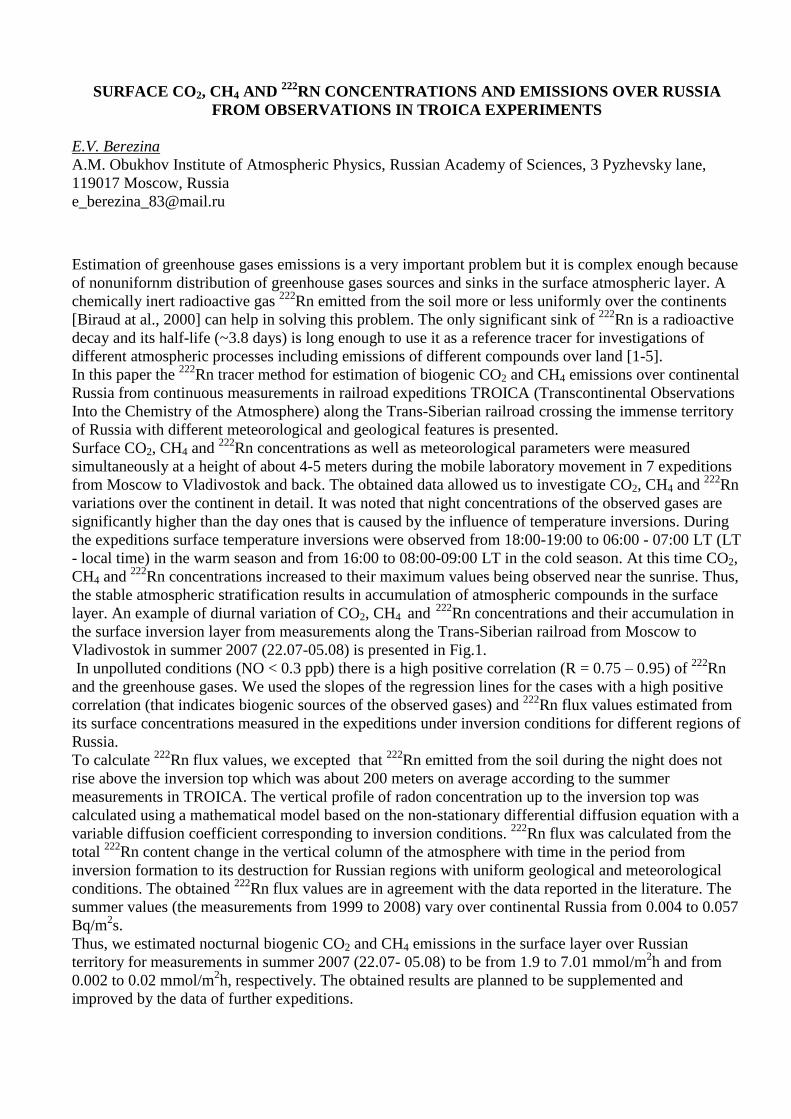
SURFACE CO 2 , CH 4 AND 222 RN CONCENTRATIONS AND EMISSIONS OVER RUSSIA FROM OBSERVATIONS IN TROICA EXPERIMENTS E.V. Berezina A.M. Obukhov Institute of Atmospheric Physics, Russian Academy of Sciences, 3 Pyzhevsky lane, 119017 Moscow, Russia [email protected] Estimation of greenhouse gases emissions is a very important problem but it is complex enough because of nonunifornm distribution of greenhouse gases sources and sinks in the surface atmospheric layer. A chemically inert radioactive gas 222 Rn emitted from the soil more or less uniformly over the continents [Biraud at al., 2000] can help in solving this problem. The only significant sink of 222 Rn is a radioactive decay and its half-life (~3.8 days) is long enough to use it as a reference tracer for investigations of different atmospheric processes including emissions of different compounds over land [1-5]. In this paper the 222 Rn tracer method for estimation of biogenic CO 2 and CH 4 emissions over continental Russia from continuous measurements in railroad expeditions TROICA (Transcontinental Observations Into the Chemistry of the Atmosphere) along the Trans-Siberian railroad crossing the immense territory of Russia with different meteorological and geological features is presented. Surface CO 2 , CH 4 and 222 Rn concentrations as well as meteorological parameters were measured simultaneously at a height of about 4-5 meters during the mobile laboratory movement in 7 expeditions from Moscow to Vladivostok and back. The obtained data allowed us to investigate CO 2 , CH 4 and 222 Rn variations over the continent in detail. It was noted that night concentrations of the observed gases are significantly higher than the day ones that is caused by the influence of temperature inversions. During the expeditions surface temperature inversions were observed from 18:00-19:00 to 06:00 - 07:00 LT (LT - local time) in the warm season and from 16:00 to 08:00-09:00 LT in the cold season. At this time CO 2 , CH 4 and 222 Rn concentrations increased to their maximum values being observed near the sunrise. Thus, the stable atmospheric stratification results in accumulation of atmospheric compounds in the surface layer. An example of diurnal variation of CO 2 , CH 4 and 222 Rn concentrations and their accumulation in the surface inversion layer from measurements along the Trans-Siberian railroad from Moscow to Vladivostok in summer 2007 (22.07-05.08) is presented in Fig.1. In unpolluted conditions (NO < 0.3 ppb) there is a high positive correlation (R = 0.75 – 0.95) of 222 Rn and the greenhouse gases. We used the slopes of the regression lines for the cases with a high positive correlation (that indicates biogenic sources of the observed gases) and 222 Rn flux values estimated from its surface concentrations measured in the expeditions under inversion conditions for different regions of Russia. To calculate 222 Rn flux values, we excepted that 222 Rn emitted from the soil during the night does not rise above the inversion top which was about 200 meters on average according to the summer measurements in TROICA. The vertical profile of radon concentration up to the inversion top was calculated using a mathematical model based on the non-stationary differential diffusion equation with a variable diffusion coefficient corresponding to inversion conditions. 222 Rn flux was calculated from the total 222 Rn content change in the vertical column of the atmosphere with time in the period from inversion formation to its destruction for Russian regions with uniform geological and meteorological conditions. The obtained 222 Rn flux values are in agreement with the data reported in the literature. The summer values (the measurements from 1999 to 2008) vary over continental Russia from 0.004 to 0.057 Bq/m 2 s. Thus, we estimated nocturnal biogenic CO 2 and CH 4 emissions in the surface layer over Russian territory for measurements in summer 2007 (22.07- 05.08) to be from 1.9 to 7.01 mmol/m 2 h and from 0.002 to 0.02 mmol/m 2 h, respectively. The obtained results are planned to be supplemented and improved by the data of further expeditions.

Welcome message from author
This document is posted to help you gain knowledge. Please leave a comment to let me know what you think about it! Share it to your friends and learn new things together.
Transcript
SURFACE CO2, CH4 AND 222
RN CONCENTRATIONS AND EMISSIONS OVER RUSSIA
FROM OBSERVATIONS IN TROICA EXPERIMENTS
E.V. Berezina
A.M. Obukhov Institute of Atmospheric Physics, Russian Academy of Sciences, 3 Pyzhevsky lane,
119017 Moscow, Russia
Estimation of greenhouse gases emissions is a very important problem but it is complex enough because
of nonunifornm distribution of greenhouse gases sources and sinks in the surface atmospheric layer. A
chemically inert radioactive gas 222
Rn emitted from the soil more or less uniformly over the continents
[Biraud at al., 2000] can help in solving this problem. The only significant sink of 222
Rn is a radioactive
decay and its half-life (~3.8 days) is long enough to use it as a reference tracer for investigations of
different atmospheric processes including emissions of different compounds over land [1-5].
In this paper the 222
Rn tracer method for estimation of biogenic CO2 and CH4 emissions over continental
Russia from continuous measurements in railroad expeditions TROICA (Transcontinental Observations
Into the Chemistry of the Atmosphere) along the Trans-Siberian railroad crossing the immense territory
of Russia with different meteorological and geological features is presented.
Surface CO2, CH4 and 222
Rn concentrations as well as meteorological parameters were measured
simultaneously at a height of about 4-5 meters during the mobile laboratory movement in 7 expeditions
from Moscow to Vladivostok and back. The obtained data allowed us to investigate CO2, CH4 and 222
Rn
variations over the continent in detail. It was noted that night concentrations of the observed gases are
significantly higher than the day ones that is caused by the influence of temperature inversions. During
the expeditions surface temperature inversions were observed from 18:00-19:00 to 06:00 - 07:00 LT (LT
- local time) in the warm season and from 16:00 to 08:00-09:00 LT in the cold season. At this time CO2,
CH4 and 222
Rn concentrations increased to their maximum values being observed near the sunrise. Thus,
the stable atmospheric stratification results in accumulation of atmospheric compounds in the surface
layer. An example of diurnal variation of CO2, CH4 and 222
Rn concentrations and their accumulation in
the surface inversion layer from measurements along the Trans-Siberian railroad from Moscow to
Vladivostok in summer 2007 (22.07-05.08) is presented in Fig.1.
In unpolluted conditions (NO < 0.3 ppb) there is a high positive correlation (R = 0.75 – 0.95) of 222
Rn
and the greenhouse gases. We used the slopes of the regression lines for the cases with a high positive
correlation (that indicates biogenic sources of the observed gases) and 222
Rn flux values estimated from
its surface concentrations measured in the expeditions under inversion conditions for different regions of
Russia.
To calculate 222
Rn flux values, we excepted that 222
Rn emitted from the soil during the night does not
rise above the inversion top which was about 200 meters on average according to the summer
measurements in TROICA. The vertical profile of radon concentration up to the inversion top was
calculated using a mathematical model based on the non-stationary differential diffusion equation with a
variable diffusion coefficient corresponding to inversion conditions. 222
Rn flux was calculated from the
total 222
Rn content change in the vertical column of the atmosphere with time in the period from
inversion formation to its destruction for Russian regions with uniform geological and meteorological
conditions. The obtained 222
Rn flux values are in agreement with the data reported in the literature. The
summer values (the measurements from 1999 to 2008) vary over continental Russia from 0.004 to 0.057
Bq/m2s.
Thus, we estimated nocturnal biogenic CO2 and CH4 emissions in the surface layer over Russian
territory for measurements in summer 2007 (22.07- 05.08) to be from 1.9 to 7.01 mmol/m2h and from
0.002 to 0.02 mmol/m2h, respectively. The obtained results are planned to be supplemented and
improved by the data of further expeditions.
Fig.1. Spatial distribution of CO2, CH4, 222
Rn concentrations and the inversion top along the Trans-
Siberian railroad from Moscow to Vladivostok and back in summer 2007 (22.07-05.08).
References
[1] S. Biraud et al., 2000, J. Geophys. Res., 105, D1, 1351–1366.
[2] H. Dörr et al., 1983, J. Geophys. Res., 88, C2, 1309–1313.
[3] M. Shmidt et al., 1996, Tellus, 48, 457–473.
[4] C.Dueñas et al., 1999, Atmos. Environ., 33, 501-510.
[5] Messager et al., 2008, Atmos.Chem.Phys.Discuss., 8, 1191-1237
Acknowledgments. The work is supported by Russian Basic Research Foundation (project No. 10-05-
00317, 10-05-00272). The authors thank I. B. Belikov, C.A.M. Brenninkmejer, A.M. Grisenko for active
participation in the organization of TROICA experiments and all participants for taking part in the
measurements during expeditions.
CARBON DIOXIDE AND WATER VAPOUR FLUXES OF TROPICAL PASTURE AND AFFORESTATION Sebastian Wolf, Werner Eugster, Nina Buchmann ETH Zurich, Institute of Agricultural Sciences, Switzerland [email protected] Tropical ecosystems play an important role for the global carbon and water cycle. They account for 60% of the global terrestrial gross primary production [1], contain 40% of the carbon stored in the terrestrial biosphere [2] and are a major constituent of the global land-atmosphere water exchange [3]. With ongoing deforestation and land-use change, the tropics are increasingly influenced by agroecosystems and pastures [4]. It is not yet fully understood how the carbon and water cycle in the tropics respond to land-use change, particularly in such managed ecosystems, as continuous flux measurements in the tropics are still scarce. Therefore, it is crucial to investigate the biosphere-atmosphere interactions of managed ecosystems in the tropics. Our study investigated ecosystem carbon dioxide (CO2) and water vapour (H2O) fluxes of tropical pasture and native tree species afforestation with the main focus on seasonal variations and carbon sequestration potentials. Comparative eddy covariance measurements of ecosystem CO2 and H2O fluxes were performed in Sardinilla (Panama) from 2007 to 2009. Pronounced seasonal variations were observed in gross primary production (GPP), total ecosystem respiration (TER) and net ecosystem exchange (NEE), which were closely related to radiation, soil moisture and C3 versus C4 plant physiology. The pasture ecosystem was more susceptible to water limitations during the dry season and thus, the conversion from pasture to afforestation reduced seasonal variations in GPP, TER and NEE. Furthermore, El Niño Southern Oscillation (ENSO) events and associated increases in precipitation variability were found to have a strong impact on seasonal variations of CO2 fluxes, particularly on the pasture ecosystem. Soil respiration contributed about half of TER during nighttime, with only small differences between ecosystems or seasons. Temperature was found to have no effect on ecosystem and soil respiration in Sardinilla. Annual GPP was higher in the pasture (2345 gC m-2 yr-1) than in the afforestation ecosystem (2082 gC m-2 yr-1) but overall lower than reported from tropical forests. Substantial carbon sequestration was found in the afforestation (-442 gC m-2 yr-1, negative values denote ecosystem carbon uptake) during 2008, which was in good agreement with biometric observations (-450 gC m-2 yr-1) revealing a total carbon stock of 2122 gC m-2 in above and belowground biomass. Furthermore, estimates for 2007 and 2009 indicated also strong carbon uptake by the afforestation ecosystem. In contrast, the pasture ecosystem was a similarly strong carbon source in 2008 and 2009 (261 gC m-2) and carbon losses were predominantly associated with high stocking densities and periodical overgrazing. The carbon losses from the pasture originated primarily from soil organic matter. Stable isotope (δ13C) analysis indicated rapid carbon turnover following the land conversion from C4 pasture to C3 afforestation. The afforestation of tropical pasture only marginally affected annual ecosystem-scale evapotranspiration (ET; 1114 vs. 1034 mm yr-1 in 2008), but reduced the seasonal variations in ET and largely increased the soil infiltration potential. About half of the annual precipitation was returned to the atmosphere by ET from both ecosystems. In summary, our results present the first multi-year eddy covariance measured CO2 and H2O fluxes for tropical pasture and afforestation in Panama and are one of the very few

ecosystem flux studies from Central America. The results underline the substantial carbon sequestration potential of tropical afforestation and show the impact of seasonal drought and overgrazing on carbon losses from a pasture. Moreover, the land-use change from pasture to afforestation can reduce the seasonal variations of CO2 and H2O fluxes and enhance the ecosystem resilience to seasonal drought. References [1] C. Beer et al., 2010, Science, 329, 834. [2] J. Grace et al., 2001, in: Terrestrial Global Productivity, J. Roy et al., Eds. (Academic Press, San Diego, CA, USA), pp. 401-426. [3] D. Werth and R. Avissar, 2004, J. Hydrometeorol., 5, 100. [4] P. M. Fearnside, 2005, Conserv. Biol., 19, 680.
PHYSICOCHEMICAL PROPERTIES OF AMAZONIAN CLOUD
CONDENSATION NUCLEI
Micael Amore Cecchini (1), Paulo Artaxo(2)
(1) Instituto Nacional de Pesquisas Espaciais, Brazil
(2) Instituto de Física, Universidade de São Paulo, Brazil
Aerosol particles play an important role on the earth climate, as they interact directly
with the incident solar radiation and can alter clouds properties by serving as Cloud
Condensation Nuclei (CCN) (IPCC, 2007). The goal of this work is to study the
Amazonian atmospheric aerosols, particularly those from biogenic emissions, through
the characterization of their physicochemical and optical properties. We will analyze the
aerosol light scattering properties jointly with their efficiency at acting as CCN.
The data were collected during the LBA/AMAZE-08 campaign on the city of Manaus-
AM, during the period from February 7 to March 12, at the wet season. Measurements
were done for aerosol size distribution, total particle concentration (CN) and CCN
concentration as well as particle optical properties such as absorption measured with a
MAAP instrument and scattering coefficients (measured with a TSI nephelometer) (ba
and bs, respectively).
We developed an algorithm capable of estimating the CCN concentration from the
particulate size distribution and their chemical composition. The algorithm is based on
the k-Köhler theory, which synthesize the particle chemical composition into a single
parameter representing their hygroscopicity (k). Gunthe et al. (2009) states that the k
coefficient has a mean value of 0.213 for the Amazonian biogenic aerosols. Thus, this
parameter was considered constant during the whole period of analysis and
implemented into the algorithm. We concluded that the observed CCN concentrations
were well reproduced by the algorithm.
The particle size distribution was found to be the most important factor on the cloud
droplet formation, despite the aerosol chemical composition. The mean activated
fraction (the ratio between CN and CCN) was found to be 39% ± 15% (average ±
standard deviation) for the biogenic aerosols, which implies that those particles are
relatively efficient at nucleating cloud droplets. Considering k as 0.60 (characteristic of
ammonium sulfate) on the model, the obtained activated fraction was 54% ± 16%,
which shows the impact of the particle chemical composition on their capacity as acting
as CCN.
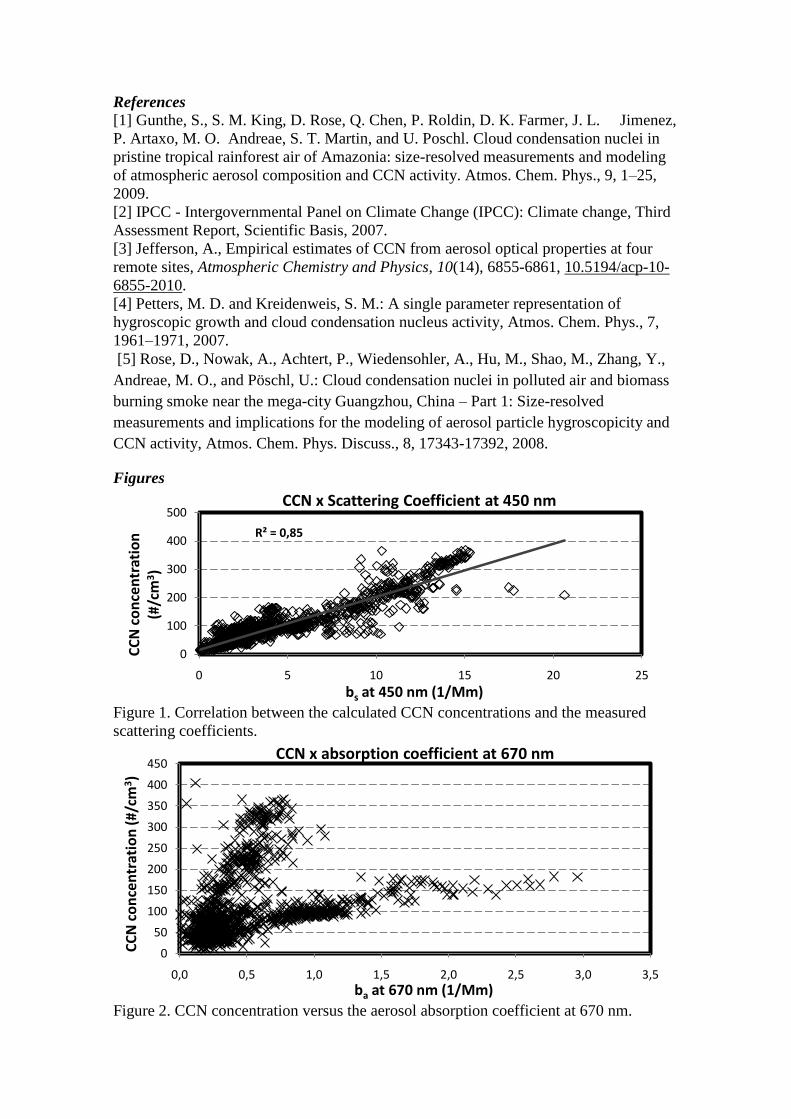
The CCN concentrations calculated by the algorithm showed a significant linear
correlation with the scattering coefficient at the wave length of 450 nm (figure 1), which
shows that the particle size distribution has a strong effect on both factors. When we
compared the CCN concentrations to the absorption coefficient, two linear tendencies
were observed (figure 2). Those tendencies apparently indicate two groups of particles
with distinct chemical composition (eg. biogenic and biomass burning aerosols).
However, we couldn’t associate groups of particles to the tendencies observed in figure
2, as additional data would be needed. Nevertheless, it’s possible to observe that the
particle chemical composition plays an important role on its efficiency at absorbing
solar radiation. In short, we were able to observe that the physical properties of the
aerosols are dominant to its efficiency at scattering solar radiation, whereas the particle
chemical composition affects primarily their absorption coefficient.
References
[1] Gunthe, S., S. M. King, D. Rose, Q. Chen, P. Roldin, D. K. Farmer, J. L. Jimenez,
P. Artaxo, M. O. Andreae, S. T. Martin, and U. Poschl. Cloud condensation nuclei in
pristine tropical rainforest air of Amazonia: size-resolved measurements and modeling
of atmospheric aerosol composition and CCN activity. Atmos. Chem. Phys., 9, 1–25,
2009.
[2] IPCC - Intergovernmental Panel on Climate Change (IPCC): Climate change, Third
Assessment Report, Scientific Basis, 2007.
[3] Jefferson, A., Empirical estimates of CCN from aerosol optical properties at four
remote sites, Atmospheric Chemistry and Physics, 10(14), 6855-6861, 10.5194/acp-10-
6855-2010.
[4] Petters, M. D. and Kreidenweis, S. M.: A single parameter representation of
hygroscopic growth and cloud condensation nucleus activity, Atmos. Chem. Phys., 7,
1961–1971, 2007.
[5] Rose, D., Nowak, A., Achtert, P., Wiedensohler, A., Hu, M., Shao, M., Zhang, Y.,
Andreae, M. O., and Pöschl, U.: Cloud condensation nuclei in polluted air and biomass
burning smoke near the mega-city Guangzhou, China – Part 1: Size-resolved
measurements and implications for the modeling of aerosol particle hygroscopicity and
CCN activity, Atmos. Chem. Phys. Discuss., 8, 17343-17392, 2008.
Figures
Figure 1. Correlation between the calculated CCN concentrations and the measured
scattering coefficients.
Figure 2. CCN concentration versus the aerosol absorption coefficient at 670 nm.
R² = 0,85
0
100
200
300
400
500
0 5 10 15 20 25
CC
N c
on
cen
trat
ion
(#
/cm
3)
bs at 450 nm (1/Mm)
CCN x Scattering Coefficient at 450 nm
0
50
100
150
200
250
300
350
400
450
0,0 0,5 1,0 1,5 2,0 2,5 3,0 3,5
CC
N c
on
cen
trat
ion
(#/
cm3)
ba at 670 nm (1/Mm)
CCN x absorption coefficient at 670 nm
CONTINUOUS VOC FLUX MEASUREMENTS ON BOREAL FOREST FLOOR
Hermanni Aaltonen (1, 2), Juho Aalto (2), Jaana Bäck (2), Pasi Kolari (2), Mari Pihlatie (2),
Jukka Pumpanen (2), Markku Kulmala (2), Eero Nikinmaa (2), Timo Vesala (2)
(1) Finnish Meteorological Institute, Finland
(2) University of Helsinki, Finland
Introduction
Biogenic sources are the main contributor to global volatile organic compound (VOC) emissions
into the atmosphere, where VOCs take part in numerous chemical reactions, the new particle
formation and particle growth as an example 1. From the air chemistry point of view, the VOC
fluxes from boreal forest canopies have been the most intensively studied biogenic source, in
contrast to forest floor VOC fluxes, which measurements have mainly been conducted on short
campaign wise basis 2, 3
. Continuous, long term measurements of VOC fluxes from the forest
floor have not been carried out so far. However, the forest floor has been shown to be an
important VOC source especially in the spring and in the autumn 2, 3
. Climate models lack
measurement data on soil and forest floor VOC fluxes, and instead, more or less estimated values
are used to describe the contribution of ground vegetation and soil to total ecosystem VOC
fluxes.
To increase the level of understanding of biogenic VOC fluxes as well as to provide data for
climate models, we conducted continuous VOC flux measurements on the boreal pine forest
floor during snow-free season.
Material and methods
We measured VOC fluxes from a Scots pine forest floor at the SMEAR II (Station for Measuring
Forest Ecosystem–Atmosphere Relations II), in southern Finland. The forest stand at the
SMEAR II is 48 years old and dominated by Scots pine (Pinus sylvestris). The stand height is
~18 m and the canopy is open, with an average tree density of ~1370 ha-1
4. The most common
vascular plant species and mosses at ground level are lingonberry (Vaccinium vitis-idaea),
bilberry (Vaccinium myrtillus), wavy hair-grass (Deschampsia flexuosa), heather (Calluna
vulgaris), Schreber’s big red stem moss (Pleurozium schreberi) and a dicranum moss (Dicranum
sp.)4. The soil above the homogeneous bedrock is Haplic podzol formed in a glacial till, with an
average depth of 0.5–0.7 m.
The VOC fluxes were measured between 6 May and 15 November 2010 with three permanently
installed polytetrafluoroethylene-coated automated dynamic non-steady-state chambers (80 cm x
40 cm x 25 cm). The chambers were connected to a proton transfer reaction-mass spectrometer
(PTR-MS, Ionicon Analytik, Innsbruck, Austria), and closed during measurement for 15 min.
Each chamber was closed eight times per day. The operation of PTR-MS, calibrations and the
flux calculations are explained detail in Taipale et al. 5. The results from the PTR-MS analyses
are expressed with the measured protonated mass symbol (amu+1, e.g. M33 = methanol). The
masses we measured and the potential contributing compounds for each mass were: M33
methanol, M45 acetaldehyde, M59 acetone, M69 isoprene, M79 benzene, M81 monoterpenes,
M99 hexenal, M101 hexanal, M137 monoterpenes, and M153 methyl salicylate.
Results and discussion
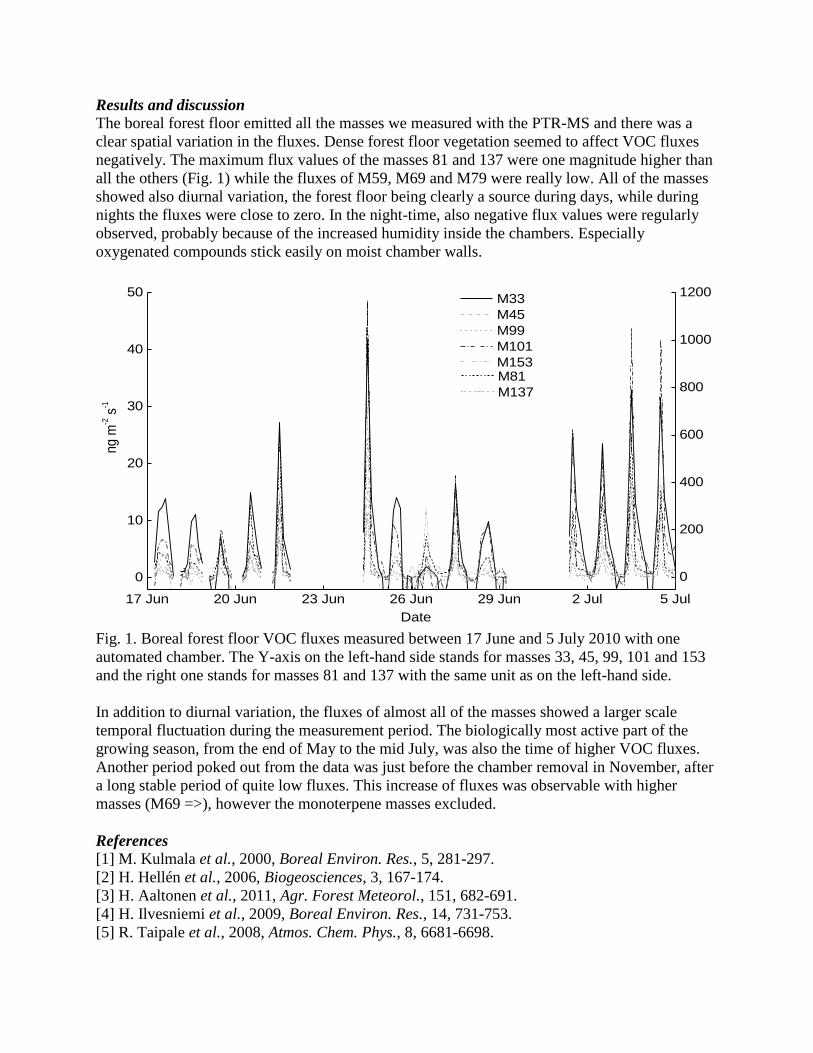
The boreal forest floor emitted all the masses we measured with the PTR-MS and there was a
clear spatial variation in the fluxes. Dense forest floor vegetation seemed to affect VOC fluxes
negatively. The maximum flux values of the masses 81 and 137 were one magnitude higher than
all the others (Fig. 1) while the fluxes of M59, M69 and M79 were really low. All of the masses
showed also diurnal variation, the forest floor being clearly a source during days, while during
nights the fluxes were close to zero. In the night-time, also negative flux values were regularly
observed, probably because of the increased humidity inside the chambers. Especially
oxygenated compounds stick easily on moist chamber walls.
Fig. 1. Boreal forest floor VOC fluxes measured between 17 June and 5 July 2010 with one
automated chamber. The Y-axis on the left-hand side stands for masses 33, 45, 99, 101 and 153
and the right one stands for masses 81 and 137 with the same unit as on the left-hand side.
In addition to diurnal variation, the fluxes of almost all of the masses showed a larger scale
temporal fluctuation during the measurement period. The biologically most active part of the
growing season, from the end of May to the mid July, was also the time of higher VOC fluxes.
Another period poked out from the data was just before the chamber removal in November, after
a long stable period of quite low fluxes. This increase of fluxes was observable with higher
masses (M69 =>), however the monoterpene masses excluded.
References [1] M. Kulmala et al., 2000, Boreal Environ. Res., 5, 281-297.
[2] H. Hellén et al., 2006, Biogeosciences, 3, 167-174.
[3] H. Aaltonen et al., 2011, Agr. Forest Meteorol., 151, 682-691.
[4] H. Ilvesniemi et al., 2009, Boreal Environ. Res., 14, 731-753.
[5] R. Taipale et al., 2008, Atmos. Chem. Phys., 8, 6681-6698.
17 Jun 20 Jun 23 Jun 26 Jun 29 Jun 2 Jul 5 Jul
0
10
20
30
40
50
0
200
400
600
800
1000
1200
ng m
-2 s
-1
Date
M33
M45
M99
M101
M153 M81
M137
IMPORTANCE OF NON-METHANE HYDROCARBONS IN OZONE FORMATION AT A SEMI-ARID URBAN SITE OF INDIA Lokesh SahuPhysical Research Laboratory (PRL), Space and Atmospheric Science Division
, Shyam Lal, S. Venkataramani
Navrangpura, Ahmedabad, India, 380009. e-mail: [email protected] Measurements of light non-methane hydrocarbons (C2-C5 NMHCs) and ozone (O3) were conducted at an urban site of Ahmedabad in India during the year 2002. Climatically, the observation site is influenced by semi-arid ecosystem. The samples were collected for the measurements of NMHCs at distinct locations of India during the winter season. The diurnal distribution of O3 shows elevated values during the daytime and lower values observed in the nighttime and early morning hours, while NMHCs show peaks during the morning and evening rush hours. The diurnal variations of NMHCs are primarily controlled by the emissions and meteorological parameters. On the other hand, the photochemical processes seem to play key role in the observed diurnal variation of O3. The Prop-Equiv concentration and the daily maximum of mixing ratio of ozone (O3max) show similar seasonal trends with their highest levels during the winter season and lowest during the summer monsoon. The monthly averages of total Prop-Equiv concentration of NMHCs and O3max were highest of 16.3 ppbC and 65 ppbv in the months of March and February; and lowest of 3.5 ppbC and 16.7 ppbv in the months of July and June, respectively. Annually, though the abundances of ethane (17.4 %) and propane (20.4 %) were dominant but the Prop-Equiv concentrations of reactive NMHCs were significantly higher compared to less reactive NMHCs. The study is important as O3 is a greenhouse gas in the troposphere and can contribute to the global climate change and air pollution. The elevated mixing ratios of O3 in the boundary layer can adversely impact the human health and crop yields. In general, the photochemical processes involving so called precursor gases such as methane (CH4), non-methane hydrocarbons (NMHCs), carbon monoxide (CO) and NOx (=NO+NO2) control the ambient concentrations of O3.
ON THE EFFECT OF FOREST EDGE ON COHERENT STRUCTURES ABOVE A FOREST CANOPY
A ndrei Serafimovich (1) , Jörg Hübner (1), Fabian Eder (1), Eva Falge (2), Thomas Foken (1)(1) Department of Micrometeorology, University of Bayreuth, Germany(2) Biogeochemistry Department, Max Planck Institute for Chemistry, Mainz, Germany [email protected]
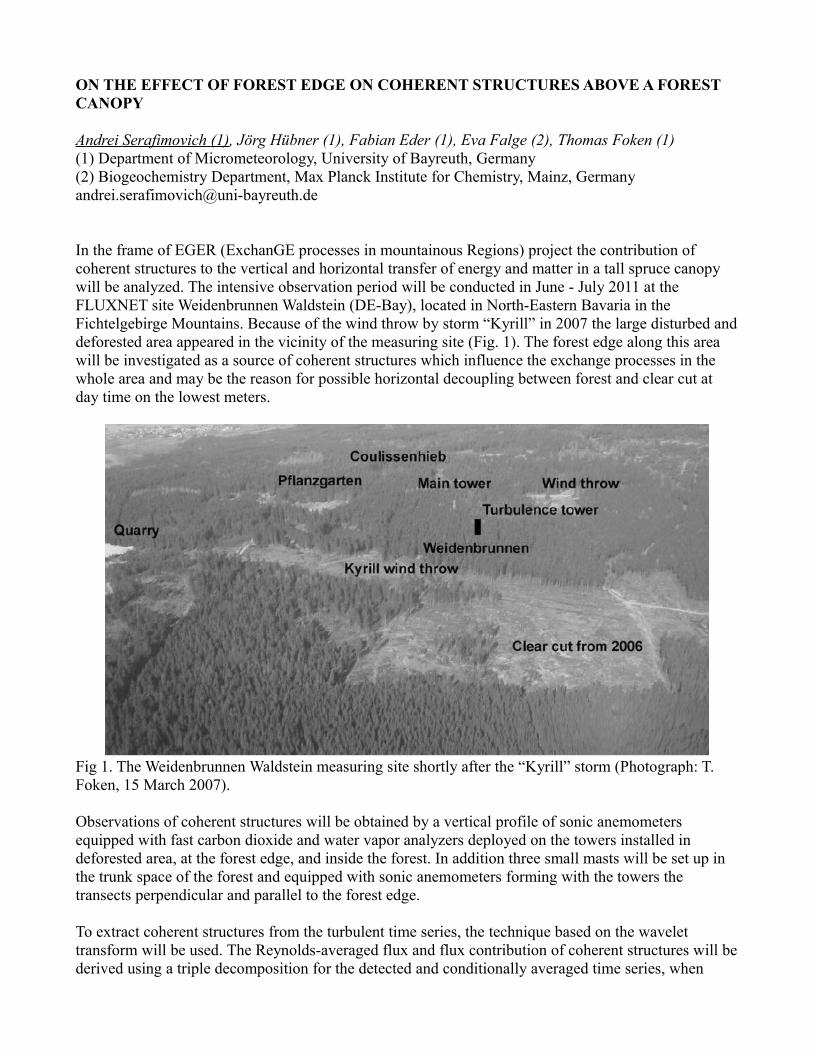
In the frame of EGER (ExchanGE processes in mountainous Regions) project the contribution of coherent structures to the vertical and horizontal transfer of energy and matter in a tall spruce canopy will be analyzed. The intensive observation period will be conducted in June - July 2011 at the FLUXNET site Weidenbrunnen Waldstein (DE-Bay), located in North-Eastern Bavaria in the Fichtelgebirge Mountains. Because of the wind throw by storm “Kyrill” in 2007 the large disturbed and deforested area appeared in the vicinity of the measuring site (Fig. 1). The forest edge along this area will be investigated as a source of coherent structures which influence the exchange processes in the whole area and may be the reason for possible horizontal decoupling between forest and clear cut at day time on the lowest meters.
Fig 1. The Weidenbrunnen Waldstein measuring site shortly after the “Kyrill” storm (Photograph: T. Foken, 15 March 2007).
Observations of coherent structures will be obtained by a vertical profile of sonic anemometers equipped with fast carbon dioxide and water vapor analyzers deployed on the towers installed in deforested area, at the forest edge, and inside the forest. In addition three small masts will be set up in the trunk space of the forest and equipped with sonic anemometers forming with the towers the transects perpendicular and parallel to the forest edge.
To extract coherent structures from the turbulent time series, the technique based on the wavelet transform will be used. The Reynolds-averaged flux and flux contribution of coherent structures will be derived using a triple decomposition for the detected and conditionally averaged time series, when

coherent structures are present. Using relational properties such as sweep and ejection ratios of coherent structures detected at the towers and the variations of the flux contribution with height, coupling processes between the subcanopy, canopy and air above the canopy level will be investigated. Combination of these results with measurements at the forest edge and over deforested area will be used to analyze the effect of the forest edge on the temporal scales of coherent structures and their role in flux transport and coupling processes between forest and deforested area. The obtained results are essential to improve the knowledge about the impact of forest heterogeneity on transport processes. Our contribution will present an overview of the experiment setup as well as first experimental results.
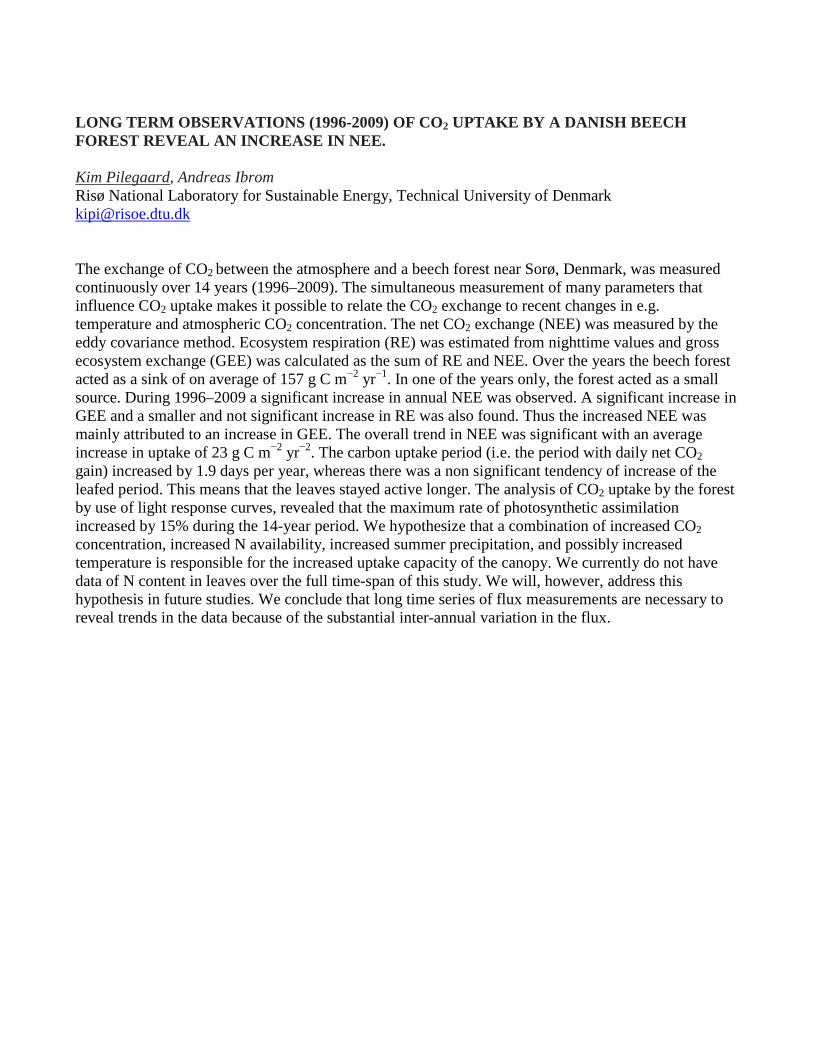
LONG TERM OBSERVATIONS (1996-2009) OF CO2 UPTAKE BY A DANISH BEECH FOREST REVEAL AN INCREASE IN NEE. Kim Pilegaard, Andreas Ibrom Risø National Laboratory for Sustainable Energy, Technical University of Denmark [email protected] The exchange of CO2 between the atmosphere and a beech forest near Sorø, Denmark, was measured continuously over 14 years (1996–2009). The simultaneous measurement of many parameters that influence CO2 uptake makes it possible to relate the CO2 exchange to recent changes in e.g. temperature and atmospheric CO2 concentration. The net CO2 exchange (NEE) was measured by the eddy covariance method. Ecosystem respiration (RE) was estimated from nighttime values and gross ecosystem exchange (GEE) was calculated as the sum of RE and NEE. Over the years the beech forest acted as a sink of on average of 157 g C m−2 yr−1. In one of the years only, the forest acted as a small source. During 1996–2009 a significant increase in annual NEE was observed. A significant increase in GEE and a smaller and not significant increase in RE was also found. Thus the increased NEE was mainly attributed to an increase in GEE. The overall trend in NEE was significant with an average increase in uptake of 23 g C m−2 yr−2. The carbon uptake period (i.e. the period with daily net CO2 gain) increased by 1.9 days per year, whereas there was a non significant tendency of increase of the leafed period. This means that the leaves stayed active longer. The analysis of CO2 uptake by the forest by use of light response curves, revealed that the maximum rate of photosynthetic assimilation increased by 15% during the 14-year period. We hypothesize that a combination of increased CO2 concentration, increased N availability, increased summer precipitation, and possibly increased temperature is responsible for the increased uptake capacity of the canopy. We currently do not have data of N content in leaves over the full time-span of this study. We will, however, address this hypothesis in future studies. We conclude that long time series of flux measurements are necessary to reveal trends in the data because of the substantial inter-annual variation in the flux.
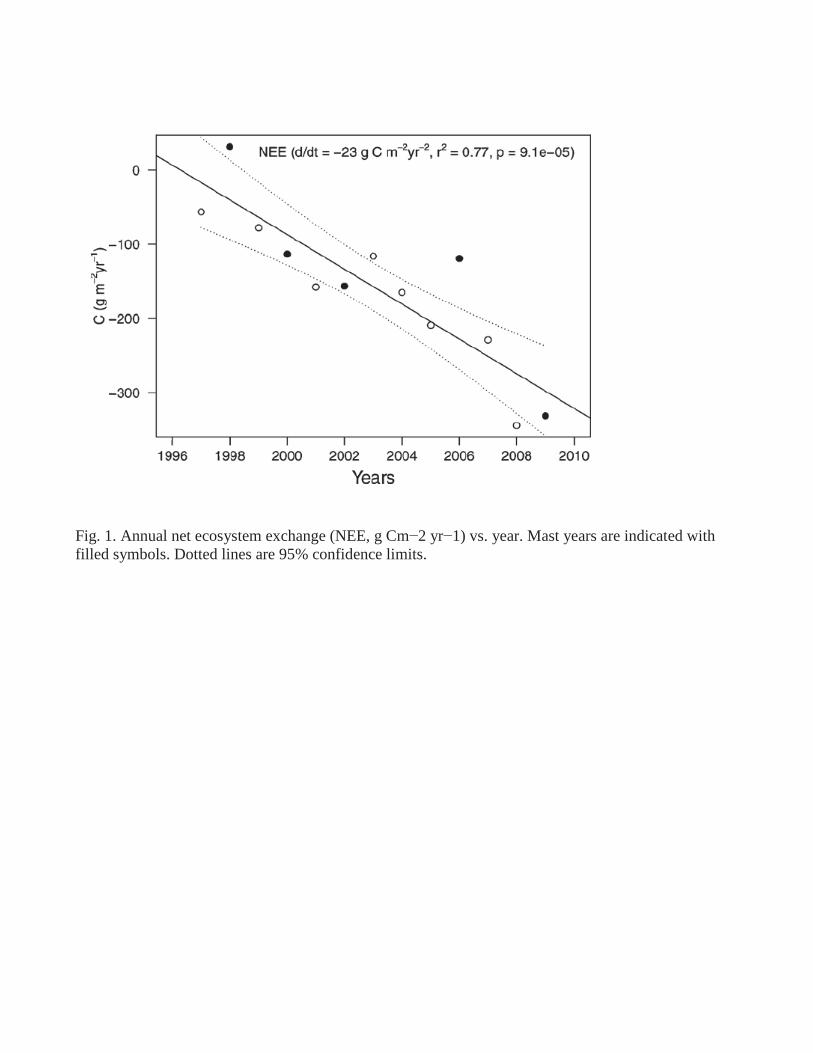
Fig. 1. Annual net ecosystem exchange (NEE, g Cm−2 yr−1) vs. year. Mast years are indicated with filled symbols. Dotted lines are 95% confidence limits.
Effects of temperature on isoprene emission of the tropical tree species Eschweilera
coriacea during leaf phenology in Central Amazon
Eliane Gomes Alves (1), Peter Harley (2), José Francisco C. Gonçalves (1), Kolby
Jardine (3).
(1) National Institute for Amazon Research, Brazil
(2) National Center for Atmospheric Research, U.S.A.
(3) University of Arizona, U.S.A.
Isoprene is quantitatively the most important of the Non-methane Biogenic Volatile
Organic Compounds (BVOC)[1] and has multiple effects on atmospheric chemistry,
carbon balance and climate [2]. It is generally assumed that tropical forests provide
most of the global isoprene budget [3]. Environmental factors such as light and
temperature strongly influence isoprene emission, and leaves of different developmental
stage exhibit different emission capacities [5]. This study investigated the effects of leaf
temperature and leaf developmental stage on photosynthesis and isoprene emission in
Eschweilera coriacea (DC.) S.A. Mori [4], an isoprene emitter and the most abundant
tree species in the Central Amazon. This work was carried out at Reserva Biológica do
Cuieiras, a primary rainforest biological reserve located approximately 100 km north of
Manaus, in the central Amazon Basin, in Amazonas, Brazil (2O 36’ 32.67” S, 60
O 12’
33.48” W, 130 m a.s.l.), during the dry-wet season transition. Photosynthesis
measurements were carried out between 8 and 12 h, using a commercial portable
photosynthesis system (LI-6400, LI-COR, Inc, Lincoln, NE, USA). To measure
isoprene emissions, air exiting the LI-6400 leaf chamber was routed to fill a X-liter
Teflon bag. Isoprene concentrations in the bag were then determined using a Proton
Transfer Reaction Mass Spectrometer (PTR-MS; Ionicon Analytik, Innsbruck, Austria).
Measurements were made on leaves of three different developmental stages in the top
layer of the canopy: young mature leaves (YML), old mature leaves (OML) and
senescent leaves (SL). Measurements were made under constant irradiance (PAR=1000
µmol m-2
s-1
) as leaf temperature was varied between approximately 25 °C and 45 °C.
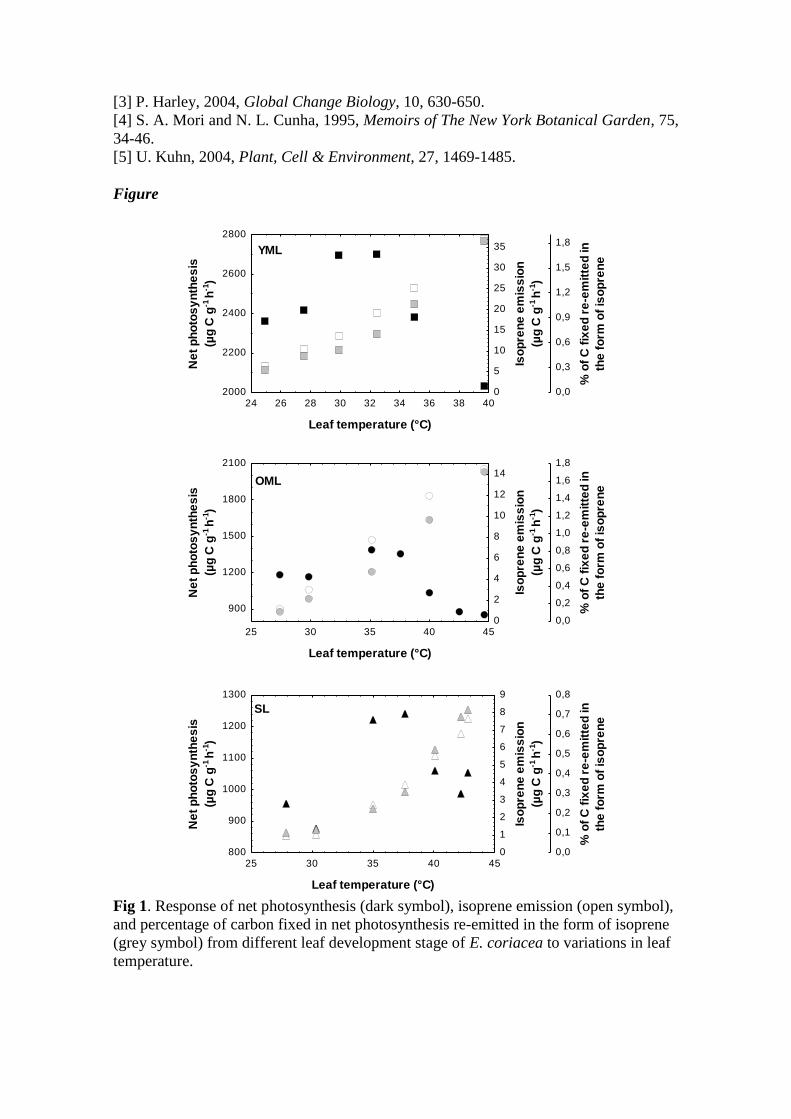
Results showed that YML had the highest isoprene emission rates at all leaf
temperatures, followed by OML and SL (Fig. 1). Under standard conditions (leaf
temperature=30OC and PAR=1000 µmol m
-2 s
-1), the observed carbon losses in the form
of isoprene were 13.5, 2.9 and 1.0 µg g-1
h-1
for YML, OML and SL, respectively.
Under these conditions, 0.12-0.5% of carbon fixed in net photosynthesis was
immediately re-emitted in the form of isoprene; with increasing temperature, this
percentage increased for leaves in all developmental stages, but for YML the percentage
was higher than for OML or SL. Models predicting emissions of BVOC from this
critically important global biome provide necessary inputs to models of atmospheric
chemistry and biogeochemical cycling at regional and global scales. In order to
improve emission models of isoprene and other important trace gas species, further
research will be necessary to better establish the role of temperature, leaf phenology and
other physical and biological factors on BVOC emissions in tropical forests.
References
[1] A. Guenther et al., 1995, Journal of Geophysical Research, 100, 8873–8892.
[2] F. Pacifico, 2009, Atmospheric Environment, 43, 6121-6135.
[3] P. Harley, 2004, Global Change Biology, 10, 630-650.
[4] S. A. Mori and N. L. Cunha, 1995, Memoirs of The New York Botanical Garden, 75,
34-46.
[5] U. Kuhn, 2004, Plant, Cell & Environment, 27, 1469-1485.
Figure
24 26 28 30 32 34 36 38 40
Leaf temperature (°C)
2000
2200
2400
2600
2800
Ne
t p
ho
tos
yn
the
sis
(µg
C g
-1 h
-1)
0
5
10
15
20
25
30
35
Iso
pre
ne
em
iss
ion
(µg
C g
-1 h
-1)
0,0
0,3
0,6
0,9
1,2
1,5
1,8
% o
f C
fix
ed
re
-em
itte
d in
the
fo
rm o
f is
op
ren
e
YML
25 30 35 40 45
Leaf temperature (°C)
900
1200
1500
1800
2100
Ne
t p
ho
tos
yn
the
sis
(µg
C g
-1 h
-1)
0
2
4
6
8
10
12
14
Iso
pre
ne
em
iss
ion
(µg
C g
-1 h
-1)
0,0
0,2
0,4
0,6
0,8
1,0
1,2
1,4
1,6
1,8
% o
f C
fix
ed
re
-em
itte
d in
the
fo
rm o
f is
op
ren
e
OML
25 30 35 40 45
Leaf temperature (°C)
800
900
1000
1100
1200
1300
Ne
t p
ho
tos
yn
the
sis
(µg
C g
-1 h
-1)
0
1
2
3
4
5
6
7
8
9
Iso
pre
ne
em
iss
ion
(µg
C g
-1 h
-1)
0,0
0,1
0,2
0,3
0,4
0,5
0,6
0,7
0,8
% o
f C
fix
ed
re
-em
itte
d in
the
fo
rm o
f is
op
ren
e
SL
Fig 1. Response of net photosynthesis (dark symbol), isoprene emission (open symbol),
and percentage of carbon fixed in net photosynthesis re-emitted in the form of isoprene
(grey symbol) from different leaf development stage of E. coriacea to variations in leaf
temperature.
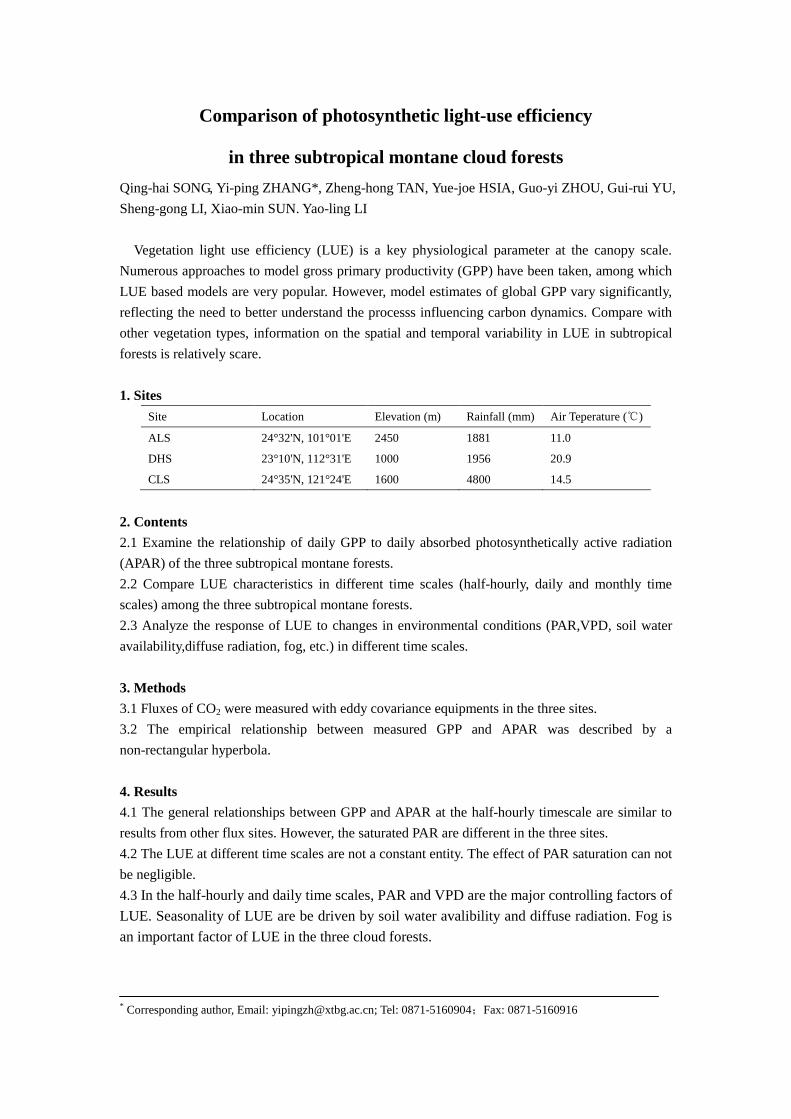
Comparison of photosynthetic light-use efficiency
in three subtropical montane cloud forests Qing-hai SONG, Yi-ping ZHANG*, Zheng-hong TAN, Yue-joe HSIA, Guo-yi ZHOU, Gui-rui YU, Sheng-gong LI, Xiao-min SUN. Yao-ling LI
Vegetation light use efficiency (LUE) is a key physiological parameter at the canopy scale. Numerous approaches to model gross primary productivity (GPP) have been taken, among which LUE based models are very popular. However, model estimates of global GPP vary significantly, reflecting the need to better understand the processs influencing carbon dynamics. Compare with other vegetation types, information on the spatial and temporal variability in LUE in subtropical forests is relatively scare. 1. Sites
Site Location Elevation (m) Rainfall (mm) Air Teperature (℃)
ALS 24°32'N, 101°01'E 2450 1881 11.0
DHS 23°10'N, 112°31'E 1000 1956 20.9
CLS 24°35'N, 121°24'E 1600 4800 14.5
2. Contents 2.1 Examine the relationship of daily GPP to daily absorbed photosynthetically active radiation (APAR) of the three subtropical montane forests. 2.2 Compare LUE characteristics in different time scales (half-hourly, daily and monthly time scales) among the three subtropical montane forests. 2.3 Analyze the response of LUE to changes in environmental conditions (PAR,VPD, soil water availability,diffuse radiation, fog, etc.) in different time scales. 3. Methods 3.1 Fluxes of CO2 were measured with eddy covariance equipments in the three sites. 3.2 The empirical relationship between measured GPP and APAR was described by a non-rectangular hyperbola. 4. Results 4.1 The general relationships between GPP and APAR at the half-hourly timescale are similar to results from other flux sites. However, the saturated PAR are different in the three sites. 4.2 The LUE at different time scales are not a constant entity. The effect of PAR saturation can not be negligible. 4.3 In the half-hourly and daily time scales, PAR and VPD are the major controlling factors of LUE. Seasonality of LUE are be driven by soil water avalibility and diffuse radiation. Fog is an important factor of LUE in the three cloud forests. * Corresponding author, Email: [email protected]; Tel: 0871-5160904;Fax: 0871-5160916
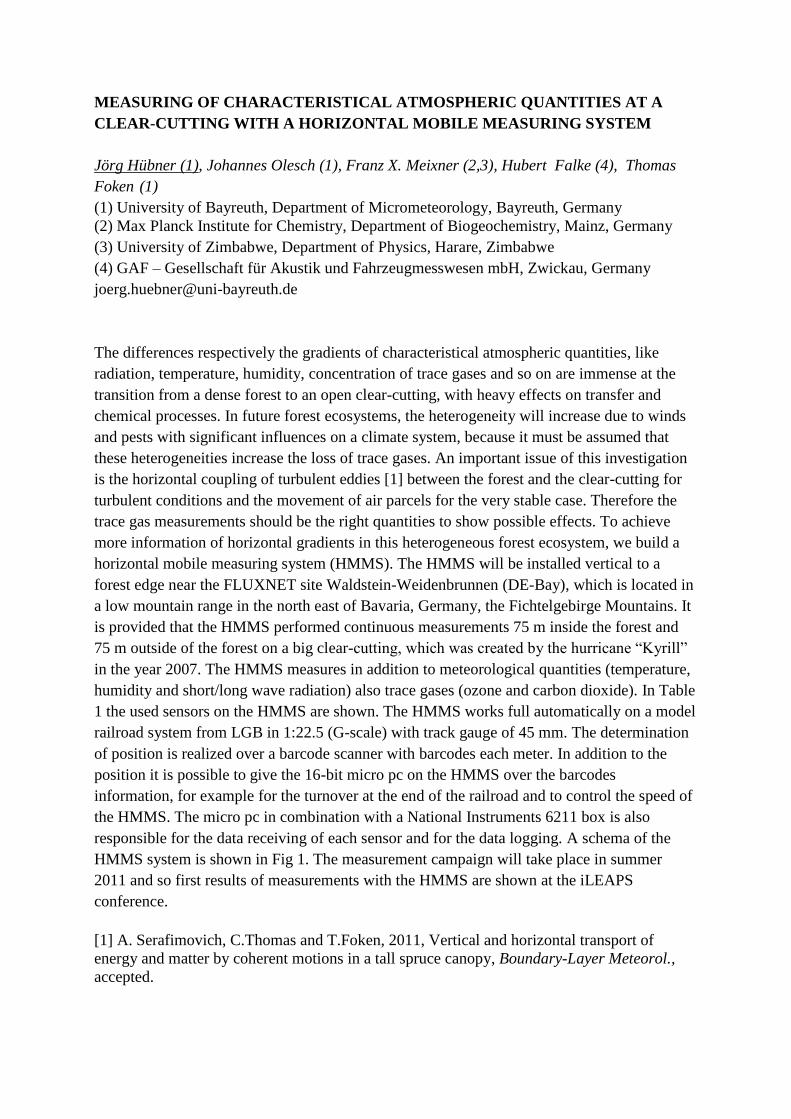
MEASURING OF CHARACTERISTICAL ATMOSPHERIC QUANTITIES AT A
CLEAR-CUTTING WITH A HORIZONTAL MOBILE MEASURING SYSTEM
Jörg Hübner (1), Johannes Olesch (1), Franz X. Meixner (2,3), Hubert Falke (4), Thomas
Foken (1)
(1) University of Bayreuth, Department of Micrometeorology, Bayreuth, Germany
(2) Max Planck Institute for Chemistry, Department of Biogeochemistry, Mainz, Germany
(3) University of Zimbabwe, Department of Physics, Harare, Zimbabwe
(4) GAF – Gesellschaft für Akustik und Fahrzeugmesswesen mbH, Zwickau, Germany
The differences respectively the gradients of characteristical atmospheric quantities, like
radiation, temperature, humidity, concentration of trace gases and so on are immense at the
transition from a dense forest to an open clear-cutting, with heavy effects on transfer and
chemical processes. In future forest ecosystems, the heterogeneity will increase due to winds
and pests with significant influences on a climate system, because it must be assumed that
these heterogeneities increase the loss of trace gases. An important issue of this investigation
is the horizontal coupling of turbulent eddies [1] between the forest and the clear-cutting for
turbulent conditions and the movement of air parcels for the very stable case. Therefore the
trace gas measurements should be the right quantities to show possible effects. To achieve
more information of horizontal gradients in this heterogeneous forest ecosystem, we build a
horizontal mobile measuring system (HMMS). The HMMS will be installed vertical to a
forest edge near the FLUXNET site Waldstein-Weidenbrunnen (DE-Bay), which is located in
a low mountain range in the north east of Bavaria, Germany, the Fichtelgebirge Mountains. It
is provided that the HMMS performed continuous measurements 75 m inside the forest and
75 m outside of the forest on a big clear-cutting, which was created by the hurricane “Kyrill”
in the year 2007. The HMMS measures in addition to meteorological quantities (temperature,
humidity and short/long wave radiation) also trace gases (ozone and carbon dioxide). In Table
1 the used sensors on the HMMS are shown. The HMMS works full automatically on a model
railroad system from LGB in 1:22.5 (G-scale) with track gauge of 45 mm. The determination
of position is realized over a barcode scanner with barcodes each meter. In addition to the
position it is possible to give the 16-bit micro pc on the HMMS over the barcodes
information, for example for the turnover at the end of the railroad and to control the speed of
the HMMS. The micro pc in combination with a National Instruments 6211 box is also
responsible for the data receiving of each sensor and for the data logging. A schema of the
HMMS system is shown in Fig 1. The measurement campaign will take place in summer
2011 and so first results of measurements with the HMMS are shown at the iLEAPS
conference.
[1] A. Serafimovich, C.Thomas and T.Foken, 2011, Vertical and horizontal transport of
energy and matter by coherent motions in a tall spruce canopy, Boundary-Layer Meteorol.,
accepted.
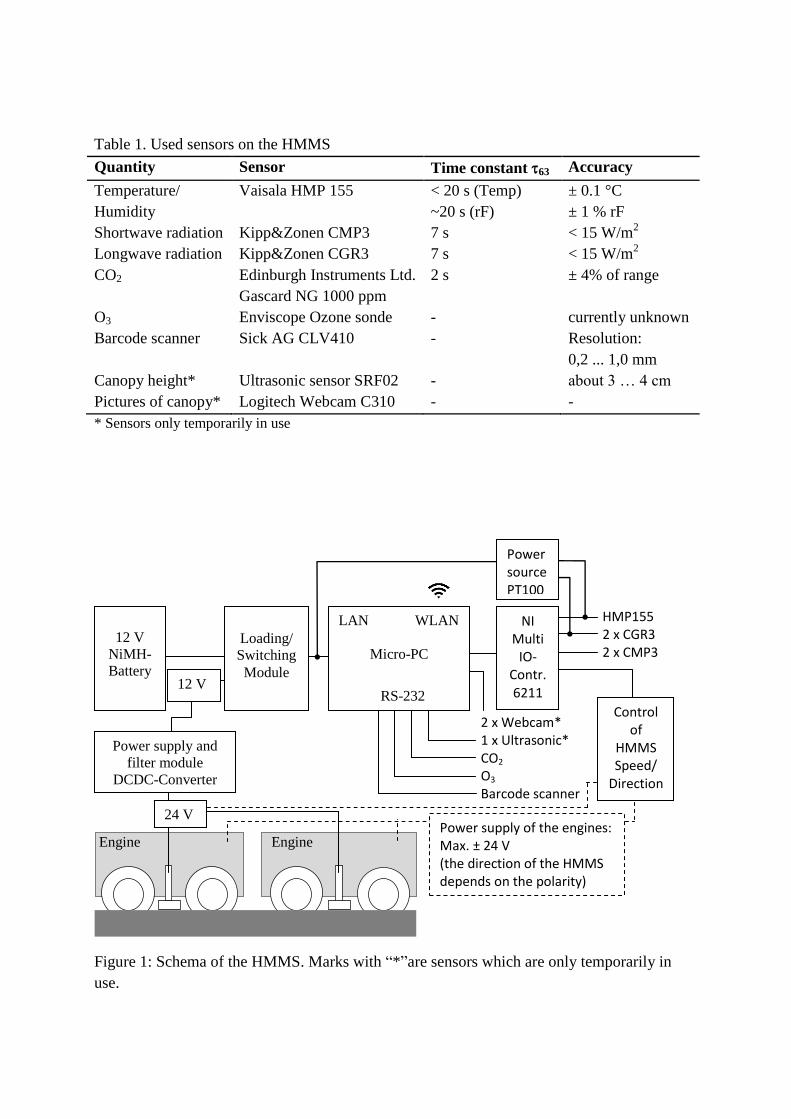
Table 1. Used sensors on the HMMS
Quantity Sensor Time constant 63 Accuracy
Temperature/
Humidity
Vaisala HMP 155 < 20 s (Temp)
~20 s (rF)
± 0.1 °C
± 1 % rF
Shortwave radiation Kipp&Zonen CMP3 7 s < 15 W/m2
Longwave radiation Kipp&Zonen CGR3 7 s < 15 W/m2
CO2 Edinburgh Instruments Ltd.
Gascard NG 1000 ppm
2 s ± 4% of range
O3 Enviscope Ozone sonde - currently unknown
Barcode scanner Sick AG CLV410 - Resolution:
0,2 ... 1,0 mm
Canopy height* Ultrasonic sensor SRF02 - about 3 … 4 cm
Pictures of canopy* Logitech Webcam C310 - -
* Sensors only temporarily in use
Figure 1: Schema of the HMMS. Marks with “*”are sensors which are only temporarily in
use.
2 x Webcam* 1 x Ultrasonic* CO2 O3
Barcode scanner
12 V
NiMH-
Battery
Loading/
Switching
Module 12 V
US
B
Power source PT100
NI Multi
IO- Contr. 6211
HMP155 2 x CGR3 2 x CMP3
Power supply of the engines: Max. ± 24 V (the direction of the HMMS depends on the polarity)
Control of
HMMS Speed/
Direction
Engine Engine
Railroad with 24V DC
Power supply and
filter module
DCDC-Converter
24 V
LAN WLAN
Micro-PC
RS-232
Obtaining Crosswind from a Single Aperture Scintillometer Daniëlle van Dinther , Oscar Hartogensis, Arnold Moene Wageningen University, The Netherlands [email protected] A scintillometer is a device that consist of a transmitter and receiver. The transmitter emits a light beam over a path towards the receiver. The receiver records light intensity fluctuations, because the light is refracted by the turbulent eddy field. Nowadays, scintillometers are mainly used to estimate the area averaged surface fluxes. The raw scintillometer measurements are converted to surface fluxes following scintillometer theory [1]. This theory relates the raw intensity measurements to the structure parameter of the refractive index, Cn
2. From Cn2 the surface fluxes can be calculated using Monin-Obukhov
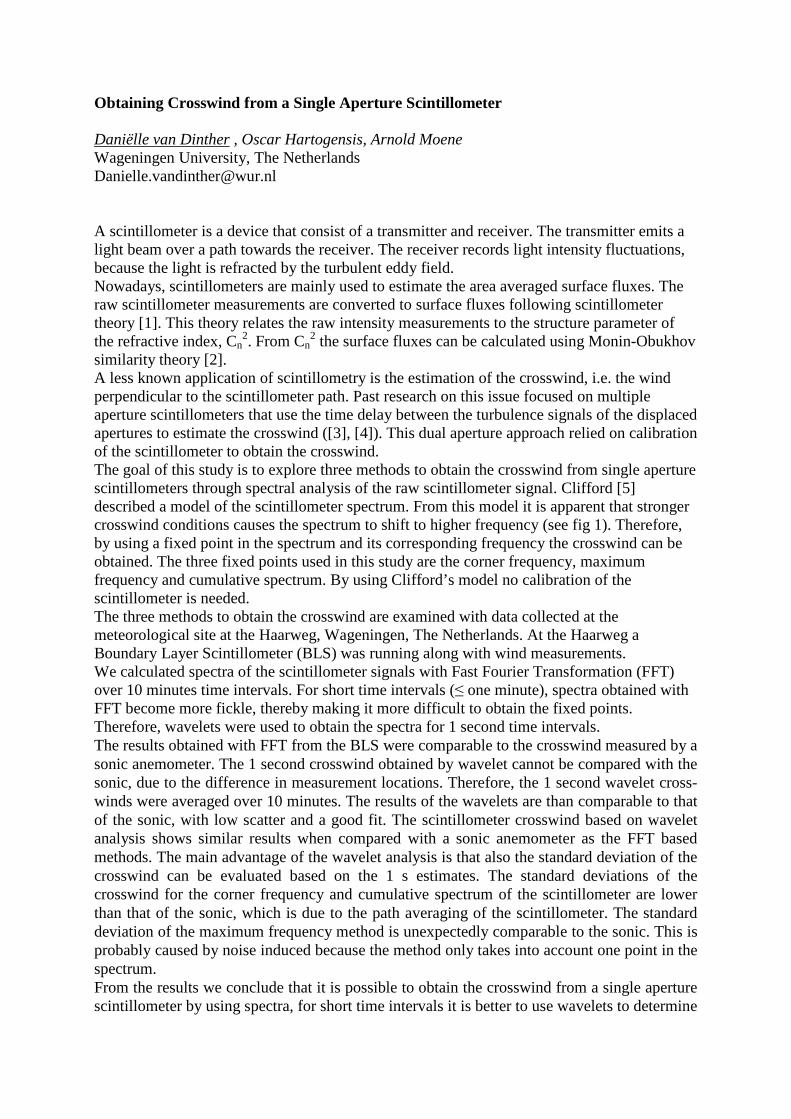
similarity theory [2]. A less known application of scintillometry is the estimation of the crosswind, i.e. the wind perpendicular to the scintillometer path. Past research on this issue focused on multiple aperture scintillometers that use the time delay between the turbulence signals of the displaced apertures to estimate the crosswind ([3], [4]). This dual aperture approach relied on calibration of the scintillometer to obtain the crosswind. The goal of this study is to explore three methods to obtain the crosswind from single aperture scintillometers through spectral analysis of the raw scintillometer signal. Clifford [5] described a model of the scintillometer spectrum. From this model it is apparent that stronger crosswind conditions causes the spectrum to shift to higher frequency (see fig 1). Therefore, by using a fixed point in the spectrum and its corresponding frequency the crosswind can be obtained. The three fixed points used in this study are the corner frequency, maximum frequency and cumulative spectrum. By using Clifford’s model no calibration of the scintillometer is needed. The three methods to obtain the crosswind are examined with data collected at the meteorological site at the Haarweg, Wageningen, The Netherlands. At the Haarweg a Boundary Layer Scintillometer (BLS) was running along with wind measurements. We calculated spectra of the scintillometer signals with Fast Fourier Transformation (FFT) over 10 minutes time intervals. For short time intervals (≤ one minute), spectra obtained with FFT become more fickle, thereby making it more difficult to obtain the fixed points. Therefore, wavelets were used to obtain the spectra for 1 second time intervals. The results obtained with FFT from the BLS were comparable to the crosswind measured by a sonic anemometer. The 1 second crosswind obtained by wavelet cannot be compared with the sonic, due to the difference in measurement locations. Therefore, the 1 second wavelet cross-winds were averaged over 10 minutes. The results of the wavelets are than comparable to that of the sonic, with low scatter and a good fit. The scintillometer crosswind based on wavelet analysis shows similar results when compared with a sonic anemometer as the FFT based methods. The main advantage of the wavelet analysis is that also the standard deviation of the crosswind can be evaluated based on the 1 s estimates. The standard deviations of the crosswind for the corner frequency and cumulative spectrum of the scintillometer are lower than that of the sonic, which is due to the path averaging of the scintillometer. The standard deviation of the maximum frequency method is unexpectedly comparable to the sonic. This is probably caused by noise induced because the method only takes into account one point in the spectrum. From the results we conclude that it is possible to obtain the crosswind from a single aperture scintillometer by using spectra, for short time intervals it is better to use wavelets to determine
the spectrum. The corner frequency and cumulative spectrum methods are preferable above the maximum frequency, because they both use the global shape of the spectrum.
10−3
100
103
10−8
10−6
10−4
10−2
Frequency [Hz]
Spe
ctru
m [v
ar H
z−1 ]
Ucross
= 0.1 m s−1
Ucross
= 10 m s−1
Fig 1. Theoretical spectrum of a scintillometer with a crosswind of 0.1 ms-1 (solid black line) and 10 ms-1 (dashed grey line). [1] Tatarskii, V.I., 1961, Wave propagation in a turbulent medium, McGraw-Hill Book Company Inc., 258 p. [2] Meijninger et al., 2002, Boundary-Layer Meteorology, 105, 37-62. [3] Andreas, E.L., 2000, Journal of atmospheric and oceanic technology, 17, 3-16. [4] Poggio et al., 2000, Journal of atmospheric and oceanic technology, 17, 17-26. [5] Clifford, 1971, Journal of the Optical Society of America, 61, 1285-1292.
A NEW GLOBAL AND MULTI-YEAR SOIL MOISTURE DATASET BASED ON MULTI-WAVELENGTH SATELLITE REMOTE SENSING Jana Kolassa (1), Filipe Aires (1), Catherine Prigent (2), Carlos Jimenez (2), Jan Polcher (3) (1) ESTELLUS, Paris, France (2) LERMA, Observatoire de Paris, Paris, France (3) LMD, Université de Paris Jussieu, Paris, France Context - Quantification of the continental water is very important for a large range of applications at various spatial and temporal scales, from climate and weather predictions to agriculture and water management. Under a changing climate, evolutions in the continental hydrological regimes are expected, but the magnitude of the change is very uncertain, with potential consequences on the water availability for the population needs. Nevertheless, despite their importance, estimates of the major hydrological variables such as Soil Moisture (SM) are not yet available with the required accuracy. The objectives of this study is to produce a satellite-derived SM estimate for comparisons with model outputs, in order to evaluate the models with the final goal of providing more reliable hydrological predictions under a changing climate. Several global datasets of satellite-derived SM estimates exist, e.g. the scatterometer-derived dataset from [6] or the passive microwave dataset from [3]. However, some problems exist with these datasets, and the goal of this study is to propose potential improvements in the existing retrieval schemes. In particular, the signal received by the satellite is generally the combination of contributions from different surface characteristics (vegetation, soil, snow, roughness, among others) and disentangling these various effects from the SM signal is difficult when using a single frequency range. Information content - In order to improve new retrieval schemes, an initial thorough analysis of the various available satellite observations is performed considering active microwave (ERS, and soon ASCAT), passive microwave (AMSR-E and SSM/I), thermal infrared (operational polar and geostationary satellites) and VIS/NIR (AVHRR, and soon MODIS) observations [5]. An important aspect of this work concerns the analysis of the benefits of good pre-processing of the satellite observations to obtain a quantity that is more directly related to SM: Passive microwave observations will be used to estimate surface emissivities [4], the thermal infrared to obtain the amplitude of the diurnal cycle of the surface temperature [2] and the VIS/NIR observation to retrieve a vegetation index. The satellite observations can also estimate preliminary SM indices such as the σ40 index developed in [6] or the Microwave Polarization Difference Index (MPDI) used in [3]. Furthermore, constrained optimal interpolation can be used to analyze the spectral signatures related to SM and construct new SM indexes. It will be investigated whether all these indices have a higher IC compared to the raw satellite data and in how their use can improve the SM retrieval. This analysis will consider the three dominant SM modes of variability of interest: the seasonal, the inter-annual, and the spatial variabilities. A new multi-wavelength retrieval scheme - Our retrieval scheme is based on a Neural Network (NN) that combines multi-wavelength observations from these instruments to
benefit from their synergy [1], at a global scale and at a 0.25°×0.25° spatial resolution. It is examined whether using a combination of different satellite sensors allows to separate the contribution of SM from the vegetation, the surface roughness, and other contaminations and thus results in an improved retrieval. In the future, a similar methodology will be developed using new instruments such as the ASCAT scatterometer or the recently launched SMOS radiometer. With its low frequency (1.4GHz), SMOS is optimized for SM estimation, with less sensitivity to vegetation cover and access to SM below the surface.
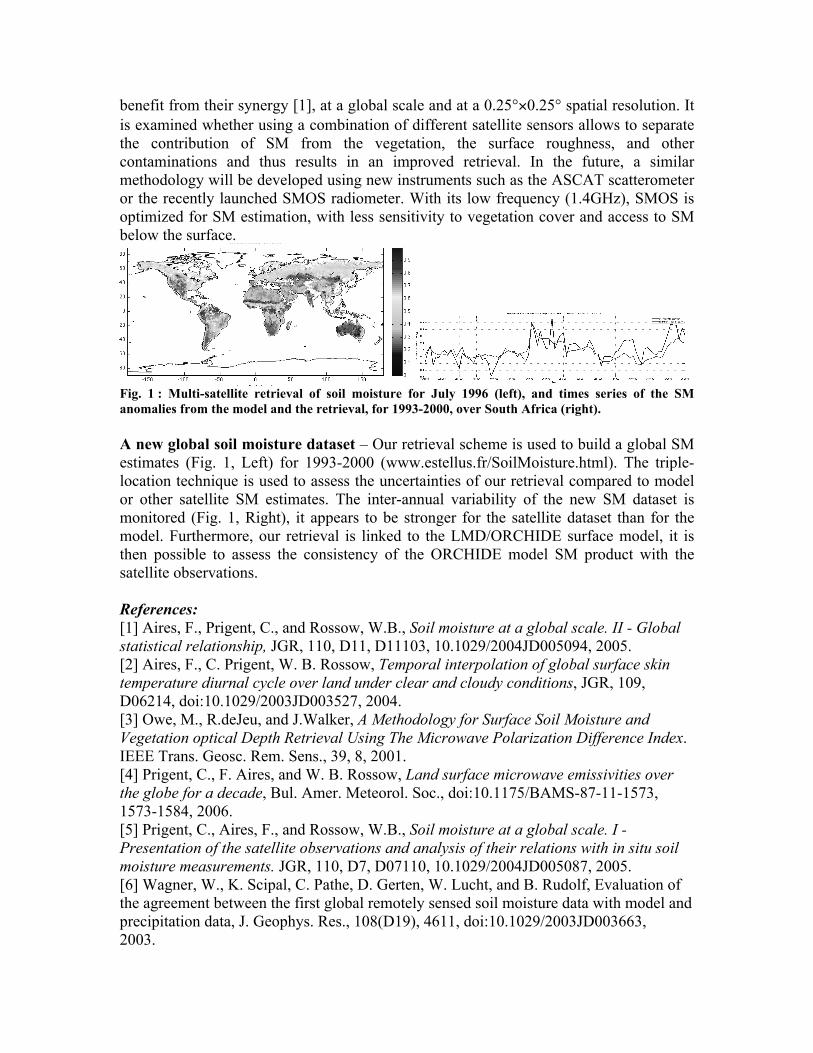
Fig. 1 : Multi-satellite retrieval of soil moisture for July 1996 (left), and times series of the SM anomalies from the model and the retrieval, for 1993-2000, over South Africa (right). A new global soil moisture dataset – Our retrieval scheme is used to build a global SM estimates (Fig. 1, Left) for 1993-2000 (www.estellus.fr/SoilMoisture.html). The triple-location technique is used to assess the uncertainties of our retrieval compared to model or other satellite SM estimates. The inter-annual variability of the new SM dataset is monitored (Fig. 1, Right), it appears to be stronger for the satellite dataset than for the model. Furthermore, our retrieval is linked to the LMD/ORCHIDE surface model, it is then possible to assess the consistency of the ORCHIDE model SM product with the satellite observations. References: [1] Aires, F., Prigent, C., and Rossow, W.B., Soil moisture at a global scale. II - Global statistical relationship, JGR, 110, D11, D11103, 10.1029/2004JD005094, 2005. [2] Aires, F., C. Prigent, W. B. Rossow, Temporal interpolation of global surface skin temperature diurnal cycle over land under clear and cloudy conditions, JGR, 109, D06214, doi:10.1029/2003JD003527, 2004. [3] Owe, M., R.deJeu, and J.Walker, A Methodology for Surface Soil Moisture and Vegetation optical Depth Retrieval Using The Microwave Polarization Difference Index. IEEE Trans. Geosc. Rem. Sens., 39, 8, 2001. [4] Prigent, C., F. Aires, and W. B. Rossow, Land surface microwave emissivities over the globe for a decade, Bul. Amer. Meteorol. Soc., doi:10.1175/BAMS-87-11-1573, 1573-1584, 2006. [5] Prigent, C., Aires, F., and Rossow, W.B., Soil moisture at a global scale. I - Presentation of the satellite observations and analysis of their relations with in situ soil moisture measurements. JGR, 110, D7, D07110, 10.1029/2004JD005087, 2005. [6] Wagner, W., K. Scipal, C. Pathe, D. Gerten, W. Lucht, and B. Rudolf, Evaluation of the agreement between the first global remotely sensed soil moisture data with model and precipitation data, J. Geophys. Res., 108(D19), 4611, doi:10.1029/2003JD003663, 2003.
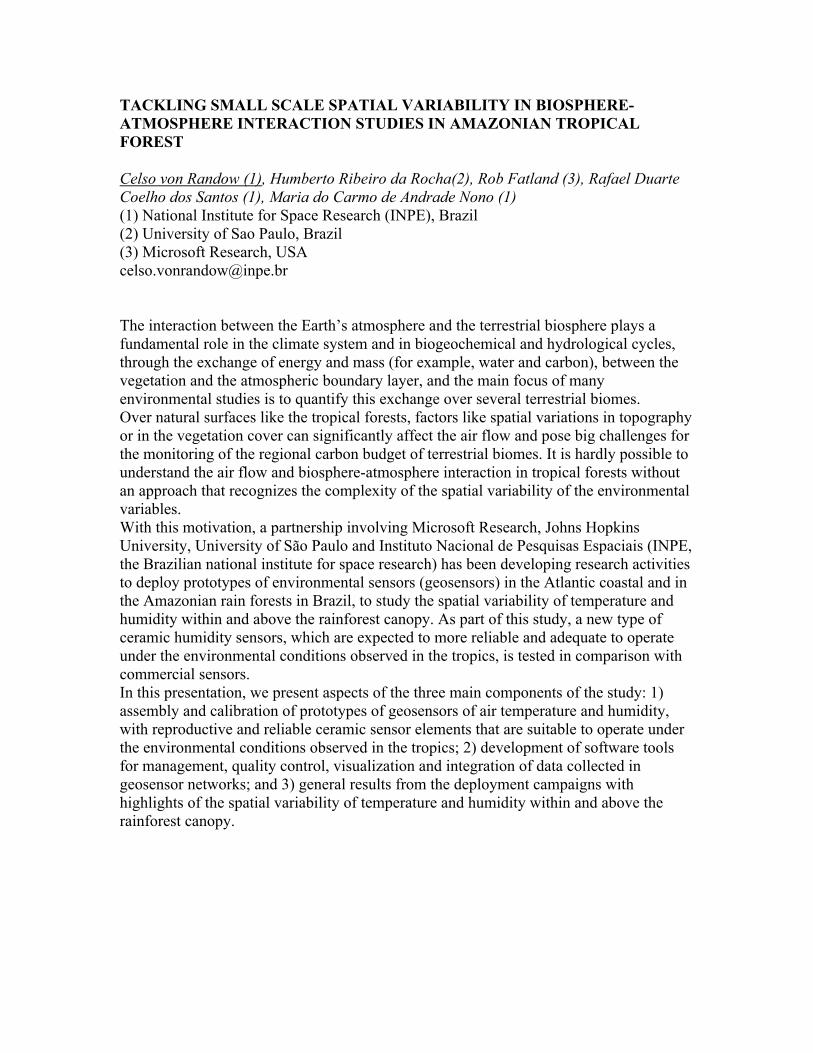
TACKLING SMALL SCALE SPATIAL VARIABILITY IN BIOSPHERE-ATMOSPHERE INTERACTION STUDIES IN AMAZONIAN TROPICAL FOREST Celso von Randow (1), Humberto Ribeiro da Rocha(2), Rob Fatland (3), Rafael Duarte Coelho dos Santos (1), Maria do Carmo de Andrade Nono (1) (1) National Institute for Space Research (INPE), Brazil (2) University of Sao Paulo, Brazil (3) Microsoft Research, USA [email protected] The interaction between the Earth’s atmosphere and the terrestrial biosphere plays a fundamental role in the climate system and in biogeochemical and hydrological cycles, through the exchange of energy and mass (for example, water and carbon), between the vegetation and the atmospheric boundary layer, and the main focus of many environmental studies is to quantify this exchange over several terrestrial biomes. Over natural surfaces like the tropical forests, factors like spatial variations in topography or in the vegetation cover can significantly affect the air flow and pose big challenges for the monitoring of the regional carbon budget of terrestrial biomes. It is hardly possible to understand the air flow and biosphere-atmosphere interaction in tropical forests without an approach that recognizes the complexity of the spatial variability of the environmental variables. With this motivation, a partnership involving Microsoft Research, Johns Hopkins University, University of São Paulo and Instituto Nacional de Pesquisas Espaciais (INPE, the Brazilian national institute for space research) has been developing research activities to deploy prototypes of environmental sensors (geosensors) in the Atlantic coastal and in the Amazonian rain forests in Brazil, to study the spatial variability of temperature and humidity within and above the rainforest canopy. As part of this study, a new type of ceramic humidity sensors, which are expected to more reliable and adequate to operate under the environmental conditions observed in the tropics, is tested in comparison with commercial sensors. In this presentation, we present aspects of the three main components of the study: 1) assembly and calibration of prototypes of geosensors of air temperature and humidity, with reproductive and reliable ceramic sensor elements that are suitable to operate under the environmental conditions observed in the tropics; 2) development of software tools for management, quality control, visualization and integration of data collected in geosensor networks; and 3) general results from the deployment campaigns with highlights of the spatial variability of temperature and humidity within and above the rainforest canopy.
THE DIURNAL CYCLE OF THE ATMOSPHERIC BOUNDARY LAYER
OVER PASTURE SITE IN AMAZONIA
Theomar Trindade de Araújo Tiburtino Neves (1), Gilberto Fisch (2).
(1) National Institute for Space Research – INPE, Brazil
(2) Aeronautic and Space Institute – IAE, Brazil
In the last decades a great effort have been made by the community of
micrometeorology and boundary layer for a better descriptions of the properties of the
atmospheric boundary layer (ABL) being its height an important feature. The reference
[1] describes the ABL as the layer adjacent to the earth´s surface which significant
turbulent transfers of heat, mass and momentum occur over a period of the order of an
hour, with vertically mixed processes of thermal and mechanical convectation on
daytime and a turbulent suppressed condition which persist and evolves during the
nighttime. The observational evaluation of Convective Boundary Layer (CBL) and the
Nocturnal Boundary Layer (NBL) is a broad field of study, since those atmospheric
processes in the lower atmosphere have an important impact on society and in the
environment. Despite its importance, the actual knowledge of the CBL and NBL in
Amazonia is restricted to a few field campaigns. Thus, this work was motivated by the
goal of integrate and comparing data of the heights of ABL (both daytime and
nighttime) by using different instruments.
The measurements were made at Nossa Senhora Aparecida farm (10 45' S, 62° 22' W;
293 m), a cleared / pasture area in the southwest of Amazonia which has been used in
micrometeorological field campaigns since the 90s [2]. The data set was obtained
during the RaCCI/LBA (Radiation, Cloud and Climate Interactions in the
Amazonia/Large Scale Biosphere-Atmosphere Experiment in Amazonia) experiment,
which occurred during the transition between the dry and wet seasons of 2002. This
data-set is representative for the temporal evolution (in daily scale) of CBL and NBL for
a pasture area on southwest Amazonia. In order to characterize the soil moisture
conditions, the data-set was divided into two periods, represented by Phases I (dry) and
II (wet) as suggested by [3]. The 3 instruments used were: a SODAR (manufactured by
REMTECH, France), with maximum vertical range of 1.5 km and temporal
measurements made every 30 min, operating between 06/Sep up to 31/Oct/2002; a
Tethered Balloon (TB) (manufactured by Atmospheric Instrument Research Inc, USA),
with a maximum vertical height around 0.5 km, but with measurements made every
hour (operating from Oct 20 up to 30, 2002) and Radiosonde (RS) from Vaisala
(Finland), with balloon released at 02, 08, 11, 14 and 17 Local Time (LT) during the
period of 12/Sep up to 31/Oct/2002.
In order to estimate the height of the CBL, it was used a profile method (subjective
approach), which used the profiles of potential temperature and specific humidity using
data from RS, the parcel method (objective), which uses the intersection of the
atmosphere potential temperature profile and from the potential temperature at surface
lifted by the dry adiabatic curve and the Richardson number method (objective) that is
based on characteristics of ABL such as the vertical variations of temperature and
winds. The SODAR´s data provided by the commercial software were not used due to
misrepresentation of the ABL [5]. For the NBL heights, it was used the profile method
(subjective) using data from RS and TB instruments. The SODAR measurements in the
nighttime was the height of maximum wind as suggested by [4] and used by [5].
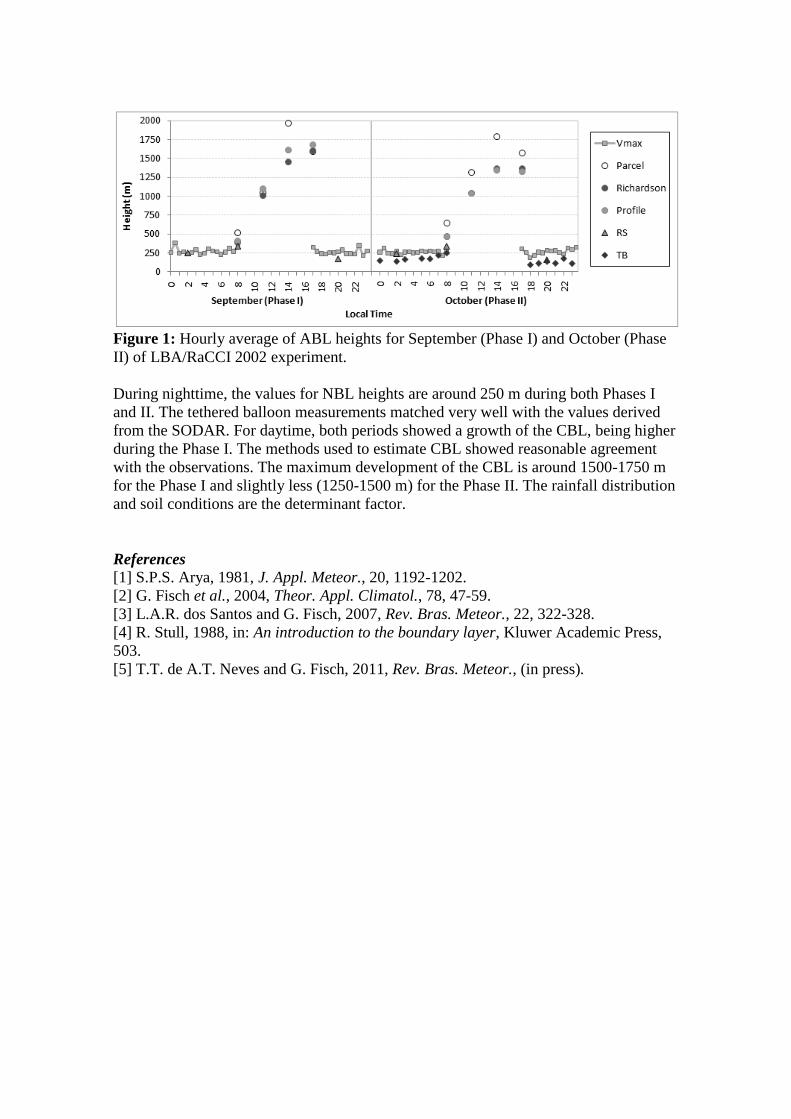
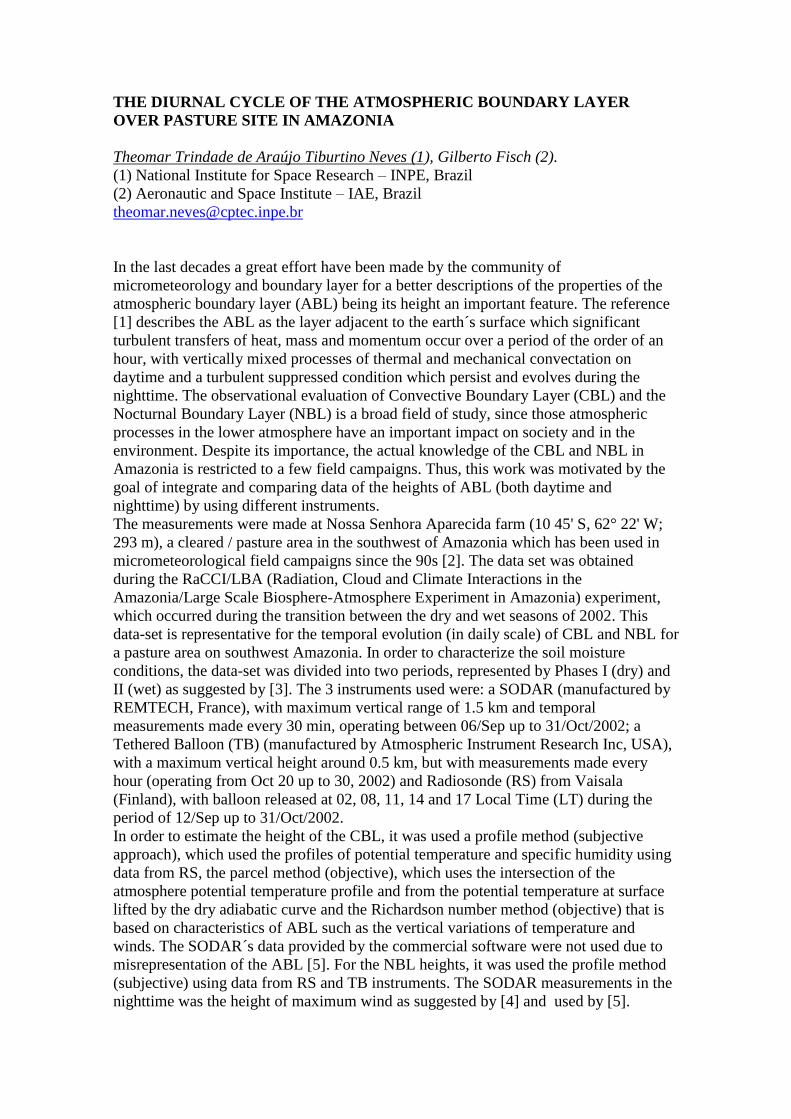
Figure 1: Hourly average of ABL heights for September (Phase I) and October (Phase
II) of LBA/RaCCI 2002 experiment.
During nighttime, the values for NBL heights are around 250 m during both Phases I
and II. The tethered balloon measurements matched very well with the values derived
from the SODAR. For daytime, both periods showed a growth of the CBL, being higher
during the Phase I. The methods used to estimate CBL showed reasonable agreement
with the observations. The maximum development of the CBL is around 1500-1750 m
for the Phase I and slightly less (1250-1500 m) for the Phase II. The rainfall distribution
and soil conditions are the determinant factor.
References [1] S.P.S. Arya, 1981, J. Appl. Meteor., 20, 1192-1202.
[2] G. Fisch et al., 2004, Theor. Appl. Climatol., 78, 47-59.
[3] L.A.R. dos Santos and G. Fisch, 2007, Rev. Bras. Meteor., 22, 322-328.
[4] R. Stull, 1988, in: An introduction to the boundary layer, Kluwer Academic Press,
503.
[5] T.T. de A.T. Neves and G. Fisch, 2011, Rev. Bras. Meteor., (in press).
ESTIMATION OF ABOVE-GROUND BIOMASS OF ALASKAN BOREAL FOREST BY ALOS-PALSAR WITH SLOPE EFFECT REDUCTION PROCESS Rikie Suzuki (1), Yongwon Kim (2), Reiichiro Ishii (1), and Jeremy Nicoll (3) (1) Research Institute for Global Change, Japan Agency for Marine-Earth Science and
Technology, Japan, [email protected] (Rikie Suzuki, corresponding author) (2) International Arctic Research Center, University of Alaska Fairbanks, U.S.A. (3) Geophysical Institute, University of Alaska Fairbanks, U.S.A.
For a better understanding of the carbon cycle in the global ecosystem, investigations of the spatio-temporal variation of the carbon stock which is stored as vegetation biomass is important. Observations by the "Phased Array type L-band Synthetic Aperture Radar (PALSAR)” instrument on board the "Advanced Land Observing Satellite (ALOS)” platform has an inestimable potential to provide forest above-ground biomass (FAGB) information about the vegetation that extensively covers the global land. This study made an attempt to develop an estimation algorithm of FAGB by PALSAR, targeting the ecotone region from the boreal forest (whose major species are black and white spruce) to tundra in Alaska by establishing a south-north transect along the trans-Alaska pipeline.
First, 20 PALSAR scenes that cover the transect in summer of 2007 were collected. The backscatter intensity of the PALSAR measurement is strongly influenced by the slope of the terrain. This study develops a simple approach to reduce this so-called “slope-effect”, which possibly contaminates the FAGB estimation, by calculating a combination of HV and HH intensities. Fig. 1 compares the original image of HV intensity (digital number) with the slope-effect reduced image in a sample area. The relief of the topography that is apparent in the original image (left) is considerably reduced in the slope-effect reduced image (right) after processing.
Next, based on the slope-effect reduced image, the FAGB estimation algorithm was
Fig. 1 Close-up of original Level 1.5 PALSAR image (HV intensity; digital number) (left) and slope-effect reduced image (right) around 67˚ 40’ 18.27” N, 149˚ 57’ 8.94”
parameterized by the in-situ FAGBs at 29 forests of the transect that were acquired by ground-based survey in July 2007. Following a linear regression analysis, the correlation coefficient between backscatter intensity (slope-effect reduced) and the in-situ FAGB was 0.75. Finally, the FAGB mapping was done by applying the FAGB regression.
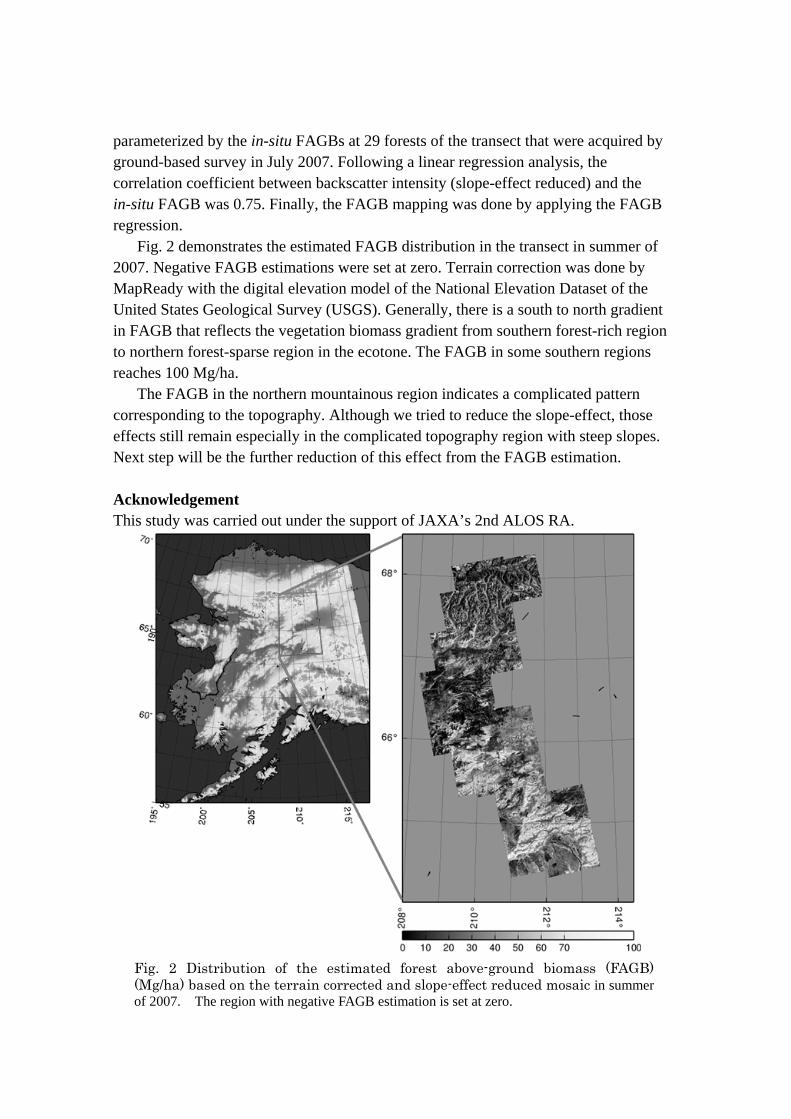
Fig. 2 demonstrates the estimated FAGB distribution in the transect in summer of 2007. Negative FAGB estimations were set at zero. Terrain correction was done by MapReady with the digital elevation model of the National Elevation Dataset of the United States Geological Survey (USGS). Generally, there is a south to north gradient in FAGB that reflects the vegetation biomass gradient from southern forest-rich region to northern forest-sparse region in the ecotone. The FAGB in some southern regions reaches 100 Mg/ha.
The FAGB in the northern mountainous region indicates a complicated pattern corresponding to the topography. Although we tried to reduce the slope-effect, those effects still remain especially in the complicated topography region with steep slopes. Next step will be the further reduction of this effect from the FAGB estimation.
Acknowledgement This study was carried out under the support of JAXA’s 2nd ALOS RA.
Fig. 2 Distribution of the estimated forest above-ground biomass (FAGB) (Mg/ha) based on the terrain corrected and slope-effect reduced mosaic in summer of 2007. The region with negative FAGB estimation is set at zero.
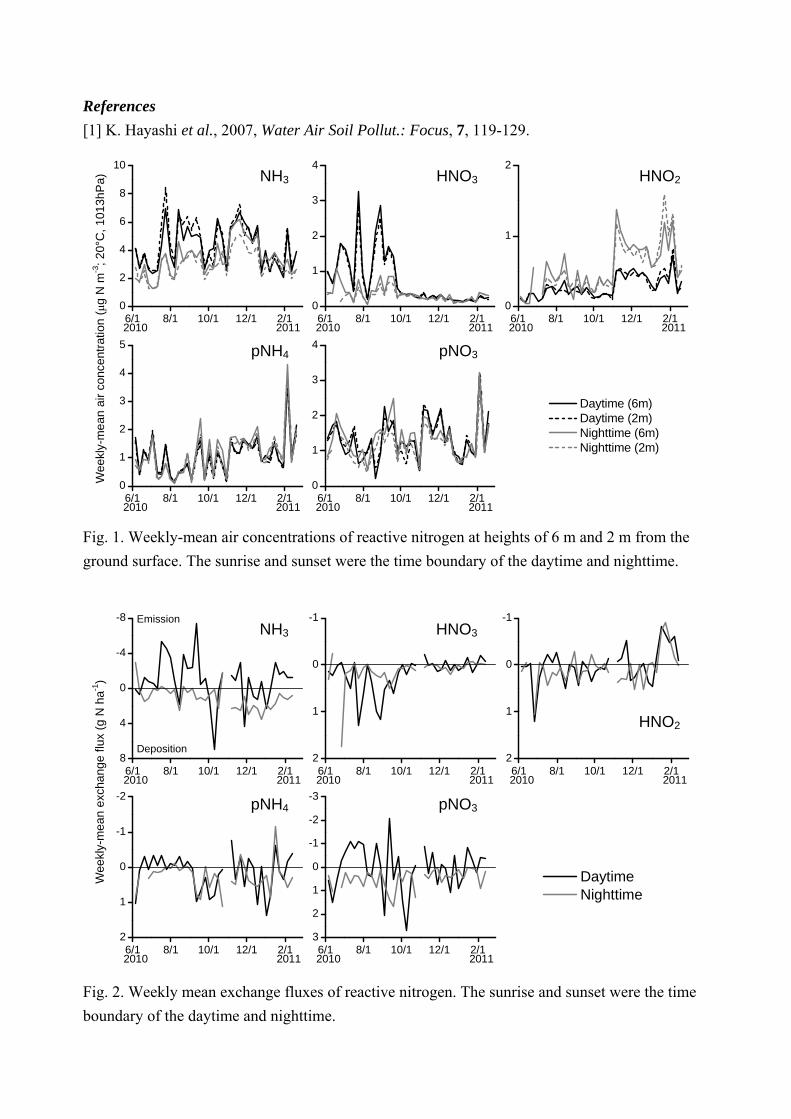
ATMOSPHERE-LAND EXCHANGE OF REACTIVE NITROGEN AT A PADDY FIELD IN CENTRAL JAPAN Kentaro Hayashi (1), Keisuke Ono (1), Kazuhide Matsuda (2), Toshihiro Hasegawa (1) (1) National Institute for Agro-Environmental Sciences, Japan (2) Meisei University, Japan E-mail: [email protected] The ongoing present study aims to elucidate the atmosphere-land exchange of reactive nitrogen, i.e., ammonia (NH3), nitric acid (HNO3), and nitrous acid (HNO2) as gases and particulate ammonium (pNH4) and nitrate (pNO3) as particles, at a paddy field in central Japan (35°58'27''N, 139°59'33''E, 10 m a.s.l.), where is also a site of free-air CO2 enrichment (FACE) experiment established in April 2010. The air concentrations and micrometeorological items have been measured since June 2010. The filter-pack method was used to measure the weekly-mean air concentrations at two heights of 6 m and 2 m from the ground surface; however, the daytime and nighttime were separated by providing the sampling lines for the daytime, nighttime, and field blank at each height (the time boundaries were the sunrise and sunset). The filter holders consisted of five stages (Hayashi et al., 2007), i.e., the first stage with a polytetrafluoroethylene (PTFE) membrane filter having a pore size of 0.8 μm (T080A047A, Advantec) that collects aerosols, including pNH4 and pNO3; the second stage with a nylon filter (Nylasorb, Pall) that collects mainly HNO3; the third and fourth stages with a cellulose filter (51A, Advantec) impregnated with potassium carbonate, respectively, that collects mainly HNO2; and the fifth stage with a cellulose filter (51A, Advantec) impregnated with phosphoric acid that collects NH3. The air flow rate for the measurements of air concentration was ca. 2 L min-1. The diffusion velocity was calculated using the micrometeorological and eddy covariance data in half-hourly basis and then the weekly-mean values in the daytime and nighttime were calculated. The exchange fluxes were expressed as the product of the difference in air concentration between the two heights by the diffusion velocity. Figure 1 shows the weekly-mean air concentrations. NH3 was the most dominant chemical species. The air concentrations of HNO3 were high only in the daytime in the warm season, and that of HNO2 conversely increased only in the nighttime in the cold season. Figure 2 shows the exchange fluxes. NH3 showed a tendency of net emission especially in the daytime in the warm season. HNO3 showed a clear tendency of net deposition. Acknowledgements The present study was supported by a Grant-in-Aid for Scientific Research, No.22248026, provided by the Ministry of Education, Culture, Sports, Science, and Technology, Japan. The study site (Tsukuba FACE) was established and maintained by a project, “Development of mitigation and adaptation techniques to global warming in the sectors of agriculture, forestry, and fisheries”, provided by the Ministry of Agriculture, Forestry and Fisheries, Japan.
References [1] K. Hayashi et al., 2007, Water Air Soil Pollut.: Focus, 7, 119-129.
6/1 8/1 10/1 12/1 2/10
1
2
2010 20116/1 8/1 10/1 12/1 2/1
0
1
2
3
4
2010 20116/1 8/1 10/1 12/1 2/1
0
2
4
6
8
10
20112010
Daytime (6m) Daytime (2m) Nighttime (6m) Nighttime (2m)
6/1 8/1 10/1 12/1 2/10
1
2
3
4
2010 20116/1 8/1 10/1 12/1 2/1
0
1
2
3
4
5
2010 2011
NH3 Fig. 1. Weekly-mean air concentrations of reactive nitrogen at heights of 6 m and 2 m from the ground surface. The sunrise and sunset were the time boundary of the daytime and nighttime.
HNO3 HNO2
6/1 8/1 10/1 12/1 2/13
2
1
0
-1
-2
-3
Wee
kly-
mea
n ai
r con
cent
ratio
n (μ
g N
m-3
; 20°
C, 1
013h
Pa)
pNH4 pNO3
Fig. 2. Weekly mean exchange fluxes of reactive nitrogen. The sunrise and sunset were the time boundary of the daytime and nighttime.
2010 20116/1 8/1 10/1 12/1 2/1
2
1
0
-1
-2
2010 2011
6/1 8/1 10/1 12/1 2/12
1
0
-1
2010 20116/1 8/1 10/1 12/1 2/1
2
1
0
-1
2010 20116/1 8/1 10/1 12/1 2/1
8
4
0
-4
-8
2010 2011
Daytime Nighttime
Wee
kly-
mea
n ex
chan
ge fl
ux (g
N h
a-1)
NH3 HNO3
HNO2
pNH4 pNO3
Emission
Deposition
Observational evidences of double cropping impacts on the climate in the northern
China plains
Jong-Ghap Jhun1, Chae-Shik Rho2, and Chang-Hoi Ho1
1School of Earth and Environmental Sciences, Seoul National University, Seoul, Korea
2The National Academy of Sciences, Republic of Korea
Corresponding author: [email protected]
The impacts of harvested cropland in the double cropping region (DCR) of the northern
China plains (NCP) on the regional climate are examined using surface meteorological data
and satellite-derived normalized difference vegetation index (NDVI) and land surface
temperature (LST). The NDVI data are used to distinguish DCR from single cropping region
(SCR) in the NCP. Notable increases in LST in the period May–June were found in the exact
area identified from the NDVI data as DCR. The difference between the mean daily
maximum temperatures averaged over the DCR and SCR stations peaks at 1.7℃ in June. The
specific humidity in DCR is significantly lower than that in SCR. The results suggest that the
enhanced agricultural production by multiple cropping may amplify regional warming and
aridity, and thus further modify the regional climate. Moreover, the present results could also
serve as a quantitative observed reference state of the crop/vegetation effects for future
climate modeling studies.
HIGHLY SIZE RESOLVED PARTICLE FLUXES OVER AN URBAN AREA
M. J. Deventer, F. Griessbaum and O. Klemm Climatology Working Group, University of Münster, 48148 Münster, Germany [email protected] Cities are both sources and sinks for atmospheric aerosol particles. The input of particulate material from the regional background is mostly established through aged accumulation range particles. The emissions originate from combustion processes, yielding large numbers of nano-sized particles, and from re-suspension of coarse particles from the urban surfaces. Size-resolved measurement of turbulent particle fluxes by using the eddy covariance technique is an appropriate tool to study these bi-directional fluxes. A preliminary study showed that emission of ultrafine particles may co-occur with deposition of particles in the micrometer range. This is equivalent to the simultaneous occurrence of positive (upward) number fluxes and negative (downward) mass fluxes [3]. For this study, we employ two fast aerosol particle spectrometers, a Ultra-High Sensitivity Aerosol Spectrometer (UHSAS) covering the size range between 60 nm and 1 µm diameters, and a Passive Cavity Aerosol Spectrometer Probe (PCASP-X), ranging from 0.1 µm to 10 µm diameter, both from Droplet Measurement Technologies, Boulder, CO, USA. The instrument combination covers the entire size range in over 100 size bins. This will allow the detailed study of aerosol dynamics within the urban boundary layer. Processes are analyzed in combination with the exchange fluxes of sensible heat, water vapor, and carbon dioxide (CO2). The measurements are conducted at a 65 m high telecommunication tower in the city of Münster (population ~ 275.000), NW Germany. The tower has been extensively evaluated on its flow distortion effects on turbulent flux measurements [2], by using the large eddy simulation (LES) code Gerris (http://gfs.sourceforge.net/). The well defined site [1] is influenced by traffic, industrial sources, vegetation, and long range transport. The presentation will show results of highly size resolved turbulent particle flux measurements, obtained during the 2011 field campaign. Acknowledgements: This work is supported by the Deutsche Forschungsgemeinschaft (DFG) under grant KL 623 / 12-1. References: [1] F. Dahlkötter, F. Griessbaum, A. Schmidt, O. Klemm, 2010, Meteorologische Zeitschrift, 19, 565-575, doi 10.1127/0941-2948/ 2010/0492. [2] F. Griessbaum and A. Schmidt, 2009, Quarterly Journal of the Royal Meteorological Society, 135, 1603-1613. [3] A. Schmidt and O. Klemm, 2008, Atmospheric Chemistry and Physics, 8, 7405-7417. [4] A. Schmidt, T. Wrzesinsky, O. Klemm, 2008, Boundary-Layer Meteorology, 126, 389-413.
INVESTIGATION OF CARBON DISTRIBUTION AFTER ASSIMILATION BY COMBINING STABLE ISOTOPE LABELING AND MICROMETEOROLOGICAL TOOLS Michael Riederer (1, 2), Willi Brand (4), Yakov Kuzyakov (2, 3), Thomas Foken (1) (1) University of Bayreuth, Department of Micrometeorology, Bayreuth, Germany (2) University of Bayreuth, AgroEcoSystem Research Department, Bayreuth, Germany (3) University of Göttingen, Temperate Ecopedology, Göttingen, Germany (4) Max-Planck-Institute for Biogeochemistry, Jena, Germany [email protected] There is still disagreement whether grassland ecosystems are to be considered as carbon sink or source. Already small influences can turn the balance. Thus, ongoing detailed investigation of atmosphere, biosphere and soil interactions is required. Combining techniques - usually used for analysis of one of these ecosystem compartments - increases the possibilities of application: We conducted a 13C and 15N pulse labeling experiment with subsequent tracing of 13C and 15N in several plant and soil pools. This was accompanied by micrometeorological flux measurement techniques - eddy covariance (EC) to gain the net ecosystem exchange of carbon (NEE) and a hyperbolic relaxed eddy accumulation (HREA) system to measure atmospheric isotopic flux densities (isofluxes) of 13C (and 18O) (Ruppert [2]) The latter can be used to separate sources and sinks – assimilation and respiration - within the NEE (Wichura [3]). Another aim was to separate root derived soil CO2 efflux (consisting of root respiration and rhizomicrobial respiration) from soil organic matter (SOM) derived CO2. This is possible by labeling photosynthetic active aboveground biomass with a 13CO2 pulse and tracing the latter afterwards by taking soil respiration samples (with static soil chambers and NaOH-jars inside) and determining its isotopic composition. To evaluate the amount of the soil CO2 and to transfer its sources to larger scales by comparison with the NEE measured by EC, there is one gap to fill (illustrated in Fig. 1a). Shoot respiration is also part of the NEE but is not determined yet. This is done by an approach that uses the results of the pulse labeling experiment. The decrease of the heavy 13C in the aboveground biomass has three reasons (Kuzyakov et al. [1] , see Fig. 1b): The dilution by newly assimilated and incorporated carbon with a natural isotope ratio, the 13C translocation from aboveground biomass into roots and soil, and finally the loss directly into the atmosphere by shoot respiration. Here the circle closes, because shoot respiration can be determined when all the other processes are quantified. Validation of determined assimilation and respiration fluxes by comparison with modeled fluxes by Lloyd-Taylor and Michaelis-Menten functions and validation of the whole method by further side by side EC and chamber measurements in 2011 is intended. This research was funded within FORKAST, a research cooperation of the Bavarian Research Alliance.
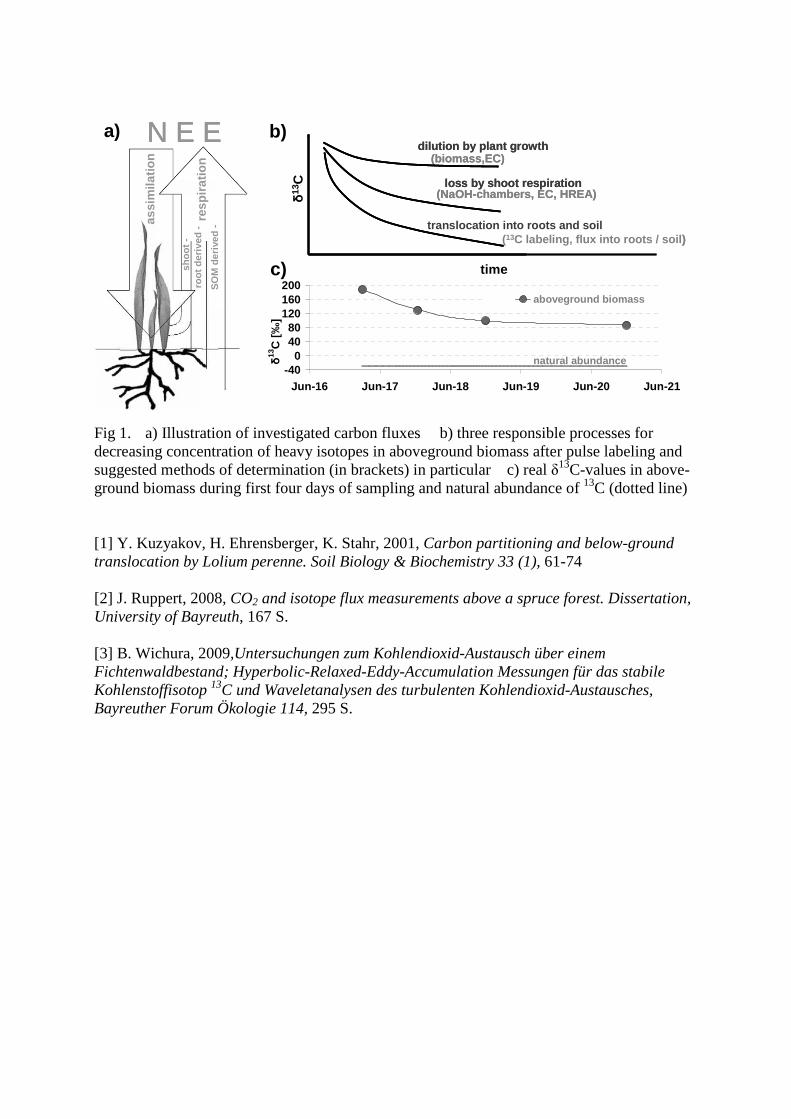
Fig 1. a) Illustration of investigated carbon fluxes b) three responsible processes for decreasing concentration of heavy isotopes in aboveground biomass after pulse labeling and suggested methods of determination (in brackets) in particular c) real δ13C-values in above- ground biomass during first four days of sampling and natural abundance of 13C (dotted line) [1] Y. Kuzyakov, H. Ehrensberger, K. Stahr, 2001, Carbon partitioning and below-ground translocation by Lolium perenne. Soil Biology & Biochemistry 33 (1), 61-74 [2] J. Ruppert, 2008, CO2 and isotope flux measurements above a spruce forest. Dissertation, University of Bayreuth, 167 S. [3] B. Wichura, 2009,Untersuchungen zum Kohlendioxid-Austausch über einem Fichtenwaldbestand; Hyperbolic-Relaxed-Eddy-Accumulation Messungen für das stabile Kohlenstoffisotop 13C und Waveletanalysen des turbulenten Kohlendioxid-Austausches, Bayreuther Forum Ökologie 114, 295 S.
N E E
shoo
t -ro
ot d
eriv
ed-
SO
M d
eriv
ed-
resp
iratio
n
assi
mila
tion
N E E
shoo
t -ro
ot d
eriv
ed-
SO
M d
eriv
ed-
resp
iratio
n
assi
mila
tion
N E E
shoo
t -ro
ot d
eriv
ed-
SO
M d
eriv
ed-
resp
iratio
n
assi
mila
tion
-400
4080
120160200
Jun-16 Jun-17 Jun-18 Jun-19 Jun-20 Jun-21
δ13
C [‰
]
aboveground biomass
natural abundance
time
δ13
C
loss by shoot respiration(NaOH-chambers, EC, HREA)
dilution by plant growth(biomass,EC)
translocation into roots and soil(13C labeling, flux into roots / soil)
-400
4080
120160200
Jun-16 Jun-17 Jun-18 Jun-19 Jun-20 Jun-21
δ13
C [‰
]
aboveground biomass
natural abundance
time
δ13
C
loss by shoot respiration(NaOH-chambers, EC, HREA)
loss by shoot respiration(NaOH-chambers, EC, HREA)
dilution by plant growth(biomass,EC)
dilution by plant growth(biomass,EC)
translocation into roots and soil(13C labeling, flux into roots / soil)
a) b)
c)
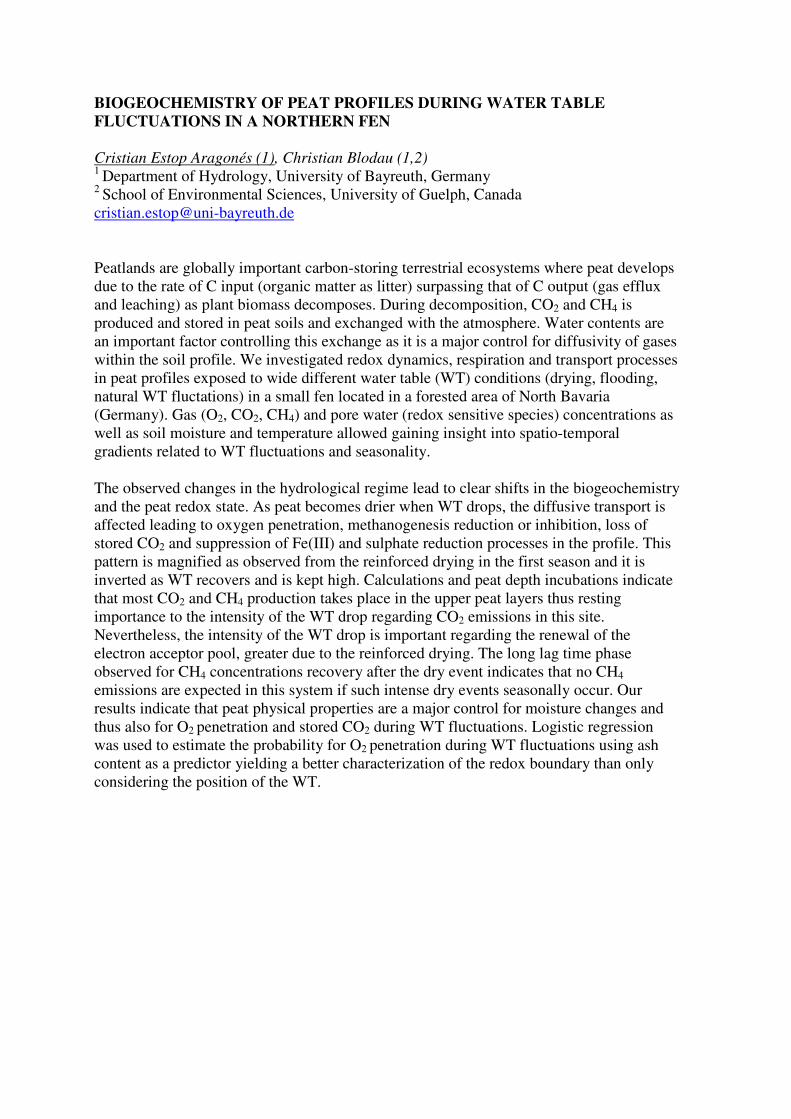
BIOGEOCHEMISTRY OF PEAT PROFILES DURING WATER TABLE
FLUCTUATIONS IN A NORTHERN FEN
Cristian Estop Aragonés (1), Christian Blodau (1,2) 1
Department of Hydrology, University of Bayreuth, Germany 2
School of Environmental Sciences, University of Guelph, Canada
Peatlands are globally important carbon-storing terrestrial ecosystems where peat develops
due to the rate of C input (organic matter as litter) surpassing that of C output (gas efflux
and leaching) as plant biomass decomposes. During decomposition, CO2 and CH4 is
produced and stored in peat soils and exchanged with the atmosphere. Water contents are
an important factor controlling this exchange as it is a major control for diffusivity of gases
within the soil profile. We investigated redox dynamics, respiration and transport processes
in peat profiles exposed to wide different water table (WT) conditions (drying, flooding,
natural WT fluctations) in a small fen located in a forested area of North Bavaria
(Germany). Gas (O2, CO2, CH4) and pore water (redox sensitive species) concentrations as
well as soil moisture and temperature allowed gaining insight into spatio-temporal
gradients related to WT fluctuations and seasonality.
The observed changes in the hydrological regime lead to clear shifts in the biogeochemistry
and the peat redox state. As peat becomes drier when WT drops, the diffusive transport is
affected leading to oxygen penetration, methanogenesis reduction or inhibition, loss of
stored CO2 and suppression of Fe(III) and sulphate reduction processes in the profile. This
pattern is magnified as observed from the reinforced drying in the first season and it is
inverted as WT recovers and is kept high. Calculations and peat depth incubations indicate
that most CO2 and CH4 production takes place in the upper peat layers thus resting
importance to the intensity of the WT drop regarding CO2 emissions in this site.
Nevertheless, the intensity of the WT drop is important regarding the renewal of the
electron acceptor pool, greater due to the reinforced drying. The long lag time phase
observed for CH4 concentrations recovery after the dry event indicates that no CH4
emissions are expected in this system if such intense dry events seasonally occur. Our
results indicate that peat physical properties are a major control for moisture changes and
thus also for O2 penetration and stored CO2 during WT fluctuations. Logistic regression
was used to estimate the probability for O2 penetration during WT fluctuations using ash
content as a predictor yielding a better characterization of the redox boundary than only
considering the position of the WT.
EVIDENCE OF ANTARCTIC AEROSOL FORMATION DUE TO CONTINENTAL BIOGENIC PRECURSORS Ella-Maria Kyrö (1), Aki Virkkula (1,2), Miikka Dal Maso (1), Jevgeni Parshintsev (3), Jose Ruìz-Jimenez (3), Hanna M. Manninen (1), Petri Heinonen (4), Laura Forsström (5), Marja-Liisa Riekkola (3), Kari Hartonen (3) and Markku Kulmala (1) (1) Department of Physics, University of Helsinki, Finland (2) Air Quality Research, Finnish Meteorological Institute, Finland (3) Department of Chemistry, University of Helsinki, Finland (4) FINNARP Logistics, Finnish Meteorological Institute, Finland (5) Department of Biological and Environmental Sciences, University of Helsinki, Finland [email protected] Until now, the sources of observed secondary aerosol formation in Antarctica have thought to be elsewhere than in the continent itself. Possible sources include dimethyl sulphide (DMS) emissions from oceans [1,2], long-range transport of nucleating material into the continent [3] and further intrusion of upper tropospheric air into the boundary layer [1,4]. It has been observed that at the Finnish Antarctic Research Station Aboa, the particle formation takes place in airmasses coming along the coast [5]. It has also been discussed, that secondary organic aerosols (SOA), having significant contribution in the Aitken and accumulation modes, could contribute to the growth of aerosol particles [4,6]. Moreover, the observed growth of the smallest cluster ions suggests that the nucleation in Antarctica can occur in the boundary layer and / or in the lower troposphere [2]. However, the lack of adequate measurements has restricted the chances to study the possible continental new particle formation (NPF) sources. Aerosol and atmospheric composition measurements were carried out 5.12.2009-21.1.2010 at Aboa, Queen Maud Land, during the FINNARP 2009 -expedition. The station is built on a nunatak Basen about 500 m ASL and the measurement site is located 200 m upwind from the main building. The open ocean is approximately 130 km away. During the short Antarctic summer, some of the snow and ice on top of the nunatak melts into shallow, algae filled ponds. The ponds are located approximately 2.5 km upwind from the measurement site. The concentrations of neutral and charged particles as well as their size distribution and ozone concentration were measured and filter samples were taken from the atmosphere. The meteorological conditions were usual summertime conditions at Aboa. The prevailing wind direction at the station was North-East. Only rarely the wind blew elsewhere, hence, the contamination by the station and vehicles that were used at the station was minimal. Most of the time only few clouds were present, but also some days when the station was inside the cloud, did occur. Three periods of intense NPF were observed. The obtained formation and growth rates were comparatively high for Antarctica [7], order of 1 – 10 nm/h, and cannot be explained by sulphuric acid alone. On contrary to the observations by Virkkula et al. [4] the majority of the events were not associated with ozone increase, which is a tracer of air descending from higher above. In addition, the shape of some of the events suggests that the particle formation took place on a small scale, not far away from the measurement site. To our knowledge, for neutral particles this has not been observed earlier in Antarctica. The possible connection between the algae-filled ponds and new particle formation and subsequent growth has been studied. Samples of the water and algae were taken and these samples as well as the filter samples were analyzed with a comprehensive two dimensional gas chromatography–time–of–flight mass spectrometry (GCxGC–TOF–MS). With this

methodology a large number of organic compounds can be detected. If some of the observed particle formation proves to be originated in the algae-ponds, it would be the first evidence of Antarctic new particle formation due to continental biogenic precursors. References [1] D. Davis et al., 1998, JGR, 103 (D1), 1657-1678. [2] E. Asmi et al., 2010, Atmos. Chem. Phys., 10, 4253-4271. [3] T. Ito, 1993, Tellus B, 145-159. [4] A. Virkkula et al., 2009, Geophysica, 45 (1-2), 163-181. [5] I. K. Koponen et al., 2003, JGR, 108 (D18), 4587. [6] A. Virkkula et al., 2006, JGR, 111, D05306. [7] M. Kulmala et al., 2004, J. Aerosol Sci., 35, 143-176.
INFLUENCE OF THE DRIVING TEMPERATURE FOR EDDY COVARIANCE CARBON FLUX PARTITIONING
Gitta Lasslop (1), Mirco Migliavacca (2), Markus Reichstein (1), Dario Papale (3), Alessandro Cescatti (2)
(1) MPI for Biogeochemistry, Jena
(2) European Commission, JRC Ispra, Italy
(3) University of Tuscia, Viterbo, Italy
Eddy covariance measurements have contributed strongly to our understanding of the ecosystems responses to climate with respect to the water, carbon and energy fluxes (Law et al. 2002, Mahecha et al. 2010 and many more).
To attribute the ecosystem's reponse to processes the observed net ecosystem exchange (NEE) is often split up into gross primary production (GPP) and ecosystem respiration (Reco). This procedure is usually based on semi-empirical models of respiration, that use temperature as a driver.
The collection and harmonization of the observations from many stations all over the world (www.fluxdata.org) and recent methodological developments now also allow to derive global estimates of these fluxes from the local eddy covariance flux measurements (Beer et al. 2010). In addition to the value of having a global estimate based on observations, the data streams are highly promising for model validation and improvement. The uncertainty of the GPP estimate has been partly considered by including estimates based on daytime and nighttime data, but both algorithms rely on air temperature as driver for respiration. As respiration takes place in many compartments of the ecosystem it remains unclear which temperature (air or soil in a specific depth) is the most appropriate.
In this study we investigate the potential of air and soil temperature as a driver for the Lloyd and Taylor respiration model (Lloyd and Taylor 1994) across FLUXNET sites. We quantify the uncertainty and potential biases arising from the choice of the driving temperature for respiration and try to attribute the differences between the annual flux components derived with the two temperatures to statistical measures of the relation between air and soil temperature and to vegetation structure. Moreover we quantify the effect on ecosystem parameters derived from the flux components.
References:
[1] Beer, C., Reichstein, M., Tomelleri, E., Ciais, P., Jung, M., Carvalhais, N., Rodenbeck, C., Arain, M. A., Baldocchi, D., Bondeau, G. B. B. A., Cescatti, A., Lasslop, G., Lindroth, A., Lomas, M., Luyssaert, S., Margolis, H., Oleson, K. W., Roupsard, O.,
Veenendaal, E., Viovy, N., Williams, C., Woodward, F. I., and Papale, D.: Terrestrial Gross Carbon Dioxide Uptake: Global Distribution und Covariation with Climate, Science, p. 10.1126/science. 1184984, 2010. [2] Law, B. E., Falge, E., Gu, L., Baldocchi, D. D., Bakwin, P., Berbigier, P., Davis, K., Dolman, A. J., Falk, M., Fuentes, J. D., Goldstein, A., Granier, A., Grelle, A., Hollinger, D., Janssens, I. A., Jarvis, P., Jensen, N. O., Katul, G., Mahli, Y., Matteucci, G., Meyers, T., Monson, R., Munger, W., Oechel, W., Olson, R., Pilegaard, K., Paw, K. T., Thorgeirsson, H., Valentini, R., Verma, S., Vesala, T.,Wilson, K., andWofsy, S.: Environmental controls over carbon dioxide and water vapor exchange of terrestrial vegetation, Agricultural and Forest Meteorology, 113, 97–120, 2002. [3] Lloyd J, Taylor JA, On the Temperature Dependence of Soil Respiration. Functional Ecology, 8, 315-323,1994. [4] Mahecha, M. D., Reichstein, M., Carvalhais, N., Lasslop, G., Lange, H., Seneviratne, S. I., Vargas, R., Ammann, C., Arain, M. A., Cescatti, A., Janssens, I. A., Migliavacca, M., Montagnani, L., and Richardson, A. D.: Global Convergence in the Temperature Sensitivity of Respiration at Ecosystem Level, Science, p. 10.1126/science.1189587, 2010.
MONO- AND SESQUITERPENE EMISSIONS FROM DAHURIAN LARCH Maija K. Kajos (1), Thomas Holst (2), Hannele Hakola (3), V. Tarvainen(3), Janne Rinne (1), Trofim Maximov (4) and Almut Arneth (2) (1) Department of Physics, University of Helsinki, Finland (2) Division of Physical Geography and Ecosystem Analysis, Lund University, Sweden (3) Finnish Meteorological Institute, Finland (4) Institute for Biological Problems of Cryolithozone SB RAS, Yakutsk, Russia [email protected] Emissions of mono- and sesquiterpenes and other biogenic volatile organic compounds (BVOCs) from the boreal forest biome contribute a large precursor source to the formation and growth of secondary organic aerosol, with unknown but potentially substantial effects on the atmosphere and climate [1]. However, variation in the BVOC source distribution across the boreal forests and over the course of a growing season is poorly quantified since only a very limited number of mostly short-term studies in northern Europe and northern America have been made [2]. The total forested area of Siberia is 570 million ha from which 46 % is larch forest. Two dominant larch species are Dahurian larch (Larix gmelinii) in the eastern part and Siberian larch (Larix sibirica) in the western part of Siberia. This is the first time when BVOC emissions of larch in this area have been reported, although larch is a substantial emitter of mono- and sesquiterpenes [3]. The shoot-scale BVOC emissions of Larix gmelinii were measured at the Spasskaja Pad flux measurement station located ca. 30 km to the northwest of the city of Yakutsk (62o15'18.4''N, 129o37'07.9''E, Fig 1) during three campaigns in the summer of 2009: 3.-24.6., 8.-26.7. and 14.-30.8. Emission rates of both mono- and sesquiterpenes decreased over the course of the summer with the highest concentrations measured in June. The monoterpene emission spectra were similar for both measured trees and remained fairly constant throughout the growing season. About half of the monoterpene emission spectrum was represented by 3-carene. Other major compounds were - and -pinene. On the other hand, the sesquiterpene emission spectra varied between the two measured trees and in addition changed substantially during the summer. In June and July alloaromadrendrene/farnesene was the highest contributor for both trees and in August it was below the detection limit. Since the monoterpene emissions are mostly temperature dependent, the traditionally used temperature dependent emission algorithm E = E0exp[ (T-T0)] was used [3] to determine the emission potential. E is the measured emission rate, E0 the emission potential at standard temperature T0 (30 C), an empirical factor and T is the temperature inside the chamber. The monoterpene emission potentials are in agreement with previously reported values for Larix sibirica (Table 1).
References [1] P. Tunved, H.-C et al., 2006, Science, 312, 261-263. [2] J. Rinne et al., 2009, Boreal environmental Research, 14, 807-826. [3] T. M. Ruuskanen et al., 2007, Atmospheric Environment, 41, 5807-5812. [4] A. B.Guenther et al., 1993, Journal of Geophysical Research, 98, 12609-12617
Fig 1. Location of the Spasskaja Pad field site.
Table 1. The emission potentials [ g gdw
-1 h-1] of monoterpenes at standard conditions of 30ºC calculated using the temperature dependent emission algorithm.
Tree A Tree B Ruuskanen et al., 2007, Larix Sibirica
constant (0.09)
variable constant (0.09)
variable constant (0.09)
variable
June 1.0-9.0 0.9-8.0 = 0.20 ± 0.18
10-15 4.0-15 = 0.30 ± 0.12
4.3-6.1 6.2-9.2 = 0.11 ± 0.02
July 2.0-3.0 1.5 - 2.5 = 0.15 ± 0.08
3.0-10 1.0-8.0 = 0.21 ± 0.19
6.0-7.3 9.1-9.7 = 0.03 ± 0.01
TIME-FREQUENCY ANALYSIS OF AEROSOL NUMBER CONCENTRATIONS IN
EUROPE - 28 DAY PERIOD IN NUCLEATION AND THE (LACK OF) WEEKLY CYCLE
IN CCN-SIZED PARTICLES
Ari Asmi
Dept. of Physics, University of Helsinki, Finland
Two aerosol-climate interactions are directly connected to cyclicity of aerosol particles. The
potential of cosmic-ray or sun-mediated variation in new particle formation, has been under
extensive scientific interest. Similarily, a correlation between potentially anthropogenic weekly
cycle of particle concentrations and several meteorological parameters has been proposed.
We follow the work of [1] where the EUSAAR measurements did not show any weekly cycle in the
CCN-sized aerosol number concentrations. By using long-period measurements from 3 stations in
Europe (SMEAR II and Pallas in Finland, Melpitz in Germany), we can extract the time-frequency
variations of both nucleation and CCN-sized particles to detect any weekly or monthly cycles in the
aerosol concentrations. We used all of the available data from the stations and thus have at longest
almost 14 years of continuous dataset. The method used is discrete wavelet analysis, which provides
us time-frequency spectra of the concentrations [2] .
We see no clear signal in weekly or weekly-type (e.g. 5 or 2 days) variation of CCN-sized aerosol
in the stations (Fig 1A). This suggests that the number concentration of CCN-sized aerosols are not
strongly varying with anthropogenic work week, at least in regional background. The low signal of
weekly-type variations do not support indirect aerosol effect based weekday or weekend cycles in
European boundary layer regional background.
The nucleation mode results show that the 28 days cycle can be seen in the nucleation mode aerosol
concentrations in almost every spring at SMEAR II station and visible in all stations (Fig 1B). This
period is the same as solar rotation period and related parameters, such as neutron counts on surface
and hemispheric energetic particle deposition (Fig 1B bottom). More support on this potential
hypothesis comes from the fact that the month-like periodicities of solar-related parameters also are
strongest in spring and autumn. The mechanism how this periodicity would actually influence the
nucleation rates is not, however, easily defined. To study this phenomena closer, we separated the
times of opposite phases of the periodic oscillation in nucleation. By analysing re-analysis weather
information during these periods, we noticed that the oscillation was connected to periodic
oscillation between of high and low pressure systems around North sea and Barents sea, already
discovered by [3]. This suggests that the observed 28 day periodicity in nucleation is more likely of
meteorological origin, and the underlying reason for the oscillation is periodic Arctic air outbreaks
to Scandinavia.
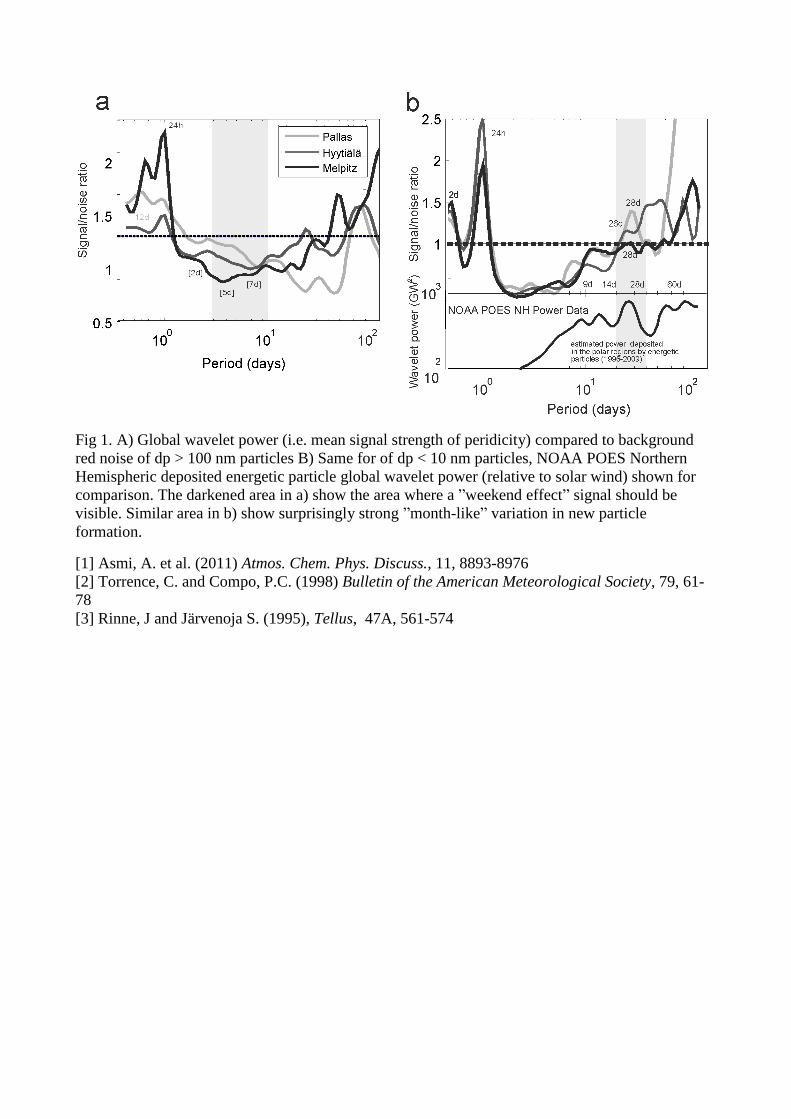
Fig 1. A) Global wavelet power (i.e. mean signal strength of peridicity) compared to background
red noise of dp > 100 nm particles B) Same for of dp < 10 nm particles, NOAA POES Northern
Hemispheric deposited energetic particle global wavelet power (relative to solar wind) shown for
comparison. The darkened area in a) show the area where a ”weekend effect” signal should be
visible. Similar area in b) show surprisingly strong ”month-like” variation in new particle
formation.
[1] Asmi, A. et al. (2011) Atmos. Chem. Phys. Discuss., 11, 8893-8976
[2] Torrence, C. and Compo, P.C. (1998) Bulletin of the American Meteorological Society, 79, 61-
78
[3] Rinne, J and Järvenoja S. (1995), Tellus, 47A, 561-574
ISOPRENE FLUXES FROM A TUNDRA ECOSYSTEM Mark Potosnak (1), Brad Baker (2), Stephen Disher(2), Kevin Griffin (3), and Sydonia Bret-Harte(4) (1) Environmental Science Program, DePaul University, Chicago, IL, USA (2) Department of Chemistry, California State University-Sacramento, Sacramento, CA, USA (3) Lamont-Doherty Earth Observatory of Columbia University, Palisades, NY, USA (4) Institute of Arctic Biology, University of Alaska-Fairbanks, Fairbanks, AK, USA [email protected] Whole-system fluxes of isoprene from a moist acidic tundra ecosystem and leaf-level emission rates of isoprene from an important species in that same ecosystem (Salix pulchra) were measured during two separate field campaigns to assess the contribution of biogenic volatile organic compounds on the chemistry of the Arctic atmosphere. The field campaigns were conducted during the summers of 2005 and 2010. The measurements took place in the Imnavait Creek watershed near the Toolik Field Station on the north slope of the Brooks Range (69° N, 149° W). The whole system fluxes were measured in conjunction with a project that is determining the net carbon exchange of the ecosystem (Arctic Observatory Network). Significant whole-system isoprene fluxes were observed during both campaigns (Figures 1 and 2). The maximum rate of isoprene flux measured was over 1 mg C m-2 hr-1 with an air temperature of 22°C and a PAR level over 2000 μmol m-2 s-1. Leaf level isoprene emission rates for S. pulchra reached 20 nmol m-2 s-1 (38 μg C gdw-1 hr-1), which was over 1% of the net carbon assimilated. In addition, several moss species emitted significant amounts of isoprene. These significant rates of isoprene emission need to be further investigated in field studies and will have major impacts of efforts to model tropospheric chemistry in the Arctic. BVOC emissions from tundra ecosystems are probably not significant in terms of carbon balance, but the effects on atmospheric chemistry in the Arctic may be much more important. Initial results from running a photochemical box model (RACMv2) indicate that OH concentrations are ½ the level that would exist without the measured amount of isoprene emitted into the atmosphere. Future research is necessary to quantify the seasonal cycle of isoprene emissions and model the impacts of all BVOC emissions on atmospheric chemistry in this region. The authors gratefully acknowledge support from the National Science Foundation for a Collaborative Research award: Biogenic Volatile Organic Compound Emissions from the Tundra and Arctic Atmospheric Chemistry (1025948). We also thank the Toolik Field Station and Institute for Arctic Biology for logistical support.
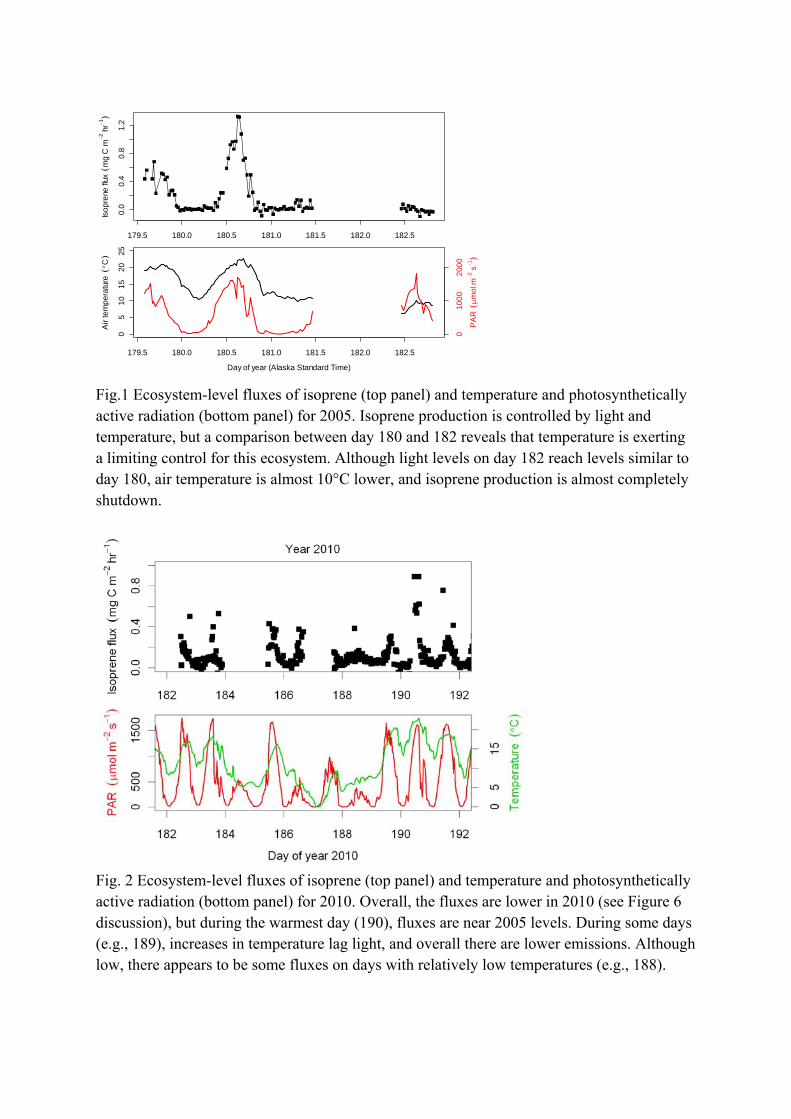
Fig.1 Ecosystem-level fluxes of isoprene (top panel) and temperature and photosynthetically active radiation (bottom panel) for 2005. Isoprene production is controlled by light and temperature, but a comparison between day 180 and 182 reveals that temperature is exerting a limiting control for this ecosystem. Although light levels on day 182 reach levels similar to day 180, air temperature is almost 10°C lower, and isoprene production is almost completely shutdown.
Fig. 2 Ecosystem-level fluxes of isoprene (top panel) and temperature and photosynthetically active radiation (bottom panel) for 2010. Overall, the fluxes are lower in 2010 (see Figure 6 discussion), but during the warmest day (190), fluxes are near 2005 levels. During some days (e.g., 189), increases in temperature lag light, and overall there are lower emissions. Although low, there appears to be some fluxes on days with relatively low temperatures (e.g., 188).
179.5 180.0 180.5 181.0 181.5 182.0 182.5
0.0
0.4
0.8
1.2
Iso
pre
nefl
ux
mgCm
2h
r1
179.5 180.0 180.5 181.0 181.5 182.0 182.5
05
10
15
20
25
Day of year (Alaska Standard Time)
Air
tem
pe
ratu
reC
01
00
02
00
0
PA
R m
olm
2s1
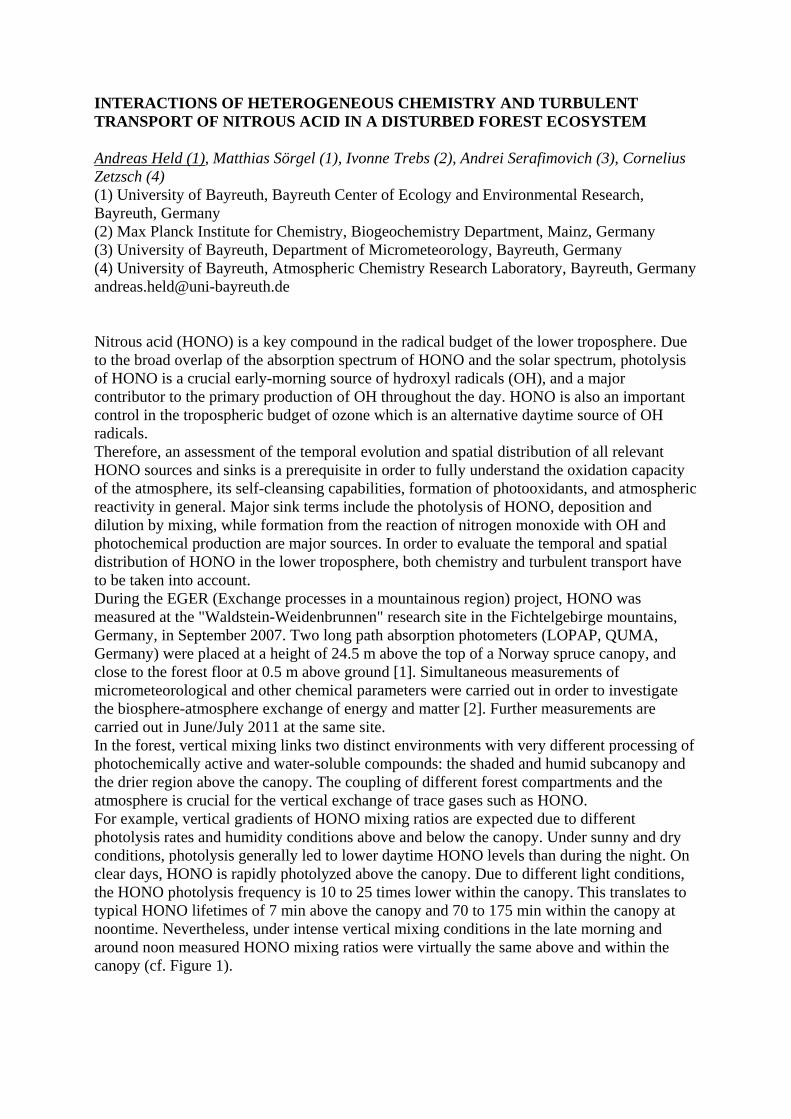
INTERACTIONS OF HETEROGENEOUS CHEMISTRY AND TURBULENT TRANSPORT OF NITROUS ACID IN A DISTURBED FOREST ECOSYSTEM Andreas Held (1), Matthias Sörgel (1), Ivonne Trebs (2), Andrei Serafimovich (3), Cornelius Zetzsch (4) (1) University of Bayreuth, Bayreuth Center of Ecology and Environmental Research, Bayreuth, Germany (2) Max Planck Institute for Chemistry, Biogeochemistry Department, Mainz, Germany (3) University of Bayreuth, Department of Micrometeorology, Bayreuth, Germany (4) University of Bayreuth, Atmospheric Chemistry Research Laboratory, Bayreuth, Germany [email protected] Nitrous acid (HONO) is a key compound in the radical budget of the lower troposphere. Due to the broad overlap of the absorption spectrum of HONO and the solar spectrum, photolysis of HONO is a crucial early-morning source of hydroxyl radicals (OH), and a major contributor to the primary production of OH throughout the day. HONO is also an important control in the tropospheric budget of ozone which is an alternative daytime source of OH radicals. Therefore, an assessment of the temporal evolution and spatial distribution of all relevant HONO sources and sinks is a prerequisite in order to fully understand the oxidation capacity of the atmosphere, its self-cleansing capabilities, formation of photooxidants, and atmospheric reactivity in general. Major sink terms include the photolysis of HONO, deposition and dilution by mixing, while formation from the reaction of nitrogen monoxide with OH and photochemical production are major sources. In order to evaluate the temporal and spatial distribution of HONO in the lower troposphere, both chemistry and turbulent transport have to be taken into account. During the EGER (Exchange processes in a mountainous region) project, HONO was measured at the "Waldstein-Weidenbrunnen" research site in the Fichtelgebirge mountains, Germany, in September 2007. Two long path absorption photometers (LOPAP, QUMA, Germany) were placed at a height of 24.5 m above the top of a Norway spruce canopy, and close to the forest floor at 0.5 m above ground [1]. Simultaneous measurements of micrometeorological and other chemical parameters were carried out in order to investigate the biosphere-atmosphere exchange of energy and matter [2]. Further measurements are carried out in June/July 2011 at the same site. In the forest, vertical mixing links two distinct environments with very different processing of photochemically active and water-soluble compounds: the shaded and humid subcanopy and the drier region above the canopy. The coupling of different forest compartments and the atmosphere is crucial for the vertical exchange of trace gases such as HONO. For example, vertical gradients of HONO mixing ratios are expected due to different photolysis rates and humidity conditions above and below the canopy. Under sunny and dry conditions, photolysis generally led to lower daytime HONO levels than during the night. On clear days, HONO is rapidly photolyzed above the canopy. Due to different light conditions, the HONO photolysis frequency is 10 to 25 times lower within the canopy. This translates to typical HONO lifetimes of 7 min above the canopy and 70 to 175 min within the canopy at noontime. Nevertheless, under intense vertical mixing conditions in the late morning and around noon measured HONO mixing ratios were virtually the same above and within the canopy (cf. Figure 1).
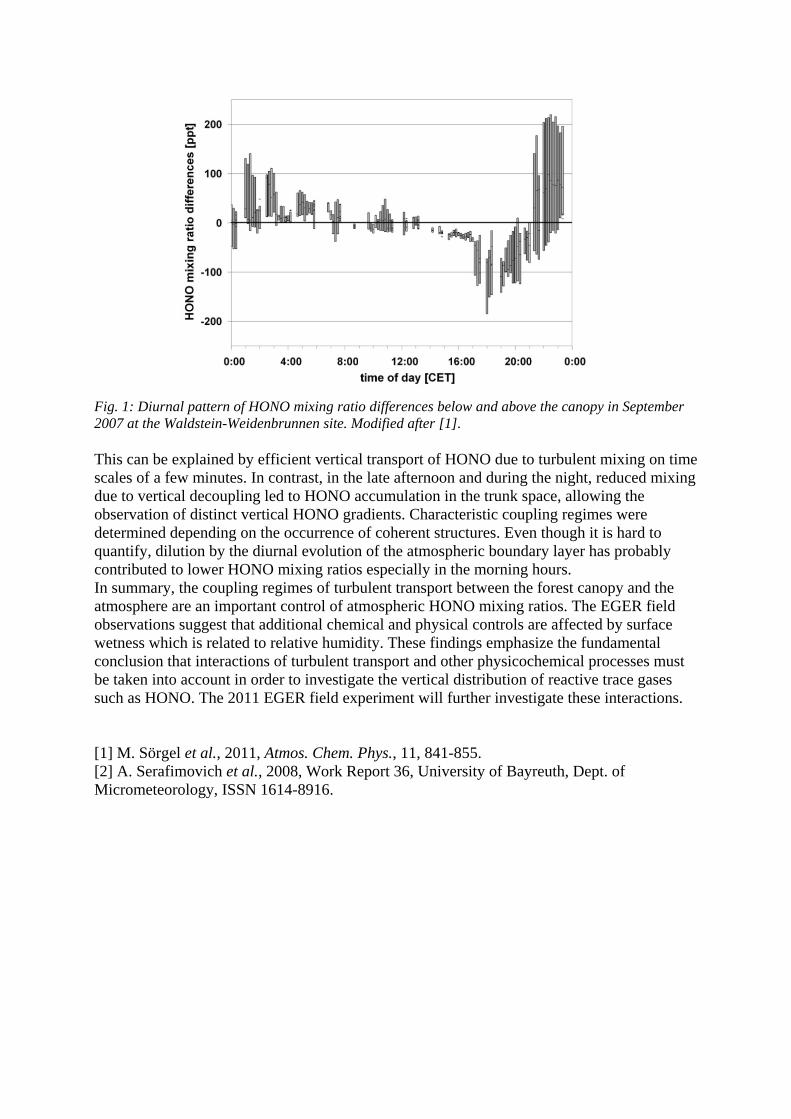
Fig. 1: Diurnal pattern of HONO mixing ratio differences below and above the canopy in September 2007 at the Waldstein-Weidenbrunnen site. Modified after [1]. This can be explained by efficient vertical transport of HONO due to turbulent mixing on time scales of a few minutes. In contrast, in the late afternoon and during the night, reduced mixing due to vertical decoupling led to HONO accumulation in the trunk space, allowing the observation of distinct vertical HONO gradients. Characteristic coupling regimes were determined depending on the occurrence of coherent structures. Even though it is hard to quantify, dilution by the diurnal evolution of the atmospheric boundary layer has probably contributed to lower HONO mixing ratios especially in the morning hours. In summary, the coupling regimes of turbulent transport between the forest canopy and the atmosphere are an important control of atmospheric HONO mixing ratios. The EGER field observations suggest that additional chemical and physical controls are affected by surface wetness which is related to relative humidity. These findings emphasize the fundamental conclusion that interactions of turbulent transport and other physicochemical processes must be taken into account in order to investigate the vertical distribution of reactive trace gases such as HONO. The 2011 EGER field experiment will further investigate these interactions. [1] M. Sörgel et al., 2011, Atmos. Chem. Phys., 11, 841-855. [2] A. Serafimovich et al., 2008, Work Report 36, University of Bayreuth, Dept. of Micrometeorology, ISSN 1614-8916.
BIOSPHERE – ATMOSPHERE EXCHANGE OF VOCS
Taina M. Ruuskanen, Simon Schallhart, Maija K. Kajos, Markku Kulmala, Janne Rinne
Department of Physics, University of Helsinki, Finland
Volatile organic compounds (VOCs) take part in atmospheric processes from formation of
atmospheric oxidants, such as ozone and OH, to secondary organic aerosol (SOA) particle
formation. Plants emit various VOCs, including mono- and sesquiterpenes, precursors for the
growth of freshly nucleated aerosol particles [1]. Aerosol particle growth rates are larger during the
summer, at the time of the highest biogenic VOC emissions. A wide range of organic compounds
are ionized by H3O+ used in proton transfer reaction – mass spectrometry (PTR-MS). PTR-MS
instruments equipped with a quadrupole have been commercially available for over a decade and
been widely coupled with disjunct eddy covariance method for VOC flux measurements. However,
the method measures one mass/charge at a time with a nominal mass resolution. Preselected set of
measurable compounds, biases towards studies of species with known emissions. This in turn leads
to missing of unusual events including emission of unexpected compounds e.g. during extreme
physical stress [2] and deposition of terpenoids [3]. In addition, the consecutive measurement of
compounds and disjunct VOC time series result in a poor flux resolution.
The novel combination of PTR with a time-of-flight mass-spectrometer (PTR-ToF) enables
measurement of full mass spectra with a mass resolution sufficient for the identification of chemical
formulas and separation of oxygenated and hydrocarbon species exhibiting the same nominal mass
[4]. The PTR-ToF is a fast response instrument that enables direct eddy covariance (EC)
measurements (5-20Hz) which is the preferred flux determination technique for biosphere-
atmosphere exchange studies. Determining simultaneous EC fluxes opens up a new possibility to
look at fluxes of a wide range of organic compounds allowing the determination of their fate in the
atmosphere, e.g. screening of VOCs emission from various ecosystems and observation of
deposition fluxes.
In March – May, 2011 a PTR-ToF-MS was used to measure at 10 Hz frequency full mass spectra
up to m/z 520 above a boreal forest at SMEAR II site in Hyytiälä, Finland [5], with a measurement
setup described by Schallhart et al. [6]. We will present preliminary results from the spring 2011
measurement campaign.
References
[1] P. Tunved et al., 2006, Science, 312, 261–263.
[2] T. M. Ruuskanen et al., 2010, Atmos. Chem. Phys., 11, 611-625.
[3] I. Bamberger et al., 2011, iLEAPS OSC 2011 proceedings.
[4] M. Graus et al., 2010, J. Am. Soc. Mass Spectr., 21, 1037-1044.
[5] Hari and Kulmala, 2005, Boreal Environ. Res., 10, 315–322.
[6] S. Schallhart et al., iLEAPS OSC 2011 proceedings.
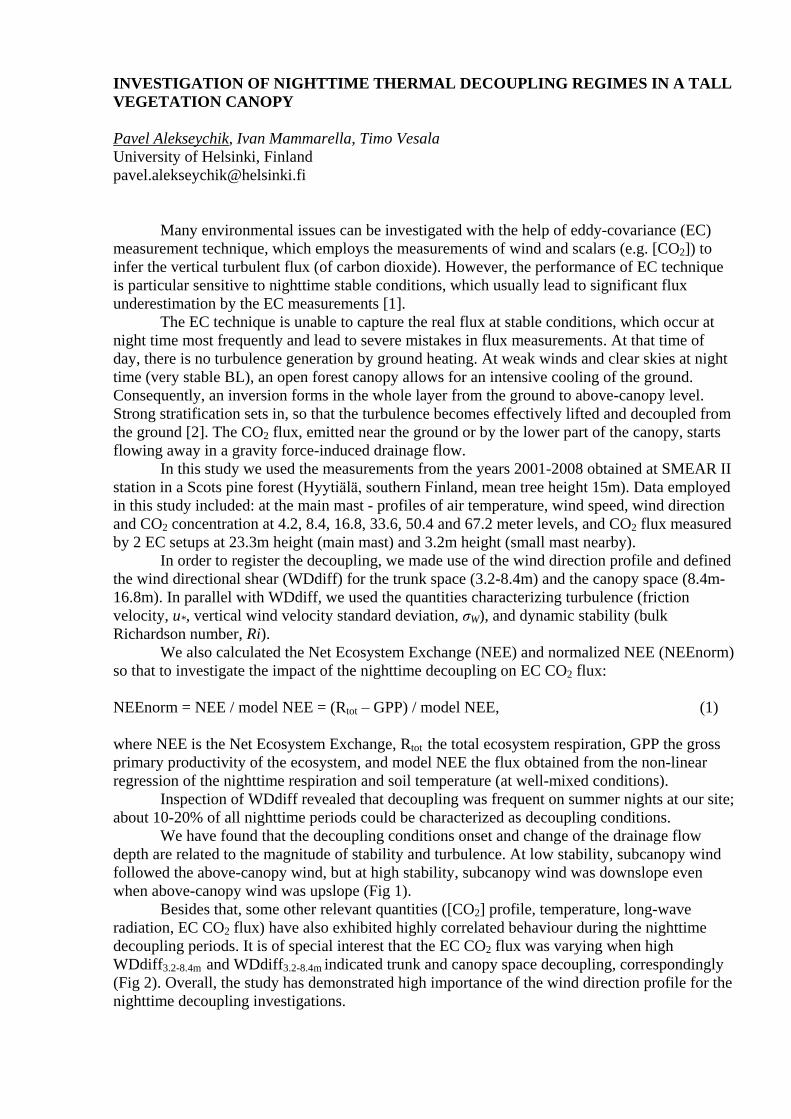
INVESTIGATION OF NIGHTTIME THERMAL DECOUPLING REGIMES IN A TALL
VEGETATION CANOPY
Pavel Alekseychik, Ivan Mammarella, Timo Vesala
University of Helsinki, Finland
Many environmental issues can be investigated with the help of eddy-covariance (EC)
measurement technique, which employs the measurements of wind and scalars (e.g. [CO2]) to
infer the vertical turbulent flux (of carbon dioxide). However, the performance of EC technique
is particular sensitive to nighttime stable conditions, which usually lead to significant flux
underestimation by the EC measurements [1].
The EC technique is unable to capture the real flux at stable conditions, which occur at
night time most frequently and lead to severe mistakes in flux measurements. At that time of
day, there is no turbulence generation by ground heating. At weak winds and clear skies at night
time (very stable BL), an open forest canopy allows for an intensive cooling of the ground.
Consequently, an inversion forms in the whole layer from the ground to above-canopy level.
Strong stratification sets in, so that the turbulence becomes effectively lifted and decoupled from
the ground [2]. The CO2 flux, emitted near the ground or by the lower part of the canopy, starts
flowing away in a gravity force-induced drainage flow.
In this study we used the measurements from the years 2001-2008 obtained at SMEAR II
station in a Scots pine forest (Hyytiälä, southern Finland, mean tree height 15m). Data employed
in this study included: at the main mast - profiles of air temperature, wind speed, wind direction
and CO2 concentration at 4.2, 8.4, 16.8, 33.6, 50.4 and 67.2 meter levels, and CO2 flux measured
by 2 EC setups at 23.3m height (main mast) and 3.2m height (small mast nearby).
In order to register the decoupling, we made use of the wind direction profile and defined
the wind directional shear (WDdiff) for the trunk space (3.2-8.4m) and the canopy space (8.4m-
16.8m). In parallel with WDdiff, we used the quantities characterizing turbulence (friction
velocity, u*, vertical wind velocity standard deviation, σW), and dynamic stability (bulk
Richardson number, Ri).
We also calculated the Net Ecosystem Exchange (NEE) and normalized NEE (NEEnorm)
so that to investigate the impact of the nighttime decoupling on EC CO2 flux:
NEEnorm = NEE / model NEE = (Rtot – GPP) / model NEE, (1)
where NEE is the Net Ecosystem Exchange, Rtot the total ecosystem respiration, GPP the gross
primary productivity of the ecosystem, and model NEE the flux obtained from the non-linear
regression of the nighttime respiration and soil temperature (at well-mixed conditions).
Inspection of WDdiff revealed that decoupling was frequent on summer nights at our site;
about 10-20% of all nighttime periods could be characterized as decoupling conditions.
We have found that the decoupling conditions onset and change of the drainage flow
depth are related to the magnitude of stability and turbulence. At low stability, subcanopy wind
followed the above-canopy wind, but at high stability, subcanopy wind was downslope even
when above-canopy wind was upslope (Fig 1).
Besides that, some other relevant quantities ([CO2] profile, temperature, long-wave
radiation, EC CO2 flux) have also exhibited highly correlated behaviour during the nighttime
decoupling periods. It is of special interest that the EC CO2 flux was varying when high
WDdiff3.2-8.4m and WDdiff3.2-8.4m indicated trunk and canopy space decoupling, correspondingly
(Fig 2). Overall, the study has demonstrated high importance of the wind direction profile for the
nighttime decoupling investigations.
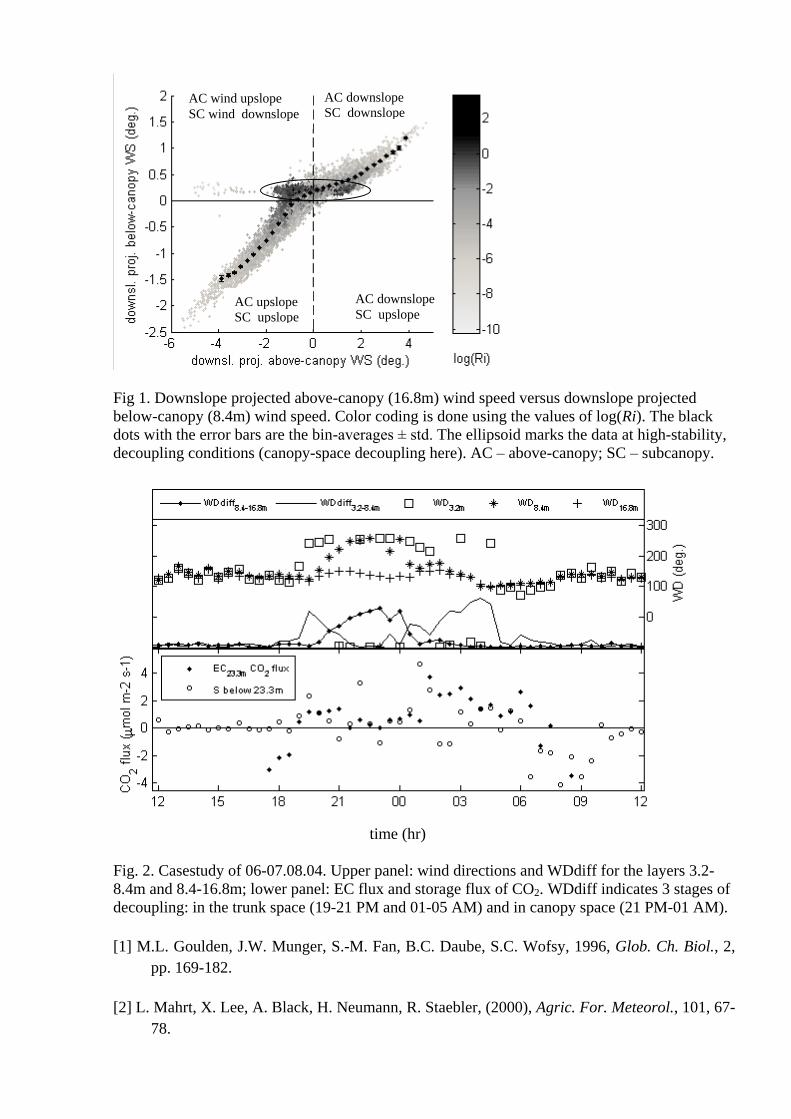
Fig 1. Downslope projected above-canopy (16.8m) wind speed versus downslope projected
below-canopy (8.4m) wind speed. Color coding is done using the values of log(Ri). The black
dots with the error bars are the bin-averages ± std. The ellipsoid marks the data at high-stability,
decoupling conditions (canopy-space decoupling here). AC – above-canopy; SC – subcanopy.
time (hr)
Fig. 2. Casestudy of 06-07.08.04. Upper panel: wind directions and WDdiff for the layers 3.2-
8.4m and 8.4-16.8m; lower panel: EC flux and storage flux of CO2. WDdiff indicates 3 stages of
decoupling: in the trunk space (19-21 PM and 01-05 AM) and in canopy space (21 PM-01 AM).
[1] M.L. Goulden, J.W. Munger, S.-M. Fan, B.C. Daube, S.C. Wofsy, 1996, Glob. Ch. Biol., 2,
pp. 169-182.
[2] L. Mahrt, X. Lee, A. Black, H. Neumann, R. Staebler, (2000), Agric. For. Meteorol., 101, 67-
78.
AC wind upslope
SC wind downslope
AC downslope
SC downslope
AC upslope
SC upslope
AC downslope
SC upslope
SYSTEMATIC AND RANDOM ERRORS IN EDDY COVARIANCE MEASUREMENTS AT AN URBAN SITE Annika Nordbo, Leena Järvi and Timo Vesala Department of Physics, University of Helsinki, Finland [email protected] The eddy covariance technique is a state-of-the-art method for measuring surface–atmosphere interactions in the atmospheric boundary layer by determining the vertical turbulent fluxes of momentum, heat and gases. Sensible (H) and latent (LE) heat fluxes form a surface energy balance together with net radiation (Rn), change in heat storage (QS) and anthropogenic-based heat flux (QF). Urban areas are characterized by a high coverage of impervious surfaces in addition to changed heat capacities and surface albedos of different materials. These together with the existence of an additional anthropogenic heat source leads to an altered energy partitioning between H and LE which further leads to inadvertent climate modification. Therefore, much attention is directed to the determination of QF and QS which are almost impossible to measure in an urban environment and are thus often considered together as the residual of the energy balance (Res=Rn–H–LE =QS–QF). Consequently, all uncertainties in H and LE measurements propagate to errors in Res. The errors can be divided to random and systematic ones and the latter can further be divided into unknown and known systematic errors that stem from choices in flux calculation procedure. Despite the ever-growing usage of the eddy covariance technique, many flux calculation procedures are under debate and subjective choices are to be made when calculating fluxes. Our objective is to assess the random and known systematic errors in eddy covariance measurements at a heterogeneous urban site and their effect on the energy balance residual. Three years of continuous measurements of Rn, H and LE are used from the SMEAR III station, Helsinki, Finland [1]. The water vapor concentration needed for latent heat flux calculations is measured both with an open- and a closed-path infrared gas analyzer (LEOP, LECP). The mean random error, as percentages of the observed flux, is least for H (9.1%, 6.4 Wm-2) and almost as small for momentum flux (12.4%, 0.046 kg m-1s-2 , Figure 1). The latent heat flux measurements are more inaccurate: with random errors of 16.14% (6.70 Wm-2) and 15.75% (7.63 Wm-2) for closed-path and open-path measurements, respectively. The systematic errors—due to flux calculation procedure choices—vary between fluxes and procedures of concern. Leaving out spectral corrections causes, on average, a 26.2% underestimation of LECP, whereas the underestimations for LEOP, H and momentum are around 5% (Figure 1). The huge underestimation in LECP is caused by water vapor condensation as air samples are drawn down the tube of the closed-path system. The calculation is improved by 4 percent points by making a theoretical spectral correction which does not take into account all tube effects. Consequently, the energy balance residual is overestimated in unstable conditions and underestimated in stable conditions: by about 8% if spectral corrections to H and LECP are not made. The effect is smaller if an open-path analyzer is used. If fluxes are calculated without taking into account the interdependency of corrections through iteration, the effect on flux value is minor (<1%). Furthermore, making a planar fit coordinate rotation—instead of the commonly used 2-dimensional coordinate rotation—underestimates all fluxes by about 5% and also the residuals are underestimated by a few percent. The underestimation is larger during unstable atmospheric stratification than stable atmospheric stratification, implying that streamlines depend on stability. Moreover, LEOP is increased by 1.6% by making a surface heating correction and LECP is underestimated by 1.8% if a theoretical lag window is used and the lag time dependency on

relative humidity is not taken into account. The effects on ResOP and ResCP are of course opposite. To conclude, the random error incorporated in energy-flux measurements is of the order of 10% and systematic errors due to subjective choices in calculation procedures can exceed this value. Latent heat flux observations using a closed-path analyzer are most prone to errors for our measurement setup whereas sensible heat and open-path latent heat flux observations are less sensitive to calculation choices. The impact on the energy-balance residuals can be of the same order as anthropogenic heat release itself and thus special care must be taken. This sort of uncertainty analysis is the perquisite to model–data synthesis and urban metabolic budget estimation, especially in complex environments like cities.
[1] T. Vesala, L. Järvi, S. Launiainen, A. Sogachev, Ü. Rannik, I. Mammarella, E. Siivola, P. Keronen, J. Rinne, A. Riikonen and E. Nikinmaa, 2008, Surface-atmosphere interactions over complex urban terrain in Helsinki, Finland. Tellus Ser. B-Chem. Phys. Meteorol., 60, 188-199.
Figure 1. Random and systematic errors for momentum flux ( ), sensible heat flux (H), closed-path latent heat flux (LECP), open-path latent heat flux (LEOP) and energy balance residuals using LECP and LEOP (ResCP, ResOP). The random flux error for each flux is shown with a gray patch. The mean systematic flux error due to different calculation procedures is shown as bars for all stabilities and means for different stability classes are denoted by (stable, >0.01), o (neutral, -0.01< <0.01), (unstable, <-0.01). Errorbars denote 25th and 75th percentiles and the median is denoted by a filled circle (•).
VARIABILITY AND LONG-TERM TRENDS OF CARBON DIOXIDE AND METHANE COLUMN-AVERAGED MOLE FRACTIONS RETRIEVED FROM SCIAMACHY ONBOARD ENVISAT
Oliver Schneising, Michael Buchwitz, Maximilian Reuter, Jens Heymann, Heinrich Bovensmann, and John P. BurrowsUniversity of Bremen, Institute of Environmental Physics (IUP), [email protected]
Carbon dioxide (CO2) and methane (CH4) are the two most important anthropogenic greenhouse gases contributing to global climate change. Despite their importance our knowledge about their variable sources and sinks has significant gaps. However, satellite data, if accurate and precise enough, have the potential to significantly reduce surface flux uncertainties. High reduction of regional flux uncertainties additionally requires high sensitivity to the lowest atmospheric layers where the variability is largest. Sensitivity to all altitude levels, including the boundary layer, can be achieved using reflected solar radiation in the near-infrared/shortwave-infrared (NIR/SWIR) spectral region. SCIAMACHY onboard ENVISAT (launch 2002) was the first and is now with TANSO onboard GOSAT (launch 2009) one of only two satellite instruments currently in space covering important absorption bands of both gases in this spectral range.Global SCIAMACHY nadir observations from the time period 2003-2009 have been used to retrieve carbon dioxide and methane column-averaged mole fractions (which are the quantities needed for inverse modelling to get information on the sources and sinks) constituting seven years of greenhouse gas information derived from European EO data. These multi-year global data sets will be presented and discussed focusing on the variability due to land-atmosphere interactions and long-term trends. The analysis includes an investigation of the boreal forest carbon uptake during the growing season and the renewed growth of atmospheric methane in recent years.
Effects of land use change and monsoon variability on atmosphere-ecosystem exchange
in high alpine grasslands on the Tibetan Plateau
Tobias Biermann (1), Wolfgang Babel (1), Lena Becker(2), H einz Coners (3),
Silke Hafner (4,5), Siyuan He (6), Johannes Ingrisch (4), Thomas Leipold (1), E. Seeber (3),
O. Shibostova (2), Sebastian Unteregelbacher (4,7), Peli Shi (8), Yaoming Ma (9),
Yongpin Yang (9), Keith Richards (6), Karsten Wesche (10), Georg Miehe(11),
Christoph Leuschner (3), Yakov Kuzyakov (4,5), Georg Guggenberger(2), Thomas Foken (1)
(1) Dept. Micrometeorology, University of Bayreuth, Germany
(2) Institute of Soil Science, University Hannover, Germany
(3) Institute of Plant Ecology University of Göttingen, Germany
(4) Dept. of Agroecosystem Research, University of Bayreuth, Germany
(5) Dept. of Soil Science of Temperate and Boreal Ecosystems, University of Göttingen,
Germany
(6) Geography Department, University of Cambridge, UK
(7) Inst. for Meteorology and Climate Research - Atmospheric Environmental Research,
Garmisch-Partenkirchen, Germany
(8) Institute of Geographical Sciences and Natural Resources Research, China
(9) Institute of Tibetan Plateau Research, China
(10) Senckenberg Museum for Natural History, Görlitz, Germany
(11) Geography Department, University of Marburg, Germany
The Atmosphere Ecology Glaciology cluster (AEG) within DFG SPP 1372 Tibetan Plateau
(TiP) investigates the ecosystem response on the Tibetan Plateau (TP) to changes in climate,
monsoon dynamics and land use. The highlands of the TP inherit the world’s largest alpine
ecosystem [1, 2]. Special focus lies on the Cyperaceae Kobresia pygmaea, which covers app.
450.000 km 2 on an altitudinal range from 4000 to 5960 m a.s.l. (Fig 1). This species is the
most abundant on the TP and is especially adapted to grazing pressure, growing only 2-6 cm
tall and forming a stable turf built up from roots which play a key role in prevention of soil
degradation [2]. Soils on the TP store 2.5 % of the global soil organic carbon (SOC) stocks
[1]. Furthermore the TP contains the headwaters of Asia’s major rivers, providing a large
portion of the worlds population with freshwater and likewise bearing the risk of flooding
events [2]. The dynamics of these rivers is strongly affected by Monsoon variability, which in
turn is modulated by local circulation systems on the TP and in the Himalayans.
The research of the AEG cluster focuses on two vegetation types, alpine steppe and montane
grassland in different altitudes on the TP. Fenced sites, which exclude grazing by livestock,
have been established along an altitude gradient on the TP [3], since grazing is considered to
be a key factor affecting plant community and fodder quality, soil carbon stocks and turnover
as well as the energy and matter exchange between the atmosphere and the ecosystem.
The sites in Qinghai 3300-3600 m a.s.l. (Fig 1), established in 2002, showed in 2009 great
differences in vegetation composition on grazed and non grazed plots. Main research focused
on the change in vegetation and its fodder quality as well as soil carbon stocks and turnover,
which were investigated by soil analysis and 13
C pulse labeling. Results indicate that the
exclusion of grazing livestock might lead to reduced carbon storage in soils and therefore is
not the appropriate choice for management of Kobresia meadows [4, 5]. In 2010 the cluster
conducted a multidisciplinary experiment in Kema, in the center of the major distribution of
Kobresia pygmaea 4400 m a.s.l (Fig 1), to investigate the response of these meadows to land
use and climatic changes. Focus lied on the energy and matter exchange between the
ecosystem and the atmosphere, CO2 fluxes and water exchange in soil and plants as well as
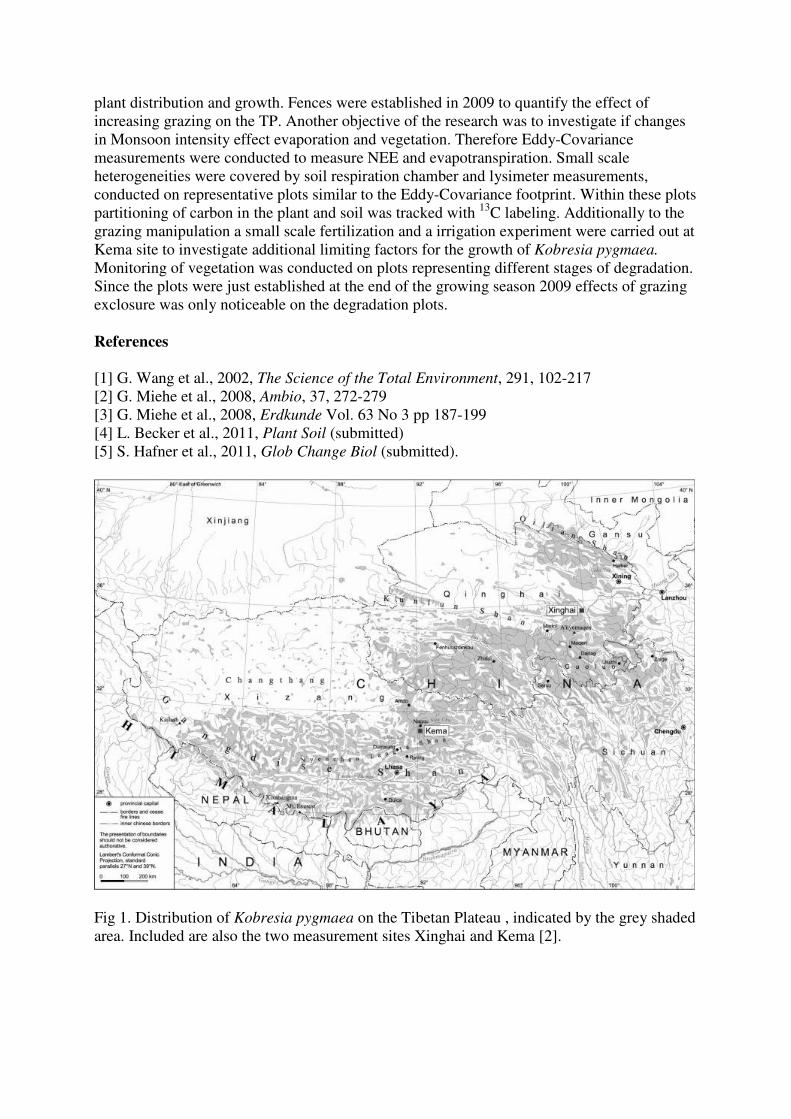
plant distribution and growth. Fences were established in 2009 to quantify the effect of
increasing grazing on the TP. Another objective of the research was to investigate if changes
in Monsoon intensity effect evaporation and vegetation. Therefore Eddy-Covariance
measurements were conducted to measure NEE and evapotranspiration. Small scale
heterogeneities were covered by soil respiration chamber and lysimeter measurements,
conducted on representative plots similar to the Eddy-Covariance footprint. Within these plots
partitioning of carbon in the plant and soil was tracked with 13
C labeling. Additionally to the
grazing manipulation a small scale fertilization and a irrigation experiment were carried out at
Kema site to investigate additional limiting factors for the growth of Kobresia pygmaea.
Monitoring of vegetation was conducted on plots representing different stages of degradation.
Since the plots were just established at the end of the growing season 2009 effects of grazing
exclosure was only noticeable on the degradation plots.
References
[1] G. Wang et al., 2002, The Science of the Total Environment, 291, 102-217
[2] G. Miehe et al., 2008, Ambio, 37, 272-279
[3] G. Miehe et al., 2008, Erdkunde Vol. 63 No 3 pp 187-199
[4] L. Becker et al., 2011, Plant Soil (submitted)
[5] S. Hafner et al., 2011, Glob Change Biol (submitted).
Fig 1. Distribution of Kobresia pygmaea on the Tibetan Plateau , indicated by the grey shaded
area. Included are also the two measurement sites Xinghai and Kema [2].
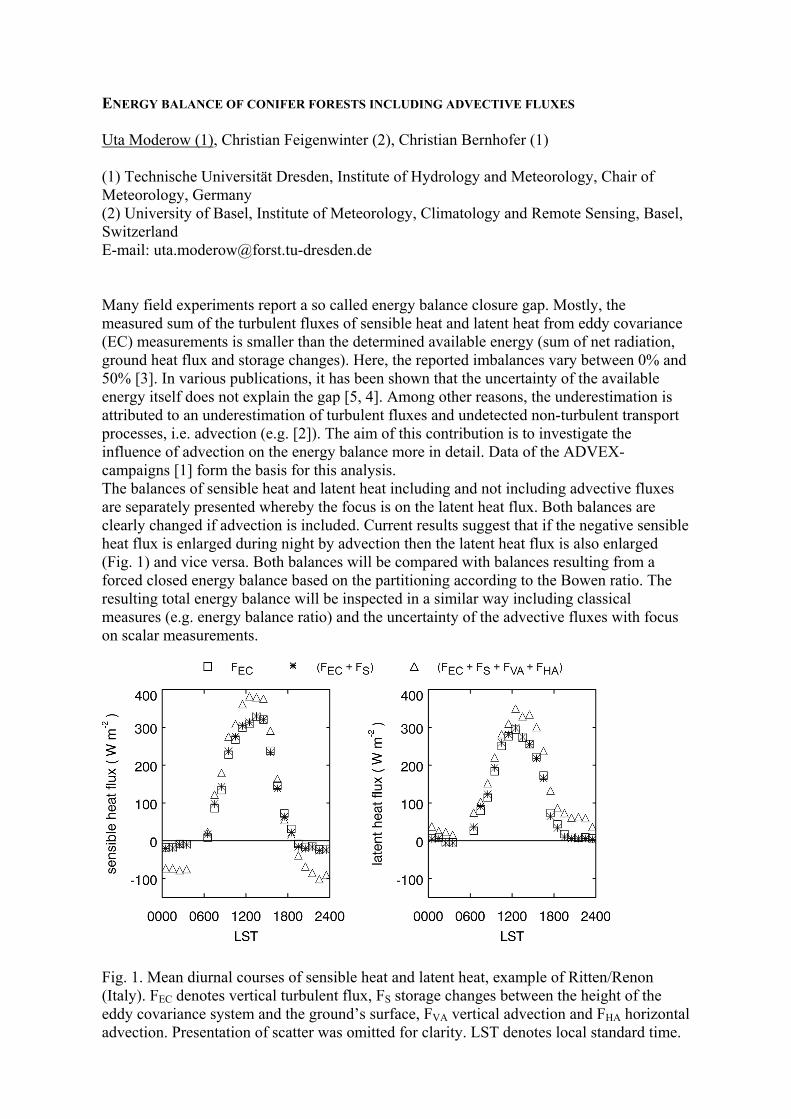
ENERGY BALANCE OF CONIFER FORESTS INCLUDING ADVECTIVE FLUXES Uta Moderow (1), Christian Feigenwinter (2), Christian Bernhofer (1) (1) Technische Universität Dresden, Institute of Hydrology and Meteorology, Chair of Meteorology, Germany (2) University of Basel, Institute of Meteorology, Climatology and Remote Sensing, Basel, Switzerland E-mail: [email protected] Many field experiments report a so called energy balance closure gap. Mostly, the measured sum of the turbulent fluxes of sensible heat and latent heat from eddy covariance (EC) measurements is smaller than the determined available energy (sum of net radiation, ground heat flux and storage changes). Here, the reported imbalances vary between 0% and 50% [3]. In various publications, it has been shown that the uncertainty of the available energy itself does not explain the gap [5, 4]. Among other reasons, the underestimation is attributed to an underestimation of turbulent fluxes and undetected non-turbulent transport processes, i.e. advection (e.g. [2]). The aim of this contribution is to investigate the influence of advection on the energy balance more in detail. Data of the ADVEX-campaigns [1] form the basis for this analysis. The balances of sensible heat and latent heat including and not including advective fluxes are separately presented whereby the focus is on the latent heat flux. Both balances are clearly changed if advection is included. Current results suggest that if the negative sensible heat flux is enlarged during night by advection then the latent heat flux is also enlarged (Fig. 1) and vice versa. Both balances will be compared with balances resulting from a forced closed energy balance based on the partitioning according to the Bowen ratio. The resulting total energy balance will be inspected in a similar way including classical measures (e.g. energy balance ratio) and the uncertainty of the advective fluxes with focus on scalar measurements.
Fig. 1. Mean diurnal courses of sensible heat and latent heat, example of Ritten/Renon (Italy). FEC denotes vertical turbulent flux, FS storage changes between the height of the eddy covariance system and the ground’s surface, FVA vertical advection and FHA horizontal advection. Presentation of scatter was omitted for clarity. LST denotes local standard time.

References
[1] C. Feigenwinter et al., 2008, Agric. Forest. Meteorol., 148, 12-24.
[2] T. Foken et al., 2006, Atmos. Chem. Phys. Discuss., 6, 3381-3402.
[3] J. Laubach, 1996, Wissenschaftliche Mitteilungen aus dem Institut für Meteorologie der Universität Leipzig und dem Institut für Troposphärenforschung e.V, Volume 3, Leipzig, p 139.
[4] U. Moderow et al., 2009, Theor. Appl. Climatol. 98, 397-412.
[5] R. Vogt et al., 1996, Theor. Appl. Climatol. 53, 23–31.
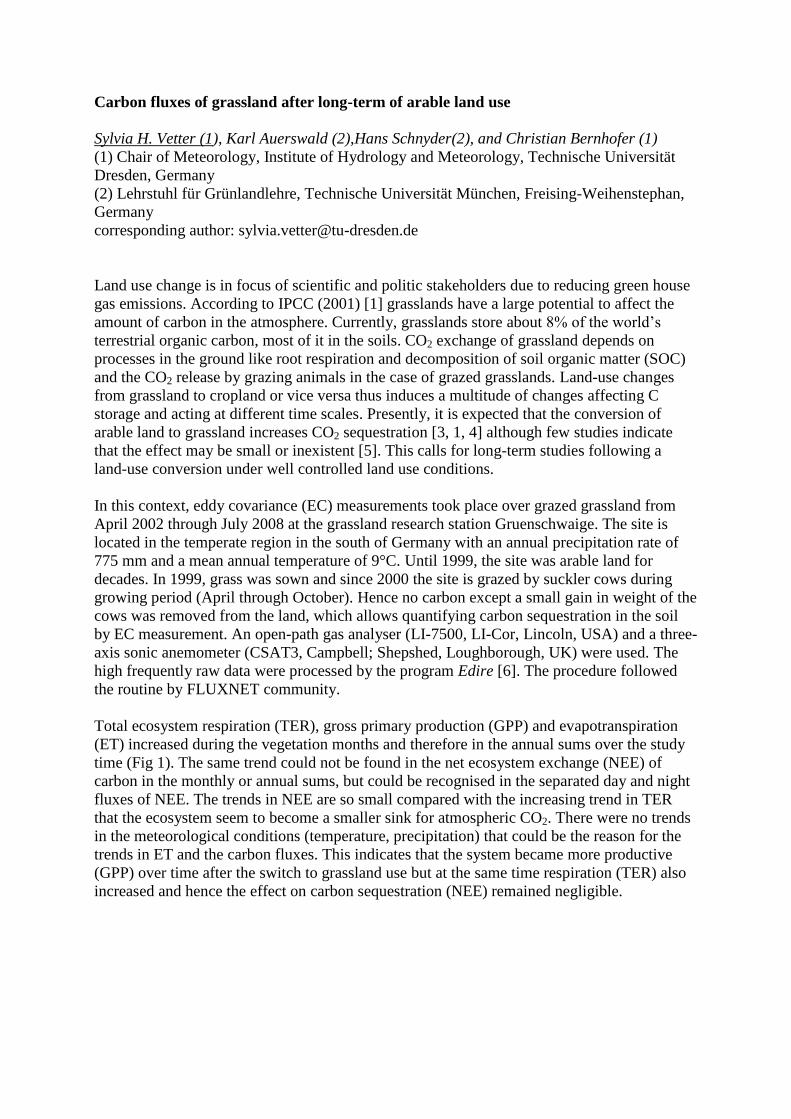
Carbon fluxes of grassland after long-term of arable land use
Sylvia H. Vetter (1), Karl Auerswald (2),Hans Schnyder(2), and Christian Bernhofer (1)
(1) Chair of Meteorology, Institute of Hydrology and Meteorology, Technische Universität
Dresden, Germany
(2) Lehrstuhl für Grünlandlehre, Technische Universität München, Freising-Weihenstephan,
Germany
corresponding author: [email protected]
Land use change is in focus of scientific and politic stakeholders due to reducing green house
gas emissions. According to IPCC (2001) [1] grasslands have a large potential to affect the
amount of carbon in the atmosphere. Currently, grasslands store about 8% of the world’s
terrestrial organic carbon, most of it in the soils. CO2 exchange of grassland depends on
processes in the ground like root respiration and decomposition of soil organic matter (SOC)
and the CO2 release by grazing animals in the case of grazed grasslands. Land-use changes
from grassland to cropland or vice versa thus induces a multitude of changes affecting C
storage and acting at different time scales. Presently, it is expected that the conversion of
arable land to grassland increases CO2 sequestration [3, 1, 4] although few studies indicate
that the effect may be small or inexistent [5]. This calls for long-term studies following a
land-use conversion under well controlled land use conditions.
In this context, eddy covariance (EC) measurements took place over grazed grassland from
April 2002 through July 2008 at the grassland research station Gruenschwaige. The site is
located in the temperate region in the south of Germany with an annual precipitation rate of
775 mm and a mean annual temperature of 9°C. Until 1999, the site was arable land for
decades. In 1999, grass was sown and since 2000 the site is grazed by suckler cows during
growing period (April through October). Hence no carbon except a small gain in weight of the
cows was removed from the land, which allows quantifying carbon sequestration in the soil
by EC measurement. An open-path gas analyser (LI-7500, LI-Cor, Lincoln, USA) and a three-
axis sonic anemometer (CSAT3, Campbell; Shepshed, Loughborough, UK) were used. The
high frequently raw data were processed by the program Edire [6]. The procedure followed
the routine by FLUXNET community.
Total ecosystem respiration (TER), gross primary production (GPP) and evapotranspiration
(ET) increased during the vegetation months and therefore in the annual sums over the study
time (Fig 1). The same trend could not be found in the net ecosystem exchange (NEE) of
carbon in the monthly or annual sums, but could be recognised in the separated day and night
fluxes of NEE. The trends in NEE are so small compared with the increasing trend in TER
that the ecosystem seem to become a smaller sink for atmospheric CO2. There were no trends
in the meteorological conditions (temperature, precipitation) that could be the reason for the
trends in ET and the carbon fluxes. This indicates that the system became more productive
(GPP) over time after the switch to grassland use but at the same time respiration (TER) also
increased and hence the effect on carbon sequestration (NEE) remained negligible.
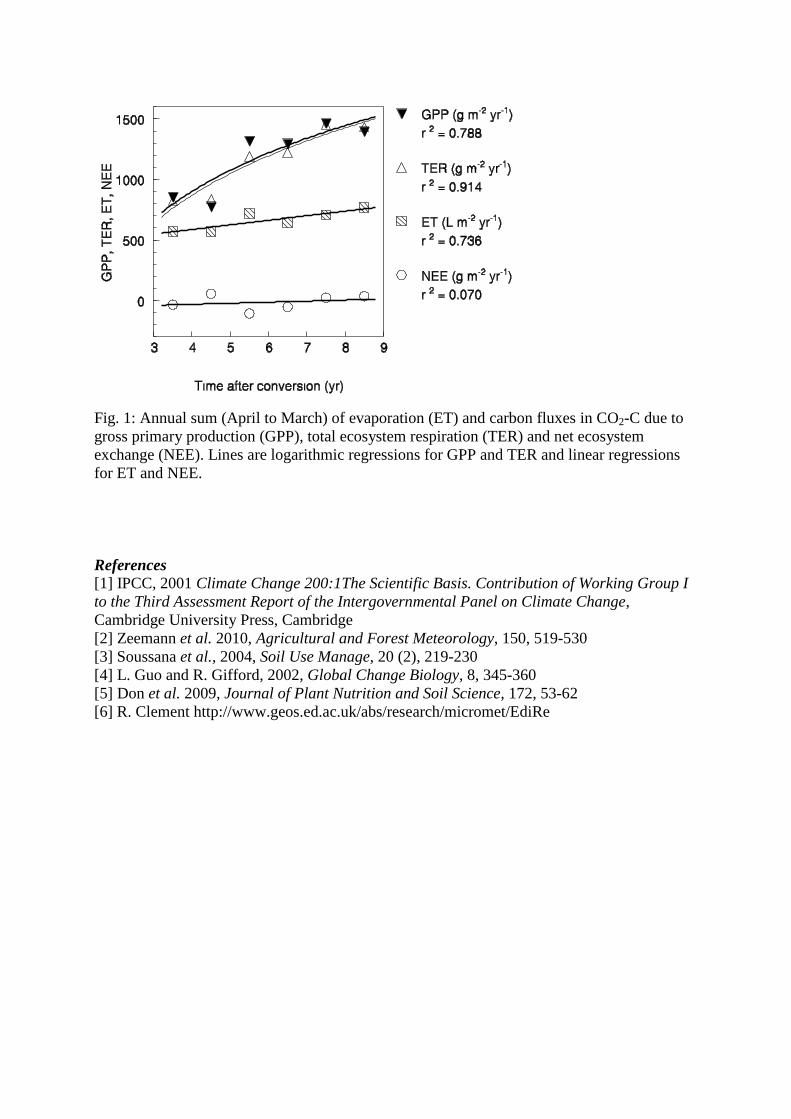
Fig. 1: Annual sum (April to March) of evaporation (ET) and carbon fluxes in CO2-C due to
gross primary production (GPP), total ecosystem respiration (TER) and net ecosystem
exchange (NEE). Lines are logarithmic regressions for GPP and TER and linear regressions
for ET and NEE.
References
[1] IPCC, 2001 Climate Change 200:1The Scientific Basis. Contribution of Working Group I
to the Third Assessment Report of the Intergovernmental Panel on Climate Change,
Cambridge University Press, Cambridge
[2] Zeemann et al. 2010, Agricultural and Forest Meteorology, 150, 519-530
[3] Soussana et al., 2004, Soil Use Manage, 20 (2), 219-230
[4] L. Guo and R. Gifford, 2002, Global Change Biology, 8, 345-360
[5] Don et al. 2009, Journal of Plant Nutrition and Soil Science, 172, 53-62
[6] R. Clement http://www.geos.ed.ac.uk/abs/research/micromet/EdiRe
GRASSLAND: NOT ONLY A SOURCE FOR VOCS
Bamberger Ines1, Hörtnagl Lukas
2, Ruuskanen Taina
1,3, Schnitzhofer Ralf
1,4, Müller Markus
1,
Graus Martin1,5, 6
, Karl Thomas1,7
, Wohlfahrt Georg2, Hansel Armin
1
1 Institute for Ion Physic and Applied Physics, University of Innsbruck, Innsbruck, Austria
2 Institute of Ecology, University of Innsbruck, Innsbruck, Austria
3 Division of Atmospheric Sciences, Department of Physics, University of Helsinki,
Finland
4 Ionicon Analytik, Innsbruck, Austria
5Chemical Sciences Division, Earth System Research Laboratory, National Oceanic and
Atmospheric Administration, Boulder, USA
6Cooperative Institute for Research in Environmental Sciences, University of Colorado,
Boulder, USA
7NCAR Earth Systems Laboratory, National Center for Atmospheric Research, Boulder,
USA
Biogenic volatile organic compounds (BVOCs) are important precursors for secondary organic
aerosol (SOA) formation [1] and the production of tropospheric ozone [2]. Despite their
importance in atmospheric chemistry, sources and sinks of BVOCs are highly uncertain,
presenting a major challenge for improving climate models and predicting budgets of reactive
carbon.
Over a time period of two subsequent years, fluxes of several BVOCs were measured above an
intensively managed temperate mountain grassland in Stubai valley, Austria, using a proton-
transfer-reaction-mass-spectrometer (PTR-MS). In addition we deployed a proton-transfer-
reaction time-of-flight mass spectrometer (PTR-TOF) for measuring full range mass spectra for
several months. VOC fluxes were evaluated using the virtual disjunct eddy covariance (vDEC)
method [3] for PTR-MS data and the conventional eddy covariance (EC) method for 10 Hz PTR-
TOF data [4].
Measurements covered a time period when ambient volume mixing ratios of monoterpenes and
other terpenoids (sesquiterpenes, oxygenated terpenes) were significantly enhanced due to the
damage of the nearby coniferous forests by a severe hailstorm in 2009. During this time period
monoterpenes, sesquiterpenes and oxygenated terpenes were deposited to the grassland. On a
carbon basis the monoterpene uptake alone accumulated to levels comparable to emissions of
methanol, the most abundant non methane BVOC continuously emitted from the grassland [5].
The observations raise the question whether deposition processes of non-oxygenated VOCs to
vegetation play a more significant role in atmospheric chemistry than currently assumed and
whether they need to be incorporated into atmospheric VOC budgets.
[1] M. Hallquist, J. C. Wenger, U. Baltensperger, Y. Rudich, D. Simpson, M. Claeys, J.
Dommen, N. M. Donahue, C. George, A. H. Goldstein, J. F. Hamilton, H. Herrmann, T.
Hoffmann, Y. Iinuma, M. Jang, M. E. Jenkin, J. L. Jimenez, A. Kiendler-Scharr, W. Maenhaut,
G. McFiggans, Th. F. Mentel, A. Monod, A. S. H. Prévôt, J. H. Seinfeld, J. D. Surratt, R.
Szmigielski, and J. Wildt, 2009, Atmos. Chem. Phys., 9, 5155-5236.
[2] R. Atkinson, 2000, Atmos. Environ. 34, 2063-2101.
[3] T. G. Karl, C. Spirig, J. Rinne, C. Stroud, P. Prevost, J. Greenberg, R. Fall, and A. Guenther,
2002, Atmos. Chem. Phys., 2, 279-291.

[4] T. M. Ruuskanen, M. Müller, R. Schnitzhofer, T. Karl, M. Graus, I. Bamberger, L. Hörtnagl,
F. Brilli, G. Wohlfahrt, and A. Hansel, 2011, Atmos. Chem. Phys., 11, 611-625.
[5] I. Bamberger, L. Hörtnagl, R. Schnitzhofer, M. Graus, T.M. Ruuskanen, M Müller, J. Dunkl,
G. Wohlfahrt, and A. Hansel, 2010, Biogeosciences, 7, 1413-1424.
Fluxes of BVOC and tropospheric ozone from a Citrus orchard in the California
Central Valley
Silvano Fares1,2
, Jeong-Hoo Park2, Robin Weber
2, Drew Gentner
3,
John Karlik4, and Allen H. Goldstein
2,3
1
Agricultural Research Council (CRA), Research Centre for the Soil Plant System,
Rome, Italy. CNR (National Research Council) – Istituto di Biologia Agroambientale
e Forestale, Via Salaria km. 29,300, 00016 Monterotondo Scalo (Rome), Italy. 2 University of California, Berkeley, Division of Ecosystem Sciences, Department of
Environmental Science, Policy, and Management. 3
University of California, Berkeley, Department of Civil and Environmental
Engineering. 4 University of California Cooperative Extension.
Citrus plants, especially oranges, are widely cultivated in many countries experiencing
Mediterranean climates. In many of these areas, orchards are often exposed to high
levels of tropospheric ozone (O3) due to their location in polluted airsheds. Citrus take
up O3 through their stomata and emit biogenic volatile organic compounds (BVOC),
which can contribute to non-stomatal O3 removal through fast gas-phase reactions with
O3. The study was performed in a valencia orange orchard in Exeter, California. From
fall 2009 to winter 2010, CO2 & water fluxes, together with O3 uptake and BVOC
emissions were measured continuously in situ with specific sensors (e.g. fast ozone
analyzer and Proton Transfer Reaction Mass Spectrometer) using the eddy covariance
techniques. Vertical concentration gradients of these compounds were also measured at
4 heights from the orchard floor to above the canopy. We observed high levels (up to 60
ppb) of volatile organic compounds including methanol, isoprene, monoterpenes,
sesquiterpenes, and some additional oxygenated BVOC. Methanol dominated BVOC
emissions (up to 7 nmol m-2
s-1
) followed by acetone. Monoterpenes fluxes were also
recorded during the all vegetative period, with the highest emissions taking place during
flowering periods, and in general highly temperature dependent. The orchard represented
a sink for ozone, with uptake rates on the order of 10 nmol m-2
s-1
during the central hours
of the day. We found that BVOC played a major role in removing ozone through chemical
reactions in the gas-phase, while only up to 40 % of ozone was removed via stomatal
uptake. The current research aimed at investigating the fate of BVOC emitted from
orange trees will help understanding the role of Citrus orchards in the complex

oxidation mechanisms taking place in the polluted atmosphere of the San Joaquin
Valley (California).
EFFECTS OF LOCAL EMISSION SOURCES ON NEW PARTICLE FORMATION,
BASED ON A THREE –YEAR ANALYSIS, KUOPIO, FINLAND
AMAR HAMED (1), JORMA JOUTSENSAARI (1), HARRI PORTIN (2), ARI LESKINEN (2), MIKA
KOMPPULA (2), KARI LEHTINEN (1, 2), SAMI ROMAKKANIEMI (1), JAMES SMITH (1,3), ARI
LAAKSONEN (1,4)
(1) University of Eastern Finland, Kuopio, Finland
(2) Finnish Meteorological Institute, Kuopio Unit, Finland
(3) National Center for Atmospheric Research, Boulder, USA
(4) Finnish Meteorological Institute, Helsinki, Finland
Correspondence to: Amar.Hamed ([email protected])
The formation of new aerosol particles by atmospheric nucleation and growth is a global
phenomenon that has been shown to take place in a wide variety of high and low altitude
environments (Kulmala et al., 2004). However, the fundamental processes causing nucleation and
subsequent growth into the size-range of a few nanometers are still not well understood. The new
particles can grow through condensation and coagulation to sizes of 50 –100 nm where they can
become cloud condensation nuclei (CCN). Several recent studies (e.g. Laaksonen et el., 2005) and
modeling efforts (e.g. Pierce and Adams, 2007; Spracklen et al., 2010) have directly implicated that
atmospheric new particle formation (NPF) events are an important source of cloud condensation
nuclei (CCN). It is essential that NPF is sufficiently well understood since global climate models
require accurate prediction of this phenomenon in order to realistically capture aerosol radiative
effects. A comparison of sufficiently long atmospheric data sets in different environments is
expected to reveal useful information on how different sources and transformation processes modify
properties of aerosol particles.
Here, we study NPF observed at the Puijo tower research station. The station is on the top of the
Puijo observation tower; 62° 54 32 N, 27° 39 31 E, 306 m a.s.l and 224 m above the surrounding
lake and located about 2 km northwest of the center of Kuopio city, Eastern Finland. Details of the
station can be found in Leskinen et al. (2009).
The observations of aerosol nucleation at the Puijo research station analyzed here took place from
June 2006 to November 2009. The Puijo data set is unique in the sense that the surroundings of the
station are different in each side. There are distinct sectors for cleaner and more polluted air, which
give us a good opportunity to investigate the effects of local emission sources on aerosol particle
formation. Our analysis uses the measured particle number size distribution (measurements were
carried out using a twin DMPS system (Differential Mobility Particle Sizers) at the Puijo site, with
particle size ranges of 7-800 nm), trace gas concentrations (SO2 ,NOx,O3) and basic meteorological
variables (T, RH, P, wind speed and wind direction).
In the process of the NPF analysis from Puijo research station, the particle formation events were
identified and classified into three different categories according to the local emission sources;
Class 1 includes normal nucleation days (similar to what has been observed in different
environments) with very high number particle concentrations and clear growth of the newly formed
particles that last for many hours; Class 2 includes clean nucleation days (with relatively very low
growth rates and low concentrations of SO2 ); and Class 3 includes polluted nucleation days (with
high concentrations of SO2 when the wind comes from N, NE directions, see Fig. 1).
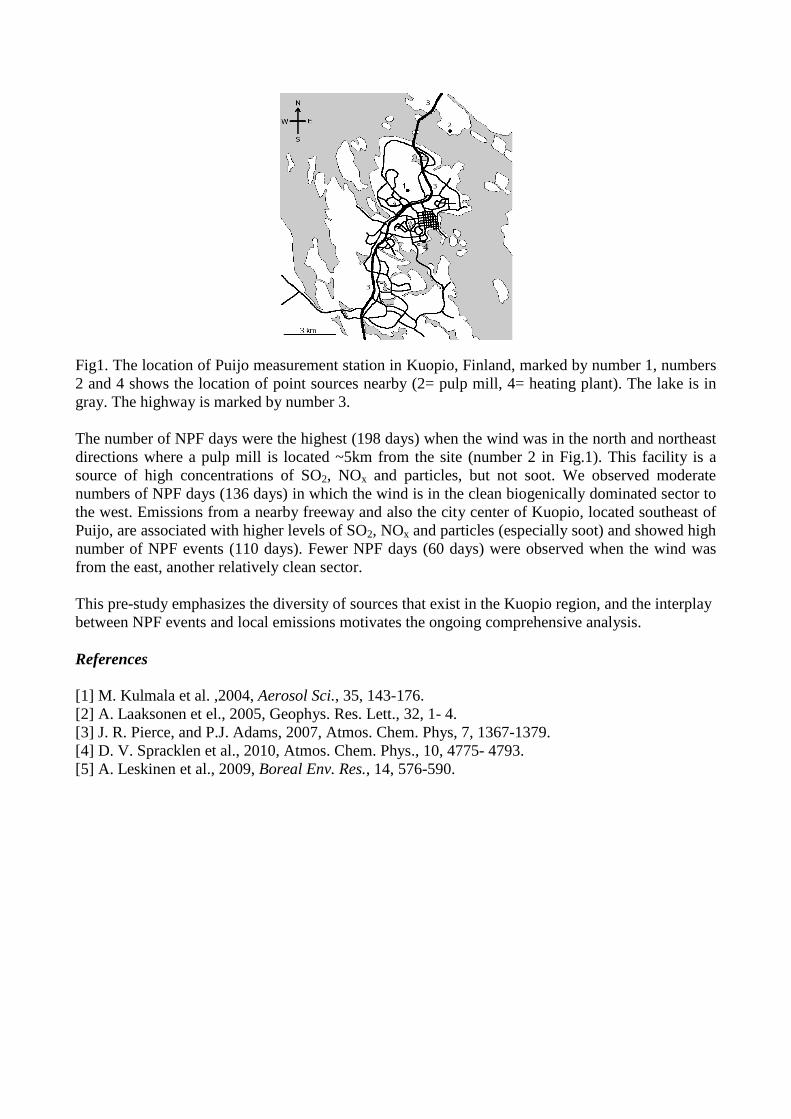
Fig1. The location of Puijo measurement station in Kuopio, Finland, marked by number 1, numbers
2 and 4 shows the location of point sources nearby (2= pulp mill, 4= heating plant). The lake is in
gray. The highway is marked by number 3.
The number of NPF days were the highest (198 days) when the wind was in the north and northeast
directions where a pulp mill is located ~5km from the site (number 2 in Fig.1). This facility is a
source of high concentrations of SO2, NOx and particles, but not soot. We observed moderate
numbers of NPF days (136 days) in which the wind is in the clean biogenically dominated sector to
the west. Emissions from a nearby freeway and also the city center of Kuopio, located southeast of
Puijo, are associated with higher levels of SO2, NOx and particles (especially soot) and showed high
number of NPF events (110 days). Fewer NPF days (60 days) were observed when the wind was
from the east, another relatively clean sector.
This pre-study emphasizes the diversity of sources that exist in the Kuopio region, and the interplay
between NPF events and local emissions motivates the ongoing comprehensive analysis.
References
[1] M. Kulmala et al. ,2004, Aerosol Sci., 35, 143-176.
[2] A. Laaksonen et el., 2005, Geophys. Res. Lett., 32, 1- 4.
[3] J. R. Pierce, and P.J. Adams, 2007, Atmos. Chem. Phys, 7, 1367-1379.
[4] D. V. Spracklen et al., 2010, Atmos. Chem. Phys., 10, 4775- 4793.
[5] A. Leskinen et al., 2009, Boreal Env. Res., 14, 576-590.
4
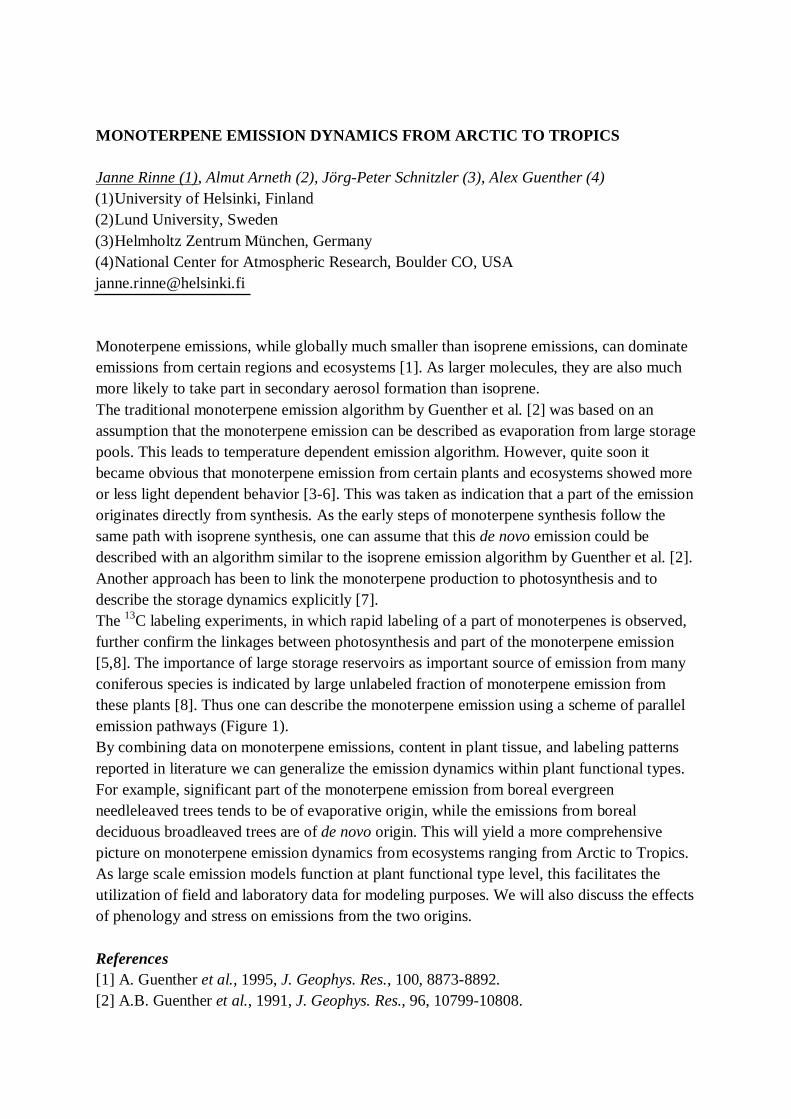
MONOTERPENE EMISSION DYNAMICS FROM ARCTIC TO TROPICS Janne Rinne (1), Almut Arneth (2), Jörg-Peter Schnitzler (3), Alex Guenther (4) (1) University of Helsinki, Finland (2) Lund University, Sweden (3) Helmholtz Zentrum München, Germany (4) National Center for Atmospheric Research, Boulder CO, USA [email protected] Monoterpene emissions, while globally much smaller than isoprene emissions, can dominate emissions from certain regions and ecosystems [1]. As larger molecules, they are also much more likely to take part in secondary aerosol formation than isoprene. The traditional monoterpene emission algorithm by Guenther et al. [2] was based on an assumption that the monoterpene emission can be described as evaporation from large storage pools. This leads to temperature dependent emission algorithm. However, quite soon it became obvious that monoterpene emission from certain plants and ecosystems showed more or less light dependent behavior [3-6]. This was taken as indication that a part of the emission originates directly from synthesis. As the early steps of monoterpene synthesis follow the same path with isoprene synthesis, one can assume that this de novo emission could be described with an algorithm similar to the isoprene emission algorithm by Guenther et al. [2]. Another approach has been to link the monoterpene production to photosynthesis and to describe the storage dynamics explicitly [7]. The 13C labeling experiments, in which rapid labeling of a part of monoterpenes is observed, further confirm the linkages between photosynthesis and part of the monoterpene emission [5,8]. The importance of large storage reservoirs as important source of emission from many coniferous species is indicated by large unlabeled fraction of monoterpene emission from these plants [8]. Thus one can describe the monoterpene emission using a scheme of parallel emission pathways (Figure 1). By combining data on monoterpene emissions, content in plant tissue, and labeling patterns reported in literature we can generalize the emission dynamics within plant functional types. For example, significant part of the monoterpene emission from boreal evergreen needleleaved trees tends to be of evaporative origin, while the emissions from boreal deciduous broadleaved trees are of de novo origin. This will yield a more comprehensive picture on monoterpene emission dynamics from ecosystems ranging from Arctic to Tropics. As large scale emission models function at plant functional type level, this facilitates the utilization of field and laboratory data for modeling purposes. We will also discuss the effects of phenology and stress on emissions from the two origins. References [1] A. Guenther et al., 1995, J. Geophys. Res., 100, 8873-8892. [2] A.B. Guenther et al., 1991, J. Geophys. Res., 96, 10799-10808.
[3] M. Staudt, and G. Seufert, G., 1995, Naturwissenschafen, 82, 89-92. [4] G. Schuh, et al., 1997, J. Atmos. Chem., 27, 291-318. [5] M. Shao et al., 2001, J. Geophys. Res., 106, 20483-20491. [6] H.J.I. Rinne et al., 2002, Atmos. Environ., 36, 2421-2426. [7] G. Schurgers et al., 2009, Atmos. Chem. Phys., 9, 3409–3423. [8] A. Ghirardo, et al., 2010, Plant Cell Environ., 33, 781-792.
Fig. 1: Schematic of the parallel emission pathways and their links to carbon uptake of the plant.

DEVELOPMENT AND APPLICATION OF A NOVEL FAST-RESPONSE
CONVERTER (TRANC) TO MEASURE TOTAL REACTIVE ATMOSPHERIC
NITROGEN
Christian Brümmer (1), Oliver Marx (2), Christof Ammann (3), Catharina Don (1), Werner
Leo Kutsch (1), Dirk Lempio (1), Veronika Wolff (3), Annette Freibauer (1)
(1) Johann Heinrich von Thünen-Institute, Braunschweig, Germany
(2) LI-COR Biosciences, Bad Homburg, Germany
(3) Swiss Federal Research Station Agroscope ART, Zürich, Switzerland
Concentration and flux measurements of reactive nitrogen species (Nr) from agriculture are
still challenging from a metrological point of view (e.g., von Bobrutzki et al., 2010). Well-
established measurement techniques (e.g., chemiluminescence detector (CLD), molybdenum
converter, denuder/impinger with ion chromatography analysis) are usually limited to single
compounds or provide concentration values and flux rates in poor time resolution and require
labour and cost-intensive lab analyses. We present a novel total reactive nitrogen converter
(TRANC: Total Reactive Atmospheric Nitrogen Converter), which, in combination with a
fast-response analyser, offers an opportunity to quantify the sum of all airborne Nr
compounds in high time resolution (Marx et al., 2006; Brümmer et al., 2011).
The basic concept of the TRANC is the full conversion of all Nr compounds in the sample air
to nitrogen monoxide (NO) within two reaction steps. Initially, reduced N compounds are
being oxidised, whereas oxidised N compounds are thermally converted to compounds of
lower oxidation states. Particulate N is being sublimated and oxidised or reduced afterwards.
In a second reaction step, remaining higher N oxides in the sample air or those originated in
the first reaction step are catalytically converted to NO. Carbon monoxide (CO) is used as
reduction gas.
Fig 1. Design of the converter, not true to scales.
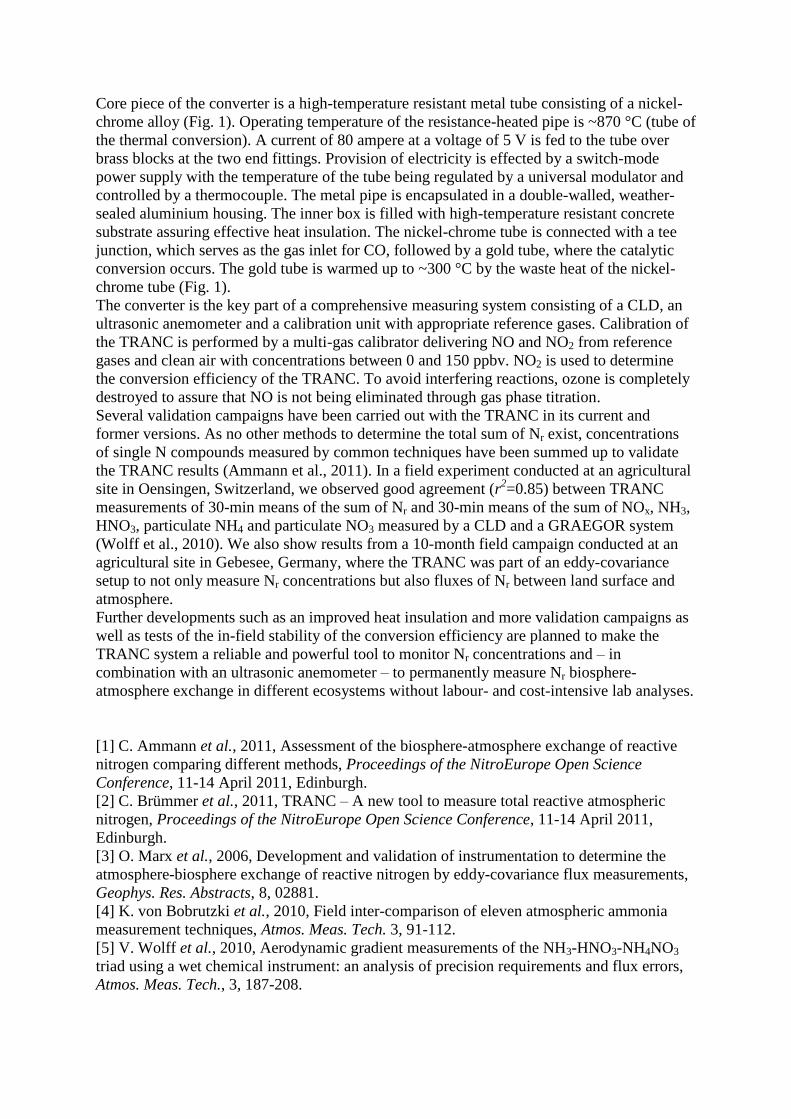
Core piece of the converter is a high-temperature resistant metal tube consisting of a nickel-
chrome alloy (Fig. 1). Operating temperature of the resistance-heated pipe is ~870 °C (tube of
the thermal conversion). A current of 80 ampere at a voltage of 5 V is fed to the tube over
brass blocks at the two end fittings. Provision of electricity is effected by a switch-mode
power supply with the temperature of the tube being regulated by a universal modulator and
controlled by a thermocouple. The metal pipe is encapsulated in a double-walled, weather-
sealed aluminium housing. The inner box is filled with high-temperature resistant concrete
substrate assuring effective heat insulation. The nickel-chrome tube is connected with a tee
junction, which serves as the gas inlet for CO, followed by a gold tube, where the catalytic
conversion occurs. The gold tube is warmed up to ~300 °C by the waste heat of the nickel-
chrome tube (Fig. 1).
The converter is the key part of a comprehensive measuring system consisting of a CLD, an
ultrasonic anemometer and a calibration unit with appropriate reference gases. Calibration of
the TRANC is performed by a multi-gas calibrator delivering NO and NO2 from reference
gases and clean air with concentrations between 0 and 150 ppbv. NO2 is used to determine
the conversion efficiency of the TRANC. To avoid interfering reactions, ozone is completely
destroyed to assure that NO is not being eliminated through gas phase titration.
Several validation campaigns have been carried out with the TRANC in its current and
former versions. As no other methods to determine the total sum of Nr exist, concentrations
of single N compounds measured by common techniques have been summed up to validate
the TRANC results (Ammann et al., 2011). In a field experiment conducted at an agricultural
site in Oensingen, Switzerland, we observed good agreement (r2=0.85) between TRANC
measurements of 30-min means of the sum of Nr and 30-min means of the sum of NOx, NH3,
HNO3, particulate NH4 and particulate NO3 measured by a CLD and a GRAEGOR system
(Wolff et al., 2010). We also show results from a 10-month field campaign conducted at an
agricultural site in Gebesee, Germany, where the TRANC was part of an eddy-covariance
setup to not only measure Nr concentrations but also fluxes of Nr between land surface and
atmosphere.
Further developments such as an improved heat insulation and more validation campaigns as
well as tests of the in-field stability of the conversion efficiency are planned to make the
TRANC system a reliable and powerful tool to monitor Nr concentrations and – in
combination with an ultrasonic anemometer – to permanently measure Nr biosphere-
atmosphere exchange in different ecosystems without labour- and cost-intensive lab analyses.
[1] C. Ammann et al., 2011, Assessment of the biosphere-atmosphere exchange of reactive
nitrogen comparing different methods, Proceedings of the NitroEurope Open Science
Conference, 11-14 April 2011, Edinburgh.
[2] C. Brümmer et al., 2011, TRANC – A new tool to measure total reactive atmospheric
nitrogen, Proceedings of the NitroEurope Open Science Conference, 11-14 April 2011,
Edinburgh.
[3] O. Marx et al., 2006, Development and validation of instrumentation to determine the
atmosphere-biosphere exchange of reactive nitrogen by eddy-covariance flux measurements,
Geophys. Res. Abstracts, 8, 02881.
[4] K. von Bobrutzki et al., 2010, Field inter-comparison of eleven atmospheric ammonia
measurement techniques, Atmos. Meas. Tech. 3, 91-112.
[5] V. Wolff et al., 2010, Aerodynamic gradient measurements of the NH3-HNO3-NH4NO3
triad using a wet chemical instrument: an analysis of precision requirements and flux errors,
Atmos. Meas. Tech., 3, 187-208.
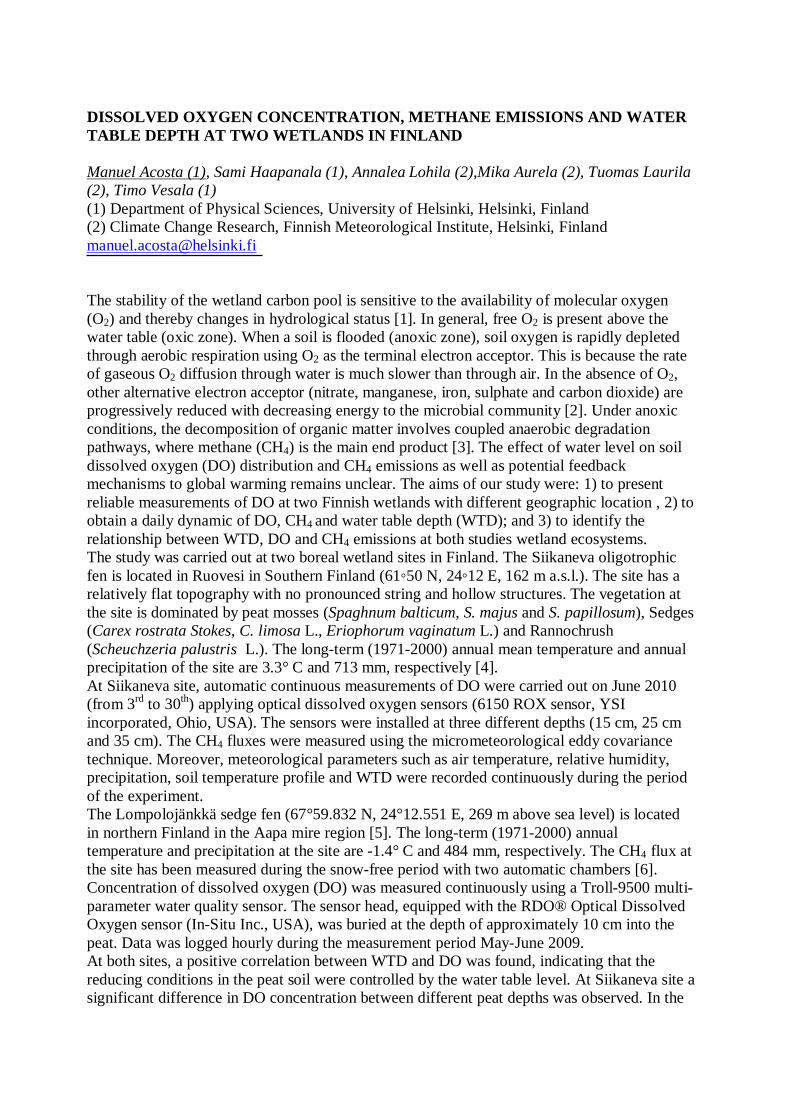
DISSOLVED OXYGEN CONCENTRATION, METHANE EMISSIONS AND WATER TABLE DEPTH AT TWO WETLANDS IN FINLAND Manuel Acosta (1), Sami Haapanala (1), Annalea Lohila (2),Mika Aurela (2), Tuomas Laurila (2), Timo Vesala (1) (1) Department of Physical Sciences, University of Helsinki, Helsinki, Finland (2) Climate Change Research, Finnish Meteorological Institute, Helsinki, Finland [email protected] The stability of the wetland carbon pool is sensitive to the availability of molecular oxygen (O2) and thereby changes in hydrological status [1]. In general, free O2 is present above the water table (oxic zone). When a soil is flooded (anoxic zone), soil oxygen is rapidly depleted through aerobic respiration using O2 as the terminal electron acceptor. This is because the rate of gaseous O2 diffusion through water is much slower than through air. In the absence of O2, other alternative electron acceptor (nitrate, manganese, iron, sulphate and carbon dioxide) are progressively reduced with decreasing energy to the microbial community [2]. Under anoxic conditions, the decomposition of organic matter involves coupled anaerobic degradation pathways, where methane (CH4) is the main end product [3]. The effect of water level on soil dissolved oxygen (DO) distribution and CH4 emissions as well as potential feedback mechanisms to global warming remains unclear. The aims of our study were: 1) to present reliable measurements of DO at two Finnish wetlands with different geographic location , 2) to obtain a daily dynamic of DO, CH4 and water table depth (WTD); and 3) to identify the relationship between WTD, DO and CH4 emissions at both studies wetland ecosystems. The study was carried out at two boreal wetland sites in Finland. The Siikaneva oligotrophic fen is located in Ruovesi in Southern Finland (61 50 N, 24 12 E, 162 m a.s.l.). The site has a relatively flat topography with no pronounced string and hollow structures. The vegetation at the site is dominated by peat mosses (Spaghnum balticum, S. majus and S. papillosum), Sedges (Carex rostrata Stokes, C. limosa L., Eriophorum vaginatum L.) and Rannochrush (Scheuchzeria palustris L.). The long-term (1971-2000) annual mean temperature and annual precipitation of the site are 3.3° C and 713 mm, respectively [4]. At Siikaneva site, automatic continuous measurements of DO were carried out on June 2010 (from 3rd to 30th) applying optical dissolved oxygen sensors (6150 ROX sensor, YSI incorporated, Ohio, USA). The sensors were installed at three different depths (15 cm, 25 cm and 35 cm). The CH4 fluxes were measured using the micrometeorological eddy covariance technique. Moreover, meteorological parameters such as air temperature, relative humidity, precipitation, soil temperature profile and WTD were recorded continuously during the period of the experiment. The Lompolojänkkä sedge fen (67°59.832 N, 24°12.551 E, 269 m above sea level) is located in northern Finland in the Aapa mire region [5]. The long-term (1971-2000) annual temperature and precipitation at the site are -1.4° C and 484 mm, respectively. The CH4 flux at the site has been measured during the snow-free period with two automatic chambers [6]. Concentration of dissolved oxygen (DO) was measured continuously using a Troll-9500 multi-parameter water quality sensor. The sensor head, equipped with the RDO® Optical Dissolved Oxygen sensor (In-Situ Inc., USA), was buried at the depth of approximately 10 cm into the peat. Data was logged hourly during the measurement period May-June 2009. At both sites, a positive correlation between WTD and DO was found, indicating that the reducing conditions in the peat soil were controlled by the water table level. At Siikaneva site a significant difference in DO concentration between different peat depths was observed. In the
surface layer (15cm) the diurnal dynamics in DO could be explained by the change in peat temperature. At lower depths, diurnal variation was not observed – conditions being anoxic with values close to 0.2 mg/L. Rain events were another factor influencing DO concentration in the surface layer, increase in DO was observed after rain events in the majority of the occasions. Emissions of CH4 were very stable during the experiment period and did not correlate with DO. However, occasionally a slight increase in CH4 flux was observed with increased WTD.
-16
-14
-12
-10
-8
-6
-4
-2
0
0
1
2
3
4
5
6
7
8
WTD
(cm
)
DO
(mg/
L), C
H4
(mg m
-2s-1
), ra
in (m
m)
DOY
rain DO Conc 15cm DO Conc 25cm DO Conc 35cm CH4 WTD
155 157 159 161 163 165 167 169 171 173 175 177 179
Fig 1. Daily courses of dissolved oxygen concentration (DO) at three different depth (15cm, 25cm and 35cm), methane emissions (CH4, daily averaged), rain events and water tale depth (WTD) at Siikaneva wetland site during the measurement period (from 3rd to 30th of June 2010). At Lompolojänkkä, the peat at the measurement depth stayed anoxic for most of the summer. However, in May during the flooding and in June after some rainy days, the DO concentration peaked right after a rise in WTD. This was likely due to the input of oxygen-rich water from precipitation and from the surface runoff water originating from the surrounding forest. In June 15, lowered methane flux was observed for a short time at the same time with the rise in WTD and the first, smaller increase in DO concentration. Our wetland ecosystems exhibit a complex interaction between DO and WTD that is important in the understanding of CH4 emissions. References [1] E.G. Jobbagy and R.B. Jackson, 2000, Ecological Applications 10 (2): 423–436. [2] L.J. Puckett and T.K. Cowdery, 2002, Journal of Environmental Quality 31 (3): 782–796. [3] J. Le Mer and P. Roger, 2001, European Journal of Soil Science 37: 25–50. [4] J. Rinne et al., 2007, Tellus 59B: 449–457. [5] M. Aurela et al., 2009, Boreal Environment Research 14, 699–710. [6] A. Lohila, et al., European Journal of Soil Science 61, 651–661.

UNCERTAINTY IN EDDY COVARIANCE CARBON FLUXES DUE TO DATA POST
PROCESSING OPTIONS
Trotta Carlo(1), Papale D.(1)
(1) Department of Forest Environment and Resources (DISAFRI), University of Tuscia, 01100
Viterbo, Italy
[email protected], [email protected]
Ecosystem carbon cycle is a key biogeosciences topic ([1]; [2]) that requires to be fully understood the assessment of carbon dioxide fluxes between ecosystems and atmosphere at hourly, daily, seasonal and yearly time scales and across spatial scale from leaves to individual plants and canopies. [3]. One of the most diffused and accepted methods to quantify the Net Ecosystem carbon Exchange (NEE) is the eddy covariance (EC). This technique counts at least three factors for its popularity: (i) it provides net CO2 exchanges estimates at ecosystem scale; (ii) produces a direct measure of NEE across the canopy-atmosphere interface; (iii) the technique is capable of measuring NEE across a spectrum of times scales, ranging from hours to years ([4]; [5]) [3]. Globally, more than 500 eddy covariance sites are active and initiatives like FLUXNET organize synthesis activities where data are collected and processed using standardized methods. This standard processing includes for example general QAQC, storage correction, spike detection and filtering for low turbulence conditions ([6]) where data affected by potential errors or acquired under not ideal conditions are excluded. This filtering activity introduces gaps in the time series and since to calculate annual budgets complete time series are needed it is necessary to apply a gap filling technique to estimate missing data. Finally, since the NEE is the difference between Gross Primary Production (GPP) and Ecosystem Respiratio (Reco) n it is possible to apply “flux partitioning algorithms” to estimate these two quantities starting from NEE. Different methods and techniques and parameterizations exist to filter the data ([6], [7], Barr et al in prep.), fill the gaps ([8]) and partition NEE in GPP and Reco ([7], [9], [10]) that could give slightly to substantially different results that should be considered as processing uncertainty when the data are used or interpreted. In this work we present the results of the post processing uncertainty analysis and estimation in a number of EC sites with contrasting climate and Plant Functional Type. Reference [1] Running SW, Baldocchi DD, Turner D et al., 1999, A global terrestrial monitoring network, scaling tower fluxes with ecosystem modeling and EOS satellite data. Remote Sensing Environment, 70, 108-127. [2] Geider RJ, Delucia EH, Falkowski PG et al., 2001, Primary productivity of planet earth: biological determinants and physical constraints in terrestrial and aquatic habitats. Global Change Biology, 7, 849-882 [3] Baldocchi, D. D. 2003. Assessing the eddy covariance technique for evaluating carbon dioxide exchange rates of ecosystems: past, present and future. Global Change Biology 9:479-492.

[4] Wofsy SC, Goulden ML, Munger JW et al., 1993, Net exchange of CO2 in mid-latitude forest. Science, 260, 1314-1317. [5] Baldocchi DD, Falge E., Gu L., et al., 2001a, FLUXNET: new tool to study the temporal and spatial variability of ecosystem scale carbon dioxide, water vapour and energy flux densities. Bulletin of the American Meteorology Society, 82, 2415-2434. [6] Papale D., Reichstein M., Aubinet M., Canfora E., Bernhofer C., Longdoz B., Kutsch W., Rambal S., Valentini R., Vesala T., Yakir D. (2006). Towards a standardized processing of Net Ecosystem Exchange measured with eddy covariance technique: algorithms and uncertainty estimation. Biogeosciences, 3, 571-583. [7] Reichstein M., Falge E., Baldocchi D., Papale D., Aubinet M., Berbigier P., Bernhofer C., Buchmann N., Gilmanov T., Granier A., Grünwald T., Havrankova K., Ilvesniemi H., Janous D., Knohl A., Laurila T., Lohila A., Loustau D., Matteucci G., Meyers T., Miglietta F., Ourcival JM., Pumpanen J., Rambal S., Rotenberg E., Sanz M., Tenhunen J., Seufert G., Vaccari F., Vesala T., Yakir D., Valentini R. (2005). On separation of net ecosystem exchange into assimilation and ecosystem respiration: review and improved algorithm. Global Change Biology, 11, 1424-1439. [8] Moffat AM., Papale D., Reichstein M., Hollinger DY., Richardson AD., Barr AG., Beckstein C., Braswell BH., Churkina G., Desai AR., Falge E., Gove JH., Heimann M., Hui D., Jarvis AJ., Kattge J., Noorments A., Stauch VJ. (2007) Comprehensive comparison of gap-filling techniques for eddy covariance net carbon fluxes. Agricultural and Forest Meteorology, 147, 209-232. [9] Lasslop G., Reichstein M., et al., 2010, Separation of net ecosystem exchange into assimilation and respiration using a light response curve approach: critical issues and global evaluation. Global Change Biology, 16, 187-208 [10] van Gorsel et al., 2007, Nocturnal carbon efflux: reconciliation of eddy covariance and chamber measurements using an alternative to the u*-threshold filtering technique. Tellus, 59B, 397-403.
FROM MODELS TO THE REAL WORLD: A FIELD-SCALE TEST
Tom Denmead1,2, Ben Macdonald1, Enli Wang1, Hongtao Xing1,3, Deli Chen2 and Debra Turner2
(1) CSIRO Land and Water, GPO Box 1666, Canberra, ACT, 2601, Australia (2) School of Land and Environment, University of Melbourne, Victoria 3010, Australia (3) Institute of Geographical Sciences and Natural Resources Research, Chinese Academy of Sciences, A11 Datun Road Anwai, Beijing, 100101, China [email protected]
There are now many models of carbon and nitrogen cycling in soils and cropping systems such as the well-known DNDC and DAYCENT models. But modelling is not enough. We must be able to quantify the relevant fluxes of gas and water in the field environment with reliable measurements in the first place; then use our measurement skills to both validate models of the way systems work, test mitigation measures, and improve greenhouse gas inventories. This paper describes a first step towards these ends: a comprehensive measurement system to establish the magnitudes and time courses of emissions of carbon and nitrogen gases and evaporation from a bare soil after application of urea fertilizer and a preliminary comparison of the field results with the outputs of various models including two Australian models APSIM (an Australian Agricultural Production Systems Model) and WNMM (a University of Melbourne Water and Nitrogen Management Model). The experimental field had been used prior to the test to produce a wheat crop and the stubble was incorporated in the soil before the test commenced. The field remained bare for the 2 months of the test. Gas fluxes in the field were measured with a micrometeorological mass balance technique and some supporting measurements of background fluxes were made with static chambers. Urea was applied to a circular plot of 50 m diameter at a rate of 200 kg N ha-1 and incorporated in the top 10 cm of soil at the commencement of the test. Gas concentrations, wind speeds, soil temperatures soil moisture contents, evaporation and CO2 exchange rates at the centre of the plot were measured continuously as 30-min means for 2 months at the centre of the plot. The mass balance technique equates the rate of gas emission from the surface with the net horizontal gas flux across the plot centre. The net horizontal flux was calculated as the integral of the horizontal fluxes (the products of wind speed and concentration, less background concentration, at 5 levels up to 4.8 m). Concentrations of CO2, CH4, N2O, CO and H2O were measured with closed-path FTIR spectroscopy and those of NH3 and NOx with a chemiluminescence gas analyser. Exchanges of CO2 and water vapour were measured by eddy covariance. Profiles of temperature, moisture content, gas concentration and mineral N content in the soil were measured to a depth of 0.8 m. Urea treated with 15N was applied to a small plot in order to estimate the total gaseous N loss. Analysis of the field results and modelling are in hand at the time of submission of this Abstract and will be presented at the Conference
EDDY-COVARIANCE FLUX MEASUREMENT OVER COMPLEX TERRAIN WITH WEIGHT-SHIFT MICROLIGHT AIRCRAFT Stefan Metzger (1, 2), Wolfgang Junkermann (1), Matthias Mauder (1), Klaus Butterbach-Bahl (1), Baltasar Trancon y Widemann (3), Sebastian Wienicke (1), Hans Peter Schmid (1) and Thomas Foken (4) (1) Karlsruhe Institute of Technology, IMK-IFU, Garmisch-Partenkirchen, Germany (2) Chinese Academy of Sciences, IAP-LAPC, Beijing, China (3) University of Bayreuth, Chair of Ecological Modeling, Bayreuth, Germany (4) University of Bayreuth, Department of Micrometeorology, Bayreuth, Germany [email protected] The eddy covariance (EC) method is based on the Reynolds decomposition of relevant terms in the Navier-Stokes equation. The inherent assumptions are steady state conditions and horizontal homogeneity. For this reason the applicability of ground based EC flux measurements over heterogeneous land cover is object of extensive investigation. To a lesser degree ground based or even airborne EC measurements over topographically complex terrain are pursued. The objective of this study is to investigate the possibility of meaningful EC flux determination from airborne measurements over terrain with complex land cover and topography. The airborne measurement should take place at a low and constant altitude above ground. This is to keep the vertical flux divergence small and to avoid artificial flux contributions through altitude fluctuations along vertical gradients. Thus the aircraft preferably possesses a high ratio of climb rate to true airspeed, so as to be able to follow topographical contours. Only a few airborne platforms fulfil this requirement, with the weight-shift microlight aircraft (WSMA) being one of them. Due to its unique transportability and little infrastructural demand, the WSMA furthermore enables airborne measurements in remote settings at reasonable cost. Hence a WSMA was outfitted as comprehensive environmental research aircraft and thoroughly calibrated [4, 5]. In the framework of the DFG research group 536 MAGIM, EC flux measurements were performed from 23 June to 4 August 2009 at 50 m over the steppe of the Mongolian Plateau. The hilly investigation area south of the provincial capital Xilinhot, Inner Mongolia, China (43.6° N, 116.7° E, 1000 - 1400 m a.s.l.) is mainly covered by semi-arid grassland (73 %) and a dune belt (10 %), interspersed by agriculture, bare soil, marshland and mountain meadow. In place of Reynolds decomposed EC, the fluxes of sensible heat, water vapour and CO2 are inferred from the wavelet cross-scalogram, where the steady state and homogeneity assumptions can be relaxed to some extent [3]. Moreover this allows a high spatial discretization of the fluxes without increasing the systematic error. For each overflown 90 x 90 m cell of a land cover map the fluxes are integrated from the cross-scalogram, resulting in >400 flux estimates per flight pattern. Footprint modelling [2] is then used to determine the relative land cover contributions to each flux estimate (Figure 1). From here the flux estimates can be functionally related to land cover characteristics, reflecting the effects of vegetation, climate, soil and topography on the flux magnitude: land cover specific fluxes (Table 1) are computed as the regression coefficients of a linear model between flux estimates and their relative land cover contributions [1]. Throughout 35 flights the regressions explain 92 % and 93 % of the variability (median R2) in the sensible and latent heat fluxes, with an F-statistic median p-value of 10-24 and 10-23, respectively.
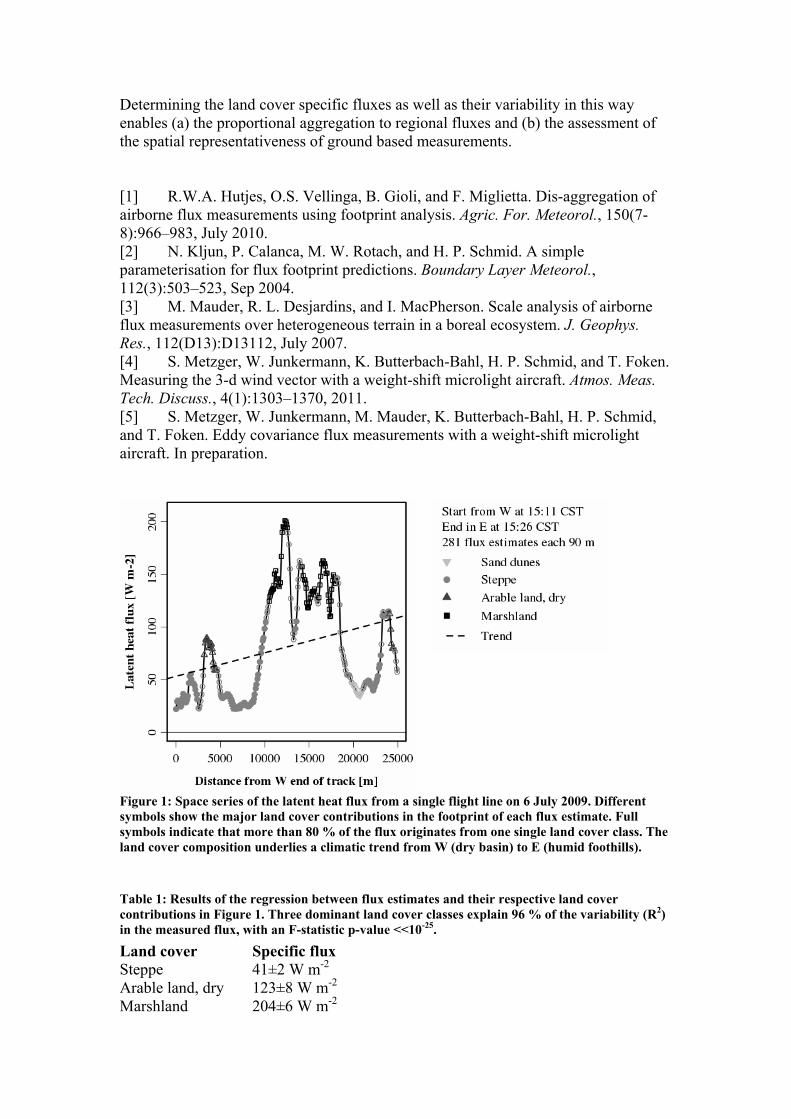
Determining the land cover specific fluxes as well as their variability in this way enables (a) the proportional aggregation to regional fluxes and (b) the assessment of the spatial representativeness of ground based measurements. [1] R.W.A. Hutjes, O.S. Vellinga, B. Gioli, and F. Miglietta. Dis-aggregation of airborne flux measurements using footprint analysis. Agric. For. Meteorol., 150(7-8):966–983, July 2010. [2] N. Kljun, P. Calanca, M. W. Rotach, and H. P. Schmid. A simple parameterisation for flux footprint predictions. Boundary Layer Meteorol., 112(3):503–523, Sep 2004. [3] M. Mauder, R. L. Desjardins, and I. MacPherson. Scale analysis of airborne flux measurements over heterogeneous terrain in a boreal ecosystem. J. Geophys. Res., 112(D13):D13112, July 2007. [4] S. Metzger, W. Junkermann, K. Butterbach-Bahl, H. P. Schmid, and T. Foken. Measuring the 3-d wind vector with a weight-shift microlight aircraft. Atmos. Meas. Tech. Discuss., 4(1):1303–1370, 2011. [5] S. Metzger, W. Junkermann, M. Mauder, K. Butterbach-Bahl, H. P. Schmid, and T. Foken. Eddy covariance flux measurements with a weight-shift microlight aircraft. In preparation.
Figure 1: Space series of the latent heat flux from a single flight line on 6 July 2009. Different symbols show the major land cover contributions in the footprint of each flux estimate. Full symbols indicate that more than 80 % of the flux originates from one single land cover class. The land cover composition underlies a climatic trend from W (dry basin) to E (humid foothills). Table 1: Results of the regression between flux estimates and their respective land cover contributions in Figure 1. Three dominant land cover classes explain 96 % of the variability (R2) in the measured flux, with an F-statistic p-value <<10-25.
Land cover Specific flux Steppe 41±2 W m-2 Arable land, dry 123±8 W m-2 Marshland 204±6 W m-2
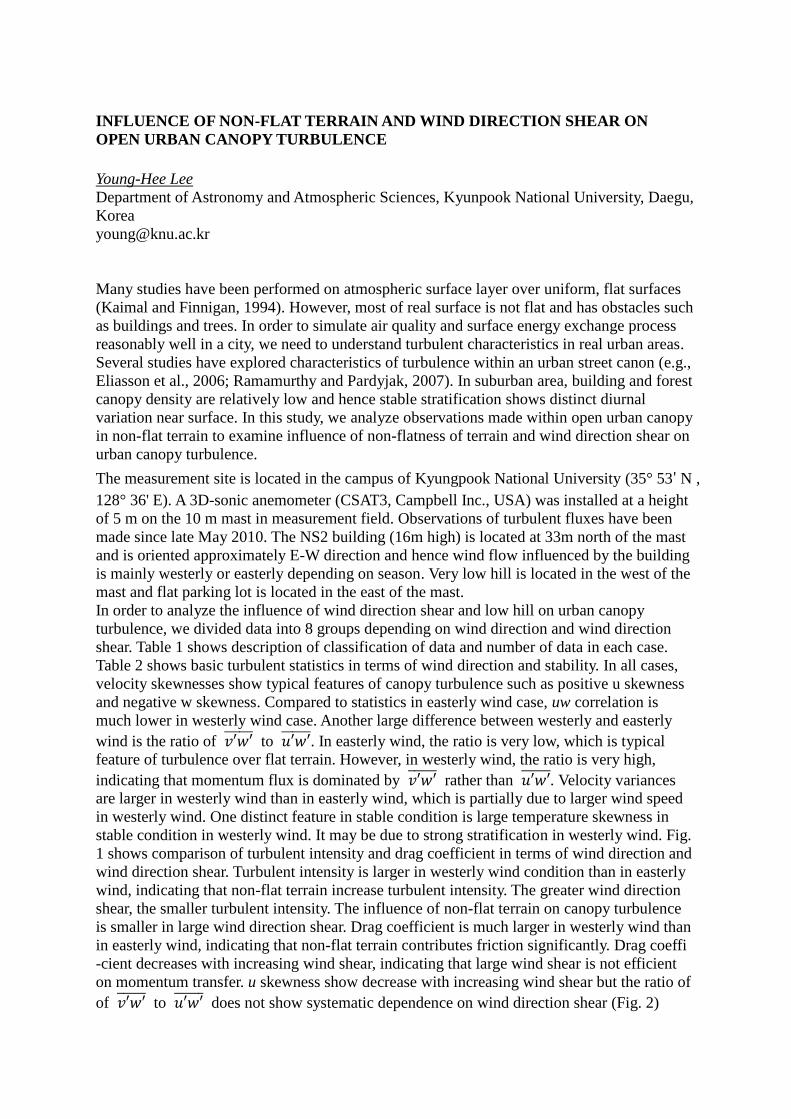
INFLUENCE OF NON-FLAT TERRAIN AND WIND DIRECTION SHEAR ON
OPEN URBAN CANOPY TURBULENCE
Young-Hee Lee
Department of Astronomy and Atmospheric Sciences, Kyunpook National University, Daegu,
Korea
Many studies have been performed on atmospheric surface layer over uniform, flat surfaces
(Kaimal and Finnigan, 1994). However, most of real surface is not flat and has obstacles such
as buildings and trees. In order to simulate air quality and surface energy exchange process
reasonably well in a city, we need to understand turbulent characteristics in real urban areas.
Several studies have explored characteristics of turbulence within an urban street canon (e.g.,
Eliasson et al., 2006; Ramamurthy and Pardyjak, 2007). In suburban area, building and forest
canopy density are relatively low and hence stable stratification shows distinct diurnal
variation near surface. In this study, we analyze observations made within open urban canopy
in non-flat terrain to examine influence of non-flatness of terrain and wind direction shear on
urban canopy turbulence.
The measurement site is located in the campus of Kyungpook National University (35° 53' N ,
128° 36' E). A 3D-sonic anemometer (CSAT3, Campbell Inc., USA) was installed at a height
of 5 m on the 10 m mast in measurement field. Observations of turbulent fluxes have been
made since late May 2010. The NS2 building (16m high) is located at 33m north of the mast
and is oriented approximately E-W direction and hence wind flow influenced by the building
is mainly westerly or easterly depending on season. Very low hill is located in the west of the
mast and flat parking lot is located in the east of the mast.
In order to analyze the influence of wind direction shear and low hill on urban canopy
turbulence, we divided data into 8 groups depending on wind direction and wind direction
shear. Table 1 shows description of classification of data and number of data in each case.
Table 2 shows basic turbulent statistics in terms of wind direction and stability. In all cases,
velocity skewnesses show typical features of canopy turbulence such as positive u skewness
and negative w skewness. Compared to statistics in easterly wind case, uw correlation is
much lower in westerly wind case. Another large difference between westerly and easterly
wind is the ratio of to . In easterly wind, the ratio is very low, which is typical
feature of turbulence over flat terrain. However, in westerly wind, the ratio is very high,
indicating that momentum flux is dominated by rather than . Velocity variances
are larger in westerly wind than in easterly wind, which is partially due to larger wind speed
in westerly wind. One distinct feature in stable condition is large temperature skewness in
stable condition in westerly wind. It may be due to strong stratification in westerly wind. Fig.
1 shows comparison of turbulent intensity and drag coefficient in terms of wind direction and
wind direction shear. Turbulent intensity is larger in westerly wind condition than in easterly
wind, indicating that non-flat terrain increase turbulent intensity. The greater wind direction
shear, the smaller turbulent intensity. The influence of non-flat terrain on canopy turbulence
is smaller in large wind direction shear. Drag coefficient is much larger in westerly wind than
in easterly wind, indicating that non-flat terrain contributes friction significantly. Drag coeffi
-cient decreases with increasing wind shear, indicating that large wind shear is not efficient
on momentum transfer. u skewness show decrease with increasing wind shear but the ratio of
of to does not show systematic dependence on wind direction shear (Fig. 2)
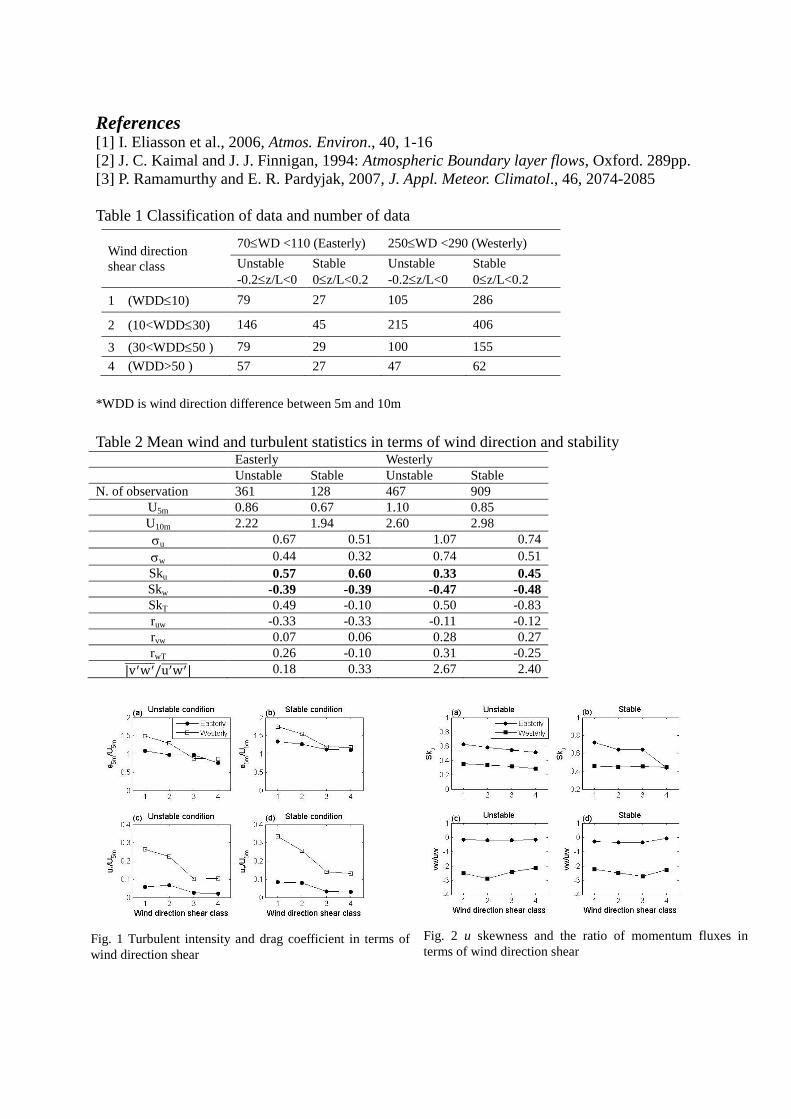
References [1] I. Eliasson et al., 2006, Atmos. Environ., 40, 1-16
[2] J. C. Kaimal and J. J. Finnigan, 1994: Atmospheric Boundary layer flows, Oxford. 289pp.
[3] P. Ramamurthy and E. R. Pardyjak, 2007, J. Appl. Meteor. Climatol., 46, 2074-2085
Table 1 Classification of data and number of data
*WDD is wind direction difference between 5m and 10m
Table 2 Mean wind and turbulent statistics in terms of wind direction and stability Easterly Westerly
Unstable Stable Unstable Stable
N. of observation 361 128 467 909
U5m 0.86 0.67 1.10 0.85
U10m 2.22 1.94 2.60 2.98
u 0.67 0.51 1.07 0.74
w 0.44 0.32 0.74 0.51
Sku 0.57 0.60 0.33 0.45
Skw -0.39 -0.39 -0.47 -0.48
SkT 0.49 -0.10 0.50 -0.83
ruw -0.33 -0.33 -0.11 -0.12
rvw 0.07 0.06 0.28 0.27
rwT 0.26 -0.10 0.31 -0.25
0.18 0.33 2.67 2.40
Wind direction
shear class
70WD <110 (Easterly) 250WD <290 (Westerly)
Unstable
-0.2z/L<0
Stable
0z/L<0.2
Unstable
-0.2z/L<0
Stable
0z/L<0.2
1 (WDD10) 79 27 105 286
2 (10<WDD30) 146 45 215 406
3 (30<WDD50 ) 79 29 100 155
4 (WDD>50 ) 57 27 47 62
Fig. 1 Turbulent intensity and drag coefficient in terms of
wind direction shear
Fig. 2 u skewness and the ratio of momentum fluxes in
terms of wind direction shear
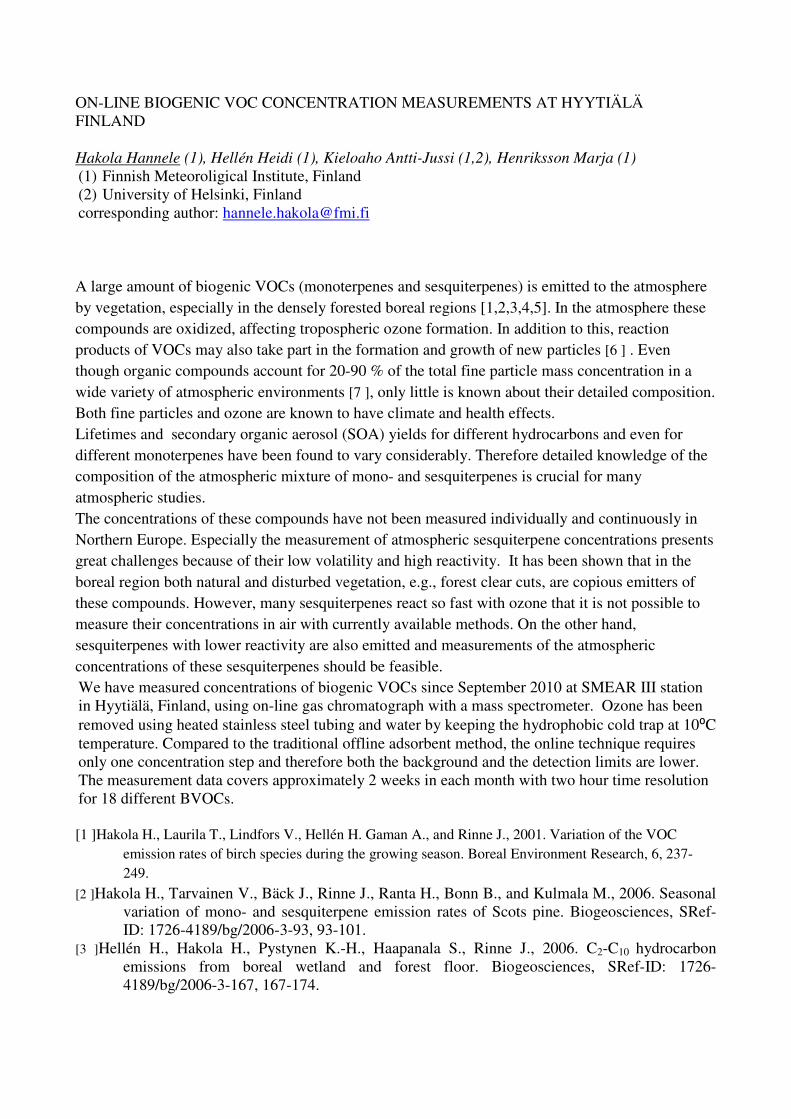
ON-LINE BIOGENIC VOC CONCENTRATION MEASUREMENTS AT HYYTIÄLÄ FINLAND Hakola Hannele (1), Hellén Heidi (1), Kieloaho Antti-Jussi (1,2), Henriksson Marja (1)
(1) Finnish Meteoroligical Institute, Finland (2) University of Helsinki, Finland corresponding author: [email protected] A large amount of biogenic VOCs (monoterpenes and sesquiterpenes) is emitted to the atmosphere
by vegetation, especially in the densely forested boreal regions [1,2,3,4,5]. In the atmosphere these
compounds are oxidized, affecting tropospheric ozone formation. In addition to this, reaction
products of VOCs may also take part in the formation and growth of new particles [6 ] . Even
though organic compounds account for 20-90 % of the total fine particle mass concentration in a
wide variety of atmospheric environments [7 ], only little is known about their detailed composition.
Both fine particles and ozone are known to have climate and health effects.
Lifetimes and secondary organic aerosol (SOA) yields for different hydrocarbons and even for
different monoterpenes have been found to vary considerably. Therefore detailed knowledge of the
composition of the atmospheric mixture of mono- and sesquiterpenes is crucial for many
atmospheric studies.
The concentrations of these compounds have not been measured individually and continuously in
Northern Europe. Especially the measurement of atmospheric sesquiterpene concentrations presents
great challenges because of their low volatility and high reactivity. It has been shown that in the
boreal region both natural and disturbed vegetation, e.g., forest clear cuts, are copious emitters of
these compounds. However, many sesquiterpenes react so fast with ozone that it is not possible to
measure their concentrations in air with currently available methods. On the other hand,
sesquiterpenes with lower reactivity are also emitted and measurements of the atmospheric
concentrations of these sesquiterpenes should be feasible. We have measured concentrations of biogenic VOCs since September 2010 at SMEAR III station in Hyytiälä, Finland, using on-line gas chromatograph with a mass spectrometer. Ozone has been removed using heated stainless steel tubing and water by keeping the hydrophobic cold trap at 10⁰C temperature. Compared to the traditional offline adsorbent method, the online technique requires only one concentration step and therefore both the background and the detection limits are lower. The measurement data covers approximately 2 weeks in each month with two hour time resolution for 18 different BVOCs. [1 ]Hakola H., Laurila T., Lindfors V., Hellén H. Gaman A., and Rinne J., 2001. Variation of the VOC
emission rates of birch species during the growing season. Boreal Environment Research, 6, 237-
249.
[2 ]Hakola H., Tarvainen V., Bäck J., Rinne J., Ranta H., Bonn B., and Kulmala M., 2006. Seasonal variation of mono- and sesquiterpene emission rates of Scots pine. Biogeosciences, SRef-ID: 1726-4189/bg/2006-3-93, 93-101.
[3 ]Hellén H., Hakola H., Pystynen K.-H., Haapanala S., Rinne J., 2006. C2-C10 hydrocarbon emissions from boreal wetland and forest floor. Biogeosciences, SRef-ID: 1726-4189/bg/2006-3-167, 167-174.

[4 ]Wiedinmyer, C., Guenther, A., Harley, P., Hewitt, N., Geron, C., Artaxo, P., Steinbrecher, R., and
Rasmussen, R., 2004. Global organic emissions from vegetation. In: Emissions of atmospheric trace
compounds, Granier, C. et al. (eds), Kluwer Academic Publishers, Dordrecht, 115-170.
[5 ]Steiner, A. H. and Goldstein, A. L., 2007. Biogenic VOCs. In: Volatile organic compounds in the atmosphere, Koppmann, R. (Ed.), Blackwell Publishing Ltd, Oxford, 82-128.
[6 ] Tunved P., Hansson H.-C., Kerminen V.-M., Ström J., Dal Maso M., Lihavainen H., Viisanen Y., Aalto
P.P., Komppula M., and Kulmala M., 2006. High natural aerosol loading over boreal forests. Science
312, 261-263.
[7 ] Kanakidou M., Seinfeld J.H., Pandis S. N., Barnes I., Dentener F. J., Facchini M.C., Van Dingenen R., Ervens B., Nenes A., Nielsen C. J., Swietlicki E., Putaud J.P., Balkanski Y., Fuzzi S., Horth J., Mootgat G.K., Winterhalter R., Myhre C. E. L., Tsigaridis K., Vignati E., Stephanou E. G., Wilson J, Organic aerosol and global climate modelling: a review. Atmos. Chem. Phys. 2005, 5, 1053-1123
MONOTERPENE FLUXES ABOVE A WIND-THROW DISTURBED UPLAND SPRUCE FOREST ECOSYSTEM Benjamin Wolpert, Rainer Steinbrecher, Matthias Lindauer, Hans Peter Schmid Karlsruhe Institute of Technology (KIT), Institute of Meteorology and Climate Research (IMK-IFU), Garmisch-Partenkirchen, Germany [email protected] The high chemical reactivity of monoterpenes emitted from vegetation lead to a significant effect on atmospheric air chemistry and physics. These reactive biogenic hydrocarbons participate in the formation of ozone and secondary organic aerosols and alter the oxidation capacity of the atmosphere. They play a fundamental role as messenger substances in plant-plant and plant-insect interaction. Therefore, accurate knowledge of the emission of these trace gases in the atmosphere is important for assessing chemical and physical processes in the atmosphere. Almost 50% of Europe is covered by forests, which are known to be strong emitters of reactive hydrocarbons. Disturbances of woodland can strongly change the emission characteristics of biogenic volatile compounds. Dominant perturbations for this ecosystem type are storms, responsible for more than half of the total damage in the years 1950 - 2000. In January 2007, cyclone Kyrill caused large-scale windfall damage in the upper part of the National Park Šumava/Bavarian Forest (Czech Republic/Germany) which is the largest contiguous forest area in central Europe. A non-cleared windthrow of Norway spruce (Picea abies L. Karst.) of more than 300000 m2 was selected to investigate the monoterpene long- term emission behavior on ecosystem scale. Fluxes were determined by two tower based micrometeorological measurement approaches: (1) the modified Bowen ratio (MBR) technique, where the vertical flux of monoterpenes is calculated from the vertical gradient of the mean concentration of monoterpenes and the turbulent transfer coefficient derived from concentration differences of water, CO2 and temperature over the same height interval and corresponding fluxes measured by the eddy correlation technique, (2) the surface layer gradient (SLG) technique, where the transfer coefficient is derived from atmospheric stability functions, calculated from the Monin-Obukhov similarity theory. The observed monoterpene fluxes were dominated by - and - pinene, with emissions up to 0.5 nmol m-2 s-1.The results from the two different micrometeorological approaches are in good agreement

UNCERTAINTY IN EDDY COVARIANCE FLUX ESTIMATES OF CO2 AND
ENERGY, RELATED TO RAW DATA PROCESSING
Gerardo Fratini (1), Carlo Trotta (2), Dario Papale (2)
(1) LI-COR Biosciences GmbH, Germany
(2) University of Tuscia, Italy
The Eddy Covariance (EC) method is the only direct, defensible way to measure turbulent fluxes
within the atmospheric boundary layer at ecosystem scale. However, the knowledge of errors and
uncertainties related to CO2 and energy flux estimates by EC is an outstanding issue still to be
solved. Among the sources of such uncertainties, the one deriving from the raw data processing
has been rarely addressed, though suspected to be crucial. Estimating fluxes from raw wind,
temperature and gas concentration data with the EC method implies a remarkably long sequence
of operations, including calibrations, corrections, unit conversions and statistical screening for
QA/QC. The correct application, order and sometimes meaning and consequences of many EC
processing steps are still topics under discussion. Usually, information about the processing
schemes applied is not available when EC data are collected from central repositories like
regional and FLUXNET databases. However, different data treatments may largely affect the
consistency and inter-comparability of flux data and should be considered for a confident use of
eddy fluxes on the regional, continental and global scale synthesis studies.
By analyzing data from three different EC setups we individuated the most critical processing
steps, those that determine the largest uncertainty in resulting fluxes, when different options are
used. Such processing steps are different for open and closed path systems and for different
fluxes, while they depend less on the ecosystem considered. The detrending method and the
choice of the flux averaging period are deemed important in all cases. In addition, the choice of
the spectral correction scheme and the time-lag compensation method critically affect closed
path results, while the coordinate rotation method and the angle-of-attack correction gain
importance for open path systems.
Here we limit attention to these most critical processing steps and perform a full-factorial, multi-
site analysis on 20 site-years of raw data, to investigate the combined effects of individual
sources of deviation. The aim is to assess the confidence level expected for gas and energy fluxes
measured with open and closed path EC systems. We analyze random and systematic uncertainty
components and how they propagate throughout the processing. The final aim is to develop a
simple procedure to attach a confidence level to EC flux estimates that next-generation databases
could accommodate.
EDDYUH - AN ADVANCED SOFTWARE FOR EDDY COVARIANCE POST-PROCESSING
Ivan Mammarella, Olli Peltola, Annika Nordbo, llar Rannik, Timo Vesala University of Helsinki, Finland [email protected]
The Eddy Covariance (EC) technique is the most common and worldwide used method for measuring vertical turbulent fluxes of momentum, energy, gases between the atmosphere and any ecosystem. Recently the number of EC stations all over the world is dramatically increased and is thought to increase more in the next few years. EC is a mathematically complex technique, which analyzes high-frequency wind and scalar atmospheric data series (often called “raw data”), which are usually saved in hard drive devices for post-processing and final estimations of turbulent flux values. Although in the past several years great efforts of the EC flux community have led to a standard methodology [1] for post-processing steps (at least for CO2 and energy fluxes), the harmonization of post-processing is quite difficult, since most of the required steps and corrections are site- and instrument- (gas analyzer and sonic anemometer) specific. Systematic differences in EC flux estimates strongly depend on the selection, application and order of processing steps [2]. Moreover, a standard methodology for CH4 and N2O is not yet established in the EC flux community, and analysis and QA/QC tools need be developed for inclusion into the international database for non-CO2 flux measurements and to extend the methodological approach already taken in the CarboEurope database for CO2. With this in mind, we recently developed the software EddyUH, a new post-processor for EC measurements. EddyUH includes standardized procedures, as well as the most updated corrections and methods for EC flux estimates, in order to advance methodical issues concerning especially CH4 and N2O flux measurements. The new software is validated against the Eddy Covariance Community software (ECO2S), recently developed within the IMECC-EU project. The software intercomparison was performed using one year of raw data, measured at the SMEAR II station, Hyttiälä, Finland. The resulting flux datasets show close agreement. The software EddyUH includes a graphical user interface and can potentially expands the use of the EC method beyond the micrometeorology community and prove valuable tool for plant physiologists, hydrologists, biologists, and other non-micrometeorological areas of research. [1] M. Aubinet et al., 2000, Adv. Ecol. Res., 30, 113–175. [2] M. Mauder et al., 2008, Biogeosciences, 5, 451-462.
DIFFERENT ROOTASSOCIATED SYMBIOTIC ECTOMYCORRHIZAL FUNGALSPECIES AFFECT CARBON ALLOCATION OF SCOTS PINE
Jussi Heinonsalo (1,2), Aki Lindén (1), Eija Juurola (1), Jukka Pumpanen (1)(1) Department of Forest Sciences, University of Helsinki, Finland(2) Department of Food and Environmental Sciences, University of Helsinki, [email protected]
In boreal forest ecosystems, major part of the fine roots of trees are in symbiotic association with awide range of ectomycorrhizal fungal (ECM) species. Hundreds of fungal species or strains can befound even in one forest stand, indicating high biological diversity in rootassociated fungal microflora. We have studied the effects of different ectomycorrhizal fungal species on the completecarbon budget and the turnover rate of assimilated carbon in the Scots pine (Pinus sylvestris L.) treeseedlings growing on natural humus in microcosm conditions.When ectomycorrhizal species Suillus variegatus was associated with the pine roots, the belowground respiration increased and this carbon loss was compensated by higher photosyntheticactivity. Other fungal species did not differ between each other in their effects on carbon balance.Our findings indicate that some rootassociated mycorrhizal fungal symbionts can significantly alterplant CO2 exchange, biomass distribution, and the allocation of recently photosynthesized plantderived carbon [1].These findings were made in natural humus conditions where the plant roots were associated withseveral different ectomycorrhizal species at the same time. Also in natural forests, the trees alwayshost a wide variety of fungal symbionts. However, to confirm our result on the ectomycorrhizalfungal effect on photosynthetic capacity of the tree, we performed a new experiment using sterilepine seedling inoculated with single ECM species at a time. The surface sterilized pine seeds weregerminated on glucose agar and transferred to glass tubes (diameter 22 mm) with Brown&Wilkingsgrowth media. Until the first lateral short roots emerged, the seedlings were inoculated with eight(8) different ECM fungal species (N=16). Noninoculated seedlings served as controls (N=16).After three months growth period in standardized and controlled growth chamber conditions, thephotosynthetic capacity (Pmax) was analysed in light levels 01400 µmol m2 s1. The total andshoot and root biomass were measured to record the relative C allocation. The mycorrhizal and nonmycorrhizal root tips were calculated to confirm the presence and intensity of fungal symbioticassociation with the trees.The preliminary results show a cleat trend that if seedlings are associated with different ECMspecies, more C is allocated into root biomass but the total seedling biomass is not significantlyaffected by the symbiosis, compared to noninoculated seedlings. For several species thisobservation is statistically significant. The results concerning mycorrhization percentage(mycorrhizal roots vs. all short root tips), N uptake and photosynthesis (Pmax) are presented in theposter.
References[1] J. Heinonsalo, J. Pumpanen, T. Rasilo, K.R. Hurme and H. Ilvesniemi, 2010, Soil Biol. &Biochem. 42 (9), 16141623.
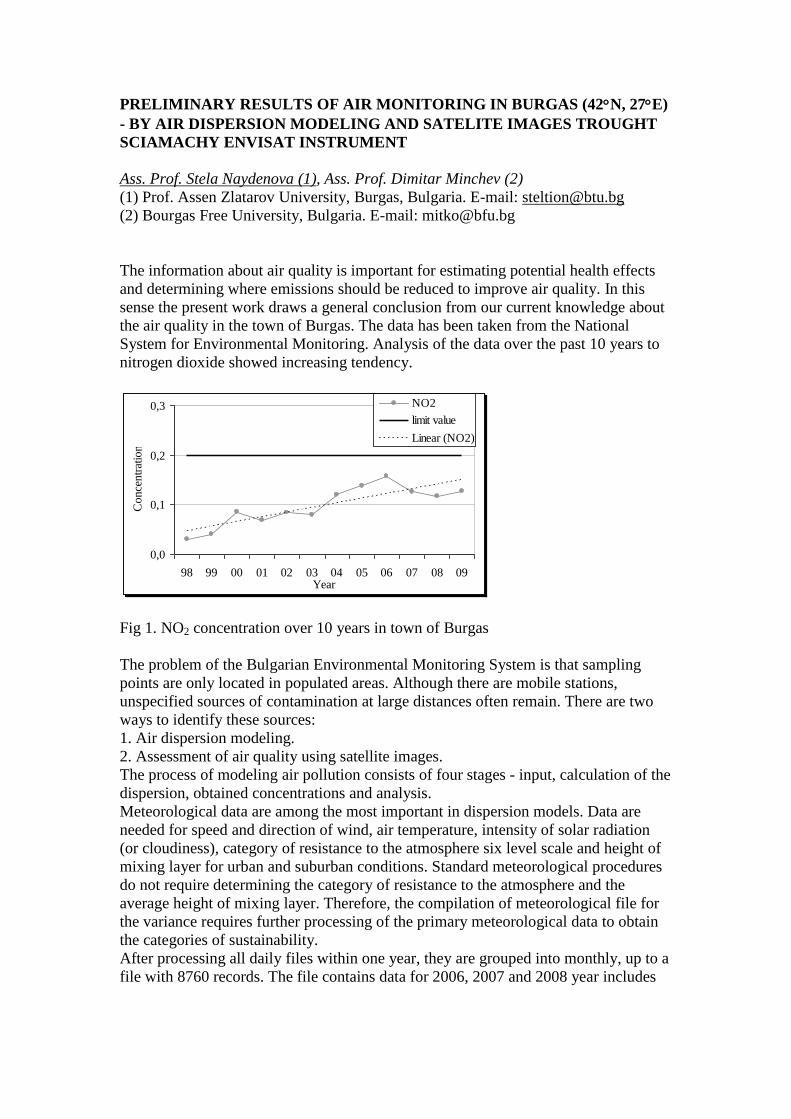
PRELIMINARY RESULTS OF AIR MONITORING IN BURGAS (42N, 27E)
- BY AIR DISPERSION MODELING AND SATELITE IMAGES TROUGHT
SCIAMACHY ENVISAT INSTRUMENT
Ass. Prof. Stela Naydenova (1), Ass. Prof. Dimitar Minchev (2)
(1) Prof. Assen Zlatarov University, Burgas, Bulgaria. E-mail: [email protected]
(2) Bourgas Free University, Bulgaria. E-mail: [email protected]
The information about air quality is important for estimating potential health effects
and determining where emissions should be reduced to improve air quality. In this
sense the present work draws a general conclusion from our current knowledge about
the air quality in the town of Burgas. The data has been taken from the National
System for Environmental Monitoring. Analysis of the data over the past 10 years to
nitrogen dioxide showed increasing tendency.
0,0
0,1
0,2
0,3
98 99 00 01 02 03 04 05 06 07 08 09Year
Co
nce
ntr
atio
n
NO2
limit value
Linear (NO2)
Fig 1. NO2 concentration over 10 years in town of Burgas
The problem of the Bulgarian Environmental Monitoring System is that sampling
points are only located in populated areas. Although there are mobile stations,
unspecified sources of contamination at large distances often remain. There are two
ways to identify these sources:
1. Air dispersion modeling. 2. Assessment of air quality using satellite images.
The process of modeling air pollution consists of four stages - input, calculation of the
dispersion, obtained concentrations and analysis.
Meteorological data are among the most important in dispersion models. Data are
needed for speed and direction of wind, air temperature, intensity of solar radiation
(or cloudiness), category of resistance to the atmosphere six level scale and height of
mixing layer for urban and suburban conditions. Standard meteorological procedures
do not require determining the category of resistance to the atmosphere and the
average height of mixing layer. Therefore, the compilation of meteorological file for
the variance requires further processing of the primary meteorological data to obtain
the categories of sustainability.
After processing all daily files within one year, they are grouped into monthly, up to a
file with 8760 records. The file contains data for 2006, 2007 and 2008 year includes
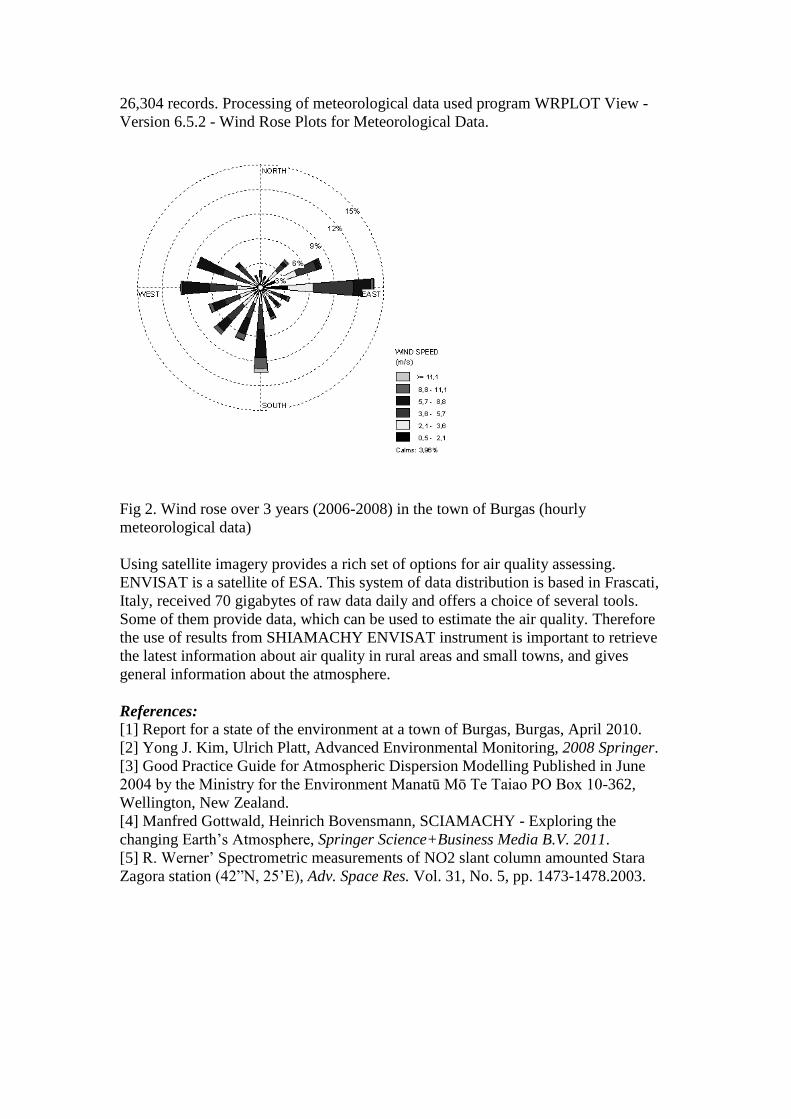
26,304 records. Processing of meteorological data used program WRPLOT View -
Version 6.5.2 - Wind Rose Plots for Meteorological Data.
Fig 2. Wind rose over 3 years (2006-2008) in the town of Burgas (hourly
meteorological data)
Using satellite imagery provides a rich set of options for air quality assessing.
ENVISAT is a satellite of ESA. This system of data distribution is based in Frascati,
Italy, received 70 gigabytes of raw data daily and offers a choice of several tools.
Some of them provide data, which can be used to estimate the air quality. Therefore
the use of results from SHIAMACHY ENVISAT instrument is important to retrieve
the latest information about air quality in rural areas and small towns, and gives
general information about the atmosphere.
References:
[1] Report for a state of the environment at a town of Burgas, Burgas, April 2010.
[2] Yong J. Kim, Ulrich Platt, Advanced Environmental Monitoring, 2008 Springer.
[3] Good Practice Guide for Atmospheric Dispersion Modelling Published in June
2004 by the Ministry for the Environment Manatū Mō Te Taiao PO Box 10-362,
Wellington, New Zealand.
[4] Manfred Gottwald, Heinrich Bovensmann, SCIAMACHY - Exploring the
changing Earth’s Atmosphere, Springer Science+Business Media B.V. 2011.
[5] R. Werner’ Spectrometric measurements of NO2 slant column amounted Stara
Zagora station (42”N, 25’E), Adv. Space Res. Vol. 31, No. 5, pp. 1473-1478.2003.
COMPARISON OF STATIC CHAMBERS TO MEASURE NON-CO2 GREENHOUSE GAS FLUXES FROM SOILS
Mari Pihlatie (1), Jesper Riis Christiansen (2), Hermanni Aaltonen (3), Janne Korhonen (1), Annika Nordbo (1), Terhi Rasilo (3), Giuseppe Benanti (4), Michael Giebels (5), Mohamed Helmy (4), Jatta Hirvensalo (6), Stephanie Jones (7), Radoslaw Juszczak (8), Roland Klefoth (9), Raquel Lobo do Vale (10), Ana Paula Rosa (11), Peter Schreiber (12), Dominique Serça (13), Sara Vicca (14), Benjamin Wolf (15), and Jukka Pumpanen (3) (1) Department of Physics, Division of Atmospheric Sciences, FI-00014 University of Helsinki, Finland, and Institute for Meteorology and Climate Research (IMK-IFU), Karlsruhe Institute of Technology, Kreuzeckbahnstraße 19, 82467 Garmisch-Partenkirchen, Germany (2) Department of Forest & Landscape Ecology, University of Copenhagen, Denmark (3) University of Helsinki, Department of Forest Sciences, FI-00014 University of Helsinki, Finland (4) School of Biology and Environmental Science, University College Dublin, Dublin 4, Ireland (5) Leibniz-Centre for Agricultural Landscape Research, Institute for Landscape Matter Dynamics, Germany (6) MTT Agrifood Research Finland, Plant Production Research, FI-31600 Jokioinen, Finland (7) Scottish Agricultural College, Edinburgh, Bush Estate, Penicuik, Midlothian EH26 OPH (8) Meteorology Department, Poznan University of Life Sciences, Piatkowska 94, 60-649 Poznan, Poland (9) Wageningen UR, Environmental Sciences, Soil Science Centre, P.O. Box 47, 6700 AA, Wageningen, the Netherlands (10) ISA, Universidade Téchnica de Lisboa, Tapada da Ajuda 1349-017, Lisboa, Portugal (11) Centro de Ecologia e Biologia Vegetal, Departamento de Biologia Vegetal, Lisboa, Portugal (12) University of Hamburg, KlimaCampus, Institute of Soil Science, Allende-Platz 2, 20146 Hamburg, Germany (13) Laboratoire d'Aérologie - Observatoire Midi-Pyrénées, FR-31400 Toulouse, France (14) University of Antwerp, Research Group of Plant and Vegetation Ecology, Universiteitsplein 1, 2610 Wilrijk, Belgium. (15) Institute for Meteorology and Climate Research (IMK-IFU), Karlsruhe Institute of Technology, Kreuzeckbahnstraße 19,82467 Garmisch-Partenkirchen, Germany [email protected] Soil fluxes of non-CO2 greenhouse gases are often measured by closed static chambers. The chamber method has been criticized for potentially influencing the gas concentration gradient, and as a result changing the flux rate from the soil. We measured the fluxes of methane (CH4) in controlled conditions in a chamber inter-comparison campaign at Hyytiälä, Finland. We tested 18 static chambers against five CH4 flux levels (60 - 2000 µg CH4 m-2 h-1) replicated for three soil types. The aims of the study were 1) to quantitatively assess the

uncertainties and errors related to static chamber measurements and chamber designs, and 2) to compare the suitability of different flux calculation methods. We found that most of the chambers underestimated the CH4 fluxes, however, there were marked differences between the chamber designs. Shallow chambers (height<0.2m) displayed the greatest underestimation compared to taller chambers. The degree of underestimation was independent of the flux level, and the use of non-linear flux calculation method improved the flux estimation. Also, the use of fans to mix the chamber headspace significantly reduced the degree of underestimation of the fluxes.
NET ECOSYSTEM EXCHANGE OF A NATURAL AND A DRAINED TEMPERATE PEATLAND FOREST Janina Hommeltenberg (1), Matthias Drösler (1), Hans Peter Schmid (2), Stephan Thiel (2), Peter Werle (2) (1) Technical University of Munich, Restoration Ecology, Germany (2) Karlsruhe Institute of Technology, Institute of Meteorology and Climate Research (IMK-IFU), Germany [email protected] Natural peatlands are continuous sinks for atmospheric carbon dioxide and therefore count among the most important terrestrial carbon storage pools. However their continued role as substantial carbon sinks is threatened especially by land use changes. Peatland drainage for forestry or agriculture induces oxidation of the peat-carbon resulting in a strong release of carbon dioxide into the atmosphere. Until now the carbon exchange of temperate forested peatland ecosystems and the influence of management and climate change have been rarely investigated. The carbon budget of a natural bog forest and a bog drained for forestry in the pre-alpine region of southern Germany has been investigated since June 2010, using the eddy covariance technique. The sites under investigation are separated by about ten kilometers, and thus share the same geological history and underlie the same general weather conditions. In contrast, both measurement sites are clearly distinct by land use type: at the Schechenfilz (47°48' N; 11°19' E, 590 m a.s.l.) site a natural Pinus mugo rotundata forest grows on an undisturbed (> 6 m) thick peat layer, while in Mooseurach (47°48' N, 11°27' E, 598 m a.s.l.) a planted Picea abies forest grows on drained and degraded peat (< 4 m). The objective of the intercomparison is to investigate the variation and differences of the net ecosystem exchange (NEE) between the two sites. A prerequisite for reliable conclusions is to understand the overall data quality, but also data processing issues play an important role. Especially the influence of the applied gap filling strategy for eddy covariance measurements has to be carefully analyzed. In this contribution first time series data will be discussed in this context.
NET ECOSYSTEM EXCHANGE OF CO2 IN A WIND-THROW-DISTURBED UPLAND SPRUCE FOREST ECOSYSTEM – FIRST RESULTS Matthias Lindauer
Karlsruhe Institute of Technology - Institute of Meteorology and Climate Research (IMK-IFU), Germany
, Hans Peter Schmid, Matthias Mauder, Benjamin Wolpert, Rainer Steinbrecher
[email protected] In the past years there has been an increasing interest in determining carbon sink and source relations in different types of ecosystems. Forests, as large and highly dynamic terrestrial carbon pools attract special attention. Areas with wind-throw, where dead-wood remains on the ground, may turn into a substantial carbon source for extended periods, in contrast to the general carbon sink behavior of even mature intact forest ecosystems. The dynamics and magnitude of those processes on terrestrial carbon turnover are largely unknown. In a large wind-throw area (ca. 600 m diameter, due to cyclone Kyrill in January 2007), where dead-wood has not been removed, in the Bavarian Forest National Park (Lackenberg, 1308 m a.s.l., Bavaria, Germany) fluxes of CO2, water vapor and energy have been measured since 2009. Decomposition of the coarse woody debris remaining on the ground is expected to lead to substantial net carbon emission in this area. On the other hand, nutrients leached from the dead biomass likely accelerate plant re-growth, leading to an earlier turn of the disturbed area from a carbon source to a carbon sink compared to a cleared wind-throw or a harvested area. For 2009 and 2010 estimates of Net Ecosystem Exchange (NEE) showed that the wind-throw was a smaller carbon source than expected. Furthermore, at daytime on sunny and warm summer days the wind-throw acts as a net carbon sink, indicating that photosynthesis by the few remaining trees and newly emerging vegetation (grass, sparse young spruce, etc.) already exceeds respiration two years after the wind-throw event. The relatively high elevation of the site, with cold temperatures and long periods with a closed snow cover, may also affect this balance by slowing down heterotrophic respiration. In the calculation of annual NEE, there is still some debate concerning the treatment of data gaps in the time series, resulting from instrument failure and unfavorable environmental conditions for the eddy covariance approach. A suitable strategy for gap-filling day- as well as night-time flux values is suggested and discussed.
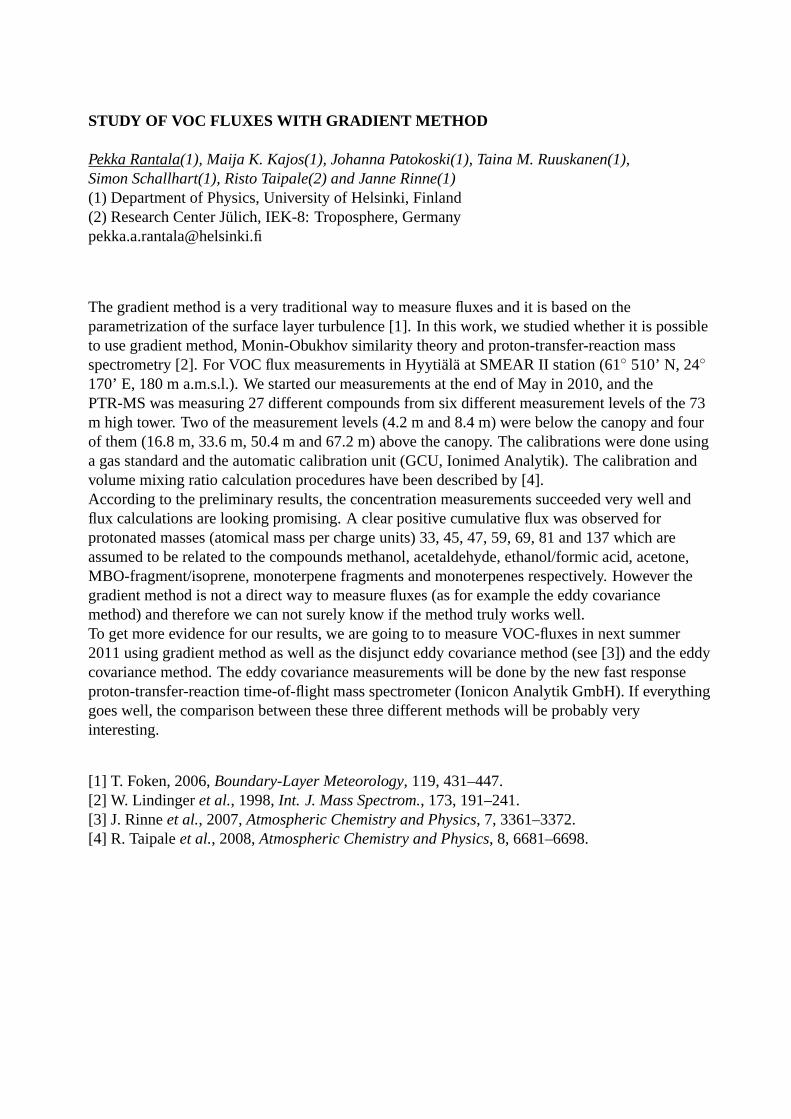
STUDY OF VOC FLUXES WITH GRADIENT METHOD
Pekka Rantala(1), Maija K. Kajos(1), Johanna Patokoski(1), Taina M. Ruuskanen(1),Simon Schallhart(1), Risto Taipale(2) and Janne Rinne(1)(1) Department of Physics, University of Helsinki, Finland(2) Research Center Julich, IEK-8: Troposphere, [email protected]
The gradient method is a very traditional way to measure fluxes and it is based on theparametrization of the surface layer turbulence [1]. In this work, we studied whether it is possibleto use gradient method, Monin-Obukhov similarity theory and proton-transfer-reaction massspectrometry [2]. For VOC flux measurements in Hyytiala at SMEAR II station (61◦ 510’ N, 24◦
170’ E, 180 m a.m.s.l.). We started our measurements at the end of May in 2010, and thePTR-MS was measuring 27 different compounds from six different measurement levels of the 73m high tower. Two of the measurement levels (4.2 m and 8.4 m) were below the canopy and fourof them (16.8 m, 33.6 m, 50.4 m and 67.2 m) above the canopy. Thecalibrations were done usinga gas standard and the automatic calibration unit (GCU, Ionimed Analytik). The calibration andvolume mixing ratio calculation procedures have been described by [4].According to the preliminary results, the concentration measurements succeeded very well andflux calculations are looking promising. A clear positive cumulative flux was observed forprotonated masses (atomical mass per charge units) 33, 45, 47, 59, 69, 81 and 137 which areassumed to be related to the compounds methanol, acetaldehyde, ethanol/formic acid, acetone,MBO-fragment/isoprene, monoterpene fragments and monoterpenes respectively. However thegradient method is not a direct way to measure fluxes (as for example the eddy covariancemethod) and therefore we can not surely know if the method truly works well.To get more evidence for our results, we are going to to measure VOC-fluxes in next summer2011 using gradient method as well as the disjunct eddy covariance method (see [3]) and the eddycovariance method. The eddy covariance measurements will be done by the new fast responseproton-transfer-reaction time-of-flight mass spectrometer (Ionicon Analytik GmbH). If everythinggoes well, the comparison between these three different methods will be probably veryinteresting.
[1] T. Foken, 2006,Boundary-Layer Meteorology, 119, 431–447.[2] W. Lindingeret al., 1998,Int. J. Mass Spectrom., 173, 191–241.[3] J. Rinneet al., 2007,Atmospheric Chemistry and Physics, 7, 3361–3372.[4] R. Taipaleet al., 2008,Atmospheric Chemistry and Physics, 8, 6681–6698.
25/07 26/07 27/07 28/07 29/07 30/07 31/07 01/08
0.2
0.4
0.6
0.8
1
1.2
1.4
1.6C
once
ntra
tion
[ppb
v]
Time (dd/mm)
67.2 m 16.8 m
Figure 1: Concentration of monoterpenes (protonated mass 137 amu) at levels 16.8 m (grey line)and 67.2 m (black line) during 25.7.-31.7.2010.
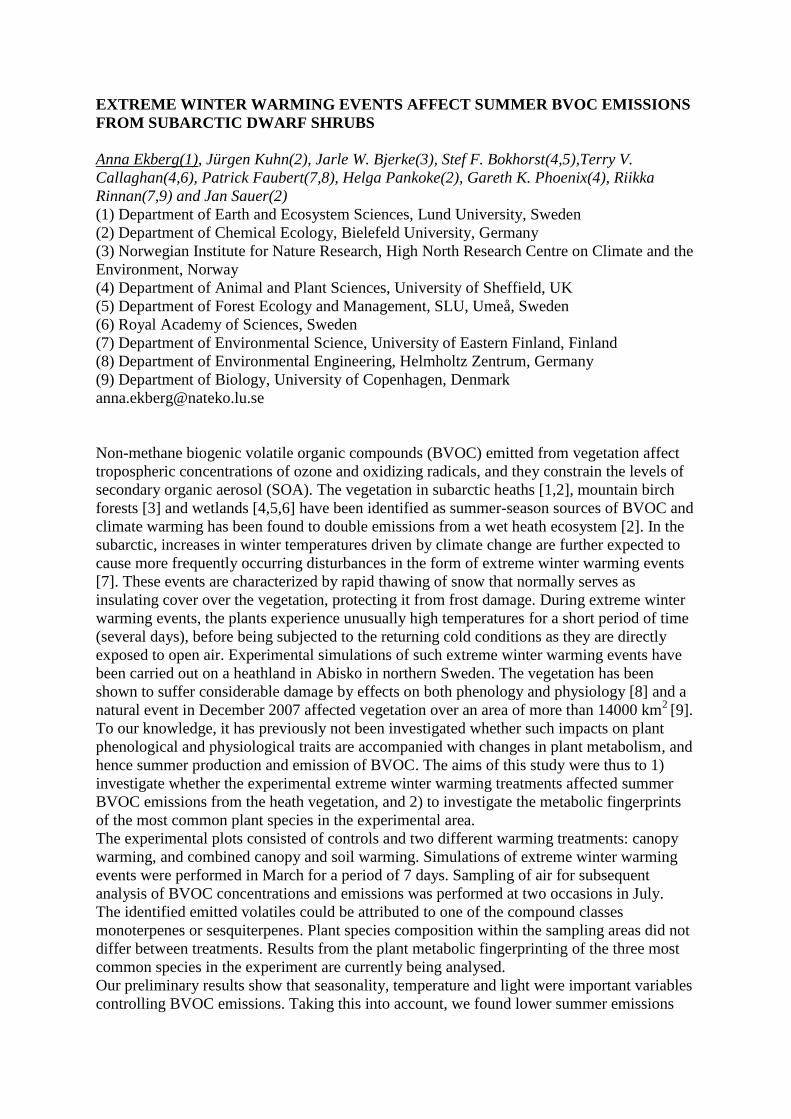
EXTREME WINTER WARMING EVENTS AFFECT SUMMER BVOC EMISSIONS
FROM SUBARCTIC DWARF SHRUBS
Anna Ekberg(1), Jürgen Kuhn(2), Jarle W. Bjerke(3), Stef F. Bokhorst(4,5),Terry V.
Callaghan(4,6), Patrick Faubert(7,8), Helga Pankoke(2), Gareth K. Phoenix(4), Riikka
Rinnan(7,9) and Jan Sauer(2)
(1) Department of Earth and Ecosystem Sciences, Lund University, Sweden
(2) Department of Chemical Ecology, Bielefeld University, Germany
(3) Norwegian Institute for Nature Research, High North Research Centre on Climate and the
Environment, Norway
(4) Department of Animal and Plant Sciences, University of Sheffield, UK
(5) Department of Forest Ecology and Management, SLU, Umeå, Sweden
(6) Royal Academy of Sciences, Sweden
(7) Department of Environmental Science, University of Eastern Finland, Finland
(8) Department of Environmental Engineering, Helmholtz Zentrum, Germany
(9) Department of Biology, University of Copenhagen, Denmark
Non-methane biogenic volatile organic compounds (BVOC) emitted from vegetation affect
tropospheric concentrations of ozone and oxidizing radicals, and they constrain the levels of
secondary organic aerosol (SOA). The vegetation in subarctic heaths [1,2], mountain birch
forests [3] and wetlands [4,5,6] have been identified as summer-season sources of BVOC and
climate warming has been found to double emissions from a wet heath ecosystem [2]. In the
subarctic, increases in winter temperatures driven by climate change are further expected to
cause more frequently occurring disturbances in the form of extreme winter warming events
[7]. These events are characterized by rapid thawing of snow that normally serves as
insulating cover over the vegetation, protecting it from frost damage. During extreme winter
warming events, the plants experience unusually high temperatures for a short period of time
(several days), before being subjected to the returning cold conditions as they are directly
exposed to open air. Experimental simulations of such extreme winter warming events have
been carried out on a heathland in Abisko in northern Sweden. The vegetation has been
shown to suffer considerable damage by effects on both phenology and physiology [8] and a
natural event in December 2007 affected vegetation over an area of more than 14000 km2
[9].
To our knowledge, it has previously not been investigated whether such impacts on plant
phenological and physiological traits are accompanied with changes in plant metabolism, and
hence summer production and emission of BVOC. The aims of this study were thus to 1)
investigate whether the experimental extreme winter warming treatments affected summer
BVOC emissions from the heath vegetation, and 2) to investigate the metabolic fingerprints
of the most common plant species in the experimental area.
The experimental plots consisted of controls and two different warming treatments: canopy
warming, and combined canopy and soil warming. Simulations of extreme winter warming
events were performed in March for a period of 7 days. Sampling of air for subsequent
analysis of BVOC concentrations and emissions was performed at two occasions in July.
The identified emitted volatiles could be attributed to one of the compound classes
monoterpenes or sesquiterpenes. Plant species composition within the sampling areas did not
differ between treatments. Results from the plant metabolic fingerprinting of the three most
common species in the experiment are currently being analysed.
Our preliminary results show that seasonality, temperature and light were important variables
controlling BVOC emissions. Taking this into account, we found lower summer emissions

from the vegetation that had been subjected to extreme winter warming events. This feedback
between climate and plant secondary metabolism may have implications for ecosystem
functioning, for example the ability to withstand insect or pest outbreaks.
References [1] P. Tiiva et al., 2008, New Phytol., 180, 853–863.
[2] P. Faubert et al., 2010, New Phytol., 187, 199-208.
[3] S. Haapanala et al., 2009, Biogeosciences 6, 2709-2718.
[4] K. Bäckstrand et al., 2008, Tellus 60, 226-237.
[5] A. Ekberg et al., 2009, Biogeosciences 6, 601-613.
[6] T. Holst et al., 2010, Atmos. Chem. Phys. 10, 1617-1634.
[7] A. Shabbar and B. Bonsal, 2003, Natural Hazards 29, 173-188.
[8] S. Bokhorst et al., 2008, Glob. Change Biol. 14, 2603-2612.
[9] S. Bokhorst et al., 2009, J. Ecol. 97, 1408-1415.
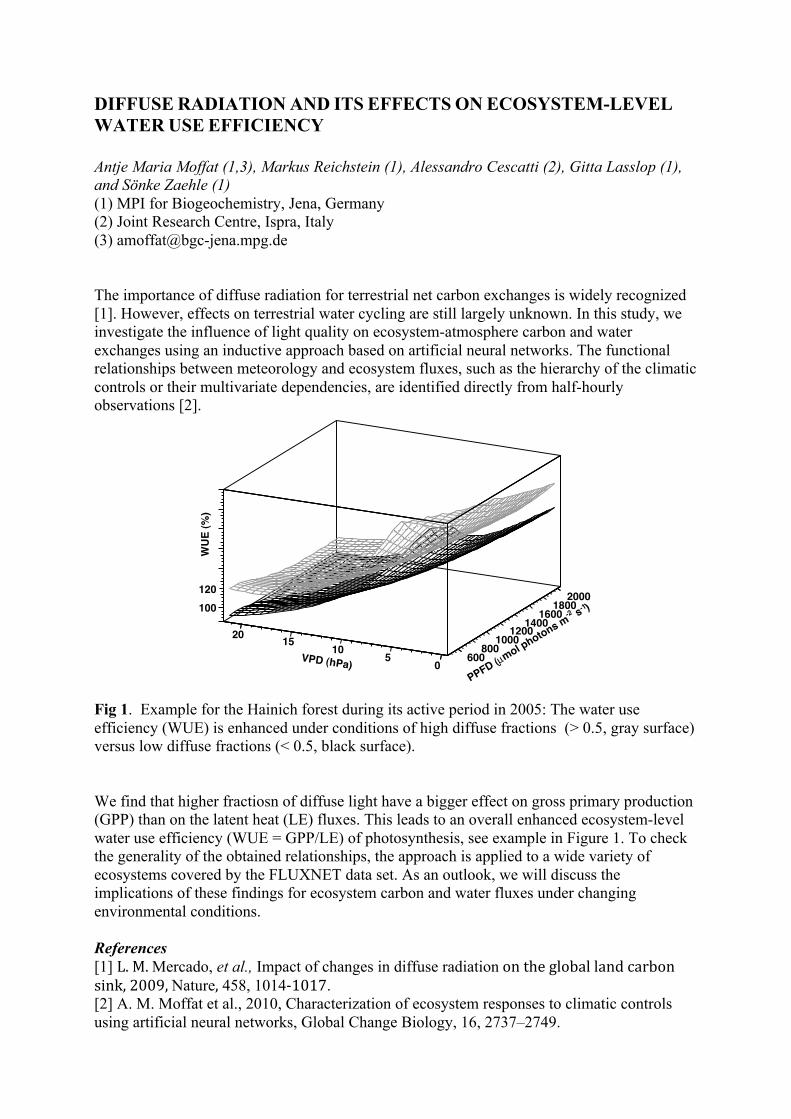
DIFFUSE RADIATION AND ITS EFFECTS ON ECOSYSTEM-LEVEL WATER USE EFFICIENCY Antje Maria Moffat (1,3), Markus Reichstein (1), Alessandro Cescatti (2), Gitta Lasslop (1), and Sönke Zaehle (1) (1) MPI for Biogeochemistry, Jena, Germany (2) Joint Research Centre, Ispra, Italy (3) [email protected] The importance of diffuse radiation for terrestrial net carbon exchanges is widely recognized [1]. However, effects on terrestrial water cycling are still largely unknown. In this study, we investigate the influence of light quality on ecosystem-atmosphere carbon and water exchanges using an inductive approach based on artificial neural networks. The functional relationships between meteorology and ecosystem fluxes, such as the hierarchy of the climatic controls or their multivariate dependencies, are identified directly from half-hourly observations [2].
Fig 1. Example for the Hainich forest during its active period in 2005: The water use efficiency (WUE) is enhanced under conditions of high diffuse fractions (> 0.5, gray surface) versus low diffuse fractions (< 0.5, black surface). We find that higher fractiosn of diffuse light have a bigger effect on gross primary production (GPP) than on the latent heat (LE) fluxes. This leads to an overall enhanced ecosystem-level water use efficiency (WUE = GPP/LE) of photosynthesis, see example in Figure 1. To check the generality of the obtained relationships, the approach is applied to a wide variety of ecosystems covered by the FLUXNET data set. As an outlook, we will discuss the implications of these findings for ecosystem carbon and water fluxes under changing environmental conditions. References [1] !"#$"#Mercado, et al., Impact of changes in diffuse radiation#%&#'()#*+%,-+#+-&.#/-0,%&34#56674#Nature4 458, 10148969:. [2] A. M. Moffat et al., 2010, Characterization of ecosystem responses to climatic controls using artificial neural networks, Global Change Biology, 16, 2737–2749.
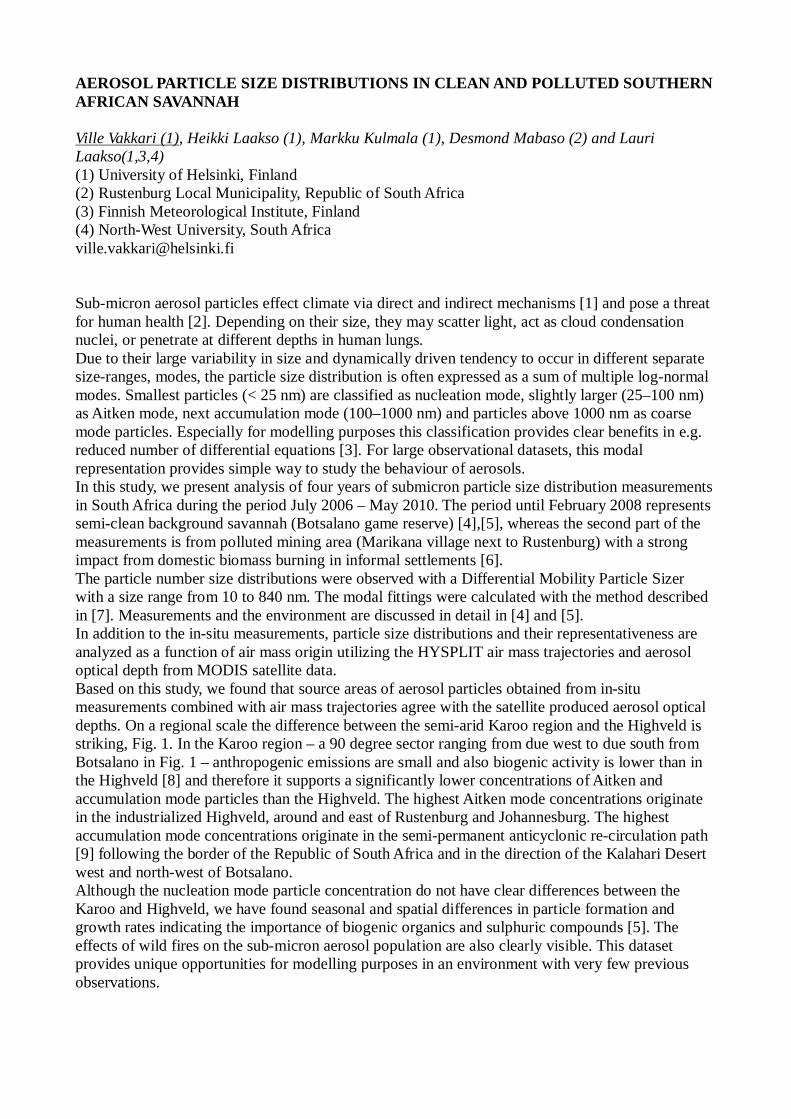
AEROSOL PARTICLE SIZE DISTRIBUTIONS IN CLEAN AND POLLUTED SOUTHERN AFRICAN SAVANNAH Ville Vakkari (1), Heikki Laakso (1), Markku Kulmala (1), Desmond Mabaso (2) and Lauri Laakso(1,3,4) (1) University of Helsinki, Finland (2) Rustenburg Local Municipality, Republic of South Africa (3) Finnish Meteorological Institute, Finland (4) North-West University, South Africa [email protected] Sub-micron aerosol particles effect climate via direct and indirect mechanisms [1] and pose a threat for human health [2]. Depending on their size, they may scatter light, act as cloud condensation nuclei, or penetrate at different depths in human lungs. Due to their large variability in size and dynamically driven tendency to occur in different separate size-ranges, modes, the particle size distribution is often expressed as a sum of multiple log-normal modes. Smallest particles (< 25 nm) are classified as nucleation mode, slightly larger (25–100 nm) as Aitken mode, next accumulation mode (100–1000 nm) and particles above 1000 nm as coarse mode particles. Especially for modelling purposes this classification provides clear benefits in e.g. reduced number of differential equations [3]. For large observational datasets, this modal representation provides simple way to study the behaviour of aerosols. In this study, we present analysis of four years of submicron particle size distribution measurements in South Africa during the period July 2006 – May 2010. The period until February 2008 represents semi-clean background savannah (Botsalano game reserve) [4],[5], whereas the second part of the measurements is from polluted mining area (Marikana village next to Rustenburg) with a strong impact from domestic biomass burning in informal settlements [6]. The particle number size distributions were observed with a Differential Mobility Particle Sizer with a size range from 10 to 840 nm. The modal fittings were calculated with the method described in [7]. Measurements and the environment are discussed in detail in [4] and [5]. In addition to the in-situ measurements, particle size distributions and their representativeness are analyzed as a function of air mass origin utilizing the HYSPLIT air mass trajectories and aerosol optical depth from MODIS satellite data. Based on this study, we found that source areas of aerosol particles obtained from in-situ measurements combined with air mass trajectories agree with the satellite produced aerosol optical depths. On a regional scale the difference between the semi-arid Karoo region and the Highveld is striking, Fig. 1. In the Karoo region – a 90 degree sector ranging from due west to due south from Botsalano in Fig. 1 – anthropogenic emissions are small and also biogenic activity is lower than in the Highveld [8] and therefore it supports a significantly lower concentrations of Aitken and accumulation mode particles than the Highveld. The highest Aitken mode concentrations originate in the industrialized Highveld, around and east of Rustenburg and Johannesburg. The highest accumulation mode concentrations originate in the semi-permanent anticyclonic re-circulation path [9] following the border of the Republic of South Africa and in the direction of the Kalahari Desert west and north-west of Botsalano. Although the nucleation mode particle concentration do not have clear differences between the Karoo and Highveld, we have found seasonal and spatial differences in particle formation and growth rates indicating the importance of biogenic organics and sulphuric compounds [5]. The effects of wild fires on the sub-micron aerosol population are also clearly visible. This dataset provides unique opportunities for modelling purposes in an environment with very few previous observations.
This work was supported by the Academy of Finland (project numbers 117505 and 132640) and the Rustenburg local municipality. References [1] J.H. Seinfeld and S.N. Pandis, 1998, Atmospheric Chemistry and Physics: From Air Pollution to Climate Change (Wiley, New York). [2] C.A. Pope and D.W. Dockery, 2006, J. Air Waste Manag. Assoc., 56, 709-742. [3] H. Korhonen et al., 2004, Atmos. Chem. Phys., 4, 757-771. [4] L.Laakso, et al., 2008, Atmos. Chem. Phys., 8, 4823-4839. [5] V. Vakkari et al., 2011, Atmos. Chem. Phys., 11, 3333-3346. [6] A. Venter et al., 2011, in prep. [7] E.Vartiainenet al., 2007, Boreal Env. Res., 12, 375–396. [8] M.A. Friedl et al., 2002, Remote Sens. Environ., 83, 287-302. [9] M. Garstanget al., 1996, J. Geophys. Res., 101, 23721–23736.
Fig 1. Accumulation, Aitken and nucleation modes as a function of the origin of air masses for Botsalano game reserve, Republic of South Africa. The black dots are (from left to right) Botsalano, Marikana and Johannesburg.

SEGREGATION OF VOLATILE ORGANIC COMPOUNDS AND HOx RADICALS ABOVE A DECIDUOUS FOREST (ECHO CAMPAIGNS) FROM MICORMETEOROLOGICAL METHODS
Ralph Dlugi (1), Martina Berger (1), Michael Zelger (1), Gerhard Kramm (2), Andreas Hofzumahaus (3), Franz Rohrer (3) and Frank Holland (3)(1) WAP, Gernotstr.11, D-80804 München, Germany(2) Geophysical Institute, University of Alaska Fairbanks, USA(3) Forschungszentrum Jülich (FZJ), IEK-8 Troposphäre, D-52425 Jülich, GermanyEmail: [email protected]
Recent analysis of field experiments and LES – modeling showed that the intensity of segregation, e.g. a reduction of the reaction rate constant of the reaction isoprene + OH, near canopies is not zero. Values are found in the range up to 15-30% by different authors. A further analysis on ECHO data from measurements at a deciduous forest site at the Research Center Jülich, Germany, is performed to find out if intermittent organized turbulence or inhomogeneous distributions of isoprene sources is the main cause for segregation. For this purpose direct measurements of OH, HO2, NO, NOx, isoprene and some other compounds during the field campaign ECHO 2003 are analyzed. All terms of the balance equations for mixing ratios and second moments like variance, fluxes and the segregation intensity itself are calculated from measured data. The impact of advection and turbulent non local transport on the intensity of segregation can be separated from periods where chemical sink reaction is dominant. It is shown, that also the spatial distribution of sources is of influence as proposed by model results e.g. by Krol et al.[1], Verver et al. [2] and Patton et al. [3].
[1] Krol, M. C., M.-J. Molemaker and J. Vila Guerau de Arellano. Effects of turbulence and heterogeneous emission on photochemically active species in the convective boundary layer. J. Geophys. Res., 105(D5):6871--6884, 2000 [2] G. H. L. Verver, H. van Dop, and A. A. M. Holtslag. Turbulent mixing and the chemicalbreakdown of isoprene in the atmospheric boundary layer. J. Geophys. Res., 105((D3)):3983–4002, 2000[3] E.G. Patton, K.J. Davis, M.C. Barth, and P. P. Sullivan. Decaying scalars emitted by a forest canopy: A numerical study. Boundary Layer Meteorol., 100:91–129, 2001
LYSIMETER WATER BALANCE IN THE RIETHOLZBACH CATCHMENT Irene Lehner and Sonia I. Seneviratne Institute for Atmospheric and Climate Science, ETH Zurich, Switzerland [email protected] Long-term measurements provide deep insights in land-atmosphere processes on different time scales. Using a weighing lysimeter – in combination with other meteorological and hydrological instrumentation – allows to assess the water balance in detail. The partitioning of the available precipitation water into evapotranspiration and leachate allows the identification and characterisation of the involved processes. Such measurements are very scarce [1] but often available over longer time periods than e.g. from FLUXNET [2]. The data set of interest originates from the Rietholzbach catchment which is a small, pre-alpine research basin in the north-eastern part of Switzerland (http://www.iac.ethz.ch/url/rietholzbach). Its area of 3.31 km2 is only sparsely populated and primarily used as pasture (73 %). Measurements were initiated in 1975. Amongst other measurements a weighing lysimeter was built and catchment runoff as well as precipitation measurements were introduced. The grass-covered, weighing lysimeter has a surface area of 3.14 m2 and is 2.5 m deep. The lysimeter is backfilled and leachate is by gravitation only. Recently, in May 2009 a flux tower was built and equipped with ultrasonic anemometer (CSAT3, Campbell Scientific, Logan, USA) and open-path CO2/H2O infrared gas analyser (Li7500, Li-Cor, Lincoln, USA) both operated at 10 Hz. A comparison of evapotranspiration estimates derived from lysimeter data, flux measurements and the hydrological water balance approach over the common measurement period shows a good agreement. During summer the lysimeter shows higher evapotranspiration values than the flux measurements. During winter the ratio between the two measurements is opposite. These results are put in context with the 35-year long time series of the lysimeter water balance which is investigated in terms of seasonal patterns, annual variability, change over time, behaviour under extreme conditions, as well as the main driving processes. In addition, we assess the representativeness of the results for the entire catchment with the hydrological water balance approach. References [1] S.I. Seneviratne et al., 2010, Earth-Science Reviews 99: 125-161. [2] D.D. Baldocchi et al., 2001, Bulletin of the American Meteorological Society 82: 2415-2434.
PTR- TOF FLUX AND CONCENTRATION MEASUREMENTS ABOVE A BOREAL
FOREST
Simon Schallhart, Taina M. Ruuskanen, Maija K. Kajos, Janne Rinne, Markku Kulmala
Department of Physics, University of Helsinki, Finland
The boreal zone is the largest forested area in the northern hemisphere and a major source of
biogenic volatile organic compounds (VOCs). The emitted VOCs react during the day with OH and
O3, during the night with NO3 and O3, and form oxidation products. The biogenic VOCs, such as
isoprene and monoterpenes, can react further and form less volatile products, which can condense
on secondary organic aerosol (SOA) particles [1] or contribute to wet or dry deposition. Only a few
of the biogenic VOCs that affect SOA growth have been identified, and the reactions of higher
photo-oxidized biogenic VOCs are poorly known. Due to the discrepancies between organic aerosol
measurements and predictions of atmospheric chemistry models, the sources of SOA are still
uncertain [2].
Biogenic emissions from a boreal forest in Hyytiälä (SMEAR II [3]) were measured by a proton-
transfer-reaction time-of-flight (PTR-TOF) mass spectrometer from March to May 2011. The PTR-
ToF combines the soft ionization of PTR [4] and the high duty cycle of a TOF [5]. The high mass
resolving power of ~4000 Δm/m (full width at half maximum) and a high mass accuracy of ~20
ppm allows the separation of, e.g., pure hydrocarbons from oxygen- containing VOCs [5]. This
combination allows recording a full mass spectrum of a wide range of VOCs in sub second
integration time. In this field campaign 10Hz measurements up to 500 Th were collected. To reach
the high mass accuracy a reservoir with trichlorobenzene, used as a mass scale calibration
compound, was connected to the PTR-TOF inlet system. With a capillary the compound was mixed
by molar diffusion with the ambient sampling air, which results in an always detectable, known
peak in the mass scale. The low instrumental background was characterized by zero air
measurements and separated from the measurement signal leading to a better detection limit. This
allows recording signals in the ppt range.
The PTR-ToF instrument sampled from 22m height, which was ~3 m above the canopy. To
minimize the wall losses, the air was pumped with ~15 l/min flow through a 10 mm (i.d.) Teflon
PTFE tube which was heated to approximately 5 °C over ambient temperature. Time traces of the
preliminary VOC volume mixing ratios will be presented. This, in combination with the flux-data
[6] is used to acquire better knowledge of the composition and the general behavior of VOCs, as
well as of their emissions and depositions.
References:
[1] Kourtchev et al., 2006, Plant Biology, 10, 138–149.
[2] Robinson et al., 2007, Science, 315, 1259-1262.
[3] Hari and Kulmala, 2005, Boreal Environ. Res., 10, 315–322.
[4] Hansel et al., 1995, Int. J. Mass. Spectrom., 149, 609-619.
[5]Graus et al., 2010, J. Am. Soc. Mass Spectr., 21, 1037-1044.
[6] Ruuskanen et al., 2011, iLEAPS OSC 2011 proceedings.
DIRECT DETECTION OF ATMOSPHERIC PARTICLE FORMATION USING ION SPECTROMETERS Hanna E. Manninen, Tuomo Nieminen, Anne Hirsikko, Taina Yli-Juuti, Jenni Kontkanen, Eija Asmi, Alessandro Franchin, Stéphanie Gagné, Katrianne Lehtipalo, Tuukka Petäjä and Markku Kulmala. Department of Physics, University of Helsinki, P.O. Box 64, FI-00014, Finland. [email protected]
Aerosol particles exist everywhere in the atmosphere, they are diverse and complex, and they are in a constant movement and interaction with their surroundings. Aerosol particle sizes range from nanometer sized molecular clusters up to approximately 100 m cloud droplets. Aerosol particles have global effects on Earth’s climate and regional effects on air quality. The main characterizing parameters of atmospheric particles are their size, concentration, and composition. Secondary new particle formation (NPF) increases the total particle concentration and decreases the median particle size. Under favorable conditions, nucleated particles grow into sizes in which they are able to act as cloud condensation nuclei.
From a physical point of view, two very different particle types can be distinguished: charged (air ions or ion clusters) and neutral particles. The existence of atmospheric ion clusters as small as 0.5-1 nm in diameter has been known for decades, and measurements with ion spectrometers, such as the Air Ion Spectrometer (AIS [1]) and Balanced Scanning Mobility Analyzer (BSMA [2]), have demonstrated that such clusters are present practicall all the time [3]. The production rates of ion clusters are, however, generally too low to explain the observed particle formation rate [3]. In view of the insufficient numbers of ion clusters, the key to understanding the atmospheric NPF is clearly the presence of neutral clusters. Direct measurement at the size range where the nucleation occurs infers the possible mechanism for NPF (relative contribution of ions or neutral particles to total particle formation).
Ion spectrometers were used to measure the mobility distributions of charged aerosol particles and clusters down to molecular sizes. Atmospheric nucleation and cluster activation takes place in the mobility diameter range of 1.5–2 nm [4]. Therefore, ion spectrometers allow direct measurements exactly at the size where atmospheric nucleation occurs. In addition to characterizing the spatial and temporal variability of the nucleation events, this enables the investigation of several parameters relevant to nucleation events, including the particle formation and growth rates. Understanding the temporal variation of the NPF phenomenon and quantifying its effect on the climate and air quality requires both intensive field campaigns and long-term, continuous field measurements.
Although a large number of observations have shown that atmospheric NPF takes place frequently in the continental boundary layer, the role of ions in this process is not well quantified. Therefore, ion spectrometers have been measuring in many diffrent locations for example in continuous measurements in Hyytiälä, Finland [5], and in EUCAARI (European Integrated project on Aerosol Cloud Climate and Air Quality interactions) campaign one-year-long time series from 12 continental measurement sites [6]. The data set presented by Manninen et al. 2010 [6] is unique. To date, the EUCAARI ion spectrometer measurements are the most comprehensive effort to experimentally characterize nucleation and growth of atmospheric clusters and particles at ground-based observation sites on a continental scale. The twelve field sites represent a wide variety of environments, such as marine, coastal, remote continental, suburban, rural and mountainous regions. The field sites are located at different altitudes ranging
from sea level to several thousands of meters above sea level. NPF was observed to occur at all the sites and the observations were used as indicators of the particle formation mechanisms. Particle formation rates and size-dependent growth rates were examined to obtain information on NPF and subsequent growth.
The recently developed Neutral cluster and Air Ion Spectrometer (NAIS [6,7]) can be reliably used to measure ions and neutral species near the sizes where atmospheric particle formation begins. The main purposes of the NAIS are to: 1) charge particles efficiently in sub-3 nm size range, 2) detect the fraction concentration of charged particles down to 10 cm-3 in air, 3) measure with a high enough time resolution that enables the detection of rapid changes in size spectra during particle formation bursts, and 4) cover the whole size range from cluster molecules up to 42 nm, which approaches the climatically relevant sizes where the particles act as cloud condensation nuclei. In the case of parallel ion and neutral cluster measurements, also the contribution of ions to the NPF can be investigated.
One of the key problems in elucidating the atmospheric nucleation is the importance of ion-induced nucleation. As a solution, simultaneous measurement of the concentrations of charged and neutral nanoparticles is a viable method to detect it. Based on our study, neutral particle formation seems to dominate over ion-induced and ionmediated nucleation, at least in the continental boundary layer. The results obtained from the NAIS particle and ion measurements agree well with separate independent measurements performed with other electrical mobility spectrometer [8] and condensation based [9] techniques. The formation rates of charged particles at 2 nm accounted for 1-30 % of the respective total particle formation rates. As a significan new result, we found out that the total particle formation rate varied much more between the different sites than the formation rate of charged particles [6].
In order to understand the role of atmospheric aerosol particles in the climate change and radiative forcing and feedbacks related to it, long-term measurements are crucially needed. Continuous time series are essential to understanding difference between seasonal and long-term interannual variability. As an example, continuous (particle and) ion number size distribution measurements at SMEAR II in Hyytiälä since (1997 and) 2003 can be seen as a good starting point towards the right direction. The instrumental developments described here, observing neutral clusters about a nanometer smaller than any earlier measurement technique, offer a chance to test the existing nucleation theories against real atmospheric data. By conducting measurements similar to those reported here in a few carefully-selected locations, it should be possible to develop simple yet sufficiently accurate nucleation parameterizations for large-scale modeling [10,11].
[1] Mirme et al., 2007, Boreal Environ. Res., 12, 247-264. [2] Tammet et al., 2006, Atmos. Res., 82: 523–535. [3] Hirsikko et al., 2011, Atmos. Chem. Phys., 11, 767-798. [4] Nieminen et al., 2009, Environ. Sci. Technol., 43, 4715–4721. [5] Manninen et al., 2009, Boreal Environ. Res., 14, 591-605. [6] Manninen et al., 2010, Atmos. Chem. Phys., 10, 7907-7927. [7] Kulmala, M. et al., 2007, Science, 318: 89-92. [8] Gagné et al, 2010, Atmos. Chem. Phys., 10, 3743-3757. [9] Lehtipalo et al., 2009, Atmos. Chem. Phys., 9, 4177-4184. [10] Paasonen et al., 2010, Atmos. Chem. Phys., 10, 11223-1124. [11] Nieminen et al., 2011, Environ. Sci. Technol., 43, 4715–4721.
INTERCOMPARISON OF FOUR METHANE GAS ANALYSERS FOR EDDY
COVARIANCE FLUX MEASUREMENTS
Olli Peltola, Sami Haapanala, Ivan Mammarella, Janne Rinne, Timo Vesala
University of Helsinki, Finland
Methane fluxes were measured simultaneously with four gas analysers capable of measuring
gas concentration with high sampling frequency. The measurement system operated about six
months between March and August 2010. The aim of the campaign was to evaluate
functionality, data quality and overall performance of the gas analysers and to provide an
instrumentation recommendation for the European Research Infrastructure ICOS (Integrated
Carbon Observation System).
The participating gas analysers were TGA100A (Campbell Scientific Inc.), G1301-f (Picarro
Inc.), RMT-200 (Los Gatos Research Inc.) and LI-7700 (Li-Cor Inc.). Three first gas
analysers were closed-path and the last was a prototype of later commercialised open-path
methane gas analyser.
The gas analyser intercomparison was carried out in Siikaneva fen in southern Finland (61°
49.961'N, 24° 11.567'E, 160 m a.s.l). Siikaneva is a nutrient poor, i.e. oligotrophic, open fen.
The methane sources are quite uniformly distributed around the footprint area. Distance from
the study site to the tree line is in north and south directions about 200 meters and east and
west directions several hundred meters. Rinne et al. (2007) reported annual cycle of methane
flux in the study site. Winter time flux is around zero, after snow melt in the spring the flux
starts to rise peaking in early August and starts to decline in autumn. Thus the
intercomparison was performed during a period when the methane fluxes varied between near
zero to up to about 5 mg m-2
h-1
.
The preliminary results show great similarity between the instruments. Magnitude and
variation of measured methane flux are alike, in addition to similar methane concentration
values. Furthermore all the instruments seem to be able to capture methane flux related to
wide range of turbulent eddies.
References
[1] J. Rinne et al., 2007, Tellus B, 59(3), 449 - 457.
ACROSS‐SITE VARIABILITY OF SOIL ORGANIC CARBON TURNOVER
TIMES DERIVED FROM CHAMBER AND EDDY COVARIANCE BASED
MEASUREMENTS, AS AFFECTED BY CLIMATE AND VEGETATION
Myroslava Khomik(1), Markus Reichstein(1), Marion Schrumpf(1), Christian Beer(1),
Jorge Curiel Yuste(2), Ivan Janssens(3), Sebastiaan Luyssaert(4), Jens-Arne Subke(5),
Susan Trumbore(2), Thomas Wutzler(1)
(1) Max-Plank Institute for Biogeochemistry, Jena, Germany
(2) CREAF, Universitat Autònoma de Barcelona, Barcelona, Spain
(3) Department of Biology, University of Antwerp, Belgium
(4) Laboratoire des Sciences du Climat et de l'Environnemant (LSCE), France
(5) University of Stirling, School of Natural Sciences, Institute of Biological and
Environmental Sciences, Stirling, Scotland, UK
Corresponding author: [email protected]
Our understanding of climatic controls on the rate of soil organic carbon (SOC)
decomposition is still limited and greatly debated, especially the temperature sensitivity
of SOC decomposition. Some argue that SOC turnover time (TO) decreases
exponentially with increasing temperatures, while others disagree.
We undertook a study that used ecosystem carbon flux measurements (FLUXNET
LaThuile dataset: www.fluxdata.org) and global soil carbon stock estimates to investigate
across-site variability in TO in relation to climate and vegetation type.
Using these flux and stock measurements, together with some assumptions about steady
state conditions, we estimated TO for bulk soils across a selection of forested sites around
the globe. We then related our TO-estimates to mean annual temperature (MAT) and
total annual precipitation (TAP) of the respective sites.
We found that, overall, TO decreased exponentially with increasing MAT, in accordance
with past studies. This relationship was maintained even when the data was analyzed
under the combined effects of MAT and TAP. TO was also negatively correlated with
TAP, although not as strongly as with MAT. Turnover times at sites with low annual
precipitation and low mean annual temperatures were high (i.e. the rate of decomposition
was low). However, upon closer examination, we also found that this overall global
exponential relationship was largely driven by the difference in TO between sites located
in the boreal climate zone and sites from the other climates considered (i.e. tropical,
Mediterranean and temperate climate zones, combined). The range of computed TO
values in the boreal zone was statistically higher compared to the rest of the climatic
zones studied. Here we also elaborate on some of the possible reasons behind this
difference.
We also tested if the TO-MAT-TAP relationship differed between sites of different
foliage habits, distinguishing among evergreen needle-leaf and broadleaf deciduous
stands. We found no statistical differences in the relationship among the different
vegetation types.
Results from this study add to our understanding of the spatial variability of SOM
decomposition. The trends and relationships we obtained could also help to constrain
current models of global soil carbon dynamics.
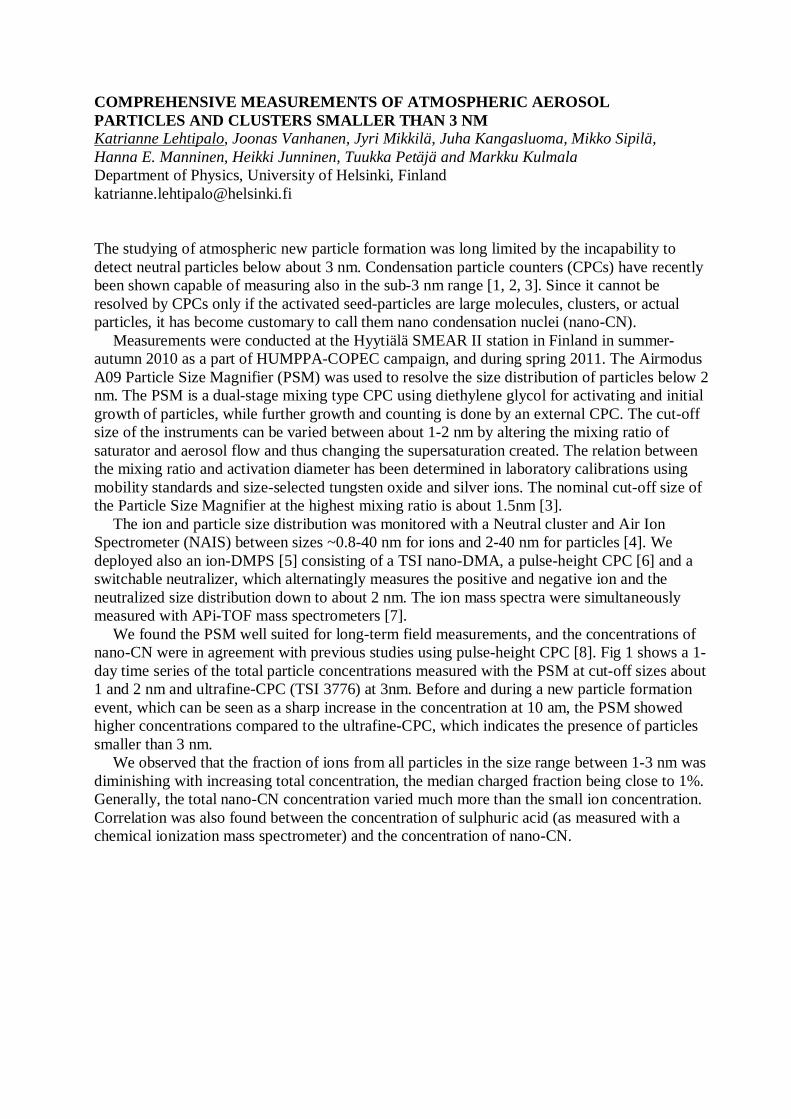
COMPREHENSIVE MEASUREMENTS OF ATMOSPHERIC AEROSOL PARTICLES AND CLUSTERS SMALLER THAN 3 NM Katrianne Lehtipalo, Joonas Vanhanen, Jyri Mikkilä, Juha Kangasluoma, Mikko Sipilä, Hanna E. Manninen, Heikki Junninen, Tuukka Petäjä and Markku Kulmala Department of Physics, University of Helsinki, Finland [email protected]
The studying of atmospheric new particle formation was long limited by the incapability to detect neutral particles below about 3 nm. Condensation particle counters (CPCs) have recently been shown capable of measuring also in the sub-3 nm range [1, 2, 3]. Since it cannot be resolved by CPCs only if the activated seed-particles are large molecules, clusters, or actual particles, it has become customary to call them nano condensation nuclei (nano-CN). Measurements were conducted at the Hyytiälä SMEAR II station in Finland in summer-autumn 2010 as a part of HUMPPA-COPEC campaign, and during spring 2011. The Airmodus A09 Particle Size Magnifier (PSM) was used to resolve the size distribution of particles below 2 nm. The PSM is a dual-stage mixing type CPC using diethylene glycol for activating and initial growth of particles, while further growth and counting is done by an external CPC. The cut-off size of the instruments can be varied between about 1-2 nm by altering the mixing ratio of saturator and aerosol flow and thus changing the supersaturation created. The relation between the mixing ratio and activation diameter has been determined in laboratory calibrations using mobility standards and size-selected tungsten oxide and silver ions. The nominal cut-off size of the Particle Size Magnifier at the highest mixing ratio is about 1.5nm [3]. The ion and particle size distribution was monitored with a Neutral cluster and Air Ion Spectrometer (NAIS) between sizes ~0.8-40 nm for ions and 2-40 nm for particles [4]. We deployed also an ion-DMPS [5] consisting of a TSI nano-DMA, a pulse-height CPC [6] and a switchable neutralizer, which alternatingly measures the positive and negative ion and the neutralized size distribution down to about 2 nm. The ion mass spectra were simultaneously measured with APi-TOF mass spectrometers [7]. We found the PSM well suited for long-term field measurements, and the concentrations of nano-CN were in agreement with previous studies using pulse-height CPC [8]. Fig 1 shows a 1-day time series of the total particle concentrations measured with the PSM at cut-off sizes about 1 and 2 nm and ultrafine-CPC (TSI 3776) at 3nm. Before and during a new particle formation event, which can be seen as a sharp increase in the concentration at 10 am, the PSM showed higher concentrations compared to the ultrafine-CPC, which indicates the presence of particles smaller than 3 nm. We observed that the fraction of ions from all particles in the size range between 1-3 nm was diminishing with increasing total concentration, the median charged fraction being close to 1%. Generally, the total nano-CN concentration varied much more than the small ion concentration. Correlation was also found between the concentration of sulphuric acid (as measured with a chemical ionization mass spectrometer) and the concentration of nano-CN.
Fig 1. Example of total particle concentrations in Hyytiälä on 31.3.2011 measured with the PSM at cut-off sizes ~1 nm and 2 nm, compared to TSI 3776 ultrafine-CPC at 3 nm cut-off size. [1] M. Sipilä et al., 2008, Atmos. Chem. Phys., 8, 4049-4060. [2] K. Iida et al., 2009, Aerosol Sci. Technol. 43, 81-96. [3] J. Vanhanen et al., 2011, Aerosol Sci. Technol., 45, 533-542. [4] S. Mirme et al., 2010, Atmos. Chem. Phys., 10, 437-451. [5] L. Laakso et al., 2007, Atmos. Chem. Phys., 7, 1333-1345. [6] M. Sipilä et al., 2009, Aerosol Sci. Technol., 43, 126-135. [7] H. Junninen et al., 2010, Atmos. Meas. Tech., 3, 1039-1053. [8] K. Lehtipalo et al., 2009, Atmos. Chem. Phys., 9, 4177-4184.
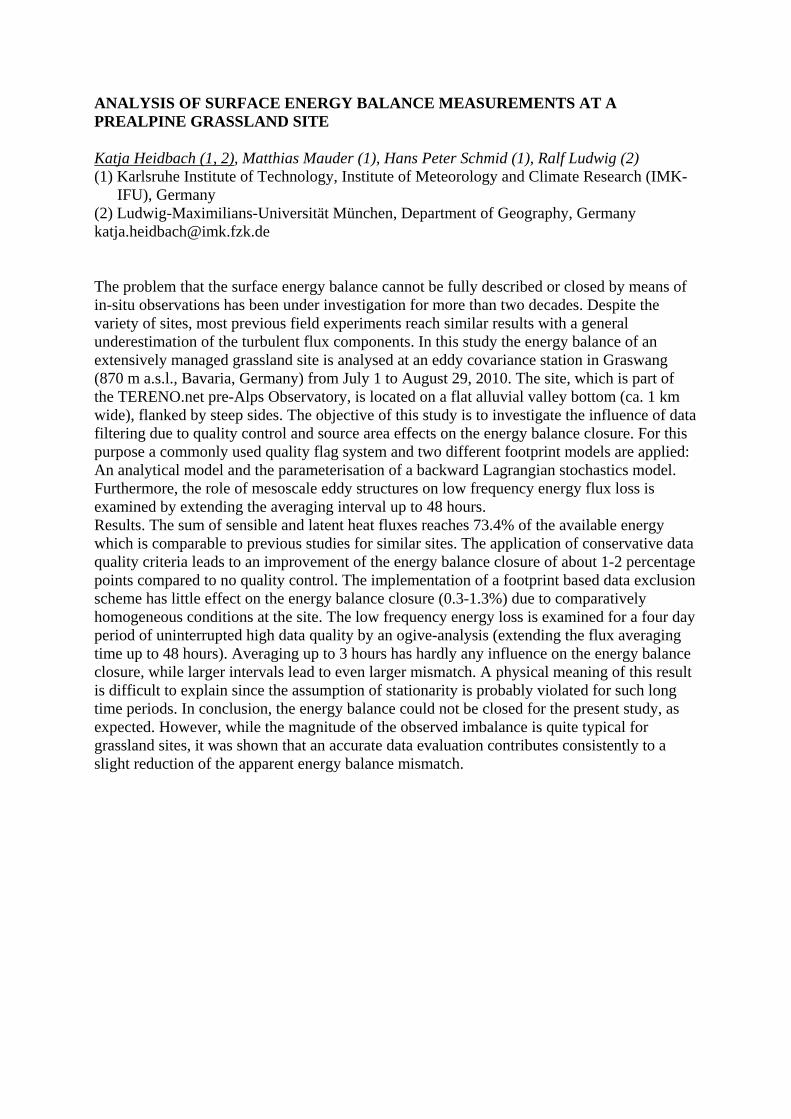
ANALYSIS OF SURFACE ENERGY BALANCE MEASUREMENTS AT A PREALPINE GRASSLAND SITE Katja Heidbach (1, 2), Matthias Mauder (1), Hans Peter Schmid (1), Ralf Ludwig (2) (1) Karlsruhe Institute of Technology, Institute of Meteorology and Climate Research (IMK-
IFU), Germany (2) Ludwig-Maximilians-Universität München, Department of Geography, Germany [email protected] The problem that the surface energy balance cannot be fully described or closed by means of in-situ observations has been under investigation for more than two decades. Despite the variety of sites, most previous field experiments reach similar results with a general underestimation of the turbulent flux components. In this study the energy balance of an extensively managed grassland site is analysed at an eddy covariance station in Graswang (870 m a.s.l., Bavaria, Germany) from July 1 to August 29, 2010. The site, which is part of the TERENO.net pre-Alps Observatory, is located on a flat alluvial valley bottom (ca. 1 km wide), flanked by steep sides. The objective of this study is to investigate the influence of data filtering due to quality control and source area effects on the energy balance closure. For this purpose a commonly used quality flag system and two different footprint models are applied: An analytical model and the parameterisation of a backward Lagrangian stochastics model. Furthermore, the role of mesoscale eddy structures on low frequency energy flux loss is examined by extending the averaging interval up to 48 hours. Results. The sum of sensible and latent heat fluxes reaches 73.4% of the available energy which is comparable to previous studies for similar sites. The application of conservative data quality criteria leads to an improvement of the energy balance closure of about 1-2 percentage points compared to no quality control. The implementation of a footprint based data exclusion scheme has little effect on the energy balance closure (0.3-1.3%) due to comparatively homogeneous conditions at the site. The low frequency energy loss is examined for a four day period of uninterrupted high data quality by an ogive-analysis (extending the flux averaging time up to 48 hours). Averaging up to 3 hours has hardly any influence on the energy balance closure, while larger intervals lead to even larger mismatch. A physical meaning of this result is difficult to explain since the assumption of stationarity is probably violated for such long time periods. In conclusion, the energy balance could not be closed for the present study, as expected. However, while the magnitude of the observed imbalance is quite typical for grassland sites, it was shown that an accurate data evaluation contributes consistently to a slight reduction of the apparent energy balance mismatch.
CALIBRATION AND FIRST FIELD MEASUREMENTS OF AEROSOL PARTICLES WITH AIRMODUS A20 CONDENSATION PARTICLE COUNTER
Joonas Vanhanen (1,2), Katrianne Lehtipalo (1,2), Jyri Mikkilä (1,2), Mikko Sipilä (2), Tuukka Petäjä (2), Markku Kulmala (2)[1] Airmodus Oy, Finland[2] Department of Physics, University of Helsinki, [email protected]
Condensation particle counters (CPCs) are the basis of modern aerosol instrumentation in sub-micrometer range. CPCs can be used both as stand-alone instruments for measuring the total particle number concentration, and as counters in different kind of applications such as differential mobility particle sizer (DMPS). A new laminar flow condensation particle counter, Airmodus A20, using butanol as condensing liquid, was constructed. The CPC operates with aerosol flow rate of 1 lpm, achieved with a critical orifice and an external pump. First field measurements with the Airmodus A20 were conducted in April 2011. The calibration of the CPC was done by using silver particles produced in a tube furnace and size selected by using a Hauke-type DMA. Nitrogen was used as carrier gas in the furnace. Sheath flow of the DMA was 20 LPM and the aerosol flow 2 LPM, which corresponds to a size resolution of 0.3nm. Calibration results are shown in the Fig. 1. The 50% cut-off diameter of the Airmodus A20 CPC for silver particles was 7.1 nm. Preliminary concentration calibrations conducted by using 20 nm silver particles showed that the single particle counting capability of the Airmodus A20 reached at least to 20 000 #/cc.
Fig 1. Calibration of the Airmodus A20 condensation particle counter with size-selected silver ions. The resulting 50%-cut off diameter of the instrument is ~7 nm.
First field measurements were conducted at SMEAR II station [1] in Hyytiälä, Southern Finland (61o51´N, 24o17´E, 170 asl) between April 7th and 14th, 2011. The data was compared to the TSI 3022 CPC with a cut-off size of 7nm. Fig 2. shows a time series of the total particle number concentration measured with the two instruments. Two distinctive new particle formation events were occurring during the measuring period (on 9th and 10th of April). A slight difference in
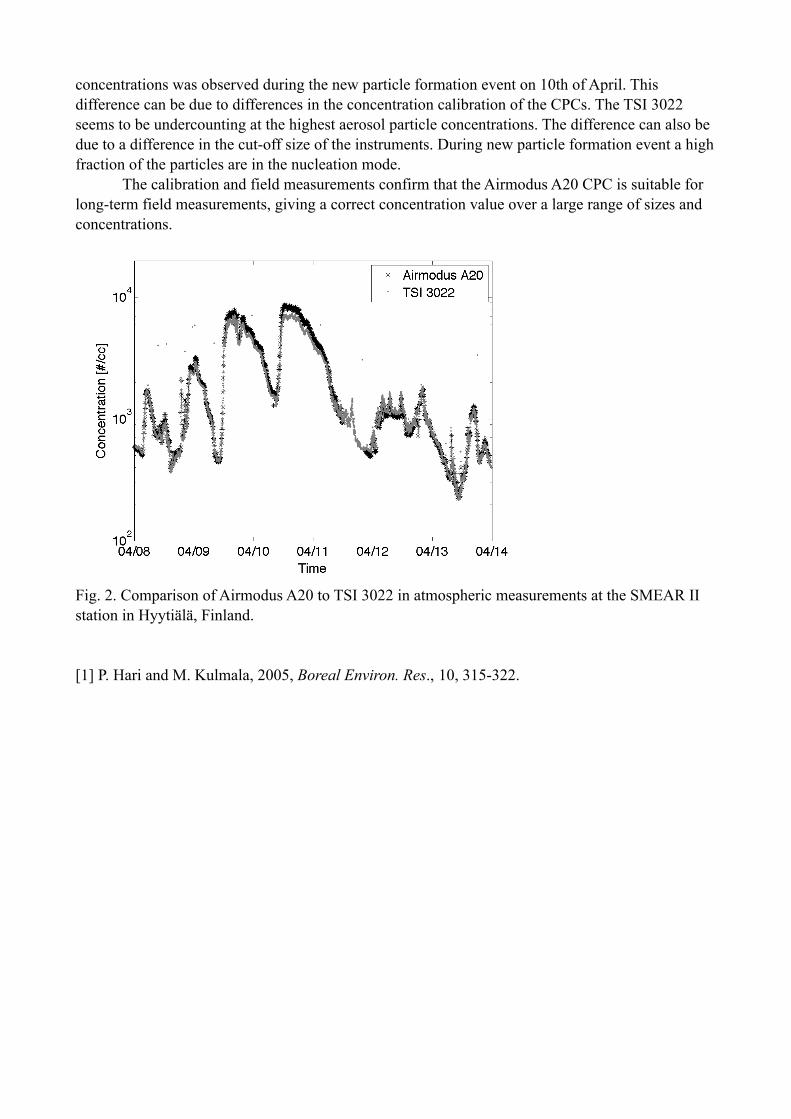
concentrations was observed during the new particle formation event on 10th of April. This difference can be due to differences in the concentration calibration of the CPCs. The TSI 3022 seems to be undercounting at the highest aerosol particle concentrations. The difference can also be due to a difference in the cut-off size of the instruments. During new particle formation event a high fraction of the particles are in the nucleation mode. The calibration and field measurements confirm that the Airmodus A20 CPC is suitable for long-term field measurements, giving a correct concentration value over a large range of sizes and concentrations.
Fig. 2. Comparison of Airmodus A20 to TSI 3022 in atmospheric measurements at the SMEAR II station in Hyytiälä, Finland.
[1] P. Hari and M. Kulmala, 2005, Boreal Environ. Res., 10, 315-322.
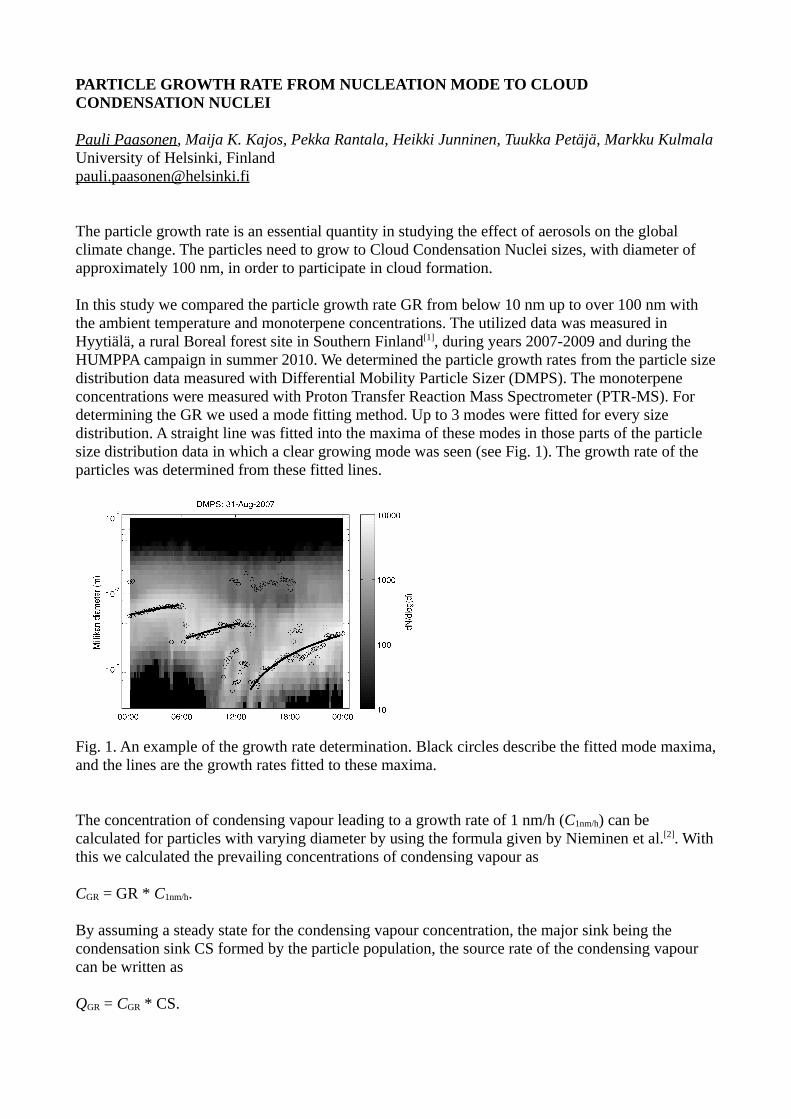
PARTICLE GROWTH RATE FROM NUCLEATION MODE TO CLOUD CONDENSATION NUCLEI
Pauli Paasonen, Maija K. Kajos, Pekka Rantala, Heikki Junninen, Tuukka Petäjä, Markku KulmalaUniversity of Helsinki, [email protected]
The particle growth rate is an essential quantity in studying the effect of aerosols on the global climate change. The particles need to grow to Cloud Condensation Nuclei sizes, with diameter of approximately 100 nm, in order to participate in cloud formation.
In this study we compared the particle growth rate GR from below 10 nm up to over 100 nm with the ambient temperature and monoterpene concentrations. The utilized data was measured in Hyytiälä, a rural Boreal forest site in Southern Finland[1], during years 2007-2009 and during the HUMPPA campaign in summer 2010. We determined the particle growth rates from the particle size distribution data measured with Differential Mobility Particle Sizer (DMPS). The monoterpene concentrations were measured with Proton Transfer Reaction Mass Spectrometer (PTR-MS). For determining the GR we used a mode fitting method. Up to 3 modes were fitted for every size distribution. A straight line was fitted into the maxima of these modes in those parts of the particle size distribution data in which a clear growing mode was seen (see Fig. 1). The growth rate of the particles was determined from these fitted lines.
Fig. 1. An example of the growth rate determination. Black circles describe the fitted mode maxima, and the lines are the growth rates fitted to these maxima.
The concentration of condensing vapour leading to a growth rate of 1 nm/h (C1nm/h) can be calculated for particles with varying diameter by using the formula given by Nieminen et al.[2]. With this we calculated the prevailing concentrations of condensing vapour as
CGR = GR * C1nm/h.
By assuming a steady state for the condensing vapour concentration, the major sink being the condensation sink CS formed by the particle population, the source rate of the condensing vapour can be written as
QGR = CGR * CS.

The temperature explains almost 30 % of the variation in QGR throughout the year, both during day and night (Fig. 2a), when those data points in which the RH was over 90 % were left out. In the very humid data points the correlation between QGR and T was completely lost and the QGR values were clearly higher than in dryer data points with same temperature. This might be due to a significant difference in the initial wet diameter and the observed dry diameter of these particles.
a) b)Fig. 2. The source rate of condensing vapour as a function of a) temperature and b) monoterpene concentration. Correlation coefficients R2 and p-values describing the probability of coincidental correlation are shown in the figure.
The exponential dependency on temperature is typical for biogenic emissions, and especially the oxidized monoterpenes have been suggested to be responsible for a large portion of the particle growth[3]. QGR is depicted as a function of measured monoterpene concentration [MT] in Fig. 2b. An increase of two orders of magnitude in monoterpene concentration causes approximately equal increase in QGR. However, during the HUMPPA campaign [MT] was lower than during the previous years with the corresponding temperatures. This uplifts the HUMPPA data points in Fig. 2b.
As stated earlier, monoterpenes do not condense on particles without being oxidized. However, the correlation between the ratio QGR/[MT] and ozone concentration was week (R2=0.08), even though it was clear (p=3*10-31).
According to our analysis the growth rate of particles with diameters between 10 and 100 nm in Boreal forest is strongly dependent on monoterpene concentration, and further on temperature.
References:[1] P. Hari and M. Kulmala, 2005, Boreal Env. Res., 10, 315-322.[2] T. Nieminen et al., 2009, Atmos. Chem. Phys., 10, 9773-9779.[3] P. Tunved et al., 2006, Science, 312, 261-263.
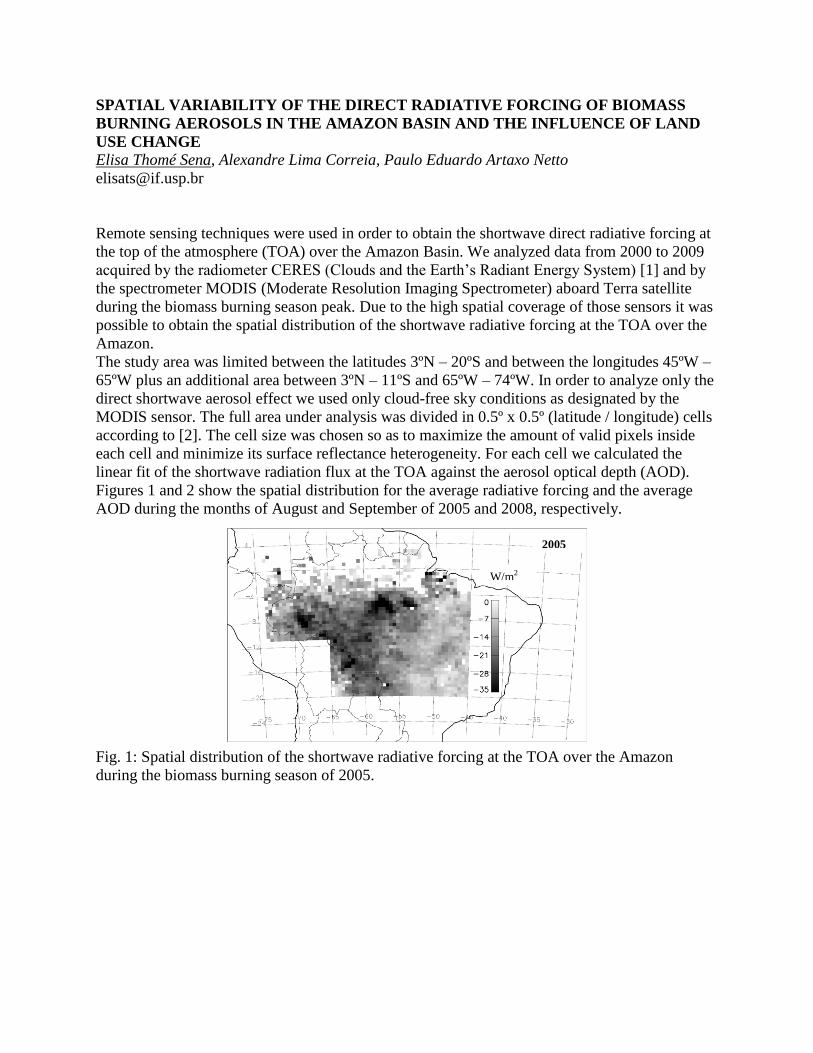
SPATIAL VARIABILITY OF THE DIRECT RADIATIVE FORCING OF BIOMASS
BURNING AEROSOLS IN THE AMAZON BASIN AND THE INFLUENCE OF LAND
USE CHANGE
Elisa Thomé Sena, Alexandre Lima Correia, Paulo Eduardo Artaxo Netto
Remote sensing techniques were used in order to obtain the shortwave direct radiative forcing at
the top of the atmosphere (TOA) over the Amazon Basin. We analyzed data from 2000 to 2009
acquired by the radiometer CERES (Clouds and the Earth’s Radiant Energy System) [1] and by
the spectrometer MODIS (Moderate Resolution Imaging Spectrometer) aboard Terra satellite
during the biomass burning season peak. Due to the high spatial coverage of those sensors it was
possible to obtain the spatial distribution of the shortwave radiative forcing at the TOA over the
Amazon.
The study area was limited between the latitudes 3ºN – 20ºS and between the longitudes 45ºW –
65ºW plus an additional area between 3ºN – 11ºS and 65ºW – 74ºW. In order to analyze only the
direct shortwave aerosol effect we used only cloud-free sky conditions as designated by the
MODIS sensor. The full area under analysis was divided in 0.5º x 0.5º (latitude / longitude) cells
according to [2]. The cell size was chosen so as to maximize the amount of valid pixels inside
each cell and minimize its surface reflectance heterogeneity. For each cell we calculated the
linear fit of the shortwave radiation flux at the TOA against the aerosol optical depth (AOD).
Figures 1 and 2 show the spatial distribution for the average radiative forcing and the average
AOD during the months of August and September of 2005 and 2008, respectively.
Fig. 1: Spatial distribution of the shortwave radiative forcing at the TOA over the Amazon
during the biomass burning season of 2005.
W/m2
2005
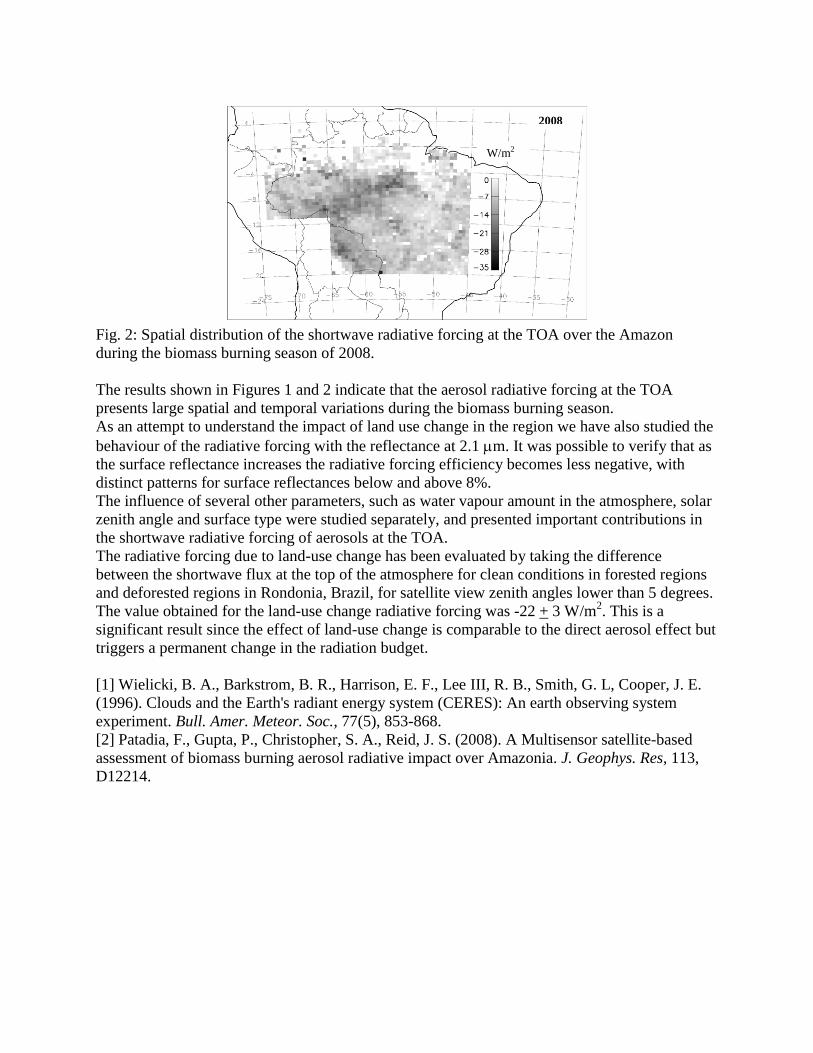
Fig. 2: Spatial distribution of the shortwave radiative forcing at the TOA over the Amazon
during the biomass burning season of 2008.
The results shown in Figures 1 and 2 indicate that the aerosol radiative forcing at the TOA
presents large spatial and temporal variations during the biomass burning season.
As an attempt to understand the impact of land use change in the region we have also studied the
behaviour of the radiative forcing with the reflectance at 2.1 m. It was possible to verify that as
the surface reflectance increases the radiative forcing efficiency becomes less negative, with
distinct patterns for surface reflectances below and above 8%.
The influence of several other parameters, such as water vapour amount in the atmosphere, solar
zenith angle and surface type were studied separately, and presented important contributions in
the shortwave radiative forcing of aerosols at the TOA.
The radiative forcing due to land-use change has been evaluated by taking the difference
between the shortwave flux at the top of the atmosphere for clean conditions in forested regions
and deforested regions in Rondonia, Brazil, for satellite view zenith angles lower than 5 degrees.
The value obtained for the land-use change radiative forcing was -22 + 3 W/m2. This is a
significant result since the effect of land-use change is comparable to the direct aerosol effect but
triggers a permanent change in the radiation budget.
[1] Wielicki, B. A., Barkstrom, B. R., Harrison, E. F., Lee III, R. B., Smith, G. L, Cooper, J. E.
(1996). Clouds and the Earth's radiant energy system (CERES): An earth observing system
experiment. Bull. Amer. Meteor. Soc., 77(5), 853-868.
[2] Patadia, F., Gupta, P., Christopher, S. A., Reid, J. S. (2008). A Multisensor satellite-based
assessment of biomass burning aerosol radiative impact over Amazonia. J. Geophys. Res, 113,
D12214.
W/m2
2008
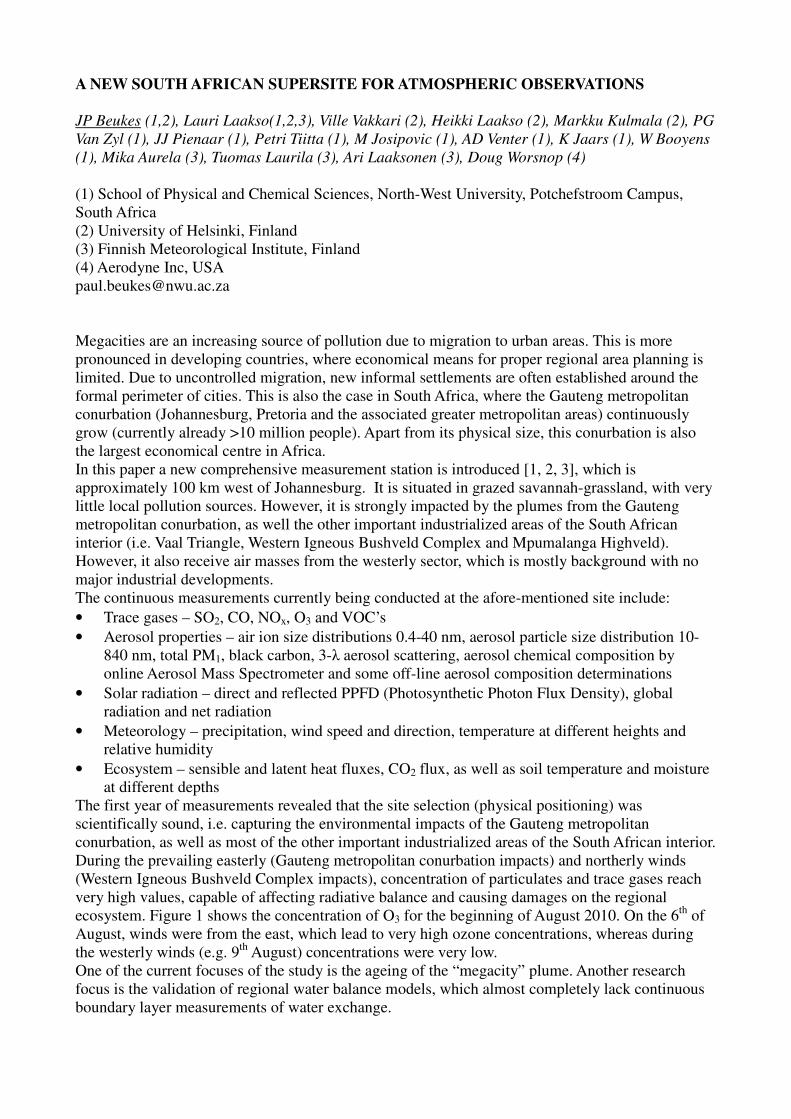
A NEW SOUTH AFRICAN SUPERSITE FOR ATMOSPHERIC OBSERVATIONS
JP Beukes (1,2), Lauri Laakso(1,2,3), Ville Vakkari (2), Heikki Laakso (2), Markku Kulmala (2), PG
Van Zyl (1), JJ Pienaar (1), Petri Tiitta (1), M Josipovic (1), AD Venter (1), K Jaars (1), W Booyens
(1), Mika Aurela (3), Tuomas Laurila (3), Ari Laaksonen (3), Doug Worsnop (4)
(1) School of Physical and Chemical Sciences, North-West University, Potchefstroom Campus,
South Africa
(2) University of Helsinki, Finland
(3) Finnish Meteorological Institute, Finland
(4) Aerodyne Inc, USA
Megacities are an increasing source of pollution due to migration to urban areas. This is more
pronounced in developing countries, where economical means for proper regional area planning is
limited. Due to uncontrolled migration, new informal settlements are often established around the
formal perimeter of cities. This is also the case in South Africa, where the Gauteng metropolitan
conurbation (Johannesburg, Pretoria and the associated greater metropolitan areas) continuously
grow (currently already >10 million people). Apart from its physical size, this conurbation is also
the largest economical centre in Africa.
In this paper a new comprehensive measurement station is introduced [1, 2, 3], which is
approximately 100 km west of Johannesburg. It is situated in grazed savannah-grassland, with very
little local pollution sources. However, it is strongly impacted by the plumes from the Gauteng
metropolitan conurbation, as well the other important industrialized areas of the South African
interior (i.e. Vaal Triangle, Western Igneous Bushveld Complex and Mpumalanga Highveld).
However, it also receive air masses from the westerly sector, which is mostly background with no
major industrial developments.
The continuous measurements currently being conducted at the afore-mentioned site include:
• Trace gases – SO2, CO, NOx, O3 and VOC’s
• Aerosol properties – air ion size distributions 0.4-40 nm, aerosol particle size distribution 10-
840 nm, total PM1, black carbon, 3-λ aerosol scattering, aerosol chemical composition by
online Aerosol Mass Spectrometer and some off-line aerosol composition determinations
• Solar radiation – direct and reflected PPFD (Photosynthetic Photon Flux Density), global
radiation and net radiation
• Meteorology – precipitation, wind speed and direction, temperature at different heights and
relative humidity
• Ecosystem – sensible and latent heat fluxes, CO2 flux, as well as soil temperature and moisture
at different depths
The first year of measurements revealed that the site selection (physical positioning) was
scientifically sound, i.e. capturing the environmental impacts of the Gauteng metropolitan
conurbation, as well as most of the other important industrialized areas of the South African interior.
During the prevailing easterly (Gauteng metropolitan conurbation impacts) and northerly winds
(Western Igneous Bushveld Complex impacts), concentration of particulates and trace gases reach
very high values, capable of affecting radiative balance and causing damages on the regional
ecosystem. Figure 1 shows the concentration of O3 for the beginning of August 2010. On the 6th
of
August, winds were from the east, which lead to very high ozone concentrations, whereas during
the westerly winds (e.g. 9th
August) concentrations were very low.
One of the current focuses of the study is the ageing of the “megacity” plume. Another research
focus is the validation of regional water balance models, which almost completely lack continuous
boundary layer measurements of water exchange.
References
[1] L. Laakso et al., 2008, Atmos. Chem. Phys., 8, 4823.
[2] V. Vakkari et al., 2011, Atmos. Chem. Phys., 11, 3333.
[3] www.welgegund.org, cited 13 April 2011
Fig 1. Ozone concentrations at the new measurement site in the beginning of August 2010
EFFECT OF INCREASED SOIL TEMPERATURE ON CO2 EXCHANGE AND NET BIOMASS ACCUMULATION IN PICEA ABIES, PINUS SYLVESTRIS AND BETULA PENDULA
Jukka Pumpanen (1), Jussi Heinonsalo (2), Terhi Rasilo (1) and Hannu Ilvesniemi (3)
(1) Department of Forest Sciences, PO Box 27, FI-00014, University of Helsinki, Finland. (2) Viikki Biocenter, Department of Food and Environmental Sciences, Faculty of Agriculture and Forestry, PO Box 56, FI-00014 University of Helsinki, Finland. (3) Finnish Forest Research Institute, Vantaa Research Station, PO Box 18, FI-01301 Vantaa, Finland. E-mail address of the corresponding author: [email protected] The aim of this study was to investigate in a microcosm experiment the effect of soil temperature on CO2 exchange and carbon allocation pattern of Pinus sylvestris, Picea abies and Betula pendula seedlings and on the species composition of associated ectomycorrhizal (ECM) fungi. We studied the effect of soil temperature on carbon balance of soil column where the tree roots were growing in humus. We measured soil respiration, needle or leaf photosynthesis and biomass carbon allocation pattern of the seedlings in controlled temperature, moisture and light conditions and determined the species composition of associated ectomycorrhizal fungal species. We hypothesized that high soil temperature affects the photosynthesis of the plant by increasing the belowground carbon sink according to the earlier presented hypothesis e.g. by Körner [1] and this mechanism is related to the root associated ECM biomass and ECM species composition. We also hypothesized that the belowground carbon sink strength depends on the ECM species and could be seen in the carbon allocation pattern of different tree and ECM species. The soils used in this study were collected from Hyytiälä Forestry Field Station in southern Finland (61° 84’ N, 24° 26’ E) from individual stands dominated by P. sylvestris or B. pendula and P. abies. The soil was sieved through a 4 mm mesh and applied in thin microcosms consisting of separate root and shoot compartments allowing separate measurements of CO2 exchange of belowground and aboveground parts. The seedlings (n=15) were grown at 7 11.5 °C, 12 16 °C and 16 22 °C soil temperatures. During the growth period microcosms were placed into growth chambers (300x300x400 mm with transparent lids) equipped with a cooling system maintaining soil temperatures described above. The soil part of the microcosms was covered with opaque white polyethylene lids to protect the root system from the light and isolating the root system from the aboveground part. The isolation was also needed for controlling the belowground part temperature. Seedlings were exposed to a day/night photoperiod of 19/5 h and photon irradiance was 170 300 µmol m-2 s–1 during the day period. Microcosms were watered three times a week with distilled water spray to maintain sufficient soil moisture. The above and below ground CO2 exchange was measured at the end of the 7 month growth period using the gas exchange laboratory system described in Pumpanen et al. [2]. The biomass of the seedlings was harvested in the end of the experiment and separated to following compartments: needles, stems, roots and ectomycorrhizal root tips. For ECM analyses, one ectomycorrhizal root tip per ten randomly selected root pieces was taken, pooled and used for DGGE analysis in order to identify different species and their occurrence in the samples as described in Heinonsalo et al. [3]. Net photosynthesis and shoot and root respiration generally increased along with increasing temperature. However, the temperature did not affect significantly net biomass accumulation, suggesting higher turnover rate of assimilated carbon at high soil temperatures. Ectomycorrhizal species composition and mass did not show correlation with soil temperature and below ground carbon sink. Our results suggest that P. sylvestris benefits from warmer soil temperature, since its biomass accumulation seemed to be higher in the warmest soil temperature especially in the belowground. References: [1] C. Körner, 2003, Journal of Ecology, 9, 4-17. [2] J.S. Pumpanen et al. 2009. Carbon balance and allocation of assimilated CO2 in Scots pine, Norway spruce and Silver birch seedlings determined with gas exchange measurements and 14C pulse labelling in laboratory conditions. Trees-Structure and Function 23, 611-621. [3] J. Heinonsalo et al. 2010. Carbon partitioning in ectomycorrhizal Scots pine seedlings. Soil Biol. & Biochem. 42,9, 1614-1623.
CARBON DIOXIDE, METHANE AND NITROUS OXIDE FLUXES IN MOUNTAIN GRASSLANDS DIFFERING IN LAND USE Thomas Ladreiter-Knauss (1), Michael Schmitt (1), Klaus Butterbach-Bahl (2), Verena Gruber (1), Roland Hasibeder (1), Eric Walter (1), Michael Bahn (1) (1) Institute of Ecology, University of Innsbruck, Austria (2) Institute for Meteorology and Climate Research, Atmospheric Environmental Research (IMK-IFU), Karlsruhe Institute of Technology, Germany [email protected] Grassland covers about 20% of the European terrestrial surface and is being strongly affected by changes in management and land use. Effects of such changes on the greenhouse gas (GHG) balance have so far not been well documented. As contribution to the EU-project GHG Europe we are studying the net ecosystem exchange (NEE) of carbon dioxide (CO2), methane (CH4) and nitrous oxide (N2O) on a mountain meadow, an adjacent pasture and an abandoned grassland at 1820-1970m a.s.l. in the Austrian Central Alps. The CO2 balance is estimated from chamber measurements of NEE, which have been made episodically over almost a decade [1] and from 2011 will be monitored continuously using newly developed autochambers. Winter fluxes of CO2, which are primarily due to soil respiration underneath the snowpack, are estimated using profiles of permanently operating solid state CO2 sensors in conjunction with a validated diffusion model [2,3]. First results suggest that decreasing management intensity decreases the net ecosystem exchange of CO2 and its component fluxes, which is explained by differences in leaf area index (LAI), biomass and leaf-area-independent changes that were likely related to photosynthetic physiology [1]. While gross primary productivity (GPP) and ecosystem respiration (R) were found to be generally closely coupled during most of the growing season, GPP was more immediately and strongly affected by land management (mowing, grazing) and season [1]. CH4 and N2O flux measurements started in 2011, including weekly chamber measurements, and higher time resolution observations of hot-moments during and after freeze-thaw cycles [4] and fertilization events. We expect a small net CH4 -uptake at all sites irrespective of land use intensity, and hypothesize that annual N2O efflux decreases with decreasing land use intensity. Our preliminary results suggests that management and growing season length, as well as their possible future changes, may play an important role for the greenhouse gas balance of mountain grassland. References [1] M. Schmitt, M. Bahn, G. Wohlfahrt, U. Tappeiner, and a Cernusca, 2010, Biogeosciences, 7, 2297- 2309. [2] P. Moldrup, T. Olesen, S. Yoshikawa, T. Komatsu, and D.E. Rolston, 2004, Soil Sci. Soc. Am. J., 68, 750-759. [3] R. Vargas, D.D. Baldocchi, M.F. Allen, M. Bahn, T.A. Black, S.L. Collins, J.C. Yuste, T. Hirano, R.S. Jassal, J. Pumpanen, and J. Tang, 2010, Ecol. appl., 20, 1569-1582. [4] B. Wolf, X. Zheng, N. Brüggemann, W. Chen, M. Dannenmann, X. Han, M. a Sutton, H. Wu, Z. Yao, and K. Butterbach-Bahl, 2010, Nature, 464, 881-884.
IMPACT OF THE INUNDATED AREAS ON THE DEEP CONVECTION AT CONTINENTAL SCALE FROM SATELLITE OBSERVATIONS AND MODELING EXPERIMENTS C. Prigent (1), N. Rochetin (2), F. Aires (1-3), E. Defer (1), J.-Y. Grandpeix (2), C. Jimenez (1), F. Papa (4) (1) CNRS, Laboratoire d’Etudes du Rayonnement et de la Matière en Astrophysique, Observatoire de Paris, France. (2) Laboratoire de Météorologie Dynamique / IPSL / CNRS, Université de Paris VI/Jussieu, France. (3) Estellus, France (4) Laboratoire d’Etude en Géophysique et Océanographie, IRD, Toulouse, France. Recent studies already showed the effect of inundated areas on precipitation at a local scale [1]. This study analyzes the effect of wetlands on the convection, at continental scales, using satellite observations. Different processes can generate inundation: it can be related to local precipitation as well as to rainfall or snow-melt upstream. In regions where convective precipitation generates local inundations, such as in monsoon regimes in the Ganges basin or in South East China, the feedback of the wetland on the convection is difficult to separate from the direct effect of the convective precipitation on the inundation. The key issue in this analysis is thus to disentangle the direct impact of the convection on the wetland through precipitation, from the impact of the wetland on the convection. By carefully analyzing the time variation of the convection with respect to the inundation dynamics, at seasonal and diurnal scales, we evidence the effect of inundation on the convection. Three data sets are jointly analyzed for three years (1998-2000), over the Tropical regions.
o A global satellite-derived surface water extent [2-4] Monthly mean wetland extent for 15 years (1993-2007) for the globe at a 0.25°×0.25° spatial resolution (equal area grid) is now available. It has been used in several studies, for hydrological model evaluation or for methane related issues.
o Deep convective activity as described from microwave scattering over ice clouds at 85GHz measured by the Tropical Rainfall Measuring Mission (TRMM) Microwave Instrument (TMI). Several studies characterized the convective activity from passive microwave observations around 85 GHz [5-8]. The lower the brightness temperatures at 85 GHz, the larger the ice scattering effect, the stronger the convection.
o The monthly mean Global Precipitation Products (GPCP). It provides the distribution of precipitation around the globe over many years, from merged rain gauge measurements and infrared and microwave satellite data [9].
In parallel, the physical interaction between inundation and deep convection is analyzed, using the Single Column Model (SCM) extracted from the Laboratoire de Météorologie Dynamique (LMD)’s Global Climate Model (GCM) (LMDZ4) [10]. The SCM is used in an ideal case of radiative convective equilibrium in order to better understand the role of surface water on the convection in regions where large scale moisture transport is limited.
Although many other effects contribute to the variability in the convection (e.g., large scale circulation, weather regimes), careful examination of the seasonal and diurnal variations of the satellite-derived information makes it possible to observe two distinct regimes. In regions where the
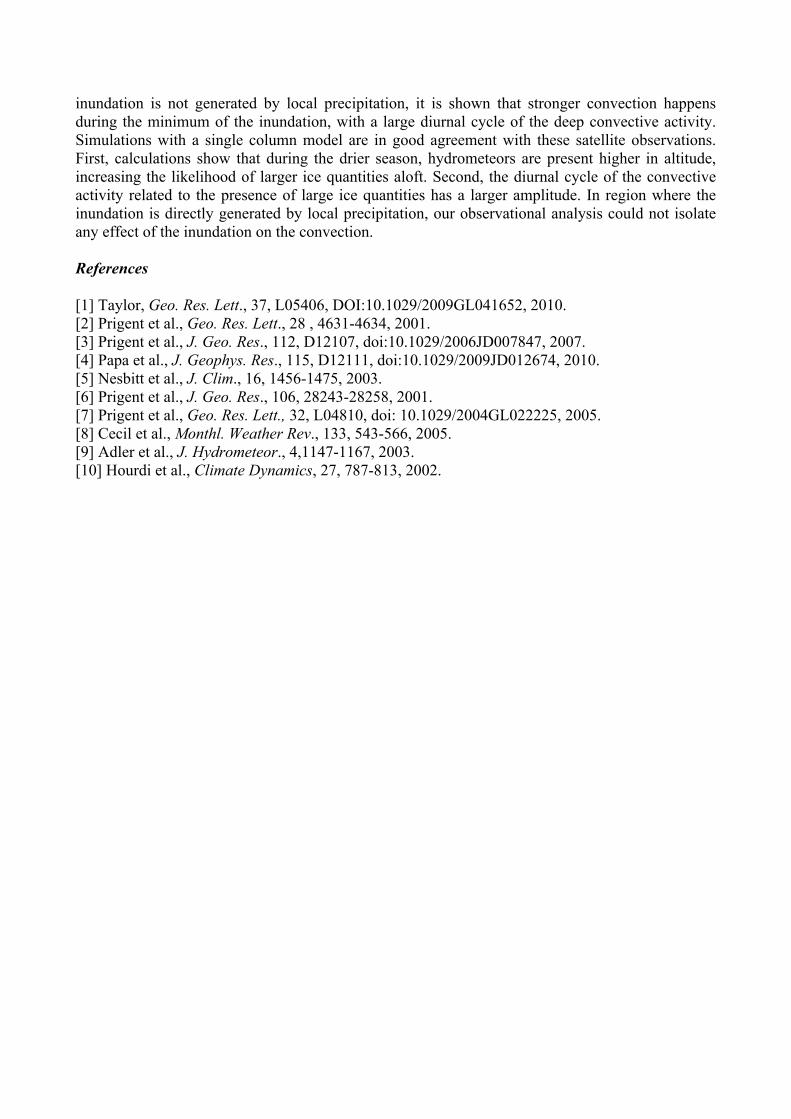
inundation is not generated by local precipitation, it is shown that stronger convection happens during the minimum of the inundation, with a large diurnal cycle of the deep convective activity. Simulations with a single column model are in good agreement with these satellite observations. First, calculations show that during the drier season, hydrometeors are present higher in altitude, increasing the likelihood of larger ice quantities aloft. Second, the diurnal cycle of the convective activity related to the presence of large ice quantities has a larger amplitude. In region where the inundation is directly generated by local precipitation, our observational analysis could not isolate any effect of the inundation on the convection. References [1] Taylor, Geo. Res. Lett., 37, L05406, DOI:10.1029/2009GL041652, 2010. [2] Prigent et al., Geo. Res. Lett., 28 , 4631-4634, 2001. [3] Prigent et al., J. Geo. Res., 112, D12107, doi:10.1029/2006JD007847, 2007. [4] Papa et al., J. Geophys. Res., 115, D12111, doi:10.1029/2009JD012674, 2010. [5] Nesbitt et al., J. Clim., 16, 1456-1475, 2003. [6] Prigent et al., J. Geo. Res., 106, 28243-28258, 2001. [7] Prigent et al., Geo. Res. Lett., 32, L04810, doi: 10.1029/2004GL022225, 2005. [8] Cecil et al., Monthl. Weather Rev., 133, 543-566, 2005. [9] Adler et al., J. Hydrometeor., 4,1147-1167, 2003. [10] Hourdi et al., Climate Dynamics, 27, 787-813, 2002.
NEAR SURFACE PROFILES OF HONO, NOx, O3 AND THEIR RELATION TO SURFACE WETNESS
Matthias Sörgel, Andreas Held University of Bayreuth, Junior Professorship in Atmospheric Chemistry, Bayreuth, Germany [email protected] The photolysis of HONO is an important OH radical source in the lower troposphere and thus crucial for the determination of the oxidation potential of the atmosphere. Although thirty years of research brought up several possible pathways for HONO formation, the exact formation mechanisms remain unclear. Contrastingly, the heterogeneous nature of the formation of HONO from its precursor NO2 is well established, especially during nighttime conditions. A relation of gas-phase HONO and relative humidity (RH) was found in many prior studies but so far no conclusive mechanism has been published. The most obvious relations of heterogeneously formed HONO and RH are due to changes in surface active sites by water adsorption or the solubility of HONO if liquid films are formed. In previous studies [1] we also observed a close relation of HONO mixing ratios and RH. Fig.1 exemplifies the diurnal evolution of HONO mixing ratios within and above a forest canopy and the influence of RH. There are several times when features in the HONO and RH time series coincide, e.g. just before sunrise, at noontime, and just before sunset. We typically found the highest HONO mixing ratios between 75 and 90 % RH which is the region where many salt mixtures show deliquescence. Therefore, we also expect a relation to leaf/surface conductivity which is increasing with deliquescence of salts at the surface. These interactions are likely to have an influence on HONO solubility or formation. Very close to the ground, where turbulent transport is less efficient, the influence of surface chemistry should become obvious.
Figure 1: Contour plot of relative humidity in a spruce forest (canopy height 21 m) overlayed by time series of HONO mixing ratios measured at 0.5 m (bottom trace) and 24.5 m (top trace) (from Sörgel et al., 2011).

These considerations triggered our interest in profiles of HONO and NOx close to the surface (height < 2 m) together with temperature and humidity profiles and direct surface wetness measurements. All these quantities are monitored to study the influence of RH on surface wetness and on HONO mixing ratios. The advantage of this approach is that besides chemical quantities also the physico-chemical properties of the surfaces as well as turbulent transport close to the surface are taken into account. Currently, we set up an automated near surface profiling system to study the formation and exchange of HONO with the surface. HONO is measured by a commercial long path absorption photometer (LOPAP, Quma Elektronik, Germany). The external sampling unit of the LOPAP is mounted on an “elevator” with programmable heights (0 to 1.7 m) and duration times. The inlets for NOx and ozone analysis are mounted next to the LOPAP inlet. Additionally, temperature and relative humidity profiles are measured. Leaf wetness is monitored by custom built sensors with leaf clamps measuring conductivity. The system will be employed in a field campaign (EGER-IOP3) at a rural forested site in the Fichtelgebirge mountains in southeast Germany in June/July 2011. The preliminary results from this campaign should provide first hints about these near surface processes. This information will also be used for reanalysis and interpretation of observations made during prior campaigns. [1] M. Sörgel et al., 2011, Atmos. Chem. Phys., 11, 841-855.
IN SITU AEROSOL ANALYSIS IN BOREAL FOREST ZONE FOR THE ALANIS-
AEROSOLS PROJECT
Niku Kivekäs (1), Veli-Matti Kerminen (1), Larisa Sogacheva (1), Hannele Korhonen (1),
Pasi Aalto (2), Markku Kulmala(2,) Gerrit de Leeuw (1,2)
(1) Finnish Meteorological Institute, Finland
(2) University of Helsinki, Finland
Atmosphere-land Interactions Study on Aerosols over the Boreal Forest (ALANIS-
Aerosols) is a feasibility study on the use of existing earth observation products for
discriminating between natural aerosols emitted by boreal Eurasian forests and long-range
transported anthropogenic aerosols. One of the problems in this area is the low aerosol
loading, producing aerosol optical depth (AOD) rarely exceeding 0.2 [1]. This is not
enough for identifying aerosol microphysical properties. The ALANIS-Aerosols project
involves combining and comparing the satellite based observations with modeling and with
in situ measurements of aerosol physical and optical properties.
The in situ analysis was done to dry particle size distribution data measured with
differential mobility particle sizer (DMPS) and aerodynamic particle sizer (APS) at
Hyytiälä, Finland. The analyzed measurement period was from year 2005 to 2010, and the
analyzed particle diameter range was 3 nm – 15 µm. All data were converted to 1-hour
averages before being analyzed. For the whole measurement period, particle number
concentration (N), particle surface area concentration (A) and particle volume
concentration (V) were calculated, as well as the corresponding size distributions. The total
volume concentration of an aerosol population can be used as a proxy for estimating the
scattering coefficient [2]. This can then be better compared with the satellite based AOD
data.
In the first stage twelve individual clean and polluted case days were selected from the
satellite based aerosol optical depth data. In situ particle size distribution data for the same
days were compared to the satellite AOD results, and the two agreed well in general, even
though there were also cases with clear disagreement. This could be due to the size
distribution measurements being conducted at the surface, and the satellite measuring the
AOD of the whole column.
Later on the in situ analysis will be extended to longer time periods, as well as to other
measurement stations in the boreal forest zone (mainly in Finland). Also ground based data
on aerosol optical properties in situ, as well as in the whole column, will be used. In
addition to this, the analyzed periods will also be modeled with a chemical transport model
GLOMAP [3].
References:
[1] V. Aaltonen, E. Rodriguez, S. Kazadzis, A. Arola, V. Amiridis, H. Lihavainen, and G.
de Leeuw, 2011, submitted to Atmospheric Research.
[2] A. Virkkula, J. Backman, P.P. Aalto, M. Hulkkonen, L. Riuttanen, T. Nieminen, M. dal
Maso, L. Sogacheva, G. de Leeuw. and M. Kulmala, 2010, Atmos. Chem. Phys. Discuss.,
10, 29997-30053.
[3] D. Spracklen, K. Pringle, K. Carslaw, M. Chipperfield, and G. Mann, 2005, Atmos.
Chem. Phys., 5, 2227-2252.
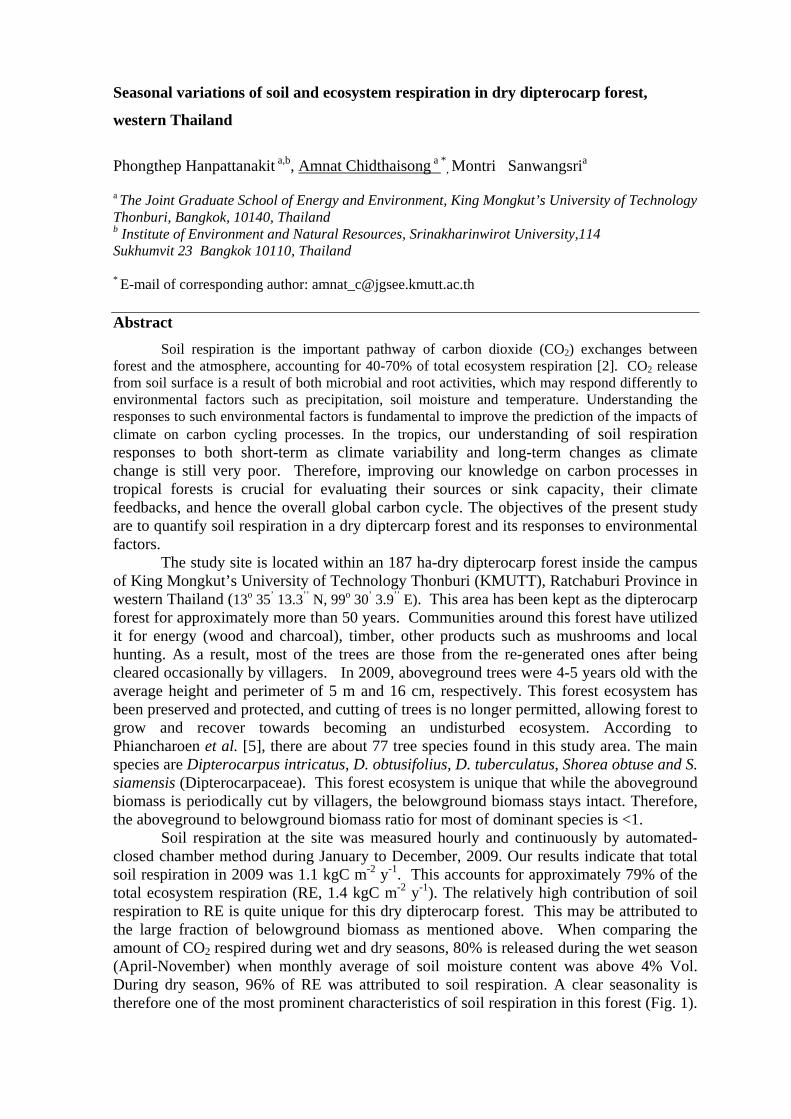
Seasonal variations of soil and ecosystem respiration in dry dipterocarp forest,
western Thailand
Phongthep Hanpattanakit a,b, Amnat Chidthaisong a *
, Montri Sanwangsria
a The Joint Graduate School of Energy and Environment, King Mongkut’s University of Technology Thonburi, Bangkok, 10140, Thailand b Institute of Environment and Natural Resources, Srinakharinwirot University,114 Sukhumvit 23 Bangkok 10110, Thailand
* E-mail of corresponding author: [email protected]
Abstract Soil respiration is the important pathway of carbon dioxide (CO2) exchanges between
forest and the atmosphere, accounting for 40-70% of total ecosystem respiration [2]. CO2 release from soil surface is a result of both microbial and root activities, which may respond differently to environmental factors such as precipitation, soil moisture and temperature. Understanding the responses to such environmental factors is fundamental to improve the prediction of the impacts of climate on carbon cycling processes. In the tropics, our understanding of soil respiration responses to both short-term as climate variability and long-term changes as climate change is still very poor. Therefore, improving our knowledge on carbon processes in tropical forests is crucial for evaluating their sources or sink capacity, their climate feedbacks, and hence the overall global carbon cycle. The objectives of the present study are to quantify soil respiration in a dry diptercarp forest and its responses to environmental factors.
The study site is located within an 187 ha-dry dipterocarp forest inside the campus of King Mongkut’s University of Technology Thonburi (KMUTT), Ratchaburi Province in western Thailand (13o 35’ 13.3’’ N, 99o 30’ 3.9’’ E). This area has been kept as the dipterocarp forest for approximately more than 50 years. Communities around this forest have utilized it for energy (wood and charcoal), timber, other products such as mushrooms and local hunting. As a result, most of the trees are those from the re-generated ones after being cleared occasionally by villagers. In 2009, aboveground trees were 4-5 years old with the average height and perimeter of 5 m and 16 cm, respectively. This forest ecosystem has been preserved and protected, and cutting of trees is no longer permitted, allowing forest to grow and recover towards becoming an undisturbed ecosystem. According to Phiancharoen et al. [5], there are about 77 tree species found in this study area. The main species are Dipterocarpus intricatus, D. obtusifolius, D. tuberculatus, Shorea obtuse and S. siamensis (Dipterocarpaceae). This forest ecosystem is unique that while the aboveground biomass is periodically cut by villagers, the belowground biomass stays intact. Therefore, the aboveground to belowground biomass ratio for most of dominant species is <1.
Soil respiration at the site was measured hourly and continuously by automated-closed chamber method during January to December, 2009. Our results indicate that total soil respiration in 2009 was 1.1 kgC m-2 y-1. This accounts for approximately 79% of the total ecosystem respiration (RE, 1.4 kgC m-2 y-1). The relatively high contribution of soil respiration to RE is quite unique for this dry dipterocarp forest. This may be attributed to the large fraction of belowground biomass as mentioned above. When comparing the amount of CO2 respired during wet and dry seasons, 80% is released during the wet season (April-November) when monthly average of soil moisture content was above 4% Vol. During dry season, 96% of RE was attributed to soil respiration. A clear seasonality is therefore one of the most prominent characteristics of soil respiration in this forest (Fig. 1).
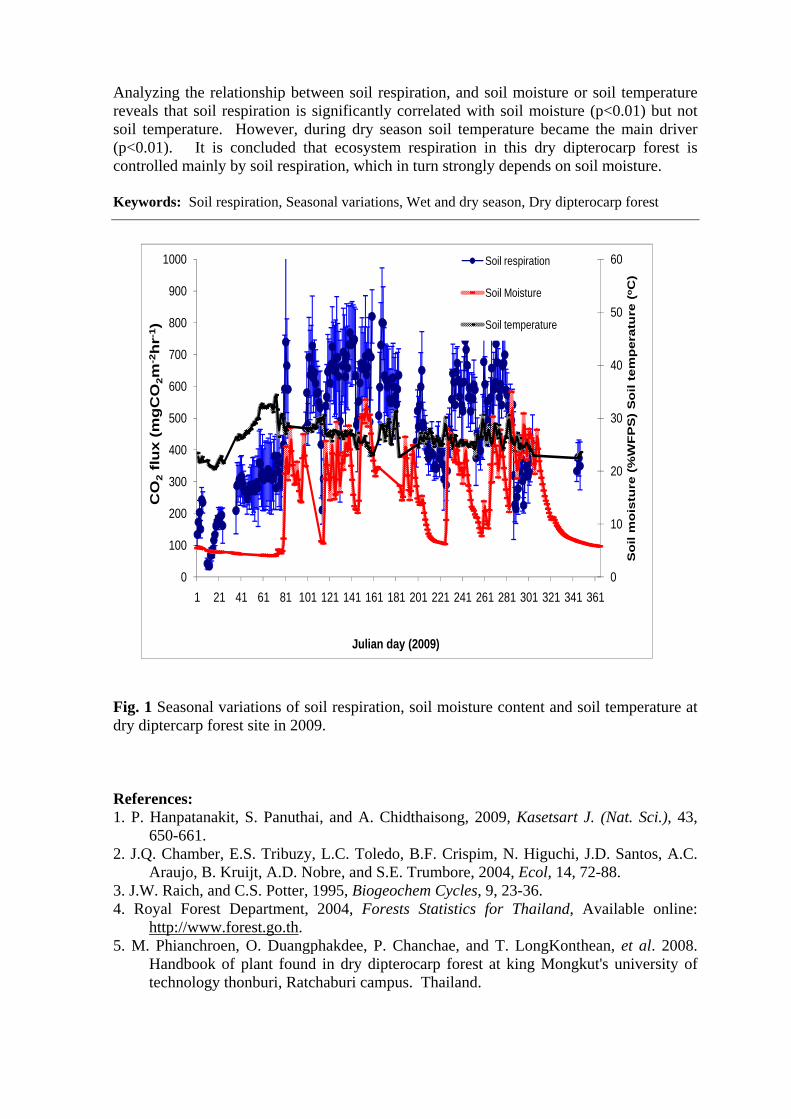
Analyzing the relationship between soil respiration, and soil moisture or soil temperature reveals that soil respiration is significantly correlated with soil moisture (p<0.01) but not soil temperature. However, during dry season soil temperature became the main driver (p<0.01). It is concluded that ecosystem respiration in this dry dipterocarp forest is controlled mainly by soil respiration, which in turn strongly depends on soil moisture. Keywords: Soil respiration, Seasonal variations, Wet and dry season, Dry dipterocarp forest
Fig. 1 Seasonal variations of soil respiration, soil moisture content and soil temperature at dry diptercarp forest site in 2009. References: 1. P. Hanpatanakit, S. Panuthai, and A. Chidthaisong, 2009, Kasetsart J. (Nat. Sci.), 43,
650-661. 2. J.Q. Chamber, E.S. Tribuzy, L.C. Toledo, B.F. Crispim, N. Higuchi, J.D. Santos, A.C.
Araujo, B. Kruijt, A.D. Nobre, and S.E. Trumbore, 2004, Ecol, 14, 72-88. 3. J.W. Raich, and C.S. Potter, 1995, Biogeochem Cycles, 9, 23-36. 4. Royal Forest Department, 2004, Forests Statistics for Thailand, Available online:
http://www.forest.go.th. 5. M. Phianchroen, O. Duangphakdee, P. Chanchae, and T. LongKonthean, et al. 2008.
Handbook of plant found in dry dipterocarp forest at king Mongkut's university of technology thonburi, Ratchaburi campus. Thailand.
0
10
20
30
40
50
60
0
100
200
300
400
500
600
700
800
900
1000
1 21 41 61 81 101 121 141 161 181 201 221 241 261 281 301 321 341 361
So
il m
ois
ture
(%
WF
PS
) S
oil
tem
per
atu
re (
oC
)
CO
2fl
ux
(mg
CO
2m-2
hr-
1 )
Julian day (2009)
Soil respiration
Soil Moisture
Soil temperature
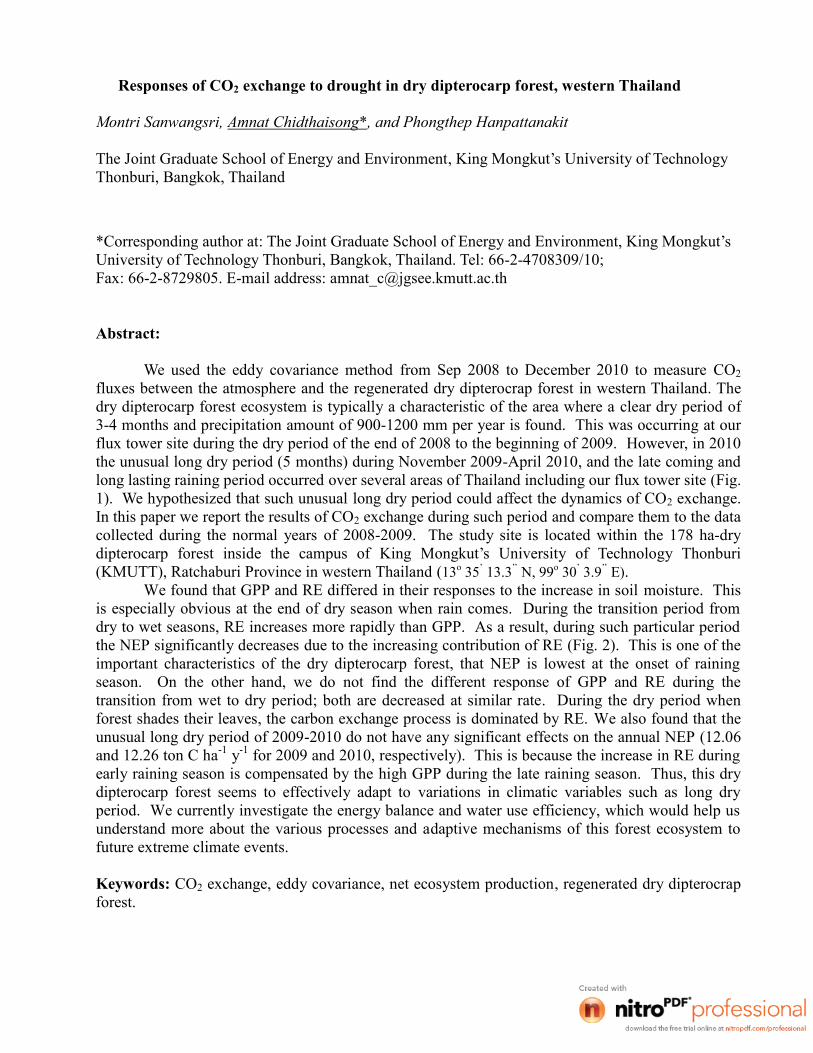
Responses of CO2 exchange to drought in dry dipterocarp forest, western Thailand
Montri Sanwangsri, Amnat Chidthaisong*, and Phongthep Hanpattanakit
The Joint Graduate School of Energy and Environment, King Mongkut’s University of TechnologyThonburi, Bangkok, Thailand
*Corresponding author at: The Joint Graduate School of Energy and Environment, King Mongkut’sUniversity of Technology Thonburi, Bangkok, Thailand. Tel: 66-2-4708309/10;Fax: 66-2-8729805. E-mail address: [email protected]
Abstract:
We used the eddy covariance method from Sep 2008 to December 2010 to measure CO2fluxes between the atmosphere and the regenerated dry dipterocrap forest in western Thailand. Thedry dipterocarp forest ecosystem is typically a characteristic of the area where a clear dry period of3-4 months and precipitation amount of 900-1200 mm per year is found. This was occurring at ourflux tower site during the dry period of the end of 2008 to the beginning of 2009. However, in 2010the unusual long dry period (5 months) during November 2009-April 2010, and the late coming andlong lasting raining period occurred over several areas of Thailand including our flux tower site (Fig.1). We hypothesized that such unusual long dry period could affect the dynamics of CO2 exchange.In this paper we report the results of CO2 exchange during such period and compare them to the datacollected during the normal years of 2008-2009. The study site is located within the 178 ha-drydipterocarp forest inside the campus of King Mongkut’s University of Technology Thonburi(KMUTT), Ratchaburi Province in western Thailand (13o 35’ 13.3’’ N, 99o 30’ 3.9’’ E).
We found that GPP and RE differed in their responses to the increase in soil moisture. Thisis especially obvious at the end of dry season when rain comes. During the transition period fromdry to wet seasons, RE increases more rapidly than GPP. As a result, during such particular periodthe NEP significantly decreases due to the increasing contribution of RE (Fig. 2). This is one of theimportant characteristics of the dry dipterocarp forest, that NEP is lowest at the onset of rainingseason. On the other hand, we do not find the different response of GPP and RE during thetransition from wet to dry period; both are decreased at similar rate. During the dry period whenforest shades their leaves, the carbon exchange process is dominated by RE. We also found that theunusual long dry period of 2009-2010 do not have any significant effects on the annual NEP (12.06and 12.26 ton C ha-1 y-1 for 2009 and 2010, respectively). This is because the increase in RE duringearly raining season is compensated by the high GPP during the late raining season. Thus, this drydipterocarp forest seems to effectively adapt to variations in climatic variables such as long dryperiod. We currently investigate the energy balance and water use efficiency, which would help usunderstand more about the various processes and adaptive mechanisms of this forest ecosystem tofuture extreme climate events.
Keywords: CO2 exchange, eddy covariance, net ecosystem production, regenerated dry dipterocrapforest.
Fig. 1 Rainfall distribution (available from May 2008 onwards) and soil water content patterns atdry dipterocarp forest flux site, western Thailand.
Fig. 2 Monthly patterns of NEP, GPP and RE during January 2009-December 2010 at drydipterocarp forest flux site, western Thailand.
0
100
200
300
400
500
600
700
0
2
4
6
8
10
12
14
16Se
p
Oc
t
No
v
De
c
Jan
Feb
Ma
r
Ap
r
Ma
y
Jun Jul
Au
g
Sep
Oc
t
No
v
De
c
Jan
Feb
Ma
r
Ap
r
Ma
y
Jun Jul
Au
g
Sep
Oc
t
No
v
De
c
2008 2009 2010
Pre
cipi
tat i
on (
mm
.)
Soi l
wa
ter
con
t en
t (%
VW
C)
Raifall Soil Water Content
0
50
100
150
200
250
300
350
Jan Feb Mar Apr May Jun Jul Aug Sep Oct Nov Dec Jan Feb Mar Apr May Jun Jul Aug Sep Oct Nov Dec
2009 2010
gC m
-2m
ont
h-1
NEP
GPP
RE
2008-2009Dry period
2009-2010Dry period
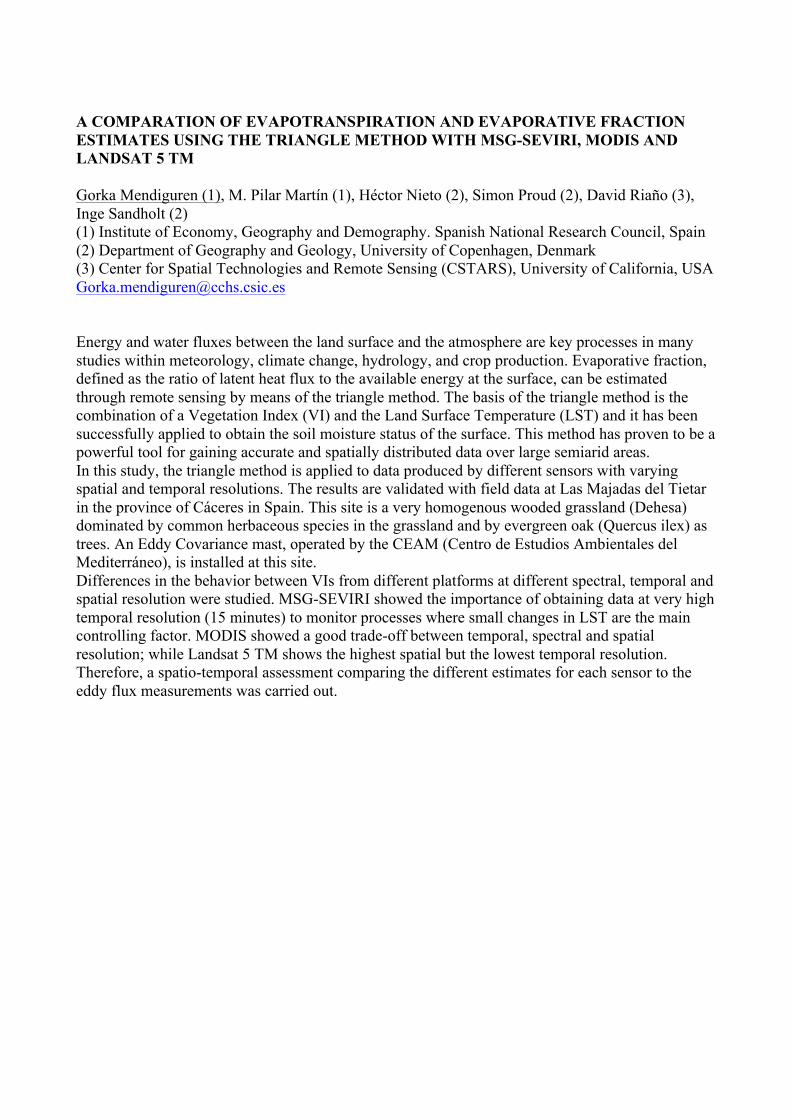
A COMPARATION OF EVAPOTRANSPIRATION AND EVAPORATIVE FRACTION ESTIMATES USING THE TRIANGLE METHOD WITH MSG-SEVIRI, MODIS AND LANDSAT 5 TM Gorka Mendiguren (1), M. Pilar Martín (1), Héctor Nieto (2), Simon Proud (2), David Riaño (3), Inge Sandholt (2) (1) Institute of Economy, Geography and Demography. Spanish National Research Council, Spain (2) Department of Geography and Geology, University of Copenhagen, Denmark (3) Center for Spatial Technologies and Remote Sensing (CSTARS), University of California, USA [email protected] Energy and water fluxes between the land surface and the atmosphere are key processes in many studies within meteorology, climate change, hydrology, and crop production. Evaporative fraction, defined as the ratio of latent heat flux to the available energy at the surface, can be estimated through remote sensing by means of the triangle method. The basis of the triangle method is the combination of a Vegetation Index (VI) and the Land Surface Temperature (LST) and it has been successfully applied to obtain the soil moisture status of the surface. This method has proven to be a powerful tool for gaining accurate and spatially distributed data over large semiarid areas. In this study, the triangle method is applied to data produced by different sensors with varying spatial and temporal resolutions. The results are validated with field data at Las Majadas del Tietar in the province of Cáceres in Spain. This site is a very homogenous wooded grassland (Dehesa) dominated by common herbaceous species in the grassland and by evergreen oak (Quercus ilex) as trees. An Eddy Covariance mast, operated by the CEAM (Centro de Estudios Ambientales del Mediterráneo), is installed at this site. Differences in the behavior between VIs from different platforms at different spectral, temporal and spatial resolution were studied. MSG-SEVIRI showed the importance of obtaining data at very high temporal resolution (15 minutes) to monitor processes where small changes in LST are the main controlling factor. MODIS showed a good trade-off between temporal, spectral and spatial resolution; while Landsat 5 TM shows the highest spatial but the lowest temporal resolution. Therefore, a spatio-temporal assessment comparing the different estimates for each sensor to the eddy flux measurements was carried out.
15 YEARS OF OBSERVATIONS OF ATMOSPHERIC NEW PARTICLE FORMATION IN HYYTIÄLÄ, FINLAND
Chatriya Watcharapaskorn, Tuomo Nieminen, Miikka Dal Maso, Tuukka Petäjä, Michael Boy, and Markku Kulmala.
Department of Physics, University of Helsinki, P.O. Box 64, FI-00014, Finland.
Research on new particle formation in the atmosphere has been very active during the last two decades. This phenomenon has been observed in various environments around the world, both in rural and urban areas as well as close to sea level and at higher altitudes [1]. In all the different environments, the occurance of new particle formation seems to be controlled by various factors, such as the origin of air masses (polluted vs. clean), concentration of precursor vapors and pre-existing aerosols, meteorological parameters and solar radiation. Understanding the temporal variation of the new particle formation and e.g. quantifying its climatic effects requires long-term continuous measurements. One of the longest and most comprehensive data sets of atmospheric aerosol properties is available from the University of Helsinki SMEAR II station in Hyytiälä, Finland [2].
Ambient aerosol size distributions have been measured at Hyytiälä since January 1996 with a twin DMPS system covering particle size range 3 – 1000 nm. Aerosol measurements are complemented by measurements of basic meteorological variables (temperature, RH, solar radiation intensity, etc.), trace gas concentrations (SO2, O3, NO, NO2, CO, CO2), and various quantities related to the soil and forest surrounding the station. These measurements allow us to study the interactions between the atmosphere and biosphere.
The set of aerosol instrumentation in Hyytiälä has been continuously developed and extended. In 2003 measurements of charged clusters and air ions were started with two ion spectrometers, the Balanced Scanning Mobility Analyzer BSMA [3] and the Air Ion Spectrometer AIS [4]. Both of these instruments measure charged particles below 1 nm in diameter. Starting in 2006, also neutral particles smaller than 3 nm have been measured with the Neutral cluster and Air Ion Spectrometer NAIS. With these three instruments it is possible to detect the first steps of particle formation and growth occuring at particle diameter around 1.5 – 2 nm, and also characterize the role of ions in this process.
The collected aerosol and ion spectrometer data is divided into particle formation event days, non-event days and undefined days according to the classification scheme by Dal Maso et al. [5]. From the measured aerosol size distributions we can calculate parameters that describe the new particle formation events, such as the formation and growth rates of the particles, as well as concentration and source rate of the precursor vapors.
The number of nucleation events detected at Hyytiälä varies from year to year in the range of 60 – 120 per year. The reasons behind this quite substantial variation are not yet found. We have, however, established that variation of the galactic cosmic ray intensity due to the 11 year solar cycle is not connected to the particle formation intensity at Hyytiälä [6]. Another characteristic of the particle formation is the seasonal distribution of nucleation event days. In springtime, April and May, particle formation is detected on average every second day in Hyytiälä. Another clear peak in event intensity occurs in autumn. The spring maximum is probably connected to the beginning of biogenic activity in the surrounding forest and an increase in concentration of oxidation products of various organic vapors. Also, based on simple proxy calculations the sulphuric acid concentration has a clear maximum during March – May, coinciding with event frequency maximum. During the autumn the peak in the proxy concentration is less clear but still distinguishable. The summer minimum in the number of event days might be connected to meteorological conditions and the
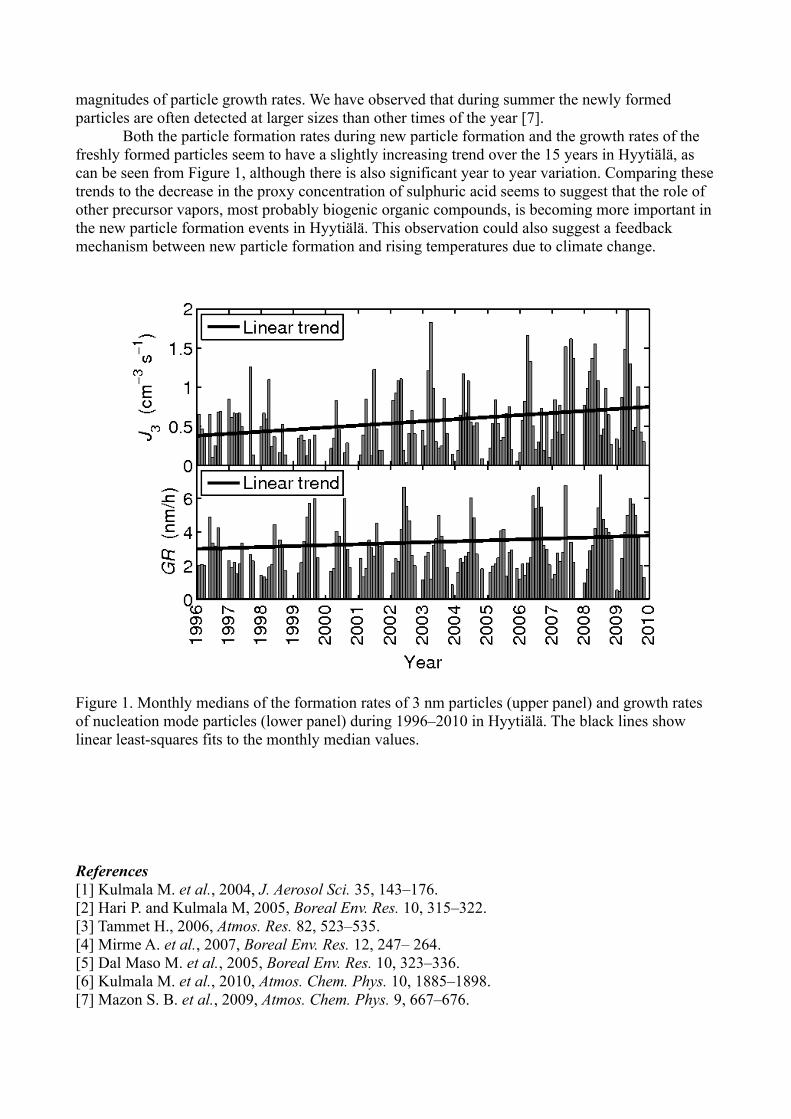
magnitudes of particle growth rates. We have observed that during summer the newly formed particles are often detected at larger sizes than other times of the year [7].
Both the particle formation rates during new particle formation and the growth rates of the freshly formed particles seem to have a slightly increasing trend over the 15 years in Hyytiälä, as can be seen from Figure 1, although there is also significant year to year variation. Comparing these trends to the decrease in the proxy concentration of sulphuric acid seems to suggest that the role of other precursor vapors, most probably biogenic organic compounds, is becoming more important in the new particle formation events in Hyytiälä. This observation could also suggest a feedback mechanism between new particle formation and rising temperatures due to climate change.
Figure 1. Monthly medians of the formation rates of 3 nm particles (upper panel) and growth rates of nucleation mode particles (lower panel) during 1996–2010 in Hyytiälä. The black lines show linear least-squares fits to the monthly median values.
References[1] Kulmala M. et al., 2004, J. Aerosol Sci. 35, 143–176.[2] Hari P. and Kulmala M, 2005, Boreal Env. Res. 10, 315–322.[3] Tammet H., 2006, Atmos. Res. 82, 523–535.[4] Mirme A. et al., 2007, Boreal Env. Res. 12, 247– 264.[5] Dal Maso M. et al., 2005, Boreal Env. Res. 10, 323–336.[6] Kulmala M. et al., 2010, Atmos. Chem. Phys. 10, 1885–1898.[7] Mazon S. B. et al., 2009, Atmos. Chem. Phys. 9, 667–676.
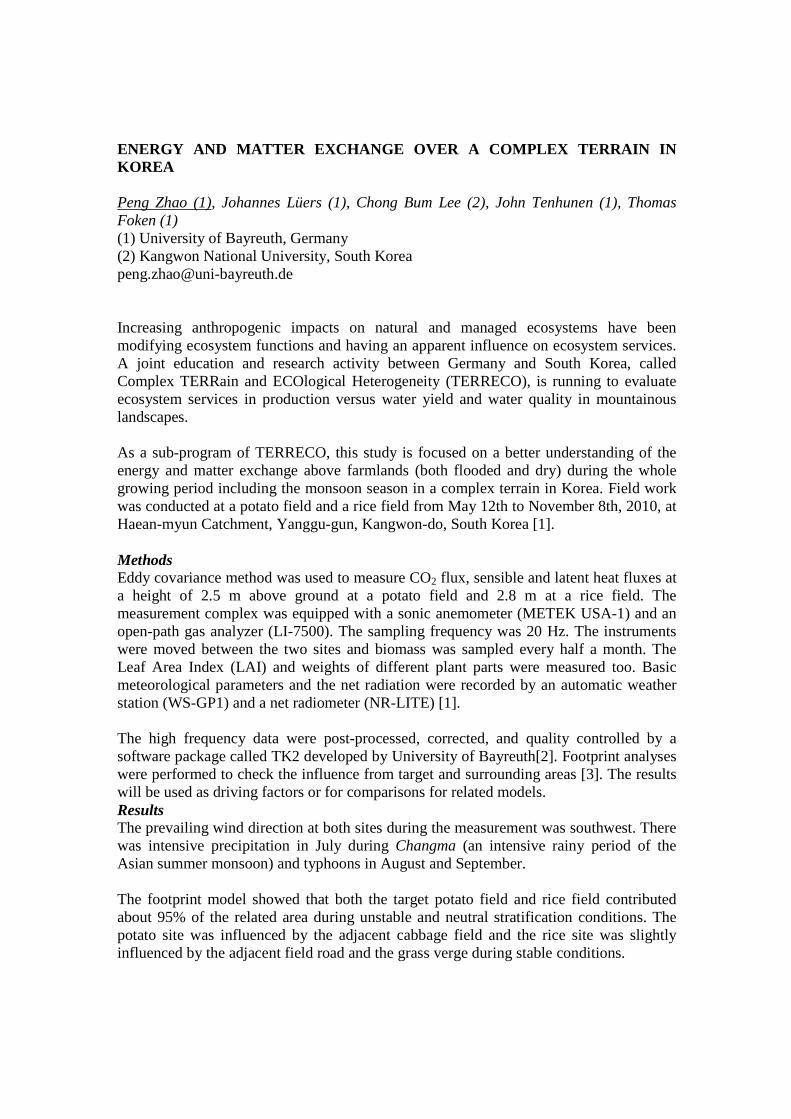
ENERGY AND MATTER EXCHANGE OVER A COMPLEX TERRAIN IN KOREA Peng Zhao (1), Johannes Lüers (1), Chong Bum Lee (2), John Tenhunen (1), Thomas Foken (1) (1) University of Bayreuth, Germany (2) Kangwon National University, South Korea [email protected] Increasing anthropogenic impacts on natural and managed ecosystems have been modifying ecosystem functions and having an apparent influence on ecosystem services. A joint education and research activity between Germany and South Korea, called Complex TERRain and ECOlogical Heterogeneity (TERRECO), is running to evaluate ecosystem services in production versus water yield and water quality in mountainous landscapes. As a sub-program of TERRECO, this study is focused on a better understanding of the energy and matter exchange above farmlands (both flooded and dry) during the whole growing period including the monsoon season in a complex terrain in Korea. Field work was conducted at a potato field and a rice field from May 12th to November 8th, 2010, at Haean-myun Catchment, Yanggu-gun, Kangwon-do, South Korea [1]. Methods Eddy covariance method was used to measure CO2 flux, sensible and latent heat fluxes at a height of 2.5 m above ground at a potato field and 2.8 m at a rice field. The measurement complex was equipped with a sonic anemometer (METEK USA-1) and an open-path gas analyzer (LI-7500). The sampling frequency was 20 Hz. The instruments were moved between the two sites and biomass was sampled every half a month. The Leaf Area Index (LAI) and weights of different plant parts were measured too. Basic meteorological parameters and the net radiation were recorded by an automatic weather station (WS-GP1) and a net radiometer (NR-LITE) [1]. The high frequency data were post-processed, corrected, and quality controlled by a software package called TK2 developed by University of Bayreuth[2]. Footprint analyses were performed to check the influence from target and surrounding areas [3]. The results will be used as driving factors or for comparisons for related models. Results The prevailing wind direction at both sites during the measurement was southwest. There was intensive precipitation in July during Changma (an intensive rainy period of the Asian summer monsoon) and typhoons in August and September. The footprint model showed that both the target potato field and rice field contributed about 95% of the related area during unstable and neutral stratification conditions. The potato site was influenced by the adjacent cabbage field and the rice site was slightly influenced by the adjacent field road and the grass verge during stable conditions.
The sensible heat flux had two peaks, one at the beginning and the other at the end of potato growing period, while only one peak was observed at the rice field before harvest. These peaks were apparently due to a small LAI when there was much bare soil surface exposed to the air. The latent heat fluxes increased with the development of crops, indicating that it was controlled by plant transpiration. During the crop initial stages and develop stages, the net ecosystem CO2 exchange (NEE) at both sites was generally negative during daytime (sink) and positive during nighttime (source) as a result of photosynthesis and respiration, respectively. The diurnal pattern of NEE was mainly controlled by solar radiation, and the day-to-day pattern was controlled by the growing stages of the crops. CO2 fluxes reached the peak simultaneously with the maximum of LAI during mid-day. A depression in NEE during Changma was reported in literature [4], but it was not observed in this study possibly because of the exclusion of data with bad quality during rain events. During the mid- and late season stages of the crops, the farmland became a smaller sink for CO2 as the LAI decreased. Normally farmers harvest potatoes when the fields are dry in August or beginning of September, but in 2010 the intensive rainfalls made the fields wet, and farmers could not harvest potatoes until the fields were dry at the end of September or beginning of October. As there were less and less green leaves or photosynthesis during the late season stage, the potato field became a slight source of CO2. The measurements of energy and matter exchange are used to evaluate and improve Weather Research and Forecasting (WRF) Model. A study of the comparison between eddy covariance method and chamber measurement is going on. These results will be available in the near future. References [1] P. Zhao et al., 2011, Arbeitsergebnisse 45, ISSN 1614-8916 [2] M. Mauder and T. Foken, 2004, Arbeitsergebnisse 26, ISSN 1614-8916 [3] M. Göckede et al., 2006, Boundary-Layer Meteorology, 118, 635-655. [4] H. Kwon, J. Kim, and J. Hong, 2009, Biogeosciences Discuss., 6(6), pp.10279-10309.
IMPACT OF METEOROLOGICAL ANOMALIES AND DISTURBANCES ON FOREST PRODUCTIVITY IN EAST ASIA Nobuko Saigusa Center for Global Environmental Research, National Institute for Environmental Studies, Tsukuba, Japan [email protected]
East Asia is a part of the monsoon climate region. The early summer rainy season in East Asia provides a sufficient water supply to terrestrial ecosystems over Japan, Korea, and eastern China and maintains high productivity of the temperate vegetation in the region. The intensity and duration of the early summer rainy season have a large seasonal and year-to-year variability due to the air-sea-land interactions over the Pacific Ocean and Eurasia. This variability is the major focus of research on ecosystem services related to carbon and water cycles in East Asia including disaster prevention, food and timber production, and climate regulation. Recent studies using flux measurement networks in Asia have shown that the year-to-year changes in annual net ecosystem CO2 exchanges are controlled by different key factors in different biomes. In humid temperate forests, the key factors are the temperature and solar radiation during the growing season, which vary year-to-year in response to the timing of the early summer rainy seasons [1]. In tropical forests in Southeast Asia, the keys are the length and strength of the dry season, and the El Niño/Southern Oscillation (ENSO)-related dry weather [2]. Another important key factor is the natural disaster. In East Asia, the area of forests disturbed by strong winds caused by typhoon is crucial, followed by heavy snow and fire. Strong winds often cause significant reduction in Leaf Area Index (LAI) and in the forest productivity from summer to autumn. To improve future climate change predictions, synthetic knowledge of how ecosystem functions on carbon and water cycles respond to large-scale meteorological phenomena, such as year-to-year changes in Asian monsoon circulations would be desirable. This is because ongoing global warming has the potential to increase the frequency and magnitude of many extreme climatic events, including storms, floods, droughts, and anomalous temperatures in the global scale as well as in the Asian monsoon region. In recent years, the climate from 2003 to 2004, particularly that during Northern Hemisphere summer, was exceptionally anomalous. The heat wave led to drought, crop shortfalls, and health crises in southern Europe in the 2003 summer. The rainy season was prolonged in the mid-latitude extending from Japan, China, through South Korea in 2003, and brought a cool summer with extremely low insolation. Another climatic extreme event was strong-wind disaster in 2004. About 10 typhoons struck the East Asia from summer to autumn in the year. This anomalous typhoon attack was related to an unusual atmospheric pressure pattern in the 2004 summer. In order to clarify how meteorological anomalies and natural disturbances affected the productivity of Asian forests, the spatial distributions of the year-to-year changes in the Photosynthetic Photon Flux Density (PPFD) and the Gross Primary Production (GPP) were examined during the period from 2001 to 2006. The spatiotemporal variation of the PPFD was obtained by satellite images, and that of the GPP was derived by a regression-type model, which was evaluated by ground observation data. The correlation between year-to-year changes in the PPFD and GPP was positive in the mid and high latitudes over various ecosystems, since the incoming radiation was an essential controlling

factor of the GPP in the regions under the anomalous weather in the 2003 summer [3]. On the other hand, the effects of strong winds caused by typhoons were different in different biomes. A significant reduction in LAI and GPP was caused by direct effect of strong winds in a deciduous broad-leaved forest. The defoliation and reduction in productivity were less sensitive in mixed forests. The study showed some features of the responses of East Asian forest productivity to large-scale meteorological anomalous pattern. Since there is a potential that the frequency of anomalous weather conditions increases in the future affecting productivity in the Asian forests, further studies are necessary to gain a more accurate understanding of the response of Asian ecosystems to the meteorological anomalies and natural disturbances. The recovery process after the disturbance should be studied as well. The damage in green leaves, the increase in litter-fall, and the change in the timing of litter-fall might alter the decomposition process, nutrient-availability, and productivity in the following growing season. Based on the understandings of different recovery processes and resilience of ecosystems, suggestions for appropriate forestry management would become possible. References [1] Saigusa et al., 2008, Agric. Forest Meteorol., 148, 700–713. [2] Hirano et al., 2007, Global Change Biol., 13, 412–425. [3] Saigusa et al., 2010, Biogeosciences, 7, 641-655.
Impact of climate manipulation on carbon fluxes of a Mediterranean shrubland in Sardinia
GUIDOLOTTI G., LIBERATI D., DE DATO G., DE ANGELIS P.
Department of Forest Environment and Resources, University of Tuscia, Via San Camillo de Lellis, 01100 Viterbo, Italy
Arid and semiarid woody shrublands make up approximately 35% of the global terrestrial surface
area, 24% of the global organic carbon and 16% of the global aboveground biomass. Despite their
potential impact on the global carbon balance, these ecosystems and their responses to climate
change are still poorly studied. With the aim of investigating the potential effect of global
environmental changes on ecosystem function, we manipulated the microclimate in a
Mediterranean shrubland in the Island of Sardinia in Italy to increase soil and air night‐time
temperatures and to reduce water input from precipitation. Temperature and water are the main
drivers for many biological and chemical processes, and could strongly affect the principal C fluxes
such as NEE (Net Ecosystem Exchange), TER (Total Ecosystem respiration) and SR (Soil CO2 efflux).
The experimental site consists of nine plots (about 25 m2) with an automatic roof that covers the
vegetation during the night (Warming treatment, 3 plots) or during rainfall events (Drought
treatment, 3 plots), the remaining 3 plots are used as control. A canopy‐chamber was developed
and tested to measure NEE and TER in the three treatments. Soil CO2 efflux was also measured in
each of the 9 plots, using a commercial Li‐Cor 8100 soil chamber. All measurements were carried
out during the year 2010, after nine years of manipulative experiment.
All the C fluxes examined showed a strong seasonality, with the highest rates during the spring,
when the high soil water content and the mild temperatures supported both the photosynthetic
and respiratory activity, and the lowest rates during the hot dry non‐vegetative summer season.
The warming and drought treatments did not affect significantly the C fluxes at any sampling date.
The variability between plots was also high, as a consequence of the high heterogeneity in plant
composition. In this Mediterranean shrubland, already adapted to extremely high temperatures
and prolonged drought conditions, the increase of temperature and the reduced water availability
will unlikely affect ecosystem C fluxes. In the long term, changes in plant composition could play a
major role to determine the responses of this community to climate changes, and their role on the
biosphere C‐balance.
APPLICATION OF A NEW WATER FLOW MODEL FOR SOIL-PLANT SYSTEMS BASED ON TERRESTRIAL LASER SCANNER DATA TO OBTAIN HYDRAULIC ARCHITECTURE OF TREES Eckart Priesack, Sebastian Bittner, Rainer Hentschel, Michael Janott Helmholtz-Zentrum München, Germany priesack@ helmholtz-muenchen.de The estimation of root water uptake and water flow in plants is crucial to quantify transpira-tion and hence the water exchange between land surface and atmosphere. In particular the soil water extraction by plant roots which provides the water supply of plants is a highly dynamic and non-linear process interacting with soil transport processes that are mainly determined by the natural soil variability at different scales. To better consider this root-soil interaction, we extended and further developed a finite ele-ment tree crown hydro-dynamics model based on the one-dimensional porous media equation (Früh and Kurth, 1999; Aumann and Ford, 2002; Bohrer et al., 2005) by aptly defining xylem hydraulic properties (Zweifel, 2000; Janott et al., 2011) and including in addition to the ex-plicit three-dimensional architectural representation of the tree crown a corresponding three-dimensional characterization of the root system (Janott et al., 2011). This new one-dimensional xylem water flow model was then coupled to a soil water flow model which is similarly described by a further one-dimensional porous media equation (Janott et al., 2011). To apply the new model to simulate transpiration of temperate deciduous beech, lime and ash trees of a mixed forest stand input data on plant architecture are needed. For this purpose we use terrestrial laser scanning (TLS) which has been successfully applied to assess the structure of the aboveground vegetation in situ in the last years. Based on the technique of light detection and ranging (LIDAR) this method provides a set of three dimen-sional points that are located on the surface of objects such as vegetation. A further data pro-cessing of this three dimensional point cloud (typically consistent of some million points) enables to obtain structural properties like the spatial leaf distribution or large scale charac-teristics such as the stand height or plant density. Using a skeleton extraction algorithm (Verroust and Lazarus, 2000, Xu et al., 2007), we are able to obtain the position and size of branch and stem cylinder elements from a three-dimen-sional point cloud obtained by TLS field measurements. No manual data processing is neces-sary to apply the algorithm allowing the analysis of a high number of individual plants. Finally we test the new model to describe xylem water flow in temperate deciduous beech and ash trees and compare simulation results to experimental data obtained by sap flow measure-ments. [1] Aumann C. and Ford E., 2002, Journal of Theoretical Biology, 219, 415-429. [2] Bohrer F. et al., 2005, Water Resource Research, 41, W11404. [3] Früh T. and Kurth W., 1999, Journal of Theoretical Biology, 201, 251-270. [3] Janott M. et al, 2011, Plant and Soil, 341, 233-256. [5] Verroust, A., Lazarus, F., 2000. The Visual Computer, 16, 15. [6] Xu, H., Gossett, N., Chen, B., 2007. ACM Transaction on Graphics (TOG), 26, 19. [7] Zweifel, R. et al., 2000, Trees, 15, 50-57.
BIOLOGICAL CRUSTS: A FORGOTTEN COMPONENT OF THE GLOBAL CARBON
AND NITROGEN CYCLE?
Bettina Weber
University of Kaiserslautern, Germany
Biological crusts are composed of cyanobacteria, green algae, lichens, bryophytes, fungi and
bacteria, which grow in varying proportions in the uppermost millimeters of the soil
(biological soil crusts), on or within rocks (biological rock crusts) and on the bark or leaves of
trees and shrubs (epiphytic crusts). Due to photoautotrophic organisms within these crusts
they sequester atmospheric CO2 and many of them inhabit nitrogen-fixing cyanobacteria that
utilize atmospheric N2 to form ammonium which can be readily utilized by vascular plants.
In a thorough literature search, we compiled all available data on the photosynthetic
properties of the different types of biological crusts and developed a model to calculate the net
primary production of biological crusts. We obtained a total value of 3.6 Pg a-1
for the global
net uptake of carbon by biological crusts [1], which corresponds to approximately 6% of the
estimated global net primary production of terrestrial vegetation [2]. This value is of the same
magnitude as the global annual carbon turnover due to biomass burning, which has been
estimated at 3.6 Pg a-1
[3].
A corresponding study on the nitrogen assimilation of biological crusts revealed global
estimates of ~30 Tg a-1
and ~15 Tg a-1
for nitrogen fixation by biological soil crusts and
epiphytic crusts, respectively. Thus, the total rate of annual nitrogen fixation by biological
crusts (~45 Tg a-1
) appears to be a major contribution to the global biological nitrogen
fixation, which is estimated to be about 107 Tg a-1
[4].
In order to obtain a more profound basis on the primary production of biological soil crusts, a
long-term study on the net primary production of biological soil crusts in the Succulent
Karoo, South Africa, is being conducted. The microclimatic conditions of four different types
of biological soil crusts have been monitored over one whole year. These data on the water
status, temperature and light intensity of the crusts (acquired in 5-minute intervals) are now
combined with ecophysiological characterizations of the four crust types to obtain the annual
balance of the net primary production of each type. In a remote sensing approach, the final
step of the analysis, to calculate the net primary production of the biological soil crusts on a
spatial scale, is being accomplished. Based on hyperspectral remote sensing data we have
developed an algorithm to classify biological soil crusts of the Succulent Karoo [5]. Knowing
the percentage of each crust type, we now can depict and calculate the long-term productivity
of each crust type with high accuracy.
Apart from valuable balancing results on the long-term net primary production of biological
soil crusts in semiarid regions, the applied methodology can serve as a standard for further
studies in different habitats and regions throughout the world.
References
[1] W. Elbert et al., 2009, Biogeosciences Discuss., 6, 6983-7015.
[2] S.W. Running et al., 2004, Bioscience, 54, 547-560.
[3] M.O. Andreae and P. Merlet, 2001, Global Biogeochemical Cycles, 15, 955-966.
[4] J.N. Galloway, 2005, in: Biogeochemistry, W.H. Schlesinger, Ed. (Elsevier-Pergamon,
Oxford), pp. 557-583.
[5] B. Weber et al., 2008, Remote Sensing of Environment, 112, 2187-2201.
THE ANALYSIS OF SIZE-SEGREGATED CLOUD CONDENSATION NUCLEI COUNTER (CCNC) DATA FROM SMEAR II AND ITS IMPLICATIONS FOR AEROSOL-CLOUD RELATIONS Mikhail Paramonov (1), Tuukka Petäjä (1), Pasi P. Aalto (1), Veli-Matti Kerminen (2) and Markku Kulmala (1) (1) Department of Physics, University of Helsinki, P.O. Box 64, FI-00014, Helsinki, Finland (2) Finnish Meteorological Institute, P.O. Box 503, 00101, Helsinki, Finland [email protected] Aerosol particles are omnipresent in the atmosphere, and besides directly influencing the radiative balance of the Earth, they play a crucial role in cloud formation [1]. Through a variety of microphysical processes aerosol particles influence the albedo, lifetime and precipitation patterns of clouds in what is known as indirect effects of aerosols on climate [2]. The ability of aerosol particles to act as cloud condensation nuclei (CCN) is strongly linked to their physical and chemical properties [3], with the most important parameters being CCN concentration, aerosol critical diameter and hygroscopicity. CCNC measurements have been conducted continuously at the SMEAR II (Station for Measuring Ecosystem-Atmosphere Relations) in Hyytiälä Forestry Field Station in Finland since June 2008, and form a part of the comprehensive network of aerosol- and meteorology-related measurements in Southern Finland [4]. The station (61º 50' 50.685'', 24º 17' 41.206'', 179 m a.m.s.l.) is located 220 km north-west of Helsinki on a flat terrain surrounded by a Scots Pine stand, and is, therefore, well representative of the boreal environment. The CCNC in question is a diffusion-type CCN counter, including a differential mobility analyzer (DMA), condensation and optical particle counters (CPC and OPC) and a saturator unit. Both non-size-segregated and size-segregated measurements are performed by the instrument, with the latter having started in February 2009 with an introduction of a DMA into the system. CCN concentrations are measured across 30 size channels, with particle diameters ranging from 20 to 300 nm for supersaturation levels of 0.1%, 0.2%, 0.4%, 0.6% and 1%. This measurement setup allows for a direct determination of critical diameter dc and the hygroscopicity parameter . In previous studies, which dealt with CCN data from SMEAR II, dc and values were calculated indirectly, either by applying the -Köhler theory to the hygroscopicity-tandem DMA (H-TDMA) data, or by combining the particle size distribution data with the CCNC data [5, 6]. This study will be the first to present the results of direct derivation of dc and values from CCNC measurements at SMEAR II, and will allow for a comparison of methods for their determination. Besides the temporal trends and the chemical analysis based on values, the study will also concentrate on the source apportionment of CCN based on the observed chemical variations utilizing the trajectory analysis. During the conditions of the well-mixed boundary layer, particle number size distributions will also be used simultaneously with CCNC data to investigate the occurrence of the Hoppel minimum as a result of the processing of particles by clouds. The study aims to provide the most comprehensive and up-to-date overview of the CCNC data for a boreal environment in Southern Finland by means of detailed analysis of size-segregated CCN data, aided by the incorporation of a variety of other datasets from SMEAR II deemed relevant. References [1] B. Stevens and G. Feingold, 2009, Nature, 461, 607–613.

[2] P. Forster et al., 2007, in: Climate Change 2007: The Physical Science Basis. Contribution of Working Group I to the Fourth Assessment Report of the Intergovernmental Panel on Climate Change, S. Solomon et al., Eds. (Cambridge University Press). [3] J.H. Seinfeld and S.N. Pandis, 2006, Atmospheric Chemistry and Physics. From air pollution to climate change (2nd edition). (John Wiley & Sons). [4] P. Hari and M. Kulmala, 2005, Boreal Env. Res., 10, 315–322. [5] J. Mikkilä et al., 2010, IAC 2010 proceeddings. [6] S.-L. Sihto et al., 2010, Atmos. Chem. Phys. Discuss., 10, 28231–28272.
Remote sensing of aerosols with high spatial resolution in the Amazon
Silvia de Lucca (1), Paulo Artaxo (1), Andrea de Almeida Castanho (2)1. Institute of Physics, University of Sao Paulo, Brazil.2. Woods Hole Research Center, MA,USA.Presenting author email: [email protected]
The significant process of deforestation in the Amazon results in emissions of large amounts of aerosols and trace gases to the atmosphere. It is necessary to develop tools that better quantify the large scale atmospheric load of aerosols generated and therefore the impact on regional climate. Our goal was to obtain the spatial distribution of aerosols in the Amazon dry season, with high spatial resolution and better accuracy than current retrieval methods.
The methodology was developed to obtain the aerosol optical depth from observations of radiance obtained from the MODIS (Moderate-Resolution Imaging Spectroradiometer) sensor (Castanho et al., 2008). The developed method increases spatial resolution from 10 km x 10 km (operational product at NASA for aerosol optical depth – AOD) to 1.5 km x 1.5 km, with better accuracy due to a carefully chosen aerosol optical model that better represent the actual aerosol layer. The NASA operational product (Collection 4) uses a single model to describe the aerosol in Amazonia that is not specifically designed for the type of aerosols in the region.
Optical models based on measured single scattering albedo (ω0), real and imaginary refractive index as well as size distributions were constructed to better characterize the aerosol in the region. These aerosol optical properties were obtained from the database acquired by the CIMEL sun photometer part of the Aerosol Robotic Network (AERONET), located in Ji-Paraná, Rondônia state. Two models were constructed due to different aerosol types, and at a wavelength of 676 nm, the two optical models obtained show values for ω0 of 0.88 and 0.94.
The algorithm uses the critical reflectance property (Kaufman et al., 1987) to determine the aerosol optical model to be employed, in a dynamic an interactive way, reducing the uncertainty in the determination of the AOD with high spatial resolution. In 52% of the days analyzed, the aerosol optical model was chosen in a dynamic way. The remaining days, because of statistical limitation, an average model was used. So, an important source of uncertainty in the acquisition of the AOD was reduced, which is the choice of an optical model more adequate to describe the biomass burning aerosol present at the atmosphere.
The comparison of the AOD retrieved from satellite and the AOD measured from CIMEL showed good agreement as shown by the linear fit y= (1.09±0.03) x + (0.03 ±0.02), with R2=0.80. The improvement in the AOD retrieved from MODIS sensor over Amazonia described here in this work pointed this methodology to be a promising tool to access aerosol loadings in Amazonia region. The methodology used in this work showed to be a promising tool to retrieve aerosol loadings in the Amazon region. Castanho, A. D. A., J. Vanderlei Martins, and P. Artaxo (2008), MODIS Aerosol Optical Depth retrievals with high spatial resolution over an urban area using the critical reflectance, J. Geophys. Res., 113, D02201, doi:10.1029/2007JD008751 Kaufman, Y. J. (1987), Satellite sensing of aerosol absorption, J. Geophys. Res., 92(D4), 4307–4317.

ACTIVE MICROWAVE SATELLITE DATA IN SUPPORT OF METHANE
MODELING AT HIGH LATITUDES
Annett Bartsch (1), Stefan Schlaffer (1), Christoph Paulik (1), Daniel Sabel (1), Vahid Naeimi
(1), Garry Hayman (2), Wolfgang Wagner (1)
(1) Institute of Photogrammetry and Remote Sensing, Vienna University of Technology,
Vienna, Austria
(2) Centre of Ecology and Hydrology, Wallingford, UK
Active microwave satellite data can provide information on surface hydrology on local to
global scale. Information includes wetland dynamics, surface wetness and status regarding
frozen or thawed condition. C-band data are available from SAR (synthetic aperture radar) as
well as scatterometer. SARs are applicable on local to regional scale and scatterometer cover
the entire globe in a few days.
Land surface hydrology and permafrost conditions need to be considered for land ecosystem-
atmosphere modeling at high latitudes. The suitability of active microwave data to help
validate or constrain relevant models is investigated within the European Space Agency
funded projects STSE ALANIS-Methane and DUE Permafrost.
The European platform ENVISAT carries an advanced SAR (ASAR) which provides C-band
data in ScanSAR mode. These data can be used for update of inundation status with 150m
spatial resolution at frequent intervals (several times per month depending on actual
acquisitions). This complements regional to global wetland datasets with coarser scale
(~25km). Smaller permanent and seasonal features as abundant in high latitudes and which
are usually not captured with even medium resolution datasets [1] can be identified.
Figure 1: Example of ENVISAT ASAR wide swath derived inundation patterns for the central
Ob River region in Western Siberia
Scatterometer such as on ERS1/2 and Metop ASCAT provide global information on soil
moisture and surface status every few days [2, 3, 4]. Continuous records are available since
1992 and 2007 respectively.
This paper provides insight into available datasets, validation results of the freeze/thaw status
(air temperature, surface temperature measurements, satellite derived surface temperature),
wetland dynamics (multi scale assessment) and discusses issues regarding use with climate
models with focus on Northern Eurasia.
References
[1] Bartsch A., Pathe C., Wagner W., and K. Scipal, 2008. Detection of permanent open water
surfaces in central Siberia with ENVISAT ASAR wide swath data with special emphasis on
the estimation of methane fluxes from tundra wetlands. Hydrology Research 39 (2): 89-100.
[2] Naeimi, V., Z. Bartalis, W. Wagner (2008):ASCAT soil moisture: An assessment of the
data quality and consistency with the ERS scatterometer heritage, Journal of
Hydrometeorology. doi:10.1175/2008JHM1051.1.
[3] Naeimi, V., Paulik, C. Wagner, W. & Bartsch A. (2010): Freeze/thaw detection in
permafrost region with C-Band scatterometers. Proc. ‘Earth Observation for Land-
Atmosphere Interaction Science’, Frascati, Italy 3 –5 November 2010 (ESA SP-688, January
2011)
[4] Wagner, W., G. Blöschl, P. Pampaloni, J.-C. Calvet, B. Bizzarri, J.-P. Wigneron, Y. Kerr
(2007): Operational readiness of microwave remote sensing of soil moisture for hydrologic
applications, Nordic Hydrology, Volume 38, No 1, Pages 1-20.
VARIATION OF SOIL ORGANIC CARBON STOCK IN ABANDONED RICE FIELD MANAGED BY CROP ROTATION
Nittaya Cha-un (1), Sirintornthep Towprayoon* (1,2)
(1) The Joint Graduate School of Energy and Environment (JGSEE) and Center of Energy Technology and Environment, King Mongkut’s University of Technology Thonburi, ,126 Prachauthit Rd, Bangmod, Tungkru, Bangkok, Thailand 10140
(2) Earth System Science Research and Development Center (ESS), King Mongkut’s University of Technology Thonburi, 126 Prachauthit Rd, Bangmod, Tungkru, Bangkok, Thailand 10140
E-mail address: [email protected]
Abandoned rice field and upland agriculture area in Thailand are more than 346,976,000 km2 of the agricultural area in the country. These areas are not well managed for agricultural purposed due to its poor soil properties and low organic carbon stock, especially the abandoned rice field which are the economic area for rice production. In order to improve soil fertility and increase soil organic carbon stock in these area, we introduced area specific energy crop rotation as the sustainable agricultural management system aiming not only for bio-energy purposed but also for reclaiming of rice cultivation field. Therefore the monitoring of soil organic carbon stock variation in these abandoned land management are the basic data reflecting the improvement of abandoned agricultural area. This study started from Aug 2009 to Jan 2011. The abandoned rice field in southwestern part of Thailand were designed for four crop rotation systems including 1) single cropping of rain fed rice field (RF), 2) double cropping of corn and rain fed rice field (RC), 3) double cropping of irrigation and rain fed rice field (RI), and 4) double cropping of sweet sorghum and rain fed rice field (RS). The sequences of field management were field preparation by tillage, 4.35 ton ha-1 of manure incorporation, first cropping (corn, fallow land, rice, sweet sorghum) and second cropping (rain fed rice field), respectively. Prior to crop rotation treatment, the result showed that, the soil texture of abandoned rice field was sandy loam and soil fertility was low. In 0-15 and 15-30 cm soil depth of abandoned rice field, the soil bulk densities were 1.75 and 1.88 g cm-3, the SOC stocks were 10.50 and 6.20 ton C ha-1, respectively. After tillage, change of soil properties (in 0-15 and 15-30 cm) were observed such as soil bulk density (1.52 and 1.66 g cm-3) and SOC stock (7.99 and 5.64 ton C ha-1). In addition, the SOC stock increased to 10.70 and 7.89 ton C ha-1(in 0-15 and 15-30 cm) after manure incorporation. After the crop rotation management (1st and 2nd cropping), the SOC stock in RC, RF and RC decreased by 6.30 – 8.64 ton C ha-1 in 0-15 cm and 2.54 – 6.13 ton C ha-1 in 15-30 cm. Besides, the SOC stock after 2nd cropping in RI (0-15 cm) increased to 11.32 % when compared with the abandoned rice field.
Keywords: soil carbon stock, abandoned rice field, bulk density, crop rotation
UNCERTAINTY IN ESTIMATES OF TURBULENT FLUX OF MASS AND ENERGY DUE TO EXPERIMENTAL SET-UP
Nicola Arriga (1), Gerardo Fratini(1,2), Carlo Trotta (1), Dario Papale (1)(1) Università degli Studi della Tuscia (dip. Di.S.A.F.Ri.), Viterbo, Italy(2) LI-COR Biosciences GmbH, Bad Homburg, [email protected]
The Eddy Correlation (EC) methodology has been thoroughly and widely used in the last decades as a tool for atmospheric turbulence investigation in the context of Atmospheric Boundary Layer science and Micrometeorology, in particular to estimate mass and energy exchange above ecologically relevant surfaces. Despite its long term application and theoretical studies, many issues are still open about the effect of different experimental set-up on final flux estimates. Moreover recent instrumental and theoretical developments posed new questions to the Micrometeorology community. In particular the sampling and sensing principles of gas analysers introduce several sources of uncertainty in the concentration measurement and in the consequent flux estimates, as well as the use of different devices for the measurements of turbulent or meteorological quantities relevant for the final estimates of land atmosphere exchange such as sonic anemometers or radiometers. As a consequence the specific experimental set-up has been definitely recognized as a source of systematic and random errors by numerous studies (see references [1] and [2]). The final estimates of the uncertainty resultant from random and systematic experimental sources, is a crucial step toward a deeper and more detailed representation of interactions between land ecosystems and Atmosphere that has been not completed. The repeatibility and spatial representativeness of EC single point estimates is another factor intrinsically connected to the measurement techniques and instruments employed. This work dealt with some of these issues exploiting the simultaneous availability of several types and models of EC sensors for a technical intercomparison of instruments in the framework of EU-funded ICOS project and the possibility of using spatial replicates for some particular set-up. These parallel intercomparisons have been realized for time intervals of different extension, ranging from some weeks to more than one year in order to provide a wide spectrum of the external variables, both meteorological both phenological, relevant for the functioning of the measuring systems. A consistent dataset has been collected for intercomparison and statistical analysis of differences in the flux estimates obtained with different gas analyzers such as LI-7000, LI-7200 and LI-7500 provided by LI-COR Biosciences Inc. and with several ultra-sonic three dimensional anemometers such as R3 and HS (Gill Instruments Ltd), CSAT-3D (Campbell Scientific Inc.) and Metek-USA-1 (Metek GmbH). All the instruments have been installed above the same crop field and at the same height above the surface, in an experimental facility of Università degli Studi della Tuscia, near Viterbo (Italy). A spatially enough separated EC systems, i.e. placed at a distance higher than a typical source area extension, have been installed above the same surface to provide a reference system useful as an independent replicates of the flux measurements for the statistical interpretation of data. This cluster of measurement devices is expected to provide relevant information about instrumental and methodological sources of uncertainty in the estimates of turbulent mass and energy exchange at the surface atmosphere interface.
References[1] M. Mauder et al., 2007, Boundary Layer Meteorology, 123, 29-54[2] W.J. Massman and X. Lee, 2002, Agricultural and Forest Meteorology, 113, 121-144
BLACK CARBON, ORGANIC CARBON AND POLYCYCLIC AROMATIC HYDROCARBON IN AMBIENT AIR OF CENTRAL INDIA Y. Nayak1, K. S. Patel1*, H. Saathoff2, T. Leisner2, L. Jutta3 and M. Georg3 (1) School of Studies in Chemistry, Pt. Ravishankar Shukla University, Raipur, India (2) Institute for Meteorology and Climate Research (IMK), KIT, Germany (3) Helmholtz Zentrum Muenchen, Ingolstädter Landstr. Neuherberg, Germany *Corresponding author: [email protected] The combustion processes i.e. fuels, agricultural waste, etc. are main sources of black carbons (BC), organic carbons(OC), polycyclic aromatic hydrocarbons (PAHs), etc. in the environments [1]. A huge amount of coal is burnt in the central region of India for the production of electricity and sponge iron. The coal burning generates BC, OC and PAHs in the ambient air and their concentration attained maximum in the winter season mainly due to slowest wind speed and temperature inversion [2]. The BC and PAHs are matter of great climate and environmental interests. The PAHs belong to the group of persistent organic pollutants (POPs) with a similar structure comprising two or more joined aromatic carbon rings. They are considered highly toxic for human beings and they may be altered after absorption into the body into substances that are able to damage the genetic material in cells and initiate the development of cancer, although individual PAHs differ in their capacity to damage cells in this way. The USEPA have been identified following PAHs i.e. phenanthrene(Phe), anthracene(Ant), fluoranthene(Fla), pyrene(Pyr), benzo[a]anthracene (Baa), chrysene(Cry), benzo[b ]fluoranthene,(Bbf) benzo[k]fluoranthene (Bkf), benzo[a]- yrene (Bap), dibenzo- [a,h]anthracene(Dba), benzo[ghi]perylene(Bgh) and indeno[1,2,3-cd]pyrene(Ind) as the priority pollutants. In the present work, BC, OC and PAHs distribution, variations and sources in the most industrialized region of the country, Raipur (21° 8′ 24″ N, 81° 22′ 48″ E) is described. The PM10 samples were collected over the 47-mm quartz filters using suitable blank for duration of 24 hrs during period 2007-08. The carbon and PAHs contents were analyzed by the thermal and HPLC methods, respectively. The BC, OC and PAHs contents (n=24) in the ambient air ranged from 4.8 - 60.8, 5.0 - 53.4 and 0.04 - 0.16 µg m-3 with mean value of 24.7±12.1, 20.1±9.3 and 0.09±0.02 µg m-3 respectively, Figure 1. The highest concentration of BC, OC and ΣPAH was observed in the winter season of a year, mainly due to the lowest wind speed and temperature inversion. Among them, content of three PAHs (i.e. Fla, Pyr and Cry) is dominated, contributing ≈ 46% of the ΣPAH12. The fraction of BC and OC in the PM10 ranged from 3.78 – 12.67% and 4.03 – 11.24% with mean value of 8.04±1.87% and 7.04±1.13%, respectively, Figure 2. The higher fraction of carbons in the PM10 was observed in the winter season. The concentration of BC, OC and ΣPAH12 are well correlated among themselves, indicating their common sources. The speciation and sources of 12 PAHs are described. The higher concentration of BC and PAHs in this region of the country was observed, may be due to huge coal burning.
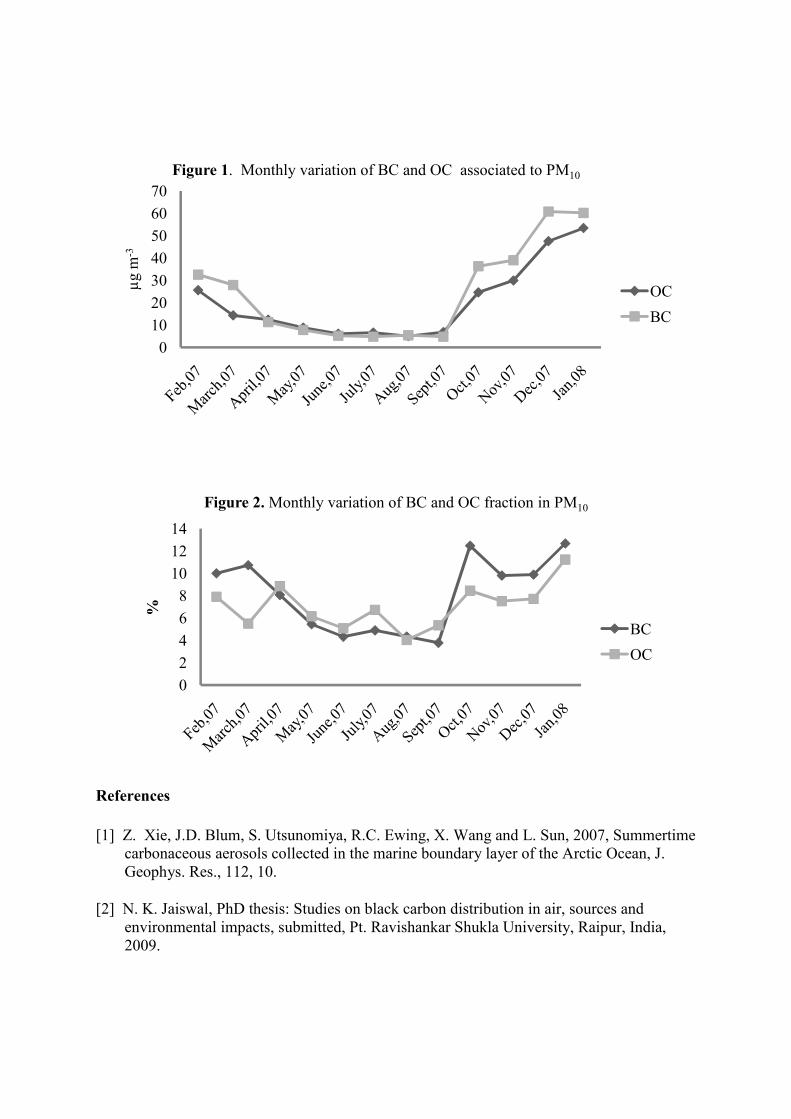
References
[1] Z. Xie, J.D. Blum, S. Utsunomiya, R.C. Ewing, X. Wang and L. Sun, 2007, Summertime carbonaceous aerosols collected in the marine boundary layer of the Arctic Ocean, J. Geophys. Res., 112, 10.
[2] N. K. Jaiswal, PhD thesis: Studies on black carbon distribution in air, sources and environmental impacts, submitted, Pt. Ravishankar Shukla University, Raipur, India, 2009.
010203040506070
µg m
-3
Figure 1. Monthly variation of BC and OC associated to PM10
OC
BC
02468
101214
%
Figure 2. Monthly variation of BC and OC fraction in PM10
BC
OC


EFFECTS OF RECURRING SUMMER DROUGHT ON THE NET ECOSYSTEM CO2 EXCHANGE AND ITS COMPONENT FLUXES IN MOUNTAIN GRASSLAND Michael Bahn (1), Michael Schmitt (1), Thomas Ladreiter-Knauss (1), Roland Hasibeder (1), Verena Gruber (1), Eric Walter (1), Karin Bianchi (1), Dagmar Rubatscher (1), Lucia Fuchslueger (2), Andreas Richter (2) (1) University of Innsbruck, Austria (2) University of Vienna, Austria [email protected] Mountain ecosystems are considered as particularly vulnerable to disturbance and are exposed to comparatively fast changes in climate and land use. Climate projections suggest that besides warming future climates involve an increased occurrence of extreme weather events, including extended periods of drought. Effects of such extreme events on ecosystems and their greenhouse gas balance are not yet well understood, and are currently assessed a.o. by the EU-FP7-project Carbo-Extreme, which aims to provide a Pan-European synthesis of the terrestrial carbon cycle under climate variability and extremes. We studied effects of recurring summer drought on the net ecosystem CO2 exchange (NEE) and its component fluxes in a mountain meadow at 1820 m in the Austrian Central Alps, as based on a series of rainfall exclusion experiments. Aboveground net primary production, NEE, gross primary productivity and ecosystem respiration showed a consistent reduction with increasing progression of drought. Drought diminished canopy photosynthesis more strongly than ecosystem respiration. After the third subsequent year of simulated summer drought memory effects on NEE were observed, which were likely due to shifts in the abundance of species, whose stomatal response to drought differed considerably. Belowground net primary production was not consistently affected by drought. Soil respiration and CO2 concentrations across the soil profile were significantly reduced by drought, though soil respiration responded only when a critical threshold of soil moisture was exceeded towards the end of the drought period. Autotrophic (i.e. root and rhizosphere) components of soil respiration showed a stronger decrease than heterotrophic (i.e. bulk soil microbial) components. The first rainfall event after the simulated drought triggered a peak in soil CO2 emissions which lasted for several hours and was, surprisingly, more pronounced for autotrophic than for heterotrophic components. Detailed analyses of mechanisms underlying the observed changes, as based on in situ isotopic labeling studies and model analyses of the production and diffusion of CO2 across the soil profile are currently being elaborated. We conclude that 1) summer drought may potentially alter the carbon balance of alpine grassland towards decreasing the C sink strength, 2) component processes are governed by different critical thresholds, and 3) repeated drought may induce memory effects on the C dynamics in mountain grassland.
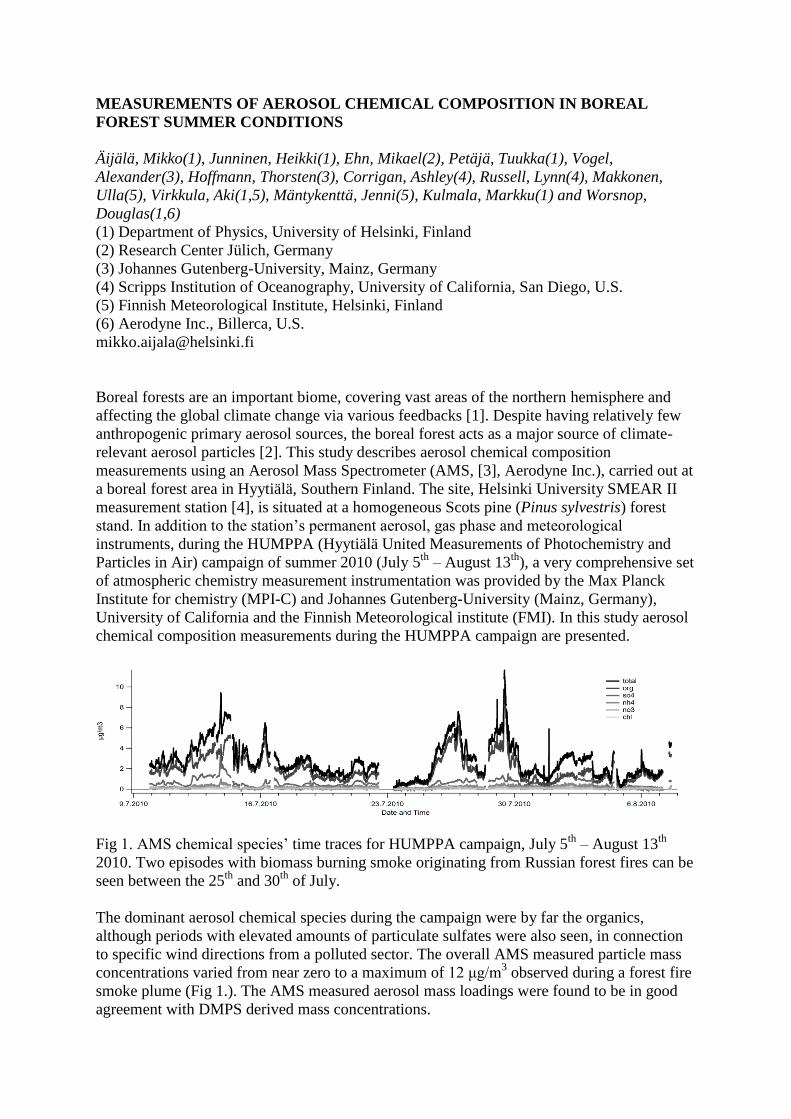
MEASUREMENTS OF AEROSOL CHEMICAL COMPOSITION IN BOREAL
FOREST SUMMER CONDITIONS
Äijälä, Mikko(1), Junninen, Heikki(1), Ehn, Mikael(2), Petäjä, Tuukka(1), Vogel,
Alexander(3), Hoffmann, Thorsten(3), Corrigan, Ashley(4), Russell, Lynn(4), Makkonen,
Ulla(5), Virkkula, Aki(1,5), Mäntykenttä, Jenni(5), Kulmala, Markku(1) and Worsnop,
Douglas(1,6)
(1) Department of Physics, University of Helsinki, Finland
(2) Research Center Jülich, Germany
(3) Johannes Gutenberg-University, Mainz, Germany
(4) Scripps Institution of Oceanography, University of California, San Diego, U.S.
(5) Finnish Meteorological Institute, Helsinki, Finland
(6) Aerodyne Inc., Billerca, U.S.
Boreal forests are an important biome, covering vast areas of the northern hemisphere and
affecting the global climate change via various feedbacks [1]. Despite having relatively few
anthropogenic primary aerosol sources, the boreal forest acts as a major source of climate-
relevant aerosol particles [2]. This study describes aerosol chemical composition
measurements using an Aerosol Mass Spectrometer (AMS, [3], Aerodyne Inc.), carried out at
a boreal forest area in Hyytiälä, Southern Finland. The site, Helsinki University SMEAR II
measurement station [4], is situated at a homogeneous Scots pine (Pinus sylvestris) forest
stand. In addition to the station’s permanent aerosol, gas phase and meteorological
instruments, during the HUMPPA (Hyytiälä United Measurements of Photochemistry and
Particles in Air) campaign of summer 2010 (July 5th
– August 13th
), a very comprehensive set
of atmospheric chemistry measurement instrumentation was provided by the Max Planck
Institute for chemistry (MPI-C) and Johannes Gutenberg-University (Mainz, Germany),
University of California and the Finnish Meteorological institute (FMI). In this study aerosol
chemical composition measurements during the HUMPPA campaign are presented.
Fig 1. AMS chemical species’ time traces for HUMPPA campaign, July 5th
– August 13th
2010. Two episodes with biomass burning smoke originating from Russian forest fires can be
seen between the 25th
and 30th
of July.
The dominant aerosol chemical species during the campaign were by far the organics,
although periods with elevated amounts of particulate sulfates were also seen, in connection
to specific wind directions from a polluted sector. The overall AMS measured particle mass
concentrations varied from near zero to a maximum of 12 μg/m3 observed during a forest fire
smoke plume (Fig 1.). The AMS measured aerosol mass loadings were found to be in good
agreement with DMPS derived mass concentrations.
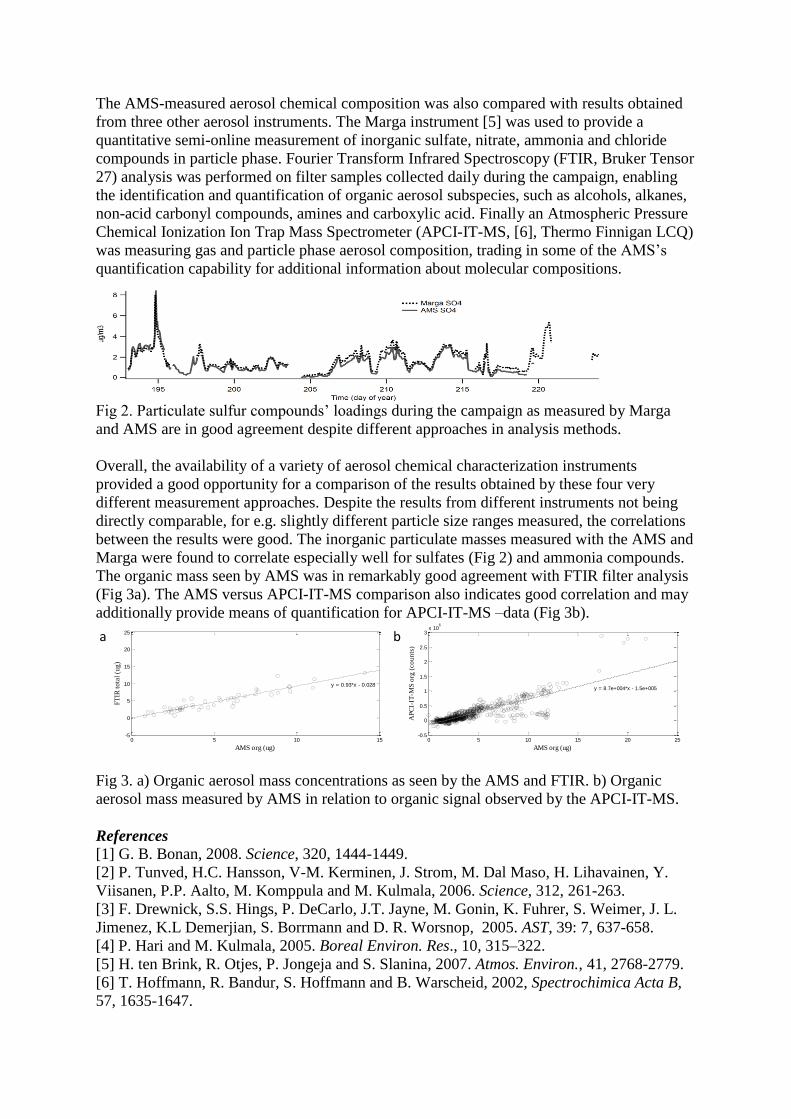
The AMS-measured aerosol chemical composition was also compared with results obtained
from three other aerosol instruments. The Marga instrument [5] was used to provide a
quantitative semi-online measurement of inorganic sulfate, nitrate, ammonia and chloride
compounds in particle phase. Fourier Transform Infrared Spectroscopy (FTIR, Bruker Tensor
27) analysis was performed on filter samples collected daily during the campaign, enabling
the identification and quantification of organic aerosol subspecies, such as alcohols, alkanes,
non-acid carbonyl compounds, amines and carboxylic acid. Finally an Atmospheric Pressure
Chemical Ionization Ion Trap Mass Spectrometer (APCI-IT-MS, [6], Thermo Finnigan LCQ)
was measuring gas and particle phase aerosol composition, trading in some of the AMS’s
quantification capability for additional information about molecular compositions.
Fig 2. Particulate sulfur compounds’ loadings during the campaign as measured by Marga
and AMS are in good agreement despite different approaches in analysis methods.
Overall, the availability of a variety of aerosol chemical characterization instruments
provided a good opportunity for a comparison of the results obtained by these four very
different measurement approaches. Despite the results from different instruments not being
directly comparable, for e.g. slightly different particle size ranges measured, the correlations
between the results were good. The inorganic particulate masses measured with the AMS and
Marga were found to correlate especially well for sulfates (Fig 2) and ammonia compounds.
The organic mass seen by AMS was in remarkably good agreement with FTIR filter analysis
(Fig 3a). The AMS versus APCI-IT-MS comparison also indicates good correlation and may
additionally provide means of quantification for APCI-IT-MS –data (Fig 3b).
Fig 3. a) Organic aerosol mass concentrations as seen by the AMS and FTIR. b) Organic
aerosol mass measured by AMS in relation to organic signal observed by the APCI-IT-MS.
References
[1] G. B. Bonan, 2008. Science, 320, 1444-1449.
[2] P. Tunved, H.C. Hansson, V-M. Kerminen, J. Strom, M. Dal Maso, H. Lihavainen, Y.
Viisanen, P.P. Aalto, M. Komppula and M. Kulmala, 2006. Science, 312, 261-263.
[3] F. Drewnick, S.S. Hings, P. DeCarlo, J.T. Jayne, M. Gonin, K. Fuhrer, S. Weimer, J. L.
Jimenez, K.L Demerjian, S. Borrmann and D. R. Worsnop, 2005. AST, 39: 7, 637-658.
[4] P. Hari and M. Kulmala, 2005. Boreal Environ. Res., 10, 315–322.
[5] H. ten Brink, R. Otjes, P. Jongeja and S. Slanina, 2007. Atmos. Environ., 41, 2768-2779.
[6] T. Hoffmann, R. Bandur, S. Hoffmann and B. Warscheid, 2002, Spectrochimica Acta B,
57, 1635-1647.
0 5 10 15-5
0
5
10
15
20
25
AMS org (ug)
FT
IR t
ota
l (u
g)
y = 0.93*x - 0.028
a
a
)
a
)
A
)
P
C
I
-
I
T
-
M
S
0 5 10 15 20 25-0.5
0
0.5
1
1.5
2
2.5
3x 10
6
AMS org (ug)
AP
CI-
IT-M
S o
rg (
co
un
ts)
y = 8.7e+004*x - 1.5e+005
b
]
)
a
)
a
)
A
)
P
C
I
-
I
T
-
M
S
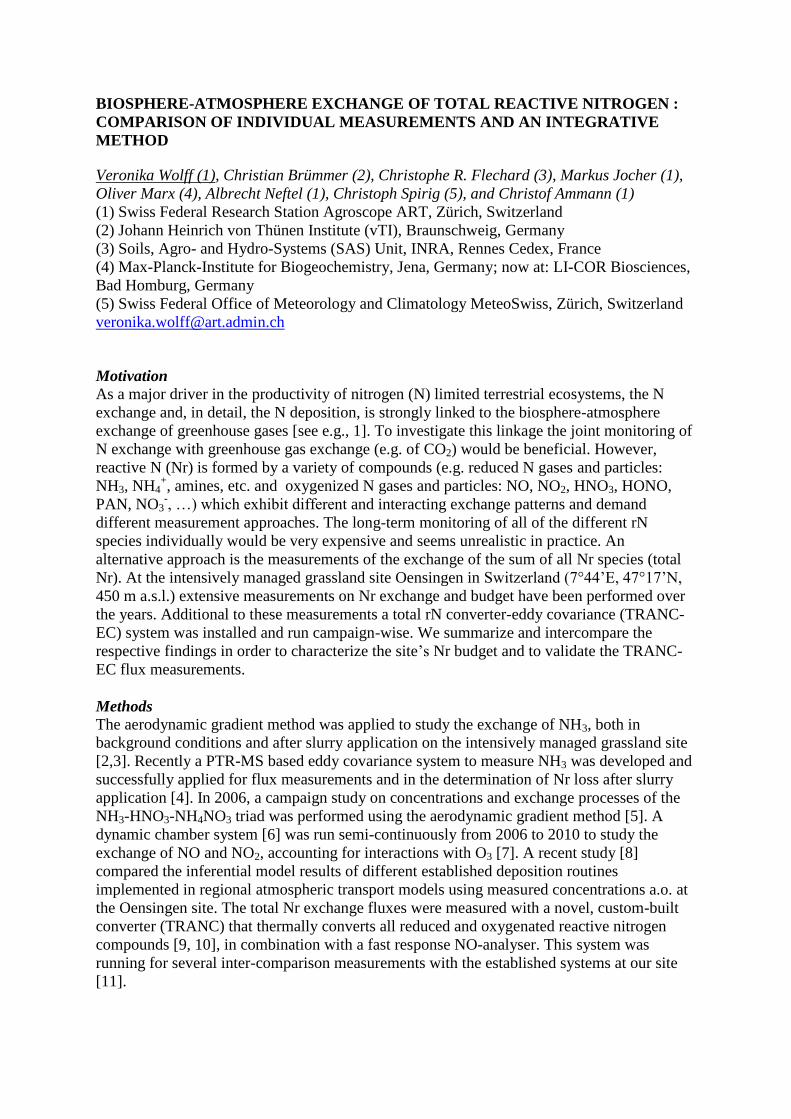
BIOSPHERE-ATMOSPHERE EXCHANGE OF TOTAL REACTIVE NITROGEN :
COMPARISON OF INDIVIDUAL MEASUREMENTS AND AN INTEGRATIVE
METHOD
Veronika Wolff (1), Christian Brümmer (2), Christophe R. Flechard (3), Markus Jocher (1),
Oliver Marx (4), Albrecht Neftel (1), Christoph Spirig (5), and Christof Ammann (1)
(1) Swiss Federal Research Station Agroscope ART, Zürich, Switzerland
(2) Johann Heinrich von Thünen Institute (vTI), Braunschweig, Germany
(3) Soils, Agro- and Hydro-Systems (SAS) Unit, INRA, Rennes Cedex, France
(4) Max-Planck-Institute for Biogeochemistry, Jena, Germany; now at: LI-COR Biosciences,
Bad Homburg, Germany
(5) Swiss Federal Office of Meteorology and Climatology MeteoSwiss, Zürich, Switzerland
Motivation
As a major driver in the productivity of nitrogen (N) limited terrestrial ecosystems, the N
exchange and, in detail, the N deposition, is strongly linked to the biosphere-atmosphere
exchange of greenhouse gases [see e.g., 1]. To investigate this linkage the joint monitoring of
N exchange with greenhouse gas exchange (e.g. of CO2) would be beneficial. However,
reactive N (Nr) is formed by a variety of compounds (e.g. reduced N gases and particles:
NH3, NH4+, amines, etc. and oxygenized N gases and particles: NO, NO2, HNO3, HONO,
PAN, NO3-, …) which exhibit different and interacting exchange patterns and demand
different measurement approaches. The long-term monitoring of all of the different rN
species individually would be very expensive and seems unrealistic in practice. An
alternative approach is the measurements of the exchange of the sum of all Nr species (total
Nr). At the intensively managed grassland site Oensingen in Switzerland (7°44’E, 47°17’N,
450 m a.s.l.) extensive measurements on Nr exchange and budget have been performed over
the years. Additional to these measurements a total rN converter-eddy covariance (TRANC-
EC) system was installed and run campaign-wise. We summarize and intercompare the
respective findings in order to characterize the site’s Nr budget and to validate the TRANC-
EC flux measurements.
Methods
The aerodynamic gradient method was applied to study the exchange of NH3, both in
background conditions and after slurry application on the intensively managed grassland site
[2,3]. Recently a PTR-MS based eddy covariance system to measure NH3 was developed and
successfully applied for flux measurements and in the determination of Nr loss after slurry
application [4]. In 2006, a campaign study on concentrations and exchange processes of the
NH3-HNO3-NH4NO3 triad was performed using the aerodynamic gradient method [5]. A
dynamic chamber system [6] was run semi-continuously from 2006 to 2010 to study the
exchange of NO and NO2, accounting for interactions with O3 [7]. A recent study [8]
compared the inferential model results of different established deposition routines
implemented in regional atmospheric transport models using measured concentrations a.o. at
the Oensingen site. The total Nr exchange fluxes were measured with a novel, custom-built
converter (TRANC) that thermally converts all reduced and oxygenated reactive nitrogen
compounds [9, 10], in combination with a fast response NO-analyser. This system was
running for several inter-comparison measurements with the established systems at our site
[11].
Results
A major effort was made to characterize error sources and ranges of individual flux
measurements in order to minimize their joint error when budgeting [3, 12]. We found the Nr
budget of the site being dominated by NO2 and NH3. Other compounds, such as HNO3,
HONO, particulate NH4+ and NO3
-, contribute to a minor extend to the Nr budget, since
concentrations are small. NH3 exchange was divided into background/growing phase
conditions with consistent deposition patterns and periods of slurry application and
subsequent NH3 emissions [2]. Due to the proximity of the study site to a highway, the NO2
deposition time series was noisy and a parameterisation (as a function of global radiation and
leaf area index) was used to smooth and gap-fill the time series. The measured total Nr fluxes
compared well to NO2 deposition fluxes in growing phase conditions. After slurry
applications, they followed the NH3 fluxes derived from gradient measurements.
References
[1] Sutton, M. et al. (Eds.), 2011, The European Nitrogen Assessment, Cambridge University
Press, Cambridge UK
[2] Flechard, C.R. et al., 2010, Biogeosciences, 7, 537–556.
[3] Spirig, C. et al., 2010, Biogeosciences, 7, 521–536.
[4] Sintermann, J. et al., 2011, Atmos. Meas. Tech., 4, 599-616.
[5] Wolff, V. et al., 2007, Geophys. Res. Abstr., Vol. 9, 02906.
[6] Pape, L. et al., 2009, Biogeosciences, 6, 405-429.
[7] Wolff, V. et al., 2011, Proceedings of the NitroEurope Open Science Conference, 11 - 14
April 2011, Edinburgh.
[8] Flechard, C.R. et al., 2011, Atmos. Chem. Phys., 11, 2703-2728.
[9] Marx, O. et al., 2006, Geophys. Res. Abstracts, 8, 02881.
[10] Brümmer, C. et al., 2011, Proceedings of the NitroEurope Open Science Conference, 11
- 14 April 2011, Edinburgh.
[11] Ammann, C. et al., 2010, Proceedings of the 29th Conference on Agricultural and Forest
Meteorology, Keystone CO, 2-6 August 2010, Boston.
[12] Wolff, V. et al., 2010, Atmos. Meas. Tech., 3, 187–208.
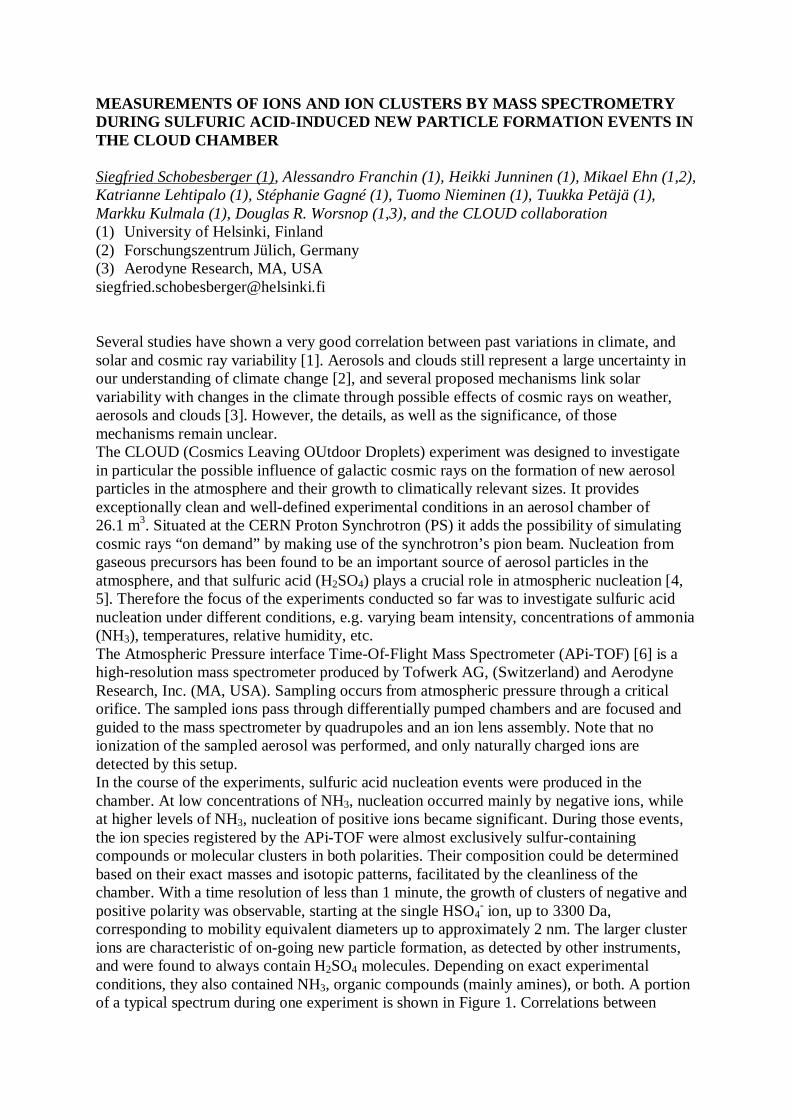
MEASUREMENTS OF IONS AND ION CLUSTERS BY MASS SPECTROMETRY DURING SULFURIC ACID-INDUCED NEW PARTICLE FORMATION EVENTS IN THE CLOUD CHAMBER Siegfried Schobesberger (1), Alessandro Franchin (1), Heikki Junninen (1), Mikael Ehn (1,2), Katrianne Lehtipalo (1), Stéphanie Gagné (1), Tuomo Nieminen (1), Tuukka Petäjä (1), Markku Kulmala (1), Douglas R. Worsnop (1,3), and the CLOUD collaboration (1) University of Helsinki, Finland (2) Forschungszentrum Jülich, Germany (3) Aerodyne Research, MA, USA [email protected] Several studies have shown a very good correlation between past variations in climate, and solar and cosmic ray variability [1]. Aerosols and clouds still represent a large uncertainty in our understanding of climate change [2], and several proposed mechanisms link solar variability with changes in the climate through possible effects of cosmic rays on weather, aerosols and clouds [3]. However, the details, as well as the significance, of those mechanisms remain unclear. The CLOUD (Cosmics Leaving OUtdoor Droplets) experiment was designed to investigate in particular the possible influence of galactic cosmic rays on the formation of new aerosol particles in the atmosphere and their growth to climatically relevant sizes. It provides exceptionally clean and well-defined experimental conditions in an aerosol chamber of 26.1 m3. Situated at the CERN Proton Synchrotron (PS) it adds the possibility of simulating cosmic rays “on demand” by making use of the synchrotron’s pion beam. Nucleation from gaseous precursors has been found to be an important source of aerosol particles in the atmosphere, and that sulfuric acid (H2SO4) plays a crucial role in atmospheric nucleation [4, 5]. Therefore the focus of the experiments conducted so far was to investigate sulfuric acid nucleation under different conditions, e.g. varying beam intensity, concentrations of ammonia (NH3), temperatures, relative humidity, etc. The Atmospheric Pressure interface Time-Of-Flight Mass Spectrometer (APi-TOF) [6] is a high-resolution mass spectrometer produced by Tofwerk AG, (Switzerland) and Aerodyne Research, Inc. (MA, USA). Sampling occurs from atmospheric pressure through a critical orifice. The sampled ions pass through differentially pumped chambers and are focused and guided to the mass spectrometer by quadrupoles and an ion lens assembly. Note that no ionization of the sampled aerosol was performed, and only naturally charged ions are detected by this setup. In the course of the experiments, sulfuric acid nucleation events were produced in the chamber. At low concentrations of NH3, nucleation occurred mainly by negative ions, while at higher levels of NH3, nucleation of positive ions became significant. During those events, the ion species registered by the APi-TOF were almost exclusively sulfur-containing compounds or molecular clusters in both polarities. Their composition could be determined based on their exact masses and isotopic patterns, facilitated by the cleanliness of the chamber. With a time resolution of less than 1 minute, the growth of clusters of negative and positive polarity was observable, starting at the single HSO4
- ion, up to 3300 Da, corresponding to mobility equivalent diameters up to approximately 2 nm. The larger cluster ions are characteristic of on-going new particle formation, as detected by other instruments, and were found to always contain H2SO4 molecules. Depending on exact experimental conditions, they also contained NH3, organic compounds (mainly amines), or both. A portion of a typical spectrum during one experiment is shown in Figure 1. Correlations between
features of the steady-state cluster distributions during nucleation and experimental variables give detailed insights into the early steps of new (charged) particle formation driven by sulfuric acid.
Fig. 1. A part of the negative ion spectrum, as recorded during a nucleation experiment in the CLOUD chamber. Clear peaks are visible, originating from molecular clusters as labeled. The isotopic patterns characteristic of these clusters can be seen. CERN’s support of CLOUD with important technical resources and provision of a particle beam from the PS is gratefully acknowledged. This research was funded by the EC's 7th Framework Programme under grant agreement number 215072 (Marie Curie Initial Training Network "CLOUD-ITN"), by the Academy of Finland (incl. the Academy of Finland Center of Excellence program under project number 1118615), by the German Federal Ministry of Education and Research under project number 01LK0902A and the Swiss National Science Foundation. [1] J. Kirkby, 2007, Surv. Geophys., 28, 333-375. [2] Intergovernmental Panel on Climate Change (IPCC), 2007, in Contribution of Working Group I to the Fourth Assessment Report of the Intergovernmental Panel on Climate Change, 2007, S. Solomon et al., Eds. (Cambridge University Press, Cambridge, United Kingdom and New York, NY, USA). [3] K.S. Carslaw et al., 2002, Science, 298, 1732 [4] M. Kulmala et al., 2004, J. Aerosol Sci., 35, 143-176. [5] I. Riipinen et al., 2007, Atmos. Chem. Phys., 7, 1899–1914. [6] H. Junninen et al., 2010, Atmos. Meas. Tech., 3, 1039–1053.

Nitrous oxide emission from purple soil under maize cultivation in southwestern China
Minghua Zhou (1, 2), Bo Zhu (1), Klaus Butterbach-Bahl (2), Xiaoguo Wang (1), Yanqiang Wang (1) (1) Key Laboratory of Mountain Environment Evolvement and Regulation, Institute of Mountain Hazards and Environment, Chinese Academy of Sciences, 610041 Chengdu, China (2)Institute for Meteorology and Climate Research, Atmospheric Environmental Research (IMK-IFU), Karlsruhe Institute of Technology, 82467 Garmisch-Partenkirchen, Germany *Corresponding author: Bo Zhu, Email: [email protected] Agricultural soils are the major source of N2O, accounting for 60% of the global anthropogenic N2O flux. Rain-fed maize cultivation with purple soil was a dominant agricultural system in the region of southwestern China. Southwestern China is one of the most intensively used agricultural regions in China, occupying 7% of the national cropland and producing 10% of China’s agricultural feed and food production. However, there were few datasets on N2O fluxes from purple soil under maize cultivation in this area. To investigate N2O emission from purple soil under maize cultivation, we conducted a field experiment using static chamber techniques at the Yanting Agro-ecological Experimental Station of Purple Soil, Southwestern China in 2004. The experiment included three treatments: soils fertilized with 0(N0), 150(N150), and 250(N250) kg N ha-1. Results showed that N2O flux were 0.02 ±0.01~0.18± 0.03, 0.02 ±0.01~1.55± 0.41, and 0.02 ±0.01~2.21± 0.03 mg N m-2 hr-1 in the N0, N150 and N250 treatment, respectively. N2O emission peaks followed the nitrogen fertilizer applications and rain events. Nitrogen fertilizer application rates significantly increased the cumulative N2O fluxes in maize season. Cumulative N2O fluxes from purple soil were 2.53 ±0.11, 4.73 ±1.18 and 7.62 ±0.87kg N ha-1 in the N0, N150 and N250 treatment, respectively. The emission factor of applied N fertilizer as N2O was 1.5% and 2.0% in the N150 and N250 treatment, respectively.
Fig.1 Ncontinuoerror (S Table 1 N2O fluxEmission
Mean± SE
2O fluxes frous arrow inE, n=3)
Cumulative
xes (kg N ha-1)n factor (%)
E (n=3). Mean
rom purple ndicates the
e N2O fluxe
N0 ) 2.53 ±0
-
ns followed b
soil under te date of N f
es and emiss
0.11c
y the differen
three N treafertilizer ap
sion factor
N1504.73 1.5
nt letter are sig
atments in mpplication, v
from purple
0 ±1.18b
gnificantly diff
maize growinvertical bar m
e soil in mai
N27.62.0
ferent (LSD, p
ng season. Tmeans stand
ize growing
250 62 ±0.87a 0
p< 0.05)
The dard
g season.
PROCESSES CONTROLLING THE INTER-ANNUAL VARIABILITY OF THE CARBON BALANCE OF EUROPEAN FOREST SITES AND EFFECT OF CLIMATIC EXTREMES FROM LONG TERM EDDY COVARIANCE DATA. ULuca Belelli MarchesiniU and Dario Papale DiSAFRi, University of Tuscia, Italy. [email protected] We present the analysis of ecosystem level COB2B fluxes of 7 European forest sites selected among those with the longest records (9-14 years) of eddy covariance available from 1996 to 2009. Selected sites are located across a climatic range of including boreal (1 site), cool temperate (5 sites) and warm temperate (3 sites) types with mean annual temperatures ranging from 3.8 to 15.1°C and precipitation distributed across 709-972 mm. The objectives of the study are: i) the evaluation of the response of COB2B fluxes to climate anomalies and extremes including lag effects; ii) the generalization of the response of fluxes to climate variability, with particular focus on extremes; iii) the evaluation of the effect of non climatic factors, such as forest management or natural disturbances, on the variability of carbon fluxes. In particular we analyzed the generic response of net ecosystem exchange (NEE) integrated at different temporal scale (from daily to annual level), as well as its assimilative (GPP) and respiratory (Reco) components, to the main climatic drivers such as air temperature (Ta), global radiation (Rg), precipitation (PPT), vapor pressure deficit (VPD), soil temperature (Ts) and soil water content (SWC) and their variation across different climatic groups. We examined the obtained patterns with special regard to the effect of extreme climatic values and to the existence of threshold values characterizing the functional responses. For most of the sites the variation of climate alone resulted in a smaller year to year variation in NEE and its components, than those determined by disturbances and by their carry over effects. Changes in ecosystem structural properties are indeed translated into changes in the eco-physiological parameters characterizing each site, which are derived from specific functional responses for NEE, GPP and Reco. We discuss the relative importance of the drivers of the carbon balance of the investigated forest ecosystems as the superimposition of the effects of climate, management and natural disturbances.
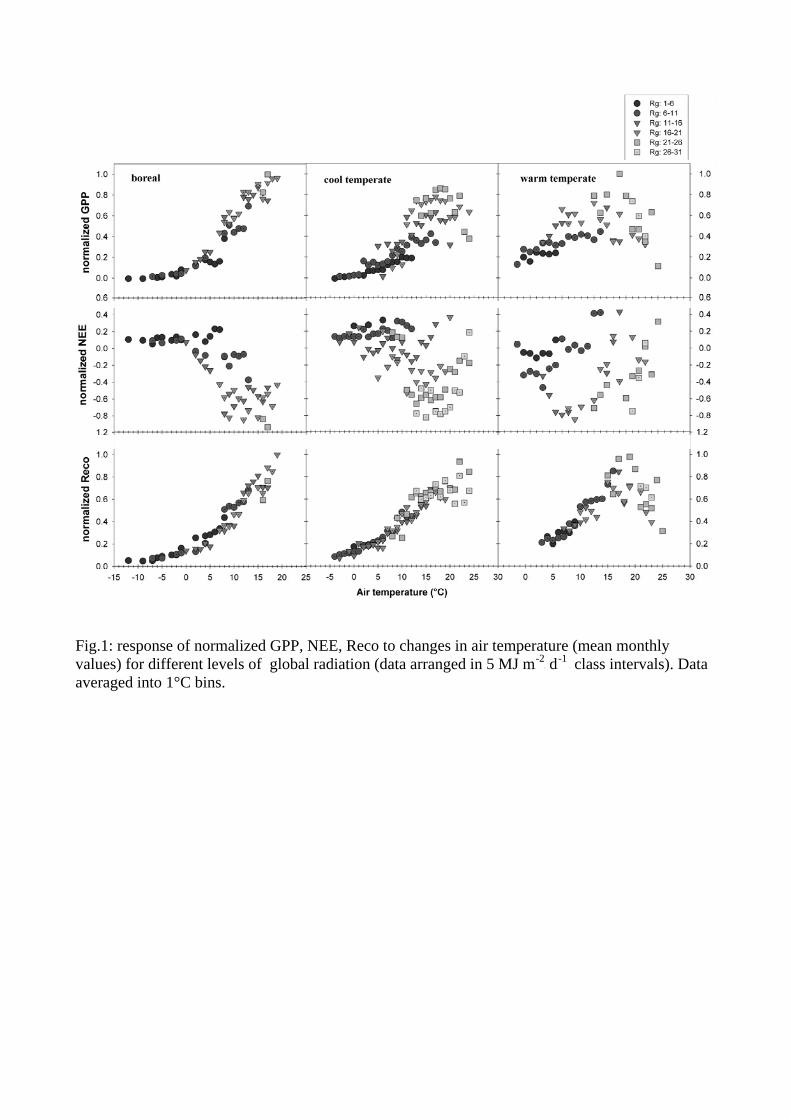
Fig.1: response of normalized GPP, NEE, Reco to changes in air temperature (mean monthly values) for different levels of global radiation (data arranged in 5 MJ mP
-2P dP
-1 P class intervals). Data
averaged into 1°C bins.
1
DETERMINATION OF N2O EMISSION RATES FROM SOIL BY OPEN-PATH MEASUREMENT METHODS DURING STABLE BOUNDARY LAYER CONDITIONS Klaus Schäfer (1), Richard H. Grant (2), Stefan Emeis (1), Armin Raabe (3), Carolin von der Heide (4), Hans Peter Schmid (1), Carsten Jahn (1) (1) Institute for Meteorology and Climate Research, Atmospheric Environmental Research (IMK-IFU), Karlsruhe Institute of Technology, Garmisch-Partenkirchen, Germany (2) Department of Agronomy, Purdue University, West Lafayette, IN, USA (3) Institute for Meteorology, University of Leipzig, Leipzig, Germany (4) Institute of Soil Science, Leibniz University Hannover, Hannover, Germany E-Mail of the corresponding author: [email protected] The determination of trace gas emission rates from soils is an important task of climate monitoring, climate change detection as well as air quality observation. A better knowledge of the temporal and spatial variations of the trace gas fluxes from soil requires an up-scaling of the source and sink measurements near the surface. Measurements of fluxes at larger spatial scales (10,000 m2) require the application of micro-meteorological measurement methods. Because a large number of simultaneous single chamber measurements need high technical and financial efforts [1] a further development of non-intrusive micrometeorological flux measurement methods is necessary. Non-intrusive soil emission and flux measurement techniques are available for CO2 and H2O only, i.e. they are yet not applicable for the greenhouse gas N2O and other trace gases. A micrometeorological flux gradient method [2] utilizing a non-intrusive path-averaging measurement method is described in this study (so called open-path flux-gradient method). The open path lengths should be bigger than 100 m. The corresponding up-scaling is 10,000 up to 100,000 m2, i.e. the method is spatially representative in this area. Successful application of this method requires confidence in the gradients of trace gas concentration and wind and in the applicability of boundary-layer turbulence theory. While there is relatively high confidence in flux measurements made under unstable atmospheres with mean winds greater than 1 m s-1, there is great uncertainty in flux measurements made under free convective or stable conditions. The quality-assured determinations of fluxes under low wind, stable or night-time atmospheric conditions are explored when the continuous ‘steady state’ turbulence of the surface boundary layer breaks down and the layer can have phenomena like intermittent and wave-like turbulent structures. Reliable concentration and concentration gradient measurements of the trace gas N2O were determined based on the minimum detection limits of the open-path FTIR measurement method and the significance of concentration gradients (lower and upper height 0.5 m and 2.7 m, respectively) derived from the individual measurements. Reliable measurements of the three orthogonal components of the wind were determined based on the turbulence statistics and sensor minimum detection limits of three-dimensional (3D) ultrasonic anemometers (USA) at the different heights. 3D USA measurements were used

2
to measure height differences of atmospheric parameters, which were the bases for calculating vertical fluxes of gaseous compounds, momentum and sensible heat. All series of measurement data of the open-path flux gradient method were averaged over 30 minutes. Different approaches for calculating the flux data were applied using the empirically-derived turbulence parameters and using those following the Monin-Obukhov similarity theory (MOST) with stability corrections. Additionally, the N2O fluxes were calculated with the concentration gradient and the diffusivity as exchange coefficient. The 30-minutes-mean diffusivity was calculated from the directly measured friction velocity (mean of the measured friction velocities in the lower and upper height, see also [3]) and the measured height difference of the horizontal wind speeds. This needs fewer assumptions than the prior flux-gradient methods in that there is no assumed MOST correction for stability correction and no assumed neutral MOST logarithmic wind profile. Tests used to evaluate the nature of the flow variability included (1) directional shear in the mean wind, (2) continuity in the calculated L for all heights of measurement, (3) analysis of the time series for intermittency, (4) flux Richardson number indicating the dominance of turbulent production over destruction and (5) analysis of the spectral distribution of the variance of vertical velocity perturbations. The FTIR measurement time was about 5 minutes. The detection limits of the K300 spectrometers at a 100 m open path were for N2O 5 ppb or 10 µg m-3 The measured height differences of concentrations were compared with the given statistical error values in both heights (combined errors at 0.90 level) and only positive differences were accepted. The combined error of the difference of the 30-minutes-mean measured concentrations in both heights is the square root of the sum of the square of the mean statistical error divided by the number of the measurements in the 30-minutes-intervals (standard deviation) in each height. A t-statistics for 90 % probability of statistically significant differences is introduced (factor 1.44). Two measurement campaigns during different seasons (October 2007 and June 2008) were analyzed in order to test the scale-integrating methodologies together with N2O measurements that were conducted with four chambers in the same area on the following day. The investigations were conducted in the flat catchment area of the Fuhrberger Feld aquifer, 30 km northeast of the city of Hannover in Northern Germany, of 20 - 40 m thick sand where the cultivated grass species Festuca rubra remained on the plot. The mean N2O emission rates differed considerably between the applied methods (MOST 236 µg m-2 h-1, Diffusivity 903 µg m-2 h-1, chambers 313 µg m-2 h-1). The advantages and disadvantages of the open-path flux-gradient method and the limitations to large-scale long-term emissions determinations will be discussed. References [1] D.A. Turner et al., 2008, Plant Soil, 309, 77-88. [2] A.K. Luhar et al., 2009, Boundary Layer Meteorol, 130, 249-274. [3] R.B. Stull, 1997, Kluwer Academic Publishers, The Netherlands, 666 pp.

MEASUREMENTS WITH A VH-TDMA ONBOARD R/V ATLANTIS IN CALNEX 2010 CAMPAIGN Jani Hakala (1), Jyri Mikkilä (1), Mikael Ehn (1), Erkki Siivola (1), Heikki Junninen (1), Mikhail Paramonov (1), Tuukka Petäjä (1), Tim Bates (2), Ibraheem Nuaamaan (3,4), Katherine Hayden (4), Shao-Meng Li (4), Timothy Onash (5), Paola Massoli (5), Douglas R. Worsnop (5), Markku Kulmala (1) and Patricia K. Quinn (2) (1) Department of Physics, 00014 University of Helsinki, Finland (2) NOAA/PMEL, 7600 Sand Point Way NE, Seattle, WA 98115, USA (3) York University, Toronto, Ontario, Canada (4) Environment Canada, 4906 Dufferin St Toronto RR 5, North Bay, ON P1B 8Z4, Canada (5) Aerodyne Research Inc., 45 Manning Road Billerica, MA, USA [email protected] Aerosol particles are ubiquitous in the atmosphere. Their effect on the global climate has not yet been resolved fully. The particles also cause adverse health effects to the human population. These various consequences depend on aerosol particle size as well as their composition. Particle size and hygroscopicity (ie how particles behave as a function of relative humidity, RH) has a crucial role governing their ability to participate in the cloud processes and determine their fate in human airways. With a Volatility Hygroscopicity Tandem Differential Mobility Analyzer (VH-TDMA) we can study the volatility and hygroscopicity of aerosol particles, as well as the hygroscopicity of the various evaporation stages of particles. This study represents the results of the VH-TDMA measurements in CalNex 2010 campaign. The operation principle of the VH-TDMA is as follows [1, 2]. The VH-TDMA developed in this study uses three Vienna type Differential Mobility Analyzers (DMAs), marked as DMA-1, DMA-2a and DMA_2b. A monodisperse fragment is separated from dried aerosol population with DMA1 and led to DMA-2a and DMA-2b operated in parallel. The sample is either passed directly to the second DMAs, or passes through a thermal denuder, using a solenoid valve. DMA-2a measures the dry size and DMA-2b measures the size after the aerosol is humidified. A full measurement cycle for a certain size with a certain denuder temperature and RH consist of a size distribution scan with and without the thermal denuder. TSI CPC-3772 and CPC-3010 are used to detect the particles passing DMA-2a and DMA-2b, respectively. The VH-TDMA was located in a R/V Atlantis reseach vessel during the CalNex campaign from May 14th to June 8th. R/V Atlantis sailed near the coast of California from San Diego to San Francisco. During the cruise, various types of aerosols were encountered and measured from polluted urban aerosol to clean marine aerosol. Also sea salt particles produced in situ by bubbling seawater with specially constructed raft were measured. As an example, in figure 1 is presented the hygroscopic and volatility growth factors (HGF and VGF recpectively), and hygroscopic growth factors of particles after passing through the thermal denuder (VHGF). It shows the growth factor distributions of 100 nm particles of polluted urban aerosol at 90% RH. The mode with the HGF around 1.6 are most likely ammonium sulfate particles (HGF >1.6 at RH 90%) with some less hygroscopic contaminants. Ammonium sulfate particles disintegrates at higher temperatures (>150°C); this is clearly visible in the figure. The mode with the HGF around 1.1 is made of either black carbon or fresh organic aerosol particles. Black carbon particles are non-volatile and the volatility of organic particles depends on the composition.
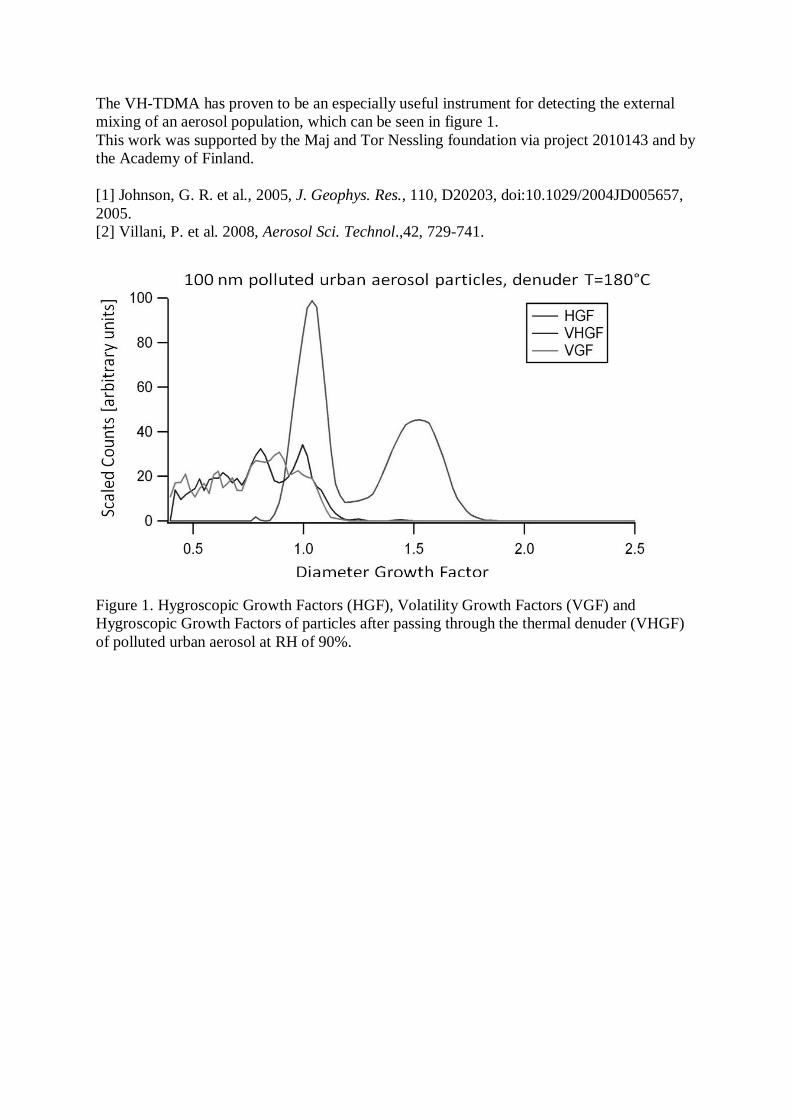
The VH-TDMA has proven to be an especially useful instrument for detecting the external mixing of an aerosol population, which can be seen in figure 1. This work was supported by the Maj and Tor Nessling foundation via project 2010143 and by the Academy of Finland. [1] Johnson, G. R. et al., 2005, J. Geophys. Res., 110, D20203, doi:10.1029/2004JD005657, 2005. [2] Villani, P. et al. 2008, Aerosol Sci. Technol.,42, 729-741.
Figure 1. Hygroscopic Growth Factors (HGF), Volatility Growth Factors (VGF) and Hygroscopic Growth Factors of particles after passing through the thermal denuder (VHGF) of polluted urban aerosol at RH of 90%.

LOCAL NETWORKS OF EDDY COVARIANCE STATIONS: EXAMPLES FROM
AN EXPERIMENT IN A MID-LATITUDE, AGRICULTURAL LANDSCAPE
Alexander Graf (1), Anneke van de Boer (2,3), Dirk Schüttemeyer (2), Arnold Moene (3),
Harrie-Jan Hendricks Franssen (1)
(1) Agrosphere (IBG-3), Forschungszentrum Jülich, Germany
(2) Meteorological Institute University Bonn, Germany
(3) Meteorology and Air Quality Group, Wageningen University, The Netherlands
Throughout the past decades, a growing number of continuously operated eddy covariance
stations have been organized in national and international networks such as FLUXNET [1].
The joint availability of data from such networks enabled a large number of studies improving
our understanding of the spatial variability of land surface – atmosphere exchange and its role
in the global climate system. Recently, it has been suggested that some of the remaining
uncertainties in such analyses, as e.g. those associated with the energy balance closure
problem, might best be addressed by local scale networks [2]. While their continuous
operation remains a challenge, some lessons on meaningful set-ups might already be learned
from existing datasets, which have been provided by short-term experiments.
Here, we present results from a local network of eddy covariance stations operated during the
vegetation period 2009 in an agricultural mosaic landscape. Three masts with two
measurement heights each were operated at distances of within a winter wheat, winter barley,
and sugarbeet field, respectively, at distances between 200 and 400 m. These three land use
types dominate the surrounding within 1 km. Additional data from a mixed-footprint station at
the same location, as well as of various more remote micrometeorological instruments, are
available for sub-periods. A natural tracer experiment analysis with different footprint models
is presented, and used to estimate errors in the fluxes of sensible and latent heat flux as well as
CO2 flux induced by inhomogeneity within the footprint. A comprehensive comparison of
existing and new algorithms to simultaneously derive roughness length and displacement
height is discussed, and the dependence of energy balance closure on land use type and
measurement height is studied. In the end, we briefly discuss possible future improvements to
local network set-ups.
[1] D. Baldocchi, 2008, Aust. J. Bot., 56, 1-26.
[2] L. Mahrt, 2010, Agric. Forest Meteorol., 150, 501-509.
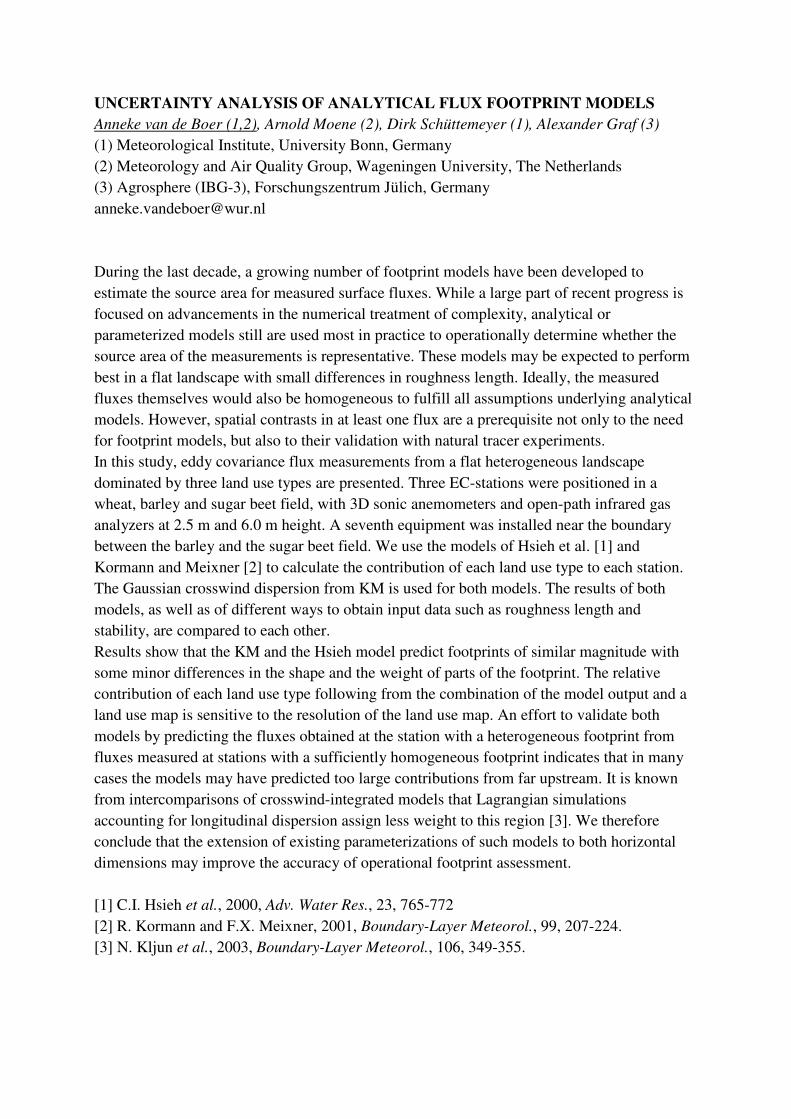
UNCERTAINTY ANALYSIS OF ANALYTICAL FLUX FOOTPRINT MODELS
Anneke van de Boer (1,2), Arnold Moene (2), Dirk Schüttemeyer (1), Alexander Graf (3)
(1) Meteorological Institute, University Bonn, Germany
(2) Meteorology and Air Quality Group, Wageningen University, The Netherlands
(3) Agrosphere (IBG-3), Forschungszentrum Jülich, Germany
During the last decade, a growing number of footprint models have been developed to
estimate the source area for measured surface fluxes. While a large part of recent progress is
focused on advancements in the numerical treatment of complexity, analytical or
parameterized models still are used most in practice to operationally determine whether the
source area of the measurements is representative. These models may be expected to perform
best in a flat landscape with small differences in roughness length. Ideally, the measured
fluxes themselves would also be homogeneous to fulfill all assumptions underlying analytical
models. However, spatial contrasts in at least one flux are a prerequisite not only to the need
for footprint models, but also to their validation with natural tracer experiments.
In this study, eddy covariance flux measurements from a flat heterogeneous landscape
dominated by three land use types are presented. Three EC-stations were positioned in a
wheat, barley and sugar beet field, with 3D sonic anemometers and open-path infrared gas
analyzers at 2.5 m and 6.0 m height. A seventh equipment was installed near the boundary
between the barley and the sugar beet field. We use the models of Hsieh et al. [1] and
Kormann and Meixner [2] to calculate the contribution of each land use type to each station.
The Gaussian crosswind dispersion from KM is used for both models. The results of both
models, as well as of different ways to obtain input data such as roughness length and
stability, are compared to each other.
Results show that the KM and the Hsieh model predict footprints of similar magnitude with
some minor differences in the shape and the weight of parts of the footprint. The relative
contribution of each land use type following from the combination of the model output and a
land use map is sensitive to the resolution of the land use map. An effort to validate both
models by predicting the fluxes obtained at the station with a heterogeneous footprint from
fluxes measured at stations with a sufficiently homogeneous footprint indicates that in many
cases the models may have predicted too large contributions from far upstream. It is known
from intercomparisons of crosswind-integrated models that Lagrangian simulations
accounting for longitudinal dispersion assign less weight to this region [3]. We therefore
conclude that the extension of existing parameterizations of such models to both horizontal
dimensions may improve the accuracy of operational footprint assessment.
[1] C.I. Hsieh et al., 2000, Adv. Water Res., 23, 765-772
[2] R. Kormann and F.X. Meixner, 2001, Boundary-Layer Meteorol., 99, 207-224.
[3] N. Kljun et al., 2003, Boundary-Layer Meteorol., 106, 349-355.
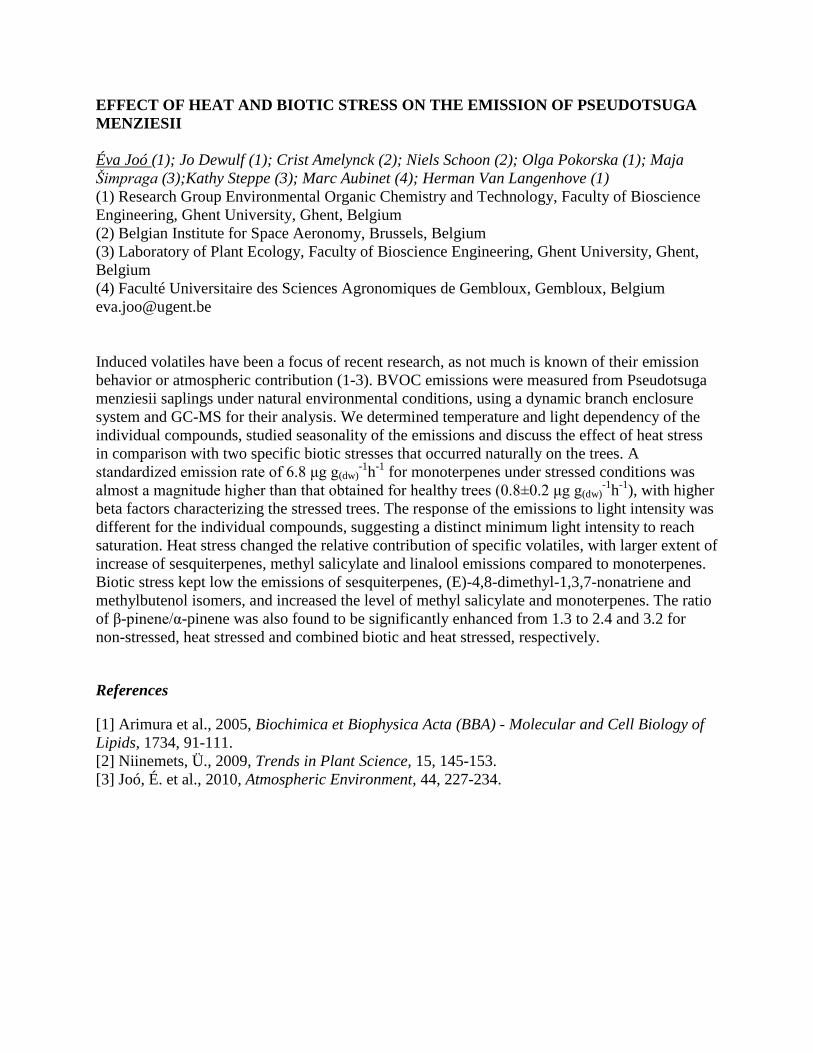
EFFECT OF HEAT AND BIOTIC STRESS ON THE EMISSION OF PSEUDOTSUGA
MENZIESII
Éva Joó (1); Jo Dewulf (1); Crist Amelynck (2); Niels Schoon (2); Olga Pokorska (1); Maja
Šimpraga (3);Kathy Steppe (3); Marc Aubinet (4); Herman Van Langenhove (1)
(1) Research Group Environmental Organic Chemistry and Technology, Faculty of Bioscience
Engineering, Ghent University, Ghent, Belgium
(2) Belgian Institute for Space Aeronomy, Brussels, Belgium
(3) Laboratory of Plant Ecology, Faculty of Bioscience Engineering, Ghent University, Ghent,
Belgium
(4) Faculté Universitaire des Sciences Agronomiques de Gembloux, Gembloux, Belgium
Induced volatiles have been a focus of recent research, as not much is known of their emission
behavior or atmospheric contribution (1-3). BVOC emissions were measured from Pseudotsuga
menziesii saplings under natural environmental conditions, using a dynamic branch enclosure
system and GC-MS for their analysis. We determined temperature and light dependency of the
individual compounds, studied seasonality of the emissions and discuss the effect of heat stress
in comparison with two specific biotic stresses that occurred naturally on the trees. A
standardized emission rate of 6.8 μg g(dw)-1
h-1
for monoterpenes under stressed conditions was
almost a magnitude higher than that obtained for healthy trees (0.8±0.2 μg g(dw)-1
h-1
), with higher
beta factors characterizing the stressed trees. The response of the emissions to light intensity was
different for the individual compounds, suggesting a distinct minimum light intensity to reach
saturation. Heat stress changed the relative contribution of specific volatiles, with larger extent of
increase of sesquiterpenes, methyl salicylate and linalool emissions compared to monoterpenes.
Biotic stress kept low the emissions of sesquiterpenes, (E)-4,8-dimethyl-1,3,7-nonatriene and
methylbutenol isomers, and increased the level of methyl salicylate and monoterpenes. The ratio
of β-pinene/α-pinene was also found to be significantly enhanced from 1.3 to 2.4 and 3.2 for
non-stressed, heat stressed and combined biotic and heat stressed, respectively.
References
[1] Arimura et al., 2005, Biochimica et Biophysica Acta (BBA) - Molecular and Cell Biology of
Lipids, 1734, 91-111.
[2] Niinemets, Ü., 2009, Trends in Plant Science, 15, 145-153.
[3] Joó, É. et al., 2010, Atmospheric Environment, 44, 227-234.
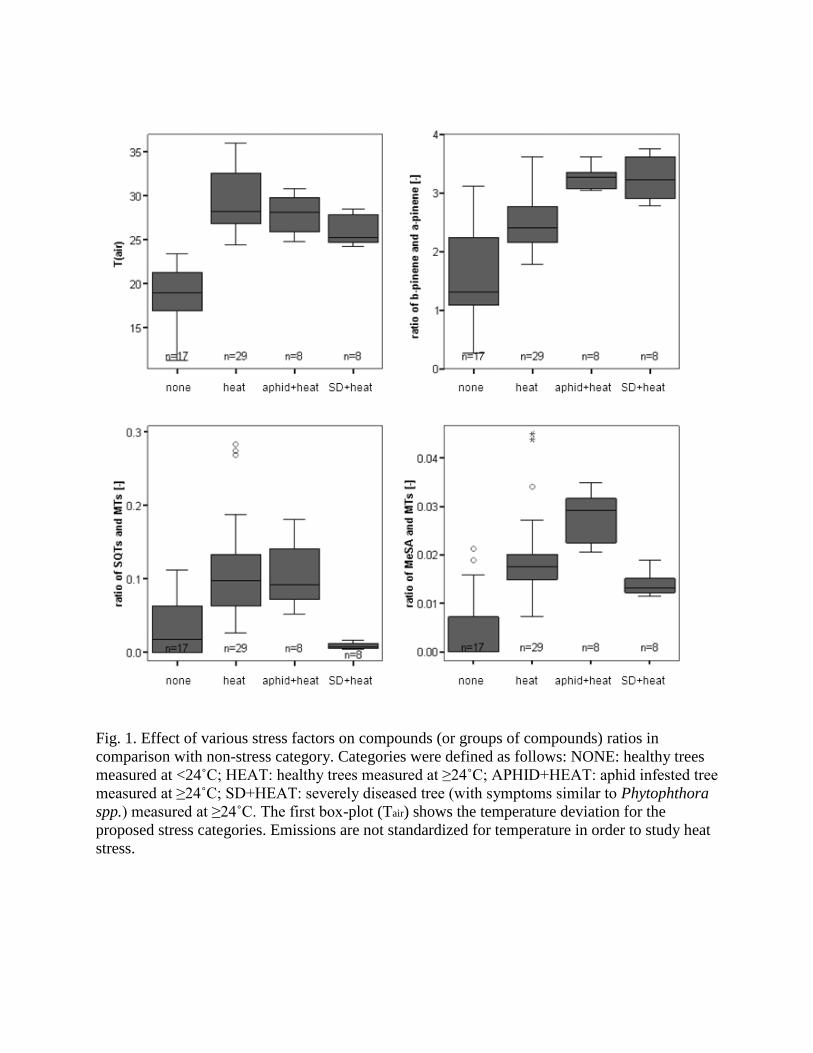
Fig. 1. Effect of various stress factors on compounds (or groups of compounds) ratios in
comparison with non-stress category. Categories were defined as follows: NONE: healthy trees
measured at <24˚C; HEAT: healthy trees measured at ≥24˚C; APHID+HEAT: aphid infested tree
measured at ≥24˚C; SD+HEAT: severely diseased tree (with symptoms similar to Phytophthora
spp.) measured at ≥24˚C. The first box-plot (Tair) shows the temperature deviation for the
proposed stress categories. Emissions are not standardized for temperature in order to study heat
stress.
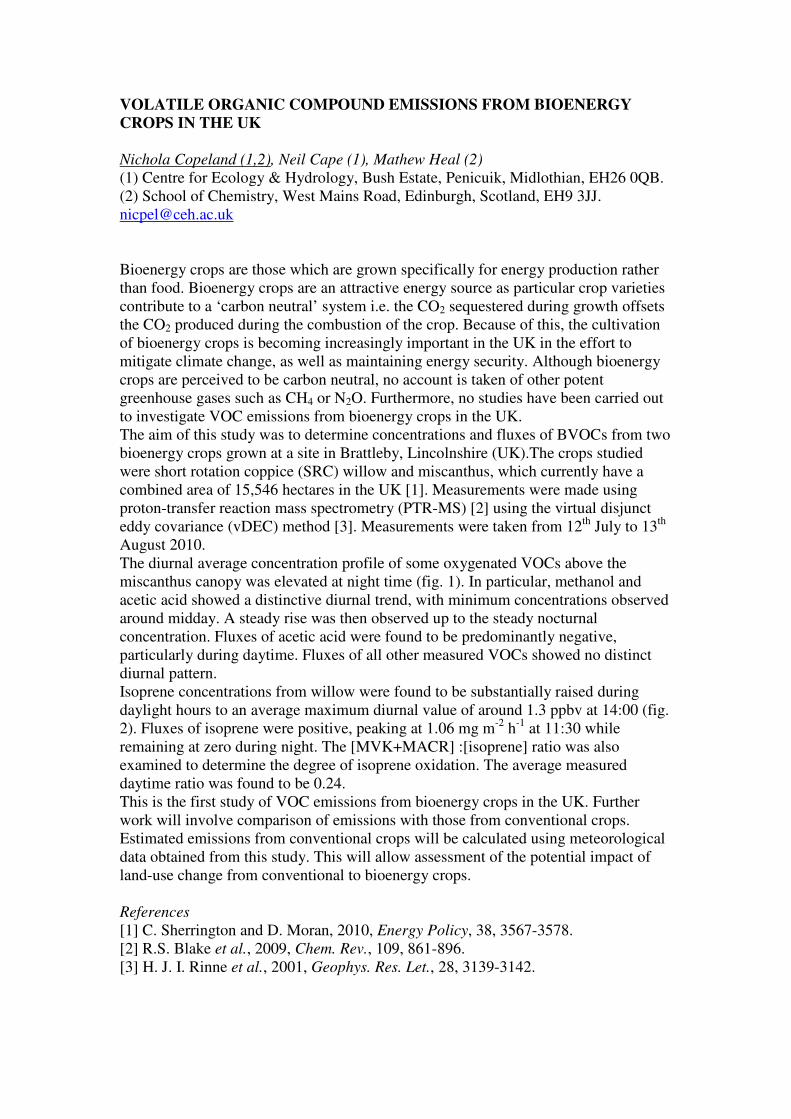
VOLATILE ORGANIC COMPOUND EMISSIONS FROM BIOENERGY
CROPS IN THE UK
Nichola Copeland (1,2), Neil Cape (1), Mathew Heal (2)
(1) Centre for Ecology & Hydrology, Bush Estate, Penicuik, Midlothian, EH26 0QB.
(2) School of Chemistry, West Mains Road, Edinburgh, Scotland, EH9 3JJ.
Bioenergy crops are those which are grown specifically for energy production rather
than food. Bioenergy crops are an attractive energy source as particular crop varieties
contribute to a ‘carbon neutral’ system i.e. the CO2 sequestered during growth offsets
the CO2 produced during the combustion of the crop. Because of this, the cultivation
of bioenergy crops is becoming increasingly important in the UK in the effort to
mitigate climate change, as well as maintaining energy security. Although bioenergy
crops are perceived to be carbon neutral, no account is taken of other potent
greenhouse gases such as CH4 or N2O. Furthermore, no studies have been carried out
to investigate VOC emissions from bioenergy crops in the UK.
The aim of this study was to determine concentrations and fluxes of BVOCs from two
bioenergy crops grown at a site in Brattleby, Lincolnshire (UK).The crops studied
were short rotation coppice (SRC) willow and miscanthus, which currently have a
combined area of 15,546 hectares in the UK [1]. Measurements were made using
proton-transfer reaction mass spectrometry (PTR-MS) [2] using the virtual disjunct
eddy covariance (vDEC) method [3]. Measurements were taken from 12th
July to 13th
August 2010.
The diurnal average concentration profile of some oxygenated VOCs above the
miscanthus canopy was elevated at night time (fig. 1). In particular, methanol and
acetic acid showed a distinctive diurnal trend, with minimum concentrations observed
around midday. A steady rise was then observed up to the steady nocturnal
concentration. Fluxes of acetic acid were found to be predominantly negative,
particularly during daytime. Fluxes of all other measured VOCs showed no distinct
diurnal pattern.
Isoprene concentrations from willow were found to be substantially raised during
daylight hours to an average maximum diurnal value of around 1.3 ppbv at 14:00 (fig.
2). Fluxes of isoprene were positive, peaking at 1.06 mg m-2
h-1
at 11:30 while
remaining at zero during night. The [MVK+MACR] :[isoprene] ratio was also
examined to determine the degree of isoprene oxidation. The average measured
daytime ratio was found to be 0.24.
This is the first study of VOC emissions from bioenergy crops in the UK. Further
work will involve comparison of emissions with those from conventional crops.
Estimated emissions from conventional crops will be calculated using meteorological
data obtained from this study. This will allow assessment of the potential impact of
land-use change from conventional to bioenergy crops.
References
[1] C. Sherrington and D. Moran, 2010, Energy Policy, 38, 3567-3578.
[2] R.S. Blake et al., 2009, Chem. Rev., 109, 861-896.
[3] H. J. I. Rinne et al., 2001, Geophys. Res. Let., 28, 3139-3142.
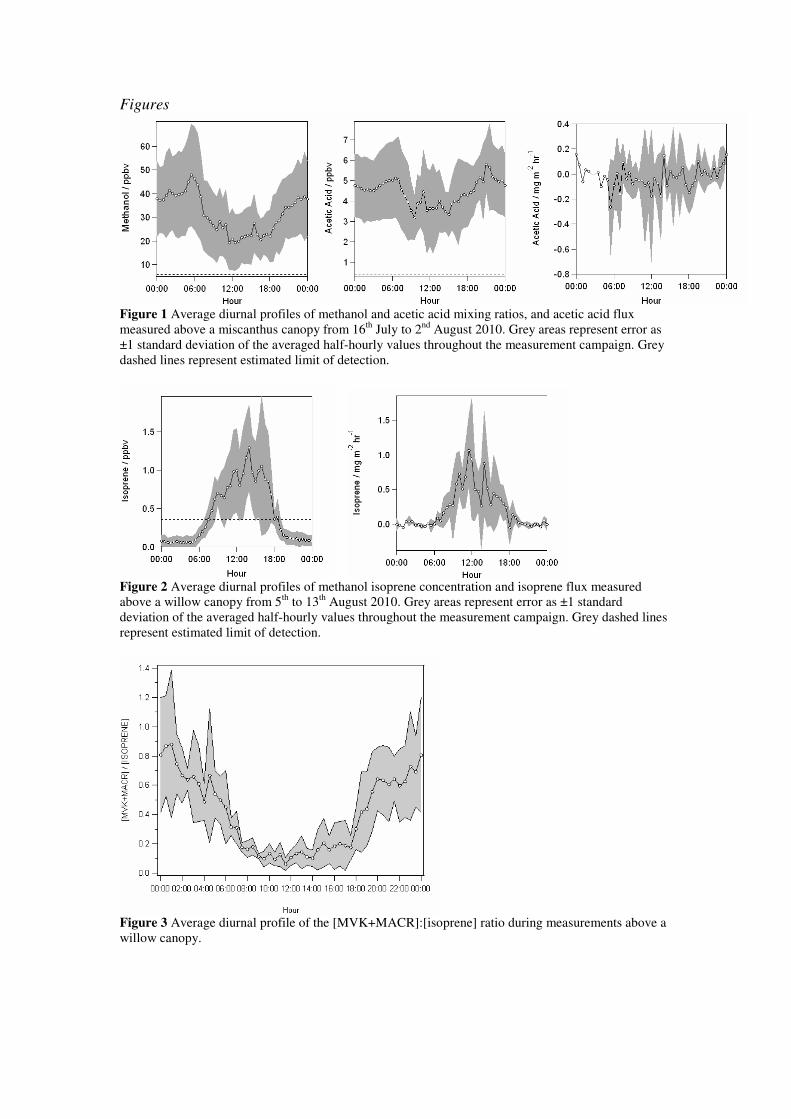
Figures
Figure 1 Average diurnal profiles of methanol and acetic acid mixing ratios, and acetic acid flux
measured above a miscanthus canopy from 16th
July to 2nd
August 2010. Grey areas represent error as
±1 standard deviation of the averaged half-hourly values throughout the measurement campaign. Grey
dashed lines represent estimated limit of detection.
Figure 2 Average diurnal profiles of methanol isoprene concentration and isoprene flux measured
above a willow canopy from 5th
to 13th
August 2010. Grey areas represent error as ±1 standard
deviation of the averaged half-hourly values throughout the measurement campaign. Grey dashed lines
represent estimated limit of detection.
Figure 3 Average diurnal profile of the [MVK+MACR]:[isoprene] ratio during measurements above a
willow canopy.
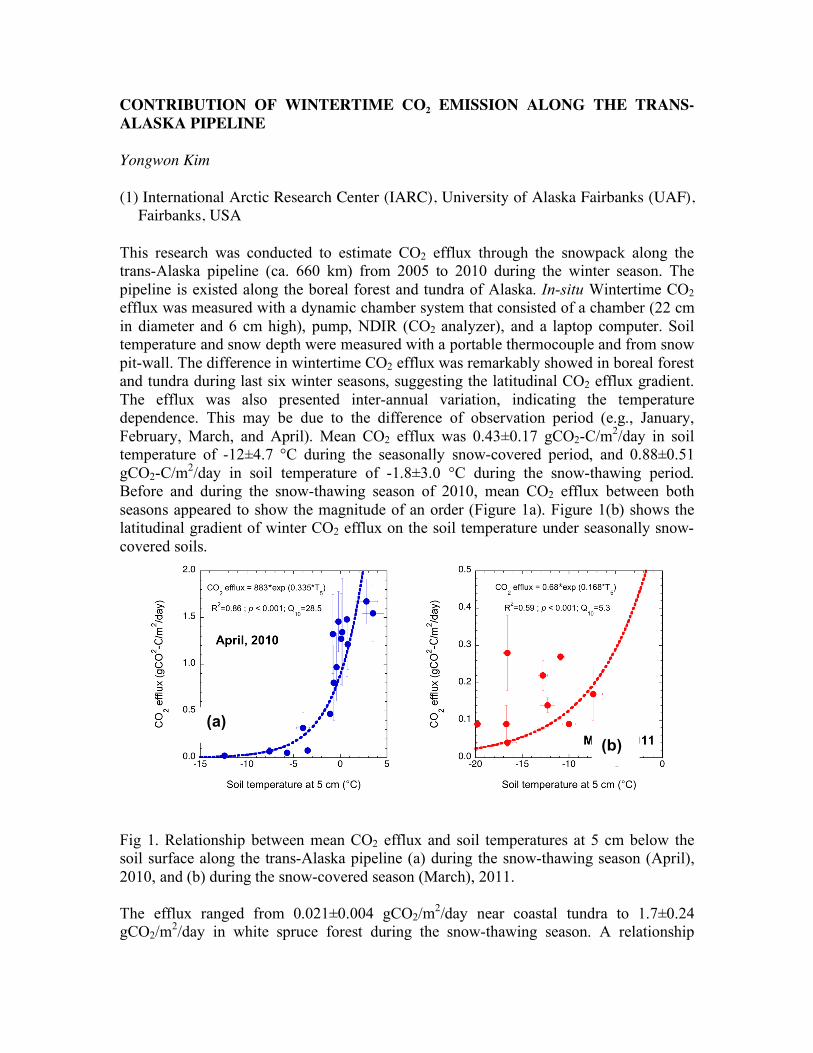
CONTRIBUTION OF WINTERTIME CO2 EMISSION ALONG THE TRANS-ALASKA PIPELINE Yongwon Kim (1) International Arctic Research Center (IARC), University of Alaska Fairbanks (UAF),
Fairbanks, USA This research was conducted to estimate CO2 efflux through the snowpack along the trans-Alaska pipeline (ca. 660 km) from 2005 to 2010 during the winter season. The pipeline is existed along the boreal forest and tundra of Alaska. In-situ Wintertime CO2 efflux was measured with a dynamic chamber system that consisted of a chamber (22 cm in diameter and 6 cm high), pump, NDIR (CO2 analyzer), and a laptop computer. Soil temperature and snow depth were measured with a portable thermocouple and from snow pit-wall. The difference in wintertime CO2 efflux was remarkably showed in boreal forest and tundra during last six winter seasons, suggesting the latitudinal CO2 efflux gradient. The efflux was also presented inter-annual variation, indicating the temperature dependence. This may be due to the difference of observation period (e.g., January, February, March, and April). Mean CO2 efflux was 0.43±0.17 gCO2-C/m2/day in soil temperature of -12±4.7 °C during the seasonally snow-covered period, and 0.88±0.51 gCO2-C/m2/day in soil temperature of -1.8±3.0 °C during the snow-thawing period. Before and during the snow-thawing season of 2010, mean CO2 efflux between both seasons appeared to show the magnitude of an order (Figure 1a). Figure 1(b) shows the latitudinal gradient of winter CO2 efflux on the soil temperature under seasonally snow-covered soils. Fig 1. Relationship between mean CO2 efflux and soil temperatures at 5 cm below the soil surface along the trans-Alaska pipeline (a) during the snow-thawing season (April), 2010, and (b) during the snow-covered season (March), 2011. The efflux ranged from 0.021±0.004 gCO2/m2/day near coastal tundra to 1.7±0.24 gCO2/m2/day in white spruce forest during the snow-thawing season. A relationship
(a) (b)

between mean CO2 efflux at each site and mean soil temperature at 5 cm below the surface along the trans-Alaska pipeline is a good exponential, which the equation is as follows: CO2 efflux = 885⋅exp(0.335⋅Ts) (R2=0.86; p<0.001). CO2 efflux in a white spruce forest during the snow-thawing season is measured in four directions from the bottom stem. The measurements show apparent differences of CO2 efflux between the exposed soil and the snow-covered soil in the four directions. This may be due to the fast decomposition of soil organic carbon and/or active root respiration in the exposed soil caused by strong radiation in the spring. The efflux increases in the order of east, south, west, and north at 60 cm from the stem. Although the snow-thawing period is relatively short, CO2 efflux during that season in white and black spruce forest soils of Alaska should not be overlooked. Acknowledgement This study was funded by under the support of JAXA (IJIS) and JAMSTEC (JICS) projects.
THE NEW PICARRO G2311-f METHANE, CARBON DIOXIDE, AND WATER VAPOR ANALYZER FOR MICROMETEOROLOGICAL APPLICATIONS1 Chris Rella
(1) Picarro Inc., 3105 Patrick Henry Drive, Santa Clara, California 94085 USA.
(1), Gloria Jacobson (1), Colm Sweeney (2), Wade McGillis (3), Anna Karion (2), Eric Crosson (1)
(2) NOAA/ESRL/GMD, 325 Broadway R/GMD1, Boulder, CO 80305 USA. (3) Lamont Doherty Earth Observatory, Columbia University, P.O. Box 1000 61 Route 9W Palisades, NY 10964-8000 USA. [email protected] Picarro has developed a new analyzer, the G2311-f, a high speed Cavity Ring-Down Spectroscopy (CRDS) based analyzer for measuring carbon dioxide (CO2), methane (CH4) and water (H2O) at 10 Hz with both high precision and high accuracy. The new analyzer has additional capabilities and improves upon the performance demonstrated in the previous version, the G2301-f, launched in 2010. In an effort to prove out the viability of the G2301-f for micrometeorological applications, a number of land- and sea-based tests have been performed by research teams from NOAA and Columbia University using the G2301-f. Stationary tests were performed in the Picarro laboratory and on Sherman Island California UC Berkeley Flux site. Sea-based tests included deployments on the Research Vessels Gould in the Southern Ocean, Atlantis in the Eastern Pacific Ocean, and Oceanus
As result of this validation effort, Picarro has developed a new analyzer, the G2311-f, which improves upon the performance demonstrated by the G2301-f. The G2311-f is capable of measuring carbon dioxide to a precision (one standard deviation) of 200 parts-per-billion (ppbv), methane to a precision of 2 ppbv, and water vapor to a precision of 20 ppm. Concentration measurements are taken at a 30-Hz rate with the result that all three species are measured at a 10-Hertz (Hz) rate with extremely high accuracy. Water vapor is measured with sufficient precision for direct measurement of the latent heat flux as well as dilution and spectroscopic correction for carbon dioxide and methane. In addition, the data stream from a 3D sonic anemometer has been time-synched and integrated into the instrument graphical user interface and data logging software, and the environmental temperature range has been expanded to allow measurements over an even broader range of environmental conditions. This flexible device is capable of simultaneously measuring fluxes of carbon dioxide, methane, and latent heat using the eddy-covariance technique, but it can also be employed with other techniques that require the high accuracy and precision inherent to the time-based CRDS method, including the
in the Gulf of Mexico. The analyzer was used during field studies of CH4 and CO2 impacts of the 2010 Gulf Oil leak and combined with Picarro analyzer measurements of water-side CH4 and CO2 using equilibrator head space techniques. The G2301-f has recently been integrated into a continuous, real-time, measurement of air-sea direct eddy covariance fluxes on the unique air-sea flux tower 3.5 km out at sea in the Western Atlantic off of Martha’s Vineyard. Tests were also conducted on aircraft as the final platform testing. The experiments conducted on aircraft, ocean vessels, terrestrial sites, ocean tower site, and lab tests provided the characterization of Picarro’s CRDS technology for micrometeorological use.

gradient flux method, relaxed eddy-covariance, headspace equilibration chambers, leaf / soil chambers, long-term tall-tower measurements, mobile plume mapping, and much more. [1]This material is based upon work supported by the Department of Energy SBIR Program under Grant No. DE-FG02-07ER84902 and does not constitute an endorsement by DOE of the views expressed in this presentation.

IS FOREST MANAGEMENT A SIGNIFICANT SOURCE OF MONOTERPENES INTO THE BOREAL ATMOSPHERE? Sami Haapanala (1), Hannele Hakola (2), Heidi Hellén (2), Mika Vestenius (2), Janne Levula (3), and Janne Rinne (1) (1) Department of Physics, University of Helsinki, Finland. (2) Air Quality Research, Finnish Meteorological Institute, Finland. (3) Hyytiälä Forestry Field Station, University of Helsinki, Finland. [email protected] Volatile organic compounds (VOCs) including terpenoids are emitted into the atmosphere from both stressed and non-stressed vegetation. In European boreal zone the natural VOC sources are known to surpass the anthropogenic ones. Mechanical stress and damage of plants often strongly increases their monoterpene emissions (1, 2, 3). As the forests in the European boreal zone are under intense economic use, forest management operations can be a significant source of terpenoids into the atmosphere of this area. The aim of this study was to estimate the significance of terpene emissions caused by timber felling compared to the emissions from intact forests. We measured the terpenoid emissions from tree stumps and logging residue in two coniferous forest felling areas. The emissions from stumps were studied using enclosures and the emissions from the whole felling area, including stumps and logging residue, using an ecosystem scale micrometeorological method, disjunct eddy accumulation (DEA). The compounds analyzed were isoprene, monoterpenes and sesquiterpenes. Strong emissions of monoterpenes were measured from both the stumps and from the whole felling area. The emissions were dominated by monoterpenes α-pinene and ∆3-carene. The emission rate fell down rapidly after the logging. The emission rates were weakly dependent on the temperature. However, the temporal decay was clearly the most important factor determining the emission rate. Figure 1 illustrates the monoterpene flux form the whole felling area together with the ambient temperature
Fig. 1. Daily mean fluxes of monoterpenes (solid line) and corresponding air temperatures (dotted line). Error bars of the fluxes are the standard errors of the means.

To evaluate the importance of monoterpenes emitted from cut coniferous forests in Finland on annual basis we conducted a rough upscaling based on annually harvested forest biomass. The resulting monoterpene release from forest felling areas was almost 40 kilotonnes per year which is about 30% of the monoterpene release from intact forests in Finland (4). However, this estimate is very uncertain due to limited dataset, and further research is needed to better quantify the importance of forestry operations to the atmospheric monoterpene burden. References [1] Juuti et al., 1990, J. Geophys. Res., 95, 7515-7519. [2] Loreto et al., 2000, Funct. Ecol., 14, 589–595. [3] Hakola et al., 2001, Boreal. Env. Res., 6, 237-249. [4] Tarvainen et al., 2007, Tellus, 54B, 526-534.
AIRBORNE AEROSOL MEASUREMENTS OVER SOUTHERN FINLAND AT
OCTOBER 2010 AND APRIL 2011
Riikka Väänänen (1), Katri Paananen (1), Tuukka Petäjä (1), Ari Virkkula (1)(2), Pasi P. Aalto (1),
Toivo Pohja (1), Lasse Kortetjärvi (1), Markku Kulmala (1)
(1) University of Helsinki, Finland
(2) Finnish Meteorological Institute, Finland
Atmospheric aerosols can be either primary particles, e.g. soot from combustion, street dust from traffic,
or salt particles from sea spray; or secondary particles, which nucleate and condense from gas
molecules. Plausible candidates for the nucleating vapors include sulfur acid [1] and for the vapors
participating to the growth include volatile organic compounds (VOCs)[2]. VOCs are shown to have an
important role to the growth of the nucleated particles in boreal forests [3].
Aerosol group at University of Helsinki has a long experience of ground-level aerosol measurements
[4]. However, there is only a few data measured in lower troposphere over Finnish boreal forests [5]-[7].
Our aim is to supplement the on-ground measurements with airborne measurements performed by a
small Cessna 172 one-engine aircraft with slow velocity (air velocity around 130 km/h) operating
between altitudes of 300 m and 3.5 km.
Our measuring system includes sample air inlet mounted under the right wing of the aircraft, and
instruments located inside the cabin. Together with the inlet there is an outside temperature, a relative
humidity, and a photosynthetically active radiation (PAR) sensors. Instruments installed inside a rack
behind the pilot and the operator include: A Scanning Mobility Particle Sizer (SMPS) with measuring
range of 10 – 350 nm; an ultrafine CPC TSI 3776 with cutoff value of 3 nm; a CO2/H2O analyzer Li-Cor
LI-840; and a pressure sensor. A triple wavelength (467,530 and 660 nm) particle/sooth absorption
photometer (PSAP, Radiance Research), and a nephelometer (Radiance Research Model 903) were not
included the campaigns in 2011 but were again in the setup of 2011. An external vacuum pump and a
venture tube located at the outlet flow generate the needed vacuum for the instruments. Additionally, a
GPS receiver records the flight track.
We will analyze the results of two measurements campaigns, namely, one performed in October 2010,
and the on-going campaign in April 2011. The campaign during 4th
Oct and 15th
Oct, 2010 included 50
vertical profiles and total amount of flight hours was 38 h. The on-going spring 2011 campaign started
at 4th
April and will continue up to four weeks including maximum 40 flight hours. In both campaigns
we measure vertical profiles up to 3.5 km above the countryside of Southern Finland – which is a
mosaic of boreal forests of different ages, mires, small lakes, and cultivated land.
The weather conditions separated the October 2010 campaign to two periods: 4th -7th Oct warmer
airmasses originating from South or South-West arrived to Southern Finland in all air levels from 500 m
to 3000 m, and during 11th -15th Oct cold airmasses arrived from North or North-West in
corresponding air levels. The trajectories of the airmasses are calculated using HYSPLIT4 model [8].
During the latter period a new particle formation events was observed at Hyytiälä SMEAR II station.
In Figure 1 is an example vertical profiles for 13th
of Oct, 2010. In that day, there is a new particle
formation event measured at Hyytiälä Smear II station between 10 am and 3 pm. The plots at the first
row show the particle size distribution during four vertical profiles. In the second row means of the
Hyytiälä DMPS particle size distributions during each flight are compared to the airborne SMPS and
CPC data measured at the lowest altitude of each profile. One can see the largest differences at the
smallest particle sizes, whereas otherwise the shapes of the distributions are quite similar. One should
note the flight route shown in the left panel of Figure 2. The numbers indicate the corresponding
profiles. The right panel of the Figure 2 shows the particle size distribution measured at Hyytiälä
SMEAR II station during that day.
As a preliminary summary, particle concentration, size distribution, absorption and scattering properties
have been measured up to 3.5 km in October 2010, and during the on-going campaign in April 2011.
The source of the airmass was found to affect to the vertical profile of the aerosol size distribution.
Fig. 1. In the first row are the particle size distribution measured with airborne SMPS and ultrafine CPC
during four vertical flight profiles at 13th
Oct, 2010. In the second row are the particle size distributions
of the lowest measured altitude compared to the average measured DMPS particle size distribution at
Hyytiälä during the time of the corresponding profile.
Fig. 2. In the left are the flight routes of four profile shown in Figure 1.In the right is the particle size
distribution at Hyytiälä during 13th
Oct 2010. The first two profiles are measured at time between the
first two dashed line and the third and the forth profile are measured between the latter dashed lines.
References
[1] M. Sipilä et al., 2010, Science, 327 (5) pp. 1243-1246.
[2] A. Metzgera et al, 2010, PNAS, 107 (15) pp. 6646-6651
[3] P. Tunved et al., 2004, Science, 312 (5771) pp. 261-263.
[4] P. Hari and M. Kulmala, 2005, Boreal Env. Res. 10: 315–322.
[5] C. D. O'Dowd. et al., 2009,. Atmos. Chem. Phys., 9, 937-944.
[6] S. Schobesberger et al., 2010, Proceedings of the Finnish Center of Excellence and Graduate School
in 'Physics, Chemistry, Biology and Meteorology of Atmospheric Composition and Climate Change'
Annual Workshop 17.-19.5.2010. Report Series in Aerosol Science, vol 109.
[7] A. Virkkula et al., 2010, Proceedings of the Finnish Center of Excellence and Graduate School in
'Physics, Chemistry, Biology and Meteorology of Atmospheric Composition and Climate Change'
Annual Workshop 17.-19.5.2010. Report Series in Aerosol Science, vol 109.
[8] R. R. Draxler, 1999: HYSPLIT4 user's guide. NOAA Tech. Memo. ERL ARL-230
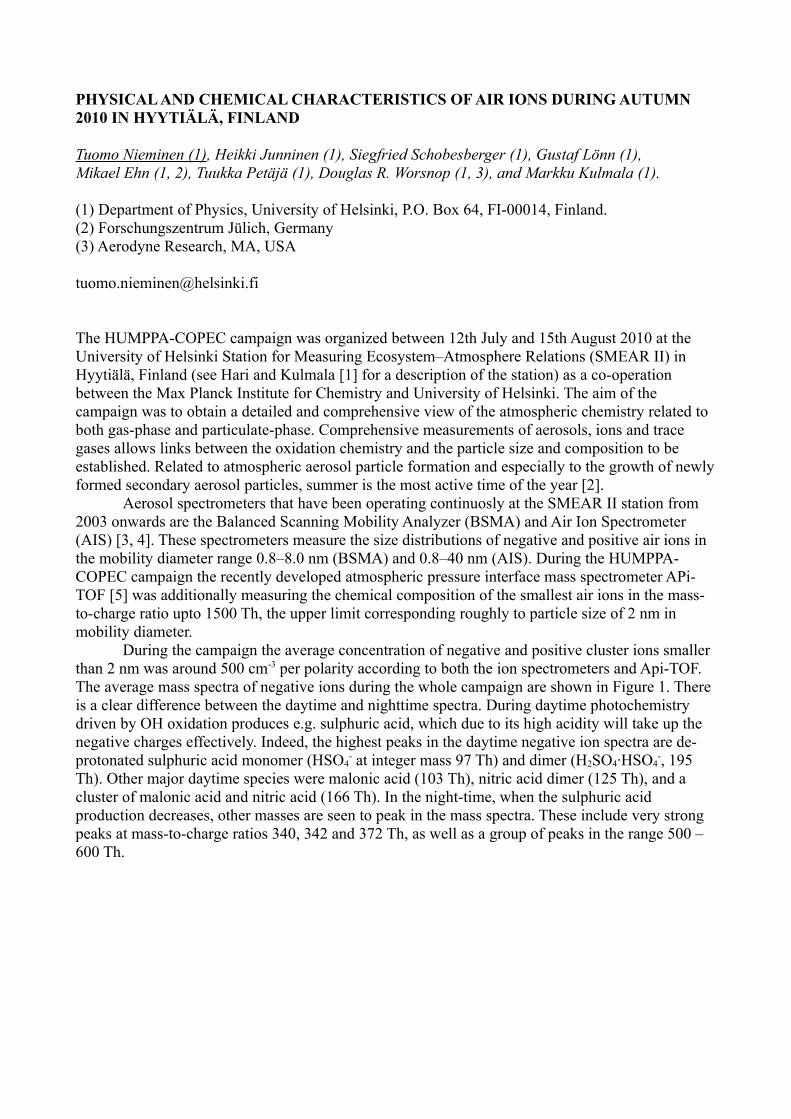
PHYSICAL AND CHEMICAL CHARACTERISTICS OF AIR IONS DURING AUTUMN 2010 IN HYYTIÄLÄ, FINLAND
Tuomo Nieminen (1), Heikki Junninen (1), Siegfried Schobesberger (1), Gustaf Lönn (1),Mikael Ehn (1, 2), Tuukka Petäjä (1), Douglas R. Worsnop (1, 3), and Markku Kulmala (1).
(1) Department of Physics, University of Helsinki, P.O. Box 64, FI-00014, Finland.(2) Forschungszentrum Jülich, Germany(3) Aerodyne Research, MA, USA
The HUMPPA-COPEC campaign was organized between 12th July and 15th August 2010 at the University of Helsinki Station for Measuring Ecosystem–Atmosphere Relations (SMEAR II) in Hyytiälä, Finland (see Hari and Kulmala [1] for a description of the station) as a co-operation between the Max Planck Institute for Chemistry and University of Helsinki. The aim of the campaign was to obtain a detailed and comprehensive view of the atmospheric chemistry related to both gas-phase and particulate-phase. Comprehensive measurements of aerosols, ions and trace gases allows links between the oxidation chemistry and the particle size and composition to be established. Related to atmospheric aerosol particle formation and especially to the growth of newly formed secondary aerosol particles, summer is the most active time of the year [2].
Aerosol spectrometers that have been operating continuosly at the SMEAR II station from 2003 onwards are the Balanced Scanning Mobility Analyzer (BSMA) and Air Ion Spectrometer (AIS) [3, 4]. These spectrometers measure the size distributions of negative and positive air ions in the mobility diameter range 0.8–8.0 nm (BSMA) and 0.8–40 nm (AIS). During the HUMPPA-COPEC campaign the recently developed atmospheric pressure interface mass spectrometer APi-TOF [5] was additionally measuring the chemical composition of the smallest air ions in the mass-to-charge ratio upto 1500 Th, the upper limit corresponding roughly to particle size of 2 nm in mobility diameter.
During the campaign the average concentration of negative and positive cluster ions smaller than 2 nm was around 500 cm-3 per polarity according to both the ion spectrometers and Api-TOF. The average mass spectra of negative ions during the whole campaign are shown in Figure 1. There is a clear difference between the daytime and nighttime spectra. During daytime photochemistry driven by OH oxidation produces e.g. sulphuric acid, which due to its high acidity will take up the negative charges effectively. Indeed, the highest peaks in the daytime negative ion spectra are de-protonated sulphuric acid monomer (HSO4
- at integer mass 97 Th) and dimer (H2SO4∙HSO4-, 195
Th). Other major daytime species were malonic acid (103 Th), nitric acid dimer (125 Th), and a cluster of malonic acid and nitric acid (166 Th). In the night-time, when the sulphuric acid production decreases, other masses are seen to peak in the mass spectra. These include very strong peaks at mass-to-charge ratios 340, 342 and 372 Th, as well as a group of peaks in the range 500 – 600 Th.
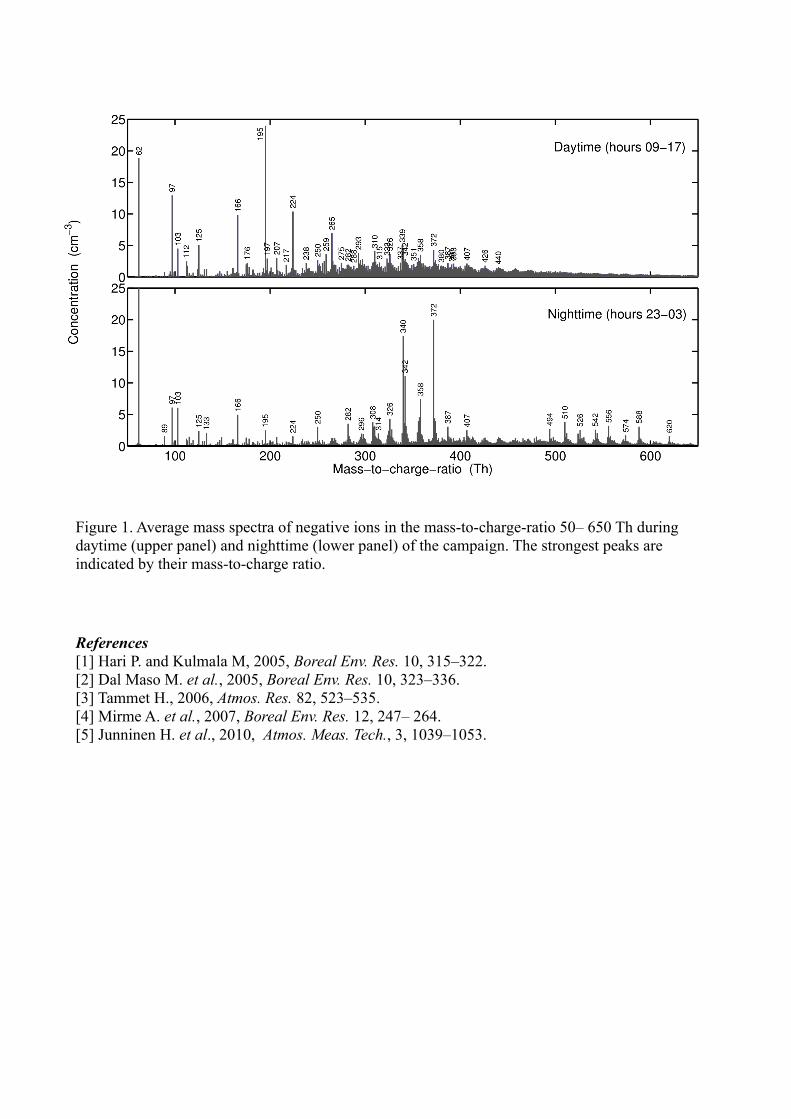
Figure 1. Average mass spectra of negative ions in the mass-to-charge-ratio 50– 650 Th during daytime (upper panel) and nighttime (lower panel) of the campaign. The strongest peaks are indicated by their mass-to-charge ratio.
References[1] Hari P. and Kulmala M, 2005, Boreal Env. Res. 10, 315–322.[2] Dal Maso M. et al., 2005, Boreal Env. Res. 10, 323–336.[3] Tammet H., 2006, Atmos. Res. 82, 523–535.[4] Mirme A. et al., 2007, Boreal Env. Res. 12, 247– 264.[5] Junninen H. et al., 2010, Atmos. Meas. Tech., 3, 1039–1053.
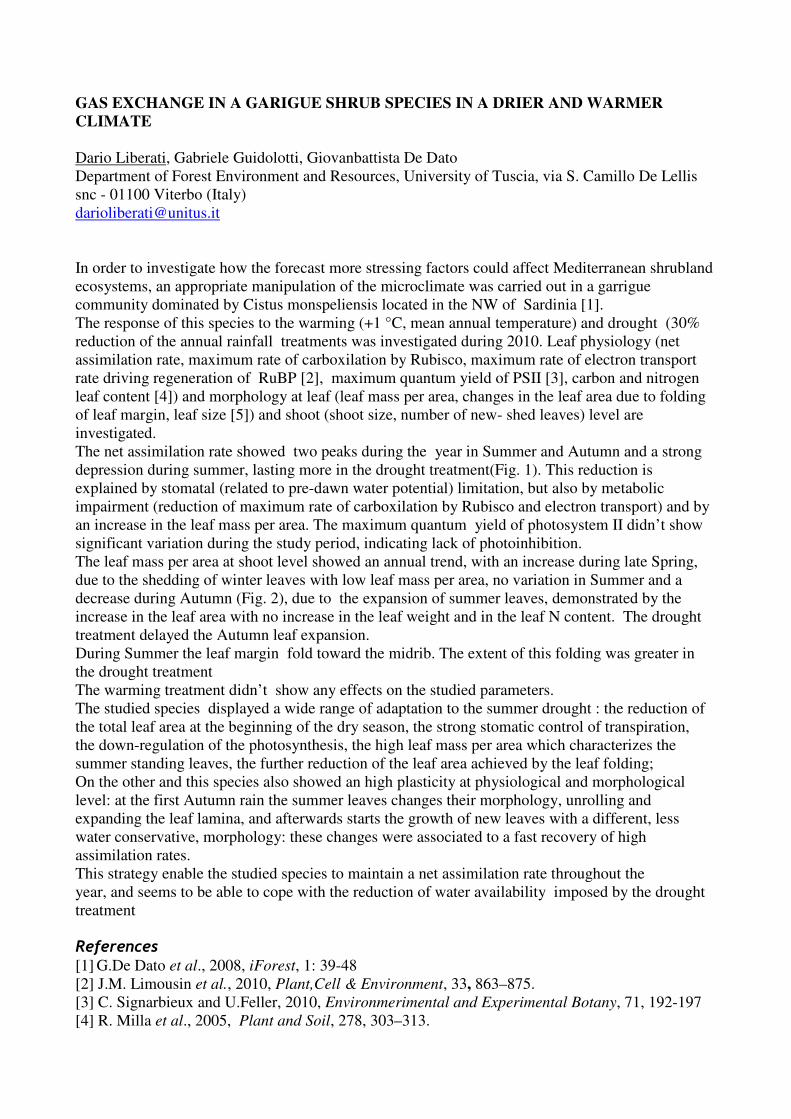
GAS EXCHANGE IN A GARIGUE SHRUB SPECIES IN A DRIER AND WARMER
CLIMATE
Dario Liberati, Gabriele Guidolotti, Giovanbattista De Dato
Department of Forest Environment and Resources, University of Tuscia, via S. Camillo De Lellis snc - 01100 Viterbo (Italy) [email protected] In order to investigate how the forecast more stressing factors could affect Mediterranean shrubland ecosystems, an appropriate manipulation of the microclimate was carried out in a garrigue community dominated by Cistus monspeliensis located in the NW of Sardinia [1]. The response of this species to the warming (+1 °C, mean annual temperature) and drought (30% reduction of the annual rainfall treatments was investigated during 2010. Leaf physiology (net assimilation rate, maximum rate of carboxilation by Rubisco, maximum rate of electron transport rate driving regeneration of RuBP [2], maximum quantum yield of PSII [3], carbon and nitrogen leaf content [4]) and morphology at leaf (leaf mass per area, changes in the leaf area due to folding of leaf margin, leaf size [5]) and shoot (shoot size, number of new- shed leaves) level are investigated. The net assimilation rate showed two peaks during the year in Summer and Autumn and a strong depression during summer, lasting more in the drought treatment(Fig. 1). This reduction is explained by stomatal (related to pre-dawn water potential) limitation, but also by metabolic impairment (reduction of maximum rate of carboxilation by Rubisco and electron transport) and by an increase in the leaf mass per area. The maximum quantum yield of photosystem II didn’t show significant variation during the study period, indicating lack of photoinhibition. The leaf mass per area at shoot level showed an annual trend, with an increase during late Spring, due to the shedding of winter leaves with low leaf mass per area, no variation in Summer and a decrease during Autumn (Fig. 2), due to the expansion of summer leaves, demonstrated by the increase in the leaf area with no increase in the leaf weight and in the leaf N content. The drought treatment delayed the Autumn leaf expansion. During Summer the leaf margin fold toward the midrib. The extent of this folding was greater in the drought treatment The warming treatment didn’t show any effects on the studied parameters. The studied species displayed a wide range of adaptation to the summer drought : the reduction of the total leaf area at the beginning of the dry season, the strong stomatic control of transpiration, the down-regulation of the photosynthesis, the high leaf mass per area which characterizes the summer standing leaves, the further reduction of the leaf area achieved by the leaf folding; On the other and this species also showed an high plasticity at physiological and morphological level: at the first Autumn rain the summer leaves changes their morphology, unrolling and expanding the leaf lamina, and afterwards starts the growth of new leaves with a different, less water conservative, morphology: these changes were associated to a fast recovery of high assimilation rates. This strategy enable the studied species to maintain a net assimilation rate throughout the year, and seems to be able to cope with the reduction of water availability imposed by the drought treatment References [1] G.De Dato et al., 2008, iForest, 1: 39-48 [2] J.M. Limousin et al., 2010, Plant,Cell & Environment, 33, 863–875. [3] C. Signarbieux and U.Feller, 2010, Environmerimental and Experimental Botany, 71, 192-197
[4] R. Milla et al., 2005, Plant and Soil, 278, 303–313.

[5] Ü. Niinemets, 1999, The New Phytologist
Fig.1. Seasonal trend in net assimilation rate in control, warming and drought treatment. Bars indicate standard deviation.
Fig.2. Seasonal trand in leaf mass per area (LMA) in control, warming and drought treatment. Bars indicate standard deviation.
The New Phytologist, 144, 35–47.
nd in net assimilation rate in control, warming and drought treatment. Bars
in leaf mass per area (LMA) in control, warming and drought treatment. Bars
nd in net assimilation rate in control, warming and drought treatment. Bars
in leaf mass per area (LMA) in control, warming and drought treatment. Bars
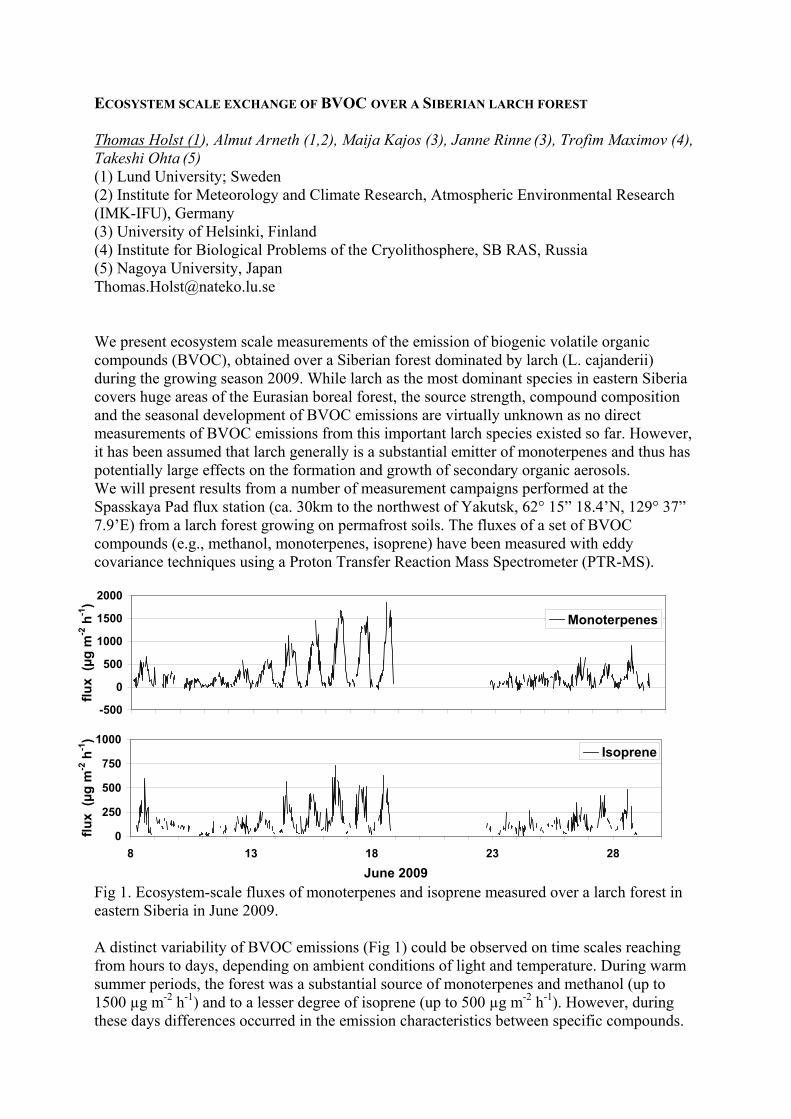
ECOSYSTEM SCALE EXCHANGE OF BVOC OVER A SIBERIAN LARCH FOREST Thomas Holst (1), Almut Arneth (1,2), Maija Kajos (3), Janne Rinne (3), Trofim Maximov (4), Takeshi Ohta (5) (1) Lund University; Sweden (2) Institute for Meteorology and Climate Research, Atmospheric Environmental Research (IMK-IFU), Germany (3) University of Helsinki, Finland (4) Institute for Biological Problems of the Cryolithosphere, SB RAS, Russia (5) Nagoya University, Japan [email protected] We present ecosystem scale measurements of the emission of biogenic volatile organic compounds (BVOC), obtained over a Siberian forest dominated by larch (L. cajanderii) during the growing season 2009. While larch as the most dominant species in eastern Siberia covers huge areas of the Eurasian boreal forest, the source strength, compound composition and the seasonal development of BVOC emissions are virtually unknown as no direct measurements of BVOC emissions from this important larch species existed so far. However, it has been assumed that larch generally is a substantial emitter of monoterpenes and thus has potentially large effects on the formation and growth of secondary organic aerosols. We will present results from a number of measurement campaigns performed at the Spasskaya Pad flux station (ca. 30km to the northwest of Yakutsk, 62° 15” 18.4’N, 129° 37” 7.9’E) from a larch forest growing on permafrost soils. The fluxes of a set of BVOC compounds (e.g., methanol, monoterpenes, isoprene) have been measured with eddy covariance techniques using a Proton Transfer Reaction Mass Spectrometer (PTR-MS). 2000
-500
0
250
500
750
1000
8 13 18 23 28June 2009
flux
(µg
m-2
h-1
)
Isoprene
0
500
1000
1500
flux
(µg
m-2
h-1
)
Monoterpenes
Fig 1. Ecosystem-scale fluxes of monoterpenes and isoprene measured over a larch forest in eastern Siberia in June 2009. A distinct variability of BVOC emissions (Fig 1) could be observed on time scales reaching from hours to days, depending on ambient conditions of light and temperature. During warm summer periods, the forest was a substantial source of monoterpenes and methanol (up to 1500 µg m-2 h-1) and to a lesser degree of isoprene (up to 500 µg m-2 h-1). However, during these days differences occurred in the emission characteristics between specific compounds.
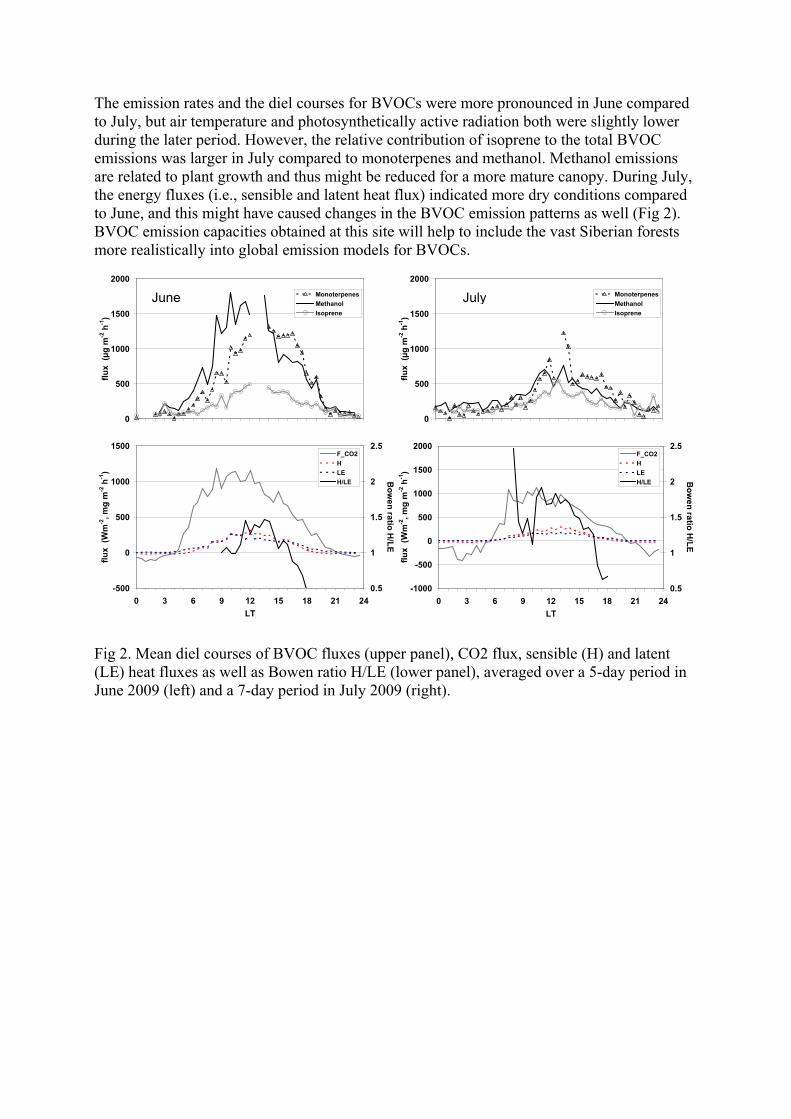
The emission rates and the diel courses for BVOCs were more pronounced in June compared to July, but air temperature and photosynthetically active radiation both were slightly lower during the later period. However, the relative contribution of isoprene to the total BVOC emissions was larger in July compared to monoterpenes and methanol. Methanol emissions are related to plant growth and thus might be reduced for a more mature canopy. During July, the energy fluxes (i.e., sensible and latent heat flux) indicated more dry conditions compared to June, and this might have caused changes in the BVOC emission patterns as well (Fig 2). BVOC emission capacities obtained at this site will help to include the vast Siberian forests more realistically into global emission models for BVOCs. h
-1)
m-2
(µg
flux
)
-2 h
-1
, mg
m
-2
(W
m
flux
-500
0
500
1000
1500
0
0
500
1000
1500
2000MonoterpenesMethanole
2000MonoterpenesMethanoly
Fig 2. M(LE) heJune 20
Jun
3 6 9 12 15 18 21 24LT
0.5
1
1.5
2
2.5
Bow
en ratio H/LE
F_CO2HLEH/LE
Isoprene
0
500
1000
1500
flux
(µg
m-2
h-1
)
-1000
-500
0
500
1000
1500
2000
0
flux
(Wm
-2, m
g m
-2 h
-1)
ean diel courses of BVOC fluxes (upper panel),at fluxes as well as Bowen ratio H/LE (lower pan09 (left) and a 7-day period in July 2009 (right).
Jul
Isoprene3 6 9 12 15 18 21 24LT
0.5
1
1.5
2
2.5
Bow
en ratio H/LE
F_CO2HLEH/LE
CO2 flux, sensible (H) and latent el), averaged over a 5-day period in
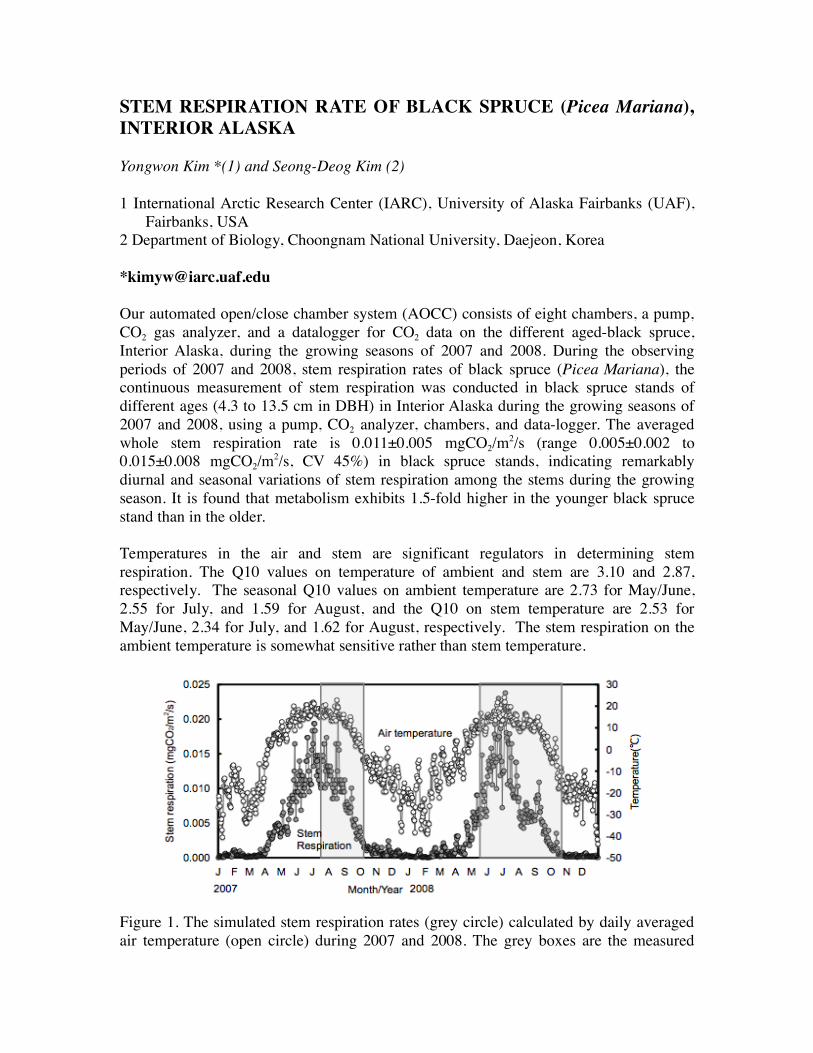
STEM RESPIRATION RATE OF BLACK SPRUCE (Picea Mariana), INTERIOR ALASKA Yongwon Kim *(1) and Seong-Deog Kim (2) 1 International Arctic Research Center (IARC), University of Alaska Fairbanks (UAF),
Fairbanks, USA 2 Department of Biology, Choongnam National University, Daejeon, Korea *[email protected] Our automated open/close chamber system (AOCC) consists of eight chambers, a pump, CO2 gas analyzer, and a datalogger for CO2 data on the different aged-black spruce, Interior Alaska, during the growing seasons of 2007 and 2008. During the observing periods of 2007 and 2008, stem respiration rates of black spruce (Picea Mariana), the continuous measurement of stem respiration was conducted in black spruce stands of different ages (4.3 to 13.5 cm in DBH) in Interior Alaska during the growing seasons of 2007 and 2008, using a pump, CO2 analyzer, chambers, and data-logger. The averaged whole stem respiration rate is 0.011±0.005 mgCO2/m2/s (range 0.005±0.002 to 0.015±0.008 mgCO2/m2/s, CV 45%) in black spruce stands, indicating remarkably diurnal and seasonal variations of stem respiration among the stems during the growing season. It is found that metabolism exhibits 1.5-fold higher in the younger black spruce stand than in the older. Temperatures in the air and stem are significant regulators in determining stem respiration. The Q10 values on temperature of ambient and stem are 3.10 and 2.87, respectively. The seasonal Q10 values on ambient temperature are 2.73 for May/June, 2.55 for July, and 1.59 for August, and the Q10 on stem temperature are 2.53 for May/June, 2.34 for July, and 1.62 for August, respectively. The stem respiration on the ambient temperature is somewhat sensitive rather than stem temperature. Figure 1. The simulated stem respiration rates (grey circle) calculated by daily averaged air temperature (open circle) during 2007 and 2008. The grey boxes are the measured

stem respiration period during 2007 and 2008. Stem respiration rates during the growing season are much higher than those during the non-growing season, Interior Alaska. The annual stem respiration rates simulated by Q10 value based on air temperature are 41.2 and 36.8 gC/m2 during 2007 and 2008, respectively, which corresponds to 5.2 and 5.0% of ecosystem respiration and GPP during 2007. This suggests that stem respiration is a significant component in the scaling-up of the regional carbon budget in a black spruce forest, Interior Alaska. Quantification of the effects of regional change on the black spruce forest carbon balance and atmosphere-forest interactions requires a better understanding of respiration response. Acknowledgement This research was funded by the support of NSF and JAMSTEC projects.
SPATIAL AND TEMPORAL VARIATIONS OF VOC IN A PONDEROSA PINE ECOSYSTEM Luping Su, Tracey Evans, Daniel Knopf, John E. Mak Stony Brook University [email protected] A Proton-Transfer-Reaction Time-of-Flight Mass Spectrometry (PTR-ToF-MS) was deployed during 2010 BEACHON-ROCS campaign in the Manitou Experimental Forest (39°6'0" N, 105°5'30" W, 2286 m a.s.l.). Several VOCs were quantified, including methanol, acetonitrile, acetaldehyde, acetone, methyl vinyl keton, 2-methyl-3-buten-2-ol, benzene, toluene, methyl ethyl keton and monoterpenes. Monoterpenes have been identified as one of the dominant BVOCs emitted in this sampling area[1], and combined observation and modeling analyses in a similar pine forest shows that during the summertime ozone loss to the forest is dominated by gas-phase chemistry, most probably contributed by BVOCs (monoterpenes, sesquiterpenes et al.)[2], the oxidation of monoterpenes, in turn, could lead to secondary organic aerosol formation[3, 4]. The spatial and temporal variations of monoterpenes show that most of the compound emitted are within the forest canopy (~18 m), and could extend to above the canopy during high mixing ratio episodes. A clear diurnal variation pattern is observed, with high mixing ratios occurring between midnight and early morning and low mixing ratios during the most of the daytime. Here we discuss the observations of the monoterpenes and other selected VOCs during the BEACHON-ROCS campaign. References [1] S. Kim et al., 2010, Atmos. Chem. Phys., 10, 1759-1771. [2] M.R. Kurpius and A.H. Goldstein, 2003, Geophys. Res. Lett., 30(7), 1371. [3] A.H. Goldstein and I.E. Galbally, 2007, Environ. Sci. Technol., 41(5), 1514-1521. [4] P. Tunved et al., 2006, Science, 312, 261-263.
COSMIC RAYS – ATMOSPHERE INTERACTIONS: PHYSICAL CHARACTERIZATION OF IONS IN THE CLOUD CHAMBER
Alessandro Franchin (1), Siegfried Schobesberger (1), Katrianne Lehtipalo (1), Vladimir Makhmutov (2), Yuri Stozhkov (2), Stéphanie Gagné (1), Tuomo Nieminen (1), Hanna E. Manninen (1), Tuukka Petäjä (1), Markku Kulmala (1) and the CLOUD collaboration.(1) University of Helsinki, Finland(2) Lebedev Physical Institute, Moscow, [email protected]
Aerosol particles have a significant influence on the Earth climate. Several studies have shown a good correlation between past variations in climate, and solar and cosmic ray variability [1].Nanoparticle formation in the boundary layer is a frequent phenomenon [2]. Sulfuric acid has been identified as playing an essential role in atmospheric nucleation [3]. Ion-induced nucleation is one of the possible pathways for new particle formation in the atmosphere, but it is still unclear how important the contribution of ions is with respect to neutral pathways. Ion concentration and their size distribution are key quantities to understand ion-induced nucleation processes and dynamics.During the CLOUD (Cosmics Leaving OUtdoor Droplets) 2010 fall campaign, several experiments of sulfuric acid-water neutral and ion-induced nucleation were performed in an aerosol chamber. In this experiment, Galactic Cosmic Rays (GCR) and the Proton Syncrotron (PS) accelerator at CERN were used as sources to generate ions in the 26.1 m3 CLOUD aerosol chamber under precisely controlled conditions. Both GCR and the PS pion beam were constantly monitored by a GCR counter and by a hodoscope, respectively.The ion concentration in the CLOUD chamber was measured with a Neutral cluster and Air Ion Spectrometer, (NAIS)[4]. The NAIS is able to measure air ion number size distributions in the mobility equivalent diameter range of 0.8 to 40 nm and correspondingly neutral particle number size distributions from ~2 to 40 nm mobility diameter. It was also possible to use an Airmodus A09 Particle Size Magnifier (PSM)[5], a scanning CPC with a cut off varying from 1 to 2 nm, to retrieve the size distribution of the atmospheric ions created in the chamber and compare it to the NAIS in absence of neutral particles in the chamber (Fig. 1).Based on the measured GCR and beam intensities we were able to calculate the expected ion concentrations in the chamber as a function of beam intensity. The calculated ion concentrations were then compared with the measured values in the NAIS, therefore we retrieved the ion-ion recombination coefficient, performing a dedicated set of experiments at different conditions: in sulfuric acid free ([H2SO4]<5e5 cm-3) and in sulfuric acid rich environment ([H2SO4]~3e6 cm-3).The ratio of formation rates of charged and total particles give information about the contribution of ion-induced nucleation. Charged nucleation rates were retrieved from the NAIS ion mode and from two CPCs one of which was equipped with a switchable ion trap both results will be compared.
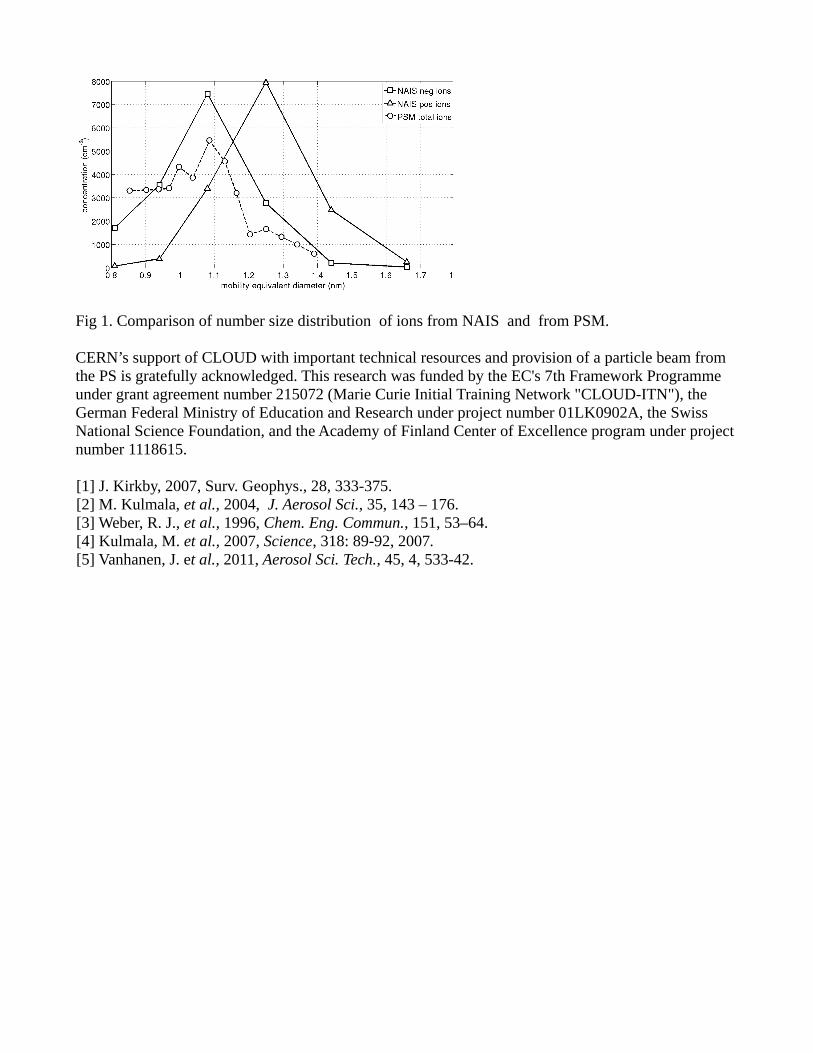
Fig 1. Comparison of number size distribution of ions from NAIS and from PSM.
CERN’s support of CLOUD with important technical resources and provision of a particle beam from the PS is gratefully acknowledged. This research was funded by the EC's 7th Framework Programme under grant agreement number 215072 (Marie Curie Initial Training Network "CLOUD-ITN"), the German Federal Ministry of Education and Research under project number 01LK0902A, the Swiss National Science Foundation, and the Academy of Finland Center of Excellence program under project number 1118615.
[1] J. Kirkby, 2007, Surv. Geophys., 28, 333-375.[2] M. Kulmala, et al., 2004, J. Aerosol Sci., 35, 143 – 176.[3] Weber, R. J., et al., 1996, Chem. Eng. Commun., 151, 53–64.[4] Kulmala, M. et al., 2007, Science, 318: 89-92, 2007.[5] Vanhanen, J. et al., 2011, Aerosol Sci. Tech., 45, 4, 533-42.

Rn (W/m2)
JOINT ANALYSIS OF GLOBAL MODELED LAND SURFACE HEAT FLUXES AND RELATED SATELLITE OBSERVATIONS Carlos Jimenez (1), Catherine Prigent (1), Filipe Aires (2) (1) LERMA, Observatoire de Paris, France (2) Estellus, Paris, France [email protected] Land heat fluxes are essential components of the water and energy cycles. Despite a large body of work, the global estimates produced by the existing methodologies present significant differences [1]. This is also the case when a group of land surface models are run with similar forcings, suggesting that the parameterizations in the models are responsible to a large degree for the observed differences. The problem is that, as other existing global datasets are also subject to uncertainty (see, e.g., Figure 1), benchmarking the land surface heat fluxes from the models is difficult. For instance, satellite-based products (relatively simple formulations driven by the relevant physical variables derived from satellite and metereological datasets) exist, but inter-comparison of these products also reveals differences [1]. Fig 1. Globally annual (1994) latent fluxes (Qle) as a function of the net radiation (Rn) for a suite of different satellite products (UCB, UMD, PRU, PAO, MPI), atmospheric reanalyses (MERRA, NCEP, ERA), and land surface models (GSWP, CLM, Noah, Mosaic). See [1] for details. To check the consistency between the existing satellite observations and the land surface models, we propose here an approach based on statistical models mapping the satellite observations onto the land surface model heat fluxes [2]. The technique consists of calibrating a statistical model based on neural networks to produce land surface heat flux estimates consistent with the observations and the land surface model field. The satellite data were selected for their expected sensitivity to the surface properties affecting the fluxes, and includes: active microwave backscatter (ERS scatterometer), passive microwave emissivities (SSM/I), visible and near-infrared reflectances (AVHRR), and thermal infrared surface skin temperature (ISCCP) and the corresponding amplitude of its diurnal cycle. As modelled land surface heat fluxes, estimates from different land
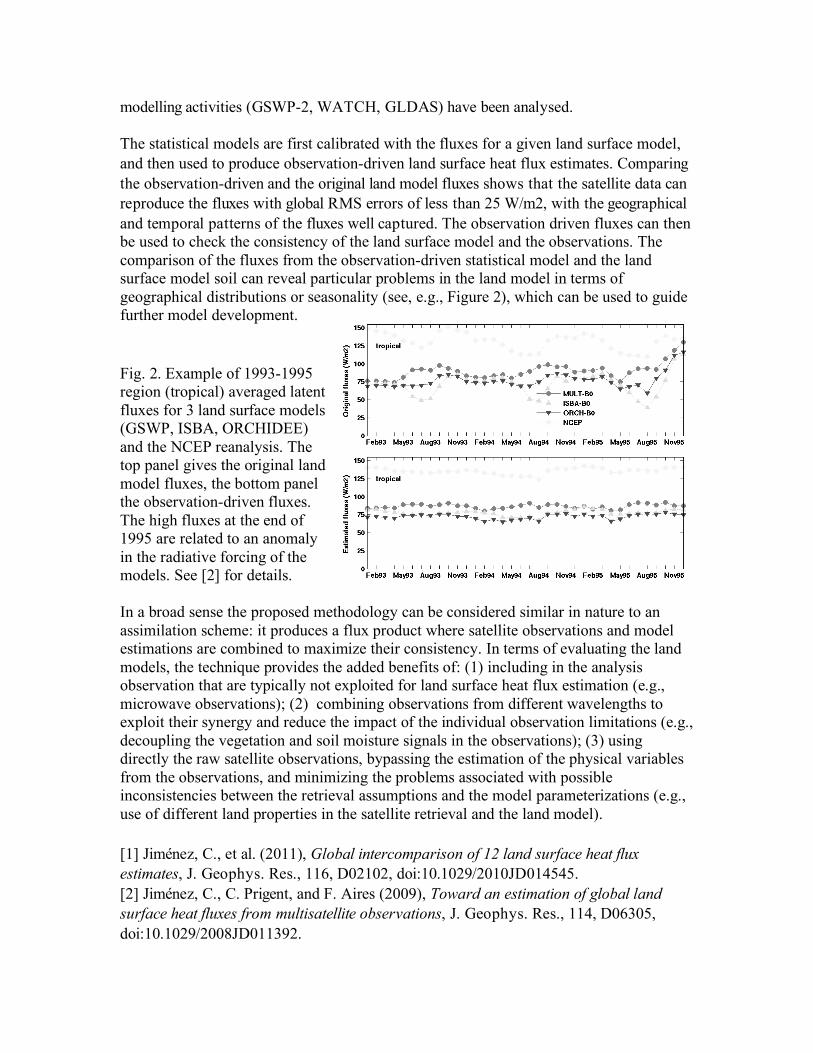
modelling activities (GSWP-2, WATCH, GLDAS) have been analysed. The statistical models are first calibrated with the fluxes for a given land surface model, and then used to produce observation-driven land surface heat flux estimates. Comparing the observation-driven and the original land model fluxes shows that the satellite data can reproduce the fluxes with global RMS errors of less than 25 W/m2, with the geographical and temporal patterns of the fluxes well captured. The observation driven fluxes can then be used to check the consistency of the land surface model and the observations. The comparison of the fluxes from the observation-driven statistical model and the land surface model soil can reveal particular problems in the land model in terms of geographical distributions or seasonality (see, e.g., Figure 2), which can be used to guide further model development. Fig. 2. Example of 1993-1995 region (tropical) averaged latent fluxes for 3 land surface models (GSWP, ISBA, ORCHIDEE) and the NCEP reanalysis. The top panel gives the original land model fluxes, the bottom panel the observation-driven fluxes. The high fluxes at the end of 1995 are related to an anomaly in the radiative forcing of the models. See [2] for details. In a broad sense the proposed methodology can be considered similar in nature to an assimilation scheme: it produces a flux product where satellite observations and model estimations are combined to maximize their consistency. In terms of evaluating the land models, the technique provides the added benefits of: (1) including in the analysis observation that are typically not exploited for land surface heat flux estimation (e.g., microwave observations); (2) combining observations from different wavelengths to exploit their synergy and reduce the impact of the individual observation limitations (e.g., decoupling the vegetation and soil moisture signals in the observations); (3) using directly the raw satellite observations, bypassing the estimation of the physical variables from the observations, and minimizing the problems associated with possible inconsistencies between the retrieval assumptions and the model parameterizations (e.g., use of different land properties in the satellite retrieval and the land model). [1] Jiménez, C., et al. (2011), Global intercomparison of 12 land surface heat flux estimates, J. Geophys. Res., 116, D02102, doi:10.1029/2010JD014545. [2] Jiménez, C., C. Prigent, and F. Aires (2009), Toward an estimation of global land surface heat fluxes from multisatellite observations, J. Geophys. Res., 114, D06305, doi:10.1029/2008JD011392.
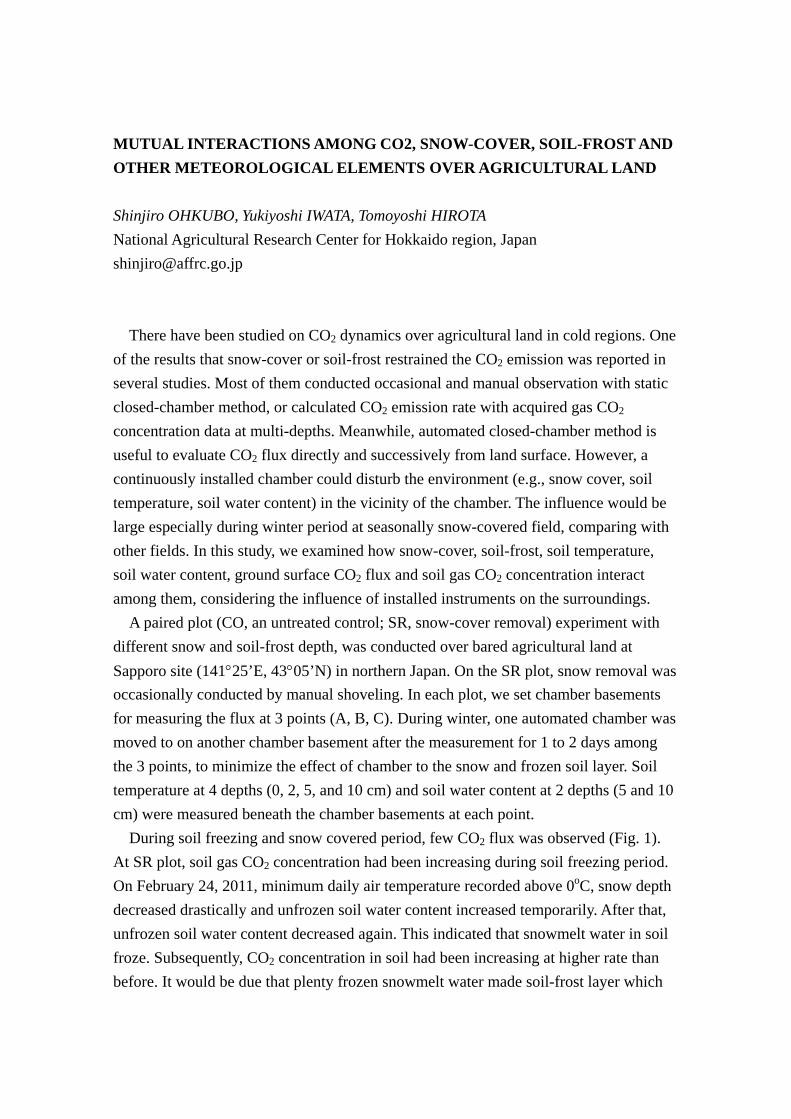
MUTUAL INTERACTIONS AMONG CO2, SNOW-COVER, SOIL-FROST AND
OTHER METEOROLOGICAL ELEMENTS OVER AGRICULTURAL LAND
Shinjiro OHKUBO, Yukiyoshi IWATA, Tomoyoshi HIROTA
National Agricultural Research Center for Hokkaido region, Japan
There have been studied on CO2 dynamics over agricultural land in cold regions. One
of the results that snow-cover or soil-frost restrained the CO2 emission was reported in
several studies. Most of them conducted occasional and manual observation with static
closed-chamber method, or calculated CO2 emission rate with acquired gas CO2
concentration data at multi-depths. Meanwhile, automated closed-chamber method is
useful to evaluate CO2 flux directly and successively from land surface. However, a
continuously installed chamber could disturb the environment (e.g., snow cover, soil
temperature, soil water content) in the vicinity of the chamber. The influence would be
large especially during winter period at seasonally snow-covered field, comparing with
other fields. In this study, we examined how snow-cover, soil-frost, soil temperature,
soil water content, ground surface CO2 flux and soil gas CO2 concentration interact
among them, considering the influence of installed instruments on the surroundings.
A paired plot (CO, an untreated control; SR, snow-cover removal) experiment with
different snow and soil-frost depth, was conducted over bared agricultural land at
Sapporo site (14125’E, 4305’N) in northern Japan. On the SR plot, snow removal was
occasionally conducted by manual shoveling. In each plot, we set chamber basements
for measuring the flux at 3 points (A, B, C). During winter, one automated chamber was
moved to on another chamber basement after the measurement for 1 to 2 days among
the 3 points, to minimize the effect of chamber to the snow and frozen soil layer. Soil
temperature at 4 depths (0, 2, 5, and 10 cm) and soil water content at 2 depths (5 and 10
cm) were measured beneath the chamber basements at each point.
During soil freezing and snow covered period, few CO2 flux was observed (Fig. 1).
At SR plot, soil gas CO2 concentration had been increasing during soil freezing period.
On February 24, 2011, minimum daily air temperature recorded above 0oC, snow depth
decreased drastically and unfrozen soil water content increased temporarily. After that,
unfrozen soil water content decreased again. This indicated that snowmelt water in soil
froze. Subsequently, CO2 concentration in soil had been increasing at higher rate than
before. It would be due that plenty frozen snowmelt water made soil-frost layer which

prevent CO2 emission to the air, much firmer. After soil thawed, CO2 concentration had
decreased abruptly as soil-frost barrier disappeared. Further analysis especially during
soil-thawing and snow-melting period, will be explained at the conference.
Fig 1. Temporal variation in meteorological environment and CO2 dynamics.
Air
tem
p.
(o C
)
-20-10
010203040
Pre
cipi
tatio
n (m
m d
ay-1
)
0
10
20
30
40
50
MaxAirT MinAirT
Sn
ow /
So
il-fr
ost
dep
th (
cm)
-200
20406080
CO plotSR plot
Soi
l te
mpe
ratu
re (
o C)
0
10
20
30 Point APoint BPoint C
0
10
20
30
Unf
roze
n s
oil
wa
ter
con
tent
(m
3 m-3
)
0.2
0.4
0.6
0.2
0.4
0.6
CO
2 flu
x (
mo
l m-2
s-1
)
0
1
2
3Point APoint BPoint C
0
1
2
3
0
1000
2000
3000
4000 0-cm depth10-cm depth
Date (Month/Day/Year)10/8/1 10/9/1 10/10/1 10/11/1 10/12/1 11/1/1 11/2/1 11/3/1 11/4/1
CO
2 co
nce
ntra
tion
(p
pm
)
0
1000
2000
3000
4000
Unfrozen soil water content at 5-cm depth (CO plot)
Unfrozen soil water content at 5-cm depth(SR plot)
Soil temperature at 2-cm depth (CO plot)
Soil temperature at 2-cm depth (SR plot)
Snow and soil-frost depth
Air temperature and precipitation
CO2 flux (CO plot)
CO2 flux (SR plot)
CO2 concentration in soil (CO plot)
CO2 concentration in soil (SR plot)

LABORATORY-LEVELLABORATORY-LEVELLABORATORY-LEVELLABORATORY-LEVEL EXPERIMENTSEXPERIMENTSEXPERIMENTSEXPERIMENTS OFOFOFOF TRACETRACETRACETRACE GASGASGASGAS (H(H(H(H2222,,,, CO,CO,CO,CO, CHCHCHCH4444))))UPTAKEUPTAKEUPTAKEUPTAKE BYBYBYBYSOILSOILSOILSOIL
Seiichiro Yonemura(1), Seiichi Nishimura(2), Masayuki Yokozawa(1),(1) National Institute for Agro-Environmental Sciences, Japan(2) National Agricultural Research Center, National Agriculture and Food ResearchOrganization, [email protected] (S. Yonemura)
Extensive field measurements of trace gases have been conducted in ourinstitutes using automatic chamber systems [1][2]. However, automatic chamber systemwas not developed for laboratory experiments where detailed . We have developed sucha kind of system and introduce it in this presentation and show results of H2, CO andCH4. These gases are direct and indirect green house gases. These gases are taken byupland soils.
The laboratory system uses flow-through-chamber method, in contrary toprevious incubation measurements that used closed-chamber method.Flow-through-chamber method has various merits. Continuous measurements of variousgases are possible at the same time and then rapid response of soil of gas exchanges ispossible to investigate. However, many devices are necessary to make it possible tomeasure trace gas exchanges by flow-through-chamber method at laboratory level. Forexample, gas analyzers need more precision. Our system was developed using manydevices. For example, the inner air of the chambers were ventilated to keep constantbecause the uptake of the target gas species depend upon their concentration themselves.Gas analyzers (chromatographs) used were GC-9A with FID for CH4 and TRA1 for H2
and CO.The test soil is from volcanic ash soil taken in the upland field of National
Institute for Agro-Environmental Sciences [3]. The soil was sieved by 2mm-sieve andthen was put into chambers. The air before entering into chambers and after going outfrom the chambers was analysed by gas analyzers. Uptake rates um of these gases werecalculated by the following equation:
INm
s OUT
1 .rfum r
⎛ ⎞= −⎜ ⎟
⎝ ⎠
, where f is flow rate, ms is the mass of soil, rIN is the gas concentration of air entering
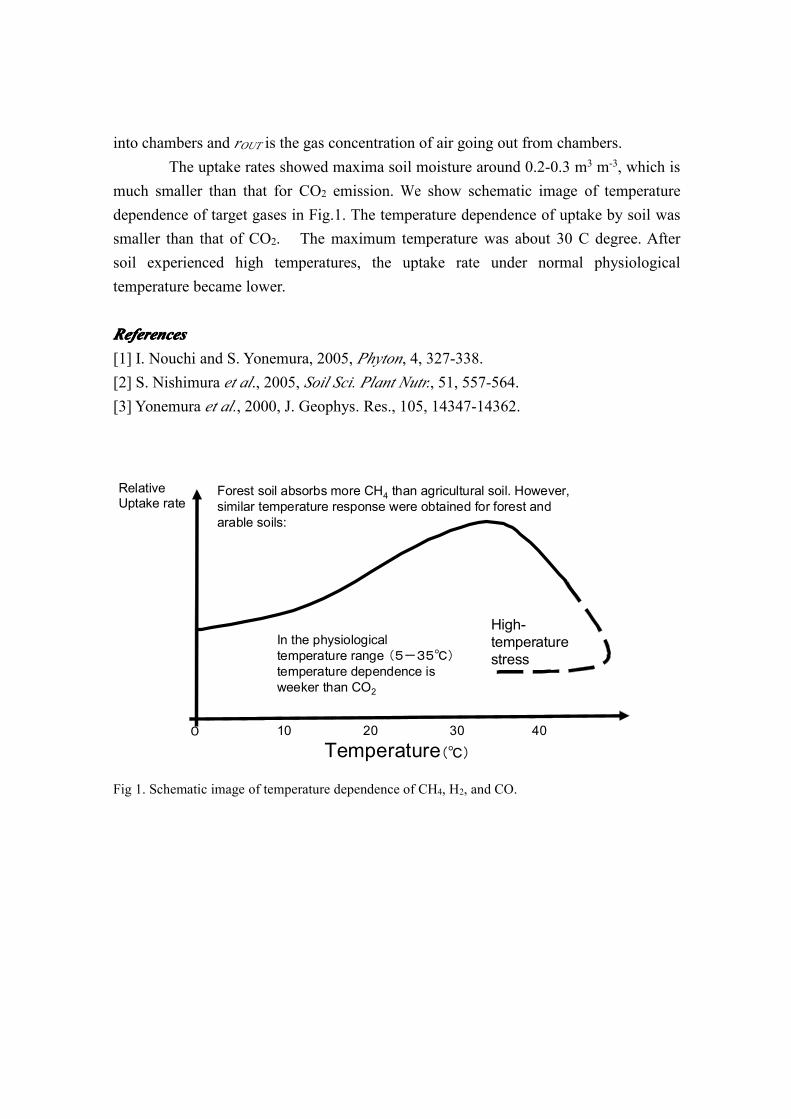
into chambers and rOUT is the gas concentration of air going out from chambers.The uptake rates showed maxima soil moisture around 0.2-0.3 m3 m-3, which is
much smaller than that for CO2 emission. We show schematic image of temperaturedependence of target gases in Fig.1. The temperature dependence of uptake by soil wassmaller than that of CO2. The maximum temperature was about 30 C degree. Aftersoil experienced high temperatures, the uptake rate under normal physiologicaltemperature became lower.
ReferencesReferencesReferencesReferences[1] I. Nouchi and S. Yonemura, 2005, Phyton, 4, 327-338.[2] S. Nishimura et al., 2005, Soil Sci. Plant Nutr., 51, 557-564.[3] Yonemura et al., 2000, J. Geophys. Res., 105, 14347-14362.
Forest soil absorbs more CH4 than agricultural soil. However, similar temperature response were obtained for forest and arable soils:
RelativeUptake rate
Temperature(℃)
0 10 20 30 40
In the physiological temperature range (5-35℃)temperature dependence is weeker than CO2
High-temperature stress
Fig 1. Schematic image of temperature dependence of CH4, H2, and CO.
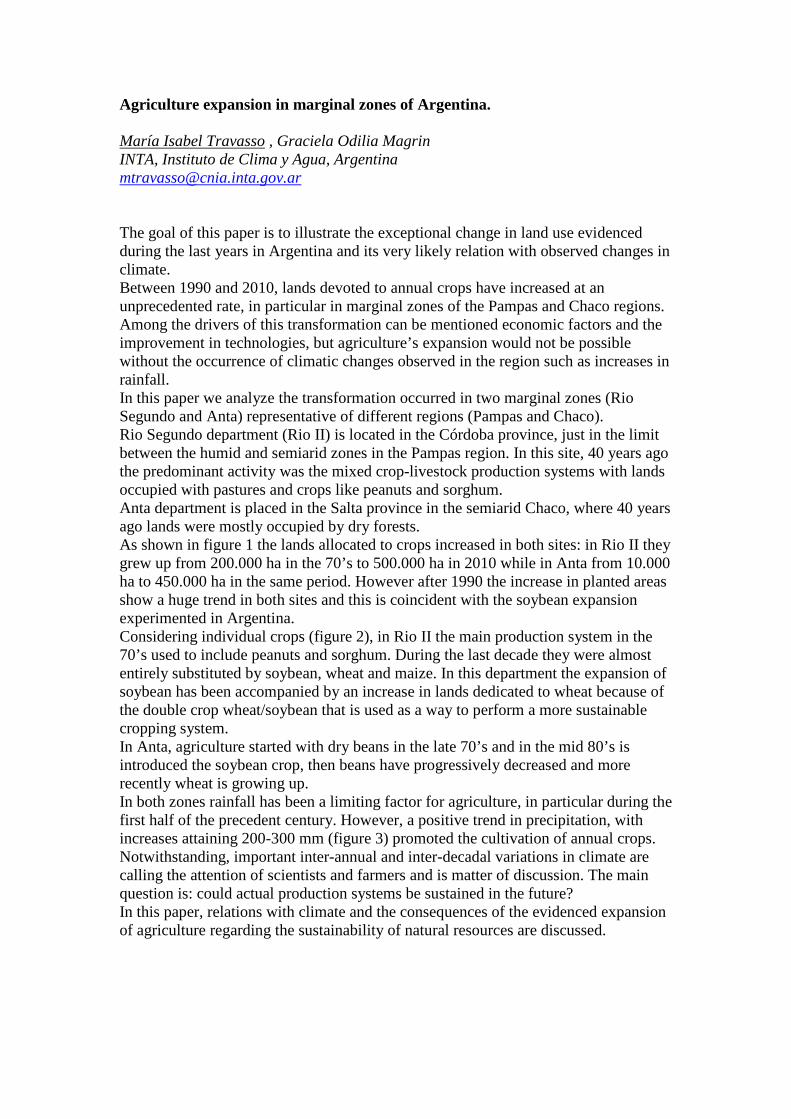
Agriculture expansion in marginal zones of Argentina. María Isabel Travasso , Graciela Odilia Magrin INTA, Instituto de Clima y Agua, Argentina [email protected] The goal of this paper is to illustrate the exceptional change in land use evidenced during the last years in Argentina and its very likely relation with observed changes in climate. Between 1990 and 2010, lands devoted to annual crops have increased at an unprecedented rate, in particular in marginal zones of the Pampas and Chaco regions. Among the drivers of this transformation can be mentioned economic factors and the improvement in technologies, but agriculture’s expansion would not be possible without the occurrence of climatic changes observed in the region such as increases in rainfall. In this paper we analyze the transformation occurred in two marginal zones (Rio Segundo and Anta) representative of different regions (Pampas and Chaco). Rio Segundo department (Rio II) is located in the Córdoba province, just in the limit between the humid and semiarid zones in the Pampas region. In this site, 40 years ago the predominant activity was the mixed crop-livestock production systems with lands occupied with pastures and crops like peanuts and sorghum. Anta department is placed in the Salta province in the semiarid Chaco, where 40 years ago lands were mostly occupied by dry forests. As shown in figure 1 the lands allocated to crops increased in both sites: in Rio II they grew up from 200.000 ha in the 70’s to 500.000 ha in 2010 while in Anta from 10.000 ha to 450.000 ha in the same period. However after 1990 the increase in planted areas show a huge trend in both sites and this is coincident with the soybean expansion experimented in Argentina. Considering individual crops (figure 2), in Rio II the main production system in the 70’s used to include peanuts and sorghum. During the last decade they were almost entirely substituted by soybean, wheat and maize. In this department the expansion of soybean has been accompanied by an increase in lands dedicated to wheat because of the double crop wheat/soybean that is used as a way to perform a more sustainable cropping system. In Anta, agriculture started with dry beans in the late 70’s and in the mid 80’s is introduced the soybean crop, then beans have progressively decreased and more recently wheat is growing up. In both zones rainfall has been a limiting factor for agriculture, in particular during the first half of the precedent century. However, a positive trend in precipitation, with increases attaining 200-300 mm (figure 3) promoted the cultivation of annual crops. Notwithstanding, important inter-annual and inter-decadal variations in climate are calling the attention of scientists and farmers and is matter of discussion. The main question is: could actual production systems be sustained in the future? In this paper, relations with climate and the consequences of the evidenced expansion of agriculture regarding the sustainability of natural resources are discussed.
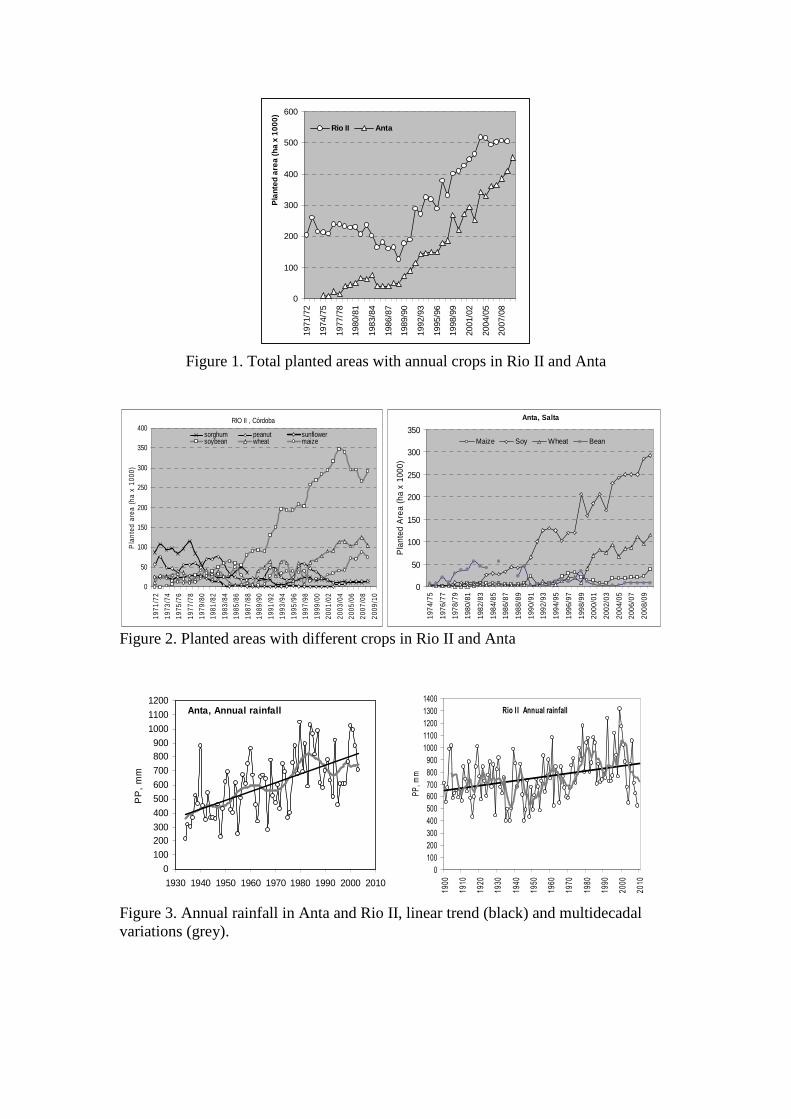
Figure 1. Total planted areas with annual crops in Rio II and Anta
RIO II , Córdoba
0
50
100
150
200
250
300
350
400
1971
/72
1973
/74
1975
/76
1977
/78
1979
/80
1981
/82
1983
/84
1985
/86
1987
/88
1989
/90
1991
/92
1993
/94
1995
/96
1997
/98
1999
/00
2001
/02
2003
/04
2005
/06
2007
/08
2009
/10
Pla
nted
are
a (h
a x
1000
)
sorghum peanut sunflowersoybean wheat maize
Anta, Salta
0
50
100
150
200
250
300
35019
74/7
5
1976
/77
1978
/79
1980
/81
1982
/83
1984
/85
1986
/87
1988
/89
1990
/91
1992
/93
1994
/95
1996
/97
1998
/99
2000
/01
2002
/03
2004
/05
2006
/07
2008
/09
Pla
nted
Are
a (h
a x
1000
)
Maize Soy Wheat Bean
Figure 2. Planted areas with different crops in Rio II and Anta
Anta, Annual rainfall
0
100
200300
400
500
600
700
800900
1000
1100
1200
1930 1940 1950 1960 1970 1980 1990 2000 2010
PP
, m
m
Rio I I Annual rainfall
0
100
200
300
400
500
600
700
800
900
1000
1100
1200
1300
1400
19
00
19
10
19
20
19
30
19
40
19
50
19
60
19
70
19
80
19
90
20
00
20
10
PP
, m
m
Figure 3. Annual rainfall in Anta and Rio II, linear trend (black) and multidecadal variations (grey).
0
100
200
300
400
500
600
1971
/72
1974
/75
1977
/78
1980
/81
1983
/84
1986
/87
1989
/90
1992
/93
1995
/96
1998
/99
2001
/02
2004
/05
2007
/08
Pla
nted
are
a (h
a x
1000
)
Rio II Anta
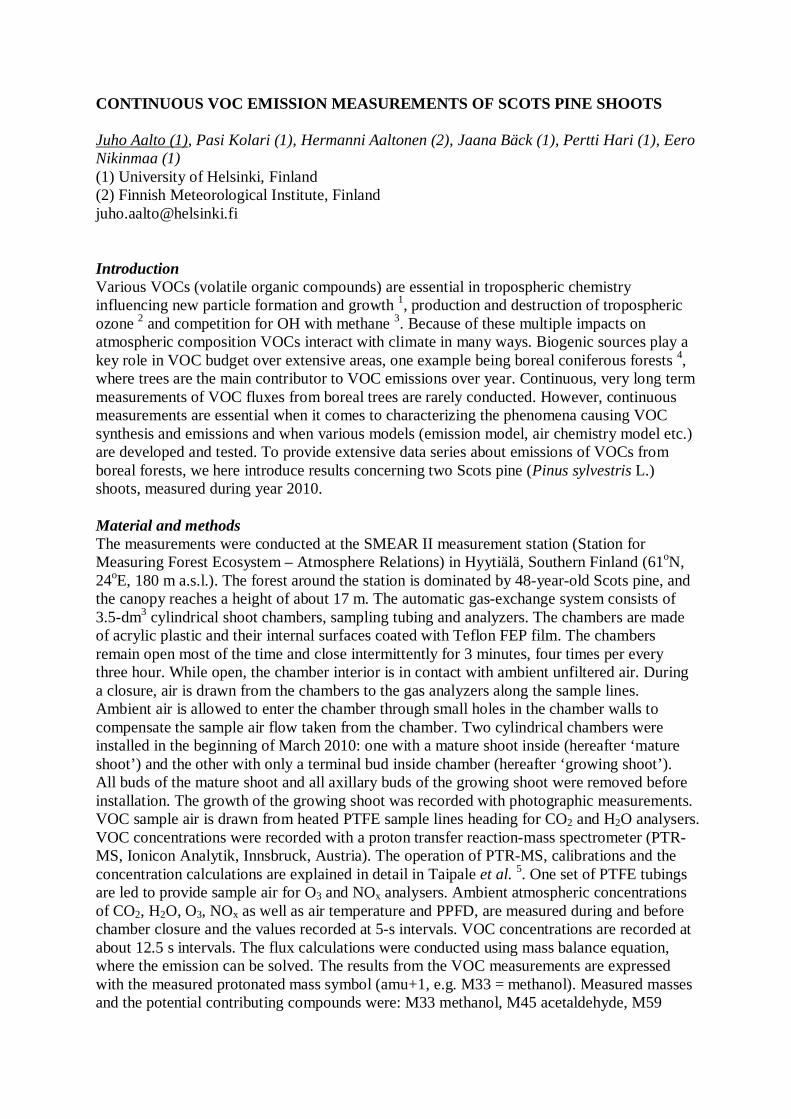
CONTINUOUS VOC EMISSION MEASUREMENTS OF SCOTS PINE SHOOTS Juho Aalto (1), Pasi Kolari (1), Hermanni Aaltonen (2), Jaana Bäck (1), Pertti Hari (1), Eero Nikinmaa (1) (1) University of Helsinki, Finland (2) Finnish Meteorological Institute, Finland [email protected] Introduction Various VOCs (volatile organic compounds) are essential in tropospheric chemistry influencing new particle formation and growth 1, production and destruction of tropospheric ozone 2 and competition for OH with methane 3. Because of these multiple impacts on atmospheric composition VOCs interact with climate in many ways. Biogenic sources play a key role in VOC budget over extensive areas, one example being boreal coniferous forests 4, where trees are the main contributor to VOC emissions over year. Continuous, very long term measurements of VOC fluxes from boreal trees are rarely conducted. However, continuous measurements are essential when it comes to characterizing the phenomena causing VOC synthesis and emissions and when various models (emission model, air chemistry model etc.) are developed and tested. To provide extensive data series about emissions of VOCs from boreal forests, we here introduce results concerning two Scots pine (Pinus sylvestris L.) shoots, measured during year 2010. Material and methods The measurements were conducted at the SMEAR II measurement station (Station for Measuring Forest Ecosystem – Atmosphere Relations) in Hyytiälä, Southern Finland (61oN, 24oE, 180 m a.s.l.). The forest around the station is dominated by 48-year-old Scots pine, and the canopy reaches a height of about 17 m. The automatic gas-exchange system consists of 3.5-dm3 cylindrical shoot chambers, sampling tubing and analyzers. The chambers are made of acrylic plastic and their internal surfaces coated with Teflon FEP film. The chambers remain open most of the time and close intermittently for 3 minutes, four times per every three hour. While open, the chamber interior is in contact with ambient unfiltered air. During a closure, air is drawn from the chambers to the gas analyzers along the sample lines. Ambient air is allowed to enter the chamber through small holes in the chamber walls to compensate the sample air flow taken from the chamber. Two cylindrical chambers were installed in the beginning of March 2010: one with a mature shoot inside (hereafter ‘mature shoot’) and the other with only a terminal bud inside chamber (hereafter ‘growing shoot’). All buds of the mature shoot and all axillary buds of the growing shoot were removed before installation. The growth of the growing shoot was recorded with photographic measurements. VOC sample air is drawn from heated PTFE sample lines heading for CO2 and H2O analysers. VOC concentrations were recorded with a proton transfer reaction-mass spectrometer (PTR-MS, Ionicon Analytik, Innsbruck, Austria). The operation of PTR-MS, calibrations and the concentration calculations are explained in detail in Taipale et al. 5. One set of PTFE tubings are led to provide sample air for O3 and NOx analysers. Ambient atmospheric concentrations of CO2, H2O, O3, NOx as well as air temperature and PPFD, are measured during and before chamber closure and the values recorded at 5-s intervals. VOC concentrations are recorded at about 12.5 s intervals. The flux calculations were conducted using mass balance equation, where the emission can be solved. The results from the VOC measurements are expressed with the measured protonated mass symbol (amu+1, e.g. M33 = methanol). Measured masses and the potential contributing compounds were: M33 methanol, M45 acetaldehyde, M59
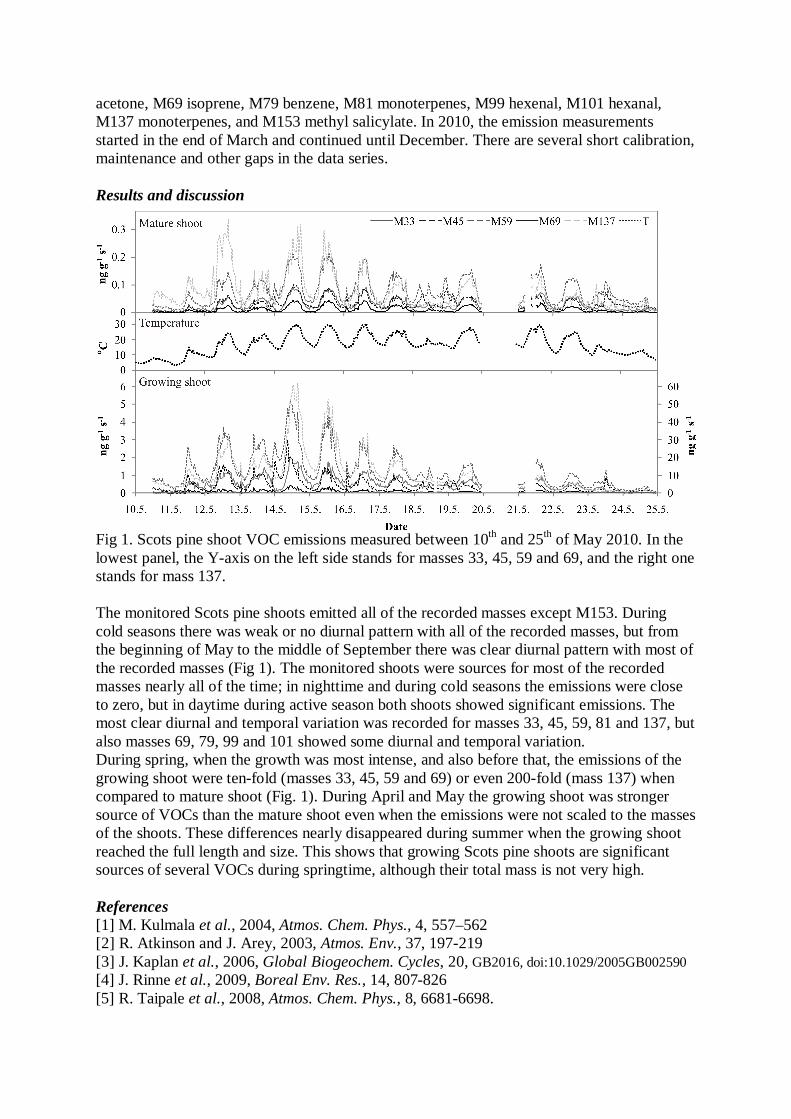
acetone, M69 isoprene, M79 benzene, M81 monoterpenes, M99 hexenal, M101 hexanal, M137 monoterpenes, and M153 methyl salicylate. In 2010, the emission measurements started in the end of March and continued until December. There are several short calibration, maintenance and other gaps in the data series. Results and discussion
Fig 1. Scots pine shoot VOC emissions measured between 10th and 25th of May 2010. In the lowest panel, the Y-axis on the left side stands for masses 33, 45, 59 and 69, and the right one stands for mass 137. The monitored Scots pine shoots emitted all of the recorded masses except M153. During cold seasons there was weak or no diurnal pattern with all of the recorded masses, but from the beginning of May to the middle of September there was clear diurnal pattern with most of the recorded masses (Fig 1). The monitored shoots were sources for most of the recorded masses nearly all of the time; in nighttime and during cold seasons the emissions were close to zero, but in daytime during active season both shoots showed significant emissions. The most clear diurnal and temporal variation was recorded for masses 33, 45, 59, 81 and 137, but also masses 69, 79, 99 and 101 showed some diurnal and temporal variation. During spring, when the growth was most intense, and also before that, the emissions of the growing shoot were ten-fold (masses 33, 45, 59 and 69) or even 200-fold (mass 137) when compared to mature shoot (Fig. 1). During April and May the growing shoot was stronger source of VOCs than the mature shoot even when the emissions were not scaled to the masses of the shoots. These differences nearly disappeared during summer when the growing shoot reached the full length and size. This shows that growing Scots pine shoots are significant sources of several VOCs during springtime, although their total mass is not very high. References [1] M. Kulmala et al., 2004, Atmos. Chem. Phys., 4, 557–562 [2] R. Atkinson and J. Arey, 2003, Atmos. Env., 37, 197-219 [3] J. Kaplan et al., 2006, Global Biogeochem. Cycles, 20, GB2016, doi:10.1029/2005GB002590 [4] J. Rinne et al., 2009, Boreal Env. Res., 14, 807-826 [5] R. Taipale et al., 2008, Atmos. Chem. Phys., 8, 6681-6698.
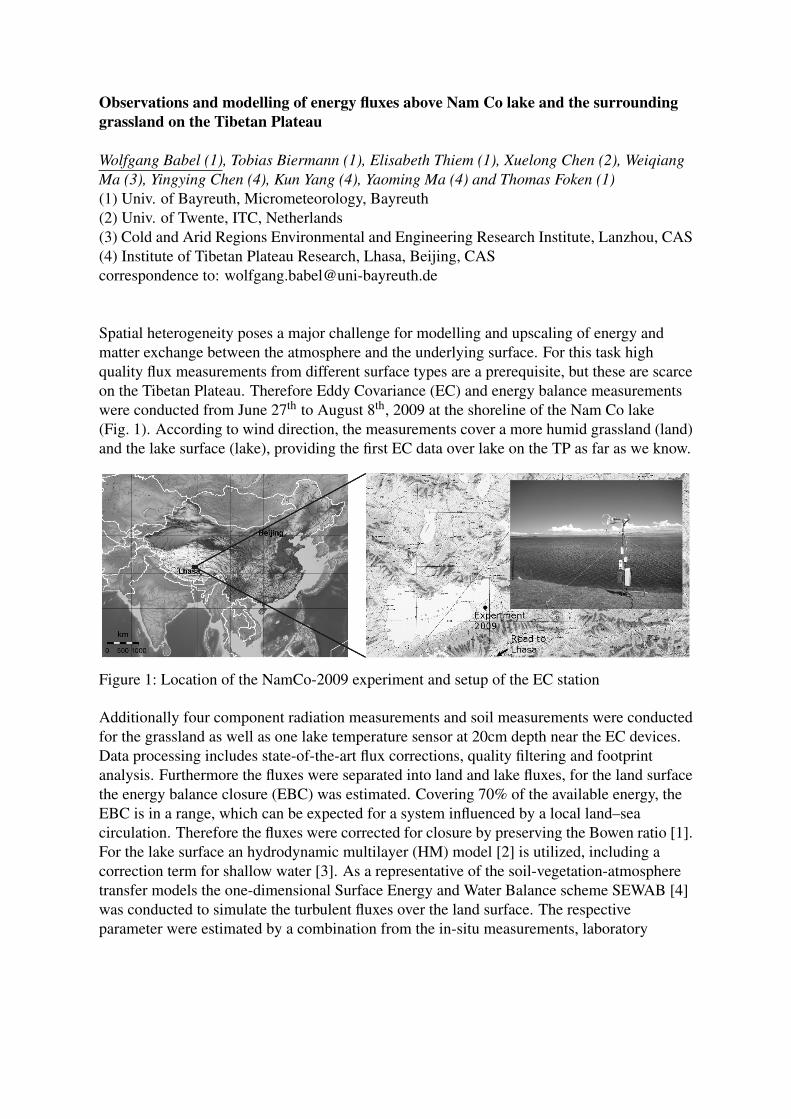
Observations and modelling of energy fluxes above Nam Co lake and the surroundinggrassland on the Tibetan Plateau
Wolfgang Babel (1), Tobias Biermann (1), Elisabeth Thiem (1), Xuelong Chen (2), WeiqiangMa (3), Yingying Chen (4), Kun Yang (4), Yaoming Ma (4) and Thomas Foken (1)(1) Univ. of Bayreuth, Micrometeorology, Bayreuth(2) Univ. of Twente, ITC, Netherlands(3) Cold and Arid Regions Environmental and Engineering Research Institute, Lanzhou, CAS(4) Institute of Tibetan Plateau Research, Lhasa, Beijing, CAScorrespondence to: [email protected]
Spatial heterogeneity poses a major challenge for modelling and upscaling of energy andmatter exchange between the atmosphere and the underlying surface. For this task highquality flux measurements from different surface types are a prerequisite, but these are scarceon the Tibetan Plateau. Therefore Eddy Covariance (EC) and energy balance measurementswere conducted from June 27th to August 8th, 2009 at the shoreline of the Nam Co lake(Fig. 1). According to wind direction, the measurements cover a more humid grassland (land)and the lake surface (lake), providing the first EC data over lake on the TP as far as we know.
Figure 1: Location of the NamCo-2009 experiment and setup of the EC station
Additionally four component radiation measurements and soil measurements were conductedfor the grassland as well as one lake temperature sensor at 20cm depth near the EC devices.Data processing includes state-of-the-art flux corrections, quality filtering and footprintanalysis. Furthermore the fluxes were separated into land and lake fluxes, for the land surfacethe energy balance closure (EBC) was estimated. Covering 70% of the available energy, theEBC is in a range, which can be expected for a system influenced by a local land–seacirculation. Therefore the fluxes were corrected for closure by preserving the Bowen ratio [1].For the lake surface an hydrodynamic multilayer (HM) model [2] is utilized, including acorrection term for shallow water [3]. As a representative of the soil-vegetation-atmospheretransfer models the one-dimensional Surface Energy and Water Balance scheme SEWAB [4]was conducted to simulate the turbulent fluxes over the land surface. The respectiveparameter were estimated by a combination from the in-situ measurements, laboratory
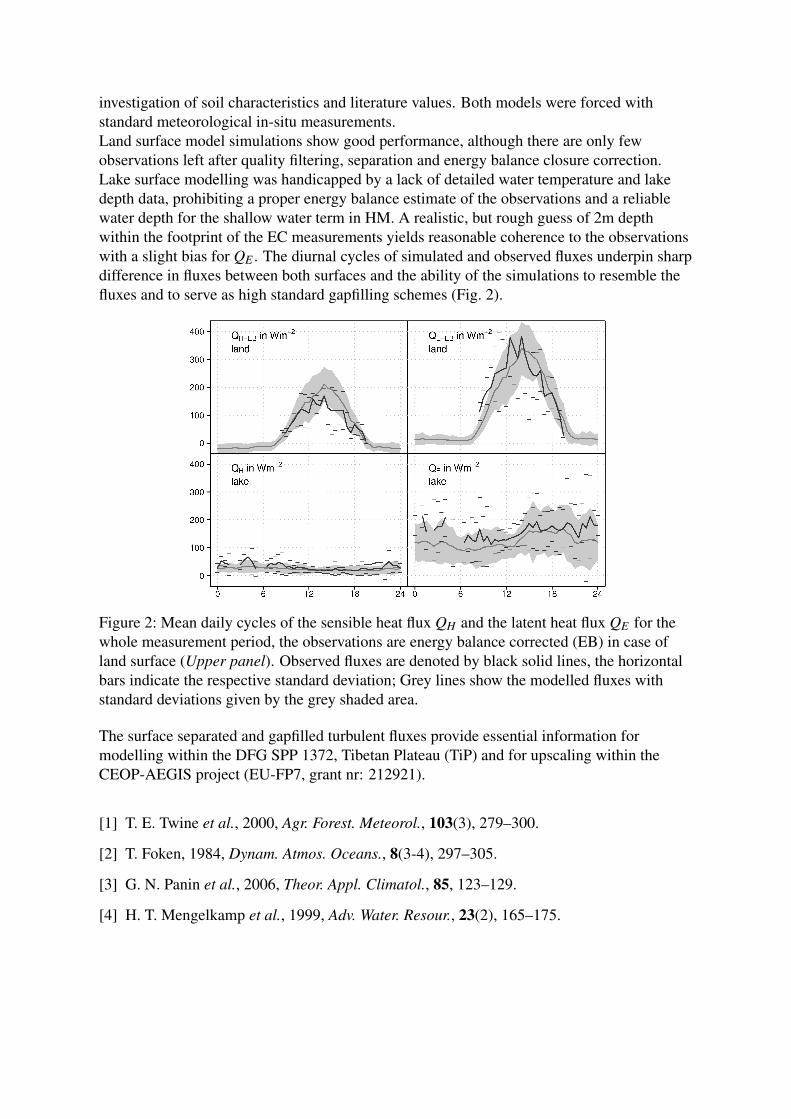
investigation of soil characteristics and literature values. Both models were forced withstandard meteorological in-situ measurements.Land surface model simulations show good performance, although there are only fewobservations left after quality filtering, separation and energy balance closure correction.Lake surface modelling was handicapped by a lack of detailed water temperature and lakedepth data, prohibiting a proper energy balance estimate of the observations and a reliablewater depth for the shallow water term in HM. A realistic, but rough guess of 2m depthwithin the footprint of the EC measurements yields reasonable coherence to the observationswith a slight bias for QE . The diurnal cycles of simulated and observed fluxes underpin sharpdifference in fluxes between both surfaces and the ability of the simulations to resemble thefluxes and to serve as high standard gapfilling schemes (Fig. 2).
Figure 2: Mean daily cycles of the sensible heat flux QH and the latent heat flux QE for thewhole measurement period, the observations are energy balance corrected (EB) in case ofland surface (Upper panel). Observed fluxes are denoted by black solid lines, the horizontalbars indicate the respective standard deviation; Grey lines show the modelled fluxes withstandard deviations given by the grey shaded area.
The surface separated and gapfilled turbulent fluxes provide essential information formodelling within the DFG SPP 1372, Tibetan Plateau (TiP) and for upscaling within theCEOP-AEGIS project (EU-FP7, grant nr: 212921).
[1] T. E. Twine et al., 2000, Agr. Forest. Meteorol., 103(3), 279–300.
[2] T. Foken, 1984, Dynam. Atmos. Oceans., 8(3-4), 297–305.
[3] G. N. Panin et al., 2006, Theor. Appl. Climatol., 85, 123–129.
[4] H. T. Mengelkamp et al., 1999, Adv. Water. Resour., 23(2), 165–175.
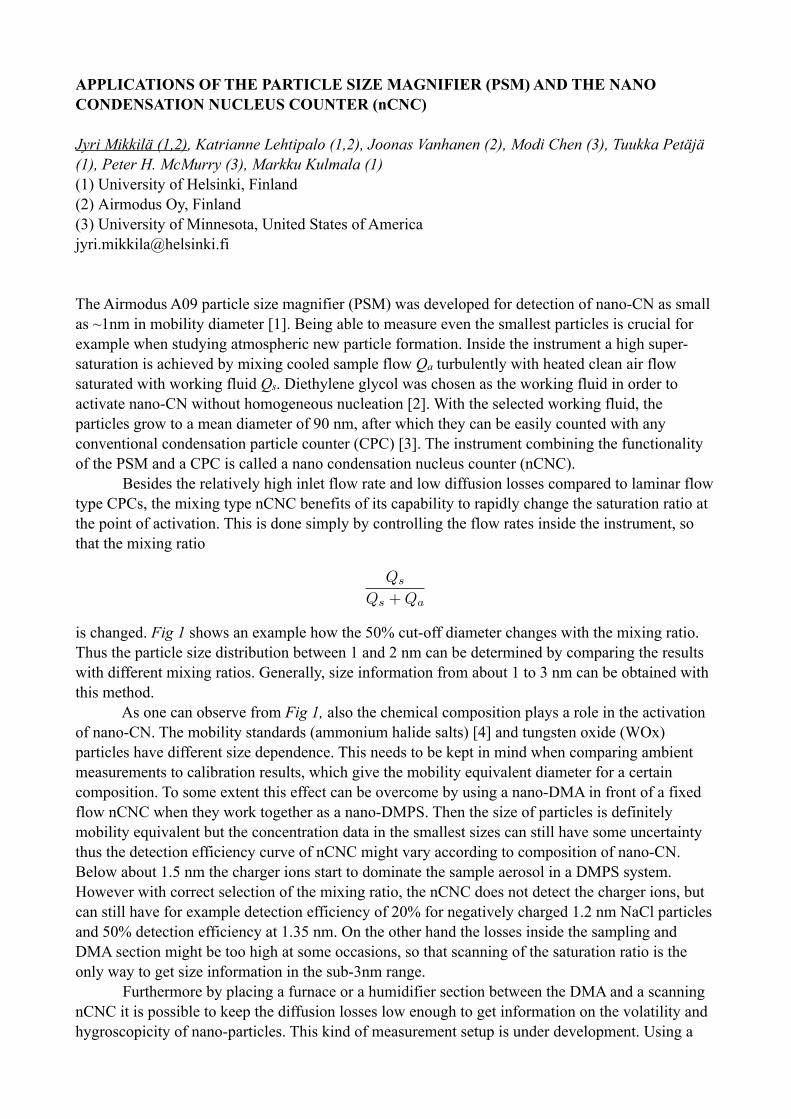
APPLICATIONS OF THE PARTICLE SIZE MAGNIFIER (PSM) AND THE NANO CONDENSATION NUCLEUS COUNTER (nCNC)
Jyri Mikkilä (1,2), Katrianne Lehtipalo (1,2), Joonas Vanhanen (2), Modi Chen (3), Tuukka Petäjä (1), Peter H. McMurry (3), Markku Kulmala (1)(1) University of Helsinki, Finland(2) Airmodus Oy, Finland(3) University of Minnesota, United States of [email protected]
The Airmodus A09 particle size magnifier (PSM) was developed for detection of nano-CN as small as ~1nm in mobility diameter [1]. Being able to measure even the smallest particles is crucial for example when studying atmospheric new particle formation. Inside the instrument a high super-saturation is achieved by mixing cooled sample flow Qa turbulently with heated clean air flow saturated with working fluid Qs. Diethylene glycol was chosen as the working fluid in order to activate nano-CN without homogeneous nucleation [2]. With the selected working fluid, the particles grow to a mean diameter of 90 nm, after which they can be easily counted with any conventional condensation particle counter (CPC) [3]. The instrument combining the functionality of the PSM and a CPC is called a nano condensation nucleus counter (nCNC). Besides the relatively high inlet flow rate and low diffusion losses compared to laminar flow type CPCs, the mixing type nCNC benefits of its capability to rapidly change the saturation ratio at the point of activation. This is done simply by controlling the flow rates inside the instrument, so that the mixing ratio
is changed. Fig 1 shows an example how the 50% cut-off diameter changes with the mixing ratio. Thus the particle size distribution between 1 and 2 nm can be determined by comparing the results with different mixing ratios. Generally, size information from about 1 to 3 nm can be obtained with this method. As one can observe from Fig 1, also the chemical composition plays a role in the activation of nano-CN. The mobility standards (ammonium halide salts) [4] and tungsten oxide (WOx) particles have different size dependence. This needs to be kept in mind when comparing ambient measurements to calibration results, which give the mobility equivalent diameter for a certain composition. To some extent this effect can be overcome by using a nano-DMA in front of a fixed flow nCNC when they work together as a nano-DMPS. Then the size of particles is definitely mobility equivalent but the concentration data in the smallest sizes can still have some uncertainty thus the detection efficiency curve of nCNC might vary according to composition of nano-CN. Below about 1.5 nm the charger ions start to dominate the sample aerosol in a DMPS system. However with correct selection of the mixing ratio, the nCNC does not detect the charger ions, but can still have for example detection efficiency of 20% for negatively charged 1.2 nm NaCl particles and 50% detection efficiency at 1.35 nm. On the other hand the losses inside the sampling and DMA section might be too high at some occasions, so that scanning of the saturation ratio is the only way to get size information in the sub-3nm range. Furthermore by placing a furnace or a humidifier section between the DMA and a scanning nCNC it is possible to keep the diffusion losses low enough to get information on the volatility and hygroscopicity of nano-particles. This kind of measurement setup is under development. Using a
Qs
Qs +Qa
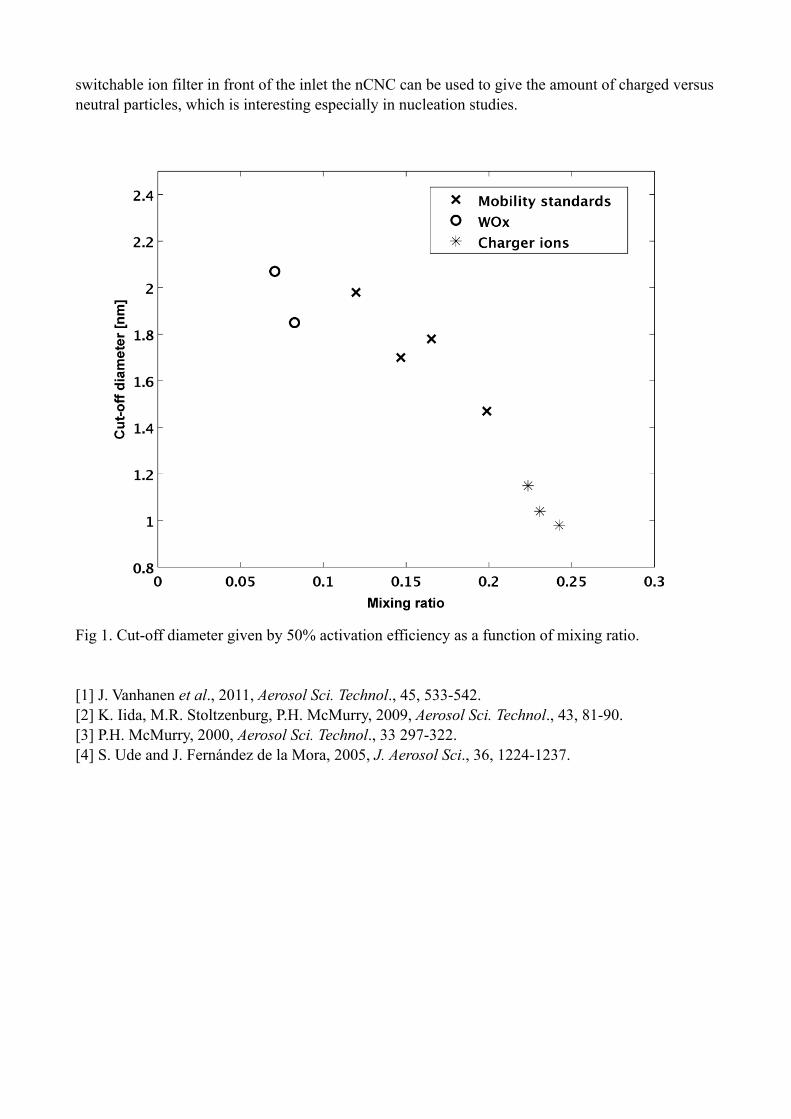
switchable ion filter in front of the inlet the nCNC can be used to give the amount of charged versus neutral particles, which is interesting especially in nucleation studies.
Fig 1. Cut-off diameter given by 50% activation efficiency as a function of mixing ratio.
[1] J. Vanhanen et al., 2011, Aerosol Sci. Technol., 45, 533-542.[2] K. Iida, M.R. Stoltzenburg, P.H. McMurry, 2009, Aerosol Sci. Technol., 43, 81-90.[3] P.H. McMurry, 2000, Aerosol Sci. Technol., 33 297-322.[4] S. Ude and J. Fernández de la Mora, 2005, J. Aerosol Sci., 36, 1224-1237.
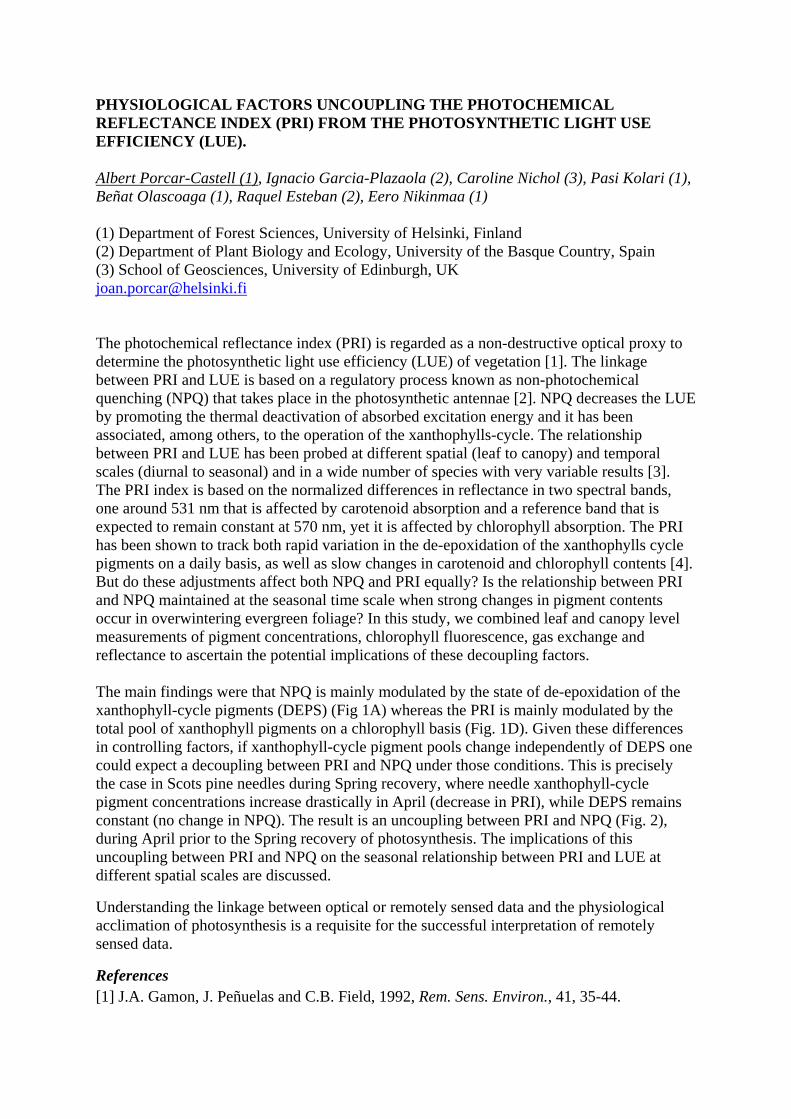
PHYSIOLOGICAL FACTORS UNCOUPLING THE PHOTOCHEMICAL REFLECTANCE INDEX (PRI) FROM THE PHOTOSYNTHETIC LIGHT USE EFFICIENCY (LUE). Albert Porcar-Castell (1), Ignacio Garcia-Plazaola (2), Caroline Nichol (3), Pasi Kolari (1), Beñat Olascoaga (1), Raquel Esteban (2), Eero Nikinmaa (1) (1) Department of Forest Sciences, University of Helsinki, Finland (2) Department of Plant Biology and Ecology, University of the Basque Country, Spain (3) School of Geosciences, University of Edinburgh, UK [email protected] The photochemical reflectance index (PRI) is regarded as a non-destructive optical proxy to determine the photosynthetic light use efficiency (LUE) of vegetation [1]. The linkage between PRI and LUE is based on a regulatory process known as non-photochemical quenching (NPQ) that takes place in the photosynthetic antennae [2]. NPQ decreases the LUE by promoting the thermal deactivation of absorbed excitation energy and it has been associated, among others, to the operation of the xanthophylls-cycle. The relationship between PRI and LUE has been probed at different spatial (leaf to canopy) and temporal scales (diurnal to seasonal) and in a wide number of species with very variable results [3]. The PRI index is based on the normalized differences in reflectance in two spectral bands, one around 531 nm that is affected by carotenoid absorption and a reference band that is expected to remain constant at 570 nm, yet it is affected by chlorophyll absorption. The PRI has been shown to track both rapid variation in the de-epoxidation of the xanthophylls cycle pigments on a daily basis, as well as slow changes in carotenoid and chlorophyll contents [4]. But do these adjustments affect both NPQ and PRI equally? Is the relationship between PRI and NPQ maintained at the seasonal time scale when strong changes in pigment contents occur in overwintering evergreen foliage? In this study, we combined leaf and canopy level measurements of pigment concentrations, chlorophyll fluorescence, gas exchange and reflectance to ascertain the potential implications of these decoupling factors. The main findings were that NPQ is mainly modulated by the state of de-epoxidation of the xanthophyll-cycle pigments (DEPS) (Fig 1A) whereas the PRI is mainly modulated by the total pool of xanthophyll pigments on a chlorophyll basis (Fig. 1D). Given these differences in controlling factors, if xanthophyll-cycle pigment pools change independently of DEPS one could expect a decoupling between PRI and NPQ under those conditions. This is precisely the case in Scots pine needles during Spring recovery, where needle xanthophyll-cycle pigment concentrations increase drastically in April (decrease in PRI), while DEPS remains constant (no change in NPQ). The result is an uncoupling between PRI and NPQ (Fig. 2), during April prior to the Spring recovery of photosynthesis. The implications of this uncoupling between PRI and NPQ on the seasonal relationship between PRI and LUE at different spatial scales are discussed.
Understanding the linkage between optical or remotely sensed data and the physiological acclimation of photosynthesis is a requisite for the successful interpretation of remotely sensed data.
References [1] J.A. Gamon, J. Peñuelas and C.B. Field, 1992, Rem. Sens. Environ., 41, 35-44.
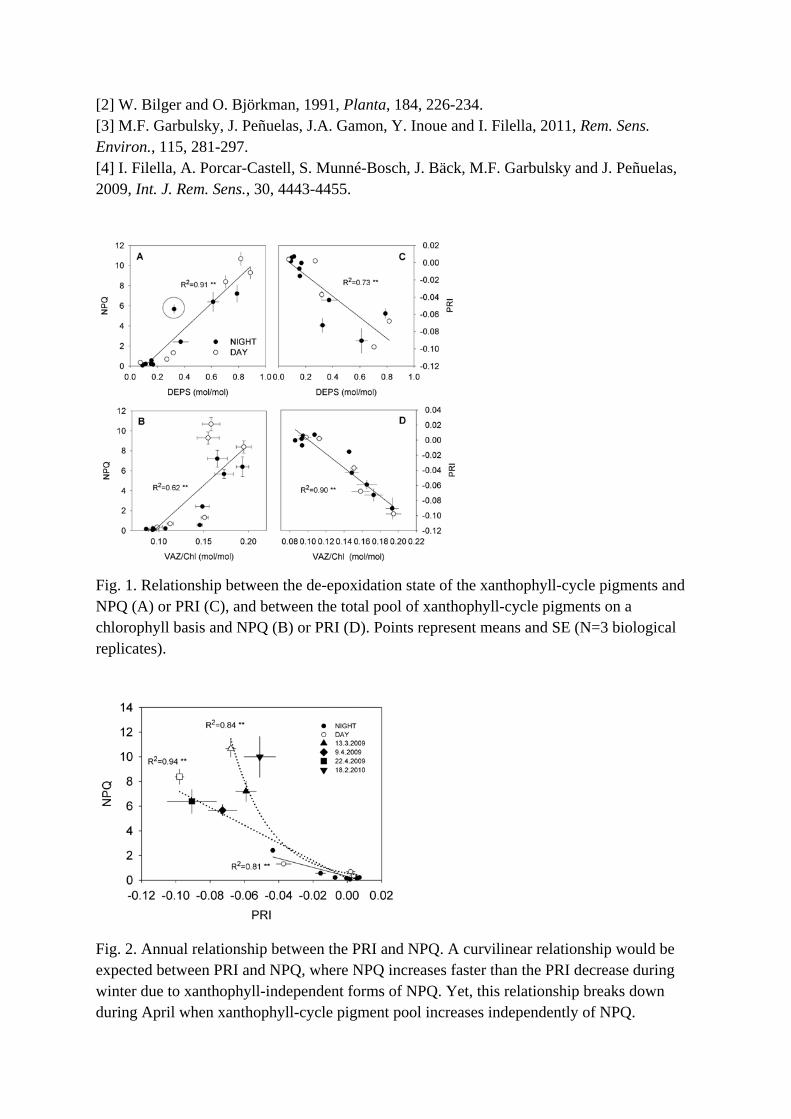
[2] W. Bilger and O. Björkman, 1991, Planta, 184, 226-234. [3] M.F. Garbulsky, J. Peñuelas, J.A. Gamon, Y. Inoue and I. Filella, 2011, Rem. Sens. Environ., 115, 281-297. [4] I. Filella, A. Porcar-Castell, S. Munné-Bosch, J. Bäck, M.F. Garbulsky and J. Peñuelas, 2009, Int. J. Rem. Sens., 30, 4443-4455.
Fig. 1. Relationship between the de-epoxidation state of the xanthophyll-cycle pigments and NPQ (A) or PRI (C), and between the total pool of xanthophyll-cycle pigments on a chlorophyll basis and NPQ (B) or PRI (D). Points represent means and SE (N=3 biological replicates).
Fig. 2. Annual relationship between the PRI and NPQ. A curvilinear relationship would be expected between PRI and NPQ, where NPQ increases faster than the PRI decrease during winter due to xanthophyll-independent forms of NPQ. Yet, this relationship breaks down during April when xanthophyll-cycle pigment pool increases independently of NPQ.

Differences in Water Limitation of Gross Primary Production between the Canopy and Understorey of a Maritime Pine Stand T. Rau, M. Cuntz, J. Ogée, J. M. Bonnefond, C. Rebmann Low soil water content leads to a decrease in Gross Primary Production (GPP). Water stress can be described as threshold of Plant Available Water (PAWt). For soil moisture below PAWt a reduction of GPP is recognized. Whether such water stress affects just the stomata control leaving other photosynthetic parameters unaffected is still discussed. PAWt varies widely for crops under field conditions from 0.35 to 1.0. Whereas for a variety of European forest ecosystems a similar value of 0.4 or slightly below is reported. We examine water limitation of GPP in a maritime pine stand at the Atlantic Coast of France. Net Ecosystem Exchange (NEE) was measured at towers 7m and 40m high with eddy covariance technique. GPP was derived separately for understorey and canopy using the Carboeurope IP protocol. Additional soil moisture (Θ) was measured at six depths. The GPP is then related to total PAW and to PAW of each depth. Results suggest that canopy and understorey have different PAWt, which both are far below 0.4. With an increasing depth the PAWt of each depth increases as well. The definition of the maximal root depth would therefore lead to a different total PAWt. I.e. an incorporation of deeper soil layers would lead to higher PAWt. While water limitation led to an understorey GPP of zero indicating a severe drought, GPP of the canopy was only reduced to one fourth of the reference GPP. The differences in reduction of GPP and the different PAWt, may be caused by different rooting depths. Also, the canopy may have access to ground water while the understorey has not. Further on PAWt depends on the definition of PAW, which may explain the range of thresholds mentioned above.
DERIVATION OF A SPATIAL AND TEMPORAL HIGH RESOLUTION LAI
PRODUCT FROM MULTI-SCALE REMOTE SENSING DATA FOR
HYDROLOGICAL MODELING
Sarah Asam (1), Doris Klein (2), Marc Zebisch (3), Harald Kunstmann (4), Stefan Dech (1)
(1) German Remote Sensing Data Center, German Aerospace Center (DLR), Germany.
(2) Remote Sensing Unit, Department of Geography, University of Würzburg, Germany.
(3) Institute for Applied Remote Sensing, European Academy of Bozen, Italy.
(4) Institute for Meteorology and Climate Research - Atmospheric Environmental Research,
Karlsruhe Institute of Technology, Germany.
Global changes are driving alterations in climate, water resources, and ecological systems.
Monitoring these changes, and thereby especially the spatial and temporal variability of
vegetation properties, is one of the foremost fields of research within remote sensing. The
knowledge of these variables is crucial for understanding terrestrial biosphere processes and
can be used for the parameterization of various physical models, quantifying the exchange of
energy and matter between the land surface and the atmosphere [1]. Due to the role of green
leaves in controlling biological and physical processes in plant canopies, the Leaf Area Index
(LAI) is a key element of vegetation structure and an important input parameter to
hydrological models [2]. Thus, a temporal and spatial continuous and high resolution LAI
product will be derived for grassland and forests in the River Ammer catchment in the
Bavarian alpine upland. A regional LAI product adapted to the alpine upland will be a unique
data set and of high use for modeling activities within the TERENO project and other
monitoring and modeling applications.
The algorithm is based on multi-scale remote sensing data in order to combine and fully
utilize the temporal and spatial resolution properties of different sensors. Due to the still
infrequent and irregular data availability from single high resolution sensors, multi-sensor
approaches are required to fill the gaps in data sequences and to guarantee data takes at
critical time steps during the phenological phases. Thus, for some high resolution RapidEye
scenes recorded during the vegetation period of 2011, the LAI as well as the land cover will
be derived. Additionally, continuous phenological signals will be detected by MODIS time
series to fill the gaps in between the high resolution data.
The RapidEye data will be used as input data to the inverted radiation transfer model
PROSAIL [3,4]. Regarding the inversion, look up tables (LUTs) are applied due to their good
performance in several studies and the reduced computational demand [2]. Further, high
resolution land cover and cover fraction maps will be derived from the RapidEye scenes and
by means of in situ data. Those maps can be used as prior information, defining the
application of a specific LUT during the LAI derivation process [5,6].
As the high resolution satellite data will enable a differentiable representation of various
biomes and vegetation states, it is assumed that the PROSAIL model is highly sensitive to the
variability of the input parameters. Therefore, the customization of the parameters for each
biome and for different development stages is required [2,7]. Based on these calibrations,
individual LUTs can be calculated on the RapidEye scale. Therefore, in situ measurements of
average leaf angle, chlorophyll, brown matter and water content, and soil spectra will be
collected repeatedly at representative sites during five field campaigns in spring and summer
2011 [8]. Also the LAI will be derived in the field for validation purposes using hemispherical
photographs in forests [9,10] and LICOR plant canopy analyzer measurements as well as
destructive sampling in meadows [10,11]. In addition to the plot measurements, two
hemispherical outdoor webcams will be installed (one on grassland, one inside a mixed

beech/spruce forest) to obtain continuous LAI field observations for representative biomes.
These measurements will be of special importance for the observation of phenological phases
and abrupt changes.
To use the MODIS time series information on a finer scale, the relation between very high
and medium resolution data has to be identified in the next step. Therefore, the RapidEye LAI
values will be aggregated to the 250 m MODIS reflectance data resolution level. On this level,
medium resolution LAI time series will be derived for all available MODIS seasons. At first,
the LAI will be derived using the above mentioned RTM, which was adapted to MODIS data
at the EURAC in Bolzano. However, as the heterogeneity of the underlying landscape has to
be considered, the use of adapted canopy reflectance models (GeoSail, 4SAIL2 or FLIM, see
[4]) instead of SAIL will be tested. For comparison purposes, also a statistical extrapolation of
the aggregated RapidEye data by the random forest approach will be tested. Therefore, the
MODIS time series features will be used to account for the temporal variability of the LAI
due to natural phenologies as well as to anthropogenic land management [12].
The medium resolution LAI time series has to be disaggregated in a last step. As downscaling
method, a disaggregation weighted according to the high resolution land cover map and cover
fraction information will be persecuted. Thereby, ideas taking into account the spatial non-
stationarity of biomes (e.g. due to environmental or management factors) like proposed in
[13] will be employed.
The collected in situ data will be used to directly validate the physically and statistically
derived LAI values on both scales. Additionally, also the temporal continuity and the accurate
mapping of inter- and intra-annual fluctuations are crucial conditions for the automatic
application of the product in system models. The continuous in situ data based on multiple
field measurements arranged in a nested sampling design of 20 x 20 m and 250 x 250 m plots
as well as the webcam information will thereby be a unique validation data set [14].
The seasonal adjusted and spatially high resolution LAI product can be applied in various
monitoring and modeling activities. As the product will also provide land cover and fractional
cover information, those will be of high use as input parameters in the hydrological models of
the Ammer and the Rott River catchments. Further, statistical analyses of vegetation
responses to meso-scale climatic conditions can be conducted profiting from the detailed
climatic records collected at the TERENO pre-alpine observation sites. Thus, the relevance of
a remotely sensed LAI product at the interface to neighboring disciplines in ecosystem-
atmosphere research can be shown.
References
[1] P. J. Sellers and D.S. Schmid, 1993, Global Planetary Change, 7, 279−297.
[2] R. Darvishzadeh et al., 2008, Remote Sens. Environ., 112, 2592-2604.
[3] M. Meroni et al., 2004, Remote Sens. Environ., 92, 195−206.
[4] S. Jacquemoud et al., 2009, Remote Sens. Environ., 113, 56–66.
[5] R.B. Myneni et al., 2002, Remote Sens. Environ., 83, 214–231.
[6] B. Combal et al., 2002, Remote Sens. Environ., 84, 1−15.
[7] W. Dorigo et al., 2009, Remote Sensing, 1, 1139-1170.
[8] F. Vuolo et al., 2010, in: ISPRS TC VII Symposium, W. Wagner and B. Székely, Eds., 38,
281-286.
[9] M. Weiss, 2002. EYE-CAN User Guide. NOVELTIS, Toulouse, France.
[10] I. Jonckheere et al., 2004, Agricultural and Forest Meteorology, 121, 19–35.
[11] A. Hammerle et al., 2008, Biogeosciences, 5, 421–431.
[12] C. Hüttich et al., 2009, Remote Sensing, 1, 620-643.
[13] L. Busetto et al., 2008, Remote Sens. Environ., 112, 118–131.
[14] M. Weiss et al., 2007, Remote Sens. Environ., 110, 317-331.
SEASONAL VARIABILITY IN HIGH-ALPINE AIRBORNE BACTERIAL COMMUNITIES R. M. Bowers and N. Fierer University of Colorado, Boulder, CO U.S.A. [email protected] Background and Aims. Airborne bacteria are a large component of the near-surface atmospheric aerosol; however we know surprisingly little about the temporal dynamics of airborne bacteria. With this work, we described seasonal shifts in bacterial abundances, total particle abundances and bacterial community structure at a high-elevation research station located in Colorado, USA. Methods. To address these knowledge gaps, we collected aerosol samples on the rooftop of Storm Peak Laboratory (3200 m ASL) over the course of 2-3 week periods during each of the four calendar seasons. Total bacterial abundances were assessed via flow cytometry, total particle abundances were calculated with an aerodynamic particle sizer, and bacterial communities were characterized using a high-throughput barcoded pyrosequencing approach. Results. Bacterial abundances varied by season with the highest concentrations observed during the fall and spring seasons (Fig. 1). This pattern contrasts with the shifts in total particle concentrations (> 0.5 µm) during the same sampling times, as the fall, spring and summer seasons had significantly higher particle counts than the counts documented during the winter season. The airborne bacterial communities varied significantly by season, with the summer communities being the most distinct (Fig. 2). Specific bacterial taxa indicative of each season were identified with the dominant taxa in the fall, spring, and winter sampling periods (when the ground was snow covered) dominated by taxa commonly found in polar and alpine environments. In contrast, the summer samples contained bacterial taxa that appear to be derived from soil and leaf-surface environments. Conclusion. High-alpine bacterial communities appear to make up a large fraction of the total atmospheric aerosol, however the different seasonal patterns between bacterial counts and total particle counts suggests that distinct factors control the quantities of different particles that make it into the atmosphere. Furthermore, the characteristics of local terrestrial sources that undergo seasonal cycles seem to have the greatest influence on the airborne communities. As airborne bacteria are more commonly being recognized as a ubiquitous component of the atmosphere, a better understanding of their temporal dynamics in the high-alpine environment may give us insight into their many potential roles in atmospheric dynamics, free troposphere atmospheric dispersal patterns, and their role in human and environmental health.
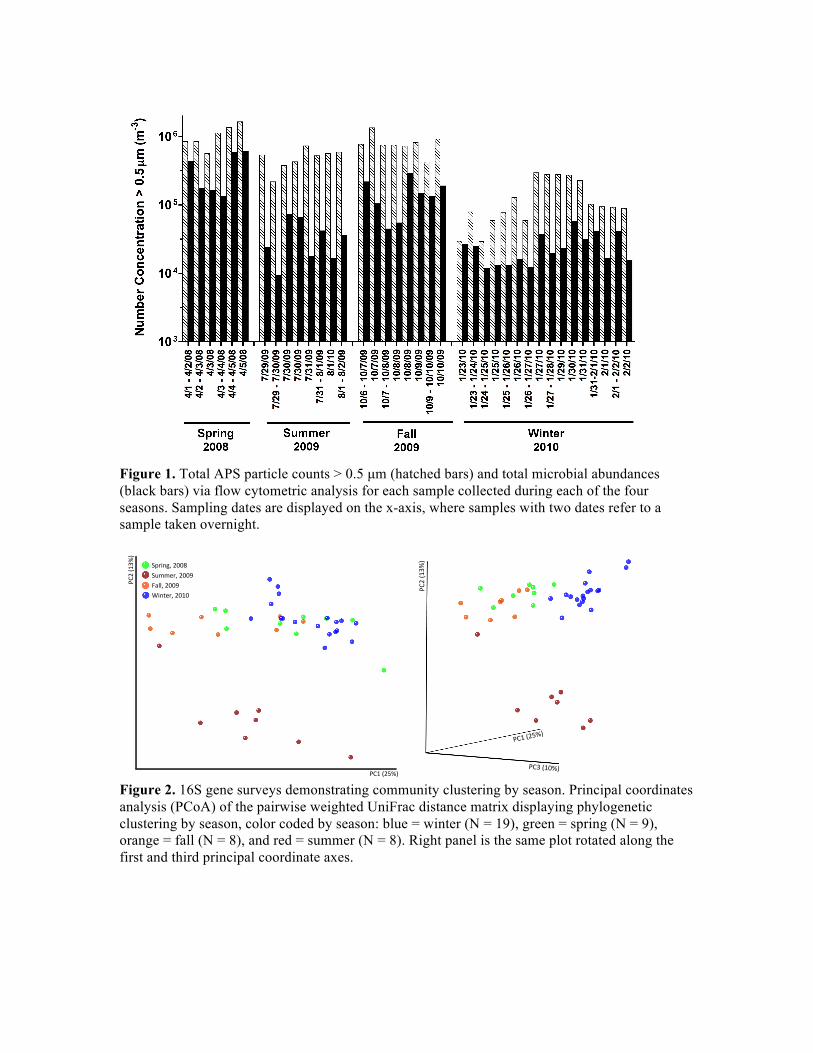
Figure 1. Total APS particle counts > 0.5 µm (hatched bars) and total microbial abundances (black bars) via flow cytometric analysis for each sample collected during each of the four seasons. Sampling dates are displayed on the x-axis, where samples with two dates refer to a sample taken overnight.
Figure 2. 16S gene surveys demonstrating community clustering by season. Principal coordinates analysis (PCoA) of the pairwise weighted UniFrac distance matrix displaying phylogenetic clustering by season, color coded by season: blue = winter (N = 19), green = spring (N = 9), orange = fall (N = 8), and red = summer (N = 8). Right panel is the same plot rotated along the first and third principal coordinate axes.
!"#$%&'(
)$
!"&$%#*()$
+,--.$#//0$123456.$#/&/$
789956.$#//0$7:623;.$#//<$
!"#$%&'()$
!"*$%&#(
)$
!"&$%*+()$
TROPOSPHERIC VOC MONITORING BY PROTON TRANSFER REACTION-MASS SPECTROMETRY (PTR-MS) IN A WESTERN AUSTRALIAN MIXED RURAL AND INDUSTRIAL ECOSYSTEM
Erika Zardin1, Sam Saunders1, Ian Galbally2, Jodi Ariti3
1 University of Western Australia – Atmospheric and Environmental Chemistry Research Group, Perth, Western Australia. 2 CSIRO Marine and Atmospheric Research – Centre for Australian Weather and Climate Research, Melbourne, Victoria. 3 Department of Environment and Conservation – Air Quality Management Branch, Perth, Western Australia.
Corresponding author email [email protected]
The PTR-MS technique builds on Chemical Ionization Mass Spectrometry (CIMS) principles to perform instantaneous, high resolution quantitative assessment of several reactive VOC at concentration levels down to ppbV [1]. Trace atmospheric VOC were continuously monitored by PTR-MS at a ground site in Yarloop, a rural location about 150 Km South of Perth (WA), from spring 2008 through to spring 2009. Besides the biogenic and biomass burning sources characteristic of the rural Australian environment, the site is impacted with emissions from a nearby isolated alumina refinery, a railway line and a regional motorway. During the winter ‘09 PTR-MS campaign the volume mixing ratios of NMHC, O3, NOx, CO, SO2 and concentrations of PM2.5 were also continuously monitored, along with a suite of meteorological parameters. Boundary layer height measurements were conducted using ground-based Ceilometer backscatter radar. The mean diurnal cycles and seasonal differences in VOC levels have been revealed and an interpretation attempted in light of meteorology, phenology and tropospheric chemistry at the site. Regression analyses on the VOC and air quality criteria pollutant concentrations, when compared with known emission ratios, resolved the influence from industrial, traffic-related or biomass burning sources impacting the site [2]. The results from this campaign are the first highly resolved inter-annual baseline VOC measurements available for the WA Mediterranean ecosystem, shedding light on the interplay between local meteorology, biogenic and anthropogenic VOC sources and air quality issues. The detailed VOC dataset lends itself to atmospheric chemistry modelling applications.
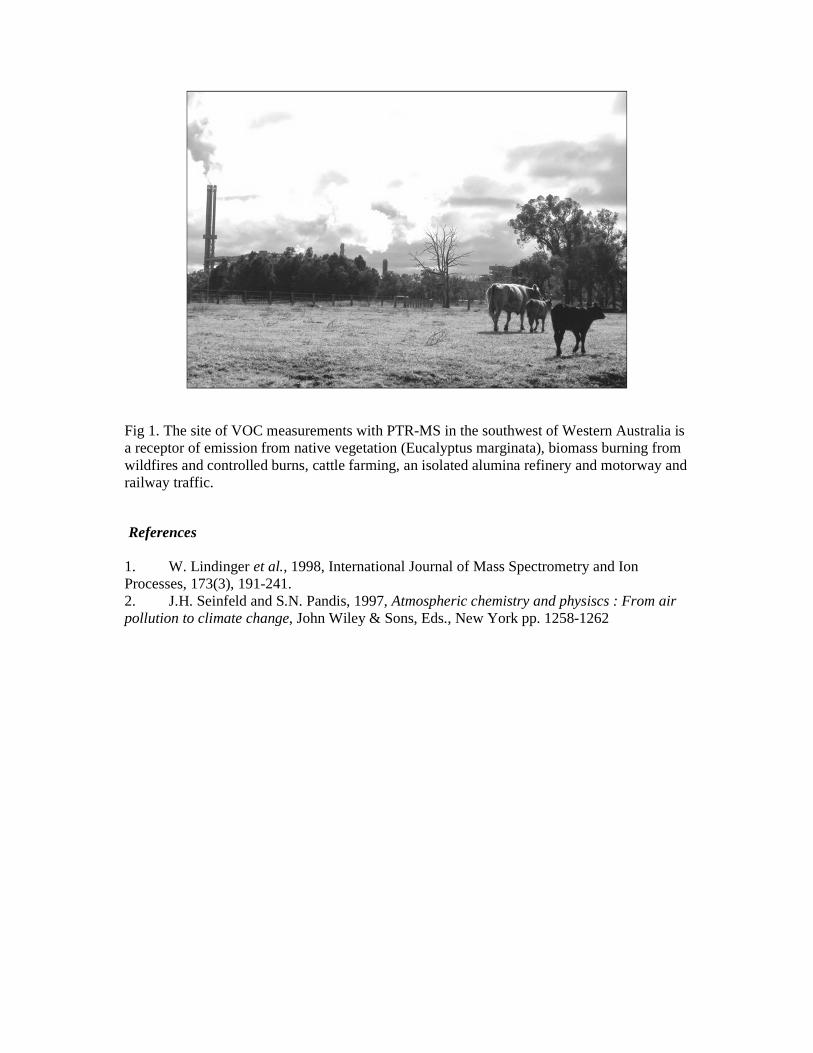
Fig 1. The site of VOC measurements with PTR-MS in the southwest of Western Australia is a receptor of emission from native vegetation (Eucalyptus marginata), biomass burning from wildfires and controlled burns, cattle farming, an isolated alumina refinery and motorway and railway traffic.
References
1. W. Lindinger et al., 1998, International Journal of Mass Spectrometry and Ion Processes, 173(3), 191-241. 2. J.H. Seinfeld and S.N. Pandis, 1997, Atmospheric chemistry and physiscs : From air pollution to climate change, John Wiley & Sons, Eds., New York pp. 1258-1262
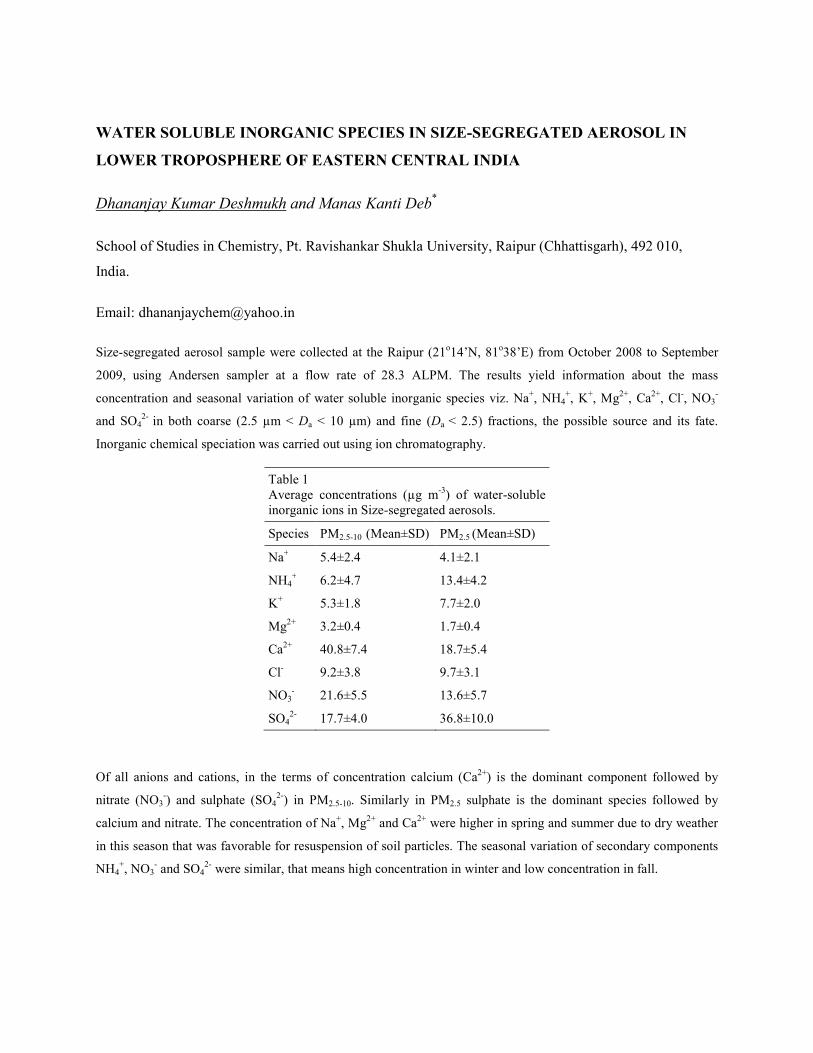
WATER SOLUBLE INORGANIC SPECIES IN SIZE-SEGREGATED AEROSOL IN
LOWER TROPOSPHERE OF EASTERN CENTRAL INDIA
Dhananjay Kumar Deshmukh and Manas Kanti Deb*
School of Studies in Chemistry, Pt. Ravishankar Shukla University, Raipur (Chhattisgarh), 492 010,
India.
Email: [email protected]
Size-segregated aerosol sample were collected at the Raipur (21o14’N, 81
o38’E) from October 2008 to September
2009, using Andersen sampler at a flow rate of 28.3 ALPM. The results yield information about the mass
concentration and seasonal variation of water soluble inorganic species viz. Na+, NH4
+, K
+, Mg
2+, Ca
2+, Cl
-, NO3
-
and SO42- in both coarse (2.5 µm < Da < 10 µm) and fine (Da < 2.5) fractions, the possible source and its fate.
Inorganic chemical speciation was carried out using ion chromatography.
Table 1
Average concentrations (µg m-3) of water-soluble
inorganic ions in Size-segregated aerosols.
Species PM2.5-10 (Mean±SD) PM2.5 (Mean±SD)
Na+ 5.4±2.4 4.1±2.1
NH4+ 6.2±4.7 13.4±4.2
K+ 5.3±1.8 7.7±2.0
Mg2+ 3.2±0.4 1.7±0.4
Ca2+ 40.8±7.4 18.7±5.4
Cl- 9.2±3.8 9.7±3.1
NO3- 21.6±5.5 13.6±5.7
SO42- 17.7±4.0 36.8±10.0
Of all anions and cations, in the terms of concentration calcium (Ca2+) is the dominant component followed by
nitrate (NO3-) and sulphate (SO4
2-) in PM2.5-10. Similarly in PM2.5 sulphate is the dominant species followed by
calcium and nitrate. The concentration of Na+, Mg
2+ and Ca
2+ were higher in spring and summer due to dry weather
in this season that was favorable for resuspension of soil particles. The seasonal variation of secondary components
NH4+, NO3
- and SO4
2- were similar, that means high concentration in winter and low concentration in fall.
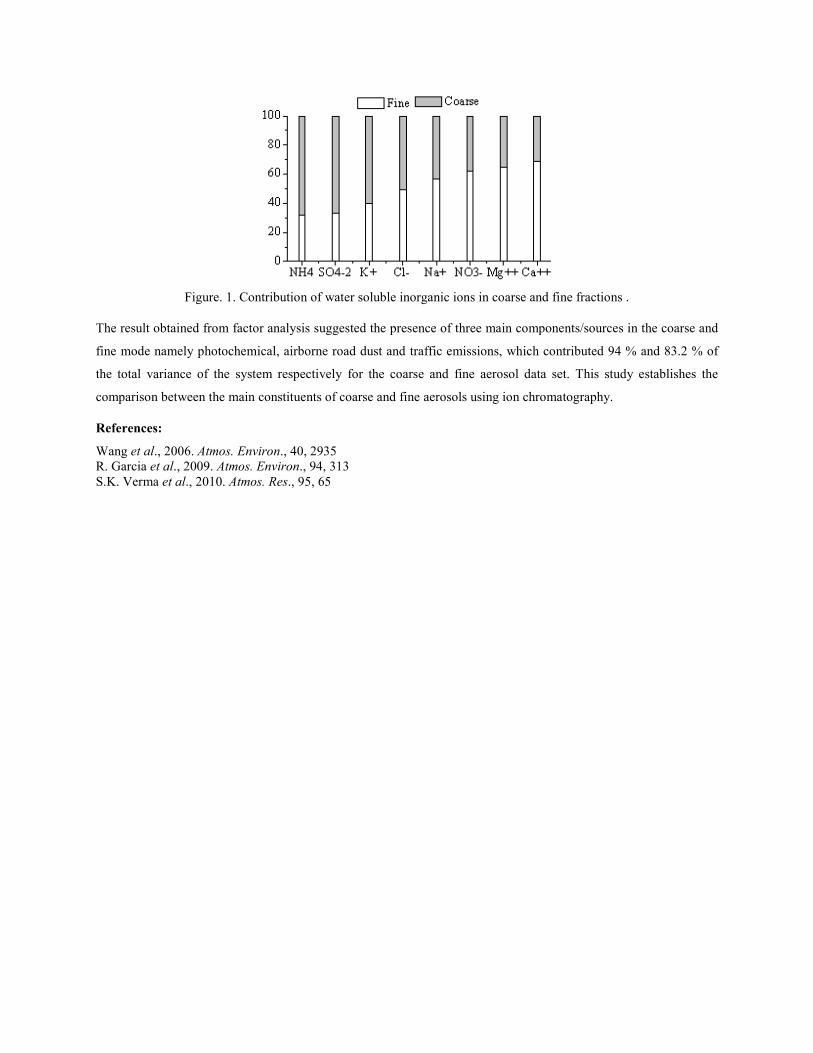
Figure. 1. Contribution of water soluble inorganic ions in coarse and fine fractions .
The result obtained from factor analysis suggested the presence of three main components/sources in the coarse and
fine mode namely photochemical, airborne road dust and traffic emissions, which contributed 94 % and 83.2 % of
the total variance of the system respectively for the coarse and fine aerosol data set. This study establishes the
comparison between the main constituents of coarse and fine aerosols using ion chromatography.
References:
Wang et al., 2006. Atmos. Environ., 40, 2935
R. Garcia et al., 2009. Atmos. Environ., 94, 313
S.K. Verma et al., 2010. Atmos. Res., 95, 65
STUDY OF TROPOSPHERIC OZONE IN CHINA
Aijun DING(1*), Tao WANG(2), Congbin FU(1)
(1) Institute for Climate and Global Change Research & School of Atmospheric
Sciences, Nanjing University, China (*[email protected])
(2) Department of Civil & Structure Engineering, The Hong Kong Polytechnic
University, Hong Kong, China
This work gives a summary about some recent findings from tropospheric ozone
study in China. Long-term ozone measurements from surface sites, the MOZAIC
aircraft program, and ozonesonde program in typical regions of China will be
presented. The temporal variation, including seasonal patterns and long-term trend,
and the vertical profiles of tropospheric ozone in the three most developed regions,
Beijing, Shanghai and Hong Kong will be shown. By using lagarangian transport and
dispersion model and global/regional chemical transport model simulations, the main
mechanisms/processes that dominated the temporal/spatial patterns of ozone in typical
regions will be discussed. The results suggest that the increasing anthropogenic
emissions in coastal developed regions of China is the main cause for the strong trend
of tropospheric ozone in East Asia in the latest decades, and that the metrological
processes play an important role on the regional/long-range transport of
photochemical pollutants. This study highlights the important impact of human
activities on the regional/global atmosphere.

GROSS CO2-BIOSPHERE EXCHANGE FLUX DURING THE INDIAN SUMMER
MONSOON AS EVIDENCED BY CARIBIC AIRCRAFT CO2 ISOTOPE DATA.
Sergey S. Assonov (1,2,3) Carl A.M. Brenninkmeijer (1) (1) Max Planck Institute for Chemistry, Mainz, Germany
(2) JRC-IRMM, European Commission, Geel, Belgium
(3) presently at the Institute for Geology, University of Köln, Germany;
e-mail: [email protected]
Observational programs aimed at greenhouse gas monitoring, covering different geographical
scales, from very local, via regional to global, are predominantly based on observations at the
Earth surface and in nearly all cases planetary boundary layer air is probed. Most observation
sites are close to CO2 sources and sinks, with fewer stations exposed on mountains to the free
troposphere. There also are programs using ocean ships (e.g. the Pacific Greenhouse Gas
Measurements) and vertical profiling by small research aircrafts (NOAA/ESRL). A known
deficiency is that global networks do cover developing countries (particularly the tropics) only
sparsely. Also much less information is available at altitude, although satellite based
observations are continuously being refined. However satellite observations need to be
validated/calibrated by direct measurements and also here aircraft measurements can help, but
are expensive. In view of all this, the 13th CO2 Expert Meeting recommended [1] to promote
programs using commercial aircraft (cruise altitude 10-12 km) providing information about
CO2 and other GHG in background air, in the free tropical troposphere and in the tropopause
region, remote from CO2 sources and sinks. During take-off and landing, vertical measurement
profiles are obtained as well.
The project CARIBIC (Civil Aircraft for Regular Investigation of the atmosphere Based on an
Instrument Container, www.caribic-atmospheric.com) started in 1997 and aims to study
atmospheric chemistry and composition by measuring many compounds and species in the
upper troposphere around the globe. The CARIBIC-2 (second phase) instrument container,
operating onboard an A340-600 of Lufthansa (Frankfurt), performs monthly flights from
Frankfurt to North and South America, China, Japan, and India. The container includes an
extended range of instrumentation (O3, CO, NOx, H2O and for other species, see www.caribic-
atmospheric.com). During the period of isotope measurements, the sampling system consisted
of two collector boxes each with 14 glass containers being filled with 10 liter of air within a
minute (giving ~14 km sampling resolution) at regular intervals.
In 2007-2009 JRC-IRMM, in collaboration with the project CARIBIC conducted systematic
measurements aimed to study the global distribution of CO2 isotopic composition (Fig. 1). A
large data set for the upper troposphere-lowermost stratosphere and free troposphere was
obtained. For the first time it is demonstrated how CO2 isotope signals reflect global-scale
variability in air mass origin [2]. The very close correlations observed arise either from
stratosphere/troposphere mixing or from mixing of background air and air masses affected by
CO2 sources and sinks, over long distances and throughout the seasons. The high quality 18
O(CO2) data prove to be a useful tracer reflecting long range CO2 transport and also CO2
exchange with land biosphere and soils and respiration.
In June-September 2008 four CARIBIC flights crossed the Indian monsoon plume. The Indian
summer monsoon is known to be a major mechanism delivering continental polluted air to the
free troposphere in this region. Based on gradients of GHG data over the Indian continent,
fluxes of methane and N2O as well as the CO2 sink magnitude were estimated [3]. In particular
CO2 isotope data demonstrated regular 18
O(CO2) shifts at the same latitudes where methane
increases were observed (Fig. 2). As methane indicates land surface-affected air masses,
negative 18
O(CO2) shifts are interpreted as CO2 exchange with the land biosphere&soils and
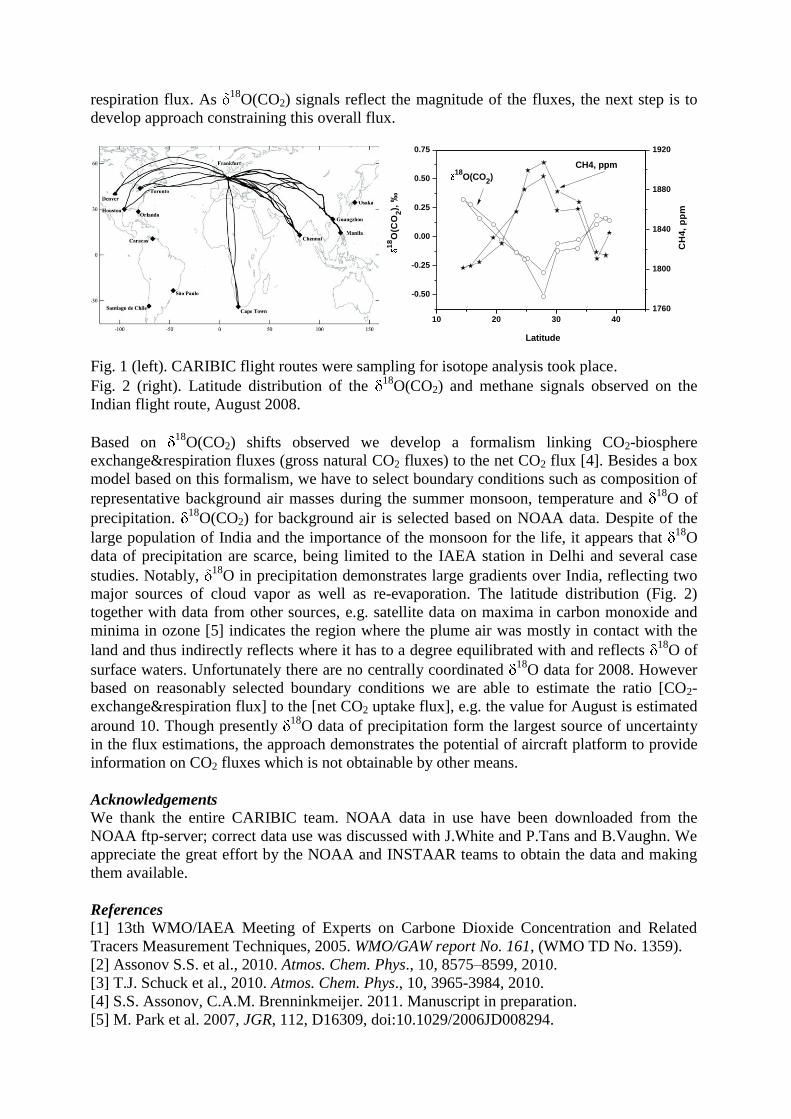
respiration flux. As 18
O(CO2) signals reflect the magnitude of the fluxes, the next step is to
develop approach constraining this overall flux.
10 20 30 40
-0.50
-0.25
0.00
0.25
0.50
0.75
1760
1800
1840
1880
1920
18O(CO
2)
18O
(CO
2),
‰
Latitude
CH4, ppm
CH
4,
pp
m
Fig. 1 (left). CARIBIC flight routes were sampling for isotope analysis took place.
Fig. 2 (right). Latitude distribution of the 18
O(CO2) and methane signals observed on the
Indian flight route, August 2008.
Based on 18
O(CO2) shifts observed we develop a formalism linking CO2-biosphere
exchange&respiration fluxes (gross natural CO2 fluxes) to the net CO2 flux [4]. Besides a box
model based on this formalism, we have to select boundary conditions such as composition of
representative background air masses during the summer monsoon, temperature and 18
O of
precipitation. 18
O(CO2) for background air is selected based on NOAA data. Despite of the
large population of India and the importance of the monsoon for the life, it appears that 18
O
data of precipitation are scarce, being limited to the IAEA station in Delhi and several case
studies. Notably, 18
O in precipitation demonstrates large gradients over India, reflecting two
major sources of cloud vapor as well as re-evaporation. The latitude distribution (Fig. 2)
together with data from other sources, e.g. satellite data on maxima in carbon monoxide and
minima in ozone [5] indicates the region where the plume air was mostly in contact with the
land and thus indirectly reflects where it has to a degree equilibrated with and reflects 18
O of
surface waters. Unfortunately there are no centrally coordinated 18
O data for 2008. However
based on reasonably selected boundary conditions we are able to estimate the ratio [CO2-
exchange&respiration flux] to the [net CO2 uptake flux], e.g. the value for August is estimated
around 10. Though presently 18
O data of precipitation form the largest source of uncertainty
in the flux estimations, the approach demonstrates the potential of aircraft platform to provide
information on CO2 fluxes which is not obtainable by other means.
Acknowledgements
We thank the entire CARIBIC team. NOAA data in use have been downloaded from the
NOAA ftp-server; correct data use was discussed with J.White and P.Tans and B.Vaughn. We
appreciate the great effort by the NOAA and INSTAAR teams to obtain the data and making
them available.
References
[1] 13th WMO/IAEA Meeting of Experts on Carbone Dioxide Concentration and Related
Tracers Measurement Techniques, 2005. WMO/GAW report No. 161, (WMO TD No. 1359).
[2] Assonov S.S. et al., 2010. Atmos. Chem. Phys., 10, 8575–8599, 2010.
[3] T.J. Schuck et al., 2010. Atmos. Chem. Phys., 10, 3965-3984, 2010.
[4] S.S. Assonov, C.A.M. Brenninkmeijer. 2011. Manuscript in preparation.
[5] M. Park et al. 2007, JGR, 112, D16309, doi:10.1029/2006JD008294.
ECOSYSTEM AND ATMOSPHERIC MEASUREMENTS IN ICOS-FINLAND Marjut Kaukolehto (1), Tuomas Laurila (2), Liisa Kulmala (1), Eija Juurola (1), Sanna Sorvari (2), Sami Haapanala (1), Petri Keronen (1), Pasi Kolari (1), Ivan Mammarella (1), M. Komppula (3), Kari Lehtinen (3), Soile Juuti (3), Tuula Aalto (2), Mika Aurela (2), Lauri Laakso (2), Yrjö Viisanen (2) and Timo Vesala (1) (1) University of Helsinki, Finland (2) Finnish Meteorological Institute, Finland. (3) University of Eastern Finland, Finland. marjut. [email protected] The global mean temperature has increased and will continue to increase in the 21st century due to the increased concentrations of greenhouse gases such as carbon dioxide (CO2), methane (CH4) and nitrous oxide (N2O) in the atmosphere [1]. Understanding about the driving forces of climate change requires full quantification of the greenhouse gas (GHG) emissions and sinks by long term and high precision observations in the atmosphere as well as on the land and ocean surfaces. Integrated Carbon Observation System (ICOS) has received funding by the EU to develop a strategic plan for constructing a European infrastructure to provide the long-term atmospheric and flux observations required to understand the present state and predict the future behaviour of the global carbon cycle and GHG emissions as well as to monitor and assess the effectiveness of carbon sequestration in GHG emission reduction activities. At the moment, Finland is aiming for ICOS headquarters and Atmospheric Thematic Centre in collaboration with France. The host of the headquarters is suggested to Finland whereas the host of the ATC would be France. The ICOS-Finland is established by three national partners: University of Helsinki (UH), Finnish Meteorological Institute (FMI), and University of Eastern Finland (UEF). ICOS-Finland will have readiness for four atmospheric stations as well as two full and seven associate ecosystem stations for ICOS. The Finnish sites represent the boreal and sub-arctic Eurasian environments with both east-west and south-north transitions in eco-climatic features. The SMEAR (station for measuring ecosystem-atmosphere relationships) stations, especially the SMEAR II in Hyytiälä is an intensively equipped world-class observatory operating since 1995. The station is a full ecosystem station and being upgraded to become also an ICOS atmospheric station. Atmosphere measurements include the precise determination of concentrations above the atmospheric surface layer. The spatial concentration variations measured the network of inter-calibrated towers together with the atmospheric transport models enables to estimate sinks and sources on the scale of 100–1000 km. The Pallas-Sodankylä is the most northern of the four Finnish Atmospheric stations. It has been operating since 1994. In the Sodankylä observatory, atmospheric concentration measurements will be upgraded and a calibration gas cylinder filling station is under construction. New atmospheric sites are under preparation in the northern Baltic proper area and in the eastern part of Finland. In order to interpret the atmospheric concentrations above continents in terms of GHG cycle processes, additional measurements are needed at the surface. Eddy covariance (EC) techniques allow continuous monitoring of CO2, H2O and heat fluxes over vegetation canopies. These fluxes, typically calculated on ½ h basis, form the core of ecosystem measurements. The source area (footprint) extends 0.1–1 km away from the measuring tower. The utilization and interpretation of flux measurements require the observations of tens of other variables related to meteorology, hydrology, ecophysiology of vegetation and soil

processes. CH4 and N2O can be also measured by EC although this is not yes as routine work as it is for CO2. Temporal resolution of a day for eddy flux towers is sufficient to capture the variability in terrestrial fluxes driven by changing weather patterns and transform them into operational systems. ICOS network aims at obtaining GHG balances in a high-resolution grid, ultimately in 10 km resolution. However, terrestrial ecosystem carbon fluxes are so heterogeneous and variable that it will be impossible to measure fluxes over all kinds of ecosystems continually over Europe and adjacent regions. The network of micrometeorological flux measurement sites should represent the most typical ecosystems. The GHG balance is achieved by combining atmospheric concentration and ecosystem flux observations in a modelling system. Observations of net ecosystem CO2 balances, using micrometeorological methods, will constrain simulations of CO2 uptake by photosynthesis and emission by respiration. In addition, we should have flux observations from ecosystems for which the simulations rely more on observations. Managed peatlands are such an extensive ecosystem type in Finland. Soil respiration measurements by chambers will help in segregating soil processes from net ecosystem balance observations. The full ecosystem stations, SMEARII in southern Finland and Sodankylä in northern Finland are ready and running. At some associate ecosystem sites, flux measurements still needs to be developed to reach ICOS standards. New sensors for ancillary measurements, such as radiation and soil temperature probes, are added to most sites. A new automated chamber measurement system has been developed for forest floor vegetation gas exchange [2]. At the Pallas node of the Global Atmosphere Watch site, a new flux site representing the arctic mountain vegetation started in autumn 2010. One key area for FMI flux studies is northern ecosystems with presently ongoing measurements in two forest ecosystems on mineral soils (Sodankylä Scots pine forest and Kenttärova spruce forest) and on two pristine wetlands (northern boreal fen Lompolojänkkä and subarctic fen Kaamanen). Another focus for FMI is the carbon balance of different ecosystems on organic soils. The northern wetlands and one southern boreal fen, Siikaneva, that is run in co-operation with the UH serve as a good reference for the measurements on managed peatlands. Measurements at a nutrient-rich forestry-drained peatland (Lettosuo) were started in 2009. Two sites of ICOS-Finland, Puijo atmospheric station and SMEARII ecosystem station, are currently participating in the ICOS demonstration experiment together with selected set of stations around Europe. The purpose is to evaluate the communications and interactions between the stations and the Thematic Centers, identify the critical aspect and problems in the data acquisition and data flow, evaluate if it is possible to acquire the 95% of the data as specified in the project, and to compare the data processed centrally with the site level version. ACKNOWLEDGEMENTS The financial support by EU projects ICOS and IMECC and the Academy of Finland Centre of Excellence program (project no 1118615) and the Academy project “Integrated Greenhouse Gas Monitoring System” (project no 17352) are gratefully acknowledged. References [1] Climate Change 2007: The Physical Science Basis. Contribution of Working Group I to the Fourth Assessment Report of the IPCC (eds Solomon, S. et al. Cambridge Univ. Press, 2007) [3] Lohila A. et al. Poster abstract in the First ICOS-Finland Science Workshop, Hyytiälä, November 16-17, 2010.
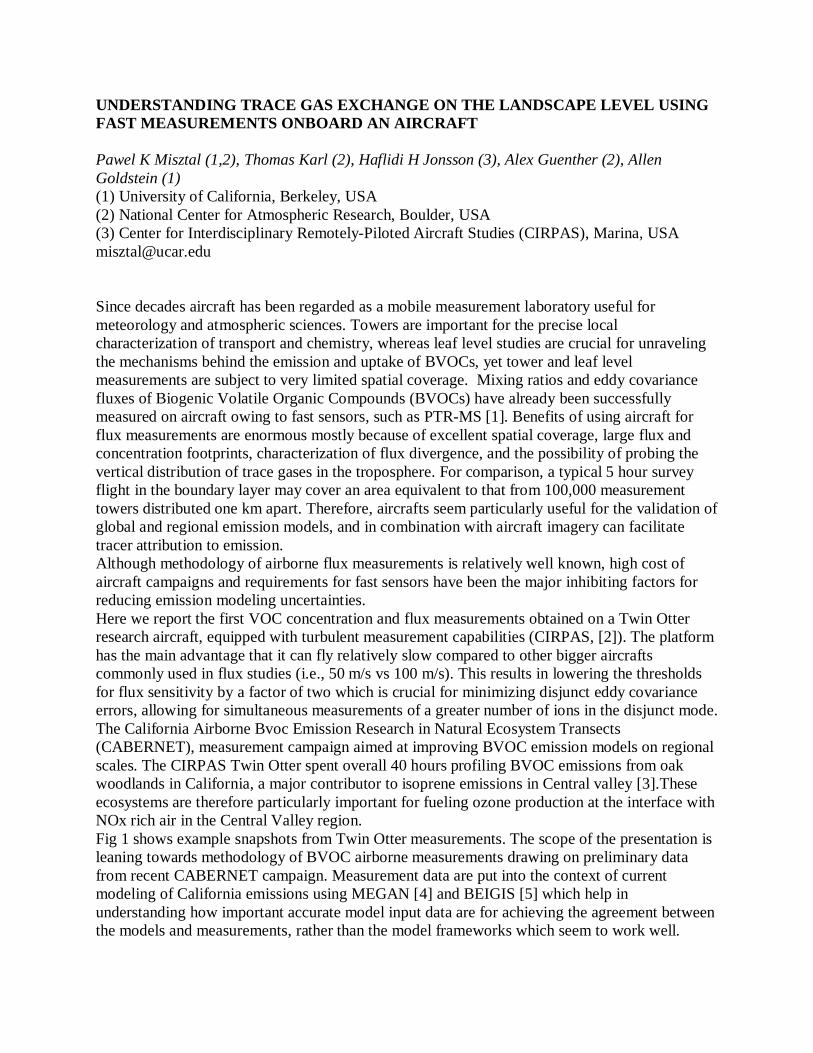
UNDERSTANDING TRACE GAS EXCHANGE ON THE LANDSCAPE LEVEL USING FAST MEASUREMENTS ONBOARD AN AIRCRAFT Pawel K Misztal (1,2), Thomas Karl (2), Haflidi H Jonsson (3), Alex Guenther (2), Allen Goldstein (1) (1) University of California, Berkeley, USA (2) National Center for Atmospheric Research, Boulder, USA (3) Center for Interdisciplinary Remotely-Piloted Aircraft Studies (CIRPAS), Marina, USA [email protected] Since decades aircraft has been regarded as a mobile measurement laboratory useful for meteorology and atmospheric sciences. Towers are important for the precise local characterization of transport and chemistry, whereas leaf level studies are crucial for unraveling the mechanisms behind the emission and uptake of BVOCs, yet tower and leaf level measurements are subject to very limited spatial coverage. Mixing ratios and eddy covariance fluxes of Biogenic Volatile Organic Compounds (BVOCs) have already been successfully measured on aircraft owing to fast sensors, such as PTR-MS [1]. Benefits of using aircraft for flux measurements are enormous mostly because of excellent spatial coverage, large flux and concentration footprints, characterization of flux divergence, and the possibility of probing the vertical distribution of trace gases in the troposphere. For comparison, a typical 5 hour survey flight in the boundary layer may cover an area equivalent to that from 100,000 measurement towers distributed one km apart. Therefore, aircrafts seem particularly useful for the validation of global and regional emission models, and in combination with aircraft imagery can facilitate tracer attribution to emission. Although methodology of airborne flux measurements is relatively well known, high cost of aircraft campaigns and requirements for fast sensors have been the major inhibiting factors for reducing emission modeling uncertainties. Here we report the first VOC concentration and flux measurements obtained on a Twin Otter research aircraft, equipped with turbulent measurement capabilities (CIRPAS, [2]). The platform has the main advantage that it can fly relatively slow compared to other bigger aircrafts commonly used in flux studies (i.e., 50 m/s vs 100 m/s). This results in lowering the thresholds for flux sensitivity by a factor of two which is crucial for minimizing disjunct eddy covariance errors, allowing for simultaneous measurements of a greater number of ions in the disjunct mode. The California Airborne Bvoc Emission Research in Natural Ecosystem Transects (CABERNET), measurement campaign aimed at improving BVOC emission models on regional scales. The CIRPAS Twin Otter spent overall 40 hours profiling BVOC emissions from oak woodlands in California, a major contributor to isoprene emissions in Central valley [3].These ecosystems are therefore particularly important for fueling ozone production at the interface with NOx rich air in the Central Valley region. Fig 1 shows example snapshots from Twin Otter measurements. The scope of the presentation is leaning towards methodology of BVOC airborne measurements drawing on preliminary data from recent CABERNET campaign. Measurement data are put into the context of current modeling of California emissions using MEGAN [4] and BEIGIS [5] which help in understanding how important accurate model input data are for achieving the agreement between the models and measurements, rather than the model frameworks which seem to work well.
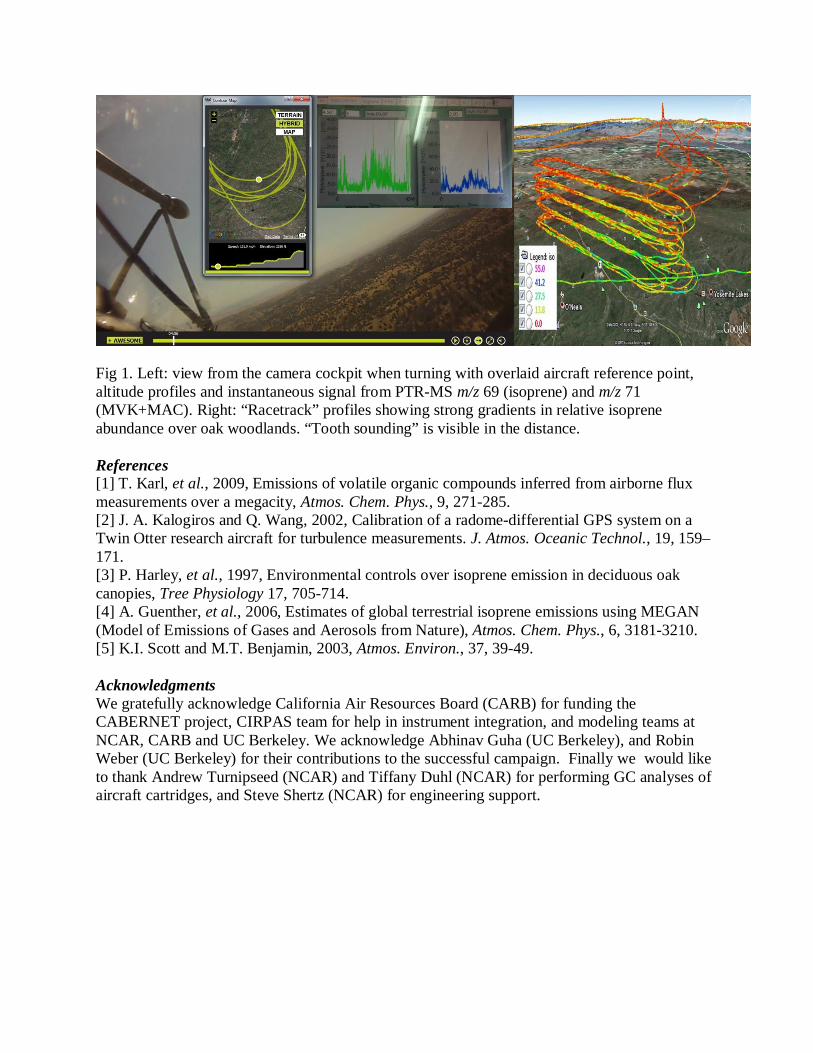
Fig 1. Left: view from the camera cockpit when turning with overlaid aircraft reference point, altitude profiles and instantaneous signal from PTR-MS m/z 69 (isoprene) and m/z 71 (MVK+MAC). Right: “Racetrack” profiles showing strong gradients in relative isoprene abundance over oak woodlands. “Tooth sounding” is visible in the distance. References [1] T. Karl, et al., 2009, Emissions of volatile organic compounds inferred from airborne flux measurements over a megacity, Atmos. Chem. Phys., 9, 271-285. [2] J. A. Kalogiros and Q. Wang, 2002, Calibration of a radome-differential GPS system on a Twin Otter research aircraft for turbulence measurements. J. Atmos. Oceanic Technol., 19, 159–171. [3] P. Harley, et al., 1997, Environmental controls over isoprene emission in deciduous oak canopies, Tree Physiology 17, 705-714. [4] A. Guenther, et al., 2006, Estimates of global terrestrial isoprene emissions using MEGAN (Model of Emissions of Gases and Aerosols from Nature), Atmos. Chem. Phys., 6, 3181-3210. [5] K.I. Scott and M.T. Benjamin, 2003, Atmos. Environ., 37, 39-49. Acknowledgments We gratefully acknowledge California Air Resources Board (CARB) for funding the CABERNET project, CIRPAS team for help in instrument integration, and modeling teams at NCAR, CARB and UC Berkeley. We acknowledge Abhinav Guha (UC Berkeley), and Robin Weber (UC Berkeley) for their contributions to the successful campaign. Finally we would like to thank Andrew Turnipseed (NCAR) and Tiffany Duhl (NCAR) for performing GC analyses of aircraft cartridges, and Steve Shertz (NCAR) for engineering support.
Related Documents