Writer: Surbhi Bansal Faculty of Science and Technology MASTER THESIS Study Program/ Specialisation: Masters in Offshore Technology/ Risk Management Spring Semester, ʹͲͳ …………………………………………………. Faculty supervisor: Andreas Falck Thesis title: Improving Human Reliability Assessment with the help of Digital Solutions Credits (ECTS): ͵Ͳ Keywords: Human Reliability Assessment, Petro-HRA, digital solutions, new risk concept Pages: 105 Stavanger, ͳͷ June ʹͲͳ

Welcome message from author
This document is posted to help you gain knowledge. Please leave a comment to let me know what you think about it! Share it to your friends and learn new things together.
Transcript
Writer:
Surbhi Bansal
Faculty of Science and Technology
MASTER THESIS
Study Program/ Specialisation:
Masters in Offshore Technology/ Risk Management
Spring Semester,
………………………………………………….
Faculty supervisor:
Andreas Falck
Thesis title:
Improving Human Reliability Assessment with the help of Digital Solutions
Credits (ECTS):
Keywords: Human Reliability Assessment, Petro-HRA, digital solutions, new risk concept
Pages: 105
Stavanger, June

This page left blank intentionally

i
ACKNOWLEDGEMENT
I would like to reflect on all the people who contributed towards the successful completion of this master thesis. First and foremost, I would like to thank my academic advisor, Associate Professor Andreas Falck for accepting to guide me on my chosen topic of interest. During the six months of intensive research tenure under his guidance, has been a learning experience for me not only on a technical front but also on a personal level. Throughout my study process, he provided me with numerous resources, personal contacts and documents which have been monumental in helping this thesis to shape up. I am also very grateful to him for pushing me towards delivering high quality work while at the same time showing me the correct path whenever I encountered any roadblock.
The results presented in this thesis have also been accomplished with the help and support of experts like Sondre Øie (DNV-GL), Kristian Gould (Statoil AS), Arne Johan Thorsen (PSA) and Koen van De Merwe (DNV-GL) who were kind enough to provide valuable insights from their vast experience in the oil and gas industry.
I express my gratitude towards my friends and peers for their consistent support and showing confidence in me when I needed it the most.
I would like to thank my parents without whose kind words it would not have been possible to achieve any milestone in my thesis or in my life.
Finally, I would like to thank my strongest pillar of support, my husband Abhishek Garg, for his wise and patient counsel, encouraging ideas and unwavering confidence which helped me in making it till the very end.
Surbhi Bansal
Stavanger, Norway
June, 2017

ii
ABSTRACT It has been observed that humans have played a big role in many past major accidents in escalating a chain of events into a full-fledged disaster. However, it needs to be recognised that the human operational barrier element can affect the risk level both positively and negatively. Understanding the human performance in a post- initiating event scenario and how this can be included in risk assessment is therefore important. In this thesis, we are attempting to understand the role of human reliability assessment (HRA) in reducing the uncertainties introduced due to human operational element and the effectiveness of current risk assessment tools in capturing human performance within the scope of the new risk concept. This thesis also tries to discuss and present a way in which digitization can help to improve the current risk analysis method incorporating HRA.
Study of investigation reports, literature review, interviews and discussion with industrial experts and reviewing the case study in the Petro-HRA guidelines are used throughout the research process of this report to reach logical conclusions.
The first chapter defines the objective, motivation and scope of the thesis. In the second chapter, we conduct a literature review of the current and the new risk concept, human reliability assessment techniques used across the industries and conduct interviews of industrial specialists from the oil and gas sector. These insights help us to understand the current HRA’s developmental stage in Norway, its perceived limitations and background. In the third chapter, various investigation reports have been reviewed to understand the role and cause of human performance in the past accidents. Also, various risk indicators have been discussed for their ability to capture human performance. The fourth chapter reviews current risk assessment practices for their applicability, methodology and weaknesses with respect to HRA requirements. The fifth chapter proceeds towards understanding the HRA integration with quantitative risk assessment (QRA), practical limitations, data requirements, modelling Human Failure Events (HFEs) and uncertainties in HRA guidelines. These have helped us to find out gaps and areas in the Petro-HRA guidelines, which require improvement or further research. The sixth chapter introduces the digitisation in oil and gas sector. Here, we present a digital solution encompassing a Multiplier Model as a solution to the highlighted gaps along with its associated assumptions, simplifications and challenges. Finally, the thesis ends on chapter seven by suggesting a few other alternate directions of research which were identified during the study as holding some potential for improving the HRA framework further.

iii
TABLE OF CONTENTS Acknowledgement ................................................................................................................................. i
Abstract .................................................................................................................................................. ii
A. List of Figures ................................................................................................................................... v
B. List of Tables ................................................................................................................................... vii
C. List of Abbreviations ..................................................................................................................... viii
Chapter Introduction ........................................................................................................................ 1
1.1 Objective ....................................................................................................................................... 1
1.2 Motivation .................................................................................................................................... 1
1.3 Background................................................................................................................................... 1
1.4 Limitations of Scope .................................................................................................................... 2
Chapter Literature Review ................................................................................................................ 3
2.1 Risk concepts................................................................................................................................ 5
2.1.1 Existing historical risk concepts .......................................................................................... 5
2.1.2 New Hierarchical Risk concept ........................................................................................... 6
2.2 Human Reliability Assessment .................................................................................................. 8
2.2.1 Insights from Interviews of industrial experts ................................................................. 12
2.3 Discussion .................................................................................................................................. 14
Chapter Major accident Events ...................................................................................................... 16
3.1 Review of investigation reports of accidental events ............................................................. 17
3.2 Role of Current Activity indicators in capturing human element ....................................... 27
3.3 Discussion on ability of indicators in capturing human behavioural elements ................. 29
3.4 Conclusion ................................................................................................................................. 30
Chapter Current risk assessment practices .................................................................................. 32
4.1 Current Industrial practices ..................................................................................................... 32
4.1.1 BORA-Release ...................................................................................................................... 32
4.1.2 LOPA and SIL ...................................................................................................................... 35
4.1.3 Event Trees and Fault Tree Analysis................................................................................. 37
4.1.4 Bayesian Network Model ................................................................................................... 39
4.2 Assumptions and uncertainty ................................................................................................. 40
4.3 Discussion on the ability to analyse human performance ................................................... 43
Chapter QRA, HRA and The New Risk Concept .......................................................................... 45
5.1 Relationship between HRA and QRA ...................................................................................... 46
5.1.1 QRA ....................................................................................................................................... 46
5.1.2 Significance of HRA ............................................................................................................ 48
iv
5.2 Integration of HRA with QRA ................................................................................................. 49
5.2.1 Establishing context ........................................................................................................... 51
5.2.1 Establishing the context ..................................................................................................... 51
5.2.2 HEP as Input to QRA ......................................................................................................... 51
5.2.3 Suggesting recommendations ........................................................................................... 51
5.3 HRA within the new risk concept perspective ....................................................................... 52
5.3.1 Need for the new risk perspective ..................................................................................... 52
5.3.2 Conformance of HRA with the new risk perspective ..................................................... 53
5.3.3 Conclusion .......................................................................................................................... 58
5.4 Modelling HFE .......................................................................................................................... 59
5.4.1 Modelling HFE with QRA .................................................................................................. 59
5.4.2 Modelling HFE as per Petro-HRA guidelines ................................................................. 60
5.4 Data requirements .................................................................................................................... 61
5.5 Discussion on HRA guidelines ................................................................................................ 62
5.5.1 Practical Limitations........................................................................................................... 62
5.5.2 Uncertainties in modelling HFEs ..................................................................................... 63
Chapter Improving HRA with Digital Solutions .......................................................................... 65
6.1 Introduction to Digital solutions ............................................................................................. 65
6.1.1 Digitization in oil and gas sector ....................................................................................... 66
6.2 Development of an improved solution ................................................................................... 67
6.2.1 Problems being addressed ................................................................................................. 67
6.2.2 Important assumptions and simplifications ................................................................... 72
6.2.3 Data Simulation Method ................................................................................................... 74
6.3 The Multiplier Model ............................................................................................................... 78
6.3.1 Comparison of Multiplier Model with the old methodology ........................................ 83
6.4 Improved HRA within the new risk concept ......................................................................... 84
6.5 Limitations and challenges of digital solutions ..................................................................... 85
Chapter Conclusions ....................................................................................................................... 87
7.1 Inferences ................................................................................................................................... 87
7.2 Recommendations for further research .................................................................................. 89
References ............................................................................................................................................ 91
Appendix A .......................................................................................................................................... 96
Appendix B ........................................................................................................................................ 101
v
A. LIST OF FIGURES Figure 1: Building blocks of risk assessment ......................................................................... 3 Figure 2: A hierarchical breakdown of risk (Source: (Flage et al., 2015) ............................ 6 Figure 3: Accident development stages (Source: Reason (1995)) ....................................... 9 Figure 4: HRA Process (Source: Kirwan (1994)) ................................................................. 10 Figure 5 1st and 2nd generation tools for HRA (Bell & Holroyd, 2009) ........................... 11 Figure 6: HRA as per Petro-HRA guidelines ....................................................................... 12 Figure 7 Barrier management in the bigger picture ........................................................... 16 Figure 8 DNV- GL Loss Causation Model ........................................................................... 23 Figure 9 Hydrocarbon leaks over 0.1 kg/s in the Norwegian Shelf in 2008-2015 period. (Norkolje&gass, 2016) ............................................................................................................ 32 Figure 10 Risk Influence Diagram example ......................................................................... 34 Figure 11 Safety Integrity Level (Iii & M., 1998) ................................................................... 36 Figure 12 Example of Operator action Event Tree ............................................................. 37 Figure 13 Fault tree for human failure event. (Van De Merwe et al., 2014) ..................... 38 Figure 14 Fault tree of operator barrier element failure (Sklet et al., 2005) .................... 38 Figure 15: Scope of HRA within QRA (Van de Merwe, Øie, Hogenboom, & Falck, 2015).................................................................................................................................................. 45 Figure 16 Bow-Tie diagram representation of risk assessment (Vinnem, 2007) ............ 46 Figure 17 Petro-HRA method steps and integration with QRA (PSA, 2016) ................... 50 Figure 18 QRA methodology for offshore industry (Vinnem, 2007) ................................ 50 Figure 19: HRA within the new risk concept perspective .................................................. 53 Figure 20 Dynamic positioning drilling operation (Bye et al., 2017) ................................ 54 Figure 21 HTA analysis for drive off case study(Bye et al., 2017) ...................................... 56 Figure 22 Time line analysis of drive-off scenario (PSA, 2016) ......................................... 56 Figure 23 Event Tree for drive off scenario (Bye et al., 2017) ............................................ 57 Figure 24 HEP calculation step for each HFE. (Bye et al., 2017) ....................................... 58 Figure 25 Upstream oil and gas Digital Trends survey done by Accenture and Microsoft(Accenture, 2016)................................................................................................... 66 Figure 26 HEP as a function of PSF influence. (Gertman, Blackman, Marble, Byers, & Smith, 2005)............................................................................................................................ 70 Figure 27 Levels and multipliers for available time PSF (Bye et al., 2017) ....................... 71 Figure 28 Outline of the proposed digital solution............................................................ 75 Figure 29 Users and providers of cloud computing. (Armbrust et al., 2010) .................. 77 Figure 30 Multiplier with respect time available time plot where X-axis = available time and Y-axis (seconds) = multiplier. .............................................................................. 80 Figure 31 Plot of Training multiplier vs. rating. X-axis: rating and Y-axis: training multiplier ................................................................................................................................ 80 Figure 32 Plot of HEP with respect to tsam= Available time sample (seconds) ............. 81 Figure 33 Standard deviation of HEP from the output console of the software. ............ 82 Figure 34 Plot of HEP with respect to tsam= Available time sample (40-70 seconds) .. 82 Figure 35 Standard deviation of HEP within the increased range of observations. ....... 83 Figure 36 Casual and evidential query from the Bayesian Network Model. ................. 102

vi
Figure 37 Structure of relationships between PSFs and failure event in the Bayesian Network Model. ................................................................................................................... 103 Figure 38 Bars showing estimates of conditional failure probability based on different combinations of Stress and operating environment PSF level observations. ............... 104 Figure 39 Depiction of how the Bayesian updating takes place in the model as new data becomes available. ....................................................................................................... 105

vii
B. LIST OF TABLES Table 1 Investigation report review study ........................................................................... 18 Table 2 Causation classification summary from accident report study........................... 24 Table 3 Summary of BORA steps ......................................................................................... 35 Table 4 Assumptions and uncertainties related to each risk analysis method ............... 40 Table 5 Available time and multiplier data points ............................................................. 79 Table 6 Interview Response Summary table ....................................................................... 96 Table 7 PSFs and their categories of level ......................................................................... 104

viii
C. LIST OF ABBREVIATIONS BN Bayesian Network
BOP Blowout Preventer
BORA Barrier Operational and Risk Analysis
CFD Computational Fluid Dynamics
DP Dynamic Positioning
EDS Emergency Disconnect Sequence
ETA Event Tree Analysis
FAR Fatal Accidental Rate
FMEA Failure Mode and Effect Analysis
FTA Fault Tree Analysis
HAZID Hazard Identification
HAZOP Hazard and Operability Study
HEP Human Error Probability
HFE Human Failure Event
HMI Human Machine Interface
HOF Human and Organisational Factors
HRA Human Reliability Assessment
HSE Health, Safety and Environment
HTA Hierarchical Task Analysis
IoE Internet of Everything
IPL Independent Protection Layer
IR Individual Risk
LOPA Layers of Protection Analysis
MTO Man, Technology and Organisation
NCS Norwegian Continental Shelf
NORSOK Norsk Sokkels Konkuranseposisjon
PFD Probability of Failure on Demand

ix
PHA Preliminary Hazard Analysis
PLL Potential Loss of Life
PPE Personnel Protective Equipment
PSA Petroleum Safety Authority, Norway
PSF Performance Shaping Factors
QRA Quantitative Risk Assessment
RIF Risk Influencing Factor
RNNP Risiko Nivå Norsk Petroleumsvirksomhet
SHERPA Systematic Human Error Reduction and Prediction Approach
SIF Safety Instrumentation Function
SIL Safety Integrity Level
SoK Strength of Knowledge
SPAR-H Standardized Plant Analysis Risk
THERP Technique for Human Error Rate Prediction
tsam time sample
1
CHAPTER INTRODUCTION
1.1 OBJECTIVE The main objective of this thesis is:
Improvement of risk analysis with focus on the human reliability aspects in the operational phase. Comparing current industrial practices involved in HRA and the need for improvements offered by digitalization.
The general intention behind this thesis is to study how the digital solutions can help us to better assess the Human Reliability factors in the post initiating event scenarios within the new risk concept. It also attempts to review the suitability of current risk assessment practices in the light of new risk concepts.
1.2 MOTIVATION Accident investigations show that humans have often played a very important role in the prevention and mitigation of major accidents. It is therefore important that the technical design of a system reflects humans’ strengths and weaknesses in response to a critical situation while operating in a complex system. A good design system is equally complemented by necessary work procedures, operator’s competence and safe work practices. However, traditionally these aspects of a design are not emphasized enough. Understanding the human behaviour and how this can be included in risk assessments is therefore important. To better assist the companies in assessing risk, we therefore need to understand the ways in which human actions contribute to major accidents. One important point remains dominant throughout the research i.e. human behaviour is complicated and difficult to predict due to large complexities and uncertainties involved. This calls for an improved HRA approach which deals with these uncertainties in a much thorough manner.
Hence, in this thesis we are attempting to understand the role of Human Reliability Assessment in capturing the uncertainties introduced due to human behaviour in post-initiating event scenarios. We will also be assessing the effectiveness of current risk assessment tools in capturing human behavioural elements. Finally, this thesis discusses the ways in which digitization can help to bridge the gaps and improve the current HRA guidelines. Study of reports and literature review will help us to find out gaps and areas which require improvement or further research.
1.3 BACKGROUND Humans are a form of barrier which is often the last line of defence when all the other barriers have failed. While human performance can generate errors on one hand, it can
2
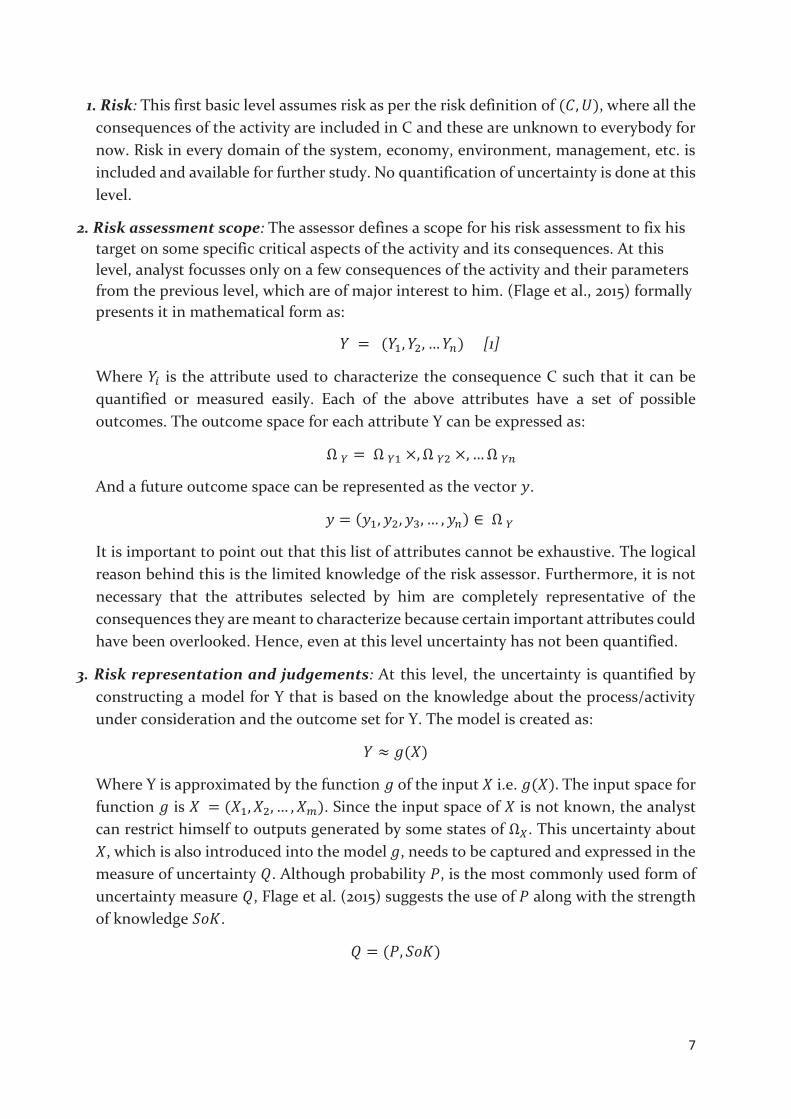
also prevent accidents on the other hand. Humans can generate direct or latent errors that might cause failures. Further, in a post-initiating event scenario, i.e. when an initiating event has already taken place, they can make errors while performing controlling actions. We will be focussing our study to the post-initiating event scenario assessment only.
While a lot of research is available on the technical factors’ role in a major accident development, it is equally important to assess the human performance. This can be done by Human Reliability Assessment which focusses on identifying, quantifying, evaluating human error factors. The results of this assessment provide input to QRA in the form of Human Error Probability (HEP) which is then used to model events and scenarios. The result from QRA is then used to provide recommendations to the management during decision making, for e.g., to implement risk reducing measures.
The result from the assessment need to be reported along with the uncertainties, assumptions, strength of knowledge and limitations to maintain transparency of the process. This thesis studies the HRA in the light of new risk concept by reviewing the current techniques used in the industry. The study also helps us to identify gaps that can be covered with the help of digital solutions, thus improving the risk analysis in the operational phase.
1.4 LIMITATIONS OF SCOPE The study is limited to the operational phase of the projects in offshore oil and
gas industry. The guideline being referred is called Petro-HRA which has been developed as a
research project sponsored by Research Council of Norway, Statoil Petroleum AS and DNV-GL as the industrial partner (Bye et al., 2017).
The QRA scope includes both post and pre- initiating event scenario analysis, however, for the sake of simplicity we will keep a post-initial event focus which refers to the consequence side of the risk picture.
The study is focussed on the human barrier and human performance shaping factors (PSFs) in a post-initiating event scenario.
The data availability is a major issue in implementing HRA, however addressing it is beyond the scope of this thesis.
Since human errors are prevalent in many other high risk industries like process, nuclear, aviation, manufacturing, etc., learnings from these industries’ HRA methods can be useful to offshore oil and gas industry as well.
3
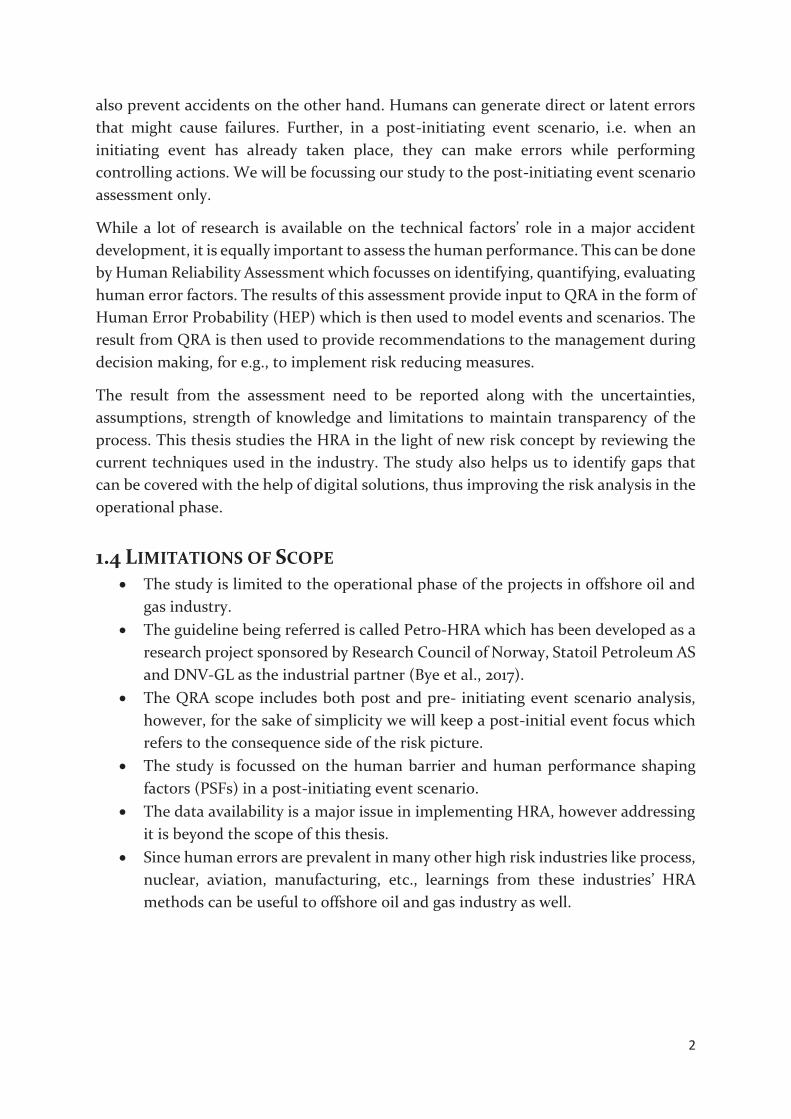
CHAPTER LITERATURE REVIEW The offshore oil and gas industry is exposed to numerous risks because of which it is important to be prepared ahead of time. Such a preparation and planning requires a thorough and strong risk management framework. The risk assessment falls under the umbrella of risk management. But before diving straight into the risk assessment philosophy it is important to obtain an insight into the meaning of risk and the underlying risk concept used to bolster it.
Figure 1: Building blocks of risk assessment
The above figure 1 is a depiction of the founding blocks of risk assessment. Risk definition forms the foundation, on which our risk concept rests followed by the roof of risk assessment. The risk concept is our way of formalizing risk and its related elements which may differ by the domain we consider it in. Terje Aven & Renn (2010) mention that risk perspective is the person’s judgement about risk and could be influenced by facts, scientific risk assessments, perception factors (like preference for risk averse behaviour etc.), etc. Needless to say our risk perception influences our risk concept in an implicit way and needs to be accounted. Finally, risk assessment based on the foundational risk definition and risk concept adopted, helps us to evaluate the potential risks related of an activity under consideration. These 3 elements have been explained below.
Risk
Aven (2014) has complied the various risk definitions that have developed across various times, places, industries, etc. For example,
The French (15th century) defined it as danger of inconvenience, predictable or otherwise
The Spanish (16th century) perceived it as possibility of harm or unpleasant consequences
The Dutch (15th century) defined it as the possibility of damage to merchandise

4
The financial industry defines risk as any of the various types of risk associated with financing, including financial transactions that include company loans in risk of default (Scott, 2003).
OHSAS (Occupational Health & Safety Advisory Services) defines risk as the combination of the probability of a hazard resulting in an adverse event, and the severity of the event (Labodová, 2004)
Information security risk is the potential that a given threat can exploit vulnerabilities of an asset or group of assets and thereby cause harm to the organization.
Similarly there are many more definitions. It is evident after studying all these definitions that no one risk definition is globally accepted. This is also implied because of the vast spectrum of contexts in which we try to perceive it. While the health industry views it in a negative connotation, the financial industry perceives it as an opportunity to gain higher returns.
Throughout our study we will be referring to the risk definition proposed by ISO which is ‘the effect of uncertainty on objectives and an effect is a positive
or negative deviation from what is expected.’ This ISO specified risk definition is in line with the PSA’s definition of risk which defines risk as the consequences of the activities, with associated uncertainty. In other words, this reinstatement of risk definition by PSA does not impose any new requirements. Risk Concept
The risk concept is a way of describing risk which stands in alignment with our risk perception. Jasanoff (1999) and many other experts believe that risk is same as the risk perception. It is important to highlight that Aven & Renn (2010) disagree with this belief because risk perception is dependent on assessor’s personal belief, experiences etc. and risk exists despite the risk perception and acceptability (whether the risk level is tolerable or intolerable). Since the risk concept is in close alignment with risk perception, it is important to emphasize on evaluating the beliefs, knowledge, expertise etc. of the assessor who is vulnerable towards introducing personal bias in his assessments. This difference of ‘risk not being same as the risk perception’ has been highlighted in order to remove any fundamental inconsistencies which can arise in believing otherwise. For example, a car driver may believe that the risk of driving fast on a winding mountain road that may lead to an accident to be negligible, while the transportation department expert may assess the same risk to be high. The difference in the risk perception does not change the inherent risk in this situation which remains present at all times.

5
Risk Assessment
Risk assessment is a structural approach to identify, measure and evaluate the risks in conducting an activity in a holistic way. It can be done quantitatively, qualitatively or an integration of both ways. Since the aim of risk assessment is to help the management in decision making, crucial aspects such as the scope, limitations, uncertainty, assumptions, strength of knowledge, data quality etc. should be reported in a transparent manner. In our study we will be focussing on the role of Human Reliability Assessment in the domain of Quantitative Risk Assessment of the offshore oil and gas industry in helping to make better decisions.
2.1 RISK CONCEPTS
2.1.1 Existing historical risk concepts The historical risk concepts have been discussed below highlighting their features.
2.1.1.1 Risk as a two dimensional combination of consequences and uncertainty (C, U)
As per Aven (2014), risk is the two dimensional combination of consequences of an activity C and the associated uncertainties U. In this concept the emphasis is on the negative outcomes of C which is related to anything of value to humans.
The risk description is where is one of the consequences under investigation,
is the measure of uncertainty and is the background knowledge on which and are based. Probability is one of the most widely used measure of uncertainty. Risk assessors identify the consequences of interest and try to measure/estimate the uncertainty of occurrence related to these. This risk concept restates the fact that the future consequences of any activity cannot be predicted with accuracy and that the risk exists objectively independent of the assessor. However, risk assessment is subjective as it depends on the expert’s judgement. One expert might choose to ignore a particular risk and the other may hold it to be of utmost importance. Independent of their assessment, the risk exists in that activities’ consequences.
2.1.1.2 Risk as pair of consequences and probabilities (C, P) This risk concept describes risk as a pair of consequences of an activity (Example: the pedestrian being hit by a car) and the probability associated with that loss/damage (Example: the probability of the person losing his life) ( Aven, 2014).
The concept allows the use of both frequentist and knowledge based probabilities. The major shortcoming of this concept is that while the probability of the loss (pedestrian
6
losing his life) may be assessed/estimated to be small, the risk might be quite substantial in reality. Aven (2014) mentions the use of risk matrix as one of the applications of this risk concept in the nuclear industry. A risk matrix is a two-dimensional combination of probability and consequences.
While probability is used to measure and quantify risk in this concept, it is far from being a perfect tool. It has certain shortcomings such as not being able to reflect the strength of knowledge dimension in the estimation of probability, quality and relevance of data, might make very simplistic assumptions which are different from the real scenario. Therefore, over reliance and unjustified confidence on this measure of uncertainty can produce misleading results.
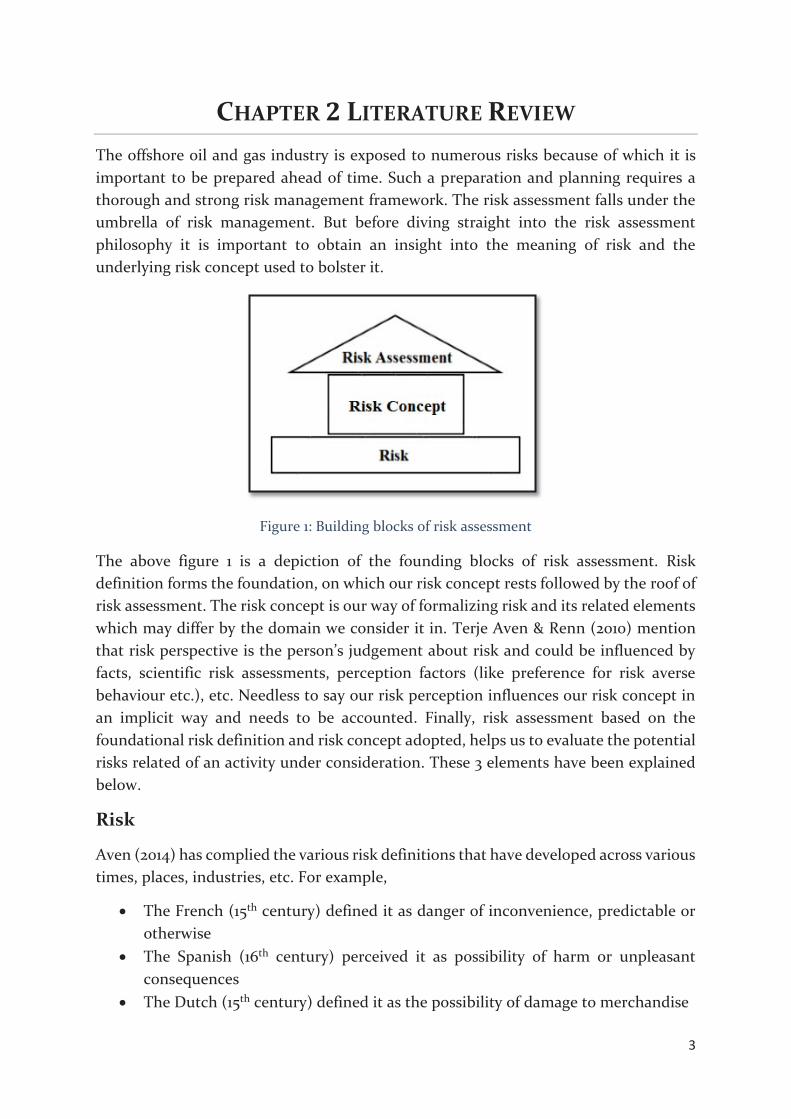
2.1.2 New Hierarchical Risk concept This new concept of hierarchical risk concept has been proposed by Flage et al. (2015). It has a hierarchy to inculcate the risk definition of combination of uncertainty and consequences. It is a systematic order of 4 levels such that each proceeding level is a subset of the previous level and demands careful registration of the unrecalled pieces of information. This risk concept puts weight on the fact that risk exists objectively and its assessment is subjective to the assessor. Hence, the risk assessor’s knowledge, judgement, assumptions and simplifications need to be evaluated and justified frequently. This can result in a transparent and logical decision making process for the management. Further, it also presents a clear transition between risk and risk description which is not very evident in the probability based risk definition.
The 4 risk levels in the hierarchical framework shown in figure 2 and have been described below as per Flage et al. (2015).
Figure 2: A hierarchical breakdown of risk (Source: (Flage et al., 2015)
7
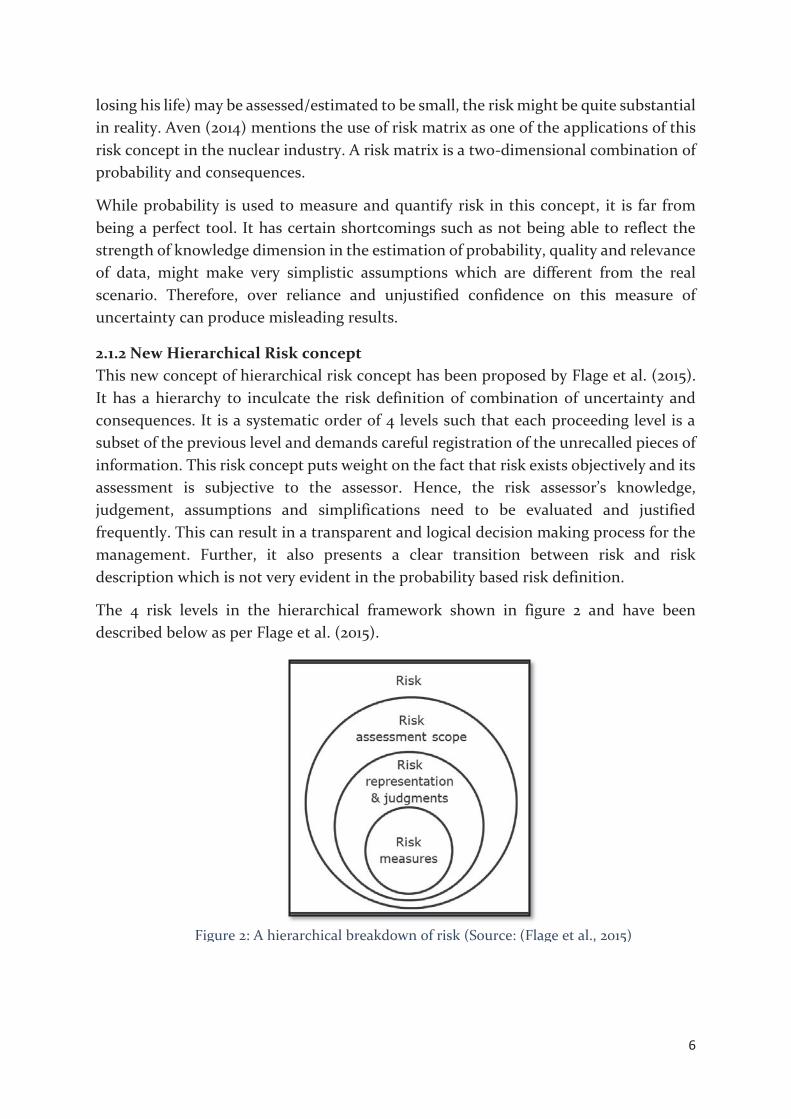
1. Risk: This first basic level assumes risk as per the risk definition of , where all the consequences of the activity are included in C and these are unknown to everybody for now. Risk in every domain of the system, economy, environment, management, etc. is included and available for further study. No quantification of uncertainty is done at this level.
2. Risk assessment scope: The assessor defines a scope for his risk assessment to fix his target on some specific critical aspects of the activity and its consequences. At this level, analyst focusses only on a few consequences of the activity and their parameters from the previous level, which are of major interest to him. (Flage et al., 2015) formally presents it in mathematical form as:
[1]
Where is the attribute used to characterize the consequence C such that it can be quantified or measured easily. Each of the above attributes have a set of possible outcomes. The outcome space for each attribute Y can be expressed as:
And a future outcome space can be represented as the vector .
It is important to point out that this list of attributes cannot be exhaustive. The logical reason behind this is the limited knowledge of the risk assessor. Furthermore, it is not necessary that the attributes selected by him are completely representative of the consequences they are meant to characterize because certain important attributes could have been overlooked. Hence, even at this level uncertainty has not been quantified.
3. Risk representation and judgements: At this level, the uncertainty is quantified by constructing a model for Y that is based on the knowledge about the process/activity under consideration and the outcome set for Y. The model is created as:
Where Y is approximated by the function of the input i.e. The input space for function is . Since the input space of is not known, the analyst can restrict himself to outputs generated by some states of . This uncertainty about
, which is also introduced into the model , needs to be captured and expressed in the measure of uncertainty . Although probability , is the most commonly used form of uncertainty measure , Flage et al. (2015) suggests the use of along with the strength of knowledge .
8
As can be seen from expression [1], model will predict the outcome approximately. The difference between the observed value of and the model prediction can be expressed by model error (Flage et al., 2015).
It is interesting to note that the following types of uncertainties have been identified and quantified:
Input quantity uncertainty: The uncertainty associated with the future input values to be entered in the model.
Model output uncertainty: The uncertainty associated with the value of model error.
Structural model uncertainty: Since the model is only a simplified approximation of the real world situation, some residual uncertainty will be present in the estimate.
4. Risk measures: This risk level facilitates the communication of results of the risk analysis to the decision makers with the help of suitable risk measures. The risk measure , chosen for this task should express the results along with the associated uncertainty (Flage et al., 2015).
The most commonly used risk measures in the Norwegian offshore oil and gas industry is Fatal Accident Rate (FAR) and Potential Loss of Life (PLL) while Individual Risk (IR) is used in other parts of the world, as mentioned by Vinnem (2013). In addition, FN-curves are also frequently used. However, these risk measures fall short of conveying the strength of knowledge dimension to the decision makers. This can hide certain aspects which maybe important from decision making perspective. An effective risk measure should be able to convey the aspects clearly for which it has been designed. Also it should be reflective of the model and sensitive to the data being entered. The use of expected values has been criticised by many authors due to its inability to reflect the spread of the result. On the other hand a distribution function may express the spread vividly, but it may not be easily interpreted by the decision makers. The choice of risk measures depends on their application.
2.2 HUMAN RELIABILITY ASSESSMENT Before we address the HRA, it is important to understand human errors in a complex system. Human errors have been defined by Swain (1989) as ‘any member of a set of human activities or actions that exceed some limit of acceptability i.e. out of tolerance action (or failure to act), where the limits of performance are defined by the system.’
Human errors have been discussed in detail by Reason (1995) in his paper, where he has presented the information in medical context, however, it applies well to any non-

9
medical high risk field as well. He stresses on the contribution of human errors to the increased number of accidents occurring in recent times. Reason (1995) asserts that the human-machine environment is dynamic, uncertain, has many concurrent sources of information, long routine activities interspersed with high stress moments and consists of complex technologies. Also at the organisational level, the activities have to be carried out as per a fixed set of protocol with interactions among various groups. Reason (1995) classifies that the human errors occur due to the following causes:
Consequences: Due to failed execution leading to slips and lapses Presumed causes: Due to inadequate planning at higher level causing mistakes Violations: Deviations from operating procedure
Figure 3: Accident development stages (Source: Reason (1995))
The above figure 3 highlights the 3 main factors i.e. the management and organisational factors (e.g. safety culture), error inducing factors/environment and barriers to be responsible for humans in making errors which can lead to development of an accident. The human errors can lead to failures, whose negative consequences are either immediately identifiable (active) or latent (making identification of failures difficult). HRA serves this purpose of identifying, quantifying and evaluating the human errors in a systematic way. Human Reliability Assessment as per Kirwan (1994) is achieving the three primary goals of identifying what errors can occur (Human Error Identification), deciding how likely the errors are to occur (Human Error Quantification) and if appropriate, enhancing human reliability by reducing this error likelihood (Human Error Reduction).
For example, on a drilling rig, the failure of operator in activating the safe stop function in a drilling blowout situation is the ‘human error’, where the drilling blowout poses the opportunity of error and failure of Blowout Preventer (BOP) system can be the compounding event along with other factors. The human error is influenced by numerous factors which are often difficult to identify or quantify, consequently making
10
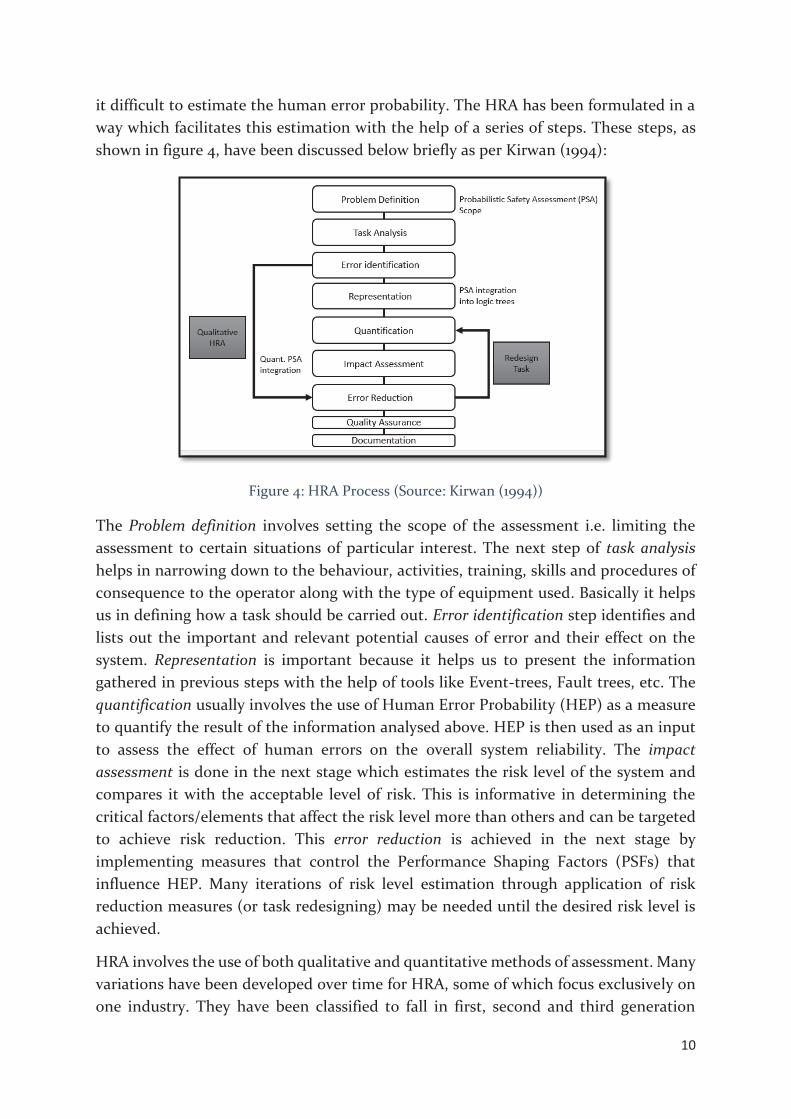
it difficult to estimate the human error probability. The HRA has been formulated in a way which facilitates this estimation with the help of a series of steps. These steps, as shown in figure 4, have been discussed below briefly as per Kirwan (1994):
Figure 4: HRA Process (Source: Kirwan (1994))
The Problem definition involves setting the scope of the assessment i.e. limiting the assessment to certain situations of particular interest. The next step of task analysis helps in narrowing down to the behaviour, activities, training, skills and procedures of consequence to the operator along with the type of equipment used. Basically it helps us in defining how a task should be carried out. Error identification step identifies and lists out the important and relevant potential causes of error and their effect on the system. Representation is important because it helps us to present the information gathered in previous steps with the help of tools like Event-trees, Fault trees, etc. The quantification usually involves the use of Human Error Probability (HEP) as a measure to quantify the result of the information analysed above. HEP is then used as an input to assess the effect of human errors on the overall system reliability. The impact assessment is done in the next stage which estimates the risk level of the system and compares it with the acceptable level of risk. This is informative in determining the critical factors/elements that affect the risk level more than others and can be targeted to achieve risk reduction. This error reduction is achieved in the next stage by implementing measures that control the Performance Shaping Factors (PSFs) that influence HEP. Many iterations of risk level estimation through application of risk reduction measures (or task redesigning) may be needed until the desired risk level is achieved.
HRA involves the use of both qualitative and quantitative methods of assessment. Many variations have been developed over time for HRA, some of which focus exclusively on one industry. They have been classified to fall in first, second and third generation

11
methods. Bell & Holroyd (2009) presented a summarised literature review for HSE, UK. The report identified 17 HRA methods, from which we have captured only the publicly available first and second generation HRA methods in figure 5 to limit our scope.
Figure 5 1st and 2nd generation methods for HRA (Bell & Holroyd, 2009)
Figure 5 points that most of the methods, that are publicly available, have been developed to serve the nuclear industry domain. Among these methods, THERP, ATHEANA and ASEP are resource intensive and comprehensive HRA methods. The HEART and SPAR-H are easy to apply, understand and useful in situations requiring only a workably detailed analysis. The HEART is the only generic HRA tool and SPAR-H has been developed from it to suit the needs of nuclear industry. The CREAM method requires further development and research.
The report by Bell & Holroyd (2009), concluded that most of the methods assessed were generic and could be used for any sector. This imposes no such requirement for applying different methods for different sectors. However, it does point out that the first generation methods are more suitable for projects in the beginning phase as they do not give enough insight on the dependencies or errors. The second generation methods are more appropriate for projects that have been using the first generation tools for some time now and require more detailed assessment of risks. And finally, the third generation methods have been developed from the first generation methods to suit the industry specific data.
Now, we look at the Norwegian oil and gas industry to identify its current level of development in the HRA methodology. For this Van De Merwe, Hogenboom,

12
Rasmussen, Laumann, & Gould (2014) present an interesting and insightful introduction to the development of HRA guidelines for the NCS in their report. It has been identified by them, that although the nuclear and petroleum industry have fundamentally different probabilities and consequences, similarities in task and accident characteristics are present.
Therefore, the latest development of the joint project between the nuclear and oil and gas industry, called the Petro-HRA, has been a significant development because of the similarity mentioned above. The project decided to use the SPAR-H as the basis for building the Petro-HRA guidelines due to its widely established use as a part of probabilistic risk assessment (PRA) in nuclear industry, in as many as 70 nuclear plants in the United States of America (K. Groth & Swiler, 2012). It can be said that since it has a scientific basis, a detailed guide and non-extreme demands of resources, it is justified as an apt choice for basis of the Petro-HRA. The methodology of the Petro-HRA guidelines have been discussed in detail in chapter 5, however, figure 6 provides a bird’s eye view of the guidelines which consists of 7 main steps in line with the general HRA process steps described above.
Figure 6: HRA as per Petro-HRA guidelines
The Petro-HRA has been fixed as the starting point to build our study further. This has been done to limit the scope of our study and apply focussed efforts in studying and improving this newly developed methodology.
2.2.1 Insights from Interviews of industrial experts In order to gain insights on the current industrial practices and Petro-HRA guidelines, 3 industrial experts have been interviewed separately. These experts were from Statoil as the operator company, PSA as the regulatory authority and DNV-GL as the consultant, have also been involved in the development of the Petro-HRA guidelines.
13
Interviewing leaders and experts from these 3 different organisations, performing entirely different functions in the oil and gas industry, has helped us to understand the expectations from HRA perceived from three different angles. The responses to the interviews have been summarized in table 6 in the Appendix A. Responses were obtained from Kristian Gould (Human Factors Chief Engineer, Statoil), Arne Johan Thorsen (Leader of Process and Enquiry, Principal Engineer, PSA) and Koen Van De Merwe (Senior Consultant for Operational Safety, DNVGL).These interviews have helped us in forming a basic overview about the expectations and requirements from the HRA. The chosen questions were aimed at gathering the industrial sentiment related to the general HRA methodology, perceived shortcomings in application and current risk analysis methods being used in the HRA. Several questions related to the gaps present in Petro-HRA methodology were also included which can help us in establishing their effect on the confidence in the estimates and results generated. Lastly, the interviewees also gave some feedback based on their experience on how to improve the HRA. The main insights derived from the interview are as follows:
1. It was established from the responses of all the three interviewees that the traditional QRA framework focussed largely on analysing the technical design aspects of the system. This was due to the lack of uniform HRA guidelines in the industry until now because of which the operating companies analysed the human performance to varying degrees of details with different approaches. This can point towards the difficulty in benchmarking the HRA methods employed by the oil and gas industry.
2. The industrial practices in risk analysis like LOPA, BORA and SIL which are common in other parts of the world are not applied much in the Norwegian oil and gas industry. However, the participants of the interview were aware of some the limitations of these methodologies because of which they might now be adequate for HRA study. These methods suffered from the problems of laying more focus on analysing the technical aspects of system, lack of thoroughness and awareness among analysts in conducting them.
3. All the three experts agreed on the lack of quantification in the current HRA methodology and stressed on measuring of uncertainty. The reasons for uncertainty were identified as under-reporting by companies, infrequent logging of data, assessing the Strength of Knowledge subjectively and lack of task specific data. It was logically inferred from the responses that all the three major parties of the industry viewed the data as a major input to the HRA methodology. Establishing the reliability and quality of data, gaining access to database and collecting objective data from direct sources like operators were the major improvements identified for an improved HRA.
4. The interview responses revealed the shortcomings and gaps of Petro-HRA guidelines which were mainly related to ignoring the dependency among PSFs, lack of quantification of uncertainty in estimating HEP, modelling HFEs as independent events and lack of a commonly accessible database which can help in better task analysis and HFE modelling.
14
This interview exercise sheds light on some of the potential gaps that present themselves as an opportunity for improvement in the Petro-HRA framework by the help of digital solutions.
2.3 DISCUSSION The new risk perspective is a vast improvement from the previously defined risk concepts such as etc. It has many highlighting features which have been discussed here after studying and analysing the new risk perspective.
The new risk concept is a step in the direction of integrating the risk assessment to facilitate a better decision making process. While on one hand, the new risk perspective highlights the different levels and steps of risk assessment explicitly, on the other hand it also facilitates smooth transition into each step ahead. This helps in maintaining the transparency, traceability and methodical sequence in the whole process.
As per the standard procedure of risk assessment, the analysts define a scope of the assessment to focus on a fixed set of consequences and their risk, relevant to their assessment. However, consequences outside their scope of assessment are nevertheless present even though the analyst might not have enough knowledge about them. These unidentified consequences can appear as black swans in the future. It is even more important to account for these knowledge constraints and to convey the limitation of their assessment scope to the decision makers. This has been explicitly included in the risk assessment scope in the hierarchical framework.
The hierarchical risk perspective is a broad framework that does not restrict itself to probability as the only choice of measure of uncertainty. It covers the one major pitfall of using probability as measure of uncertainty, i.e. expressing the strength of knowledge aspect. The assumptions may hide certain uncertainties and affect the decision making. Identifying these assumptions and simplifications, communicating them and conveying their implications can help in a more risk informed decision making.
This new risk concept also demands our focus towards the sensitivity of model towards inputs used in the model. The model error implicitly stresses on validating our past data, information, inputs, choice of parameters, assumptions, simplifications in model because they can introduce uncertainties. However, feeding these sets of data and information into our system certainly does not reduce the importance of the results of the analysis. But the need of a broader perspective and choice of a suitable risk and uncertainty measure cannot be stressed upon more.
The use of this concept is helpful in assessing even a complex situations because it helps to breakdown the task into smaller, logical and more approachable steps. For this reason, the new risk concept is ideal to be applied in the Human Reliability Assessment framework. The role of human performance in a major accident can be particularly

15
complex to quantify and assess due to human-machine interaction which involves capturing the behavioural aspects in the model. The new risk framework can help to adequately target the challenge and express the associated uncertainties. Some of the challenges have been identified from the interviews which relate to implementation of the framework, need for focus on measuring uncertainty, under-utilisation of data, ensuring data quality and quantification of uncertainty in the analysis. However, the biggest change that is the needed relates to perceiving human barrier with a capability to positively and negatively influence the risk levels of the system after an imitating event has taken place. This can help us in the long run to identify opportunities to improve the design of the system which can be built to enhance human performance and ultimately the overall system reliability.
16
CHAPTER MAJOR ACCIDENT EVENTS In the previous chapter we studied the various HRA methods available in the industries and introduced the Petro-HRA guidelines. We also gained valuable insights from the interviews of leading industrial experts about the risk analysis industrial practices and potential gaps in the current HRA methodology. In this chapter, we will utilise the accident investigation reports to understand the human role in these accidents. We will try to understand the causes behind human performance with the help of DNV Loss-Causation model. Finally, we will study activity risk indicators currently available and discuss their ability to capture the human behavioural elements.
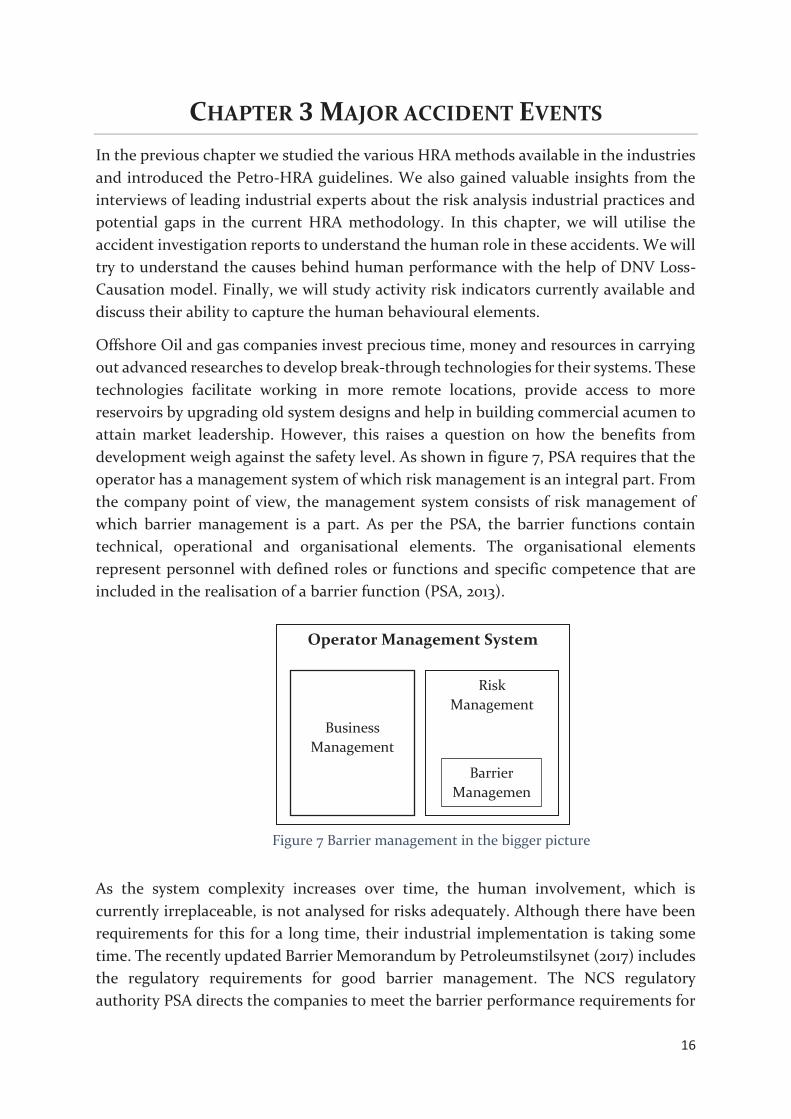
Offshore Oil and gas companies invest precious time, money and resources in carrying out advanced researches to develop break-through technologies for their systems. These technologies facilitate working in more remote locations, provide access to more reservoirs by upgrading old system designs and help in building commercial acumen to attain market leadership. However, this raises a question on how the benefits from development weigh against the safety level. As shown in figure 7, PSA requires that the operator has a management system of which risk management is an integral part. From the company point of view, the management system consists of risk management of which barrier management is a part. As per the PSA, the barrier functions contain technical, operational and organisational elements. The organisational elements represent personnel with defined roles or functions and specific competence that are included in the realisation of a barrier function (PSA, 2013).
As the system complexity increases over time, the human involvement, which is currently irreplaceable, is not analysed for risks adequately. Although there have been requirements for this for a long time, their industrial implementation is taking some time. The recently updated Barrier Memorandum by Petroleumstilsynet (2017) includes the regulatory requirements for good barrier management. The NCS regulatory authority PSA directs the companies to meet the barrier performance requirements for
Operator Management System
Risk Management
Barrier Managemen
Figure 7 Barrier management in the bigger picture
Business Management

17
barrier functions mentioned in NORSOK Z- . The operators often develop their own internal standards and safety mandates to build systems that are compliant to additional external safety standards referred to by the PSA. The regulatory authorities require that the operating companies select their own technical, operational and organisational solutions to reduce the likelihood of occurrence of hazards and accidents. The operating companies have the entire responsibility to demonstrate that the advanced technology adopted by them fall within the risk acceptance criteria and the employed barriers efficiently reduce the consequences or causes of the initiating event. Further, they are responsible for keeping internal checks on malpractices of personnel and process safety.
As it can be seen that the major portion of ensuring system safety responsibility lies with the operating company itself whose internal safety guidelines, risk assessment procedures, safety culture and senior management outlook is reflective of the safety policy employed by them. Companies emphasize heavily on reliability of the technical barriers. But the non-technical human barriers that form an integral part of the system need to be assessed and developed equally. Many instances from the past where the human elements were not given due importance in comparison to the technical elements, have shown to accelerate a chain of events to a full-fledged disaster. Study of such incidents in the past can help us in understanding the role of human element in the barrier function and its performance influencing factors. This been done by reviewing the role of humans through studying investigation reports for not only major accidents but also small scale accidents and near-miss cases. These reports have been collected from all over the world to study the effects of human involvement, which are common everywhere despite of several inherent differences.
3.1 REVIEW OF INVESTIGATION REPORTS OF ACCIDENTAL EVENTS Studying the investigation reports provides a small window in the otherwise large and chaotic picture of the accident which took place in the past. It may not be possible for the investigating teams to capture all the critical elements accurately due to practical limitations like non-availability of victim accounts, damaged documental proofs in the accident, hesitation on the part of witnesses to give an accurate and complete account of their experience, etc. However, these reports are indicative of the overall risk picture from a broader view and can impart important learnings.
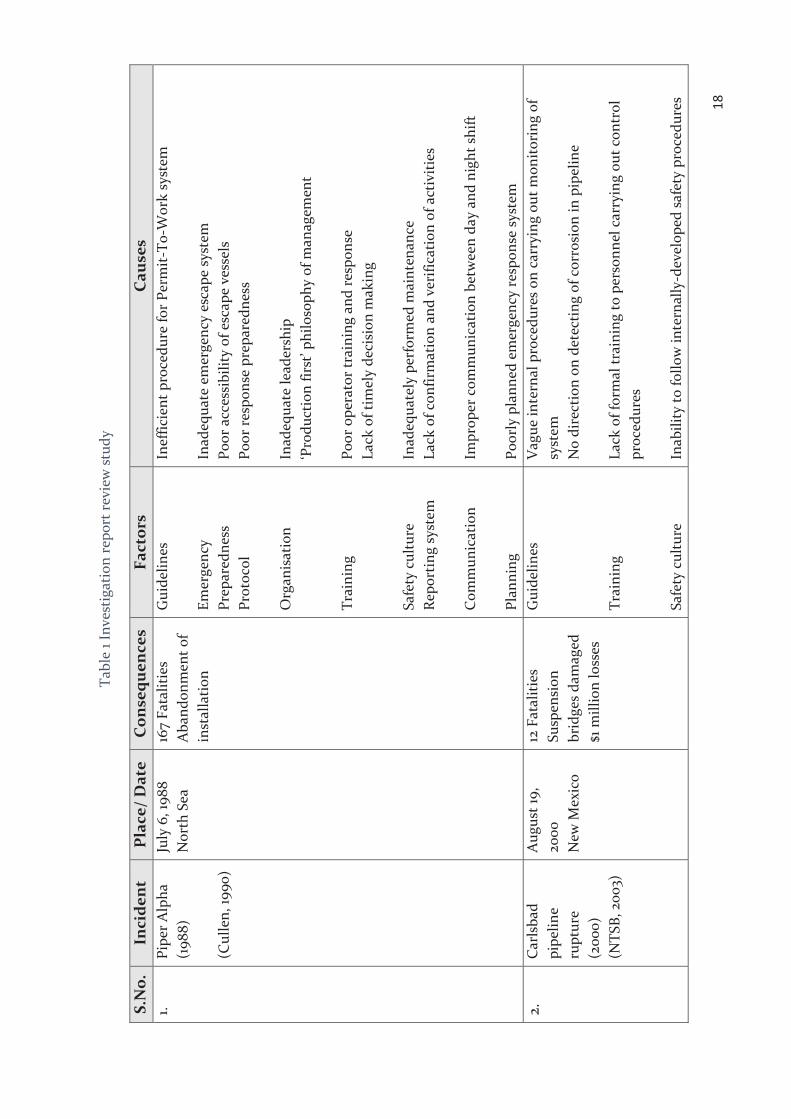
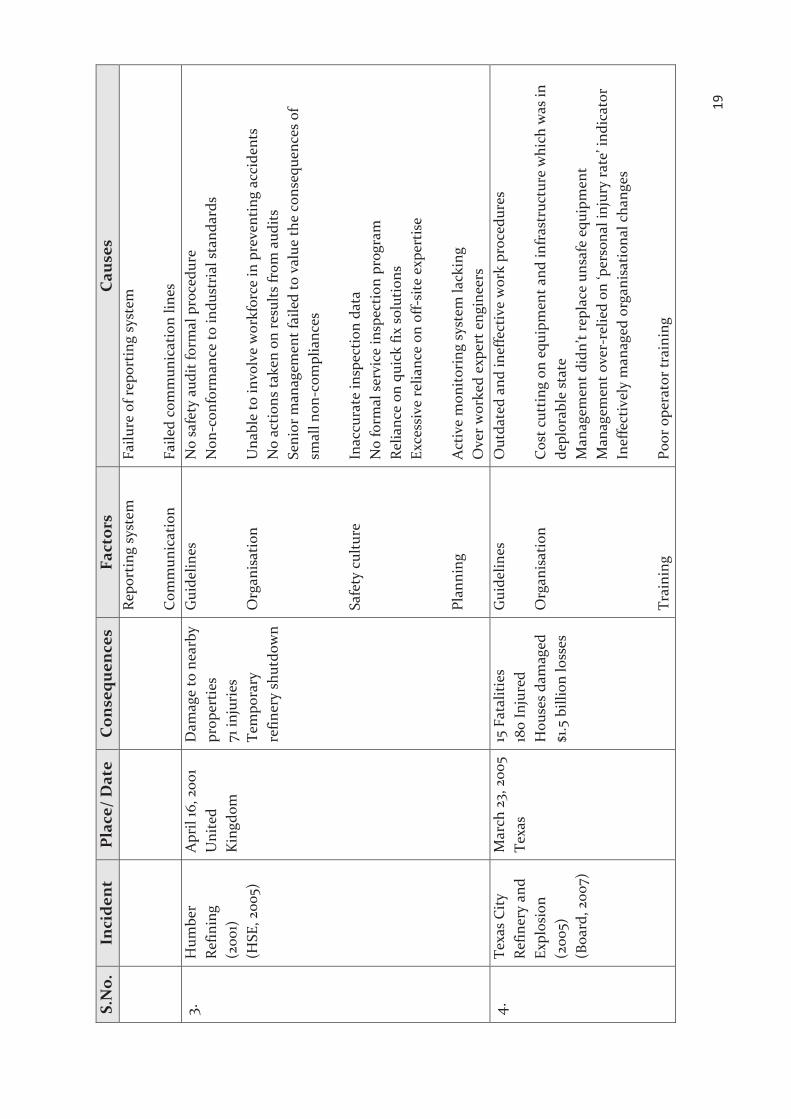
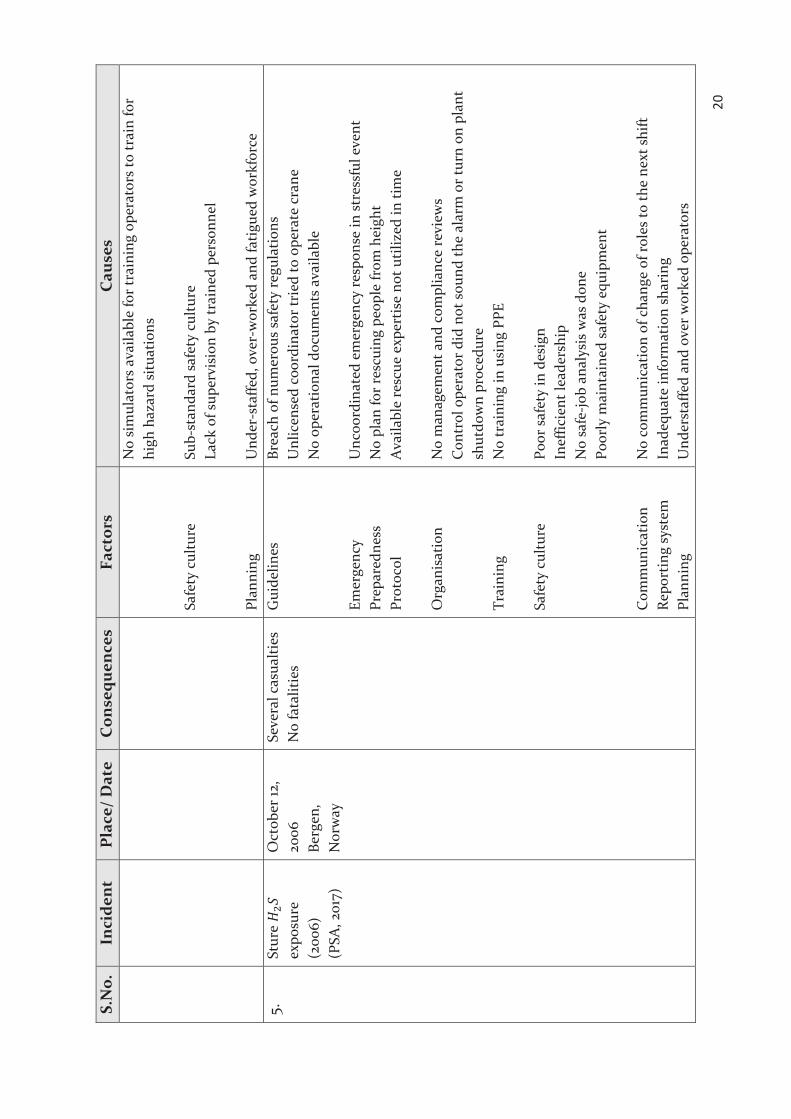
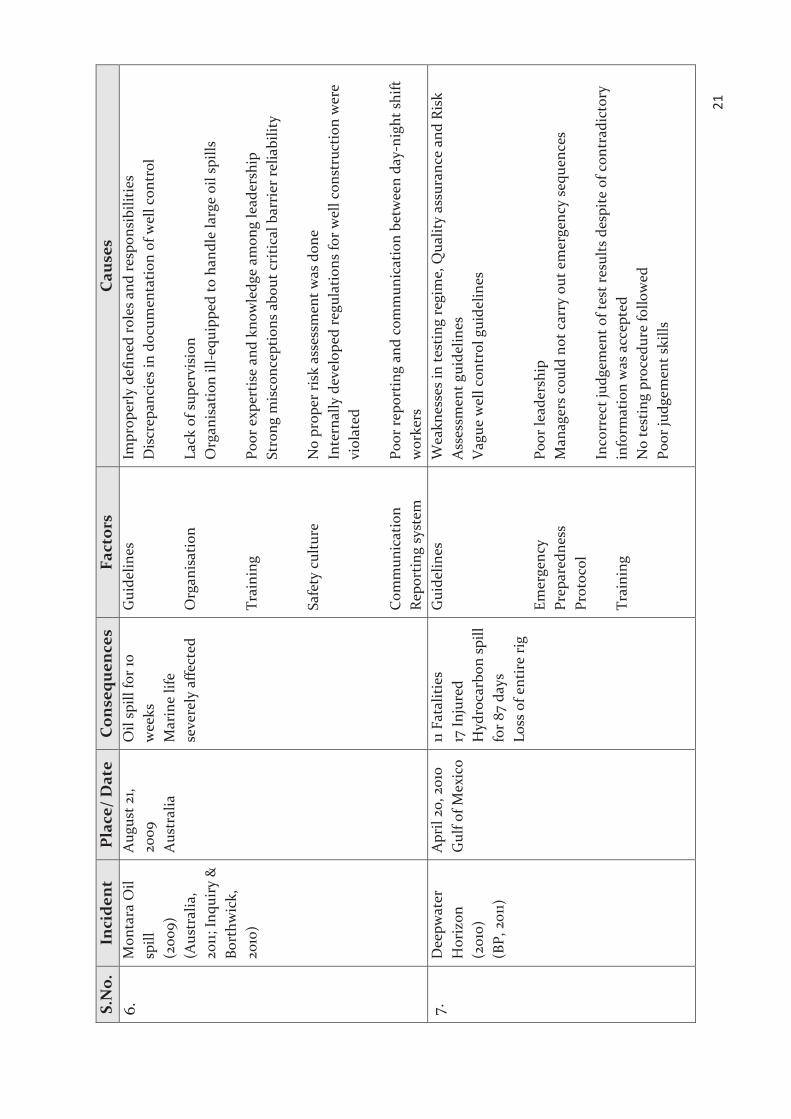
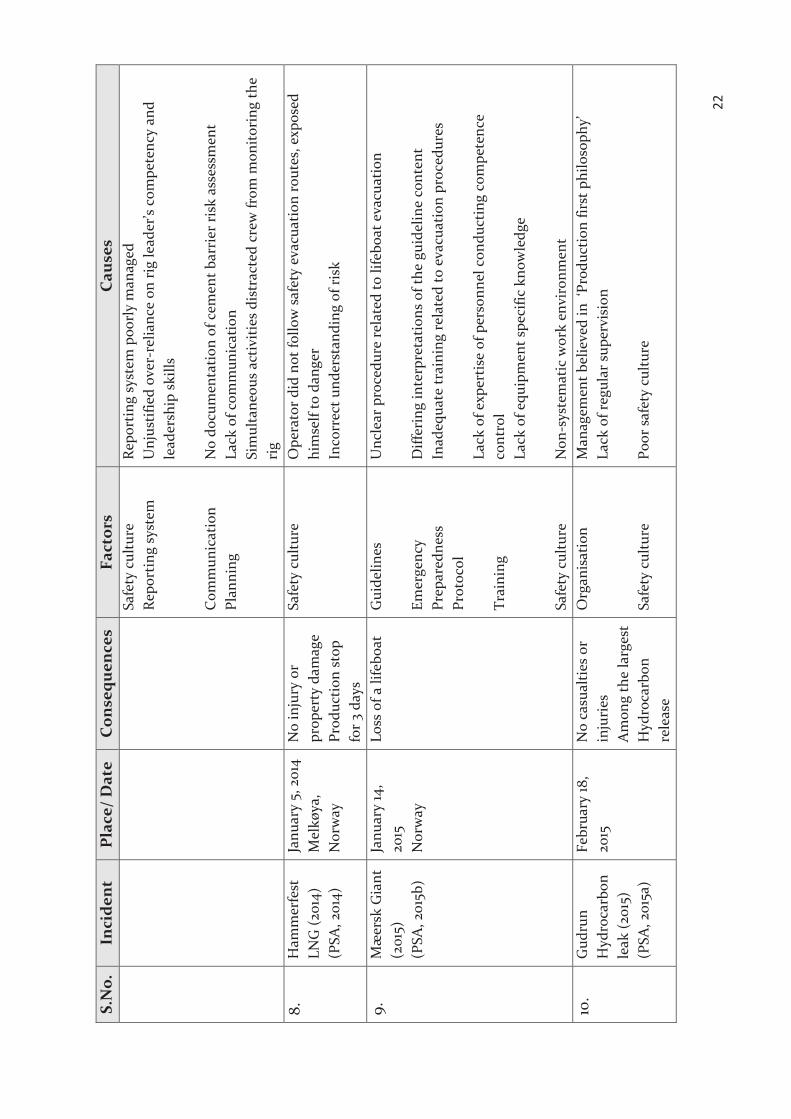
Table 1 below presents a summary derived from the review of facts and proofs from the investigation reports of accidents that have taken in the past along with their associated causes.
18
Tabl
e 1 I
nves
tigat
ion
repo
rt re
view
stu
dy
S.N
o.
Inci
dent
P
lace
/ D
ate
Con
sequ
ence
s Fa
ctor
s C
ause
s 1.
Pi
per A
lpha
(1
988)
(C
ulle
n, 19
90)
July
6, 1
988
Nor
th S
ea
167
Fata
litie
s A
band
onm
ent o
f in
stal
latio
n
Gui
delin
es
Emer
genc
y Pr
epar
edne
ss
Prot
ocol
O
rgan
isat
ion
Tr
aini
ng
Safe
ty c
ultu
re
Repo
rtin
g sy
stem
C
omm
unic
atio
n
Plan
ning
Inef
ficie
nt p
roce
dure
for
Perm
it-T
o-W
ork
syst
em
Inad
equa
te e
mer
genc
y es
cape
sys
tem
Po
or a
cces
sibi
lity
of e
scap
e ve
ssel
s Po
or re
spon
se p
repa
redn
ess
Inad
equa
te le
ader
ship
‘P
rodu
ctio
n fir
st’ p
hilo
soph
y of
man
agem
ent
Poor
ope
rato
r tra
inin
g an
d re
spon
se
Lack
of t
imel
y de
cisi
on m
akin
g In
adeq
uate
ly p
erfo
rmed
mai
nten
ance
La
ck o
f con
firm
atio
n an
d ve
rific
atio
n of
act
iviti
es
Impr
oper
com
mun
icat
ion
betw
een
day
and
nigh
t shi
ft
Poor
ly p
lann
ed e
mer
genc
y re
spon
se s
yste
m
2.
Car
lsba
d pi
pelin
e ru
ptur
e (2
000)
(N
TSB,
200
3)
Aug
ust 1
9,
2000
N
ew M
exic
o
12 F
atal
ities
Su
spen
sion
br
idge
s da
mag
ed
$1 m
illio
n lo
sses
Gui
delin
es
Trai
ning
Sa
fety
cul
ture
Vag
ue in
tern
al p
roce
dure
s on
car
ryin
g ou
t mon
itori
ng o
f sy
stem
N
o di
rect
ion
on d
etec
ting
of c
orro
sion
in p
ipel
ine
Lack
of f
orm
al tr
aini
ng to
per
sonn
el c
arry
ing
out c
ontr
ol
proc
edur
es
Inab
ility
to fo
llow
inte
rnal
ly-d
evel
oped
saf
ety
proc
edur
es
19
S.N
o.
Inci
dent
P
lace
/ D
ate
Con
sequ
ence
s Fa
ctor
s C
ause
s Re
port
ing
syst
em
Com
mun
icat
ion
Failu
re o
f rep
ortin
g sy
stem
Fa
iled
com
mun
icat
ion
lines
3.
H
umbe
r Re
finin
g (2
001)
(H
SE, 2
005)
Apr
il 16
, 200
1 U
nite
d K
ingd
om
Dam
age
to n
earb
y pr
oper
ties
71 in
juri
es
Tem
pora
ry
refin
ery
shut
dow
n
Gui
delin
es
Org
anis
atio
n Sa
fety
cul
ture
Pl
anni
ng
No
safe
ty a
udit
form
al p
roce
dure
N
on-c
onfo
rman
ce to
indu
stri
al s
tand
ards
U
nabl
e to
invo
lve
wor
kfor
ce in
pre
vent
ing
acci
dent
s N
o ac
tions
take
n on
resu
lts fr
om a
udits
Se
nior
man
agem
ent f
aile
d to
val
ue th
e co
nseq
uenc
es o
f sm
all n
on-c
ompl
ianc
es
Inac
cura
te in
spec
tion
data
N
o fo
rmal
ser
vice
insp
ecti
on p
rogr
am
Relia
nce
on q
uick
fix
solu
tion
s Ex
cess
ive
relia
nce
on o
ff-si
te e
xper
tise
Act
ive
mon
itori
ng s
yste
m la
ckin
g O
ver w
orke
d ex
pert
eng
inee
rs
4.
Texa
s C
ity
Refin
ery
and
Expl
osio
n (2
005)
(B
oard
, 200
7)
Mar
ch 2
3, 2
005
Texa
s 15
Fat
aliti
es
180
Inju
red
Hou
ses
dam
aged
$1
.5 b
illio
n lo
sses
Gui
delin
es
Org
anis
atio
n Tr
aini
ng
Out
date
d an
d in
effe
ctiv
e w
ork
proc
edur
es
Cos
t cut
ting
on
equi
pmen
t and
infr
astr
uctu
re w
hich
was
in
depl
orab
le s
tate
M
anag
emen
t did
n’t r
epla
ce u
nsaf
e eq
uipm
ent
Man
agem
ent o
ver-
relie
d on
‘per
sona
l inj
ury
rate
’ ind
icat
or
Inef
fect
ivel
y m
anag
ed o
rgan
isat
iona
l cha
nges
Po
or o
pera
tor t
rain
ing
20
S.N
o.
Inci
dent
P
lace
/ D
ate
Con
sequ
ence
s Fa
ctor
s C
ause
s Sa
fety
cul
ture
Pl
anni
ng
No
sim
ulat
ors
avai
labl
e fo
r tra
inin
g op
erat
ors
to tr
ain
for
high
haz
ard
situ
atio
ns
Sub-
stan
dard
saf
ety
cult
ure
Lack
of s
uper
visi
on b
y tr
aine
d pe
rson
nel
Und
er-s
taffe
d, o
ver-
wor
ked
and
fatig
ued
wor
kfor
ce
5.
Stur
e
expo
sure
(2
006)
(P
SA, 2
017)
Oct
ober
12,
2006
Be
rgen
, N
orw
ay
Seve
ral c
asua
lties
N
o fa
talit
ies
Gui
delin
es
Emer
genc
y Pr
epar
edne
ss
Prot
ocol
O
rgan
isat
ion
Trai
ning
Sa
fety
cul
ture
C
omm
unic
atio
n
Repo
rtin
g sy
stem
Pl
anni
ng
Brea
ch o
f num
erou
s sa
fety
regu
latio
ns
Unl
icen
sed
coor
dina
tor t
ried
to o
pera
te c
rane
N
o op
erat
iona
l doc
umen
ts a
vaila
ble
Unc
oord
inat
ed e
mer
genc
y re
spon
se in
str
essf
ul e
vent
N
o pl
an fo
r res
cuin
g pe
ople
from
hei
ght
Ava
ilabl
e re
scue
exp
ertis
e no
t uti
lized
in ti
me
No
man
agem
ent a
nd c
ompl
ianc
e re
view
s C
ontr
ol o
pera
tor d
id n
ot s
ound
the
alar
m o
r tur
n on
pla
nt
shut
dow
n pr
oced
ure
No
trai
ning
in u
sing
PPE
Po
or s
afet
y in
des
ign
Inef
ficie
nt le
ader
ship
N
o sa
fe-jo
b an
alys
is w
as d
one
Poor
ly m
aint
aine
d sa
fety
equ
ipm
ent
No
com
mun
icat
ion
of c
hang
e of
role
s to
the
next
shi
ft
Inad
equa
te in
form
atio
n sh
arin
g U
nder
staf
fed
and
over
wor
ked
oper
ator
s
21
S.N
o.
Inci
dent
P
lace
/ D
ate
Con
sequ
ence
s Fa
ctor
s C
ause
s 6.
M
onta
ra O
il sp
ill
(200
9)
(Aus
tral
ia,
2011;
Inqu
iry
&
Bort
hwic
k,
2010
)
Aug
ust 2
1, 20
09
Aus
tral
ia
Oil
spill
for 1
0 w
eeks
M
arin
e lif
e se
vere
ly a
ffect
ed
Gui
delin
es
Org
anis
atio
n Tr
aini
ng
Safe
ty c
ultu
re
Com
mun
icat
ion
Re
port
ing
syst
em
Impr
oper
ly d
efin
ed ro
les
and
resp
onsi
bilit
ies
Dis
crep
anci
es in
doc
umen
tatio
n of
wel
l con
trol
La
ck o
f sup
ervi
sion
O
rgan
isat
ion
ill-e
quip
ped
to h
andl
e la
rge
oil s
pills
Po
or e
xper
tise
and
kno
wle
dge
amon
g le
ader
ship
St
rong
mis
conc
eptio
ns a
bout
cri
tical
bar
rier
relia
bilit
y N
o pr
oper
risk
ass
essm
ent w
as d
one
In
tern
ally
dev
elop
ed re
gula
tions
for w
ell c
onst
ruct
ion
wer
e vi
olat
ed
Poor
repo
rtin
g an
d co
mm
unic
atio
n be
twee
n da
y-ni
ght s
hift
w
orke
rs
7.
Dee
pwat
er
Hor
izon
(2
010)
(B
P, 2
011)
Apr
il 20
, 201
0 G
ulf o
f Mex
ico
11 Fa
talit
ies
17 In
jure
d H
ydro
carb
on s
pill
for 8
7 da
ys
Loss
of e
ntir
e ri
g
Gui
delin
es
Emer
genc
y Pr
epar
edne
ss
Prot
ocol
Tr
aini
ng
Wea
knes
ses
in te
stin
g re
gim
e, Q
ualit
y as
sura
nce
and
Risk
A
sses
smen
t gui
delin
es
Vag
ue w
ell c
ontr
ol g
uide
lines
Po
or le
ader
ship
M
anag
ers
coul
d no
t car
ry o
ut e
mer
genc
y se
quen
ces
Inco
rrec
t jud
gem
ent o
f tes
t res
ults
des
pite
of c
ontr
adic
tory
in
form
atio
n w
as a
ccep
ted
No
test
ing
proc
edur
e fo
llow
ed
Poor
judg
emen
t ski
lls
22
S.N
o.
Inci
dent
P
lace
/ D
ate
Con
sequ
ence
s Fa
ctor
s C
ause
s Sa
fety
cul
ture
Re
port
ing
syst
em
Com
mun
icat
ion
Pl
anni
ng
Repo
rtin
g sy
stem
poo
rly
man
aged
U
njus
tifie
d ov
er-r
elia
nce
on ri
g le
ader
’s co
mpe
tenc
y an
d le
ader
ship
ski
lls
No
docu
men
tatio
n of
cem
ent b
arri
er ri
sk a
sses
smen
t La
ck o
f com
mun
icat
ion
Sim
ulta
neou
s ac
tiviti
es d
istr
acte
d cr
ew fr
om m
onito
ring
the
rig
8.
Ham
mer
fest
LN
G (2
014)
(P
SA, 2
014)
Janu
ary
5, 2
014
Mel
køya
, N
orw
ay
No
inju
ry o
r pr
oper
ty d
amag
e Pr
oduc
tion
stop
fo
r 3 d
ays
Safe
ty c
ultu
re
O
pera
tor d
id n
ot fo
llow
saf
ety
evac
uatio
n ro
utes
, exp
osed
hi
mse
lf to
dan
ger
Inco
rrec
t und
erst
andi
ng o
f ris
k
9.
Mæ
ersk
Gia
nt
(201
5)
(PSA
, 201
5b)
Janu
ary
14,
2015
N
orw
ay
Loss
of a
life
boat
G
uide
lines
Em
erge
ncy
Prep
ared
ness
Pr
otoc
ol
Trai
ning
Sa
fety
cul
ture
Unc
lear
pro
cedu
re re
late
d to
life
boat
eva
cuat
ion
Diff
erin
g in
terp
reta
tions
of t
he g
uide
line
cont
ent
Inad
equa
te tr
aini
ng re
late
d to
eva
cuat
ion
proc
edur
es
Lack
of e
xper
tise
of p
erso
nnel
con
duct
ing
com
pete
nce
cont
rol
Lack
of e
quip
men
t spe
cific
kno
wle
dge
Non
-sys
tem
atic
wor
k en
viro
nmen
t 10
. G
udru
n H
ydro
carb
on
leak
(201
5)
(PSA
, 201
5a)
Febr
uary
18,
2015
N
o ca
sual
ties
or
inju
ries
A
mon
g th
e la
rges
t H
ydro
carb
on
rele
ase
Org
anis
atio
n Sa
fety
cul
ture
Man
agem
ent b
elie
ved
in ‘
Prod
uctio
n fir
st p
hilo
soph
y’
Lack
of r
egul
ar s
uper
visi
on
Poor
saf
ety
cultu
re

23
Although there have been many incidents in the past which have had major repercussions, this small sample of reports has been selected to be reviewed. The human activities, after an initiating event has taken place, can affect the consequences of the event to a large extent. To understand this, we need to study the interactions between various causes which lead the operator into making errors in the past accidents. After analysing these investigation reports, several points have become evident. Incidents involving human errors shaping up an event into a major disaster are common around the world. Even the factors shaping the human behaviour are almost the same and these have been presented below:
The DNV-GL Loss-Causation model, as shown in figure 8, is a general model used to understand the causes behind an accident. This model aids in identifying human and organisational factors along with the technical factors. This model has been used as a basis for assessment of investigation reports to identify and present explanations of the causes behind human behaviour. As per this model, human errors can be attributed to three broad categories of causes. These causes shape the human behaviour and performance that lead to incidents or escalation of incidents resulting in losses such as fatality, injuries, process delays, property damage and environmental losses.
1. Immediate causes 2. Basic causes 3. Lack of control
Figure 8 DNV- GL Loss Causation Model
It can be seen from these investigation reports that because of the above mentioned causes (Immediate, Basic and Lack of control causes), the human operator/ supervisors have made errors of near misses, lapses, violations, poor misguided judgements and adopted unethical safety practices. Based on the study of the investigation reports, these causations have been logically categorised into Immediate, Basic and Lack of Control categories and have been summarized in the table 2 below:
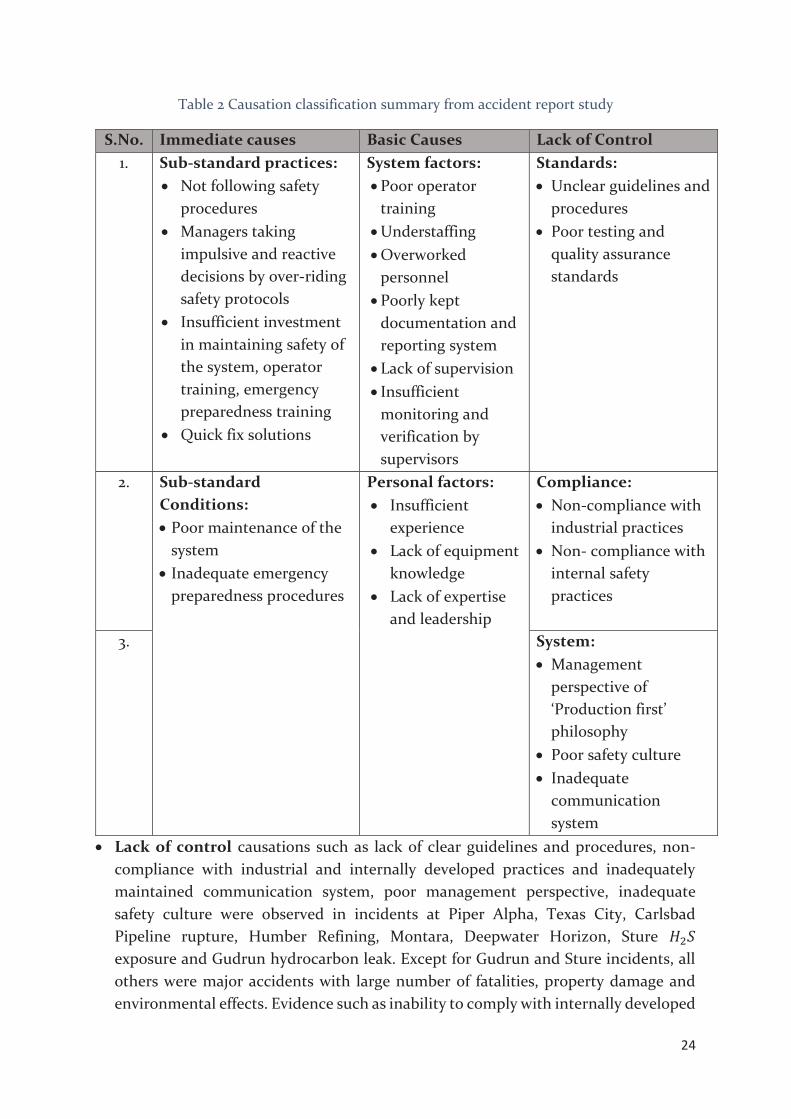
24
Table 2 Causation classification summary from accident report study
S.No. Immediate causes Basic Causes Lack of Control 1. Sub-standard practices:
Not following safety procedures
Managers taking impulsive and reactive decisions by over-riding safety protocols
Insufficient investment in maintaining safety of the system, operator training, emergency preparedness training
Quick fix solutions
System factors: Poor operator training Understaffing Overworked personnel Poorly kept documentation and reporting system Lack of supervision Insufficient monitoring and verification by supervisors
Standards: Unclear guidelines and procedures
Poor testing and quality assurance standards
2. Sub-standard Conditions: Poor maintenance of the system Inadequate emergency preparedness procedures
Personal factors: Insufficient
experience Lack of equipment
knowledge Lack of expertise
and leadership
Compliance: Non-compliance with industrial practices
Non- compliance with internal safety practices
3. System:
Management perspective of ‘Production first’ philosophy
Poor safety culture Inadequate communication system
Lack of control causations such as lack of clear guidelines and procedures, non-compliance with industrial and internally developed practices and inadequately maintained communication system, poor management perspective, inadequate safety culture were observed in incidents at Piper Alpha, Texas City, Carlsbad Pipeline rupture, Humber Refining, Montara, Deepwater Horizon, Sture exposure and Gudrun hydrocarbon leak. Except for Gudrun and Sture incidents, all others were major accidents with large number of fatalities, property damage and environmental effects. Evidence such as inability to comply with internally developed
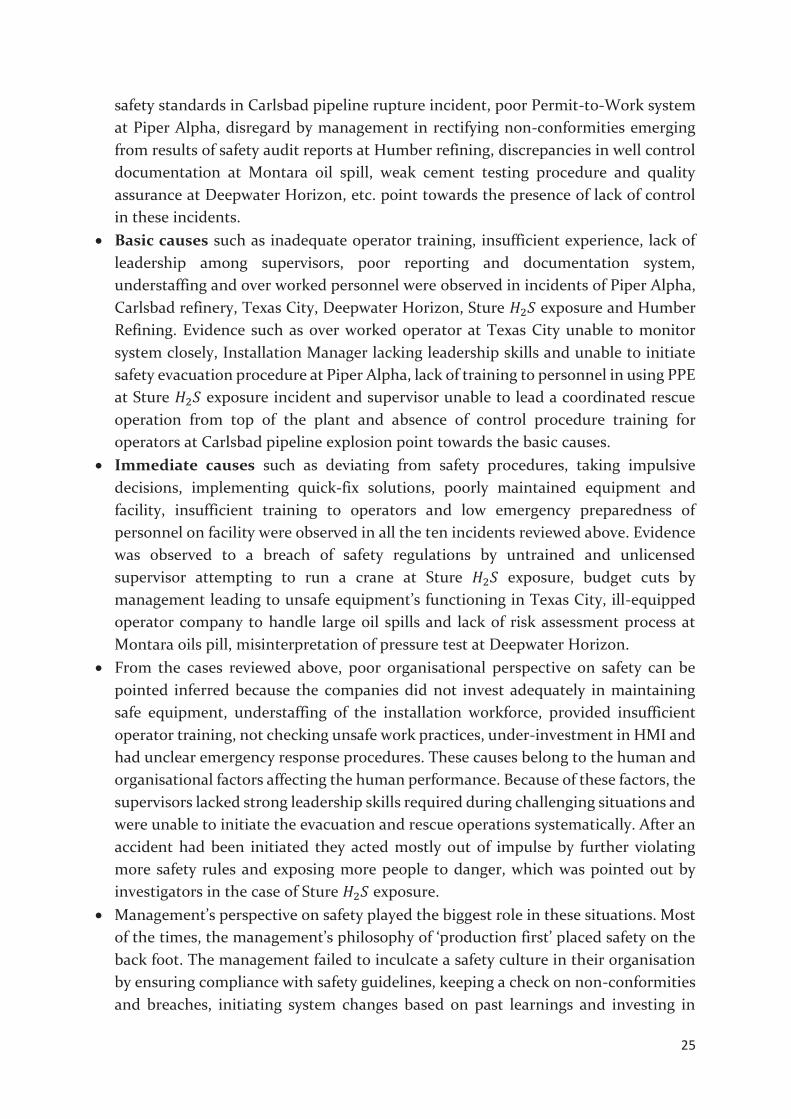
25
safety standards in Carlsbad pipeline rupture incident, poor Permit-to-Work system at Piper Alpha, disregard by management in rectifying non-conformities emerging from results of safety audit reports at Humber refining, discrepancies in well control documentation at Montara oil spill, weak cement testing procedure and quality assurance at Deepwater Horizon, etc. point towards the presence of lack of control in these incidents.
Basic causes such as inadequate operator training, insufficient experience, lack of leadership among supervisors, poor reporting and documentation system, understaffing and over worked personnel were observed in incidents of Piper Alpha, Carlsbad refinery, Texas City, Deepwater Horizon, Sture exposure and Humber Refining. Evidence such as over worked operator at Texas City unable to monitor system closely, Installation Manager lacking leadership skills and unable to initiate safety evacuation procedure at Piper Alpha, lack of training to personnel in using PPE at Sture exposure incident and supervisor unable to lead a coordinated rescue operation from top of the plant and absence of control procedure training for operators at Carlsbad pipeline explosion point towards the basic causes.
Immediate causes such as deviating from safety procedures, taking impulsive decisions, implementing quick-fix solutions, poorly maintained equipment and facility, insufficient training to operators and low emergency preparedness of personnel on facility were observed in all the ten incidents reviewed above. Evidence was observed to a breach of safety regulations by untrained and unlicensed supervisor attempting to run a crane at Sture exposure, budget cuts by management leading to unsafe equipment’s functioning in Texas City, ill-equipped operator company to handle large oil spills and lack of risk assessment process at Montara oils pill, misinterpretation of pressure test at Deepwater Horizon.
From the cases reviewed above, poor organisational perspective on safety can be pointed inferred because the companies did not invest adequately in maintaining safe equipment, understaffing of the installation workforce, provided insufficient operator training, not checking unsafe work practices, under-investment in HMI and had unclear emergency response procedures. These causes belong to the human and organisational factors affecting the human performance. Because of these factors, the supervisors lacked strong leadership skills required during challenging situations and were unable to initiate the evacuation and rescue operations systematically. After an accident had been initiated they acted mostly out of impulse by further violating more safety rules and exposing more people to danger, which was pointed out by investigators in the case of Sture exposure.
Management’s perspective on safety played the biggest role in these situations. Most of the times, the management’s philosophy of ‘production first’ placed safety on the back foot. The management failed to inculcate a safety culture in their organisation by ensuring compliance with safety guidelines, keeping a check on non-conformities and breaches, initiating system changes based on past learnings and investing in
26
safety, training and expertise of their employees. A negligence by management in carrying out any of these duties harboured an attitude of carelessness, non- accountability and undertaking reactive measures by the operator and supervisors.
Poorly maintained system of data collection, documentation, reporting, monitoring, supervision and communication systems played a big role in improper data transfer and conveying misleading information which lead to complete system breakdown once a situation of alarm took place. Had these system functionalities been in place, the severity of impact might have been reduced in a lot of the accidents studied above.
It can be concluded that as per the Loss-Causation model, human performance shaping factors (categorised into direct, immediate and lack of control factors) such as training, experience, organisational factors, safety culture, guidelines and procedures, communication and leadership have been the most important factors affecting the human performance in the major accidental events investigated leading to loss of life, environmental damage and financial loss.
Conclusion: Ability of investigation reports in identifying the human element
The study of these investigation has been helpful in understanding the role human performance has played in the accidents investigated. The investigators of these accidents probed and provided detailed accounts of factors such as:
1. Working conditions of the operator 2. Management shortcomings in promoting safe culture 3. Timeline analysis of the sequence of accidental events 4. Training and experience level of operators 5. Clarity in operator work process instructions 6. Emergency preparedness level among the personnel on-board
The investigations reports are based on assessment of evidences from the accident site, forensic studies and first-hand accounts of the survivors. Often, to gain an insight on the human element when the offshore installation accident site is completely destroyed, the survivor account can be of the greatest help. Therefore it can be said that these reports have been able to identify the human element to some extent. However, due to some implicit factors which were observed during the study of investigation reports, it became clear that the reports fell short of sufficiently covering the human performance.
1. It was observed in the reports that sometimes the investigators encountered slight resistance from the survivors while trying to obtain an accurate account of the event. This might have been because of the human tendency to avoid taking responsibility for any of their actions which could have escalated the event.
2. Some of the witnesses avoided answering critical questions which could provide important information about the cause of human behaviour and their performance.

27
These factors raise uncertainty about the findings of the investigations and visibility of critical human and organisational factors. Hence, we can say that the investigation reports are able to provide only a crude picture about the human performance in these accidental events.
3.2 ROLE OF CURRENT ACTIVITY INDICATORS IN CAPTURING HUMAN ELEMENT PSA (2015c) monitors the safety level in the offshore oil and gas industry with the help of various indicators. These indicators, published in the RNNP report, are based on the data collected over a period of time from various companies in the industry and reflect the work safety level and can help in assessing its impact on the system level HSE. These lagging indicators are both qualitative and quantitative in nature. They mainly focus on the trend levels in the past. Some of these have been discussed below: 1. Survey Questionnaire response
A questionnaire based survey of offshore personnel caters to answering questions relating to employee’s perception of the safety environment is conducted bi-yearly by RNNP. This is one of the qualitative indicators that is helpful in attaining first-hand information about the operator’s working environment quality, organisational emphasis on developing and maintaining safety culture, work load related stress, communication and reporting culture. The survey questions cover 5 broad aspects:
HSE climate Perceived accident risk Working environment Leisure Health and sickness absence Comparison of HSE assessments offshore and onshore
The responses to these surveys are compiled and processed to reveal various positive and negative trends in relation to management’s HSE perspective, effect of workload on the operator, maintenance culture, raising HSE concerns affecting career growth, transparency in reporting of accidents and hazardous situations.
The data being collected is subjective in nature, consisting of agreements and disagreements on various statements in the questionnaire. It is necessary to point out here that since it is subjective data collection, it can only present a simplistic view about HSE perception among the employees. However, in order to have a detailed assessment of trends of factors affecting human performance, the data being collected needs to be measurable as well. If such a measurable data collection is implemented, the data can be processed and analysed to provide insight into the trends of organisation’s safety culture, HMI design quality, training and experience of operators, operating environment, time- varying stress level during emergency situations, managerial

28
involvement in HSE work, task complexity and organisational response to HSE requirements.
2. Incident indicators of serious near-misses
This indicator monitors the trend of serious near-miss incidents reported by the companies and assesses them against the integrity of barriers intact during near misses. A positive indicator trend might present a misleading picture due to possibility of misreporting and under-reporting of near-miss accidents by companies to project a positive image.
This indicator can be suitable for signalling the occupational risk trends. The occupational incidents reported for this indicator were caused due to violations of procedure, equipment malfunction, obstruction, missing/wrong information, etc. These may not fall in the category of post-initiating scenario events and hence this indicator may not be suitable for capturing the human element as per the QRA focus.
3. Indicator of serious personal injuries on mobile facilities
The incident indicator for serious personal injury indicates the trend of personal injuries to workers per million working hours. It can indicate the effects on injury trends after implementing safety regulations changes by the regulatory authorities or internal organisational changes. It is also suggestive of the type of safety barriers employed, barrier maintenance standards, management emphasis on personal safety and emergency preparedness and handling after a serious personal injury takes place on the installation. However, this indicator is also susceptible to misreporting and under-reporting problems due to the reputational risk faced by companies.
The personal injuries reported to PSA include all accidents at work caused due to human activity, equipment malfunction, technical barrier element failure and working environment exposure. This means that since the exact cause of the serious injury may or may not be the human activity in a post-initiating event scenario, we should not utilise this indicator as a measure of human performance. This is largely because the indicator utilises the non-relevant scenario data in depicting the industrial trends.
4. Risk indicators of noise, chemical working environment and ergonomics
This indicator is indicative of the levels of noise, management of chemical exposure in the working environment and ergonomic design of offshore facilities. An increased exposure level to hazardous chemicals or noise level can lead to increased stress levels, increased probability of injuries or making errors, stricter safety and control requirements. The ergonomic design can be an indicative of the HMI, general health level of the workers, complexity of system design and activity, working positions resulting in physical disorders of long/short term strains. All these can indicate the
29
organisation’s investment level in employee health and working environment stress levels.
However, a larger amount of data is collected by the operators than the amount that is reported to PSA. This internally collected data is under-utilized by the companies due to lack of framework to process this data to extract meaningful results. This presents an opportunity where with the help of digital solutions, this data can be processed to produce results to be used by companies in order to make system level changes that can help in improving the stress levels encountered by operators and consequently a safer working environment. However, gaining access to this data is a practical problem but the industry is striving hard to use this data as indicators.
In addition to this, the larger portion of data collected by companies relates to tests conducted to assess the technical system reliability (for example, gas detection system, emergency shutdown system, BOP tests, etc.). While these tests manage to capture the system and component level reliability, the system testing boundary does not take into account the need for activation by human intervention. In this way, data partially captures the safety function performance and excludes the important human performance.
3.3 DISCUSSION ON ABILITY OF INDICATORS IN CAPTURING HUMAN
BEHAVIOURAL ELEMENTS Survey Questionnaire response: The Survey Questionnaires is an effective way of gathering data directly from the operators at installations, who can provide us with useful information that may not be known to the experts. It contains a set of questions representative of the data relating to Human and Organisational Factors, knowledge and expertise level of operators, safety climate in their organisation, operating environment and quality of safety procedures. However, ensuring non-bias in survey reporting can be a challenge along with the subjective nature of data collection.
The data that the survey collects is subjective in nature and hence difficult to quantify. This can be addressed by adopting a measurable data collection by designing a survey is such a form that puts forth questions that require rating and selecting performance levels for each human element being addressed. Also, the survey can be easily updated regularly with new questions to provide information relevant to a phenomenon under investigation. It is an easy and inexpensive to circulate surveys and collect responses with the help of digital technology in a stipulated time frame to produce relevant and credible results in each surveying cycle. Analysing the relevant data portions from the survey can shed light on industrial trends and areas requiring improvements. Also, the problem of under-reporting can be overcome. Therefore, the Survey Questionnaires can be adequately used to capture the human behavioural elements by making the above stated changes in data collection methodology.

30
Incident indicators of serious near-misses: The serious near- misses are reported to the PSA by each company. However, the serious near misses indicator accounts for a broad spectrum of incidents involving drops, falls, trips, helicopter incidents, technical and operational failures which are not completely relevant to the human performance owing to the nature of sources of errors. Also, it suffers from the problem of under-reporting which raises questions on the credibility of the results and can mislead the companies about their actual personnel safety levels. Hence, it is not suitable for capturing human behavioural elements.
Indicator of serious personal injuries on mobile facilities: The serious personal injuries indicator also includes the non-relevant scenario data. It suffers from the problem of under-reporting to the PSA. Also, it is difficult to analyse the possible factors responsible for causing the human injury due to inconsistency in reporting procedures. This renders it less useful as an indicator in capturing human behaviour affecting elements.
Risk indicators of noise, chemical working environment and ergonomics: These indicators can easily represent the trends in operator working environment which shape the human performance. Also, the internally maintained database of the operating companies, which is installation specific can be used for their own analysis of the factors responsible for variation in stress levels among operators and human-machine interface quality of the control room design on the installation. Hence, it is a useful indicator to capture the human behavioural elements.
3.4 CONCLUSION By applying the Loss-Causation Model in assessing the investigation report, several causes behind human errors contributing to major accidents were identified. These causes revealed some of the important human performance shaping factors such as safety culture, organisational perspective on HSE, operator training and experience, HMI design, operating environment and workload induced stress level.
The RNNP collects data, every two years, through reported incidents, surveys, interviews and workshops that presents the current risk indicator trends. However, most of these indicators are inadequate in capturing factors affecting human performance in the major accidents. This is because they capture non-relevant incident data to calculate trends, which further reinstates the need to improve the data collection methods by making use of digital solutions.
As discussed above that Survey Questionnaires and Indicator for noise, chemical environment and Ergonomics can be used as risk indicators for capturing some of the human performance elements. But they need to be aligned with the new risk concept first. According to the new risk concept, these Surveys should specify its scope and target data related to relevant human performance shaping elements which are
31
important parameters for the Human Reliability Assessment. Some of these PSFs have been chosen from the review of investigation reports after careful investigation of causes behind human errors with the help of Loss-Causation Model.
The Survey Questionnaire needs to be developed further to include questions that aid in collecting the relevant measurable data instead of subjective data. The measurable data collection from Surveys can be used in conjunction with the large amount of database maintained by companies which remains mostly unused. This presents an opportunity to make use of digital solutions to tap information from all these data reserves. Along with this, the sensor technology can be developed to capture data relating to the operating environment elements such as noise, chemical exposure and operator stress level which can be used further to accurately capture human performance shaping factors.
Hence, these indicators will then be useful in presenting the uncertainty and strength of knowledge to the decision makers along with the results of Human Reliability assessment.

32
CHAPTER CURRENT RISK ASSESSMENT PRACTICES In the previous chapter we have reviewed some investigation reports for identifying the factors that affected human performance such that it escalated the initiating events into accidents/incident. Various common performance shaping factors have been discovered during the study. These factors need to be captured, measured and analysed in the risk analysis process to produce a holistic risk assessment result about human performance. For this purpose various industrial practices are available for use by the offshore oil and gas industry during the operational phase such as BORA, LOPA and SIL, Event Trees and Fault Trees. Most of these methods are used internationally and have been reviewed below for their ability to capture human performance and uncertainty in their assessments.
4.1 CURRENT INDUSTRIAL PRACTICES
4.1.1 BORA-Release Hydrocarbon leaks are a frequently encountered initiating event at offshore units and as per Norske Oil & Gas (2016) more than half of the hydrocarbon leaks in the past took place because of human intervention in the process equipment areas (figure 9). When a leak takes place, often the technical barrier systems are rendered passive to prevent them from hindering humans, who are the last line of barrier defence, from taking necessary actions to maintain stable production.
Figure 9 Hydrocarbon leaks over 0.1 kg/s in the Norwegian Shelf in 2008-2015 period. (Norkolje&gass, 2016)
While this pie diagram statistic shown in figure 9 may seem to suggest that human intervention is a major contributor towards hydrocarbon leaks, such an approach can
33
be too simplistic. We know that the human activity has an impact on the leak frequency but we need to understand why and what influences it.
Therefore, human elements and performance shaping factors need to be identified, modelled and analysed just like any other technical barrier function in the risk assessment process. Hence, BORA-Release (Barrier Operational and Risk analysis of Hydrocarbon release), a relatively new method, can be used to conduct qualitative and quantitative risk analysis of operator error scenarios. However, due to the complex nature of methodology, it is challenging to apply.
BORA-Release emphasizes on capturing the operational factors such as barriers and barrier elements. It assesses the contribution of operator error to hydrocarbon releases. It identifies the plant specific technical, human, operational and organisational RIFs that can affect the operator performance of an offshore installation in the operational phase. It includes only the pre-initiating events of human error. The basic building blocks of BORA methodology are Barrier Block diagram, Event Tree, Fault Tree and Influence Diagram (Sklet, Aven, Hauge, & Vinnem, 2005). Five basic barriers have been identified to setup this model. These barriers are:
• Prevent loss of containment (leak) • Prevent ignition • Reduce cloud/emissions • Prevent escalation • Prevent fatalities.
As per Sklet et al. (2005), the steps involved in conducting BORA are:
1) Develop a basic risk model- The Barrier Block diagram depicts the scenario under investigation by illustrating the effect of barriers on the event sequence and subsequently possible consequences. Scenarios and performance of barriers are analysed by Event Trees and Fault Trees respectively. Influence diagrams are further use to assess the effect of Risk Influencing Factors on the initiating events of the event trees. Since human operators are part of the barrier system, these need to be included in the barrier functions in barrier block diagram. Failure of each barrier is modelled separately by a fault tree. 2) Frequencies/probabilities of initiating events and basic events- This step quantifies the industrial averages or frequencies of all initiating events of event trees and basic events in the fault trees. Industrial average values are either calculated or assigned based on industrial/internal databases or expert judgement respectively. 3) Identification and modelling of risk influencing factors- The Risk Influencing Factors (RIF) are selected and modelled to include the offshore unit specific factors affecting the occurrence of initiating and basic events. The RIFs are chosen from generic

34
groups of human, organisational, operational, technical, administrative control RIFs and any other applicable RIF is also added where necessary. One such example of RIF diagram has been shown in figure 11.
Figure 10 Risk Influence Diagram example
4) Assessment of RIFs The RIFs are assessed to assign a scoring to each RIF depending on its status relative to the industrial average. The assessment is carried out by conducting interviews and audits at the facility or status of safety critical elements against the performance requirements or results from questionnaire survey about HSE elements. Relevant data can be retrieved from the chosen RIF assessment method and used to assign scoring to the RIFs. The RIFs are then assigned normalised weights by industrial experts by means of a discussion to compare the relative importance of RIF as per the chosen scoring scale. 5) Calculation of industry average frequencies/probabilities of initiating events and basic events The industrial averages are adjusted to suit the offshore unit specific values based on the weightage assigned to the RIFs in previous step, pertaining specifically to that facility.
(Terje Aven, Sklet, & Vinnem, 2006) Where is the revised platform specific probability of occurrence of A, is the industrial average probability of occurrence, is the weightage of the RIF and is the measure of status of RIF. needs to be calculated appropriately by making use of industrial expert assigned as the lower limit and for and as the upper limit for .
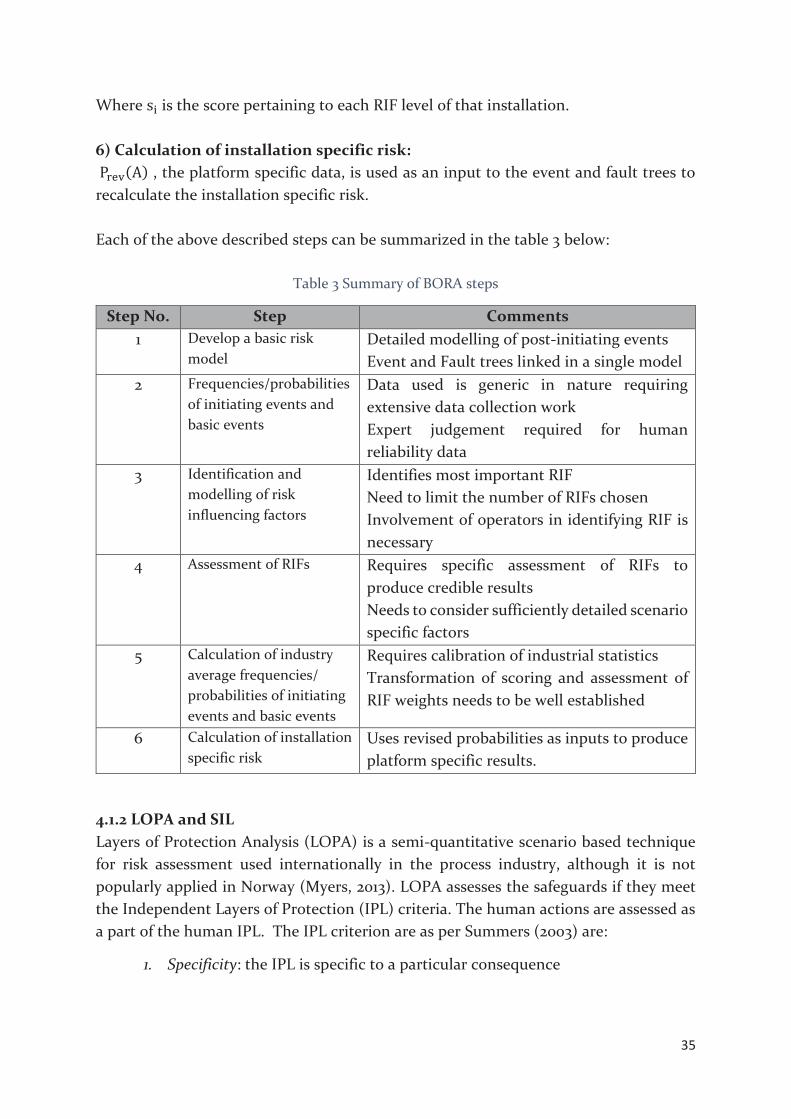
35
Where is the score pertaining to each RIF level of that installation. 6) Calculation of installation specific risk: , the platform specific data, is used as an input to the event and fault trees to recalculate the installation specific risk. Each of the above described steps can be summarized in the table 3 below:
Table 3 Summary of BORA steps
Step No. Step Comments 1 Develop a basic risk
model Detailed modelling of post-initiating events Event and Fault trees linked in a single model
2 Frequencies/probabilities of initiating events and basic events
Data used is generic in nature requiring extensive data collection work Expert judgement required for human reliability data
3 Identification and modelling of risk influencing factors
Identifies most important RIF Need to limit the number of RIFs chosen Involvement of operators in identifying RIF is necessary
4 Assessment of RIFs Requires specific assessment of RIFs to produce credible results Needs to consider sufficiently detailed scenario specific factors
5 Calculation of industry average frequencies/ probabilities of initiating events and basic events
Requires calibration of industrial statistics Transformation of scoring and assessment of RIF weights needs to be well established
6 Calculation of installation specific risk
Uses revised probabilities as inputs to produce platform specific results.
4.1.2 LOPA and SIL Layers of Protection Analysis (LOPA) is a semi-quantitative scenario based technique for risk assessment used internationally in the process industry, although it is not popularly applied in Norway (Myers, 2013). LOPA assesses the safeguards if they meet the Independent Layers of Protection (IPL) criteria. The human actions are assessed as a part of the human IPL. The IPL criterion are as per Summers (2003) are:
1. Specificity: the IPL is specific to a particular consequence

36
2. Independence: one IPL is independent to all other IPLs i.e. performance of one IPL is independent of initiating cause and is not affected by failure of another IPL
3. Dependability: the IPL reduces the identified risk by a known amount 4. Auditability: IPL permits regular periodic validation of protective function.
The LOPA aims at reducing the process risk to a given acceptable level. Usually, LOPA is done after the HAZOP review involving a multi-disciplinary team. The steps taken during LOPA as per Wei, Rogers, & Mannan (2008) are:
1. Selecting human caused pre-initiating incident scenario and its cause. These include the maintenance, testing, shutdown and other non-routine tasks.
2. Estimating the frequency of occurrence of these initiating events 3. Human IPL is identified as the people who perform the function of sensing,
deciding and taking final action. Their Probability of Failure on Demand (PFD) is estimated.
4. By combining the initiating event frequency and human IPL’s probability, the reduced frequency of occurrence is calculated by taking credit of the human IPL by introducing a corresponding reduction factor.
5. Scenario risk is estimated by combining consequence frequency and consequence severity.
6. The risk is assessed against the acceptable risk criteria level and additional IPL are applied in case the risk is unacceptable.
7. These steps are carried out for cause and consequences of all significant scenarios
LOPA is used to determine the Safety Integrity Level (SIL) of a human IPL based on its PFD.
Safety Integrity Level determination is done as an exercise of risk analysis when we need to protect our system against a specific potential hazard with the help of a safety instrumented function (Wikipedia, 2017). If the risk from the specific hazard turns out to be higher than the tolerable risk level, risk reduction needs to be done (for example: by increasing the SIL). The SIL is used for instrumentation control systems only and requires probabilistic analysis of the elements of the system. The table below in figure 12 shows the average PFD range for various SIL levels.
Figure 11 Safety Integrity Level (Iii & M., 1998)
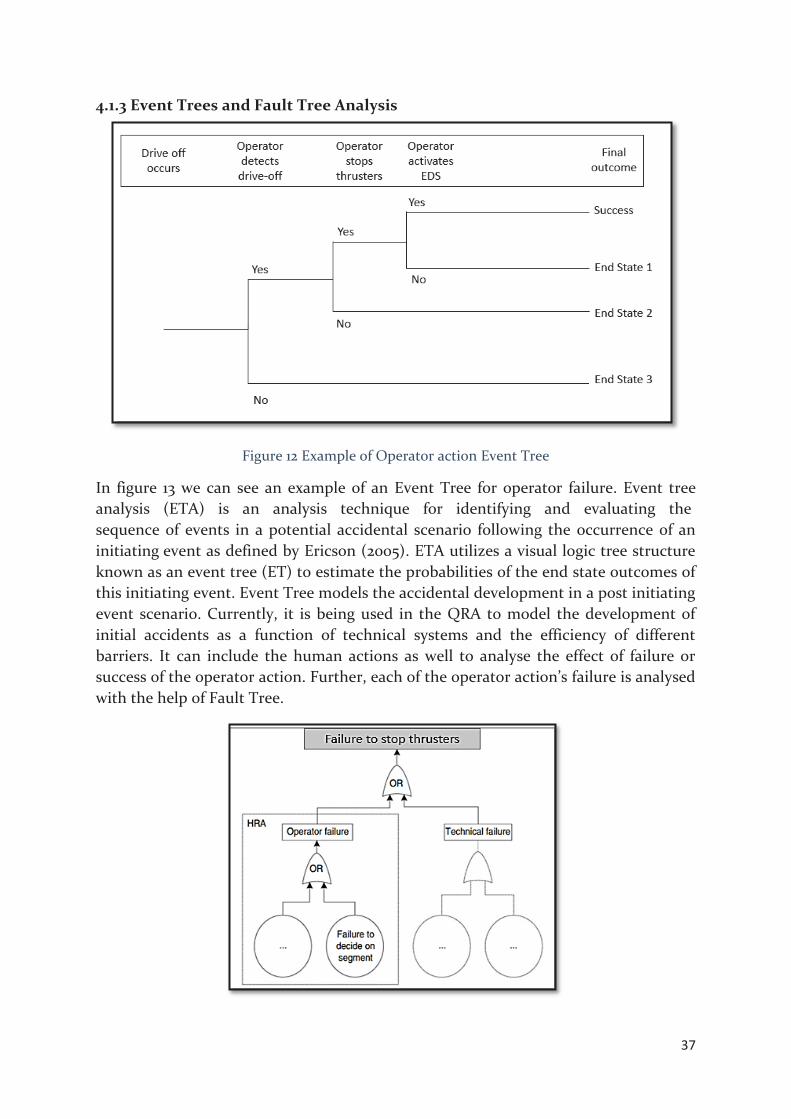
37
4.1.3 Event Trees and Fault Tree Analysis
Figure 12 Example of Operator action Event Tree
In figure 13 we can see an example of an Event Tree for operator failure. Event tree analysis (ETA) is an analysis technique for identifying and evaluating the sequence of events in a potential accidental scenario following the occurrence of an initiating event as defined by Ericson (2005). ETA utilizes a visual logic tree structure known as an event tree (ET) to estimate the probabilities of the end state outcomes of this initiating event. Event Tree models the accidental development in a post initiating event scenario. Currently, it is being used in the QRA to model the development of initial accidents as a function of technical systems and the efficiency of different barriers. It can include the human actions as well to analyse the effect of failure or success of the operator action. Further, each of the operator action’s failure is analysed with the help of Fault Tree.
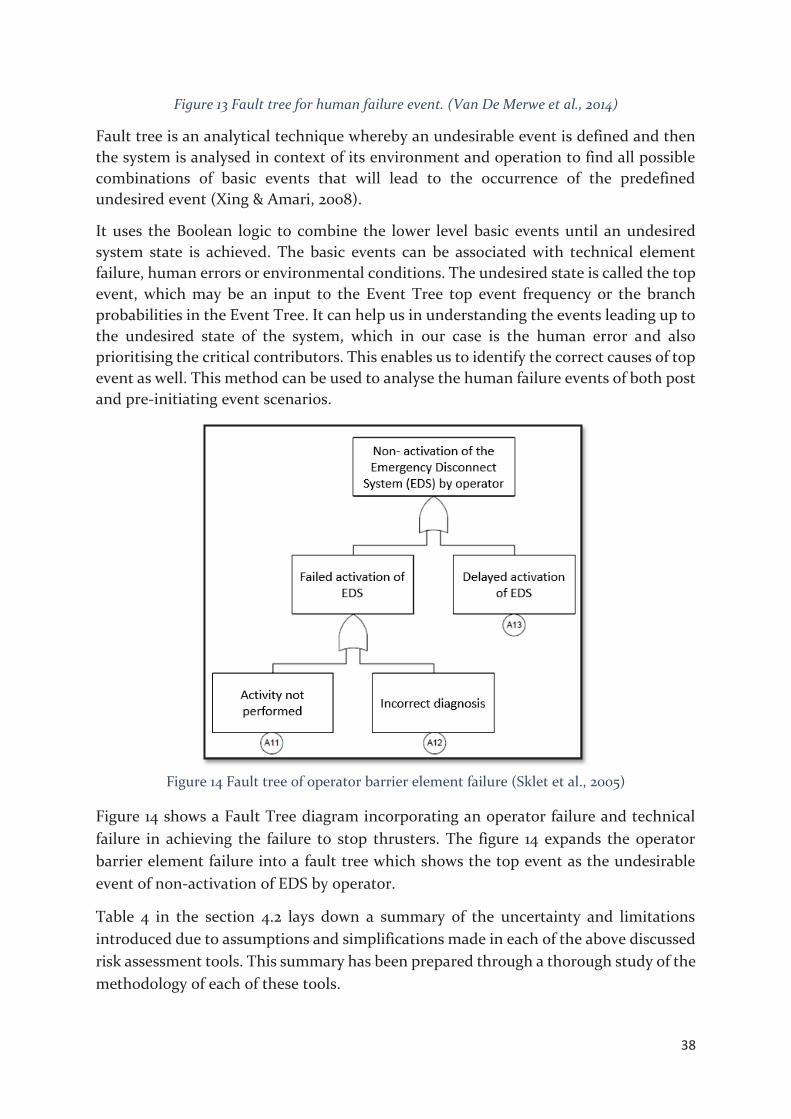
38
Figure 13 Fault tree for human failure event. (Van De Merwe et al., 2014) Fault tree is an analytical technique whereby an undesirable event is defined and then the system is analysed in context of its environment and operation to find all possible combinations of basic events that will lead to the occurrence of the predefined undesired event (Xing & Amari, 2008).
It uses the Boolean logic to combine the lower level basic events until an undesired system state is achieved. The basic events can be associated with technical element failure, human errors or environmental conditions. The undesired state is called the top event, which may be an input to the Event Tree top event frequency or the branch probabilities in the Event Tree. It can help us in understanding the events leading up to the undesired state of the system, which in our case is the human error and also prioritising the critical contributors. This enables us to identify the correct causes of top event as well. This method can be used to analyse the human failure events of both post and pre-initiating event scenarios.
Figure 14 Fault tree of operator barrier element failure (Sklet et al., 2005)
Figure 14 shows a Fault Tree diagram incorporating an operator failure and technical failure in achieving the failure to stop thrusters. The figure 14 expands the operator barrier element failure into a fault tree which shows the top event as the undesirable event of non-activation of EDS by operator.
Table 4 in the section 4.2 lays down a summary of the uncertainty and limitations introduced due to assumptions and simplifications made in each of the above discussed risk assessment tools. This summary has been prepared through a thorough study of the methodology of each of these tools.
39
4.1.4 Bayesian Network Model
K. M. Groth & Swiler (2013) have suggested a Bayesian Network (BN) Model to be applied as SPAR-H BN Model for the use of HRA practitioners. However, this method has not been focussed upon in this thesis because SPAR-H BN model is still in the research stages for specific application in the nuclear industry. It has not been framed with respect to analysing the risks in oil and gas sector. Also, it does not derive its basis from the QRA. However, since we made an attempt in the initial stages of the study to extend and develop it for application in NCS oil and gas sector, the initial thoughts on its implementation and structure have been presented in Appendix B.

40
4.2
ASS
UM
PTI
ON
S A
ND
UN
CER
TAIN
TY
Tabl
e 4
Ass
umpt
ions
and
unc
erta
intie
s re
late
d to
eac
h ri
sk a
naly
sis
met
hod
S.N
o.
Met
hod
Ass
umpt
ions
an
d M
odel
Sim
plif
icat
ion
s U
ncer
tain
ty/L
imit
atio
ns
1. BO
RA-R
elea
se
1. Ex
pert
ju
dgem
ent,
gene
ric
data
base
or
in
dust
rial
ave
rage
is
used
to
esti
mat
e th
e fr
eque
ncy
of
initi
atin
g ev
ent
occu
rren
ce
afte
r cal
ibra
tion.
2.
Max
imum
of
6 m
ost
impo
rtan
t RI
Fs a
re
allo
wed
for e
ach
even
t. 3.
Exp
ert j
udge
men
t abo
ut in
stal
lati
on sp
ecifi
c pr
obab
ility
of
fa
ilure
ev
ent
is
used
to
es
timat
e th
e sc
orin
g of
the
safe
ty le
vel.
4. A
fix
ed f
acto
r sc
ale
is u
sed
to e
xpre
ss t
he
vari
atio
ns d
ue to
RIF
’s le
vel.
1a. G
ener
ic a
ppro
ach
may
lead
to lo
sing
out
impo
rtan
t in
form
atio
n 1b
. Ope
rati
onal
ris
k an
alys
is s
houl
d be
spe
cific
to th
e in
stal
latio
n to
obt
ain
cred
ible
resu
lts
1c. W
hile
usi
ng d
ata
from
pas
t pro
ject
s, th
e ti
me
aspe
ct c
an
rend
er d
ata
outd
ated
2a
. Too
few
RIF
s m
ay o
vers
impl
ify th
e m
odel
whi
le to
o m
any
RIFs
can
mak
e th
e m
odel
com
plic
ated
and
com
plex
. 2b
. The
RIF
s m
ay n
ot b
e in
depe
nden
t of e
ach
othe
r.
3. U
ncer
tain
ty is
pre
sent
in th
e ri
sk n
umbe
rs.
4. T
he fa
ctor
sca
le m
ay b
e to
o hi
gh o
r too
low
for e
xpre
ssin
g va
riat
ions
in c
erta
in c
ases
. 5.
Som
e Pe
rfor
man
ce In
fluen
cing
Fac
tors
may
be
unkn
own
to
the
anal
yst.

41
S.N
o.
Met
hod
Ass
umpt
ions
an
d M
odel
Sim
plif
icat
ion
s U
ncer
tain
ty/L
imit
atio
ns
6. In
tent
of t
he a
sses
smen
ts p
erfo
rmed
in th
e pa
st c
an b
e qu
estio
nabl
e an
d ne
ed to
be
chec
ked
befo
re u
sing
thei
r res
ults
7.
The
bar
rier
s m
ay n
ot b
e in
depe
nden
t of e
ach
othe
r and
can
co
mpl
icat
e th
e ba
rrie
r di
agra
m.
8. B
ORA
doe
s no
t inc
orpo
rate
non
-lin
ear r
elat
ions
hips
and
fe
edba
cks
2.
LOPA
and
SIL
1.
LOPA
ass
umes
that
the
perf
orm
ance
of
hum
an IP
L is
inde
pend
ent o
f eac
h ot
her.
2.
Min
imum
num
ber o
f lay
ers
for a
cos
t -ef
fect
ive
LOPA
app
roac
h is
ass
umed
3.
Acc
epta
ble
risk
cri
teri
a is
set
up b
y th
e co
mpa
ny in
tern
ally
. 4.
The
em
erge
ncy
laye
r pro
tect
ion
cont
ribu
tion
is n
ot in
clud
ed in
the
LOPA
5.
SIL
is m
ainl
y us
ed fo
r tec
hnic
al s
afet
y sy
stem
bar
rier
s.
1. Th
e in
depe
nden
ce c
an le
ad to
unc
erta
inty
in m
itig
ated
eve
nt
freq
uenc
y es
timat
ions
. 2.
Map
ping
hig
her n
umbe
r of l
ayer
s ca
n in
crea
se c
ompl
exit
y 3a
. Ris
k ac
cept
ance
cri
teri
a de
term
inat
ion
can
hide
un
cert
aint
ies.
3b
. Acc
epta
ble
risk
may
not
be
repr
esen
tati
ve a
nd a
dequ
ate
of
the
situ
atio
n un
der
asse
ssm
ent.
4. R
educ
ed re
liabi
lity
of L
OPA
resu
lts.

42
S.N
o.
Met
hod
Ass
umpt
ions
an
d M
odel
Sim
plif
icat
ion
s U
ncer
tain
ty/L
imit
atio
ns
5a.
SIL
can
not b
e ap
plie
d to
the
risk
ana
lysi
s of
hum
an b
arri
er
perf
orm
ance
due
to th
e ne
ed o
f rel
iabi
lity
esti
mat
es b
ased
on
prob
abili
stic
ana
lysi
s.
5b. I
t fai
ls w
hen
appl
ied
to a
com
plex
sys
tem
.
3.
Even
t Tre
es
and
Faul
t Tr
ees
1. A
ll ev
ents
are
ass
umed
to b
e m
utua
lly
excl
usiv
e.
2. F
ailu
re is
ass
umed
to o
ccur
at a
con
stan
t ra
te.
3. F
ault/
even
t tre
e is
con
stru
cted
bas
ed o
n th
e kn
owle
dge
of th
e sy
stem
exp
erts
. 4.
Pro
babi
listi
c ri
sk a
sses
smen
t met
hods
1. C
omm
on c
ause
dep
ende
ncy
may
be
negl
ecte
d.
2. T
he c
onst
ant f
ailu
re r
ate
assu
mpt
ion
can
unde
rest
imat
e or
ov
eres
tim
ate
the
risk
. 3a
. Mis
sing
out
a s
igni
fican
t cau
se a
ffect
ing
the
even
t/fa
ilure
ca
n le
ad to
hig
her u
ncer
tain
ties
abo
ut th
e an
alys
is re
sult
s.
3b. T
hese
s bo
ttom
up
dedu
ctiv
e m
etho
ds a
re n
ot s
uita
ble
for
findi
ng o
ut a
bout
all
the
poss
ible
init
iatin
g fa
ults
. 4.
Pro
babi
lity
may
hid
e un
cert
aint
ies.
5.
Doe
s no
t con
side
r mul
tiple
failu
res
at a
tim
e an
d th
eir e
ffect
s at
the
syst
em le
vel w
hich
can
lead
to u
nder
esti
mat
ed fa
ilure
ra
tes.
6.
Par
tial s
ucce
ss/f
ailu
re is
not
dis
ting
uish
able
.
43
4.3 DISCUSSION ON THE ABILITY TO ANALYSE HUMAN PERFORMANCE
BORA-Release
The BORA-Release risk assessment method is used for analysing the Type-A human errors which are caused by the pre-initiating events. The QRA scope requires analysing both the post and pre-initiating event scenarios. Historically, the oil and gas industry has analysed the causes more simplistically (e.g. use of generic data) and focussed more on the assessment of the event’s consequences. BORA can fit well in this context as it can help in improving the cause assessment under QRA.
However, the main challenge of the BORA-Release methodology is the complexity of the method. As we have mentioned in the description of BORA-Release methodology, it depends on a generic database and industrial averages for assessment which are adjusted to plant specific estimates based on expert judgement. The expert judgement can introduce uncertainty in the analysis due to its subjective nature. Also, the fixed scale used for expressing the variations introduced due to RIF levels, may not express uncertainty adequately due to the binary nature of data. Moreover, the scoring system usually requires subjective interpretations of operator responses. It is also required to estimate large number of probabilistic values, gather many data inputs and does not guide enough about the level of detail we need to achieve during assessment. Lastly, the responses gathered from industrial experts reinstated the fact that the BORA-Release method is hard to apply due to the complex methodology of analysis which can be time consuming and detailed. Therefore, we can conclude that BORA-Release may not be suitable for capturing and analysing human performance.
LOPA and SIL
The LOPA and SIL methodology together are mainly used for analysing the human IPL for its performance in a human initiated pre-initiating events scenario. However, as per our QRA focus of assessing the human performance in a post-initiating event scenario may not be a human initiated event. The estimation and validation of PFD of a human IPL is a difficult task due to the need for plant specific data. Although, there are many generic sources available for human IPL, they are more representative of the process industry which has gathered a large database until now. Using this data for analysis in oil and gas industry may reduce the data reliability. (Myers, 2013) states that the companies may take too much credit of the human IPL while re-estimating the reduced human initiated event frequency which may result in an over-optimistic estimate. Also, adding an additional Safety Instrumented System may lead to the problem of moral hazard of the operator performance, which is not accounted for in the LOPA analysis results. This also raises questions on the justification of independent property of human IPL. The LOPA study breakdowns in case of complex scenarios with more dependencies.
44
Finally, applying the generic data to plant specific cases can lead to invalid results. All these, factors make LOPA and SIL as a poor choice of technique to analyse human performance in HRA framework.
Event Tree and Fault Tree Analysis
Application of both these methods can be used for analysing the human performance in post-initiating event scenario. The FTA can also be used for pre-initiating events. They are widely applied analysis due to their ability to breakdown any human failure event into a series of sub-events contributing to it. However the fault tree may not reveal the true underlying cause of the human error. For overcoming this there is a need for subject matter expert. It can also become too large and complex if the fault tree is extremely comprehensive. However, the fault tree can be modelled with the help of a software once it has been applied sufficient number of times to gain confidence in this technique. In spite of the shortcomings such as neglecting common cause dependency, inability to handle multiple failures at a time and assuming constant failure rates, they can be used to analyse the human performance in a post-initiating event scenario because of the ease of understanding, application, using qualitative and quantitative data, updating and communicating results, programming them into a software and introducing improvements in analysis technique as more and more expertise is gained.
Hence, the ETA and FTA are most suitable choice of risk analysis method among all the other methods discussed for analysing human performance in a post-initiating event scenario of HRA. Their application in the Petro-HRA framework for conducting HRA has also been discussed in subsequent chapters.
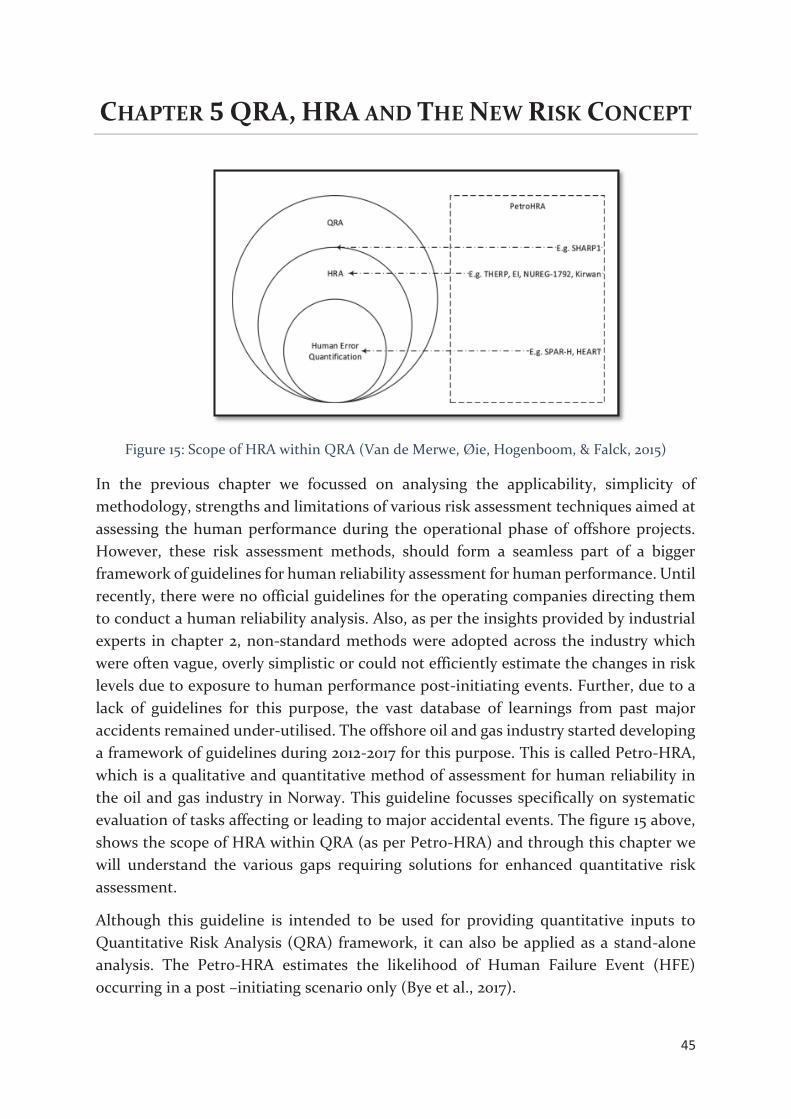
45
CHAPTER QRA, HRA AND THE NEW RISK CONCEPT
Figure 15: Scope of HRA within QRA (Van de Merwe, Øie, Hogenboom, & Falck, 2015)
In the previous chapter we focussed on analysing the applicability, simplicity of methodology, strengths and limitations of various risk assessment techniques aimed at assessing the human performance during the operational phase of offshore projects. However, these risk assessment methods, should form a seamless part of a bigger framework of guidelines for human reliability assessment for human performance. Until recently, there were no official guidelines for the operating companies directing them to conduct a human reliability analysis. Also, as per the insights provided by industrial experts in chapter 2, non-standard methods were adopted across the industry which were often vague, overly simplistic or could not efficiently estimate the changes in risk levels due to exposure to human performance post-initiating events. Further, due to a lack of guidelines for this purpose, the vast database of learnings from past major accidents remained under-utilised. The offshore oil and gas industry started developing a framework of guidelines during 2012-2017 for this purpose. This is called Petro-HRA, which is a qualitative and quantitative method of assessment for human reliability in the oil and gas industry in Norway. This guideline focusses specifically on systematic evaluation of tasks affecting or leading to major accidental events. The figure 15 above, shows the scope of HRA within QRA (as per Petro-HRA) and through this chapter we will understand the various gaps requiring solutions for enhanced quantitative risk assessment.
Although this guideline is intended to be used for providing quantitative inputs to Quantitative Risk Analysis (QRA) framework, it can also be applied as a stand-alone analysis. The Petro-HRA estimates the likelihood of Human Failure Event (HFE) occurring in a post –initiating scenario only (Bye et al., 2017).
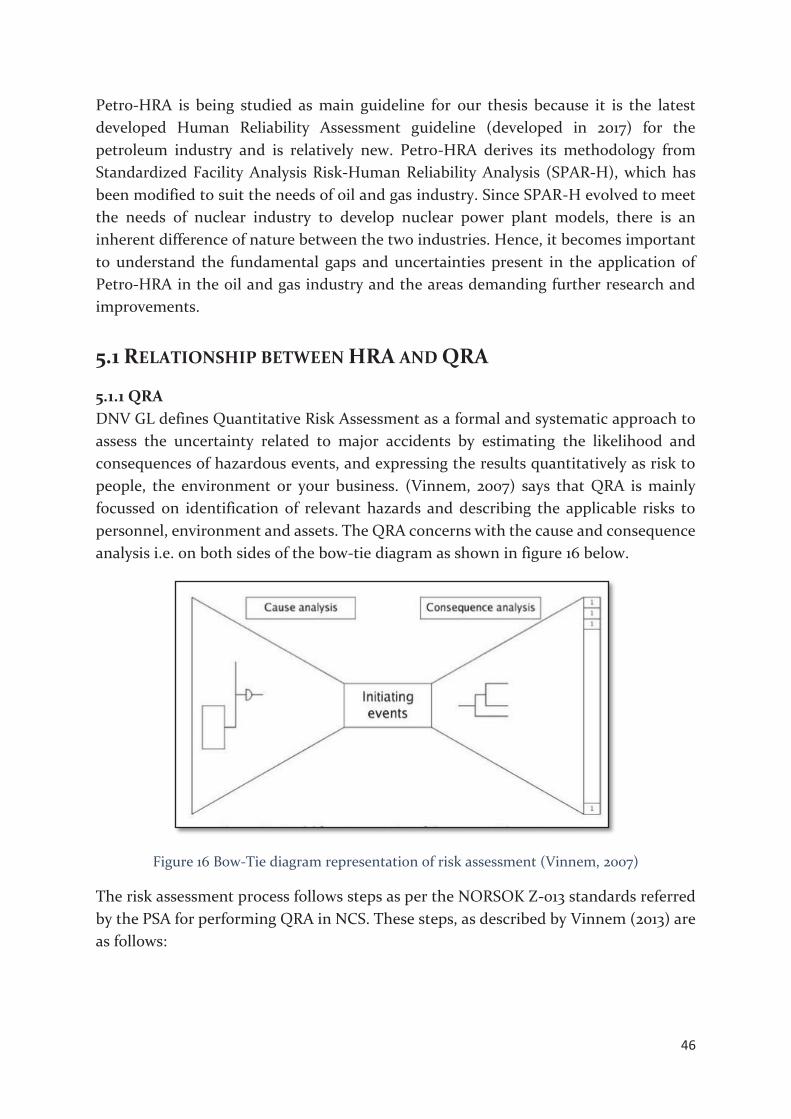
46
Petro-HRA is being studied as main guideline for our thesis because it is the latest developed Human Reliability Assessment guideline (developed in 2017) for the petroleum industry and is relatively new. Petro-HRA derives its methodology from Standardized Facility Analysis Risk-Human Reliability Analysis (SPAR-H), which has been modified to suit the needs of oil and gas industry. Since SPAR-H evolved to meet the needs of nuclear industry to develop nuclear power plant models, there is an inherent difference of nature between the two industries. Hence, it becomes important to understand the fundamental gaps and uncertainties present in the application of Petro-HRA in the oil and gas industry and the areas demanding further research and improvements.
5.1 RELATIONSHIP BETWEEN HRA AND QRA
5.1.1 QRA DNV GL defines Quantitative Risk Assessment as a formal and systematic approach to assess the uncertainty related to major accidents by estimating the likelihood and consequences of hazardous events, and expressing the results quantitatively as risk to people, the environment or your business. (Vinnem, 2007) says that QRA is mainly focussed on identification of relevant hazards and describing the applicable risks to personnel, environment and assets. The QRA concerns with the cause and consequence analysis i.e. on both sides of the bow-tie diagram as shown in figure 16 below.
Figure 16 Bow-Tie diagram representation of risk assessment (Vinnem, 2007)
The risk assessment process follows steps as per the NORSOK Z-013 standards referred by the PSA for performing QRA in NCS. These steps, as described by Vinnem (2013) are as follows:
47
1. Establishing the Context: Establishing the context means defining the basic frame conditions within which risk must be managed and it sets the scope for the rest of the risk management process. The context includes the interface between organisation’s internal and external environment and the purpose of the risk management activity (T. Aven & Vinnem, 2007). Additionally, a suitable decision criteria as well as the structure of carrying out risk assessment is also defined.
2. Identification of initiating events- It requires that all possible hazards and initiating events should be captured for subsequent analysis. This involves the use of HAZOP study, past accidental statistics and data, experienced professionals expert guidance.
3. Cause analysis: This step analyses the initiating events captured in the previous step for their causes and probability of occurrence. The qualitative techniques like HAZOP, Preliminary Hazard Analysis (PHA), BORA, Fault Tree Analysis (FTA), Failure Mode and Effect Analysis (FMEA) and Human error analysis technique like Hierarchical Task Analysis or Error Mode Analysis are utilized for analysing the causes and their combinations responsible for initiating events.
After carrying out the qualitative cause analysis, the quantitative cause analysis is done to estimate the probability of occurrence of initiating events through Monte Carlo Simulation, historical statistical data and Human Error quantification techniques. These provide us with the frequency of occurrence of initiating events which are utilized in the subsequent steps.
4. Modelling of accidental sequence- Modelling the accidental sequences falls in the consequence side of the bow-tie presentation diagram. The sequence of occurrence of series of steps and timing of the sequence needs to be modelled carefully as they define the various possibilities of escalation of initiating event into a full blown major accident. Also, whether these sequence of steps develop into a full blown major accident or not, is a function of the performance and capacity of the safety barriers. Because of this, the ETA needs to accurately reflect these, which makes it an important part and also one of the challenges of QRA technique. Also while modelling of the accidental sequence, the QRA should incorporate the technical, organisational and operational barrier elements accurately. ETA, Cause- Consequence diagram and Influence Diagrams are commonly used tools for analysis of the accidental sequence.
While most of the times only technical barrier elements are included in the QRA study, the operational elements barriers like human and organisational factors (HOF) are equally important to be analysed during the course of the study because they are the last line of defence in the system and can either prevent or escalate the chain of accidental events. This where the HRA plays its role in making the QRA a comprehensive risk assessment technique by analysing the operational barrier elements
48
as well. For example, in the event of hydrocarbon leak in an offshore installation, by analysing the operator performance (operational barrier element) in activating the pressure shutdown valve along with the reliability of the leak detector (technical barrier element), the QRA can achieve a comprehensive risk assessment of the scenario.
5. Consequence analysis- The oil and gas industry focusses heavily on analysing the fire and explosion loads related to hydrocarbon leaks, blowouts, smoke and toxic releases. This is done by using Computational Fluid Dynamics (CFD), physical model testing and structural response analysis of accidental loads. These estimate various release rates, probabilities of ignitions and explosion, overpressure, conditional probabilities of fatalities, damage to equipment and structures, fire size and smoke impact estimates.
6. Risk calculation, Analysis and Assessment- After conducting the consequence analysis in previous step, the outcomes are compared against the risk acceptance criteria set by the operating company and in case it is found unacceptable, additional risk reducing measures are employed to bring the risk calculation to acceptable level as per the ALARP evaluation.
5.1.2 Significance of HRA
Aligns with goal of QRA
HRA is aimed at identifying the potential human failure events and estimating the probability of their occurrence based on models, data or expert judgement. The objective of HRA is in line with the primary objective of QRA which aims at achieving a similar goal but on a bigger level with respect to overall potential hazards capable of producing unwanted damage and losses. Traditionally the QRA have focussed on the technical barriers more but now with the support of HRA, the QRA will be able to assess the operational barriers better.
Helps in taking risk informed decision making
In the operational phase, quantitative risk assessment should enable the management to take risk-informed decisions relating to prioritizing and coordinating tasks often guided by changing risk picture. Since, human performance can influence the risk level both negatively and positively, the Human reliability assessment falls within the scope of Quantitative risk assessment because the human operational barrier element can have a direct impact on the risk level.
Human performance affecting major accidents
The impact of human performance can be further established from the major accident study already done in Chapter 3, where we can take learnings from disasters like Deepwater Horizon, Piper Alpha, Montara oil spill accident, Texas City pipeline

49
explosion, etc. This lays emphasis on the need for utilizing past learning from these accidents to take adequate measures for enhancing the reliability of human performance, for which HRA can form an excellent building block.
Under represented human performance in QRA studies
As mentioned by Van de Merwe et al. (2015), until now the QRA has accounted for human performance contribution towards major accident risk only up to a limited extent despite the requirements in risk assessment standards such as NORSOK Z-013 and ISO 17776. Also the risk assessment methods developed currently focus on pre-initiating event errors of the operator (for example BORA method studied in previous Chapter 4), while the QRA focus on the post-initiating human error events. This mismatch of scope can be bridged with the help of HRA methodology.
5.2 INTEGRATION OF HRA WITH QRA
Based on all the reasons specified above, the Petro-HRA (Bye et al., 2017), is primarily aimed at aligning the relation of HRA with QRA at various levels such that it produces results that can be used as inputs to QRA event tree models and aid in the process of making risk informed decisions. The figure below shows the interaction between HRA and QRA at various steps. Studying these integration steps in detail will allow us to uncover various gaps present in the current Petro-HRA methodology which can be improved with the help of new digital techniques. Figure 17 shows the Petro-HRA methods for carrying out Human Reliability Assessment while Figure 18 shows the elements of offshore QRA methodology. The solid red arrows show the input/output links between QRA and HRA while the dashed lines represent the iterative nature of steps.

50
Figu
re 18
QRA
met
hodo
logy
for o
ffsho
re in
dust
ry (V
inne
m, 2
007)
Fi
gure
17 P
etro
-HRA
met
hod
step
s an
d in
tegr
atio
n w
ith Q
RA (P
SA, 2
016)
51
5.2.1 Establishing context The integration of HRA begins by establishing the context such that the HRA produces valid Human Error Probability (HEP) estimates that are relevant and representative of the Human Failure Events (HFEs) being analysed in the QRA. Bye et al. (2017) defines HFE as basic event in the plant response model that represents a failure or unavailability of a piece of equipment, system, or function that is caused by human inaction or inappropriate action. For this purpose, as is suggested by the above figures, the QRA establishes the HFEs as inputs to the HRA to facilitate the scenario description.
5.2.1 Establishing the context Establishing the context, which is also the first QRA step as per the NORSOK standard, specifically lays out the need to understand the effects of operator performance on the system safety. The context also helps in limiting the scope and objective of the HRA. The HFE established in the QRA context should supply the HRA analyst relevant information such as QRA model, underlying assumptions, barriers present in the system, initiating events and its sequence, estimated timeline, etc. The analyst can then use all this information in the subsequent steps of the HRA to model human errors and provide feedback to the QRA. Thus, the human failure event is the first point of integration between the QRA and HRA.
Another point to be noted is the two headed nature of the red arrow connecting the QRA and HRA. This reflects that although the context of HFEs are determined by the QRA, they can be modified by the HRA based on its feedback from the task analysis, human error identification or human error modelling. This empowers the HRA to reorganise and evolve the QRA when the need arises.
5.2.2 HEP as Input to QRA After the task analysis and human error modelling of the scenarios defined by the HFEs, the second important point of integration between QRA and HRA is the output of the human error quantification step. This step quantifies the human error as the Human Error Probability (HEP). As per Bye et al. (2017), the HEP is defined as a measure of the likelihood that plant personnel will fail to initiate the correct, required, or specific action or response in a given situation or by commission perform the wrong action or in other words it is the numerical probability of the human failure event. This HEP is often time dependent and related to the required operator action, is used by the QRA as an input to its various risk analysis model (example: Event Trees) dedicated to analysing the critical risks being affected by the relevant human failures.
5.2.3 Suggesting recommendations The final integration point is at the last step where the HRA can suggest recommendations to the installation management to achieve human error reduction

52
measures based on its analysis results. The recommendations can be used as input to define performance requirements for technical systems or safety critical operations. These can be taken into consideration by the decision makers to effectively introduce risk informed decision making.
5.3 HRA WITHIN THE NEW RISK CONCEPT PERSPECTIVE After studying the integration points of HRA and QRA methods, we will study the relevance of HRA within the new risk concept perspective. The new risk perspective has been presented in Chapter 1 and now we will study the Petro-HRA guidelines for HRA to see how well it conforms to the new risk perspective.
5.3.1 Need for the new risk perspective The following points sum up the need to assess the HRA guidelines with respect to the new risk perspective which adds value to the risk analysis process by highlighting the gaps and uncertainties present which may not be communicated effectively to the decision makers during decision-making process otherwise.
Helps in identifying assumptions, simplifications and choices made
The new risk concept can be viewed as a top down approach that begins with a broad outlook and narrows down to a more restricted focus to certain aspects of the risk. It is a breakdown of the risk definition of uncertainty of consequences into four levels such that each level helps us in identifying the uncertainty introduced as we are progressing ahead with the risk analysis process. Such a hierarchical decomposition of risk ensures that that a comprehensive risk assessment is achieved.
Bridges gaps between probability based and uncertainty based risk definition The probability based risk definition is often criticised for its narrow outlook towards uncertainty and inability to convey the strength of knowledge aspect of the assessment. While the uncertainty based definition is employed at the first level of the hierarchy, the combination of consequence and probability based definition is employed at the third level and finally the expected probability based definition is employed at the fourth level. In this way the new risk concept tries to bridge this age old gap between uncertainty and probability by emphasizing the need of control on the effect of simplifications made through each level.
Identify model error introduced The risk model is a more simplified representation of the real world. It tries to phase out the complexities present in the real world to ease the process of analysing our system of interest. However, this simplification introduces uncertainties in the results of the analysis. Phasing out certain aspects from the scope of assessment does not remove the associated risks in the reality and hence, the new risk perspective identifies
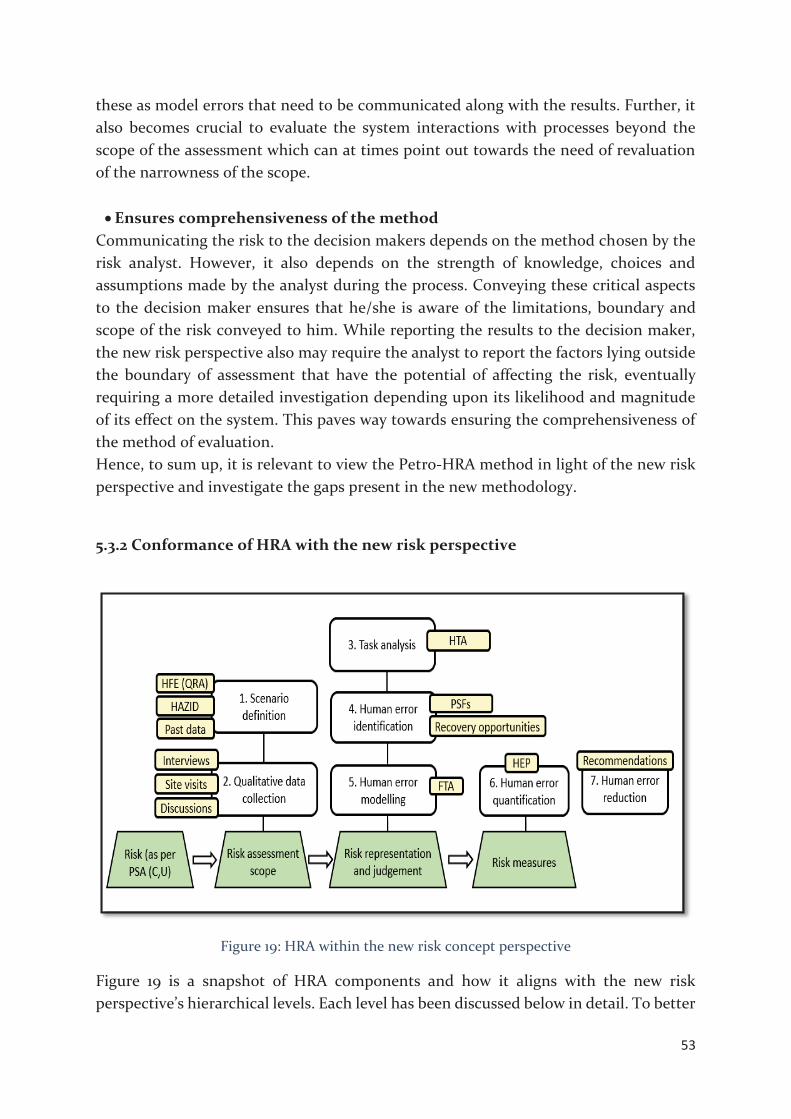
53
these as model errors that need to be communicated along with the results. Further, it also becomes crucial to evaluate the system interactions with processes beyond the scope of the assessment which can at times point out towards the need of revaluation of the narrowness of the scope.
Ensures comprehensiveness of the method Communicating the risk to the decision makers depends on the method chosen by the risk analyst. However, it also depends on the strength of knowledge, choices and assumptions made by the analyst during the process. Conveying these critical aspects to the decision maker ensures that he/she is aware of the limitations, boundary and scope of the risk conveyed to him. While reporting the results to the decision maker, the new risk perspective also may require the analyst to report the factors lying outside the boundary of assessment that have the potential of affecting the risk, eventually requiring a more detailed investigation depending upon its likelihood and magnitude of its effect on the system. This paves way towards ensuring the comprehensiveness of the method of evaluation. Hence, to sum up, it is relevant to view the Petro-HRA method in light of the new risk perspective and investigate the gaps present in the new methodology.
5.3.2 Conformance of HRA with the new risk perspective
Figure 19: HRA within the new risk concept perspective
Figure 19 is a snapshot of HRA components and how it aligns with the new risk perspective’s hierarchical levels. Each level has been discussed below in detail. To better

54
understand each of these steps at the four risk levels, we will take the help of an example presented as a case study in the Petro-HRA guideline. The case study is related to the drive off of a semi-submersible drilling unit.
Example: Drive off of a semi-submersible Drilling Unit.
The drilling unit is located in Norwegian Continental Shelf in shallow waters. The unit maintains its position above the wellhead with the help of Dynamic Positioning (DP) system that autonomously control a set of thrusters as shown in the figure 20. The dynamic positioning system receives its positional inputs from Differential Global Positioning System and Hydro-acoustic Position Reference System. In addition to this, the operator is present in the Main Control Room as a human barrier who monitors the system at all times and takes emergency actions when required.
For our example, it has been assumed that the drilling unit drifts off from its designated position due to some unknown dynamic positioning system failure leading to the initiation thrusters that drift off the drilling unit and ultimately raises specific alarms. The operator is then required to read the situation and stop the thrusters and eventually initiate the Emergency Disconnect Sequence (EDS) for disconnecting the riser from the Blowout Preventer (BOP).
Figure 20 Dynamic positioning drilling operation (Bye et al., 2017)
The role of the human operator in stopping the thrusters is critical with respect to time. This is because any unbearable delay or failure to stop the thrusters can lead to an increase in steepness of the riser angle, which may no longer be safely cut-off from the BOP. Further, the shallow water constraints the detection time available to the operator and position recovery time available to the system.
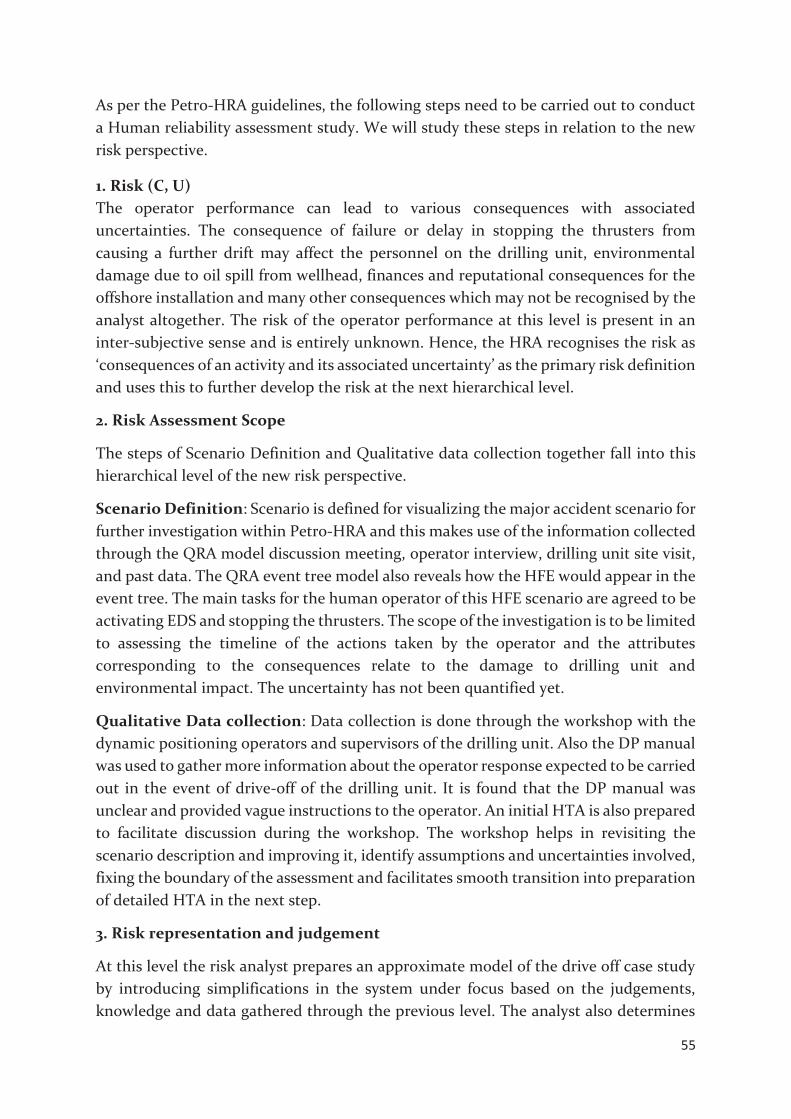
55
As per the Petro-HRA guidelines, the following steps need to be carried out to conduct a Human reliability assessment study. We will study these steps in relation to the new risk perspective.
1. Risk (C, U) The operator performance can lead to various consequences with associated uncertainties. The consequence of failure or delay in stopping the thrusters from causing a further drift may affect the personnel on the drilling unit, environmental damage due to oil spill from wellhead, finances and reputational consequences for the offshore installation and many other consequences which may not be recognised by the analyst altogether. The risk of the operator performance at this level is present in an inter-subjective sense and is entirely unknown. Hence, the HRA recognises the risk as ‘consequences of an activity and its associated uncertainty’ as the primary risk definition and uses this to further develop the risk at the next hierarchical level.
2. Risk Assessment Scope
The steps of Scenario Definition and Qualitative data collection together fall into this hierarchical level of the new risk perspective.
Scenario Definition: Scenario is defined for visualizing the major accident scenario for further investigation within Petro-HRA and this makes use of the information collected through the QRA model discussion meeting, operator interview, drilling unit site visit, and past data. The QRA event tree model also reveals how the HFE would appear in the event tree. The main tasks for the human operator of this HFE scenario are agreed to be activating EDS and stopping the thrusters. The scope of the investigation is to be limited to assessing the timeline of the actions taken by the operator and the attributes corresponding to the consequences relate to the damage to drilling unit and environmental impact. The uncertainty has not been quantified yet.
Qualitative Data collection: Data collection is done through the workshop with the dynamic positioning operators and supervisors of the drilling unit. Also the DP manual was used to gather more information about the operator response expected to be carried out in the event of drive-off of the drilling unit. It is found that the DP manual was unclear and provided vague instructions to the operator. An initial HTA is also prepared to facilitate discussion during the workshop. The workshop helps in revisiting the scenario description and improving it, identify assumptions and uncertainties involved, fixing the boundary of the assessment and facilitates smooth transition into preparation of detailed HTA in the next step.
3. Risk representation and judgement
At this level the risk analyst prepares an approximate model of the drive off case study by introducing simplifications in the system under focus based on the judgements, knowledge and data gathered through the previous level. The analyst also determines

56
the uncertainties associated with parameters of his model and strength of knowledge. The task analysis, human error identification and human error modelling fall into this risk level.
Figure 21 HTA analysis for drive off case study (Bye et al., 2017)
Task analysis:
Figure 21 shows the Hierarchical Task Analysis done by the risk analyst, which has been derived from the case study of Petro-HRA guidelines, based upon the knowledge gathered previously and makes certain assumptions while doing this. After the workshop certain uncertainties in the HTA were removed and more details were added to HTA. As mentioned in the case study presented in the Petro-HRA guidelines, the HTA lists down each step in the drive off scenario that should be carried out by the operator and the tasks have been broken down to their basic level. A further decomposition beyond this level would not add any value to the analysis. The HTA was charted into a tabular form to add further details regarding the assumptions and uncertainties, details of Human-Machine Interface, person responsible for each step.
This Figure 22 Time line analysis of drive-off scenario (PSA, 2016)
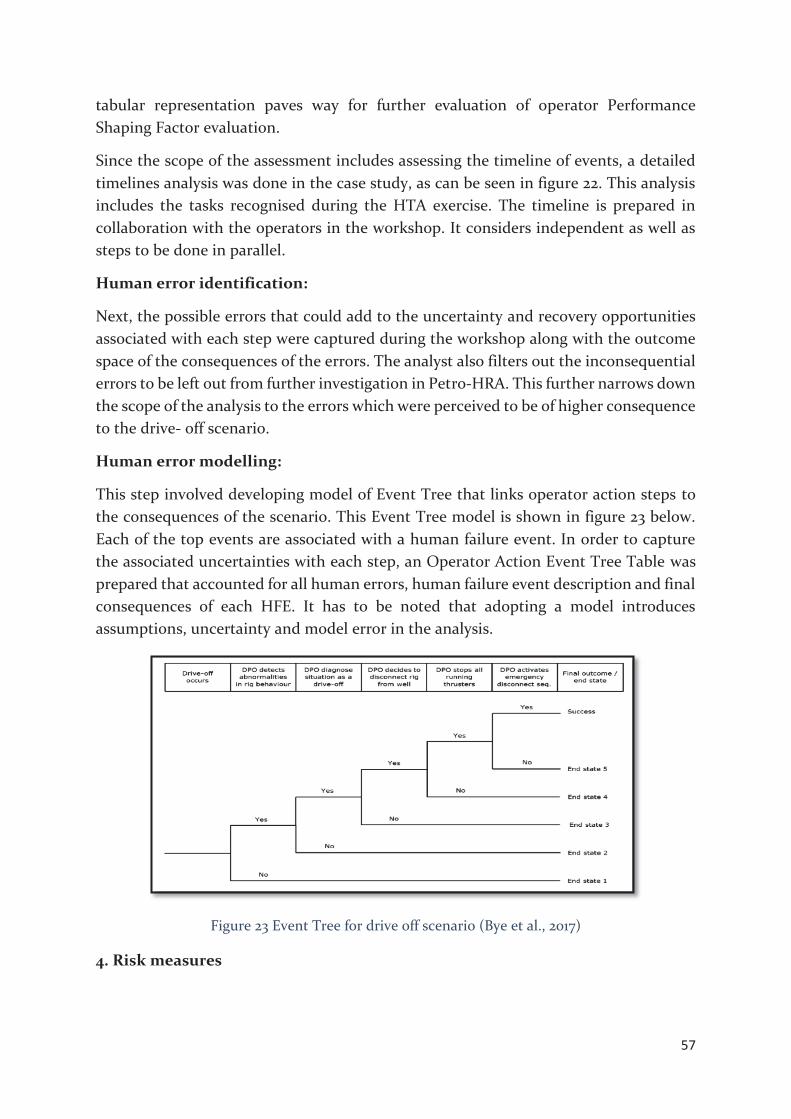
57
tabular representation paves way for further evaluation of operator Performance Shaping Factor evaluation.
Since the scope of the assessment includes assessing the timeline of events, a detailed timelines analysis was done in the case study, as can be seen in figure 22. This analysis includes the tasks recognised during the HTA exercise. The timeline is prepared in collaboration with the operators in the workshop. It considers independent as well as steps to be done in parallel.
Human error identification:
Next, the possible errors that could add to the uncertainty and recovery opportunities associated with each step were captured during the workshop along with the outcome space of the consequences of the errors. The analyst also filters out the inconsequential errors to be left out from further investigation in Petro-HRA. This further narrows down the scope of the analysis to the errors which were perceived to be of higher consequence to the drive- off scenario.
Human error modelling:
This step involved developing model of Event Tree that links operator action steps to the consequences of the scenario. This Event Tree model is shown in figure 23 below. Each of the top events are associated with a human failure event. In order to capture the associated uncertainties with each step, an Operator Action Event Tree Table was prepared that accounted for all human errors, human failure event description and final consequences of each HFE. It has to be noted that adopting a model introduces assumptions, uncertainty and model error in the analysis.
Figure 23 Event Tree for drive off scenario (Bye et al., 2017)
4. Risk measures
58
This level summarizes the result of the model with the help of a suitable risk measure (Example: Fatal Accidental Rate (FAR), Potential Loss of Life (PLL), Individual risk (IR), etc.). However, it requires quantification of the risk measure before that which is done through Human error quantification step, which has been described below.
Human error quantification:
Jonkman, van Gelder, & Vrijling (2003) define risk measure as a mathematical function of the probability of an event and the consequences of that event. It should be able to reflect the strength of knowledge to provide a complete risk picture. The risk analysts use the Human Error Probability as the risk measure to convey the uncertainty associated with the operator performance and it is conditional on the Event Tree developed in the previous level.
Figure 24 HEP calculation step for each HFE. (Bye et al., 2017)
For estimating the human error probability, PSFs captured in the previous level were analysed separately for each human failure event. The Petro-HRA methodology says that each PSF is multiplied with a corresponding multiplier for that HFE as shown in figure 24. The motivation for choosing a specific multiplier was also recorded. Further to nominalize the HEP value, it was multiplied with nominal HEP 0.01 as shown in the figure 19. This HEP was recorded in the Operator Action Event Tree and updated the event tree.
5.3.3 Conclusion Following points have become evident from the discussion above:
The Petro-HRA adopts the uncertainty based definition of risk as per the first level of risk perspective.
The Petro-HRA also defines the scope of the analysis, characteristics of consequences and limits the consequences of interest as per the second level of the new risk perspective. It does so by gathering information and data from all possible sources available then.
59
The Petro-HRA prepares a model of the Operator action as Failure Tree model based upon the HTA conducted in the previous level. The model involves estimating parameters, introducing assumptions and simplifications. However, the Petro-HRA is unable to quantify the uncertainty associated with the estimates of the risk model, model inputs and outputs. It is also not clear how the Petro-HRA critically analyses the assumptions. The model at this level tries to capture uncertainty with the help of probability alone which does not reflect the strength of knowledge. Thus, we can say that the Petro-HRA falls short of complying with the third level of the new risk perspective.
At the last level, the Petro-HRA makes use of HEP to convey the uncertainty associated with the human performance. However, this is a discrete value which may hide errors of estimation, epistemic uncertainties, model errors on which it is conditional. It is a purely probabilistic measure which needs to be supported with the strength of knowledge aspect as well. Since it is a discrete value it may be easy to communicate but does not provide as much information as a continuous distribution function can. The gaps in conforming to the fourth risk level of the new risk perspective also need to be filled.
As a conclusion we may say that, the Petro-HRA complies with the first two levels of the new risk perspective, however, it needs to be developed further to address the uncertainty in analysis and conform to the third and fourth risk level.
5.4 MODELLING HFE
5.4.1 Modelling HFE with QRA The following points provide an insight into the ability of QRA in modelling Human Failure Events:
1. Traditionally, the QRA does not model the human failure event in detail. In fact it does not provide sufficient guidance for understanding the human performance and its effect on the overall risk level.
2. The risk assessment methods available (for example: BORA, LOPA, SIL) mainly focus on pre-initiating events as opposed to the post-initiating event focus of the QRA.
3. The QRA most of the time considers only the technical barriers with little or no recognition given to the human and organisational barriers in spite of their significant role in some of the major accidents in the history of oil and gas industry all over the world. It also points out to the under-utilization of the past learnings from major accidental events.
4. Even if the human barriers are included in the assessment studies, the human performance has always been viewed as a source of uncertainty that affects the overall risk level negatively only. Such a negative perspective about the human performance prevents us from looking at the human operator performance as a defence barrier

60
which has the capacity of also preventing the initiating event to escalate into a major accident.
5. From the case study of the drilling rig drive-off scenario, it was seen that the original branch of the Event Tree in QRA, did not model the scenario in detail. Further, it also combined the tasks of ‘closing the BOP’ and ‘disconnecting the riser’ into a single operator action. This shows that it did not model the operator action task with adequate detail. This would give rise to a rather crude analysis of a critical scenario and lead to underestimated results hiding uncertainties.
It can be concluded that the traditional QRA does not adequately model HFEs and does not provide clear guidelines for doing so in its framework.
5.4.2 Modelling HFE as per Petro-HRA guidelines In order to address the shortfalls in modelling HFE in QRA, the Petro-HRA provides with detailed guidelines for this purpose. The following points highlight the features of improved HRA guidelines in modelling the HFEs.
1. The Petro-HRA guides the risk analyst to make use of the expert knowledge, workshops, direct interaction with control room operators and documental reviews to breakdown the operator tasks to cognitive and physical sub-steps in the HTA that are truly representative of the actual scenario in a post initiating event.
2. The quantitative data collection step specifically helps the analyst to gather all the relevant data that can help him in building his model precisely and justify his choices and assumptions. Also, the systematic documentation of the data enables the analyst to trace back any non-conformities in the analyses at any point of time.
3. The HFE modelled in the HRA no longer combine two significant sub steps into a single branch of the event tree model. This brings into light the significance and importance of the steps which would have been overlooked otherwise in the original Event Tree of the QRA.
4. By making use of the experience and knowledge of the operator and supervisors, the analyst can identify the Performance Shaping Factors that can affect the human performance positively or negatively. This ensures that human involvement and human performance in the operational phase is also viewed as a consequence reducing barrier that is also capable of preventing an accident from growing. Therefore, the HFEs are established in the appropriate context and in line with the QRA scope of post-initiating event analysis.
5. The HRA also focusses on only a few relevant scenarios from the vast spectrum of HFEs that can take place at the installation. This limits the scope of the assessment and allows the analyst to focus exclusively on a few critical events only.
6. The HRA also identifies the external factors such as the operating environment, physical layout of the plant, atmospheric conditions, geographical location, etc. and their impact on the human performance. The detailed analysis may further reveal overlooked aspects of the poorly described scenario under investigation.
61
7. Since, all the subsequent steps in the HRA will be affected by level of detail to which the task analysis has been carried out, the HEP estimation will depend on the HFEs and their description.
All the above mentioned points point out towards the improvements in modelling HFEs that can be achieved by incorporating the HRA guidelines in the QRA assessment. However, there also certain uncertainties present in the HRA methodology that need to be highlighted and addressed. These uncertainties have been presented in the subsequent section.
5.4 DATA REQUIREMENTS Dougherty (1997) says that human performance or the events deemed as human errors must be at least partially stochastic in nature or otherwise a quantitative HRA may not be possible. This human performance produces random chance events called human failure events, whose variability is significantly observable. Such a process is called stochastic and therefore we can say that HRA requires that this stochastically variable process to be captured within a mathematical framework. However developing such a mathematical framework purely by the way of expert judgement may not be accurate or fully representative. It needs to be supplemented by quantitative and qualitative data. The HRA requires data at various stages and these have been presented below:
1. Fundamental to establishing the basis of human error and its estimation, the data requirement is a necessary prerequisite. The significant emphasis on describing the ‘context’ while carrying out HRA gives rise to the demand for detailed tasks. This has also been highlighted in the Petro-HRA guidelines where the first step of establishing the context of HFEs is followed by the need for data collection.
2. As Kirwan, Gibson, & Hickling (2008) mention, the SPAR-H methodology focusses on the PSF approach where the scenarios are assessed keeping in mind how these PSFs can affect the human reliability. This method makes use of key PSFs in human error assessment and error reduction techniques. This requires reliance on a combination on expert judgement and data about these scenarios from industrial sources.
3. The quantification of human error correctly and comprehensively is based upon identifying the errors in the first place. To achieve this, the Petro-HRA recommends the SHERPA (Embrey, 1986) error taxonomy for human error identification. This taxonomy allows structured evaluation of error modes, consequences, recovery opportunities and PSFs (Bye et al., 2017). This also requires data to estimate the likelihoods and probability calibrations.
4. Development of risk model requires an understanding of the system in terms of the dynamics involved and the task complexity which is directly dependent of the data available specific to the industry and the critical tasks.

62
5. The risk model needs to be calibrated and tested against the real world scenario to assess its prediction accuracy and reduce the model uncertainty. This points out to the data quality and its relevance. The generic data may not be useful directly in such cases and may require normalizing to achieve results that are representative and plant specific.
6. Simulation techniques such as Monte Carlo simulations have become popular over time because they help in overcoming the problem associated with using generic data and can be manipulated to suit the customized requirements. However, they are also heavily dependent on data to begin with. This data can be captured through the real-time investigation and data collection of the operator performance by means of sensors and logical controllers.
Because of this heavy requirement and reliability on quality data that is usable and helps in ensuring the estimation accuracy of risk models, the HRA suffers from the problem of lack of availability of enough data. Further, one will also require advanced estimation techniques to be able to use such data once it becomes available. This provides us with excellent opportunity to make use of digital technology to find solutions to our data related problems.
5.5 DISCUSSION ON HRA GUIDELINES After discussing at length about all the benefits that can be achieved by incorporating the Petro-HRA guidelines in the QRA analysis study, we shift our focus towards the uncertainties and limitations associated with Petro-HRA guidelines that requires attention.
5.5.1 Practical Limitations The following practical limitations have been identified while carrying out the HRA as per Petro-HRA guidelines:
1. Data availability: The Petro-HRA faces one of the biggest practical limitation in terms of data availability. Since the Petro-HRA is a fairly new framework of guidelines, it will take some time before an adequate mechanism is setup in place that maintains a database that captures and updates data regularly.
2. Data Updating: The QRA is usually conducted at all phases of the project starting from the design phase with changing level of granularity, there is a possibility that the choices, assumptions and simplifications underlying the QRA/HRA assessment that were valid initially may no longer be justified through the course of the assessment. This may happen because of certain system changes and design deviations that may be encountered during the actual operational phase. This calls for the need of a more frequent updating of the QRA assessments which may not feasible without the use of digital solutions.
63
3. Data Quality: Along with the lack of availability of data, the Petro-HRA also suffers from the problem of ensuring the data quality. In order to get accurate estimations and develop models that are a close representation of the real world HFEs installation specific data is required. Also ensuring the reliability and quality of this data is a big challenge currently because of lack of a homogenous and robust reporting mechanism across the industry.
4. Underutilized data: As it was observed in chapter 3 that the PSA requires all companies to report incidents of injury and accidents to it for the RNNP project, the data actually reported may be far less than the actual observations. In turn, the companies maintain a larger installation specific databases that is underutilised and not shared within the industry. This underutilised database has a huge potential to be used for the HRA analysis and can help in developing improved models if employed adequately. However, gaining access to this database is a practical limitation in itself that may need to be addressed sometime in the future and currently it falls beyond the scope of this study report.
5.5.2 Uncertainties in modelling HFEs The following uncertainties were found in the Petro-HRA methodology:
1. Testing criticality of assumptions: The Petro-HRA guideline requires the risk analyst to report the justification of assumptions, choices and simplifications to be documented systematically at each step and reported along with the results of the analysis to the decision maker. However, there is no clear guideline and emphasis on testing the criticality of these assumptions that may change over time and have an impact on the risk numbers.
2. Quantification of model uncertainty: The structure of the risk model developed for capturing the HFE may hide uncertainties that need to be captured in the form of model error. The Petro-HRA does not guide enough in this aspect which is critical to the new risk perspective and can lead to underestimation of model results. Moreover, the model parameters are also accompanied by epistemic uncertainties due to the lack of knowledge of the risk analyst or lack of data. This also needs to be captured in the model error, which is currently lacking in the Petro-HRA guideline.
3. Model Input and Output uncertainty: Any model is as good as the reliability of its input. In other words, the principle of ‘Garbage in and Garbage out’ needs to be kept in mind while choosing the model inputs and model structure. The Petro-HRA method has been incorporated from the SPAR-H method developed long back for the nuclear industry that has a sufficiently large developed database by now to evaluate its model inputs and outputs for uncertainty. However, the same model structure and choice of inputs and output parameters may not be usable by Petro-HRA to be applied in oil and gas industry and will need a solid framework which guides the analyst to capture this uncertainty.

64
4. Strength of Knowledge assessment: The strength of knowledge is critical to justifying the validity of results and choices incorporate during the analysis. While Petro-HRA reports the uncertainty only as probability, it does not suitably assess the strength of knowledge aspect adequately.
5. Multiplier defined as a step function: The multipliers of the corresponding PSFs are crucial in estimating the HEP which captures the risk associated with human performance. The HRA approach is based on the non-linear time dependence of risk such that the risk of human error increase with time in a non-linear fashion. This forms the fundamental behind deciding the shape of the curve of PSFs. However contrary to this, the multipliers are defined as a step function which may increase or decrease suddenly at the particular boundary value of that range and remains constant at all value throughout that range. This problem of increased uncertainty is due to the discrete nature of multipliers which are reflected in the HEP estimations.
6. Choice and Inter-dependence of PSFs: The human error modelling assumes that the PSFs are independent of each other and have no effect on each other. However, this assumption can cost the analysis heavily in terms of uncertainty of results. It can be logically deduced that PSFs may be dependent on each other. For example, after the alarm, that notifies the operator of initiation of a drive off scenario, has been raised automatically the operator may experience stress. This stress is dependent on the time available to operator to take emergency actions and increases as the available time decreases. Hence, assuming that the stress PSF is independent of time can lead to misleading value of HEP.
7. Model testing: Model testing is a step in any assessment because it ensures the relevance of the model in fulfilling the objective of the assessment. A model testing ensures that the model error fall within acceptable range and that the results can be used for decision making with sufficient confidence. Model testing also helps in providing feedback for improvement of model structure, parameter relationships and model precision, subsequently opening up a way to test the model assumptions regularly as well. However, the Petro-HRA does not throw light on this aspect of model testing.
It may not be possible to address these limitations and uncertainties of Petro-HRA guidelines all at once because of the guideline being developed quite recently and requiring a more developed structure in place before it can be altered for improvement.
However, it is possible to address some of these limitations by making use of digital solutions and these have been targeted in the following chapter.
65
CHAPTER IMPROVING HRA WITH DIGITAL
SOLUTIONS In the previous chapter we studied the Petro-HRA guidelines for human reliability assessment. We also know that the Petro-HRA has been adopted from the SPAR-H methodology developed for the nuclear industry and this has been modified to suit the needs for oil and gas industry. After discussing the improvements that can be achieved by applying HRA integrated QRA we also found certain limitations and uncertainties associated with the Petro-HRA guidelines. We will begin this section by understanding what is meant by digital solutions and how they can benefit us. Later we will move on to look at the challenges and limitations which we will try to solve with the help of digital solutions. Finally we will discuss the framework of an improved Multiplier Model as the digital solution, its benefit and challenges for solving the limitation in HRA guideline.
6.1 INTRODUCTION TO DIGITAL SOLUTIONS As mentioned by Aron (2012), Digital Strategy is a form of strategic management and a business answer or response to a digital question. Digital Solutions are a part of the digital strategy that is often characterised by the application of new technologies to existing activity with a focus on enabling new capabilities in the existing business. The process of adopting the digital solution is called digitisation. There have been numerous advancements in digital technologies in the form of broadband connectivity, wireless mobility, cloud computing, sensors, etc.
Friedrich, Gröne, Koster, & Merle (2011) say that there are various ways in which an industry can achieve digitization such as digitized industrial transactions, digital platforms/ tools for improving the internal value chain, digitized industrial output for better delivery of products and services and fundamental infrastructure (example: computing abilities, connectivity, etc.) supporting all the above.
Shaw (2014) says that the computing power currently doubles every 18 months which enables us to solve a problem thousand times faster than conventional methods ever can. The advanced computer algorithms replace the need for acquiring expensive machinery to handle large amount of data. Further, the advanced methods available to link the datasets coupled with creative data visualisation techniques enable humans to see hidden data patterns, find associations, analyse huge datasets, etc. like never before.
Unsurprisingly, using this similar technology, giants like Amazon and Netflix are able to suggest purchase suggestions for each individual customer by studying the purchasing pattern and behaviours. However, the biggest breakthrough comes in the
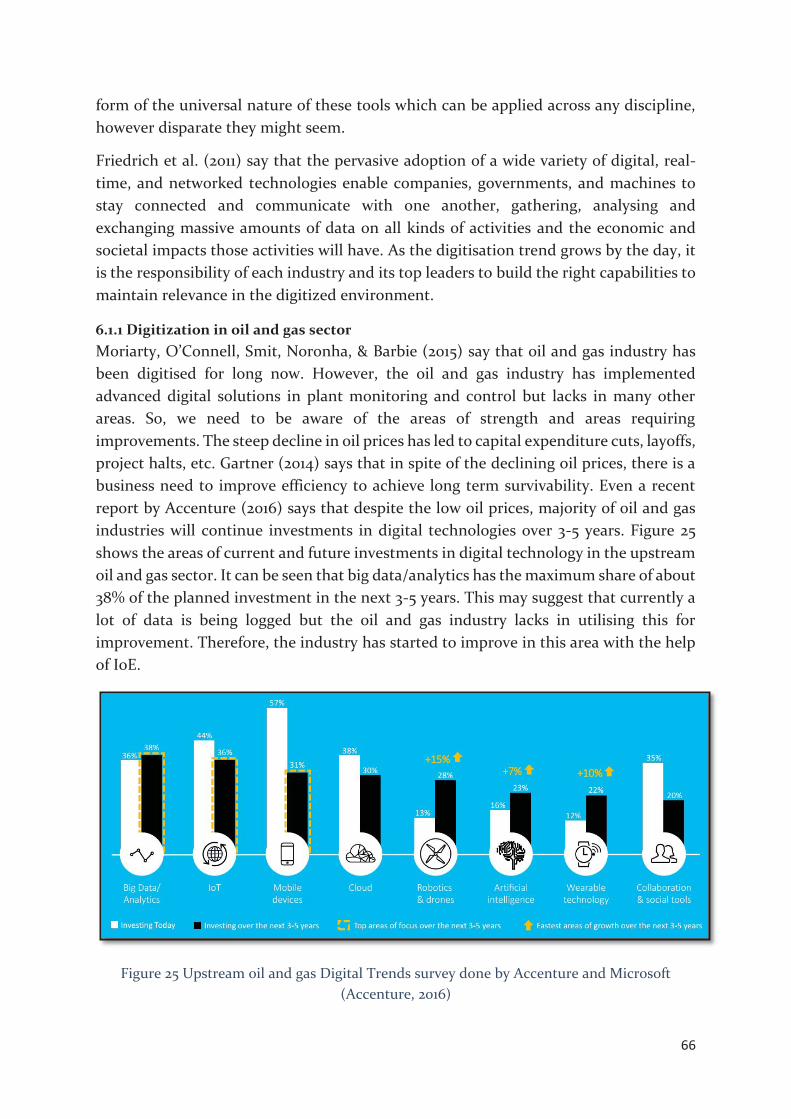
66
form of the universal nature of these tools which can be applied across any discipline, however disparate they might seem.
Friedrich et al. (2011) say that the pervasive adoption of a wide variety of digital, real-time, and networked technologies enable companies, governments, and machines to stay connected and communicate with one another, gathering, analysing and exchanging massive amounts of data on all kinds of activities and the economic and societal impacts those activities will have. As the digitisation trend grows by the day, it is the responsibility of each industry and its top leaders to build the right capabilities to maintain relevance in the digitized environment.
6.1.1 Digitization in oil and gas sector Moriarty, O’Connell, Smit, Noronha, & Barbie (2015) say that oil and gas industry has been digitised for long now. However, the oil and gas industry has implemented advanced digital solutions in plant monitoring and control but lacks in many other areas. So, we need to be aware of the areas of strength and areas requiring improvements. The steep decline in oil prices has led to capital expenditure cuts, layoffs, project halts, etc. Gartner (2014) says that in spite of the declining oil prices, there is a business need to improve efficiency to achieve long term survivability. Even a recent report by Accenture (2016) says that despite the low oil prices, majority of oil and gas industries will continue investments in digital technologies over 3-5 years. Figure 25 shows the areas of current and future investments in digital technology in the upstream oil and gas sector. It can be seen that big data/analytics has the maximum share of about 38% of the planned investment in the next 3-5 years. This may suggest that currently a lot of data is being logged but the oil and gas industry lacks in utilising this for improvement. Therefore, the industry has started to improve in this area with the help of IoE.
Figure 25 Upstream oil and gas Digital Trends survey done by Accenture and Microsoft (Accenture, 2016)
67
Internet of Everything (IoE) is a networked connection of people, process, data and things that uses the power of internet to improve the business and industry outcomes (Banafa, 2016). In a report by Moriarty et al. (2015) which summarizes the findings of a recent survey conducted by CISCSO, highlights that the oil and gas leaders believe that there is a data deluge created by the Internet of Everything. In order to achieve maximum business and operational advantage, the companies need to improve the implementation of IoE by getting more and better data to make the most out of the connected technologies. Therefore, the leaders named data as the number one driver of the IoE investment. Such a view of the industry during a time when companies are competing at low oil prices, points towards an emphasis on escalating development in data analytics via IoE in the future. Therefore, it is possible to harness all the advantages of IoE only if the processes are digitised and automated.
The oil and gas sector can benefit from using data analytics and digital technology for assessing the human performance, identify/reduce uncertainties in analysis and use it for human error reduction step for enhancing the overall system safety. In our study we will be focussing on digitisation of data collection process and applying data analytics techniques to assess the human performance in the post-initiating events of oil and gas industry. This will set a foundation for future capability building, business advantage, operational efficiency and achieving better human reliability assessment.
6.2 DEVELOPMENT OF AN IMPROVED SOLUTION In this section, we will see how we can address the gaps in Petro-HRA discussed previously by developing a new digital solution. We start by highlighting the challenges and gaps in the present methodology and their effect on the assessment. Then we will move on to specifying the assumptions and simplifications which will be used to build our Multiplier Model under the digital solution.
6.2.1 Problems being addressed In chapter 5 we saw, that the Petro-HRA guideline for conducting a Human Reliability Assessment that aims at integrating with the QRA by providing input to its Event Tree model. The initial scenario description table of the HFEs defined by the QRA, captures the clarifying assumptions, uncertainties, boundaries of scenario, potential human errors, consequences of errors and PSFs. The HFEs are assessed in the HRA by beginning with creating a HTA. The HTA is expanded by adding details from data gathered during workshops, interviews and operator response and decomposing it into certain number of sub-levels as is justified as being sufficient by the analyst. Before applying the multiplier model as a digital solution we will discuss the gaps in the current Petro-HRA methodology so as to identify the specific gaps that require attention.
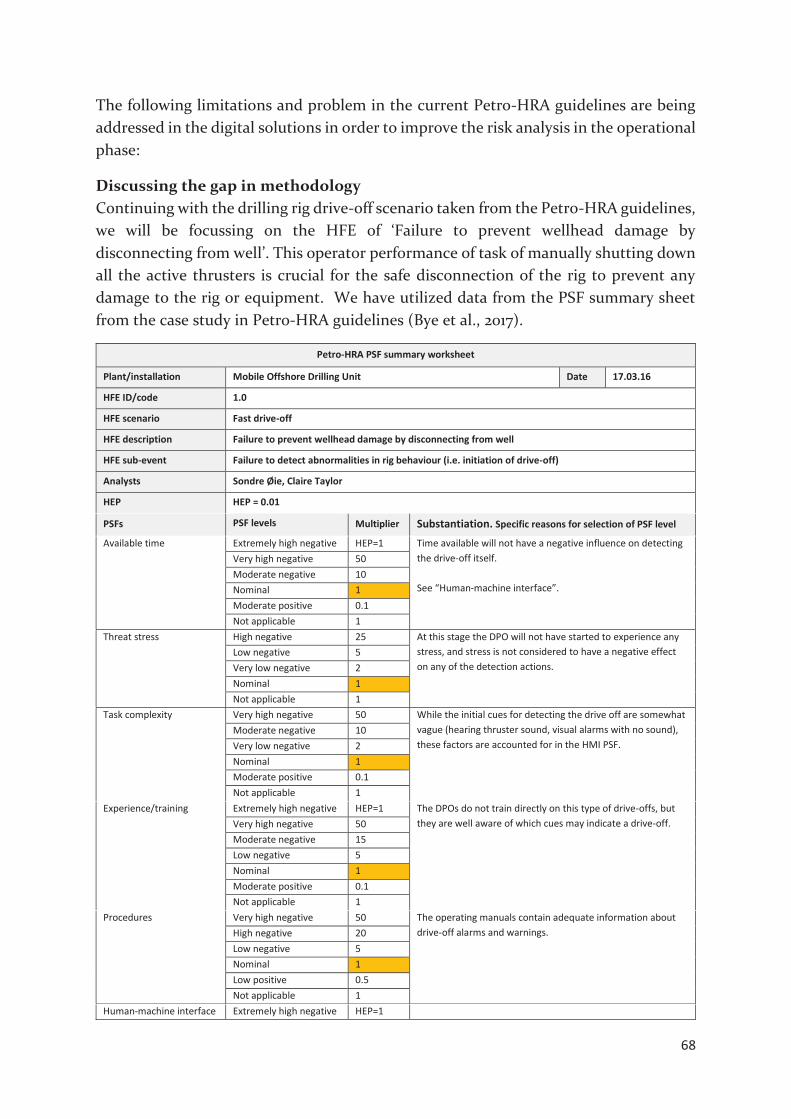
68
The following limitations and problem in the current Petro-HRA guidelines are being addressed in the digital solutions in order to improve the risk analysis in the operational phase:
Discussing the gap in methodology Continuing with the drilling rig drive-off scenario taken from the Petro-HRA guidelines, we will be focussing on the HFE of ‘Failure to prevent wellhead damage by disconnecting from well’. This operator performance of task of manually shutting down all the active thrusters is crucial for the safe disconnection of the rig to prevent any damage to the rig or equipment. We have utilized data from the PSF summary sheet from the case study in Petro-HRA guidelines (Bye et al., 2017).
Petro-HRA PSF summary worksheet
Plant/installation Mobile Offshore Drilling Unit Date 17.03.16
HFE ID/code 1.0
HFE scenario Fast drive-off
HFE description Failure to prevent wellhead damage by disconnecting from well
HFE sub-event Failure to detect abnormalities in rig behaviour (i.e. initiation of drive-off)
Analysts Sondre Øie, Claire Taylor
HEP HEP = 0.01
PSFs PSF levels Multiplier Substantiation. Specific reasons for selection of PSF level
Available time Extremely high negative HEP=1 Time available will not have a negative influence on detecting the drive-off itself. See “Human-machine interface”.
Very high negative 50 Moderate negative 10 Nominal 1 Moderate positive 0.1 Not applicable 1
Threat stress High negative 25 At this stage the DPO will not have started to experience any stress, and stress is not considered to have a negative effect on any of the detection actions.
Low negative 5 Very low negative 2 Nominal 1 Not applicable 1
Task complexity Very high negative 50 While the initial cues for detecting the drive off are somewhat vague (hearing thruster sound, visual alarms with no sound), these factors are accounted for in the HMI PSF.
Moderate negative 10 Very low negative 2 Nominal 1 Moderate positive 0.1 Not applicable 1
Experience/training Extremely high negative HEP=1 The DPOs do not train directly on this type of drive-offs, but they are well aware of which cues may indicate a drive-off. Very high negative 50
Moderate negative 15 Low negative 5 Nominal 1 Moderate positive 0.1 Not applicable 1
Procedures Very high negative 50 The operating manuals contain adequate information about drive-off alarms and warnings. High negative 20
Low negative 5 Nominal 1 Low positive 0.5 Not applicable 1
Human-machine interface Extremely high negative HEP=1
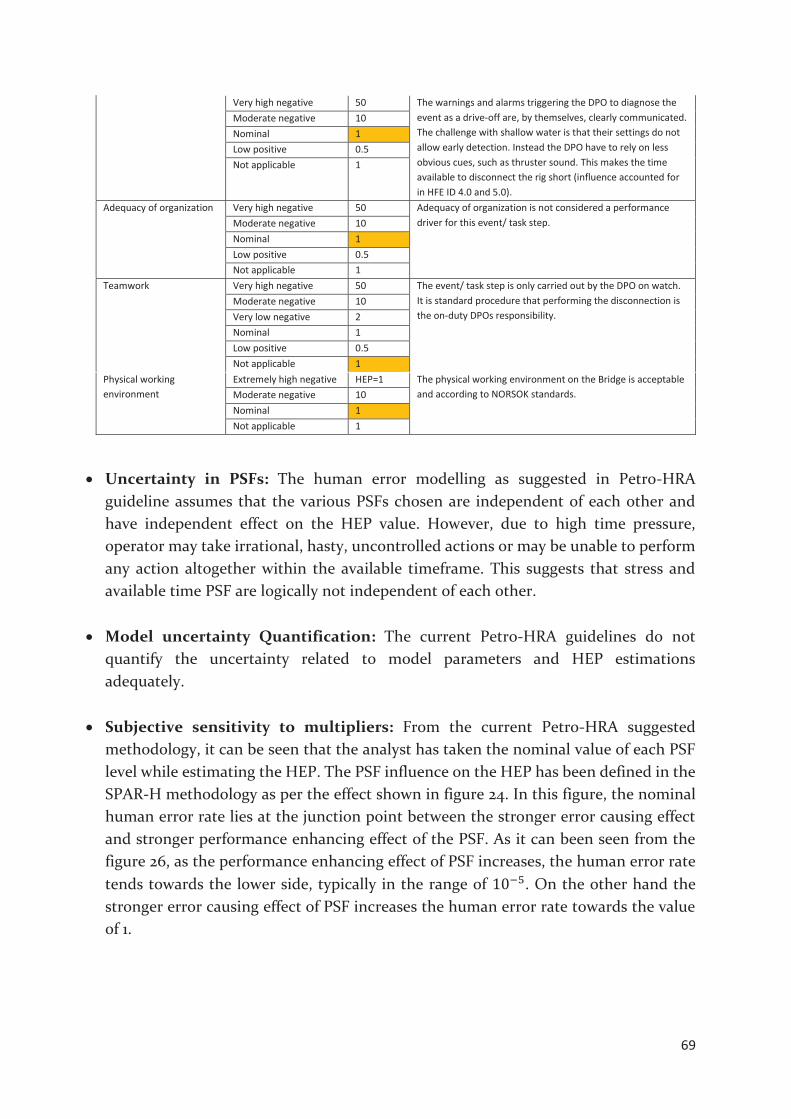
69
Very high negative 50 The warnings and alarms triggering the DPO to diagnose the event as a drive-off are, by themselves, clearly communicated. The challenge with shallow water is that their settings do not allow early detection. Instead the DPO have to rely on less obvious cues, such as thruster sound. This makes the time available to disconnect the rig short (influence accounted for in HFE ID 4.0 and 5.0).
Moderate negative 10 Nominal 1 Low positive 0.5 Not applicable 1
Adequacy of organization Very high negative 50 Adequacy of organization is not considered a performance driver for this event/ task step. Moderate negative 10
Nominal 1 Low positive 0.5 Not applicable 1
Teamwork Very high negative 50 The event/ task step is only carried out by the DPO on watch. It is standard procedure that performing the disconnection is the on-duty DPOs responsibility.
Moderate negative 10 Very low negative 2 Nominal 1 Low positive 0.5 Not applicable 1
Physical working environment
Extremely high negative HEP=1 The physical working environment on the Bridge is acceptable and according to NORSOK standards. Moderate negative 10
Nominal 1 Not applicable 1
Uncertainty in PSFs: The human error modelling as suggested in Petro-HRA guideline assumes that the various PSFs chosen are independent of each other and have independent effect on the HEP value. However, due to high time pressure, operator may take irrational, hasty, uncontrolled actions or may be unable to perform any action altogether within the available timeframe. This suggests that stress and available time PSF are logically not independent of each other.
Model uncertainty Quantification: The current Petro-HRA guidelines do not quantify the uncertainty related to model parameters and HEP estimations adequately.
Subjective sensitivity to multipliers: From the current Petro-HRA suggested methodology, it can be seen that the analyst has taken the nominal value of each PSF level while estimating the HEP. The PSF influence on the HEP has been defined in the SPAR-H methodology as per the effect shown in figure 24. In this figure, the nominal human error rate lies at the junction point between the stronger error causing effect and stronger performance enhancing effect of the PSF. As it can been seen from the figure 26, as the performance enhancing effect of PSF increases, the human error rate tends towards the lower side, typically in the range of . On the other hand the stronger error causing effect of PSF increases the human error rate towards the value of 1.
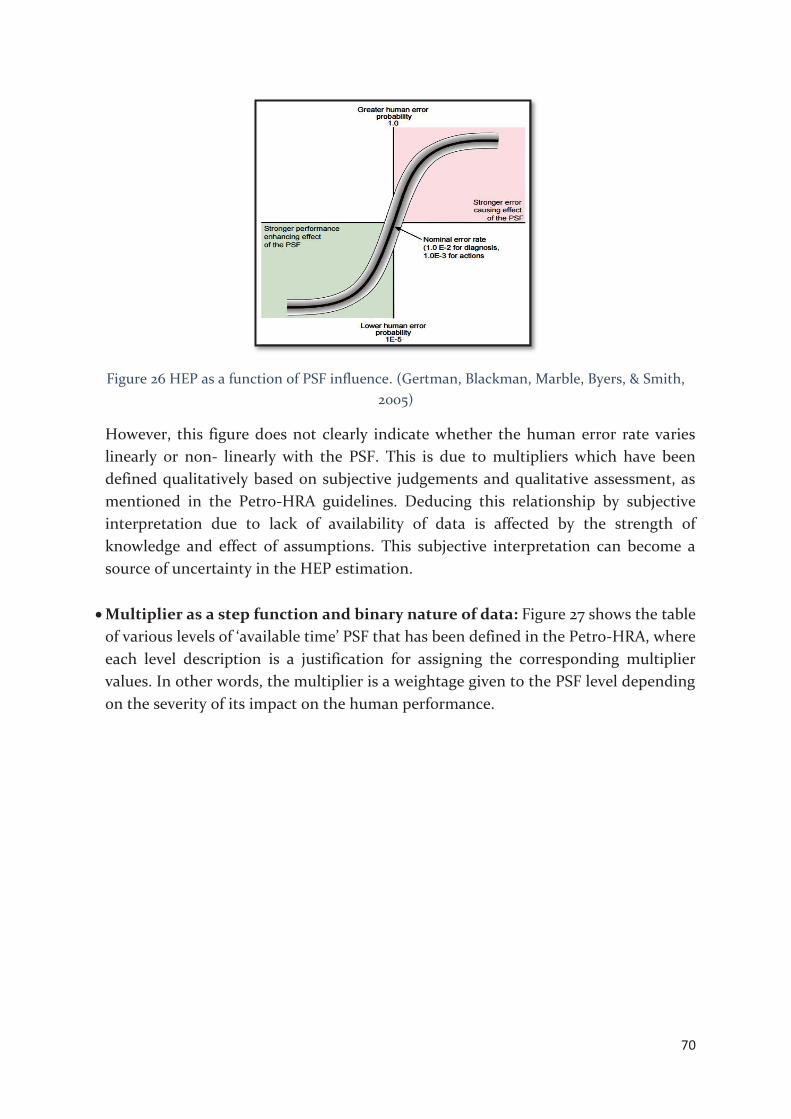
70
Figure 26 HEP as a function of PSF influence. (Gertman, Blackman, Marble, Byers, & Smith, 2005)
However, this figure does not clearly indicate whether the human error rate varies linearly or non- linearly with the PSF. This is due to multipliers which have been defined qualitatively based on subjective judgements and qualitative assessment, as mentioned in the Petro-HRA guidelines. Deducing this relationship by subjective interpretation due to lack of availability of data is affected by the strength of knowledge and effect of assumptions. This subjective interpretation can become a source of uncertainty in the HEP estimation. Multiplier as a step function and binary nature of data: Figure 27 shows the table of various levels of ‘available time’ PSF that has been defined in the Petro-HRA, where each level description is a justification for assigning the corresponding multiplier values. In other words, the multiplier is a weightage given to the PSF level depending on the severity of its impact on the human performance.
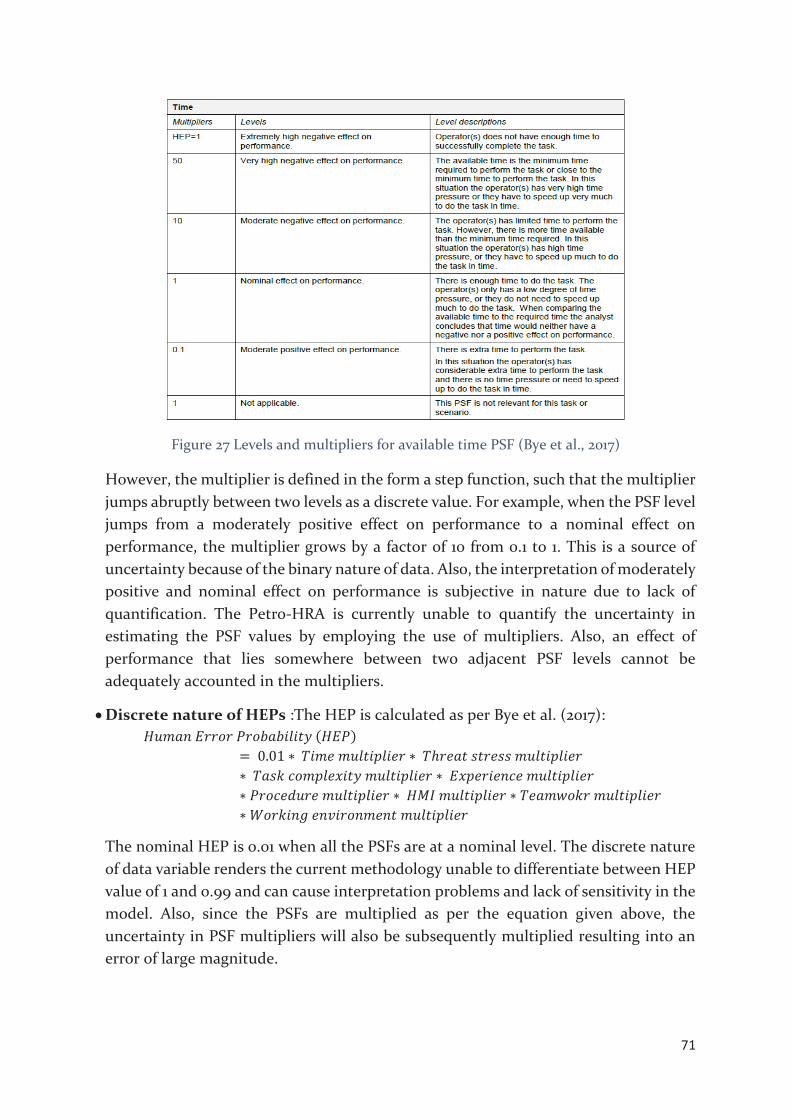
71
Figure 27 Levels and multipliers for available time PSF (Bye et al., 2017)
However, the multiplier is defined in the form a step function, such that the multiplier jumps abruptly between two levels as a discrete value. For example, when the PSF level jumps from a moderately positive effect on performance to a nominal effect on performance, the multiplier grows by a factor of 10 from 0.1 to 1. This is a source of uncertainty because of the binary nature of data. Also, the interpretation of moderately positive and nominal effect on performance is subjective in nature due to lack of quantification. The Petro-HRA is currently unable to quantify the uncertainty in estimating the PSF values by employing the use of multipliers. Also, an effect of performance that lies somewhere between two adjacent PSF levels cannot be adequately accounted in the multipliers.
Discrete nature of HEPs :The HEP is calculated as per Bye et al. (2017):
The nominal HEP is 0.01 when all the PSFs are at a nominal level. The discrete nature of data variable renders the current methodology unable to differentiate between HEP value of 1 and o.99 and can cause interpretation problems and lack of sensitivity in the model. Also, since the PSFs are multiplied as per the equation given above, the uncertainty in PSF multipliers will also be subsequently multiplied resulting into an error of large magnitude.
72
Therefore, the uncertainties related to model, subjective sensitivity to multiplier, lack of quantification of model error, binary nature of data and multiplier step function add towards an increase in the uncertainty of HEP estimation. These gaps in the current methodology for HRA point towards the need for improvement. Hence, we will discuss the assumptions and simplifications in the next section, which will form a base for developing our improved Multiplier Model aimed at addressing all these gaps.
6.2.2 Important assumptions and simplifications We will build upon the example scenario of drive-off of drilling unit presented in the previous chapter to illustrate the suggested solution. This has been done so that we can compare and gain insights on the results achieved through our suggested method with the original methodology suggested in Petro-HRA guidelines.
In order to facilitate the development of an improved Multiplier Model for the PSFs, a number of assumptions and simplifications have been made. It is important to report these simplifications and assumptions along with the results of the analysis, so that the decision maker is fully aware of the uncertainties that may be introduced by these. The simplifications and assumptions are as follows:
1. It has been recognised and acknowledged that human performance can either cause or prevent an accident from occurring. Humans can play a role in either pre-initiating event or post-initiating event. However, we will restrict ourselves from diving into the part where human activity can cause an accident as it falls beyond the scope of this study. We will focus on assessing the human role in a post-initiating event accidental scenario, both as being able to affect the HEP level positively and negatively.
2. In this suggested solution, only the ‘action’ tasks are considered and as per SPAR-H methodology recommendation, the nominal value of the HEP is assumed to be 0.01. However similar approach can be extended to the ‘diagnosis’ tasks as well by employing the nominal HEP as 0.001.
3. The eight PSFs chosen are in accordance with the PSFs specified in the SPAR-H methodology. These have been defined as per Petro-HRA guidelines as:
Available time: After an initiating event takes place, the time for safety systems and barriers to perform their intended function is limited. If the activation/functioning of these barriers is dependent on the operator action, then time duration available to operator is called the available time.
Threat Stress Task Complexity Experience/training Procedures Human-Machine Interface
73
Working environment Teamwork
The team work PSF is assumed to be not applicable in the current HFE scenario of ‘Failure to prevent wellhead damage by disconnecting from well’ as the steps are to be performed only by the Dynamic Positioning Operator alone.
4. We have relied on the Timeline Analysis presented in the Petro-HRA drive off scenario to produce the distribution of ‘Available Time’ PSF with respect to the operator activity. The Stress PSF is fitted to the available time variable based on logical reasoning. However, the actual stress levels experienced by the operator may differ considerably.
5. Gertman et al. (2005) define the nominal value as a value that is supposed to contain all small influences that can contribute to errors on a task that are not covered by the PSFs. The nominal value in Petro-HRA for all tasks is 0.01, which means that a task fails 1 out of 100 times. The range of nominal values assigned to each PSF can change depending on the criticality of HFE being assessed. However, the nominal range for the current scenario has been chosen based on logical deduction and discussions.
6. All the PSFs have been scaled from 0-100 and assumed to increase non-linearly with a continuous distribution. The scale can be thought of as a rating obtained from surveys with:
7. If one (or more) PSFs has the value of , then the HEP for the whole task is set to 1 regardless of any other PSFs’ multiplier. This PSF is regarded as a strong performance driver that will cause the task to fail for sure. In other words, the extremely high/negative level in any of the PSFs’ level is captured as . This is in accordance with the SPAR-H methodology which assumes that human error is inevitable in this case.
8. The model filters out higher generated values and utilizes only the values. The higher values of HEP is ignored as they signify that the human error is inevitable in those cases and require immediate rectifications. Further assessing them is beyond our scope because violate the laws of probability.
9. The sampling window has been restricted to the nominal values only, to be able to compare with the corresponding value of the current methodology of the Petro-HRA. However, this sampling window can be changed as per need.
0: the worst possible rating
100: the best possible rating
74
10. The values have been generated using the data generator function in-built in the R programming language for statistical modelling. Also, each generated value is independent and identically distributed as per the Monte Carlo Simulation technique which has been applied in this model. However, this assumption may not hold true in the real scenario.
6.2.3 Data Simulation Method We have chosen Monte-Carlo Simulation for our solution model. The Monte-Carlo Simulation has been chosen because as per Wade (2016):
It is a widely accepted simulation technique and simple to apply. It helps us in developing random sequences of scenarios that fit predetermined
characteristics from a spectrum of good, bad and extreme scenarios. It can be used to characterise uncertainty, test the model and assess its feasibility. We can increase the number of simulations depending upon the required level of
precision, without requiring additionally expensive machines to handle it. This method can also generate values from historical data by randomly drawing
values from past data or simulating values from a statistical distribution that closely represents our scenario. This makes it a versatile method.
6.2.4 Digital Solution Framework The digital solutions presented in this section tries to address the problems states in the previous section. It can be recalled that in chapter 5 we identified data requirement as a challenge in modelling HFEs into a mathematical framework that facilitates quantification. To fulfil this data requirement, this digital solution proposes making use of all the available data sources identified throughout the research along with some additionally suggested sources. In chapter 3, we suggested that survey/questionnaires are suitable for capturing human behavioural elements but needed improvements in terms of the collecting measurable data. Also, the risk indicators of working environment could capture installation specific data with the help of sensors. This digital solution suggests using the data captured by these activity indicators as one of the inputs sources after some changes are made in the way these indicators collect/process data. The data from these improved indicators can be subsequently used for defining the shape of the PSF functions. All these have been discussed in the digital solution presented below.

75
Figure 28 Outline of the proposed digital solution
The figure 28 is the outline of the proposed digital solution in order to improve the HRA in the operational phase with the help of digital solution. The solution makes a combined use of various digital technologies available currently. The digital solution consists of four components. These have been discussed and explained below:
1. Input: The input to this model is the data collected through various sources by using digital means such as:
Online Surveys/Questionnaires: It was concluded in Chapter 3, the Survey and Questionnaire can be a suitable indicator for capturing human behavioural elements. As Sue & Ritter (2011) mention, these surveys can be used for explanatory research which can help us in gathering empirical explanation for the phenomenon of human error, direction and relationship between various variables (PSFs and HEP). As has already been suggested, the questions designed for the survey are targeted to facilitate the quantification of those factors, which are being assessed qualitatively till now based on subjective interpretations of the analysts. Many easily accessible software can be used for designing the survey forms, collecting responses, collating information and presenting the data it in a measurable format for further analysis. For our purpose, the surveys can help us in collecting installation specific quantitative data about PSFs such as Procedure, Task Complexity, Human and Organisational Factors, Teamwork, Operator training/experience level. The survey should be conducted among the installation operators and supervisors who are asked to rate these PSFs on a rating scale of depending on their perception of the level of negative/positive effect these have on their performance. The digital surveys

76
have immediate benefits in the form of increased response rate, increased feasibility of regular surveying, effectively updating the survey questions, easy to collect and process responses with minimum error, reduced surveying time and reach a wider surveying population in a relatively inexpensive manner. Sensor data: The introduction of sensors in the operator room can provide us with a variety of information about the factors affecting human performance after an imitating event has taken place. The following digital sensors can be fitted in the operating environment of the operator:
Stress monitoring sensor: Yoon, Sim, & Cho (2016) present the use of a wearable human stress monitoring sensor patch that captures operator stress levels by integrating the signals of skin temperature, skin conductance and pulse rate. This sensor captures the physical and psychological stress signals in real time. HMI/motion monitoring sensor: RIF (2017) presents the use of digital sensor technology for analysing manual work processes for obtaining findings about human-machine interactions. This is done by capturing human motion through employing motion trackers which can live-stream the human kinematic data related to posture recognition, motion segmentation and activity level recognition. This also provides an option for carrying out simulations of human-robot collaboration type hybrid work processes. Digital Timers and Counters: The digital timers and counters can be used for capturing the time taken by operator during various subtasks and the frequency of carrying out certain critical tasks. This information can be used to construct an accurate time-line analysis.
Working environment sensor data: In chapter 3, we concluded that the indicator of noise, chemical working environment and ergonomics can also be used as indicator for capturing some of the operator working environment elements that help in shaping the human performance. The data required for these indicators can be captured with the help of digitalised sensors. As per Shelton (2015), the ‘Digital Data Logging Sound Level Meters’ can be used to measure, process and capture all the required parameters simultaneously with regular logging of data. Tao (2011) lists various types of Nano sensors that can capture allergenic particles, exhaust gases, volatile compounds, hydrocarbon releases and provide real time exposure level data that can be stored. Internal Database of companies: (Falck, 2016) mentions that only a fraction of operational data logged by the companies is used for decision making. With the

77
help of sensor and data processing technologies, this data can be used for online condition monitoring and can help in making risk-informed decision making. Further if these internal databases can be combined, collated and formatted in a uniform way, it can benefit all the companies in the industry through data sharing.
2. Database Management The management of all the data collected from the digital inputs requires infrastructure and software, which can be met through Cloud Computing. Armbrust et al. (2010) define cloud computing as both the applications delivered as services over the internet and the hardware and systems software in the data centres that provide those services. The data centre hardware and software is called cloud. ‘Private cloud’ can be used by building internal data centres of business and companies with construction at low-cost locations. However, for our purpose we can purchase ‘utility computing’ services provided by various Cloud Providers. The figure 29 shows this relation between users and providers of cloud computing services. The utility cloud computing minimizes the requirement for building large-scale data centres, electricity, infrastructure, network bandwidth, software and hardware availability. With the help of cloud computing we can digitise the process of data collection, collation, data organisation and management. Further, we can also employ cloud computing for data processing through a software.
Figure 29 Users and providers of cloud computing. (Armbrust et al., 2010)
3. Processing Software
After collecting relevant data from various sources, this data needs to be processed with the help of an algorithm based software. This algorithm is based on a Multiplier Model which is an improvement to the original guidelines presented in the Petro-HRA. The new model is needed to address the problems of binary nature of data, subjective interpretation of PSF multiplier level, lack of quantification of model uncertainty and uncertainty introduced due to discrete nature of multiplier function. With advanced

78
programming skills, this processing software can be develop din such a way that it can facilitate online monitoring of the PSF levels, indicators and sensor readings in real time along with frequent updating of newly obtained information. Since the complete development of the solution falls beyond the scope of this study, we have focussed on only on developing the Multiplier Model in the following section.
4. Output The output from the Multiplier Model is the HEP, which is used as an input to the QRA event tree model. This output is in the form of a continuous distribution function which can be communicated to the management through a histogram or graph. The software allows us to report the uncertainty in various parameters such as PSF levels, nominal HEP values, time estimates, etc. by using advanced inbuilt statistical functions. We can also conduct a sensitivity analysis by observing the extreme negative effect of each PSF level on the HEP value.
6.3 THE MULTIPLIER MODEL The digital solution framework presented in section 6.2, processes data through an algorithm based software. In this section we will be focussing only on the algorithm description of Multiplier Model of the suggested digital solution, which has been suggested as specific solution. This Multiplier model is a systematic model for data processing which converts the discrete PSF multiplier step function into a continuous distribution function with the help of input data and estimates HEP by incorporating Monte Carlo Simulation technique.
This model can process large amount of data in a short amount of time and also help in data visualisation through means of graphs and histograms. The coding for this model has been done in a versatile programming language called R which has been developed specifically for handling statistical modelling. The programming software is available without any cost and comes with advanced packages that can be used to carry out advanced simulations and data visualization.
The following steps have been carried out for building the Multiplier model algorithm in R programming environment:
1. To address the binary nature of data and subjective interpretation related issue of PSFs’ multipliers, the multipliers of Task Complexity, Experience/training, Procedures, HMI, Working environment and Teamwork have been fitted to a rating scale (0-100). Additionally for specifying the ‘Available time’ PSF and ‘Threat stress’ PSF, the timeline analysis is utilised such that the multipliers have been fitted on a scale of 1-60 seconds for this example case. However, the time scale will change with each scenario being investigated.
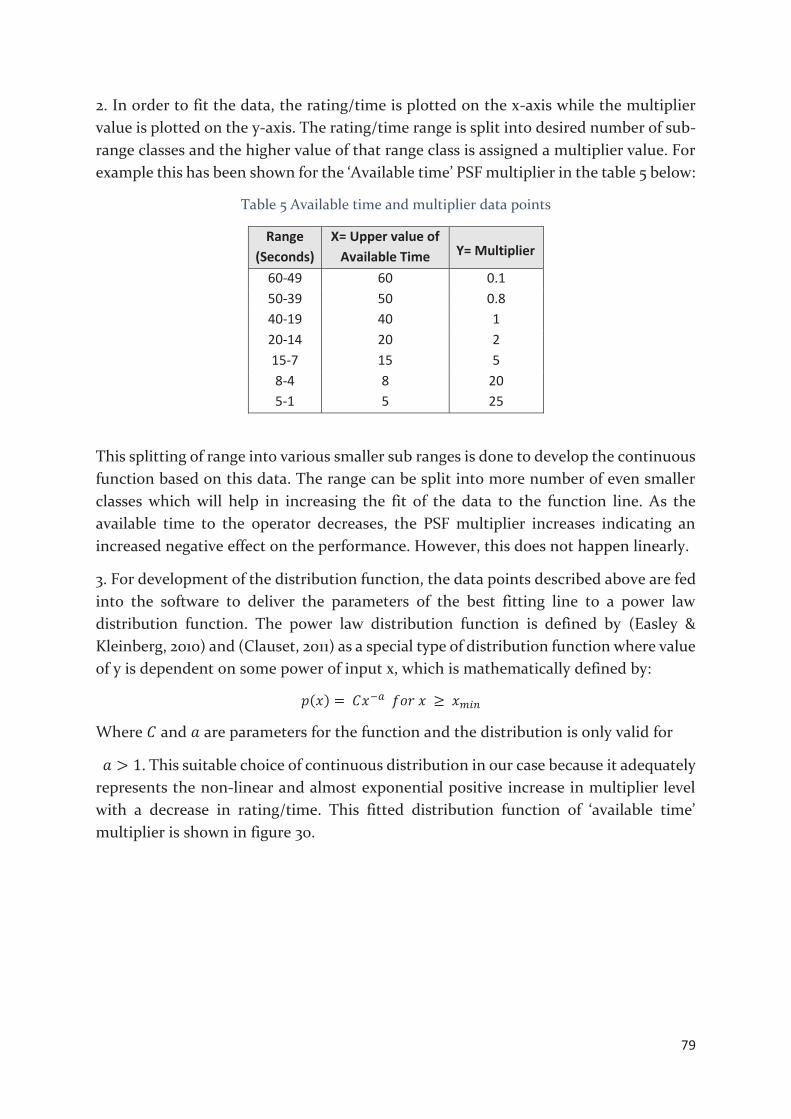
79
2. In order to fit the data, the rating/time is plotted on the x-axis while the multiplier value is plotted on the y-axis. The rating/time range is split into desired number of sub-range classes and the higher value of that range class is assigned a multiplier value. For example this has been shown for the ‘Available time’ PSF multiplier in the table 5 below:
Table 5 Available time and multiplier data points
Range (Seconds)
X= Upper value of Available Time Y= Multiplier
60-49 60 0.1 50-39 50 0.8 40-19 40 1 20-14 20 2 15-7 15 5 8-4 8 20 5-1 5 25
This splitting of range into various smaller sub ranges is done to develop the continuous function based on this data. The range can be split into more number of even smaller classes which will help in increasing the fit of the data to the function line. As the available time to the operator decreases, the PSF multiplier increases indicating an increased negative effect on the performance. However, this does not happen linearly.
3. For development of the distribution function, the data points described above are fed into the software to deliver the parameters of the best fitting line to a power law distribution function. The power law distribution function is defined by (Easley & Kleinberg, 2010) and (Clauset, 2011) as a special type of distribution function where value of y is dependent on some power of input x, which is mathematically defined by:
Where and are parameters for the function and the distribution is only valid for
. This suitable choice of continuous distribution in our case because it adequately represents the non-linear and almost exponential positive increase in multiplier level with a decrease in rating/time. This fitted distribution function of ‘available time’ multiplier is shown in figure 30.
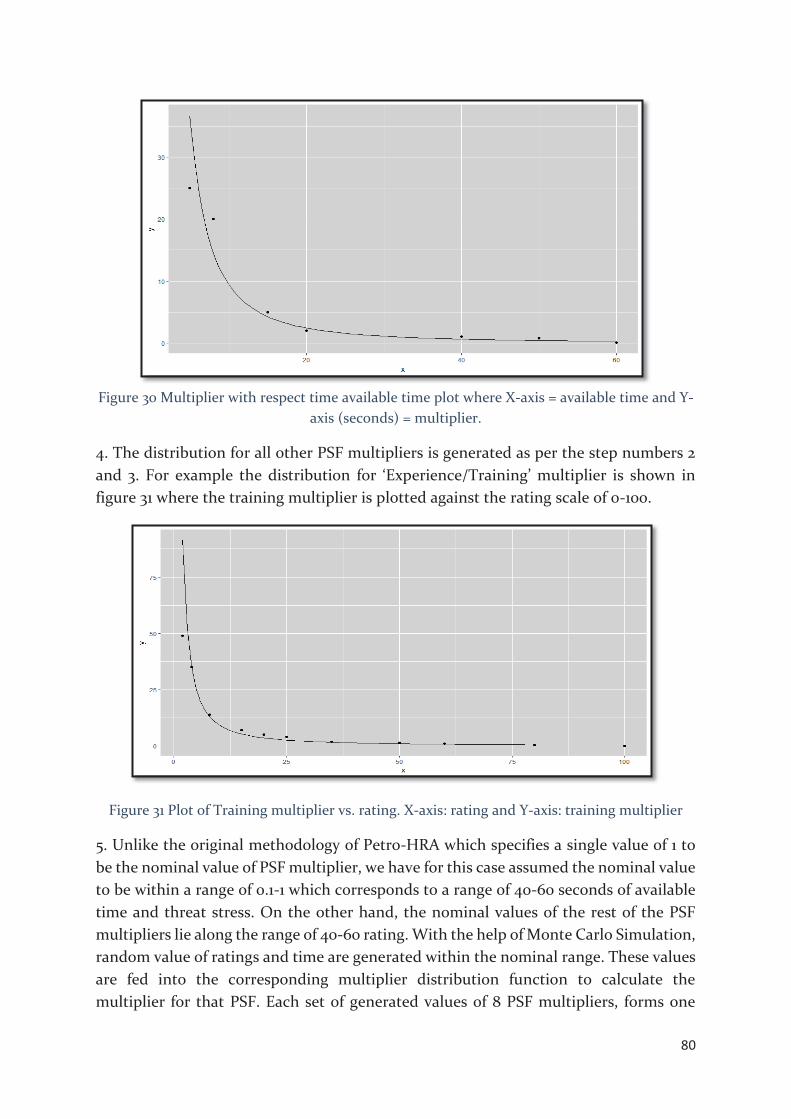
80
Figure 30 Multiplier with respect time available time plot where X-axis = available time and Y-axis (seconds) = multiplier.
4. The distribution for all other PSF multipliers is generated as per the step numbers 2 and 3. For example the distribution for ‘Experience/Training’ multiplier is shown in figure 31 where the training multiplier is plotted against the rating scale of 0-100.
Figure 31 Plot of Training multiplier vs. rating. X-axis: rating and Y-axis: training multiplier
5. Unlike the original methodology of Petro-HRA which specifies a single value of 1 to be the nominal value of PSF multiplier, we have for this case assumed the nominal value to be within a range of 0.1-1 which corresponds to a range of 40-60 seconds of available time and threat stress. On the other hand, the nominal values of the rest of the PSF multipliers lie along the range of 40-60 rating. With the help of Monte Carlo Simulation, random value of ratings and time are generated within the nominal range. These values are fed into the corresponding multiplier distribution function to calculate the multiplier for that PSF. Each set of generated values of 8 PSF multipliers, forms one

81
dataset or observation to be used for estimating HEP. For our example, we have generated datasets.
6. The HEP is estimated by multiplying nominal HEP ( ) with all the 8 multipliers within that dataset. From datasets we get an estimate of corresponding HEP values. Among these values, we keep only the observation of and their corresponding datasets.
7. The plot of the observations of HEP can be made either with respect to the rating or the available time variable. The figure 32 shows the plot of HEP w.r.t the available time in the nominal range (40-60 seconds).
Figure 32 Plot of HEP with respect to tsam= Available time sample (seconds)
An expected value of HEP within this range is estimated as and the figure 33 shows the uncertainty in this value. The uncertainty is quantified as the standard deviation which is calculated by the software to be 0.00294.

82
Figure 33 Standard deviation of HEP from the output console of the software.
8. To visualise the effect of increase in the range size of observations on the uncertainty, we also generate the HEP values for multipliers in the range of seconds and
rating. The plot of HEP in this new range is shown in figure 34 below.
Figure 34 Plot of HEP with respect to tsam= Available time sample (40-70 seconds)
The standard deviation of HEP is recalculated for this range as which is an increase of approximately in the uncertainty band. This can be seen from the picture which is a snapshot of the output console. Further the increase in the uncertainty of the HEP can also be visualized from the increase in spread of the scatter plot of HEP in figure 30 as compared to tighter spread of figure 28 which has a fewer rogue extreme points.

83
Figure 35 Standard deviation of HEP within the increased range of observations.
NOTE: As is shown in the figure 28, the digitisation of HEP estimation through Multiplier Model also provides us with the option of online monitoring of PSF levels, HEP level and more frequent updating of HEP estimates for emergency requirements of reporting overall system risk level. This is a direct benefit that can be achieved through automation of the system.
6.3.1 Comparison of Multiplier Model with the old methodology The comparison between the new digitised Multiplier Model with the old methodology has been discussed as follows:
The suggested Multiplier model produces an expected value of nominal HEP= 0.00375. In contrast, the original methodology produces a nominal HEP value of 0.01 which is almost 2.7 times higher than the HEP value estimated with the multiplier model. It is important to mention here that we have assessed a situation where the nominal time is higher than what was defined as the old nominal value. If we change the nominal value range in the multiplier function for e.g. 20-50 seconds, we may get an altogether different function. In this way we are able to assess the impact on uncertainty without using a step function multiplier factor of 10 as used in the original methodology.
The Multiplier model accounts for uncertainty in nominal HEP values by providing a range of nominal HEP. This range adequately reflects uncertainty in the small influences that can possibly contribute to errors on the task, not covered by PSFs, while the original methodology just estimates a point value which fails to account for this uncertainty.
The uncertainty in Multiplier Model of HEP has been captured by the standard deviation. On the other hand, the single point value of nominal HEP=0.01 in the original methodology points towards a standard deviation of zero which signifies that no uncertainty is present in the estimation. This is logically unreasonable given the number of simplifications and assumptions made during calculation which have been discussed already in previous sections.
84
The Multiplier model can be extended further to generate confidence intervals of nominal HEP values. For example, a confidence interval of 0.0020-0.0095 suggests that the expected value of nominal HEP value lies within this range with a confidence of 95%. Similarly this range can be expanded to a confidence on 99%. Such advanced statistical inferences cannot be derived by the original methodology which lacks quantification of uncertainty.
6.4 IMPROVED HRA WITHIN THE NEW RISK CONCEPT The following improvements can be achieved through the application of the proposed digital solution for HRA in the operational phase:
1. Uncertainty addressed: The digital Multiplier model is a step towards better addressed uncertainty, which has been the main weakness, addressed in chapter 5, in the current Petro-HRA guideline due to lack of quantification of data. The new model reports the uncertainty in HEP estimates through standard deviation, and expected HEP value in a particular range of available time/ ratings. By increasing or decreasing this range, we can observe an increase/decrease in the uncertainty levels which has already been demonstrated in the discussion in previous section 6.2.5. By presenting HEP as a function of available time/rating, it becomes easier to visualise the uncertainty in estimates when compared with reporting just a single HEP value without quantified uncertainty values.
2. Flexibility to change and update modelling parameters: The Multiplier Model requires setting forth a range in the rating scale ( ) for each PSF multiplier level, depending upon the severity of its effect on the human performance. However, we have the flexibility of changing, increasing or decreasing this multiplier range. In fact, splicing up the range into many classes can reduce the uncertainty and help in obtaining a more accurate PSF multiplier distribution function as more and more data becomes available. The problem related to subjective interpretation and binary nature of PSF data has been solved with this model because of the introduction of continuous distribution functions of parameters, the shape of which can be initially set by the subject matter experts. Later on, the newly acquired data from digital means can be used for identifying the actual shape of distribution curve.
3. Step towards achieving dynamic HRA: The digital solution involves developing a software which solicits data inputs and automatically produces outputs through simulations based upon the assumptions, simplifications, mathematical relationships and rules fixed by analysts that are encrypted in the algorithm governing the calculations. The system is highly dynamic in nature because of the option of flexibility, as already mentioned in the previous point.

85
Also, the use of real time data logging sensors pave the way towards leading risk indicators for major accidents. Hence, our digital model can evolve with time and availability of data, which is a step towards achieving dynamic HRA.
4. Reduced processing time and errors: By introducing digital processing technologies, we can remove all the computational errors that can seep while handling large amounts of data manually. Also a reduced computational time helps us in generating risk reports during emergency situations quickly and accurately.
5. Targeting more HFEs:
A generic software can be developed which can help in conducting HRA study for more number of HFEs without the requirement for repeated programming of algorithms for similar HFEs each time. Such a software would save on time and money.
6.5 LIMITATIONS AND CHALLENGES OF DIGITAL SOLUTIONS Inspire of all the potential benefits that can be achieved through the digital solutions proposed, it is also accompanied by several limitations and challenges during its application. These have been discussed below:
1. Data availability It has been recognised that the solution being suggested is a data-dependent. However, the objective of this thesis does not focus on assessing how to overcome the data availability limitation as it falls beyond our scope currently. However, we do recognise that this is a major limitation which will need to be addressed before applying this solution in the practical context.
2. Model Testing
In order to test the prediction and forecasting accuracy of any model, data is required. The lack of data availability proves as a hindrance in testing the model being presented as a solution. However, in order to validate and check the reasonability of the result obtained from our model, we have assessed it against the current methodology’s results and drawn contrasts and conclusions. It is also possible to test this model in the future when relevant data is available.
3. Violation of law of probability:
In the current Petro-HRA methodology for estimating the HEP, the PSFs levels are generally signified by multiplier levels in the range of depending upon the severity. However, this violates the principle of probability as it can produce HEPs greater than 1. We recognise this weakness of the model and restrict ourselves to assessing the values that fall within the principles of mathematics. With the availability
86
of data in the future, this weakness of model can be targeted by building normalised multiplier levels that produce HEP estimates that are compliant with the laws of probability.
4. Underutilized internal database of companies:
As it was pointed out in chapter 3, most of the oil and gas companies maintain a large internal operational database that stands underutilized. The problem of collating these industry wide databases presents itself as a unique opportunity that can be exploited with the help of digital solution. However, ownership and gaining access to these databases is a management and administrative issue which falls beyond the scope of this study.
5. Investment requirements:
Although the proposed solution was formulated by researching for the low cost digital technologies such as sensors, utility cloud computing services, cost-free programming software etc., the total implementation cost of this solution may amount to a considerable investment sum required from the companies for installing elements such as sensors, digital monitors, electronic components, hardware and software requirements, digital software training to operators and analysts, etc. In the current scenario, where the oil prices are at a low level, such an investment might not seem feasible to the management. Therefore, it will be required to conduct and present a cost-benefit analysis to the higher management to justify the benefits obtained from incurring expenditure on such a solution. The cost-benefit analysis falls beyond the scope of current study.

87
CHAPTER CONCLUSIONS In this final chapter, we will be presenting the main findings throughout the whole study of the thesis and the inferences derived from them. Finally we will be summarizing the recommendations for future research and improvements.
7.1 INFERENCES There have been numerous findings throughout the study that have helped in building up this thesis study. These have been used to derive logical inferences through each chapter and these are presented in a concise manner below:
1. The interviews from the leading industrial experts from the operator, consultant and regulatory company’s perspective revealed that the human reliability assessment is currently at the developmental stage within the oil and gas industry. Before the development of the Petro-HRA guidelines, there was no uniform guidelines to assist the companies in carrying out the HRA studies in the oil and gas industry of Norway. Because of the lack of standard guidelines, the companies carried out the traditional QRA analysis for capturing human performance as per internally developed guidelines which ranged from following extremely divergent methods to not carrying out the human performance analysis. The lack of measuring uncertainty, under-utilisation of data and ensuring the quality of data were some of the requirements for improving the HRA methodology implementation.
2. The literature study infers that most of the first and second generation HRA tools have been developed in the nuclear industry and it has advanced more in developing the HRA techniques. By acquiring enough database by now, it has enabled them to test their models. As compared to them, the Norwegian oil and gas industry has just recently begun applying and developing its Petro-HRA guidelines with SPAR-H as the basis. Therefore, the Petro-HRA has been established as the main subject of our study.
3. It is also inferred from the interviews and literature review reports that in spite of logging of large amount of data, there is a problem of sharing internal database among the oil and gas companies because of which it currently remains under-utilised. This has led to the problem of data access and ownership which falls beyond the scope of our thesis. This has been a major finding in helping to limit the scope of the study such that we develop a model which utilised the data in a better manner assuming that the data becomes available in the future.
4. The study of the risk indicators in their ability to capture the human performance reveals that the Survey/Questionnaire and risk indicator of noise, chemical working environment and ergonomics are the most suitable risk indicators for capturing some of the human behavioural element. These have been suggested to be utilised further in the improvement of the HRA framework in the digital solution framework.
5. A study of numerous investigation reports of the past major accidents helped in understanding the role of human performance in escalating the initiating event to a
88
major disaster. Through the discussion already presented, it can be inferred that as per the Loss-Causation model, there were immediate, basic and lack of control causes responsible for the poor human performance after the initiating event took place. The performance shaping factors of training, experience, organisational factors, safety culture, guidelines and procedures, communication and leadership have been the most important factors affecting the human performance in the past accidental events investigated leading to loss of life, environmental damage and financial loss. We may need several other indicators along with the two mentioned in the previous point in order to describe the human behaviour. However, we will require more data to describe them which might not exist currently but be available in the future.
6. A study of the current risk assessment practices has led to the inference that the BORA, SIL and LOPA fall short in adequately assessing the human performance as per our post-initiating event scenario focus of QRA. However, Event Trees and Fault Tree methods are easier to apply because of their ability to analyse the post-initiating event, ease of understanding, communicating results and updating estimates. Therefore, the thesis focusses on improving the inputs to these methods and reducing the uncertainty of their estimates.
7. This thesis study has analysed the current Petro-HRA methodology and its integration with the QRA. It has been inferred from the study that the Petro-HRA helps in capturing the human performance better than the traditional QRA methodology. Also, the HRA integrated QRA fits in the level 1 and 2 of the new risk perspective framework. However, Petro-HRA lacks in capturing the uncertainty and strength of knowledge aspect adequately because of which its needs to be improved to bring it closer to fit in the level 3 and 4 of the new risk perspective.
8. The lack of capturing model uncertainty and input parameter uncertainty has provided us with an opportunity to develop a digital solution framework which can address this gap. The digital solution has been the focus of this thesis because it provides us a way in which we can achieve improvements in current HRA methodology in line with the adoption of Internet of Everything (IoE) approach by the industrial oil and gas leaders. This approach aims at increased focus on gathering and utilising the data better by employing digital technologies which has also been inferred as the focus of this study. The framework of this digital solution has already been presented.
9. Within the digital solution framework, a more intentional focus has been put on developing the Multiplier Model which targets the fundamental gaps of framework, i.e. quantifying the uncertainty in HEP estimates of the operational phase obtained from the current HRA methodology. The sources of uncertainty has been identified as the subjective interpretation of PSF multipliers, lack of quantification of model uncertainty, binary nature of data and discrete step function of PSF multipliers.
10. Lastly, the Multiplier Model as part of the digital solution to improve HRA in the operational phase is accompanied with various practical limitations related to violation of law of probability, data availability, practical limitations encountered in model testing and need for investment for its implementation.

89
7.2 RECOMMENDATIONS FOR FURTHER RESEARCH
Research is a means of striving towards improvements in the current methodologies. The current Petro-HRA also presents various opportunities for research in the future that can help in developing this guideline, derived from SPAR-H which was originally developed for the nuclear industry. This will help us to develop the Petro-HRA so that it meet the needs of oil and gas industry more closely than it currently does. It is particularly easier to introduce changes in the initial developmental phase because the Petro-HRA has been developed only recently and is flexible to changes that would be easier to implement. The following areas have been recommended for further research: 1. Multiplier functions’ shape
The shape of the multiplier function of PSFs has been presented in the current model as a general solution only. However, a more representative shape of the PSF multiplier functions can be obtained with further research and testing against more relevant data.
2. Operator- Behaviour Simulation Model
Based upon the inputs from operators and installation personnel, Operator Behaviour Simulation Model can be developed which can simulate the operator task execution during critical scenarios. One such model has been suggested by Trucco & Leva (2007) which has the capability to take into account operator-machine interaction more closely. These simulations can help in estimating the human error probability in these specific scenarios more accurately because they assume human as an information processing system rather than a reactive entity. If developed, this model can aid the transformation of static HRA to dynamic HRA free from subjective interpretations, enhanced tractability and better explanatory casual model. This would also be a giant leap towards digitisation of the HRA process.
3. Bayesian Analysis and Analytical Network Model
The Bayesian Analysis has gained popularity in recent times and is a potential improvement method which helps in updating the model as and when new data becomes available. K. M. Groth, Smith, & Swiler (2014) and K. M. Groth & Swiler (2013) suggest a similar framework which utilises the Bayesian Network Model to formally use the simulator data to refine the estimation of HEPs as per the SPAR-H methodology. A similar Bayesian Model can be developed for HRA in the oil and gas industry. It has been suggested to improve the Bayesian Model further by employing the ANP models which also include the inter-dependency among the PSFs. Therefore, the Bayesian Method combined with the ANP model can be a very precise solution which helps is estimating the HEP very accurately in each HFE. An attempt at developing a Bayesian Network
90
Model incorporating ANP has been presented in the Appendix B which can form a basis for further research.
4. Stress Testing
This method is a type of scenario analysis which can be researched and employed as a way of testing the assumptions and simplifications made in the modelling of the HFEs. The Stress Testing is a simulation technique which is actively employed by the financial industry as a part of the regulatory requirements after the Financial Crisis of 2007 (Schuermann, 2014). Under this simulation, one of the critical factors (assumptions) can be stressed (violated) to extremely high levels (for example: the available time can be reduced to really low value along combined with high stress levels) to test the resilience of an exposure to the deteriorating conditions. The scenarios to be tested against can be also be derived from the past major accidents to test the human performance in the current system. This can be highly useful in identifying the design changes required to improve system resilience in selected critical HFE situations in the future. The method of relevant scenario selection for stress testing has also been suggested for further research.
91
REFERENCES Accenture. (2016). IoT and Digitalization in the Oil & Gas Industry. Retrieved from
www.ifsworld.com/no/--/.../iot-and-digitalization-in-the-oil-and-gas-industry.ashx Armbrust, M., Fox, A., Griffith, R., Joseph, A. D., Katz, R., Konwinski, A., . . . Zaharia, M.
(2010). A view of cloud computing. Commun. ACM, 53(4), 50-58. doi:10.1145/1721654.1721672
Aron, D. (2012). The Difference Between IT Strategy and Digital Strategy. Retrieved from http://blogs.gartner.com/dave-aron/2013/11/12/the-difference-between-it-strategy-and-digital-strategy/
Australia. (2011). DRAFT GOVERNMENT RESPONSE TO THE REPORT OF THE MONTARA COMMISSION OF INQUIRY. Retrieved from https://industry.gov.au/resource/UpstreamPetroleum/MontaraInquiryResponse/Documents/response-to-montara-inquiry-report.pdf
Aven, T. (2014). Risk, Surprises and Black Swans : Fundamental Ideas and Concepts in Risk Assessment and Risk Management. Florence: Taylor and Francis.
Aven, T., & Renn, O. (2010). Risk management and governance : concepts, guidelines and applications (Vol. volume 16). Heidelberg: Springer.
Aven, T., Sklet, S., & Vinnem, J. E. (2006). Barrier and operational risk analysis of hydrocarbon releases (BORA-Release): Part I. Method description. Journal of hazardous Materials, 137(2), 681-691.
Aven, T., & Vinnem, J. E. (2007). Risk management with applications from the offshore petroleum industry: Springer Verlag.
Banafa, A. (2016). The Internet of Everything (IoE). Retrieved from https://www.bbvaopenmind.com/en/the-internet-of-everything-ioe/
Bell, J., & Holroyd, J. (2009). Review of human reliability assessment methods (RR679). Retrieved from http://www.hse.gov.uk/research/rrpdf/rr679.pdf
Board, U. S. C. S. a. H. I. (2007). Investigation Report REFINERY EXPLOSION AND FIRE (2005-04-I-TX). Retrieved from http://www.csb.gov/assets/1/19/CSBFinalReportBP.pdf
BP. (2011). Deepwater Horizon Accident Investigation Report. Retrieved from http://www.bp.com/content/dam/bp/pdf/sustainability/issue-reports/Deepwater_Horizon_Accident_Investigation_Report.pdf
Bye, A., Laumann, K., Taylor, C., Rasmussen, M., Øie, S., van de Merwe, K., . . . Wærø, I. (2017). The Petro-HRA Guideline. Retrieved from https://www.ife.no/en/ife/departments/industrial_psychology/projects/petro-hra/files/the-petro-hra-guideline
Clauset, A. (2011). Inference, Models and Simulation for Complex Systems. CSCI, 7000, 4830. Cullen, L. (1990). The public enquiry into Piper Alpha accident. Retrieved from UK: Dougherty, E. M. (1997). Is human failure a stochastic process? Reliability Engineering &
System Safety, 55(3), 209-215.

92
Easley, D., & Kleinberg, J. (2010). Power laws and rich-get-richer phenomena. Networks, Crowds, and Markets: Reasoning about a Highly Connected World. Cambridge University Press.
Embrey, D. (1986). SHERPA: A systematic human error reduction and prediction approach. Paper presented at the Proceedings of the international topical meeting on advances in human factors in nuclear power systems.
Ericson, C. A. (2005). Event tree analysis. Hazard Analysis Techniques for System Safety, 223-234.
Falck, A. (2016). Barrier indicator vs risk- informing operational risk management Risk, Reliability and Safety: Innovating Theory and Practice (pp. 758-765): CRC Press.
Flage, R., Aven, T., Hafver, A., Lindberg, D. V., Jakopanec, I., & Pedersen, F. B. (2015). Risk from concept to decision making (pp. 779-784). London: Taylor & Francis , cop. 2015.
Friedrich, R., Gröne, F., Koster, A., & Merle, M. L. (2011). Measuring industry digitization: Leaders and laggards in the digital economy. Retrieved from Startegy and PwC: https://www.strategyand.pwc.com/reports/measuring-industry-digitization-leaders-laggards
Gartner. (2014). How Forward-Thinking Oil and Gas CIOs Should Approach Price Declines. Retrieved from https://www.gartner.com/doc/2933417/forwardthinking-oil-gas-cios-approach
Gertman, D., Blackman, H., Marble, J., Byers, J., & Smith, C. (2005). The SPAR-H human reliability analysis method. US Nuclear Regulatory Commission.
Groth, K., & Swiler, L. P. (2012). Use of a SPAR-H Bayesian Network for predicting Human Error Probabilities with missing observations. Paper presented at the Proceedings of the International Conference on Probabilistic Safety Assessment and Management (PSAM 11)(Helsinki, Finland, 25–29 June 2012).
Groth, K. M., Smith, C. L., & Swiler, L. P. (2014). A Bayesian method for using simulator data to enhance human error probabilities assigned by existing HRA methods. Reliability Engineering & System Safety, 128, 32-40.
Groth, K. M., & Swiler, L. P. (2013). Bridging the gap between HRA research and HRA practice: A Bayesian network version of SPAR-H. Reliability Engineering & System Safety, 115, 33-42.
HSE. (2005). Public Report of Fire and Explosion at The Conocophillips Humber Refinery on 16 April 2001. Retrieved from http://www.hse.gov.uk/comah/conocophillips.pdf
Inquiry, A. M. C. o., & Borthwick, D. (2010). Report of the Montara Commission of Inquiry: Montara Commission of Inquiry.
ISO. (2009). Risk Management—Principles and Guidelines (Vol. 31000): Geneva : International Standards Organisation, 2009.
Jasanoff, S. (1999). The Songlines of Risk. Environmental Values, 8(2), 135-152. Retrieved from http://www.jstor.org/stable/30301700
93
Jonkman, S. N., van Gelder, P. H. A. J. M., & Vrijling, J. K. (2003). An overview of quantitative risk measures for loss of life and economic damage. Journal of hazardous Materials, 99(1), 1-30. doi:https://doi.org/10.1016/S0304-3894(02)00283-2
Kirwan, B. (1994). A guide to practical human reliability assessment. London: Taylor & Francis.
Kirwan, B., Gibson, W. H., & Hickling, B. (2008). Human error data collection as a precursor to the development of a human reliability assessment capability in air traffic management. Reliability Engineering & System Safety, 93(2), 217-233. doi:https://doi.org/10.1016/j.ress.2006.12.005
Labodová, A. (2004). Implementing integrated management systems using a risk analysis based approach. Journal of cleaner production, 12(6), 571-580.
Moriarty, R., O’Connell, K., Smit, N., Noronha, A., & Barbie, J. (2015). A New Reality for Oil & Gas Complex Market Dynamics Create Urgent Need for Digital Transformation. Retrieved from http://www.cisco.com/c/dam/en_us/solutions/industries/energy/docs/OilGasDigitalTransformationWhitePaper.pdf
Myers, P. M. (2013). Layer of Protection Analysis – Quantifying human performance in initiating events and independent protection layers. Journal of Loss Prevention in the Process Industries, 26(3), 534-546. doi:https://doi.org/10.1016/j.jlp.2012.07.003
Norkolje&gass. (2016). Prosjekt HC-lekkasjer. Retrieved from https://www.norskoljeoggass.no/Global/Prosjekt%20HC-lekkasjer/Dokumenter/%C3%85rsaksanalyse%20Hydrokarbonlekkasjer%202015.pdf
NTSB. (2003). Natural Gas Pipeline Rupture and Fire Near Carlsbad, New Mexico August 19, 2000 (PB2003-916501 ). Retrieved from https://www.ntsb.gov/investigations/AccidentReports/Reports/PAR0301.pdf
Petroleumstilsynet. (2017). Prinsipper for barrierestyring i petroleumsvirksomheten BARRIERENOTAT 2017.
PSA. (2013). Principles for barrier management in the petroleum industry: Petroleum Safety Authority, Norway.
PSA. (2014). HC-lekkasje i prosessanlegget hos Hammerfest LNG Retrieved from http://www.ptil.no/getfile.php/1327976/Tilsyn%20p%C3%A5%20nettet/Granskinger/2014_18_Granskingsrapport%20Hammerfest%20LNG%20-.pdf
PSA. (2015a). Investigation of hydrocarbon leak on Gudrun of 18 February
2015. Retrieved from Norway: PSA. (2015b). Investigation of lifeboat incident of 14 January 2015 on Mærsk Giant.
Retrieved from http://www.ptil.no/getfile.php/1332747/Tilsyn%20p%C3%A5%20nettet/Granskinger/2015_77_granskingsrapport%20Maersk%20Giant_engelsk.pdf
PSA. (2015c). Trends in the risk level in the petroleum activity Summary Report 2015 Norwegian Continental Shelf. Retrieved from Stavanger:

94
http://www.psa.no/getfile.php/PDF/RNNP%202015/RNNP-2015%20Summary%20report.pdf
PSA. (2017). Personal injuries from H2S exposure at Sture on 12 October 2016. Retrieved from http://www.ptil.no/getfile.php/1343089/Tilsyn%20p%C3%A5%20nettet/Granskinger/Investigation%20report%20Sture%20H2S.pdf
Reason, J. (1995). Understanding adverse events: human factors. Quality in Health Care, 4(2), 80. doi:10.1136/qshc.4.2.80
RIF. (2017). Analyse Manual Work Processes. RIF e.V. – Institute for Research and Transfer applies MVN BIOMECH. Retrieved from https://www.xsens.com/customer-cases/rif-e-v-institute-research-transfer-applies-mvn-biomech/
Schuermann, T. (2014). Stress testing banks. International Journal of Forecasting, 30(3), 717-728. doi:https://doi.org/10.1016/j.ijforecast.2013.10.003
Scott, D. L. (2003). Wall Street words: an A to Z guide to investment terms for today's investor: Houghton Mifflin Harcourt.
Shaw, J. (2014). Why “Big Data” is a big deal. Harvard Magazine, 3, 30-35. Shelton, T. (2015). What is a Data Logging Sound Level Meter? Retrieved from
http://www.cirrusresearch.co.uk/blog/2015/04/what-is-a-data-logging-sound-level-meter/
Sklet, S., Aven, T., Hauge, S., & Vinnem, J. (2005). Incorporating human and organizational factors in risk analysis for offshore installations. Paper presented at the Proceedings of the European safety and reliability conference. June.
Sue, V. M., & Ritter, L. A. (2011). Conducting online surveys: Sage Publications. Summers, A. E. (2003). Introduction to layers of protection analysis. Journal of hazardous
Materials, 104(1–3), 163-168. doi:http://doi.org/10.1016/S0304-3894(03)00242-5 Swain, A. D. (1989). Comparative evaluation of methods for human reliability analysis.
Retrieved from Tao, N. J. (2011). Sensors to Monitor Individual Exposures to Multiple Air Pollutants.
Retrieved from http://nas-sites.org/emergingscience/files/2011/12/NJ-Tao.pdf Trucco, P., & Leva, M. C. (2007). A probabilistic cognitive simulator for HRA studies
(PROCOS). Reliability Engineering & System Safety, 92(8), 1117-1130. Van De Merwe, K., Hogenboom, S., Rasmussen, M., Laumann, K., & Gould, K. (2014).
Human-Reliability Analysis for the Petroleum Industry: Lessons Learned from Applying SPAR-H. SPE Economics & Management, 6(04), 159-164.
Van de Merwe, K., Øie, S., Hogenboom, S., & Falck, A. (2015). Guidance on integrating Human Reliability Assessment in Quantitative Risk Assessment Safety and Reliability of Complex Engineered Systems (pp. 3147-3155): CRC Press.
Vinnem, J. E. (2007). Offshore risk assessment: principles, modelling, and applications of QRA studies: Springer Verlag.
Vinnem, J. E. (2013). Offshore Risk Assessment vol 1. : Principles, Modelling and Applications of QRA Studies (3rd ed. ed.). London: Springer.

95
Wade, D. (2016). The Advantages Of Monte Carlo Simulations. Wei, C., Rogers, W. J., & Mannan, M. S. (2008). Layer of protection analysis for reactive
chemical risk assessment. Journal of hazardous Materials, 159(1), 19-24. doi:http://doi.org/10.1016/j.jhazmat.2008.06.105
Wikipedia. (2017). Safety Integrity Level. Retrieved from https://en.wikipedia.org/w/index.php?title=Safety_integrity_level&oldid=767468173
Xing, L., & Amari, S. V. (2008). Fault tree analysis. Handbook of performability engineering, 595-620.
Yoon, S., Sim, J. K., & Cho, Y.-H. (2016). A Flexible and Wearable Human Stress Monitoring Patch. Scientific reports, 6.

96
AP
PEN
DIX
A
The
inte
rvie
w r
espo
nses
from
the
oil a
nd g
as in
dust
rial
exp
erts
hav
e be
en p
rese
nted
bel
ow in
tabl
e 6.
Tabl
e 6
Inte
rvie
w R
espo
nse
Sum
mar
y ta
ble
S.
No.
Inte
rvie
w Q
uest
ions
Resp
onse
s co
llect
ed
Ope
rato
r-St
atoi
l K
rist
ian
Gou
ld
(Hum
an F
acto
rs, C
hief
Eng
inee
r)
Reg
ulat
or- P
SA
Arn
e Jo
han
Thor
sen
(Lea
der o
f Pro
cess
and
En
quir
y)
Con
sult
ant-
DN
VG
L K
oen
van
De
Mer
we
(Sen
ior C
onsu
ltant
for
Ope
ratio
nal S
afet
y)
1. H
ow w
ell d
oes
the
HRA
fit
into
the
new
risk
con
cept
? W
here
doe
s it
lack
? W
ill th
e ne
w ri
sk c
once
pt a
dd s
ome
valu
e to
it?
Not
fam
iliar
with
the
new
risk
pe
rspe
ctiv
e an
d ne
eded
to s
tudy
abo
ut
it. T
here
fore
, una
ble
to c
omm
ent o
n th
is q
uest
ion.
No
expe
rien
ce in
usi
ng th
e H
RA
till n
ow b
ut I
belie
ve th
at it
fits
w
ell.
Fits
wel
l eno
ugh
as p
er m
y op
inio
n.
2.
Wha
t are
the
impo
rtan
t as
pect
s to
be
cons
ider
ed
whi
le d
oing
HRA
?
Take
car
e of
the
hard
and
sof
t re
quir
emen
ts (F
or e
xam
ple
com
pete
nce
of th
e ex
pert
in c
arry
ing
out t
he
anal
ysis
, str
uctu
ring
the
even
t tre
e,
exec
utio
n sh
ould
be
clea
r to
all a
naly
sts
in th
e m
eeti
ng, e
tc.)
The
end
user
mus
t ben
efit
from
co
nduc
ting
the
HRA
. C
onte
xt to
be
spec
ified
for
HRA
. Def
ine
hum
an fa
ilure
ev
ents
in th
e br
oade
r ana
lysi
s pe
rspe
ctiv
e.
Focu
s on
qua
lity
of d
ata.
3.
W
hat i
ndic
ator
s ar
e us
ed to
ca
ptur
e th
e hu
man
ele
men
t re
spon
sibl
e fo
r acc
iden
tal
even
ts?
How
are
the
assu
mpt
ions
and
si
mpl
ifica
tions
mad
e in
the
mod
els
affe
ctin
g th
eir r
esul
ts?
A Q
ualit
ativ
e ap
proa
ch b
ased
aro
und
MTO
is u
sed.
Hum
an &
org
anis
atio
nal
fact
ors
are
used
(PSF
s) a
s in
dica
tors
. Si
mpl
ifica
tions
can
affe
ct th
e re
sults
be
caus
e w
e ca
nnot
mod
el th
e si
tuat
ion
accu
rate
ly e
noug
h.
An
MTO
app
roac
h is
use
d. T
his
appr
oach
es th
e hu
man
and
or
gani
satio
nal f
acto
rs to
stu
dy
acci
dent
s.
Qua
litat
ive
indi
cato
rs
(exa
mpl
e: p
erfo
rman
ce o
f op
erat
or in
giv
en ti
me
to
initi
ate
shut
dow
n/ac
tivat
e sh
utdo
wn)
Si
mpl
ifica
tions
like
failu
re to
ac
tivat
e an
d la
te a
ctiv
atio
n ar
e

97
S.
No.
Inte
rvie
w Q
uest
ions
Resp
onse
s co
llect
ed
Ope
rato
r-St
atoi
l K
rist
ian
Gou
ld
(Hum
an F
acto
rs, C
hief
Eng
inee
r)
Reg
ulat
or- P
SA
Arn
e Jo
han
Thor
sen
(Lea
der o
f Pro
cess
and
En
quir
y)
Con
sult
ant-
DN
VG
L K
oen
van
De
Mer
we
(Sen
ior C
onsu
ltant
for
Ope
ratio
nal S
afet
y)
both
ass
umed
to b
e fa
ilure
s w
hich
affe
ct th
e re
sults
. H
owev
er, i
t is
not c
lear
how
th
ey a
ffect
the
resu
lts.
4.
How
wel
l are
the
curr
ent
indu
stri
al p
ract
ices
like
BO
RA, S
IL, L
OPA
, etc
. abl
e to
ca
ptur
e th
e hu
man
pe
rfor
man
ce a
spec
t? W
hat
are
the
rela
ted
unce
rtai
ntie
s/
impr
ovem
ents
nee
ded
for
thes
e m
odel
s?
BORA
is a
Res
earc
h an
d D
evel
opm
ent
proj
ect t
hat f
airs
wel
l in
its re
sults
, eve
n be
tter
than
the
othe
rs. H
owev
er, i
t is
a co
mpl
ex m
etho
dolo
gy w
hich
mak
es th
e ap
plic
atio
n di
fficu
lt an
d le
ss p
opul
ar.
LOPA
has
a lo
t of r
oom
for
impr
ovem
ent b
ecau
se it
lack
s th
orou
ghne
ss a
nd n
eeds
to s
tate
hum
an
invo
lvem
ent e
xplic
itly
duri
ng re
port
ing.
SI
L fr
amew
ork
is u
sual
ly n
ot c
lear
to th
e an
alys
ts c
arry
ing
it o
ut. F
urth
er, a
lot o
f as
sum
ptio
ns n
eed
to b
e re
port
ed.
Ther
e is
no
solid
link
bet
wee
n LO
PA
and
hum
an re
liabi
lity
stud
ies.
We
need
to
be
awar
e w
hen
a m
ore
deta
iled
asse
ssm
ent i
s ne
eded
whi
le c
ondu
ctin
g LO
PA.
LOPA
ass
esse
s hu
man
and
or
gani
satio
nal b
arri
ers.
SI
L as
sess
es th
e te
chni
cal
barr
iers
. N
o ex
peri
ence
with
BO
RA.
I ha
ve
no
expe
rien
ce
with
BO
RA
and
little
ex
peri
ence
w
ith S
IL.
I hav
e m
ore
expe
rien
ce w
ith
LOPA
. It t
akes
hum
an
perf
orm
ance
into
acc
ount
to a
lim
ited
exte
nt b
ecau
se L
OPA
bu
ilds
on H
AZO
P. It
rela
tes
mor
e to
indi
vidu
al
com
pone
nts
in th
e sy
stem
. It
sim
plifi
es H
RA, h
as li
mite
d ou
tlook
whi
ch in
trod
uce
unce
rtai
ntie
s. It
sho
uld
be
exte
nded
furt
her t
o as
sess
hu
man
bar
rier
s th
at a
re m
ore
impo
rtan
t tha
n ot
hers
.
5.
I’ll b
e st
udyi
ng s
ome
inve
stig
atio
n re
port
s to
ass
ess
the
ques
tion
3. W
hat c
an b
e a
good
str
ateg
y to
do
that
to b
e
Look
at
the
fact
s of
the
eve
nts
rolli
ng
into
the
acci
dent
, the
rep
orti
ng p
roce
ss,
how
ex
plic
it it
is
in
stat
ing
fact
s,
tran
spar
ency
of
repo
rtin
g. A
sk y
ours
elf
whe
ther
th
e re
port
ha
s ta
ken
into
ac
coun
t all
the
rele
vant
fact
s.
Look
at S
ture
a
ccid
ent
inve
stig
atio
n re
port
to s
tudy
the
gaps
in th
eir e
mer
genc
y pr
epar
edne
ss. A
lso
stud
y th
e cu
lture
pro
blem
s, la
ck o
f le
ader
ship
and
inef
ficie
nt
Look
at t
he c
oncl
usio
ns a
bout
hu
man
per
form
ance
, str
ess
rela
ted-
wor
kloa
d an
d ot
her
rela
ted
caus
es, o
pera
ting
envi
ronm
ent c
ondi
tions
for
oper
ator
s, p
ositi
onin
g an
d
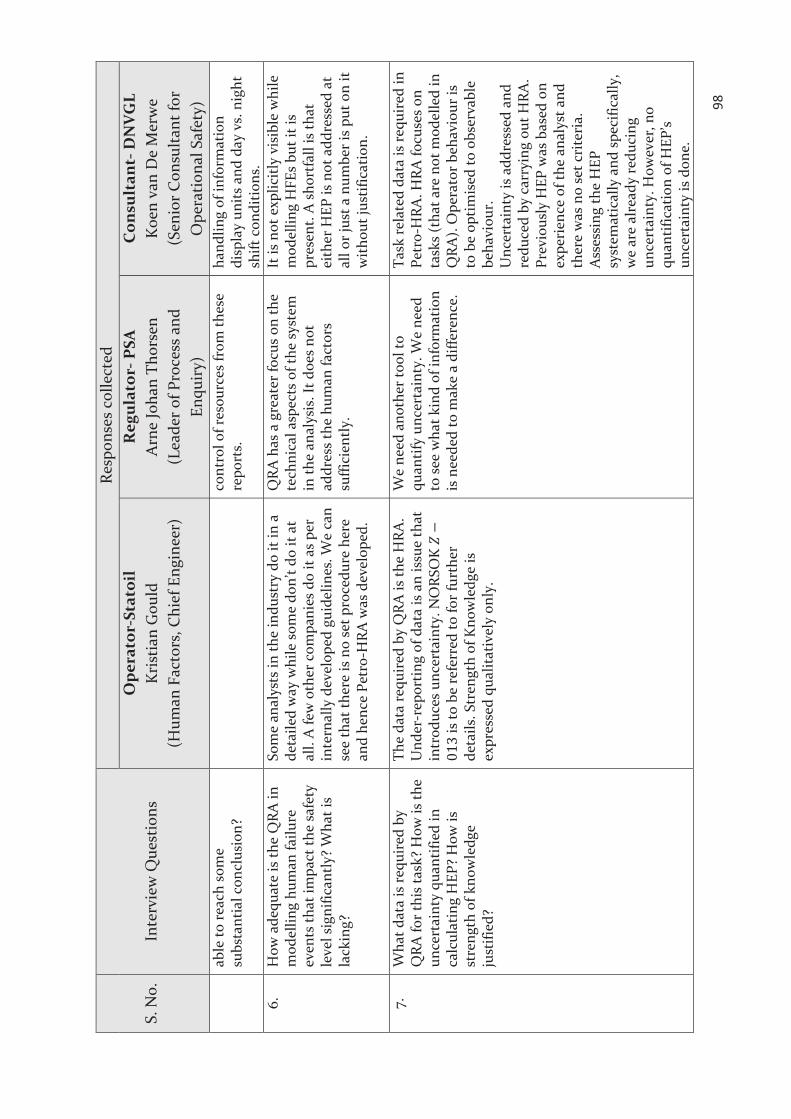
98
S.
No.
Inte
rvie
w Q
uest
ions
Resp
onse
s co
llect
ed
Ope
rato
r-St
atoi
l K
rist
ian
Gou
ld
(Hum
an F
acto
rs, C
hief
Eng
inee
r)
Reg
ulat
or- P
SA
Arn
e Jo
han
Thor
sen
(Lea
der o
f Pro
cess
and
En
quir
y)
Con
sult
ant-
DN
VG
L K
oen
van
De
Mer
we
(Sen
ior C
onsu
ltant
for
Ope
ratio
nal S
afet
y)
able
to re
ach
som
e su
bsta
ntia
l con
clus
ion?
cont
rol o
f res
ourc
es fr
om th
ese
repo
rts.
ha
ndlin
g of
info
rmat
ion
disp
lay
units
and
day
vs.
nig
ht
shift
con
ditio
ns.
6.
How
ade
quat
e is
the
QRA
in
mod
ellin
g hu
man
failu
re
even
ts th
at im
pact
the
safe
ty
leve
l sig
nific
antly
? W
hat i
s la
ckin
g?
Som
e an
alys
ts in
the
indu
stry
do
it in
a
deta
iled
way
whi
le s
ome
don’
t do
it at
al
l. A
few
oth
er c
ompa
nies
do
it as
per
in
tern
ally
dev
elop
ed g
uide
lines
. We
can
see
that
ther
e is
no
set p
roce
dure
her
e an
d he
nce
Petr
o-H
RA w
as d
evel
oped
.
QRA
has
a g
reat
er fo
cus
on th
e te
chni
cal a
spec
ts o
f the
sys
tem
in
the
anal
ysis
. It d
oes
not
addr
ess
the
hum
an fa
ctor
s su
ffici
ently
.
It is
not
exp
licitl
y vi
sibl
e w
hile
m
odel
ling
HFE
s bu
t it i
s pr
esen
t. A
sho
rtfa
ll is
that
ei
ther
HEP
is n
ot a
ddre
ssed
at
all o
r jus
t a n
umbe
r is
put o
n it
w
ithou
t jus
tific
atio
n.
7.
W
hat d
ata
is re
quir
ed b
y Q
RA fo
r thi
s ta
sk?
How
is th
e un
cert
aint
y qu
antif
ied
in
calc
ulat
ing
HEP
? H
ow is
st
reng
th o
f kno
wle
dge
just
ified
?
The
data
requ
ired
by
QRA
is th
e H
RA.
Und
er-r
epor
ting
of d
ata
is a
n is
sue
that
in
trod
uces
unc
erta
inty
. NO
RSO
K
is to
be
refe
rred
to fo
r fur
ther
de
tails
. Str
engt
h of
Kno
wle
dge
is
expr
esse
d qu
alita
tivel
y on
ly.
We
need
ano
ther
tool
to
quan
tify
unce
rtai
nty.
We
need
to
see
wha
t kin
d of
info
rmat
ion
is n
eede
d to
mak
e a
diffe
renc
e.
Task
rela
ted
data
is re
quir
ed in
Pe
tro-
HRA
. HRA
focu
ses
on
task
s (t
hat a
re n
ot m
odel
led
in
QRA
). O
pera
tor b
ehav
iour
is
to b
e op
timis
ed to
obs
erva
ble
beha
viou
r.
Unc
erta
inty
is a
ddre
ssed
and
re
duce
d by
car
ryin
g ou
t HRA
. P r
evio
usly
HEP
was
bas
ed o
n ex
peri
ence
of t
he a
naly
st a
nd
ther
e w
as n
o se
t cri
teri
a.
Ass
essi
ng th
e H
EP
syst
emat
ical
ly a
nd s
peci
fical
ly,
we
are
alre
ady
redu
cing
un
cert
aint
y. H
owev
er, n
o qu
antif
icat
ion
of H
EP’s
unce
rtai
nty
is d
one.

99
S.
No.
Inte
rvie
w Q
uest
ions
Resp
onse
s co
llect
ed
Ope
rato
r-St
atoi
l K
rist
ian
Gou
ld
(Hum
an F
acto
rs, C
hief
Eng
inee
r)
Reg
ulat
or- P
SA
Arn
e Jo
han
Thor
sen
(Lea
der o
f Pro
cess
and
En
quir
y)
Con
sult
ant-
DN
VG
L K
oen
van
De
Mer
we
(Sen
ior C
onsu
ltant
for
Ope
ratio
nal S
afet
y)
Stre
ngth
of K
now
ledg
e ju
stifi
catio
n ca
n be
don
e by
the
anal
ysis
of u
ncer
tain
ty a
spec
ts.
8.
W
hat i
mpr
ovem
ents
do
you
thin
k ca
n be
ach
ieve
d in
HRA
(e
.g. T
ask
anal
ysis
ste
p) w
ith
the
help
of d
igita
lizat
ion?
Val
idat
ing
the
asse
ssm
ent b
y co
llect
ing
data
on
hum
an p
erfo
rman
ce, l
oggi
ng
the
data
regu
larl
y, c
heck
ing
if th
e ex
pect
ed p
erfo
rman
ce c
onfo
rms
to
actu
al p
erfo
rman
ce. “
GIG
O” m
eani
ng
‘Gar
bage
in, g
arba
ge o
ut’ n
eeds
to b
e ke
pt in
min
d, tr
ust i
n da
ta to
be
just
ified
, bet
ter H
AZI
D re
quir
ed.
HRA
can
be
impr
oved
by
prov
idin
g ea
sy a
cces
s to
dat
a an
d in
form
atio
n. E
nsur
ing
the
qual
ity o
f dat
a an
d in
form
atio
n is
a c
ritic
al a
spec
t to
be lo
oked
at
.
Gat
heri
ng d
ata
base
d on
w
orks
hops
, int
ervi
ews
of
oper
ator
s an
d su
ppor
ting
this
w
ith o
bjec
tive
data
can
im
prov
e H
RA. F
urth
er, a
mor
e ob
ject
ive
quan
tific
atio
n of
H
uman
fact
or d
ata,
sha
ring
of
data
base
s (c
urre
ntly
no
open
da
taba
ses)
can
hel
p in
im
prov
ing
the
HRA
with
di
gita
l sol
utio
n.
9.
Why
onl
y lim
it to
pos
t in
itiat
ing
even
ts?
Why
not
pr
e -in
itiat
ing
even
ts?
It is
diff
icul
t to
mod
el p
re-i
nitia
ting
even
ts b
ecau
se th
e ho
rizo
n of
eve
nts
to
be c
onsi
dere
d ex
pand
s ex
pone
ntia
lly.
It is
diff
icul
t to
mod
el c
ombi
natio
ns o
f H
FE. W
e ne
ed to
cho
ose
the
scen
ario
s ca
refu
lly. H
ence
, the
focu
s is
onl
y th
e sa
fety
func
tion
afte
r eve
nt h
as
happ
ened
.
To ta
ke th
e pr
e-in
itiat
ing
even
ts
into
acc
ount
, we
will
be
requ
ired
to
dre
am u
p m
ore
num
ber o
f sc
enar
ios
as th
e er
ror
poss
ibili
ties
are
quite
larg
e. T
his
will
be
a hu
ge ta
sk a
nd m
ay n
ot
prod
uce
prac
tical
resu
lts.
-N
ot c
over
ed-
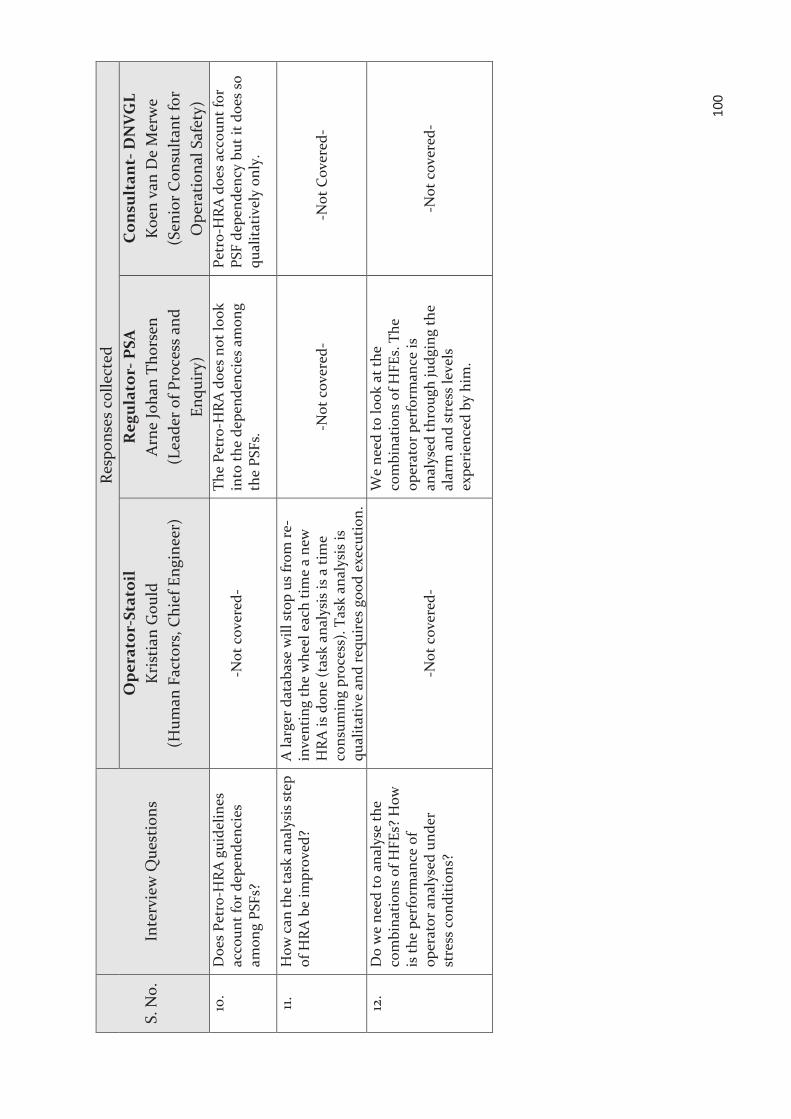
100
S.
No.
Inte
rvie
w Q
uest
ions
Resp
onse
s co
llect
ed
Ope
rato
r-St
atoi
l K
rist
ian
Gou
ld
(Hum
an F
acto
rs, C
hief
Eng
inee
r)
Reg
ulat
or- P
SA
Arn
e Jo
han
Thor
sen
(Lea
der o
f Pro
cess
and
En
quir
y)
Con
sult
ant-
DN
VG
L K
oen
van
De
Mer
we
(Sen
ior C
onsu
ltant
for
Ope
ratio
nal S
afet
y)
10.
Doe
s Pe
tro-
HRA
gui
delin
es
acco
unt f
or d
epen
denc
ies
amon
g PS
Fs?
-N
ot c
over
ed-
The
Petr
o-H
RA d
oes
not l
ook
into
the
depe
nden
cies
am
ong
the
PSFs
.
Petr
o-H
RA d
oes
acco
unt f
or
PSF
depe
nden
cy b
ut it
doe
s so
qu
alita
tivel
y on
ly.
11.
How
can
the
task
ana
lysi
s ste
p of
HRA
be
impr
oved
? A
larg
er d
atab
ase
will
sto
p us
from
re-
inve
ntin
g th
e w
heel
eac
h tim
e a
new
H
RA is
don
e (t
ask
anal
ysis
is a
tim
e co
nsum
ing
proc
ess)
. Tas
k an
alys
is is
qu
alita
tive
and
requ
ires
goo
d ex
ecut
ion.
-N
ot c
over
ed-
-N
ot C
over
ed-
12
. D
o w
e ne
ed to
ana
lyse
the
com
bina
tions
of H
FEs?
How
is
the
perf
orm
ance
of
oper
ator
ana
lyse
d un
der
stre
ss c
ondi
tions
?
-N
ot c
over
ed-
We
need
to lo
ok a
t the
co
mbi
natio
ns o
f HFE
s. T
he
oper
ator
per
form
ance
is
anal
ysed
thro
ugh
judg
ing
the
alar
m a
nd s
tres
s le
vels
ex
peri
ence
d by
him
.
-N
ot c
over
ed-

101
APPENDIX B
This Bayesian Model has been developed as per the framework suggested by K. M. Groth & Swiler (2013) in their paper. A brief methodology has been described here which may be used as a basis for further research. The coding of the model was done in R programming language with the help of several advanced packages easily available online.
The model has been built for estimating the HEP of the drilling unit drive off scenario from the Petro-HRA guideline case study.
Inputs for the model:
1. Picking up the critical Performance Shaping Factors from the case study provided in the Petro-HRA guidelines.
2. Dependency among PSFs was logically deduced for the HFE of ‘failure to prevent wellhead damage by disconnecting from well’. However to develop these dependencies in the actual project analysis we require the assistance of industrial experts and operator inputs. Also, the dependencies may change with the HFE being investigated.
3. Data set for probabilities of PSF level needs to be collected over time from the surveys of operators and supervisors. However, currently due to unavailability of the model specific data we derived values from the SPAR-H database. We acknowledge that this data being used may not be representative of the HFE being analysed and will compromise on the accuracy of the results.
4. The base probability of Failure/ No failure events have been taken from the Case study in Petro-HRA guidelines to set as a starting point of the Bayesian model.
How the Bayesian Network model was formed
1. We modelled the dependency of each PSF and logically tried to connect them to Operator ailure/ No failure event.
2. With the help of Monte Carlo simulation, we generated observation datasets of combinations of different PSF levels and failure/non failure observations based on SPAR-H method’s PSF probability allocations.
3. With the help of Bayes formula, we calculated the conditional probabilities of variables from the data sets.
4. Finally, we fitted the data into bayesian network model which can be used to update and generate conditional probabilities of interest.
Outputs from the model
1. We can obtain numerous conditional probability of each node. For example, Probabiltiy of observing high stress given not enough available time i.e. P(Stress|
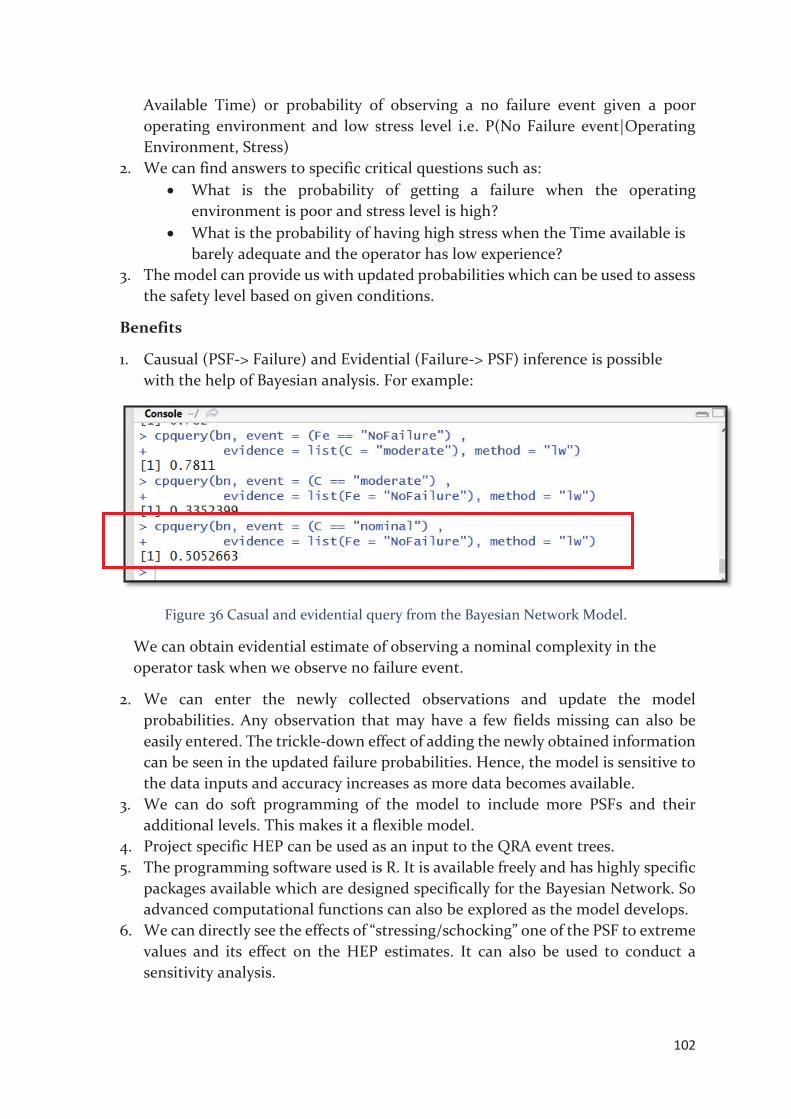
102
Available Time) or probability of observing a no failure event given a poor operating environment and low stress level i.e. P(No Failure event|Operating Environment, Stress)
2. We can find answers to specific critical questions such as: What is the probability of getting a failure when the operating
environment is poor and stress level is high? What is the probability of having high stress when the Time available is
barely adequate and the operator has low experience? 3. The model can provide us with updated probabilities which can be used to assess
the safety level based on given conditions.
Benefits
1. Causual (PSF-> Failure) and Evidential (Failure-> PSF) inference is possible with the help of Bayesian analysis. For example:
Figure 36 Casual and evidential query from the Bayesian Network Model.
We can obtain evidential estimate of observing a nominal complexity in the operator task when we observe no failure event.
2. We can enter the newly collected observations and update the model probabilities. Any observation that may have a few fields missing can also be easily entered. The trickle-down effect of adding the newly obtained information can be seen in the updated failure probabilities. Hence, the model is sensitive to the data inputs and accuracy increases as more data becomes available.
3. We can do soft programming of the model to include more PSFs and their additional levels. This makes it a flexible model.
4. Project specific HEP can be used as an input to the QRA event trees. 5. The programming software used is R. It is available freely and has highly specific
packages available which are designed specifically for the Bayesian Network. So advanced computational functions can also be explored as the model develops.
6. We can directly see the effects of “stressing/schocking” one of the PSF to extreme values and its effect on the HEP estimates. It can also be used to conduct a sensitivity analysis.

103
7. Graphical representation of probabilities makes it easier to communicate the results of analysis.
Limitations
1. The model is quite data intensive and data sensitive. Ensuring the quality and reliability of the data may present itself as a challenge.
2. It requires programming skills for initial model setup and some training for utilising the software may also be needed.
3. Improves accuracy with more number of observations and may need the subjective probabilties in case of lack of data.
The figure 37 is the logical structure of the relationships between PSFs nodes and failure events. The table 7 shows the various PSFs and their different possible levels. This has been picked up from the SPAR-H methodology. Figure 38 is a depiction of the conditional failure probability estimates of different levels of PSFs of Stress and operating environment. A similar conditional probability estimate is done for all the other 7 PSF estimates. This ultimately produces the final HEP estimate of observing a failure/no failure event as shown in figure 39. This final figure helps us to visualize the how the effect of updating the new observations is incorporated in the Bayesian Network Model.
Figure 37 Structure of relationships between PSFs and failure event in the Bayesian Network Model.
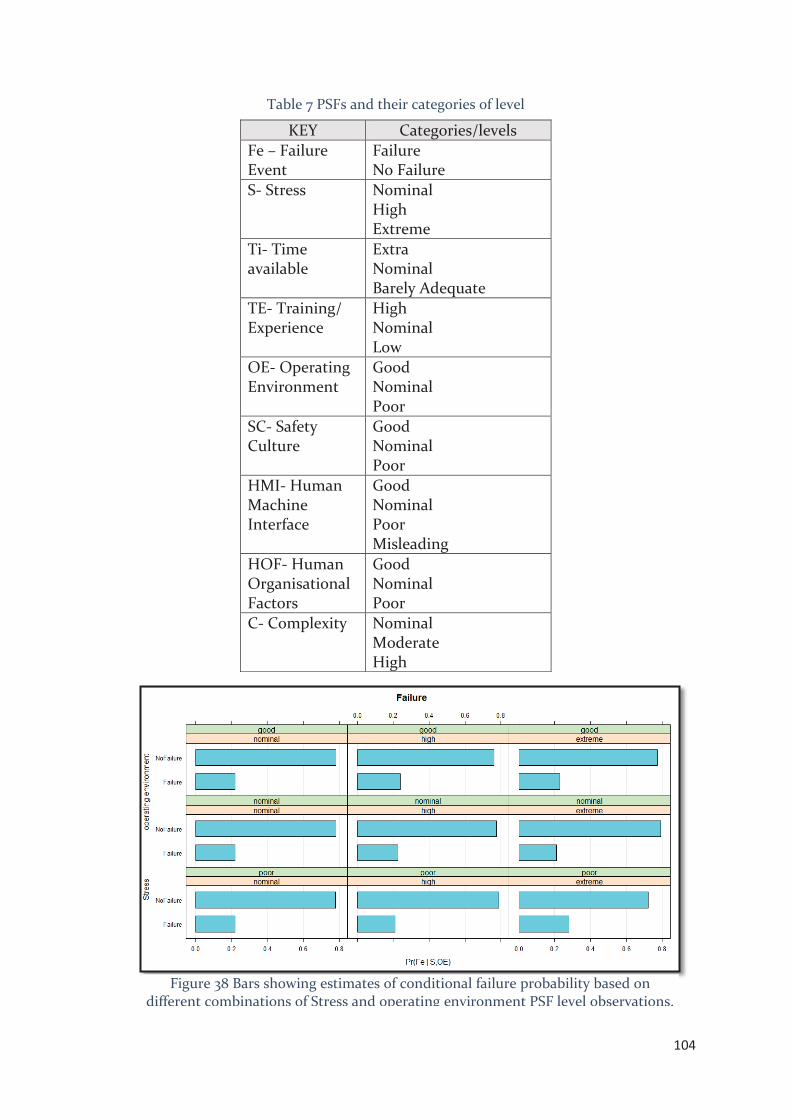
104
Table 7 PSFs and their categories of level
KEY Categories/levels Fe – Failure Event
Failure No Failure
S- Stress Nominal High Extreme
Ti- Time available
Extra Nominal Barely Adequate
TE- Training/ Experience
High Nominal Low
OE- Operating Environment
Good Nominal Poor
SC- Safety Culture
Good Nominal Poor
HMI- Human Machine Interface
Good Nominal Poor Misleading
HOF- Human Organisational Factors
Good Nominal Poor
C- Complexity Nominal Moderate High
Figure 38 Bars showing estimates of conditional failure probability based on different combinations of Stress and operating environment PSF level observations.

105
Failu
re
Stre
ss
Op.
Env
ironm
ent
Safe
ty C
ultu
re
HMI
Figu
re 3
9 D
epic
tion
of h
ow th
e Ba
yesi
an u
pdat
ing
take
s pl
ace
in th
e m
odel
as
new
dat
a be
com
es
avai
labl
e.
Related Documents