Supporting Uncertainty in Standard Database Management Systems Dian Wei Chen A Thesis In the Department of Computer Science and Software Engineering Presented in Partial Fulfillment of the Requirements for the Degree of Master of Computer Science at Concordia University Montreal, Quebec, Canada June 2012 © Dian Wei Chen, 2012

Welcome message from author
This document is posted to help you gain knowledge. Please leave a comment to let me know what you think about it! Share it to your friends and learn new things together.
Transcript

Supporting Uncertainty in
Standard Database Management Systems
Dian Wei Chen
A Thesis
In the Department of
Computer Science and Software Engineering
Presented in Partial Fulfillment of the Requirements
for the Degree of Master of Computer Science at
Concordia University
Montreal, Quebec, Canada
June 2012
© Dian Wei Chen, 2012

ii
CONCORDIA UNIVERSITY
School of Graduate Studies
This is to certify that the thesis prepared
By: Dian Wei Chen
Entitled: Supporting Uncertainty in Standard Database Management Systems
and submitted in partial fulfillment of the requirements for the degree of
Master of Computer Science
complies with the regulations of the University and meets the accepted standards with
respect to originality and quality.
Signed by the final examining committee:
______________________________________ Chair
Dr. Rene Witte
______________________________________ Examiner
Dr. Bipin C. Desai
______________________________________ Examiner
Dr. Dhrubajyoti Goswami
______________________________________ Supervisor
Dr. Nematollaah Shiri
Approved by________________________________________________
Chair of Department or Graduate Program Director
________________________________________________
Dr. Robin A. L. Drew, Dean
Faculty of Engineering and Computer Science
Date ________________________________________________

iii
ABSTRACT
Supporting Uncertainty in
Standard Database Management Systems
Dian Wei Chen
Management of uncertain data in numerous real life applications has attracted the
attention of database and artificial intelligent research communities. This has resulted
in development of new database management systems (DBMS) in which uncertainty
is treated as first class citizens. We follow a different approach in this thesis and
develop a system (DBMS with Uncertainty, or UDBMS) which is capable of
representing and manipulating uncertain data at the application level on top of a
standard relational DBMS. Compared to the first approach which treats uncertainty as
its first class citizens, the proposed approach may be considered as “light weight”
because it is built upon existing database technologies. As the underlying uncertainty
formalism, we consider the Information Source Tracking (IST) method, which is
essentially probabilistic. We extend the standard SQL language with uncertainty (to
which we refer as USQL), to express queries and transactions in our context. The
query processing and optimization techniques are extended accordingly to take into
account the presence of uncertainty. To evaluate the performance of UDBMS, we
conducted extensive experiments using USQL queries and IST relations obtained by
extending the standard TPC-H benchmark queries and generated data. We compare
and discuss the two approaches mentioned for uncertainty management. Our results
indicate that the performance of the proposed UDBMS is reasonably good when the
relations involved can be loaded completely into the main memory.

iv
Acknowledgements
First of all and most important, I would like to express my sincerest gratitude to my
supervisor, professor Nematollaah Shiri. His continuous guideance and support
helped me throughout my master studies. I thank him for his patiance and his valuable
advices in doing researches and preparing this thesis document. Without his help, I
could not achieve this far. I have learnt a lot from him and I consider myself belessed
to work under his supervision.
I would like to thank Concordia University for providing me easy and convenient
access to the computing facilities in the DB research labs and the university library.
I would also like to thank Ali Kiani and all other fellow graduate students in the
database research labs for their technical helps and advice whenever I needed.
Finally, I wish to thank my parents from my heart. Their supports, both financially
and emotionally, have been the main factors for me to purse my studies and face the
challenges during the master‟s program.
v
Table of Contents
List of Figures ................................................................................................................... viii
List of Tables ....................................................................................................................... x
1 Introduction ...................................................................................................................... 1
1.1 Uncertain Data in Applications .................................................................... 2
1.2 Approaches to Uncertain Data Management Systems ................................. 2
1.3 Thesis Contributions ..................................................................................... 5
1.4 Thesis Outline ............................................................................................... 6
2 BackGround and Related Works ................................................................................... 8
2.1 Modeling Uncertainty ................................................................................... 8
2.2 Existing Systems ........................................................................................ 10
2.3 The IST Model to Uncertainty .................................................................... 11
2.4 Manipulations of Source Vectors................................................................ 13
2.5 Extended Relational Algebra Operations in IST ......................................... 14
2.6 Reliability Calculation Algorithms ............................................................. 15
3 Extending SQL with Uncertainty ................................................................................. 17
3.1 Data Definition Component of USQL ........................................................ 18
3.2 Data Manipulation Component of USQL ................................................... 19
3.2.1 INSERT ............................................................................................... 19
3.2.2 DELETE .............................................................................................. 20
3.2.3 UPDATE ............................................................................................. 20

vi
3.2.4 SELECT .............................................................................................. 21
3.3 Limitations of USQL .................................................................................. 23
4 Query Evaluation ........................................................................................................... 25
4.1 Modeling Uncertain Data ........................................................................... 25
4.2 A Generalized Technique for Query Evaluation ........................................ 27
4.3 Evaluation of DDL Commands .................................................................. 28
4.3.1 CREATE .............................................................................................. 29
4.3.2 SHOW and DESCRIBE Commands ................................................... 30
4.4 Evaluation of DML Commands ................................................................. 30
4.4.1 UPDATE ............................................................................................. 30
4.4.2 INSERT ............................................................................................... 32
4.4.3 SELECT .............................................................................................. 33
4.5 Case Study .................................................................................................. 42
5 System Architecture and Implementation ................................................................... 47
5.1 GUI Module ............................................................................................... 49
5.2 Pre-processing Module ............................................................................... 52
5.3 Post-processing Module ............................................................................. 54
5.3.1 Naïve Approach ................................................................................... 55
5.3.2 Improved Approach ............................................................................. 60
5.4 Supports for the Conventional Databases .................................................. 65
6 Experiments, Results, and Analysis ............................................................................. 66
6.1 The Platform Setup ..................................................................................... 66
6.2 Data Generation .......................................................................................... 67

vii
6.3 Queries Selection ........................................................................................ 72
6.4 Performance Evaluation ............................................................................. 76
7 Conclusion and Future Research ................................................................................. 86
References .......................................................................................................................... 88
Appendix ............................................................................................................................ 95

viii
List of Figures
Figure 1. The employee relation ............................................................................ 23
Figure 2. Query evaluation in UDBMS ................................................................. 27
Figure 3. Evaluation plan for the “CREATE DATABASE” command ................ 29
Figure 4. Evaluation plan for the “CREATE TABLE” command ........................ 30
Figure 5. Evaluation plan for the “SVUPDATE” command................................. 31
Figure 6. Evaluation plan for the “RELIABILITYUPDATE” command ............. 32
Figure 7. Evaluation plan for the “INSERT” command ....................................... 33
Figure 8. Rewriting plan for simple queries ......................................................... 35
Figure 9. Evaluation plan for the simple queries .................................................. 36
Figure 10. Evaluation plan for the exclusive queries ............................................ 38
Figure 11. Evaluation plan for the type-S nested queries ..................................... 40
Figure 12. Evaluation plan for queries with the “(MAX | MIN) RE” keyword ... 42
Figure 13. Entity-Relationship of the TPC-H Database Schema .......................... 43
Figure 14. UDBMS System architecture ............................................................... 47
Figure 15. “CREATE DATABASE” command in the GUI .................................. 49
Figure 16. “RELIABILITYUPDATE” command in the GUI .............................. 50
Figure 17. The formatted output of query results with source vectors ................. 51
Figure 18. The formatted output of query results with reliability values ............. 52
Figure 19. Naïve internal representations of data tuples and data sets ................. 56
Figure 20. An algorithm for “ISTtuple_buildup” operation ................................. 57
Figure 21. An algorithm for “ISTtuple-group” operation ..................................... 58
Figure 22. Improved internal representations of data tuples and data sets ........... 61
Figure 23. An algorithm for “ISTtuple_minus” operation .................................... 63
ix
Figure 24. An algorithm for “SV_dependencecheck” operation .......................... 64
Figure 25. An algorithm for “testdata_extend” operation ..................................... 68
Figure 26. Evaluating conventional query in UDBMS/ MySQL DBMS .............. 77
Figure 27. Performance differences between the naïve and the improved
UDBMSs ........................................................................................................ 79
Figure 28. Experiment results of running test queries 0 to 4 in the improved
UDBMS on test databases with 2 information sources .................................. 81
Figure 29. Experiment results of running test queries 0 to 4 in the improved
UDBMS on test databases with 10 information sources ................................ 82
Figure 30. Experiment results of running test queries 5 to 7 in the improved
UDBMS .......................................................................................................... 84
Figure 31. Evaluating all test queries in the improved UDBMS ........................... 85

x
List of Tables
Table 1. Experiment environment ......................................................................... 66
Table 2. Reliability values for the 10 information sources ................................... 71
Table 3. Evaluating conventional query in UDBMS/ MySQL DBMS .................. 77
Table 4. Evaluating test query 1 in the naïve UDBMS ......................................... 78
Table 5. Evaluating test query 1 in the improved UDBMS ................................... 78
Table 6. Experiment results of running test queries 1 to 4 in the improved
UDBMS .......................................................................................................... 81
Table 7. Experiment results of running test queries 5 to 7 in the improved
UDBMS .......................................................................................................... 83
Table 8. Evaluating all test queries in the improved UDBMS .............................. 85

1
Chapter 1
Introduction
Uncertainty arises when people are not sure about the “true” state of the things. For
example, stock traders are uncertain about the profits they will make when buying
stocks; police are uncertain about the next moves the criminal will make; and we are
uncertain about what the weather will be like tomorrow. As described in [Bos 02], the
world itself is an uncertain place.
Uncertain data are data with uncertainty. We do not distinguish between imprecise and
uncertain, and we use the term uncertain for simplicity. However it is worth noticing
that data with uncertainty are different from data with error [Bell 99], while error is
the difference between the measured value and the “true value” of the thing being
measured, uncertainty is a “quantification of the doubt” we may have about the
measurement result. And to be precise [Zhan 08], imprecise means information
available is not specific enough, and the uncertainty indicated it is impossible to
determine whether information available is true or not.
In the rest of this chapter, we first list examples of the applications with uncertain data.
We then discuss current approaches to support uncertain data using conventional
database management systems (DBMSs). This is followed by a list of successful such
projects. Finally, we list the main contributions of this thesis which adopts a different
approach to develop a system to manage uncertainty and we present the thesis

2
organization.
1.1 Uncertain Data in Applications
In what follows we list examples of real-world application systems that deal with
uncertain data [Ge 09], [Sarm 09], [Shir 04]:
1. Information Extraction Systems: the extracted entities, relationships and
attributes are associated with uncertainty when they are extracted from
unstructured information sources.
2. Data Integration Systems: as these systems use schema mapping techniques,
they usually estimate whether the data records from multiple information
sources refer to same entity.
3. Sensor Networks: physical factors, such as noise and battery, usually add
uncertainty to the sensor data generated in such systems.
4. Other Sources: the complex data evaluation plans used in applications such as
weather forecasts require associating the generated answers with uncertainty.
1.2 Approaches to Uncertain Data Management Systems
Limited supports are provided by conventional DBMSs to support incompleteness in
data, represented as null values. Along with imprecision, inconsistency, and
uncertainty, incompleteness is a form of deficiency in data studied extensively in AI
and database research. A survey of approaches to handling imperfect information in

3
data and knowledge base systems can be found in [Pars 96]. For current approaches
to uncertainty in logic programming and deductive databases, interested readers are
referred to [Laks 01].
There are two approaches in general to model and manipulate uncertainty in database
management systems. The first approach is to developing new DBMSs that treat
uncertainty as first-class citizens. We will refer to this as “heavy weight” approach
since such systems are built from scratch. Almost every issue in conventional
databases needs to be reinvestigated with uncertainty semantics since the uncertainty
nature introduces new challenges to be dealt with [Zhan 08]. In an alternate approach,
to which we refer as “light weight”, current DBMSs are extended to support
uncertainty, hence treating uncertainty data as second-class citizens. While the latter
approach is criticized in [Sarm 09] for imposing “a significant burden on
applications”, it is “faster” and “cheaper” to build. The former approach, on the other
hand, as it considers a fixed underlying formalism, greatly limits the power of the
resulting DBMSs.
Examples of database management systems in which uncertainty data are treated as
first-class citizens include the Trio system developed at Stanford university [Benj 06],
[Benj 08], [Sarm 06], [Agra 09], the MayBMS system at Cornell [Anto 07a], [Anto
07b], [Anto 08], and the Orion system at Purdue [Chen 03], [Sing 08].
In what follows, we compare these two approaches to uncertain data management
systems and we list their advantages and disadvantages in terms of extendibility,

4
usability and portability.
1. Extendibility. As new advanced technologies and formalisms for uncertainty
which may require efficient managements of large amount of uncertain data
are likely to show up in near future, systems that support such data should be
easy to extend and deploy. As the DBMSs that follow the first approach are
hard-coded, they cannot be extended easily. In this case, systems developed
following the “light weight” approach are better choices in practice to be
extended and deployed;
2. Portability. There are already numerous uncertainty formalisms available. If
the developers follow the “heavy weight” approach, they have to build new
DBMSs for all uncertainty formalisms from scratch. Although this approach
provides developer with more opportunities for query optimization, lots of
time, money, and labor are required. On the other hand, if the developers
follow the “light-weight” approach, they can support new uncertainty
formalisms more conveniently and faster by extending an existing standard
DBMS or an extended one;
3. Usability. Though users mainly need DBMS to process their uncertain data, it
is likely that they may need tools to manage their conventional data as well.
We believe that while following the “light weight” approach, it will be more
convenient to the users to deal with standard and uncertain data within the
same extended DBMS for the supports for standard data may be at

5
disadvantage as the system that is developed by the “heavy weight” approach
is optimized for manipulating uncertain data;
Because of the above, we in this thesis follow the “light weight” approach to build a
new DBMS with uncertainty on top of a conventional DBMS that supports uncertain
data at the application level.
1.3 Thesis Contributions
In what follows, we list the main contributions of this thesis. For each contribution,
we also point to the chapter or section it is discussed.
1. We introduce an extension of the standard database language SQL with
uncertainty, called USQL, to formulate queries and transactions over uncertain
data (Chapter 3).
2. We extend a conventional relational database model to model and process
uncertain data based on the IST formalism (Section 4.1). We develop a generic
framework for parsing and generating plans for evaluating queries and
transactions expressed in USQL (Chapter 4).
3. We build a running prototype of our proposed DBMS with uncertainty, called
UDBMS, to manipulate uncertain IST data (Chapter 5). We discuss different
designs and options we considered in building the UDBMS prototype with
respect to efficiency and ease of implementation and maintenance (Section
5.4).
6
4. To evaluate the system performance, we adapted the TPC-H benchmark data
and queries in our context. We report the results of our experiments, which
indicate the performance of our UDBMS is reasonably good in particular when
the target databases and relations fit in the main memory (Chapter 6).
1.4 Thesis Outline
The rest of this thesis is organized as follows. In Chapter 2, we review the related
works and we provide a background knowledge about the IST model [Sadr 91a], [Sadr
91b], [Sadr 94], [Sadr 95]. This includes a classification of the types of uncertain data
in database systems, a brief introduction of the Trio, the MayBMS and the Orion
systems, a review of the definition of the terminologies used in the IST model, the
source vectors manipulation, the relational algebra, and the reliability calculation
method.
In Chapter 3, we introduce the new database query language, SQL with uncertainty
(USQL). We explain why a different database query language is required to formulate
queries and transactions in our context. We introduce our extensions to the DDL and
DML components of SQL. We address that some SQL features, such as aggregation
operations, are not supported in USQL, and we explain the reasons.
Chapter 4 describes how the USQL queries are evaluated in the UDBMS. This
includes a description of the steps in the query evaluation processes, and a case study
that demonstrates how a USQL query can be processed in the UDBMS. The system
architecture and modules together with their implementation details are presented in
7
Chapter 5. Specially, we highlight the different options we considered to improve the
efficiency of the query evaluation in the UDBMS.
In Chapter 6, standard TPC-H benchmark is extended and used in our work to
evaluate the ideas and techniques used to develop the UDBMS. We describe the
parameters we considered for generating IST relations and USQL queries used in our
experiments. We report on the experiment results and we analysis the performance of
the UDBMS we proposed.
Finally, concluding remarks and future work are provided in Chapter 7.

8
Chapter 2
Background and Related Work
In this chapter, we will review major recent achievements on uncertain data
management. We will also review the concepts and techniques regarding the
Information Source Tracking (IST) model to provide a background for our work in
this thesis.
2.1 Modeling Uncertainty
There are a number of formalisms proposed for uncertainty, including fuzzy model
based on the fuzzy set theory [Zade 65] and probabilistic model. While fuzzy model
uses fuzzy entities, fuzzy attributes, fuzzy relationship, fuzzy aggregations, and fuzzy
constraints, probabilistic model uses the associated probability values to model such
data. The probabilistic models are widely used, and we explore them in a more
detailed level.
As discussed in [Zhan 08], [Ge 09], there are three types of data uncertainty in the
probabilistic databases: table-level, tuple-level, and attribute-level uncertainty. In
table-level uncertainty, we concern the “coverage” of the group such as how much
percent of objects in the group is present. In tuple-level uncertainty, a probability
number (confidence) is associated with each tuple. And in attribute-level uncertainty,
an attribute is uncertain and we model each value of the attribute as a probabilistic
distribution.

9
Tuple-level uncertainty is more attractive mainly because it results in relations that are
in 1NF and that it is easier to store and operate on. These are the reasons explained in
[Zhan 08], which considered tuple-level uncertainty and used probability
independence mode to aggregate multiple derivations of the same ground tuple.
Independent Model: Suppose in an uncertain data set D, an object (tuple) R has
probability P(R), where P(R) > 0, to occur and all objects are independent. A possible
world W is a subset of D and includes every object R∈D with P(R) = 1. Clearly, the
occurrence probability of a possible world is P(W) = ∏R∈W P(R) × ∏R∉W (1−P(R)).
Let 𝒲 be the set of all possible worlds of D and N be the number of objects with
occurrence probability less than 1. Then 𝒲 =2N. The sum of the membership
probabilities of all possible worlds in W is 1, i.e., P(W)W∈𝒲 = 1.
General Model: In a general case, records in a data set may be correlated. A set of
records R1, ..., Rm are exclusive if at most one of them could appear in a possible
world and P Ri 1≤i≤m ≤1, where P(Ri) is the probability of occurrence of Ri. A set
of exclusive records are also called a generation rule ℛ. Occurrence probability of a
generation rule ℛ is the sum of probabilities of all the records in ℛ, i.e., P(R) =
P ℛ R∈ℛ . Note that a generation rule (virtually regarded as an object) could contain
only one record and different generation rules are independent. Given a set of 𝓂
generation rules 𝒢D = {ℛ1, …, ℛm}, a possible world W is defined as an element in
Rℛ∈𝒢 ′ , where 𝒢′ is a subset of 𝒢D and contains every generation rule ℛ such that
P(ℛ) = 1. Let j ℛ be the number of records in ℛ. The number of all possible worlds

10
with respect to 𝒢D is as follows:
𝒲 = ℛ
ℛ∈𝒢D ,P R =1
( ℛ + 1)
ℛ∈𝒢D ,P R <1
Occurrence probability of a possible world W is defined as:
P W = P(ℛ ∩ W) ×
ℛ∈𝒢D ,ℛ∩W≠∅
(1 − P ℛ )
ℛ∈𝒢D ,ℛ∩W=∅
where P(ℛ ∩ W) refers to the occurrence probability of records which belong to
both ℛ and W.
2.2 Existing Systems
In this section, we review research prototypes of database management systems such
as Trio, MayBMS, and Orion, which treat uncertain data as first-class citizens.
1. Trio Database Management System
Developed in 2005, Trio supports and manages databases with both uncertainty and
lineage. The Uncertainty Lineage DataBase (ULDB) [Benj 06] is developed by
extending the standard SQL and is identical to the independent tuple-level uncertainty
[Zhan 08]. Trio uses an extended SQL, called TriQL, to handle queries, uncertainty,
and lineage. It is a three-layer system and it is implemented on top of PostgreSQL,
which is a conventional relational DBMS. Its core system is implemented in Python
and it mediates between the underlying relational DBMS and Trio interfaces and
applications [Agra 06].
11
2. MayBMS Database Management System
Developed in 2005, MayBMS is based on the U-relations to model uncertain data.
The U-relations are standard relations extended with condition and probability
columns to encode correlations between the uncertain values and probability
distribution for the set of possible words. Notice that the U-relations support
attribute-level uncertainty through vertical decompositions and the use of an
additional (system) column to store tuple ids and undo the vertical decomposition on
demand [Huan 09]. Standard SQL is extended and used as the query and update
language in the MayBMS system. With 2.1-beta as the most recent version, the
system is built entirely inside PostgreSQL with the major changes lie in the system
catalog, parser, and executor [Huan 09].
3. Orion Database Management System
Developed in 2003, Orion is a database management system that can be used to
handle uncertain data in moving object environments. With 2.0 as the most recent
version, the system supports both attribute and tuple uncertainty with arbitrary
correlations. Orion is a two-layer system and it is built on traditional relational DBMS.
It uses probabilistic queries to manipulation uncertainty data, and it includes new
components to cope with such data. [Orion].
2.3 The IST Model to Uncertainty
As proposed in [Sadr 91a], the IST model is a probabilistic model for relational data

12
which models uncertainty at the tuple-level. Data tuples in the IST model are gathered
from “various sources with known reliabilities”. Let I1, …, I𝓀 be the information
sources and t be a data tuple in the IST model. Then an information source Ii (1≤i≤ 𝓀)
is said to be contributing to t if Ii contributes positively or negatively to t. Note that
not every information source has to be contributing to every tuple
The IST model uses “0” to indicate a noncontributing information source to tuple t, “1”
to indicate a source that contributes positively to t, and “-1” to indicate that a source
contributes negatively to t. When the number of contributing information sources is
𝓀, we use vectors of length 𝓀 to indicate the relationship between the information
sources I1, …, I𝓀 and the data tuple t, indicating the kind of contribution each source
had to tuple t. The collection of all vectors of length 𝓀 is called the information
source vectors, or source vectors for short, and is defined as follows:
{<e1,…, e𝓀> | ei∈(0, +1, -1), 1≤i≤ 𝓀 }.
Intuitively, an information source either contributes positively to a tuple in a base
relation or it is noncontributing to the tuple. Normally associated with each tuple in
the base relations in an IST database is a single source vector. As we will see, in
general, associated with each tuple is a set of source vectors in derived relations when
evaluating queries. Also source vectors with entries “-1” are usually associated with
data tuples in derived relations.
Formally, an extended relation schema R in the IST model is a set of attributes
{A1,…,An, I}, where A1,…,An are normal attributes of R and I is a special “source

13
vectors” attribute. Suppose DI is a set that contains all the source vectors in the
database, and D1, …, Dn are the domains of the normal attribute A1, …, An,
respectively. Then an extended relation (instance) r on the extended schema R is
defined as a finite subset of D1×…×Dn×DI.
A data tuple in the IST model is formally denoted as t@u, where t is the “pure” part of
the tuple correspondent to the normal attributes A1, …, An, and u, u∈DI, is the value of
the tuple correspondent to the source vector attribute I.
2.4 Manipulations of Source Vectors
The IST model introduces three operations to manipulate source vectors: “3OR”,
“negation”, and “union”. Consider the contribution values “-1”, “0”, “1” forming a
partially ordered set (a poset) with the orders 0≺1 and 0≺-1, with “lub” as least upper
bound operator.
Consider two source vectors u=(a1, …, an) and v=(b1,…,bn). Then the “3OR” of u and
v, denoted as u||v, is a source vector w=(c1, …, cn) such that ci is calculated as
lub(ai,bi). As a special case, if ci=Τ, where Τ indicates inconsistency is obtained
when a source I contributes both negatively and positively to a tuple w. In general,
“3OR” of two sets of source vectors x={u1, …, up} and y={v1, …, vq}, denoted by x||y,
is the set of source vectors, each of which is a “3OR” of ui and vj, i.e., x||y =
{u1||v1, …, u1||vq, …, up||vq}.
The “negation” of a source vector u=(a1, …, an), denoted as #u, is a source vector

14
(c1, …, cn) such that ci is “1” if ai=-1, ci is “-1” if ai=1, and ci is “0” if ai=0. The
“negation” of a set of source vectors x={u1, …, up} is defined as #x = #u1|| …|| #up.
Finally, the “union” of two sets of source vectors, x={u1, …, up} and y={v1, …, vq},
denoted as x∪y, is defined as {u1, …, up, v1, …, vq}.
2.5 Extended Relational Algebra Operations in IST
Using the above three operations on source vectors, the extended relational algebra
operations in the IST model are formally defined as follows:
σc(r)={t@u∈r, t satisfies condition C};
Πx(r)={t[X]@u∈r};
r∪s={t@u|t@u∈r or t@u∈s}.
Moreover, other standard relational operations extended to the IST model, include the
“intersection”, “Cartesian product”, and “natural join” are defined as follows using
the “3OR” operation to manipulate source vectors [Sadr 91b].
r∩s={t@(u1||u2) | t@u1∈r and t@u2∈s};
r×s={t1⋅t2@(u1||u2) | t1@u1∈r and t2@u2∈s};
r⋈s={t1∘t2@(u1||u2) | t1@u1∈r, t2@u2∈s, and t1 join t2};
Finally, the “set difference” operation in standard relational algebra is extended in the
IST model, defined as follows which uses the “3OR” and “negation” operations to
manipulate source vectors.
r−s={t@u | t@u∈r and t∉s, or t@x∈r, t@y∈s, u=x||(#y)};

15
2.6 Reliability Calculation Algorithms
In what follows, we review the procedure proposed to calculate the reliability of
answers to a query based on the reliability of the information sources assuming that
“different information sources are independent” [Sadr 91a]. Let re(i) be the reliability
of the information source i.
Suppose t@u is a tuple in a query result that u is a source vector. Let u[i] denote the
value of the ith
element of u, where u[i1]= …= u[ip] =1 and u[j1]= …= u[jp]= -1. Then
the reliability rel(t) of tuple t@u may be calculated as follows:
rel(t) = re(i1)× …× re(ip)× (1-re(j1)) ×…×(1-re(jp)).
Now suppose a set x of source vectors is associated with a tuple t in a query result.
That is t@x is returned as an answer, where x={u1, …, up}. In order to calculate the
reliability of tuple t, we consider the independent mode, described as follows. Two
source vectors u1 and u2 in x are said to be independent if for no source j, they both
have a nonzero entry [Sadr 91a]. Under the independence assumption, the reliability
value associated with tuple when the source vectors in x are independent is calculated
as follows:
rel(t) = 1− (1−rel(t@u1)) × …× (1−rel(t@up).
As can be seen from the above, when the source vectors in the set x are
inter-dependent, the set x of source vectors is converted into an equivalent set of
source vectors by including all “1”, “-1” combinations of information sources with
entry 0 and eliminating duplicates in the resulting source vectors. Finally, if we have

16
source vectors v1,…, vq in the equivalent set, we can calculate the reliability of tuple
t@x as follows:
rel(t) = rel(t@v1)+…+rel(t@vq).
17
Chapter 3
Extending SQL with Uncertainty
Relational database query languages such as SQL, Quel, and .QL are insufficient to
formulate queries and transactions over uncertain data, because they address only
particular properties of standard data. Other query languages such as PSQL and TriQL,
which are capable of handling uncertain data, cannot support uncertain data in the IST
model as well. Therefore we need to develop a new database query language using
which a user can manage and retrieve uncertain data to support IST.
Instead of building an entire new query language from scratch, we consider the
standard SQL language and extend it with uncertainty. We will refer to the resulting
language as USQL (SQL with Uncertainty), and we will refer to the new database
management system as UDBMS (DBMS with Uncertainty). Similar attempts of
extending existing query languages with new concepts have been made in different
context [Dey 97], [Egeh 94], [Lore 97], [Sard 90], etc. For instance, SQL is extended
to HSQL to manage data in the historical databases; SQL is extended to Spatial SQL
to manage spatial data; and SQL is extended to IXSQL to manage interval data.
The decision to use SQL as the foundation for the new query language is driven by
the “recognition of efforts to standardize SQL as the database query language” [Egeh
94]. The reason for extending an existing query language, as opposed to developing a
new one, is also influenced by the recognition that both conventional databases and

18
uncertain databases are the subjects of user queries.
We identify three requirements for USQL which are not supported in SQL, as follows:
1. New data manipulation commands are needed for users to manage the
information sources associated with IST databases.
2. New commands are required for users to manage the source vectors associated
with the data tuples.
3. New features are required for users to query the reliability of the resulting
tuples; sort the result tuples in increasing or decreasing order of their
reliabilities; and find the most or least reliable data tuples in a query result.
3.1 Data Definition Component of USQL
In this section, we introduce the data definition component of the USQL language. As
most of these commands are the same as in the standard case, we will focus more on
those data definition commands in USQL that are different from the corresponding
SQL commands.
Detailed description is required for the “CREATE DATABASE” command for it
includes a new optional “HAVING” clause (HAVING <number> SOURCES). The
syntax of the “CREATE DATABASE” in USQL is as follows:
CREATE DATABASE <database_name> [HAVING <number> SOURCES];
A user should always use the “CREATE DATABASE” command with the “HAVING”
19
clause to create a new IST database because he can only initial the number of the
information sources for an IST database in the “HAVING” clause, and he should use
the “CREATE DATABASE” command without the “HAVING” clause to create a new
conventional database.
For example, the following statement creates an IST database named “example_DB”
with 4 information sources:
CREATE DATABASE example_DB HAVING 4 SOURCES;
3.2 Data Manipulation Component of USQL
The data manipulation commands in SQL include “INSERT”, “DELETE”,
“UPDATE”, and queries. Theses commands are extended in USQL to manipulate IST
tuples and relations. We introduce these commands below.
3.2.1 INSERT
The syntax of the “INSERT” command in USQL is as follows:
INSERT INTO <table_name> (<column_list>) VALUES <value_list>
[WITH SV <source_vector>];
The new “WITH SV” clause (WITH SV <source_vector>) is optional in an “INSERT”
statement. But as each tuple in the base relations in IST is associated with at least one
source vector and the “WITH SV” clause is the only place where a user can introduce
the associated source vectors with the inserted tuple, the “INSERT” command should
be used together with the clause “WITH SV” in order to insert a new IST tuple into an

20
IST relation.
3.2.2 DELETE
Similar to the SQL “DELETE” command, the following USQL “DELETE” command
deletes all the data tuples in an IST relation satisfying the conditions expressed in the
query:
DELETE FROM <table_name> WHERE <predicate>;
3.2.3 UPDATE
The USQL “UPDATE” command follows the syntax of the SQL “UPDATE”
command to update the data tuples satisfying the given conditions in the clause:
UPDATE <table_name> SET <attr_list>=<exp_list> WHERE <predicate>;
A variation of the “UPDATE” command, called the “SVUPDATE” command, is
introduced in USQL to update the source vectors associated with the data tuples.
Following is the syntax of a USQL “SVUPDATE” command which updates the
source vectors to “new_source_vector”, for the tuples satisfying the conditions
expresses in the query.
UPDATE <table_name> SET SV=<new_source_vector> WHERE <predicate>;
A second variation of the “UPDATE” command, called the “RELIABILITYUPDATE”
command, is introduced in USQL to update the reliability values for the information
sources. The syntax of the USQL “RELIABILITYUPDATE” statement that updates
the reliability of information source with the identifier “source_identifier” to
21
“new_reliability_value” is as follows:
UPDATE RE OF SOURCE <source_identifier> TO <new_reliability_value>;
3.2.4 SELECT
In this section, we introduce the “SELECT”, “WHERE”, “HAVING”, and the
“ORDER BY” clauses, which are frequently used in queries. To begin with, we list
the main three classes of USQL queries as follows:
1. Conventional queries: These are typical user queries in SQL. An example of
such query is: “What is the unit price of Sofa?”;
2. Queries on Source Vectors: new uncertain queries which ask the conditions
under which the answer tuples are valid. An example of such query would be:
“What is the unit price of Sofa? And what are the conditions under which the
answer is valid?”;
3. Queries on Reliability Values: new uncertain queries that ask the reliability of
the answer tuples. For example: “What is the unit price of Sofa? And how
reliable are the results?”;
Conventional queries are supported in our UDBMS as long as we keep the
“SELECT-FROM-WHERE” structure in USQL. Uncertain queries, on the other hand,
are supported in USQL by including the following four new features:
1. A new clause, “WITH (SV | RE)”, is introduced in USQL. While queries with

22
the “WITH SV” clause are queries on source vectors that ask for the
conditions under which the query results are valid, queries with clause “WITH
RE” are queries on reliability values that ask for the reliability value
associated with every tuple in the query result;
2. A new “ORDER BY RE” predicate is introduced to sort and display the query
results in order by their reliability;
3. Instead of being interested in the results that are valid under certain conditions,
a user is more likely to be interested in the results whose reliability value is
greater than 0.5, for example, thus a new “RE (<|<=|=|>=|>) <value>”
keyword is introduced together with the “HAVING” predicate in USQL;
4. A “(MAX|MIN) RE” keyword is introduced together with the “HAVING”
predicate in USQL on the basis that user may be interested in the most or least
reliable result tuples;
Finally we have the syntax of the queries in USQL as follows:
SELECT <attr_list>
[WITH (SV | RE)]
FROM <table_list>
WHERE <predicate>
[ORDER BY RE]
[HAVING ((MAX | MIN) RE |RE (<|<=|=|>=|>) <value>)];

23
3.3 Limitations of USQL
Although our goal has been to provide as much functionality as possible in USQL, we
have to mention that currently no support is provided by USQL for the “sum”, “count”
and “average” aggregation operations. The following example is borrowed from [Sadr
94] and it explains why we do not support these aggregation opeartions in USQL.
Example 3-1: Consider the relation Employee (Salary) shown in Figure 1.
Figure 1. The Employee(Salary) relation
The alternate world for relation Employee(Salary) consists of four relations, the empty
relation r1 when none of the employee records are valid, plus relation r2 and r3 when
only tuples corresponding to employees “a” and “b” are valid, respectively, and r4
when both employee records are valid. The query sumsalary(Employee) can be
evaluated against the four regular relations r1 to r4 using the alternate world of relation
Employee(Salary). The query answer returned would be 0, 40,000, 60,000, and
100,000, respectively.
Obviously there are more situations to consider when answering queries with
aggregation operations on IST relations. For details of problems in answering such
queries, interested readers can refer to [Sadr 94]. It has been shown that the time
complexity to find all possible answers to such queries over IST relations is

24
exponential in the number of tuples in the argument relations, hence eliminating any
hope of finding an efficient algorithm [Sadr 94].
Instead of listing all possible answers, Sadri focuses more on four particular queries
that involve aggregate operations as follows:
P1. Determining the probability of a specific outcome of an aggregate query;
P2. Finding the largest (or smallest) possible outcome;
P3. Determining whether the outcome could be greater than or equal to (or less
than or equal to) a given value;
P4. Finding the expected-value of the outcome of an aggregate query;
It has been shown that problems P1, P2 and P3 are NP-complete [Gare 79] for the
“sum”, “count”, and “average” aggregation operations, and hence it is highly unlikely
that an efficient algorithm can be found for these problems. Therefore, based on the
reasons illustrated above, we do not provide supports for these aggregation operations
in USQL.
25
Chapter 4
Query Evaluation
In this chapter, we present details of evaluating USQL queries. We will use “query” to
mean requests for information or changes to data. The surrounding context will make
it clear whether the term query used refers to retrieving information and/or modifying.
We describe how a conventional DBMS relational model is extended to modeling and
processing uncertain data based on the IST formulism at the beginning of this chapter.
Following that we present a general technique for query evaluation, based on which
we introduce the correspondent evaluation plans for the USQL queries. A query
example is given at the end of this chapter to illustrate how it can be evaluated by
UDBMS using the proposed evaluation plans.
4.1 Modeling Uncertain Data
Different from conventional databases, IST databases contain additional information
of the source vectors and the information sources. Suitable mechanisms must be
designed in order to build the IST formulism based UDBMS on top of a conventional
DBMS.
First of all let us consider how we can extend the modeling capacity of a relational
DBMS to internally store the source vectors associated with the IST tuples in our
UDBMS. These additional source vectors, as suggested by IST model, are stored in a

26
special attribute “I”. We denote this special attribute the “_sourcevector” attribute in
UDBMS for easier access purpose (an under-score “_” is added in its name to
distinguish it from normal attributes). Each value correspondent to the “_sourcevector”
attribute is a source vector associated with the tuple, and each tuple in the base
relations in our extended data model can only be associated with one source vector.
This special attribute “_sourcevector” is managed automatically by the system. The
system appends it to each new relation created in the IST database, and every
operation on source vectors is re-directed to this attribute.
Secondly, a relation called “_sourcereliability” with attributes “ID” and
“reliability_value” is used by the UDBMS to store the information about sources in an
IST database. The “ID” attribute, whose value is set to auto increment, stores the
identifier of the information source; the “reliability_value” attribute, whose range is
constrained to [0.0,1.0], stores the reliability value of that information source.
Information sources with reliability 0.0 are not reliable, and sources with reliability
1.0 are fully reliable, respectively.
Similar to the “_sourcevector” attribute, the “_sourcereliability” relation is also
managed automatically by the system. The system creates it for every new IST
database generated; and the system re-directs all the operations on information
sources to this relation.
27
4.2 A Generalized Technique for Query Evaluation
An accurate definition of the results to a query is required before we can start to
introduce a generalized technique for evaluating queries in UDBMS.
Definition 4.1 (Results to a Query): The results to a query Q on a database D, denoted
by Q(D), is either a “Success / Failure” or a set of tuples satisfying the specified
conditions. The results to all the DDL commands and “INSERT”, “UPDATE” and
“DELETE” commands are “Success / Failure”, and the result to a USQL query a set
of data tuples.
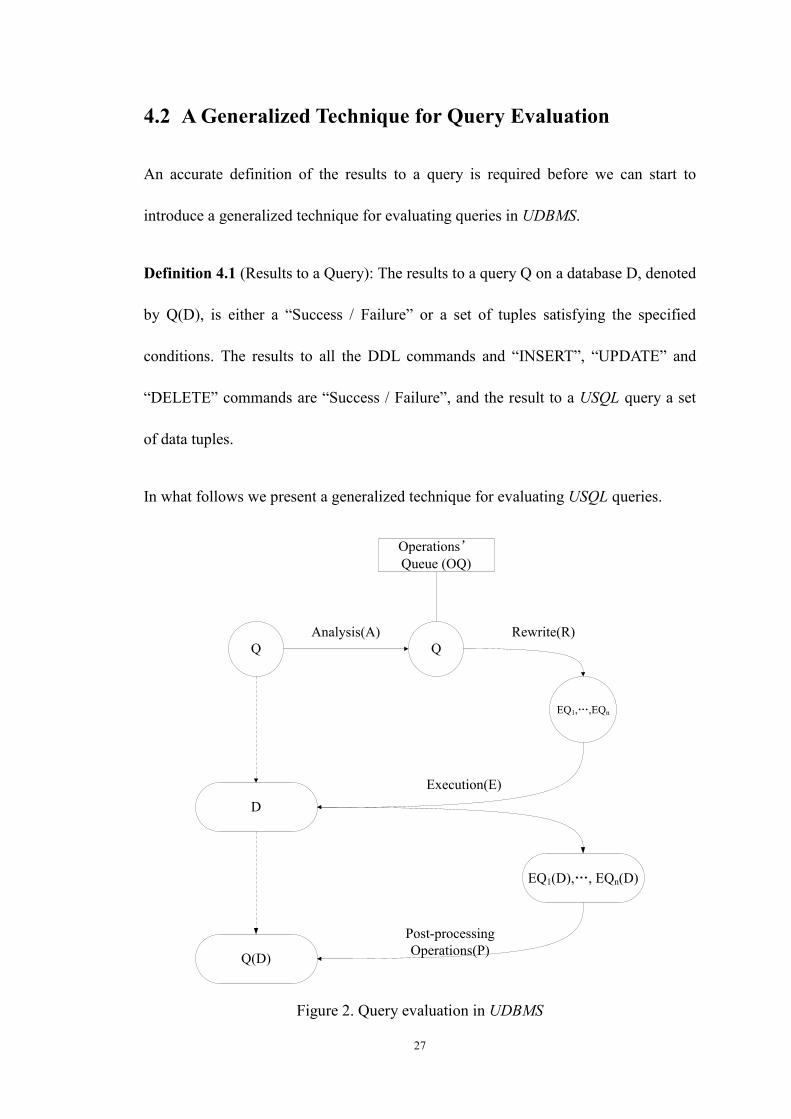
In what follows we present a generalized technique for evaluating USQL queries.
Q(D)
D
Execution(E)
Q
EQ1,…,EQn
Rewrite(R)
EQ1(D),…, EQn(D)
Post-processing
Operations(P)
Q
Analysis(A)
Operations’
Queue (OQ)
Figure 2. Query evaluation in UDBMS

28
Suppose Q is a USQL query and D is a (standard or IST) database. Then the result of
evaluating Q against D, denoted by Q(D), is computed as follows:
1. we analyze Q and D, and depending on the types of D, the predicates and
keywords in Q, we select the corresponding query evaluation plan for Q;
2. when query rewriting is necessary:
a) we rewrite Q to a set of equivalent SQL queries (EQ1, …, EQn),
denoted as R(Q) = {EQ1, …, EQn};
b) we execute EQ1, …, EQn in the back-end DBMS and we obtain
EQ1(D), …, EQn(D), respectively;
c) we check Q‟s evaluation plan and we perform the corresponding
post-processing operations on EQ1(D), …, EQn(D);
3. when Q can be directly evaluated in the back-end DBMS, the result set
returned from the back-end DBMS is then the desired set Q(D);
4.3 Evaluation of DDL Commands
We describe the query evaluation plans for the “CREATE”, “SHOW TABLE”, and
“DESCRIBE TABLE” commands in this section. Other DDL commands, as they are
similar to the corresponding commands in SQL, can be evaluated in UDBMS in the
same way they are evaluated in conventional DBMSs. Hence we do not further
discuss the evaluation plans for these commands here.

29
4.3.1 CREATE
UDBMS needs to pay special attention to the system-owned relation
“_sourcereliability” and attribute “_sourcevector” when evaluating the USQL
“CREATE” command. The evaluation plan for the “CREATE DATABASE” and the
“CREATE TABLE” commands are shown in Figure 3 and 4, in which we clearly
illustrate that the relation “_sourcereliability” is created for every new IST database
and the attribute “_sourcevector” is appended to every new IST relation.
procedure: “CREATE DATABASE” command evaluation
if the “CREATE DATABASE” command contains the “HAVING” clause
1. create the new database;
2. create the “_sourcereliability” relation in that new database;
end if
else
3. create the new database;
end else
end procedure
Figure 3. Evaluation plan for the “CREATE DATABASE” command
procedure: “CREATE TABLE” command evaluation
if the target database is an IST database:
1. append the “_sourcevector” attribute to the new relation;
2. create the new relation;

30
end if
else
3. create the new relation;
end else
end procedure
Figure 4. Evaluation plan for the “CREATE TABLE” command
4.3.2 SHOW and DESCRIBE Commands
Different evaluation plans are required to process the USQL “SHOW TABLE” and
“DESCRIBE TABLE” commands although they can be executed directly in the
back-end DBMS. This is because since the “_sourcereliabilty” relation and the
“_sourcevector” attribute are managed and maintained automatically by the system,
they should not be shown to the users. This is done by additional screening and
blocking operations on the information related to “_sourcereliability” and
“_sourcevector” in the query results of these two commands.
4.4 Evaluation of DML Commands
We describe the evaluation plans for the DML commands of USQL in this section.
More specifically, we will present the evaluation plans for the “UPDATE”, “INSERT”,
and “SELECT”.
4.4.1 UPDATE
Since a USQL “UPDATE” command can be evaluated in UDBMS in the same way it

31
is evaluated in conventional DBMSs, efforts are paid to study the evaluation plans for
the “SVUPDATE” and “RELIABILITYUPDATE” commands. As all the operations
on the source vectors are re-directed to the “_sourcevector” attribute, and all the
operations on the information sources are re-directed to the “_sourcereliablity”
relation; we have the evaluation plans for the “SVUPDATE” and the
“RELIABIITYUPDATE” commands shown in Figure 5 and 6.
procedure: “SVUPDATE” command evaluation
if the target database is an IST database
1. update on the value correspondent to the “_sourcevector” attribute;
end if
else
2. throw an exception to users indicating that the required “SVUPDATE”
command cannot be evaluated;
end else
end procedure
Figure 5. Evaluation plan for the “SVUPDATE” command
procedure: “RELIABILITYUPDATE” command evaluation
if the target database is an IST database
1. update the value correspondent to the “reliability” attribute in the
“_sourcereliability” relation;
end if
else
32
2. throw an exception to users indicating that the required
“RELIABILITYUPDATE” command cannot be evaluated;
end else
end procedure
Figure 6. Evaluation plan for the “RELIABILITYUPDATE” command
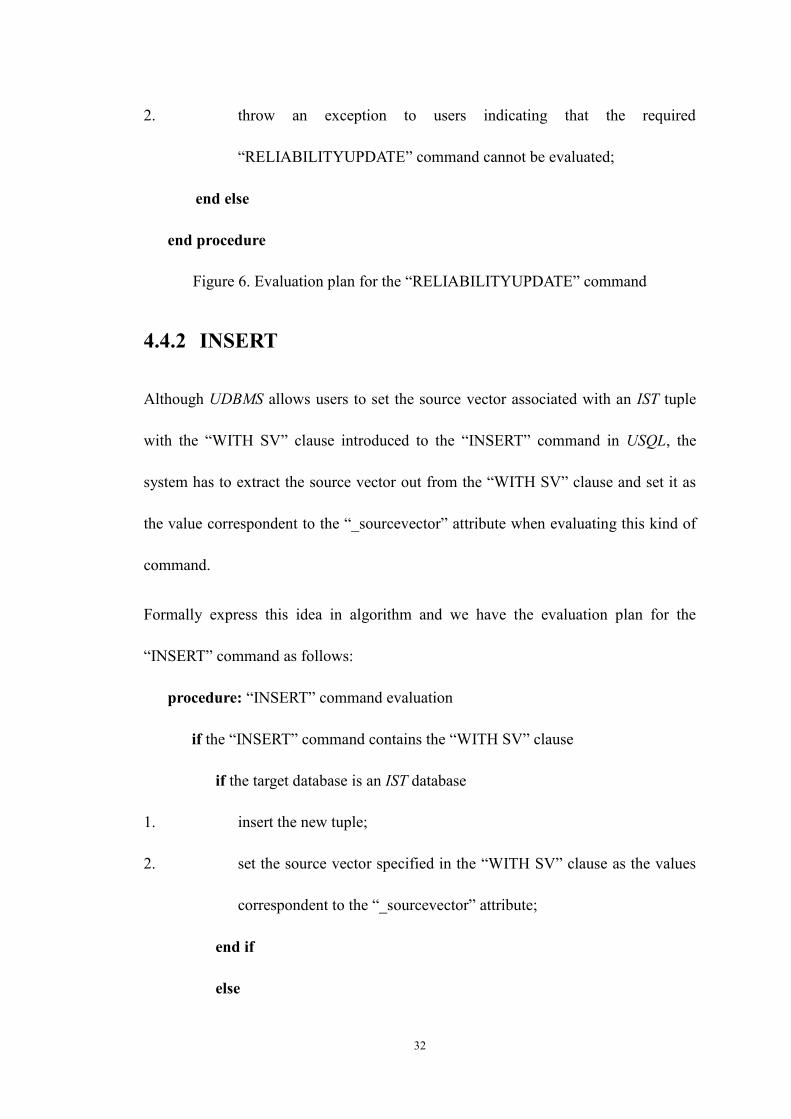
4.4.2 INSERT
Although UDBMS allows users to set the source vector associated with an IST tuple
with the “WITH SV” clause introduced to the “INSERT” command in USQL, the
system has to extract the source vector out from the “WITH SV” clause and set it as
the value correspondent to the “_sourcevector” attribute when evaluating this kind of
command.
Formally express this idea in algorithm and we have the evaluation plan for the
“INSERT” command as follows:
procedure: “INSERT” command evaluation
if the “INSERT” command contains the “WITH SV” clause
if the target database is an IST database
1. insert the new tuple;
2. set the source vector specified in the “WITH SV” clause as the values
correspondent to the “_sourcevector” attribute;
end if
else
33
3. throw an exception to users indicating that the required “INSERT”
command cannot be evaluated;
end else
end if
else
if the target database is an IST database
4. throw an exception to users indicating that the required “INSERT”
command cannot be evaluated;
end if
else
5. insert the new tuple
end else
end else
end procedure
Figure 7. Evaluation plan for the “INSERT” command
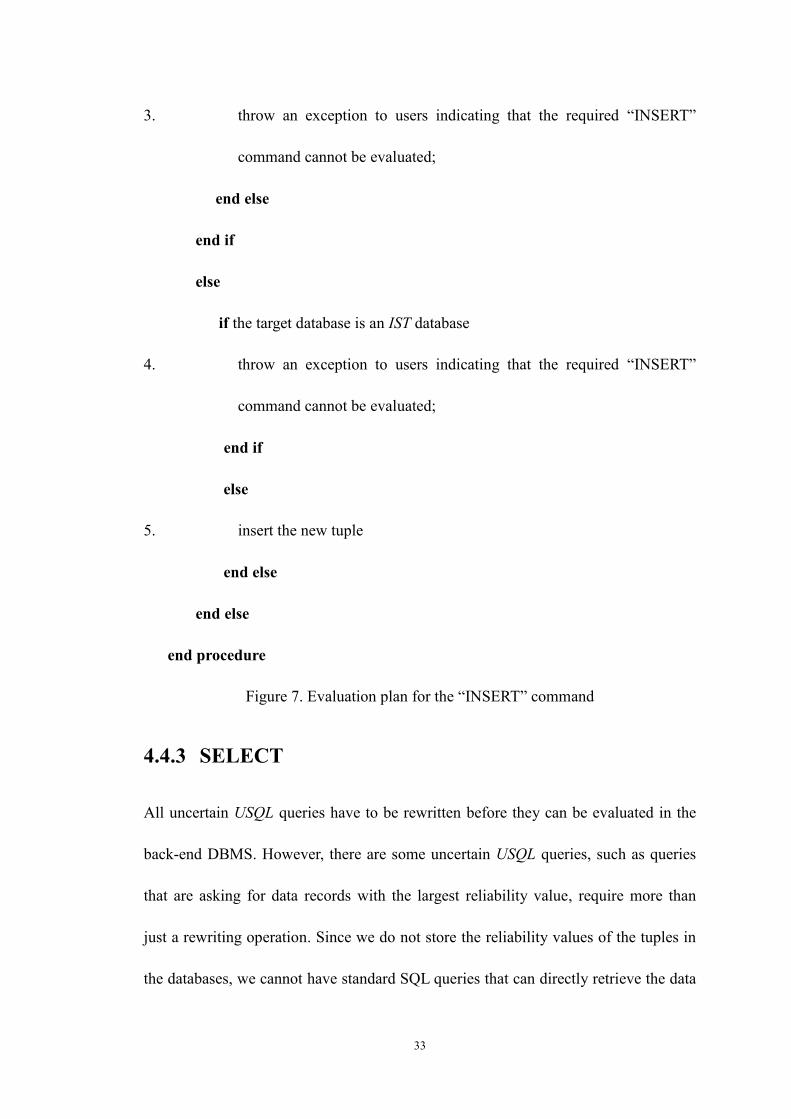
4.4.3 SELECT
All uncertain USQL queries have to be rewritten before they can be evaluated in the
back-end DBMS. However, there are some uncertain USQL queries, such as queries
that are asking for data records with the largest reliability value, require more than
just a rewriting operation. Since we do not store the reliability values of the tuples in
the databases, we cannot have standard SQL queries that can directly retrieve the data

34
records with the largest reliability value. But as we can sort the result tuples in
increasing or decreasing order by their reliability values to find the data records with
the largest reliability value, and we can calculate the reliability values for the result
tuples from their associated source vectors, the problem of evaluating the uncertain
USQL queries on reliability values comes down to the problem of how we can
calculate the source vectors associated with the result tuples. Therefore in what
follows, we will mainly focus on studying how we can evaluate the different kinds of
uncertain USQL queries on source vectors.
Recall that a USQL query has the syntax as follows:
SELECT <attr_list>
[WITH (SV | RE)]
FROM <table_list>
WHERE <predicate>
[ORDER BY RE]
[HAVING ((MAX | MIN) RE |RE (<|<=|=|>=|>) <value>)];
Suppose Ri is a relation in the database D, Ck is the kth
normal attribute of the relation
Ri, X is a constant or a list of constants, op is a scalar comparison operator (=, >, >=,
<, <=) or a set membership operator (IN, NOT IN), then the predicates in the USQL
queries can be denoted by [Ri.Ck op X].
Depending on the conditions (predicates) in the “WHERE” clause, a USQL query Q
could be a simple query, an exclusive query or a nested query, defined as below.

35
Definition 4.2 (Simple Query): a USQL query Q is called simple if Q does not use
any sub-queries nor set operators, such as the set membership operator “NOT IN”, in
its “WHERE” clause.
Definition 4.3 (Exclusive Query): Q is an exclusive query if there is at least one
membership operator “NOT IN” used in its “WHERE” clause.
Definition 4.4 (Nested Query): Q is a nested query if there is at least one sub-query
used in its “WHERE” clause. Furthermore, we say Q is a type-S nested query if its
sub-query is a simple uncertain query, and we say Q is a type-C nested query if its
sub-query contains other sub-queries.
Evaluation of Simple USQL Queries
Based on the definitions of the extended relational algebra operations in the IST
formalisms, we formally express the rewriting plan for the simple queries as follows
(refer to Figure 8, σ is the extended selection operation, ∏ is the extended
projection operation, A1, …, An are normal attributes on which the query projects, and
t1, …, tm are the extended IST relations in the database on which we evaluate the
query).
Figure 8. Rewriting plan for simple queries
Since our UDBMS is built on top of a conventional DBMS, we just need to focus on

36
the operations that have to be carried out by our UDBMS. If we use a queue to store
these operations, the order of them in the queue will be the same order they should be
performed by the UDBMS to evaluate Q. This queue, called the operations‟ queue, is
Q‟s evaluation plan and it is formally defined as below.
Definition 4.6 (Operations Queue, OQ): For every query Q, we associate a queue of
post-processing operations OP1, …, OPn, which the UDBMS performs in order they
appear in the queue. This queue, referred to as the operations‟ queue, is the evaluation
plan for Q.
The query evaluation plan (OQ) for simple queries is shown in Figure 9.
procedure: simple queries evaluation
1. rewrite Q to the equivalent SQL query EQ;
2. execute EQ at the back-end DBMS;
forall t returned from the back-end DBMS
3. perform the “3OR” operation on the values correspondent to the
“t1._sourcevector”, …, “tm._sourcevector” attributes (known as the
“ISTtuple_buildup” operation);
end forall
4. group the source vectors associated with the value-equivalent tuples together
(known as the “ISTtuple_group” operation);
end procedure
Figure 9. Evaluation plan for the simple queries

37
Evaluation of the Exclusive Queries
Based on the definition of the extended set difference operation, we present the query
rewriting plan for an exclusive query Q that:
SELECT <attr_list>
WITH SV
FROM <table_list>
WHERE <predicate> <Ri.Ck NOT IN X>;
to two simple queries Q1 and Q2 as follows:
Q1:
SELECT <attr_list>
WITH SV
FROM <table_list>
WHERE <predicate>;
Q2:
SELECT <attr_list>
WITH SV
FROM <table_list>
WHERE <predicate> <Ri.Ck IN X>;
Both Q1 and Q2 can be evaluated in our UDBMS and we have the evaluation plan for
the exclusive queries as follows:
procedure: exclusive queries evaluation

38
1. find the predicate whose op is the “NOT IN” set membership operator;
2. expand it to two new simple queries Q1 and Q2;
3. execute Q1 and Q2 at the back-end DBMS;
4. refer to the OQ for the simple queries to evaluate Q1 and Q2;
5. “minus” the results to Q2 from the result to Q1 (known as the “ISTtuple_minus”
operation);
end procedure
Figure 10. Evaluation plan for the exclusive queries
Evaluation of the Nested Queries
Similar to how conventional DBMSs evaluate a nested query, UDBMS also starts the
evaluation from the sub-query. And the system recursively performs the following
operations till it has evaluated the whole nested query: it checks the corresponding
evaluation plans and it calculates the result set for that sub-query, it uses the
calculated result set and it tries to evaluate the outer query.
Consider a type-S nested query Q as follows:
SELECT <attr_list>
WITH SV
FROM <table_list>
WHERE <predicates> <Ri.Ck [IN | NOT IN] sQ>;
and suppose the result tuples of sQ are t1@x1, …, tn@xn.
Sub-query sQ is replaced with t1, …, tn, when the original nested query Q becomes a

39
new USQL query Q‟ as follows:
SELECT <attr_list>
WITH SV
FROM <table_list>
WHERE <predicates> <Ri.Ck [IN | NOT IN] t1, …, tn>;
We evaluate Q‟ and we get tuples t1‟@x1‟, …, tm‟@xm‟ as the results to Q‟. But are
t1‟@x1‟, …, tm‟@xm‟ the answers to the nested query Q? Notice that as the source
vectors associated with the data records t1‟, …, tm‟ fail to illustrate the fact that the
tuples we use to replace sQ are uncertain tuples, t1‟@x1‟, …, tm‟@xm‟ are not the
answers to the nested query Q.
That is to say, different from how the conventional DBMSs evaluate a nested query,
UDBMS has to consider the presence of the uncertainty in the data and it needs to
keep track of where the result data tuples are derived from to correctly calculate the
conditions under which the result data tuples are valid. This is done by an additional
modifying operation on Q‟ so that it also projects on the Ri.Ck attribute (shown in
italic as follows).
SELECT <attr_list>, Ri.Ck
WITH SV
FROM <table_list>
WHERE <predicates> <Ri.Ck [IN | NOT IN] t1, …, tn>;
These ideas are formally expressed as the evaluation plan (OQ) for the type-S nested
40
queries, shown in Figure 11:
procedure: type-S nested queries evaluation
1. find the predicate that contains a sub-query (denoted by sQ);
2. refer to the OQs we have studied to calculate the result set of sQ;
3. generate a new USQL query Q‟ by replacing sQ with its result tuples;
4. rewrite Q‟ by including “Ri.Ck” in its “SELECT” statement;
5. refer to the OQs we have studied to evaluate Q‟;
forall t‟ in the results to Q‟
6. find the t in the result set of sQ that t[Ri.Ck]=t‟[Ri.Ck];
7. perform the “3OR” operation on the source vectors associated with t and t‟;
8. set the calculated source vectors as the associated source vectors for t‟;
end forall
end procedure
Figure 11. Evaluation plan for the type-S nested queries
The evaluation plan for the type-C nested queries is almost the same as the one for the
type-S nested queries and hence not further discussed here.
Evaluation of the Queries on Reliability Values
On user‟s demand, we may need to convert the source vectors associated with each
result tuple into a reliability value. We may also need to sort the result tuples by their
reliability values, or to find the result tuples with the largest or smallest reliability
value, etc. The evaluation plans for the queries on reliability values are analogs to

41
each other, and for simplicity, we use the queries with the “(MAX | MIN) RE”
keyword as examples to explain their evaluation plans. Since we have to calculate the
source vectors associated with the answer tuples in order to successfully evaluate
these queries on reliability values and in order to reuse as much as we can from the
evaluation plans we presented for the queries on source vectors, we rewrites the
following query with the “(MAX | MIN) RE” keyword Q1 to Q2, known as its
corresponding queries on source vectors, as follows.
Q1:
SELECT <attr_list>
FROM <table_list>
WHERE <predicate>
HAVING MAX RE;
Q2:
SELECT <attr_list>
WITH SV
FROM <table_list>
WHERE <predicate>;
We can now refer to the evaluation plans we have presented for the query on source
vectors to evaluate Q2, we convert the source vectors associated with the answer
tuples to reliability values, we sort the answer tuples by their reliability values, and we
find the tuples with the largest or smallest reliability value. Formally express these

42
ideas and we have the evaluation plan for the queries with the “(MAX | MIN) RE”
keyword in Figure 12.
procedure: queries with the “(MAX | MIN) RE” keywords evaluation
1. rewrite the query to its corresponding query on source vectors;
2. calculate the source vectors associated with the answer tuples;
forall t in the result set
3. calculate its reliability value (known as the “SV2RE” operation);
end forall
4. sort the result tuples in order by their reliability values (known as the
“ISTtuple_sort” operation);
5. find the result tuples with the largest or the smallest reliability value;
end procedure
Figure 12. Evaluation plan for queries with the “(MAX | MIN) RE” keyword
4.5 Case Study
An example is presented in this section to show how UDBMS can use the evaluation
plans we have introduced to evaluate queries. This example and the test queries
(described in Section 6.3) are based on a sample database defined in the TPC-H
benchmark described as follows.
The components of the TPC-H database are defined to consist of the “PART”,
“SUPPLIER”, “NATION”, “REGION”, “PARTSUPP”, “CUSTOMER”, “LINEITEM”
and “ORDERS” base tables, and the relationships between columns of these base
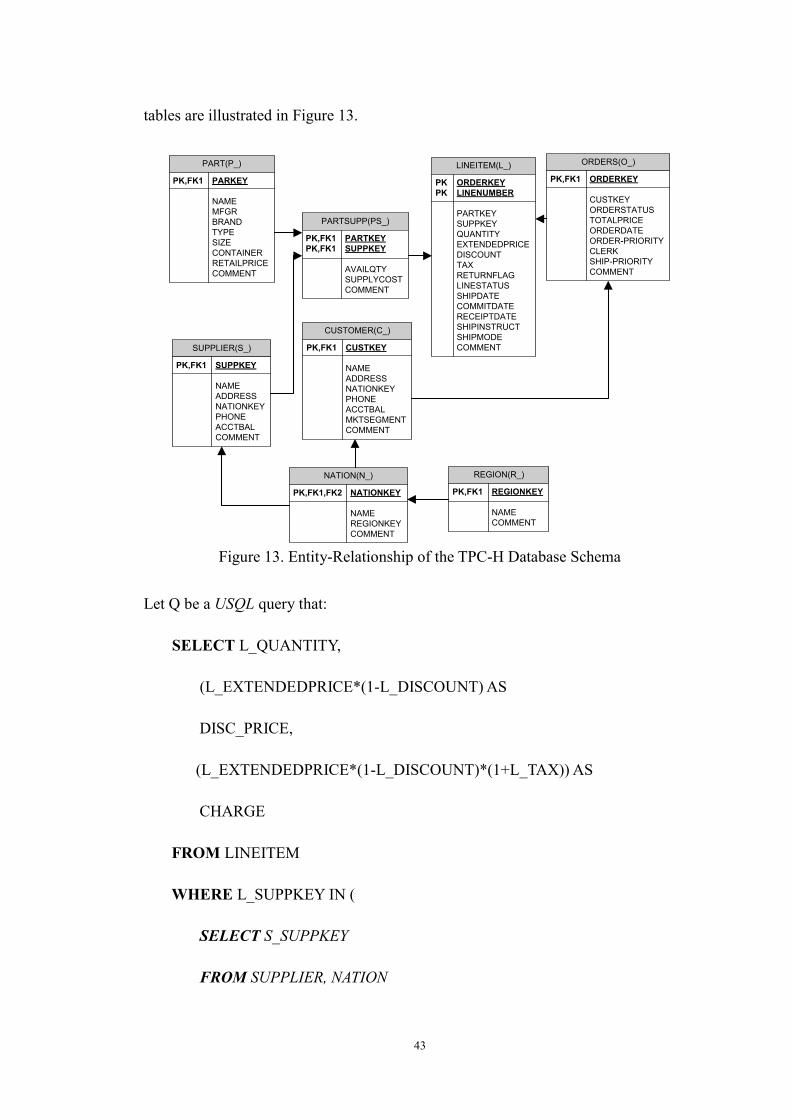
43
tables are illustrated in Figure 13.
LINEITEM(L_)
PK ORDERKEY
PK LINENUMBER
PARTKEY
SUPPKEY
QUANTITY
EXTENDEDPRICE
DISCOUNT
TAX
RETURNFLAG
LINESTATUS
SHIPDATE
COMMITDATE
RECEIPTDATE
SHIPINSTRUCT
SHIPMODE
COMMENT
ORDERS(O_)
PK,FK1 ORDERKEY
CUSTKEY
ORDERSTATUS
TOTALPRICE
ORDERDATE
ORDER-PRIORITY
CLERK
SHIP-PRIORITY
COMMENT
PARTSUPP(PS_)
PK,FK1 PARTKEY
PK,FK1 SUPPKEY
AVAILQTY
SUPPLYCOST
COMMENT
PART(P_)
PK,FK1 PARKEY
NAME
MFGR
BRAND
TYPE
SIZE
CONTAINER
RETAILPRICE
COMMENT
SUPPLIER(S_)
PK,FK1 SUPPKEY
NAME
ADDRESS
NATIONKEY
PHONE
ACCTBAL
COMMENT
CUSTOMER(C_)
PK,FK1 CUSTKEY
NAME
ADDRESS
NATIONKEY
PHONE
ACCTBAL
MKTSEGMENT
COMMENT
NATION(N_)
PK,FK1,FK2 NATIONKEY
NAME
REGIONKEY
COMMENT
REGION(R_)
PK,FK1 REGIONKEY
NAME
COMMENT
Figure 13. Entity-Relationship of the TPC-H Database Schema
Let Q be a USQL query that:
SELECT L_QUANTITY,
(L_EXTENDEDPRICE*(1-L_DISCOUNT) AS
DISC_PRICE,
(L_EXTENDEDPRICE*(1-L_DISCOUNT)*(1+L_TAX)) AS
CHARGE
FROM LINEITEM
WHERE L_SUPPKEY IN (
SELECT S_SUPPKEY
FROM SUPPLIER, NATION

44
WHERE S_NATIONKEY = N_NATIONKEY AND N_NAME=“china”)
AND L_SHIPDATE >= DATE „1995/05/01” AND
L_SHIPDATE <= DATE „1995/07/01‟
HAVING MAX RE;
The UDBMS first analyzes Q and it determines that Q is a type-S nested query. Also
among the resulting tuples, Q only selects those with the largest reliability values
(shown in italic).
Based on the results from the query analysis, UDBMS rewrites Q into a corresponding
query on source vectors, denoted by Q1, as follows:
SELECT L_QUANTITY, (L_EXTENDEDPRICE*(1-L_DISCOUNT) AS
DISC_PRICE, (L_EXTENDEDPRICE*(1-L_DISCOUNT)*(1+L_TAX)) AS
CHARGE
WITH SV
FROM LINEITEM
WHERE L_SUPPKEY IN (
SELECT S_SUPPKEY
FROM SUPPLIER, NATION
WHERE S_NATIONKEY = N_NATIONKEY AND N_NAME=“china”)
AND L_SHIPDATE >= DATE „1995/05/01” AND
L_SHIPDATE <= DATE „1995/07/01‟
HAVING MAX RE;
45
UDBMS checks the evaluation plan for Q1 and it starts to calculate the source vectors
associated with the result tuples from the most inner sub-query, denoted by sQ, as
follows:
1. UDBMS rewrites sQ to its equivalent SQL query:
SELECT S_SUPPKEY, SUPPLIER_sourcevector, NATION._sourcevector
FROM SUPPLIER, NATION
WHERE S_NATIONKEY = N_NATIONKEY AND N_NAME= “china”;
2. UDBMS executes the rewritten query in the back-end database server;
3. UDBMS performs the “3OR” operation on the values that corresponds to
“SUPPLIER._sourcevector”, the “NATION._sourcevector” attributes and
associates the calculated source vectors with each tuple returned from the
back-end database server;
4. UDBMS groups together the source vectors associated with the
value-equivalent tuple.
(Suppose the resulting tuples are t1@x1, …, tn@xn)
Then UDBMS replaces sQ with its result tuples (t1, …, tn) and it modifies the
generated query so that it projects on the “L_SUPPKEY” attribute. The modified
query, denoted by Q2, is shown as follows:
SELECT L_QUANTITY, (L_EXTENDEDPRICE*(1-L_DISCOUNT) AS
DISC_PRICE, (L_EXTENDEDPRICE*(1-L_DISCOUNT)*(1+L_TAX)) AS
CHARGE, L_SUPPKEY
WITH SV

46
FROM LINEITEM
WHERE L_SUPPKEY IN (t1, …, tn) AND L_SHIPDATE >=DATE „1995/05/01”
AND L_SHIPDATE <= DATE „1995/07/01‟;
UDBMS checks the evaluation plan for Q2 and suppose its result tuples are
t1‟@x1‟, …, tm‟@xm‟. For every tuple ti‟@xi‟ (1≤i≤m) in the result set, UDBMS
searches all the tuples in the result set of sQ until it finds a tuple ti@xi (1≤i≤n) such
that ti[L_SUPPKEY] = ti‟[L_SUPPKEY]. It then performs the “3OR” operation on
the source vectors associated with ti and ti‟ to calculate the source vectors associated
with tuple ti‟ in the result set of Q.
Finally, UDBMS calculates the reliability for every tuple in the result set of Q. The
system sorts the resulting tuples in decreasing order of their reliability values, and
displays the tuples with the largest reliability.

47
Chapter 5
System Architecture and Implementation
The proposed database management with uncertainty UDBMS is a single-user,
three-tier system that is made up of four main modules: graphical user interface
module, pre-processing module, post-processing module, and the back-end DBMS
module. The graphical user interface acts as the system‟s presentation tier, the
pre-processing and the post-processing modules form the system‟s application tier,
and the back-end DBMS module is the system‟s data tier. Figure 14 shows the
architecture of the UDBMS.
UDBMS
Conventional DBMS
Graphics User
Interface
User
pre-
Processing
post-
Processing
Figure 14. UDBMS System architecture
48
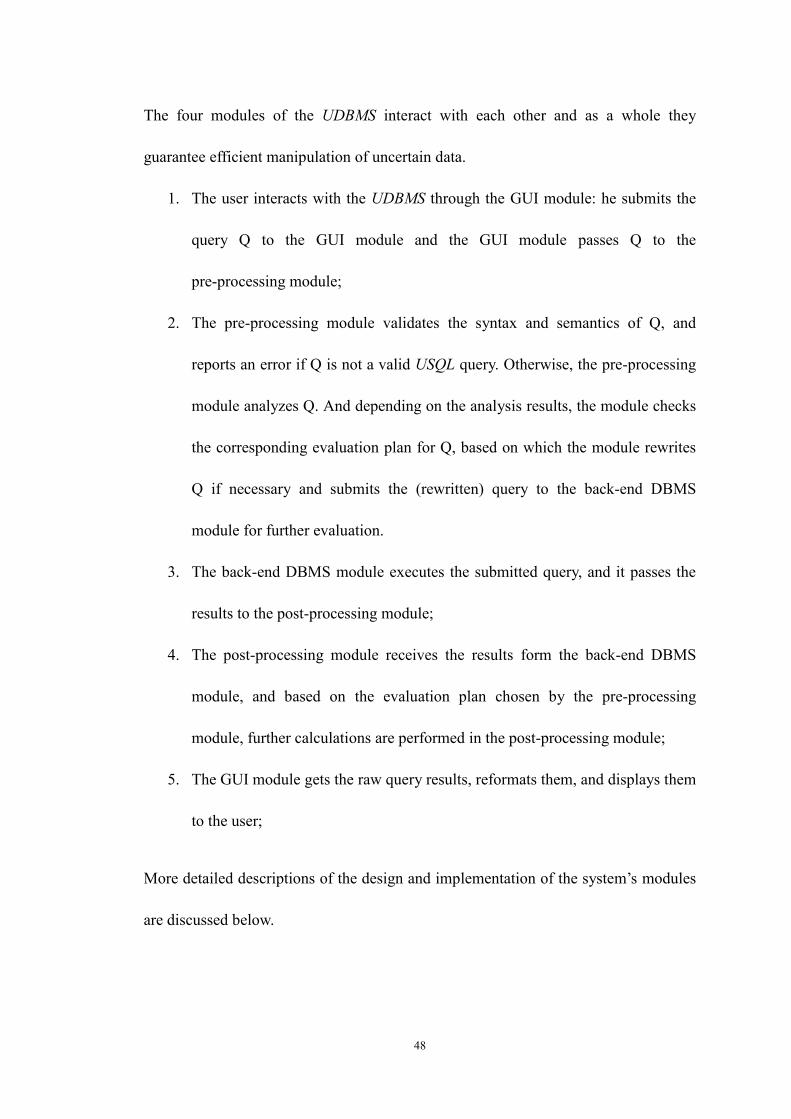
The four modules of the UDBMS interact with each other and as a whole they
guarantee efficient manipulation of uncertain data.
1. The user interacts with the UDBMS through the GUI module: he submits the
query Q to the GUI module and the GUI module passes Q to the
pre-processing module;
2. The pre-processing module validates the syntax and semantics of Q, and
reports an error if Q is not a valid USQL query. Otherwise, the pre-processing
module analyzes Q. And depending on the analysis results, the module checks
the corresponding evaluation plan for Q, based on which the module rewrites
Q if necessary and submits the (rewritten) query to the back-end DBMS
module for further evaluation.
3. The back-end DBMS module executes the submitted query, and it passes the
results to the post-processing module;
4. The post-processing module receives the results form the back-end DBMS
module, and based on the evaluation plan chosen by the pre-processing
module, further calculations are performed in the post-processing module;
5. The GUI module gets the raw query results, reformats them, and displays them
to the user;
More detailed descriptions of the design and implementation of the system‟s modules
are discussed below.

49
5.1 GUI Module
We design the GUI module so that the works on the users‟ side can be minimized.
Take the “CREATE DATABASE” command for example (shown in Figure 15): a user
only need to provide the name of the new database and the number of the information
sources to create a new IST database, as the GUI module will help he to complete the
whole “CREATE DATABASE” command in the background.
Figure 15. “CREATE DATABASE” command in the GUI
Also consider the “RELIABILITYUPDATE” command as an example: a user does
not have to use separate “RELIABILITYUPDATE” commands if he wants to update
the reliability values for multiple information sources as an interactive table (the
interactive table for an IST database with 4 information sources is shown in Figure 16)
is provided by the GUI module to the user to simultaneously update the reliability
values for the information sources.
50
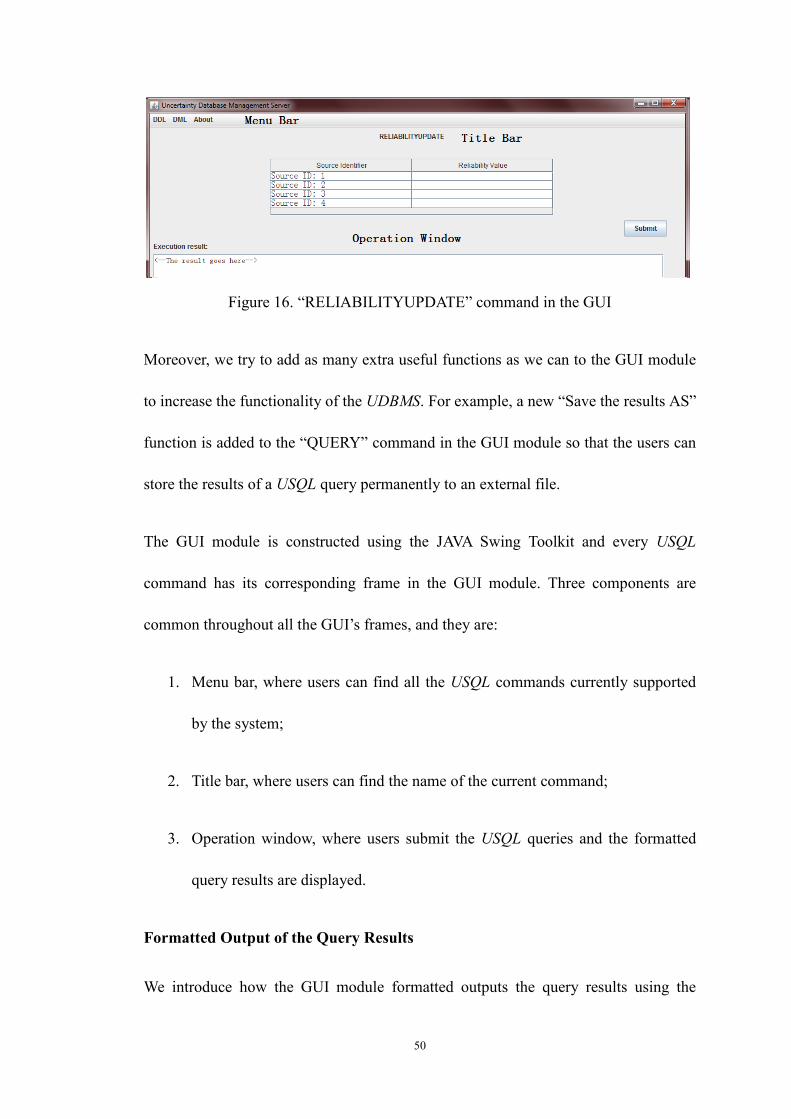
Figure 16. “RELIABILITYUPDATE” command in the GUI
Moreover, we try to add as many extra useful functions as we can to the GUI module
to increase the functionality of the UDBMS. For example, a new “Save the results AS”
function is added to the “QUERY” command in the GUI module so that the users can
store the results of a USQL query permanently to an external file.
The GUI module is constructed using the JAVA Swing Toolkit and every USQL
command has its corresponding frame in the GUI module. Three components are
common throughout all the GUI‟s frames, and they are:
1. Menu bar, where users can find all the USQL commands currently supported
by the system;
2. Title bar, where users can find the name of the current command;
3. Operation window, where users submit the USQL queries and the formatted
query results are displayed.
Formatted Output of the Query Results
We introduce how the GUI module formatted outputs the query results using the
51
following IST tuples as examples:
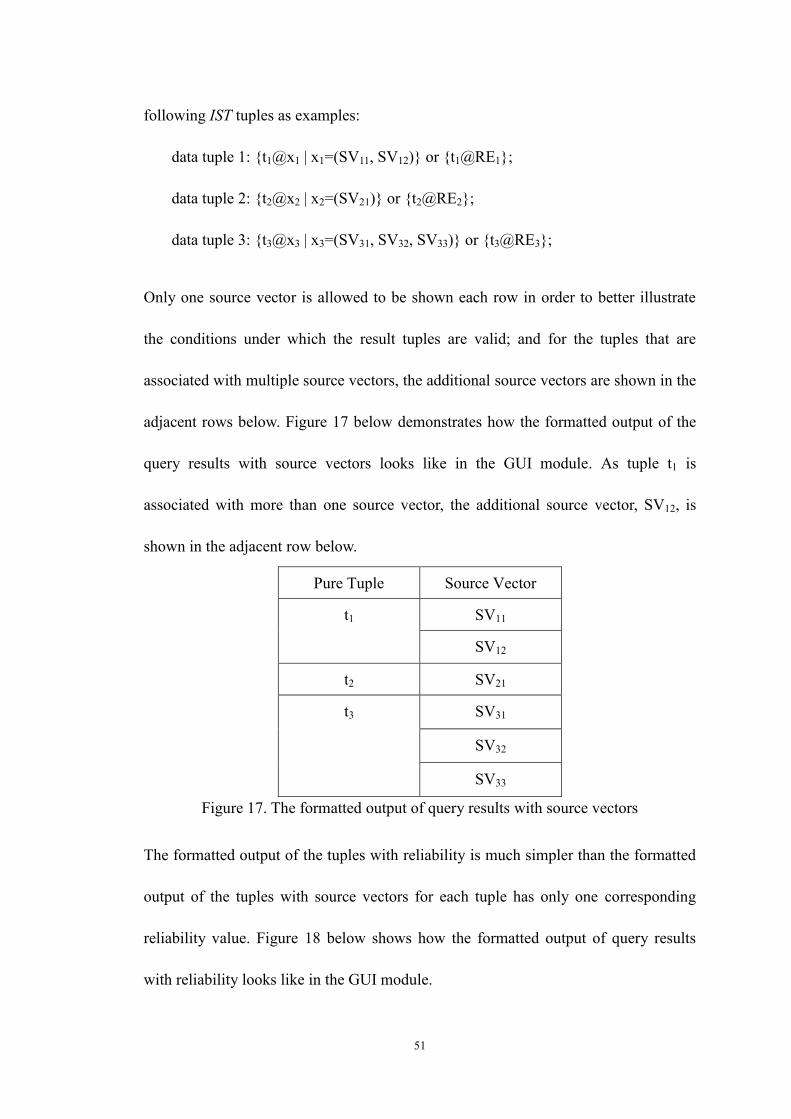
data tuple 1: {t1@x1 | x1=(SV11, SV12)} or {t1@RE1};
data tuple 2: {t2@x2 | x2=(SV21)} or {t2@RE2};
data tuple 3: {t3@x3 | x3=(SV31, SV32, SV33)} or {t3@RE3};
Only one source vector is allowed to be shown each row in order to better illustrate
the conditions under which the result tuples are valid; and for the tuples that are
associated with multiple source vectors, the additional source vectors are shown in the
adjacent rows below. Figure 17 below demonstrates how the formatted output of the
query results with source vectors looks like in the GUI module. As tuple t1 is
associated with more than one source vector, the additional source vector, SV12, is
shown in the adjacent row below.
Pure Tuple Source Vector
t1 SV11
SV12
t2 SV21
t3 SV31
SV32
SV33
Figure 17. The formatted output of query results with source vectors
The formatted output of the tuples with reliability is much simpler than the formatted
output of the tuples with source vectors for each tuple has only one corresponding
reliability value. Figure 18 below shows how the formatted output of query results
with reliability looks like in the GUI module.
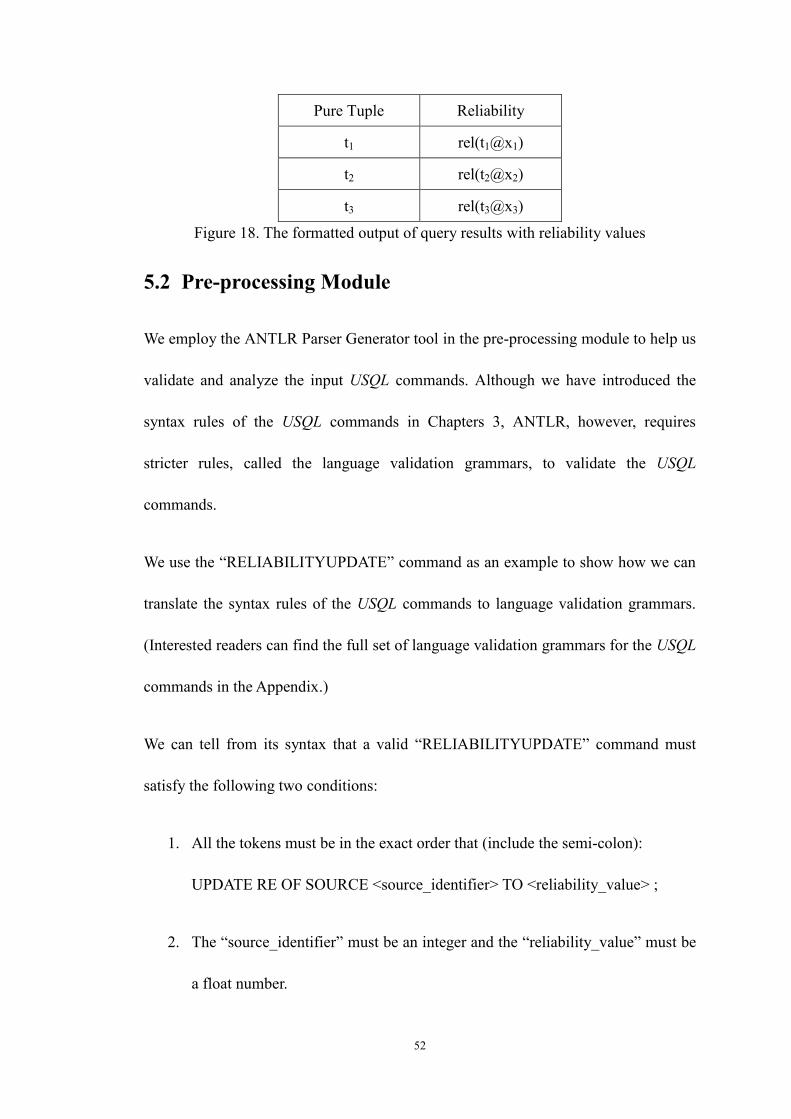
52
Pure Tuple Reliability
t1 rel(t1@x1)
t2 rel(t2@x2)
t3 rel(t3@x3)
Figure 18. The formatted output of query results with reliability values
5.2 Pre-processing Module
We employ the ANTLR Parser Generator tool in the pre-processing module to help us
validate and analyze the input USQL commands. Although we have introduced the
syntax rules of the USQL commands in Chapters 3, ANTLR, however, requires
stricter rules, called the language validation grammars, to validate the USQL
commands.
We use the “RELIABILITYUPDATE” command as an example to show how we can
translate the syntax rules of the USQL commands to language validation grammars.
(Interested readers can find the full set of language validation grammars for the USQL
commands in the Appendix.)
We can tell from its syntax that a valid “RELIABILITYUPDATE” command must
satisfy the following two conditions:
1. All the tokens must be in the exact order that (include the semi-colon):
UPDATE RE OF SOURCE <source_identifier> TO <reliability_value> ;
2. The “source_identifier” must be an integer and the “reliability_value” must be
a float number.

53
The definition of the integer and the decimal numbers are borrowed from other
ANTLR application [Antlr], and finally we have the language validation grammar for
the “RELIABILITYUPDATE” command as follows:
1. UPDATE RE OF SOURCE integer TO float ;
2. integer: '0'..'9'+;
3. float: integer '.' integer;
Example 5-1: Determine which ones of the following commands are valid
“RELIABILITYUPDATE” commands.
Input A: UPDATE RE OF SOURCE 1 TO 0.6;
Input B: UPDATE SOURCE 1 TO 0.6;
Input C: UPDATE RE OF SOURCE 2 TO 2.0;
Analyze: The first input, input A, is a valid “RELIABILITYUPDATE” command.
Input B is not a valid “RELIABILITYUPDATE” command because tokens such as
“RE” and “OF” are missing. Note that the third command, input C, is also a valid
“RELIABILITYUPDATE” command as it satisfies the language validation grammar
of the “RELIABILITYUPDATE” command.
As the ANTLR parser generator tool only checks the syntax rules of the USQL
commands, further semantics checking are required in the pre-processing module
before it can refer to the query evaluation plan and rewrite the USQL commands. Also
take the input C in Example 5-1 as an example, after Input C has been broken down to
tokens by the ANTLR parser generator tool, the pre-processing module detects that
54
the value corresponding to the “reliability_value” is 2.0, which is out of the range [0.0,
1.0], and the pre-processing module reaches a conclusion that Input C is not a valid
USQL “RELIABILITYUPDATE” command.
5.3 Post-processing Module
Although not every evaluation plan involves post-processing operations in the
post-processing module, the post-processing module is still considered the core of our
system. As the number of the data tuples the post-processing module has to consider
usually reaches high magnitude, suitable and efficient storing mechanisms and
algorithms must be carefully designed in order to achieve high performance from the
UDBMS.
Two important properties are found for the IST data tuples:
1. The number of the elements that the IST data tuples contain may be different
among different query evaluation processes, and the number of the elements
that an IST data tuple contains may also be different as the number of the
source vectors associated with the IST tuple may change in a query evaluation
process;
2. The data types for the elements that an IST data tuple contains may be varied
for it is common for a tuple to have some elements that are integers and some
elements that are strings;

55
And two important properties are found for the data sets:
1. The number of the IST data tuples that the data sets contain may be different
among different query processing processes, and the number of the IST data
tuples that a data set contains may also be different as the value-equivalent
tuples are grouped together in a query processing process;
2. Frequent random access to the IST data tuples in the data sets are possible for
the system may have to group some of the data tuples together and sort the
data tuples in increasing or decreasing order by their corresponding reliability
values;
Simple data storage structures such as Array are then not suitable to internally
represent the data tuples and the data sets in the UDBMS since it is hard to find a
suitable size for the Array, the size may be so small that the Array may encounter
“overflow”, and the size may be so large that much of the space is never used.
5.3.1 Naïve Approach
As the ArrayList data structure supports run-time “add” and “remove” functions, it
can be used to internally represent the data tuples and the data sets in the UDBMS.
Suppose ℛ is a data set with n data tuples, ti@xi (1≤i≤n) is a data tuple in ℛ with ti
{V1, …, Vp} as its the pure tuple and xi {SV1, …, SVq} as its associated source
vectors, then the ArrayLists that are used represents by the UDBMS to internal
represent the data tuple ti@xi and the data set ℛ are constructed as follows:

56
ti@xi: {ALi.add(V1); ...; ALi.add(Vp); ALi.add(SV1); …; ALi.add(SVq);}
R: {AL.add(AL1); …; AL.add(ALn);}
Figure 19 shows how the data set ℛ and the data tuples are internally represented in
the UDBMS.
... ti@xi ti+1@xi+1
V1
...
Vp
SV1
...
SVq
...
Data Set
Data Tuple
Figure 19. Naïve internal representations of data tuples and data sets
The “ISTtuple_buildup” Operation
The idea of the “ISTtuple_buildup” operation is formally expressed as an algorithm
shown in Figure 20. The input of this algorithm is a set ℛ of raw data records passed
from the back-end DBMS, and the output is a set ℛ′ of calculated IST tuples.
procedure: “ISTtuple_buildup” operation
forall t returned from the back-end DBMS
1. perform the “3OR” operation on the values correspondent to the

57
“t1._sourcevector”, …, “tm._sourcevector” attributes;
2. set the calculated results as the associated source vectors for t;
3. add t to the output data set ℛ′;
end forall
end procedure
Figure 20. An algorithm for “ISTtuple_buildup” operation
Analysis: We can see from the algorithm that the performance of this
“ISTtuple_buildup” operation is directly related to the number (q) of the source
vectors associated with the data tuples and the number (n) of the data tuples passed
from the back-end DBMS. As q is usually several magnitudes smaller than n, we can
say that this “ISTtuple_buildup” operation reaches linear time complexity with
respect to n, the number of the data tuples that are passed from the back-end DBMS.
The “ISTtuple_group” Operation
The idea of the “ISTtuple_group” operation is formally expressed as an algorithm
shown in Figure 21. The input of this algorithm is a set ℛ of IST tuples which may
share same pure tuples, and the output is a set ℛ′ of IST tuples which do not share
same pure tuples.
procedure: “ISTtuple_group” operation
1. add the first data tuple t1 in ℛ to the output data set ℛ′;
forall t in ℛ (except t1)
2. find a tuple t‟ in ℛ′ that is a value-equivalent tuple for t;
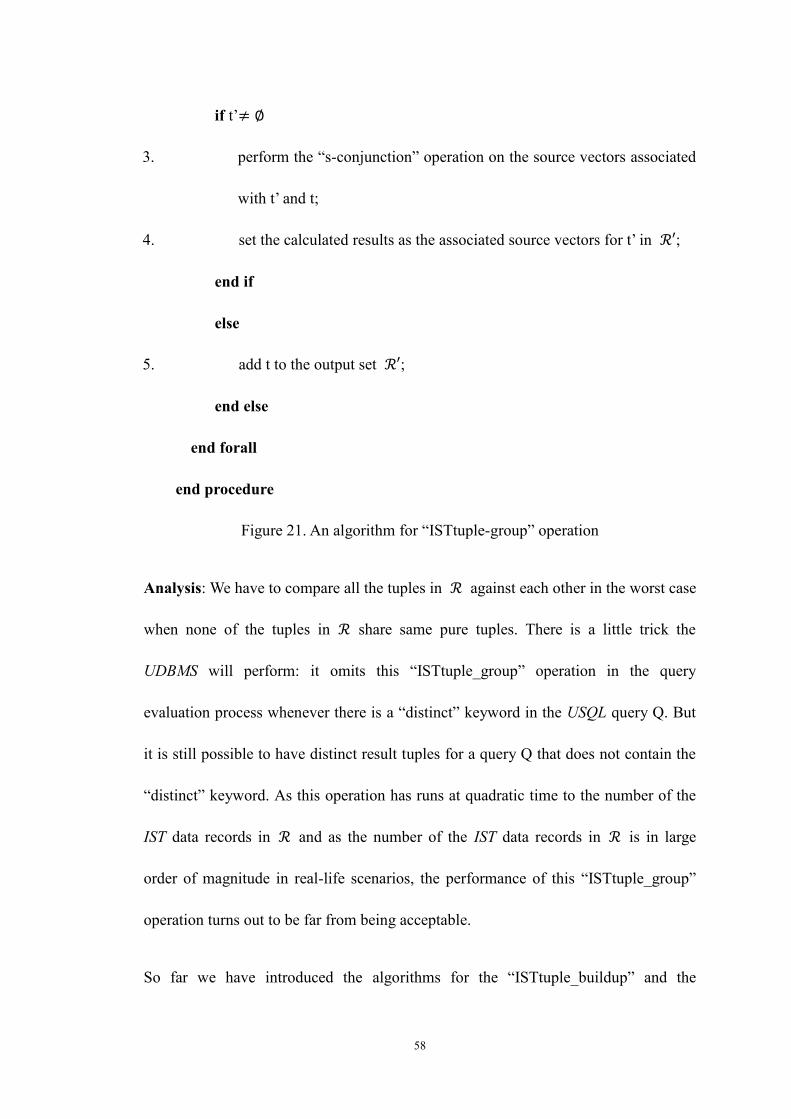
58
if t‟≠ ∅
3. perform the “s-conjunction” operation on the source vectors associated
with t‟ and t;
4. set the calculated results as the associated source vectors for t‟ in ℛ′;
end if
else
5. add t to the output set ℛ′;
end else
end forall
end procedure
Figure 21. An algorithm for “ISTtuple-group” operation
Analysis: We have to compare all the tuples in ℛ against each other in the worst case
when none of the tuples in ℛ share same pure tuples. There is a little trick the
UDBMS will perform: it omits this “ISTtuple_group” operation in the query
evaluation process whenever there is a “distinct” keyword in the USQL query Q. But
it is still possible to have distinct result tuples for a query Q that does not contain the
“distinct” keyword. As this operation has runs at quadratic time to the number of the
IST data records in ℛ and as the number of the IST data records in ℛ is in large
order of magnitude in real-life scenarios, the performance of this “ISTtuple_group”
operation turns out to be far from being acceptable.
So far we have introduced the algorithms for the “ISTtuple_buildup” and the

59
“ISTtuple_group” operations for the UDBMS, and from their analysis we find that
their performances are far from satisfaction, especially the “ISTtuple_group”
operation. Reasons for these bad performances lay in the data storage mechanisms we
designed for the data tuples and the data set:
1. Although the ArrayList structure supports run-time “add” and “remove”
operations, it introduces new problems to the system. For example, the “add”
operation requires all the elements in the ArrayList to be shifted backwards and
the “remove” operation requires all the elements in the ArrayList to be shifted
forwards in the worst case. Since the “add” and “remove” operations are
commonly used to group the data tuples in the data sets, ArrayList is not the
suitable storing structure for the data sets in the UDBMS;
2. Extra time is spent on separating the pure tuple from the source vectors since we
use a single ArrayList to internally represent an IST tuple. And because we usually
treat the pure tuple and the associated source vector separately in the
post-processing operations, the single ArrayList structure may not be suitable to
internally represent the IST data tuples in the UDBMS;
Therefore, it is impossible to find more efficient algorithms for the “ISTtuple_buildup”
and the “ISTtuple_group” operations, and we do not consider the 3 other operations in
this naïve approach as it is also impossible to find efficient implementations for them.

60
5.3.2 Improved Approach
We stated in Section 4.4.3 that the ordered sequence of the data tuples in the data sets
is not required unless the USQL queries contain the “ORDER BY RE”, the
“(MAX|MIN) RE” and the “RE (<|<=|=|>=|>) <value>” keywords. In other words, the
ordered sequence of the data tuples is not required before the system has calculated
the associated source vectors and the corresponding reliability values for the data
tuples in the data sets. Other structure, the HashSet, is hence a more suitable storing
structures for the data sets in our UDBMS since it offers constant time performance
for the basic “add”, “remove” operations and it guarantees duplicate-free collection of
the elements it keeps. Moreover, the nested ArrayList structure is used to internal
represent the IST data tuples in the UDBMS since we usually treat the pure tuple and
the source vectors separately in the post-processing module,.
Suppose ℛ is a data set with n data tuples, ti@xi (1≤i≤n) is a data tuple in ℛ with ti
{V1, …, Vp} as its the pure tuple and xi {SV1, …, SVq} as its associated source
vectors, then the storing structure used by the UDBMS to internally represents the IST
tuple ti@xi is constructed as follows:
ti@xi: {{Pure_Tuple.add(V1); ...; Pure_Tuple.add(Vp);};
{Source_Vectors.add(SV1); …; Source_Vectors.add(SVq);}}
In order to use the HashSet to internally represent the data sets in the UDBMS, we
must first study how we can generate the hash code for the IST data tuples in the data
sets. If we calculate the hash code of an IST data tuple ti@xi as the hash code of its

61
pure tuple ti, denoted by hashcode(ti@xi) = hashcode(ti), and we define the operation
to be taken when two data tuples share same hash code as the “s-conjunction”
operations on their associated source vectors, we do not have to perform the
“ISTtuple_group” post-processing operation to make sure that all the data tuples in
the data sets contain distinct pure tuples. Figure 22 shows how the data set ℛ and the
data tuple ti@xi are internally represented in the improved approach.
Data Set
Data Tuple
ti@xi
ti+1@xi+1
...
...
Pure
Tuple
Source
Vectors
V1
...
Vp
SV1
...
SVq
Figure 22. Improved internal representations of data tuples and data sets
The “ISTtuple_buildup” Operation
Implementation of the “ISTtuple_buildup” operation is much the same as the one in
the naïve approach, and it also runs at linear time with respect to the number of the
data tuples passed from the back-end DBMS.
The “ISTtuple_minus” Operation
The UDBMS performs the “ISTtuple_minus” operation on the data sets Q1(D) and
Q2(D) to calculate a data set Q(D) that Q(D)=Q1(D)-Q2(D). As the methods of how
we can calculate the source vectors associated with the result data tuples in Q(D)

62
differs on whether the data tuples from Q1(D) also appear in Q2(D), we have to decide
for each IST tuple in Q1(D) if there exists a value-equivalent tuple for it in Q2(D).
Since we have defined the hash code of the data tuples be the hash code of their pure
tuples, we can try to “add” all the tuples in Q2(D) to the HashSet that represents the
Q1(D) to check whether the tuples in Q2(D) are the value-equivalent tuples for the
tuples in Q1(D) based on the foundation that the “add” operation fails if there exists a
tuple that share same hash code with the to-be-inserted tuple.
These ideas of the “ISTtuple_minus” operation are formally expressed as an
algorithm shown in Figure 23. The inputs of this operation are two sets Q1(D) and
Q2(D), and the output is a set Q(D) whose data tuples satisfies Q(D)= Q1(D)- Q2(D).
procedure: “ISTtuple_minus” operation
forall t in Q2(D)
1. add t to the HashSet that represents Q1(D);
if there exists a t‟ in Q1(D) that hashcode(t)=hashcode(t‟)
2. perform the “s_negation” operation on the source vectors associated
with t;
3. perform the “3OR” operation on #t and the source vectors associated
with t‟;
4. set the calculated results as the source vectors associated with t‟ in
Q1(D);
end if

63
else
5. proceed to the next tuple in Q2(D);
end else
end forall
end procedure
Figure 23. An algorithm for “ISTtuple_minus” operation
Analysis: The performance of this “ISTtuple_minus” operation only depends on the
number of the data tuples in Q2(D) and the number of the associated source vectors
for the data tuples in Q1(D) and Q2(D). Since the number of the source vectors
associated with the data tuples in Q1(D) and Q2(D) is usually several magnitudes
smaller than the number of the data tuples in Q2(D), this “ISTtuple_minus” operation
will run in linear time with respect to the number of the data tuples in Q2(D).
The “SV2RE” Operation
We have presented how we can convert a set of source vectors to a reliability value
for a tuple when we reviewed the IST formulism in Chapter 2, and hence we do not
repeat the process in this section and we only consider how we can detect whether the
source vectors are independent source vectors.
Suppose we have a tuple t that is associated with a set of source vectors SV1, …, SVn
when we evaluate a USQL query Q on an IST database D with k information sources,
and we can perform the following operations to check whether SV1, …, SVn are
independent source vectors:
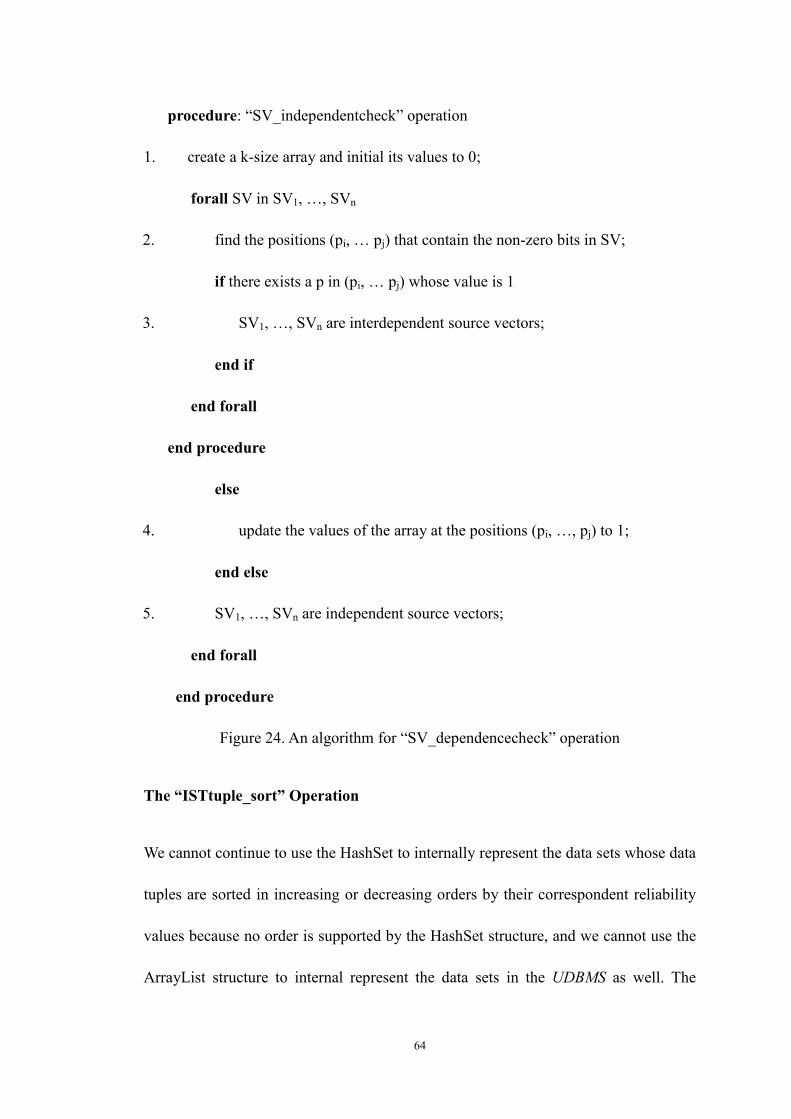
64
procedure: “SV_independentcheck” operation
1. create a k-size array and initial its values to 0;
forall SV in SV1, …, SVn
2. find the positions (pi, … pj) that contain the non-zero bits in SV;
if there exists a p in (pi, … pj) whose value is 1
3. SV1, …, SVn are interdependent source vectors;
end if
end forall
end procedure
else
4. update the values of the array at the positions (pi, …, pj) to 1;
end else
5. SV1, …, SVn are independent source vectors;
end forall
end procedure
Figure 24. An algorithm for “SV_dependencecheck” operation
The “ISTtuple_sort” Operation
We cannot continue to use the HashSet to internally represent the data sets whose data
tuples are sorted in increasing or decreasing orders by their correspondent reliability
values because no order is supported by the HashSet structure, and we cannot use the
ArrayList structure to internal represent the data sets in the UDBMS as well. The

65
TreeSet structure, as it guarantees ordered sequence of the elements is keeps and
offers log(n) time cost for the “add”, “remove” and “contains” operations, is a suitable
alternative storing structure for the UDBMS to internally represents these data sets.
In order to use the TreeSet as the storing structure for the sorted data sets in the
UDBMS, we must first design a comparator that defines the rule of the ordered
sequence of the data tuples in the data sets. For our post-processing module, the data
tuples with larger correspondent reliability values should be placed after other data
tuples if the data tuples are to be sorted in increasing order; and vice versa. Then we
initiate a TreeSet that uses the pre-defined comparator and we add the data tuples to
the TreeSet structure. Finally the data tuples will be in increasing or decreasing order
by their reliability values.
5.4 Supports for the Conventional Databases
An obvious difference between our UDBMS and other uncertain data supported
DBMSs is that our UDBMS provides supports for the conventional databases
managements. Since most of the SQL features are inherited and are continue to be
supported in the USQL, users can create, manipulate and query data in the
conventional databases in our UDBMS as they do in conventional DBMSs.

66
Chapter 6
Experiments, Results, and Analysis
We conducted a number of experiments to evaluate the performance of the query
evaluation techniques we introduced for our UDBMS. In what follows, we describe
the experiment environment in Section 6.1. We describe how the data generated by
the TPC-H benchmark are extended with uncertainty and how the test databases are
constructed in Section 6.2. The selection of the test queries are discussed in Section
6.3. Finally we report on the experiment results and we analyze the performance of
the different UDBMSs that are implemented by the naïve and the improved
approaches in Section 6.4.
6.1 The Platform Setup
Specifications of the hardware and software on which the experiments are conducted
are shown in Table 1.
Operating system UBUNTU 11.04
CPU Intel® Core™ i7 CPU M 620
@ 2.67GHz 2.67GHz
Main Memory 4.00 GB
Eclipse Vesion 3.6.2
Mysql-connector mysql-connector-java Version 5.1.14
ANTLR Parser Generator Version 3.3
UDBMS Version 1.0 and Version 1.1
Table 1. Experiment environment
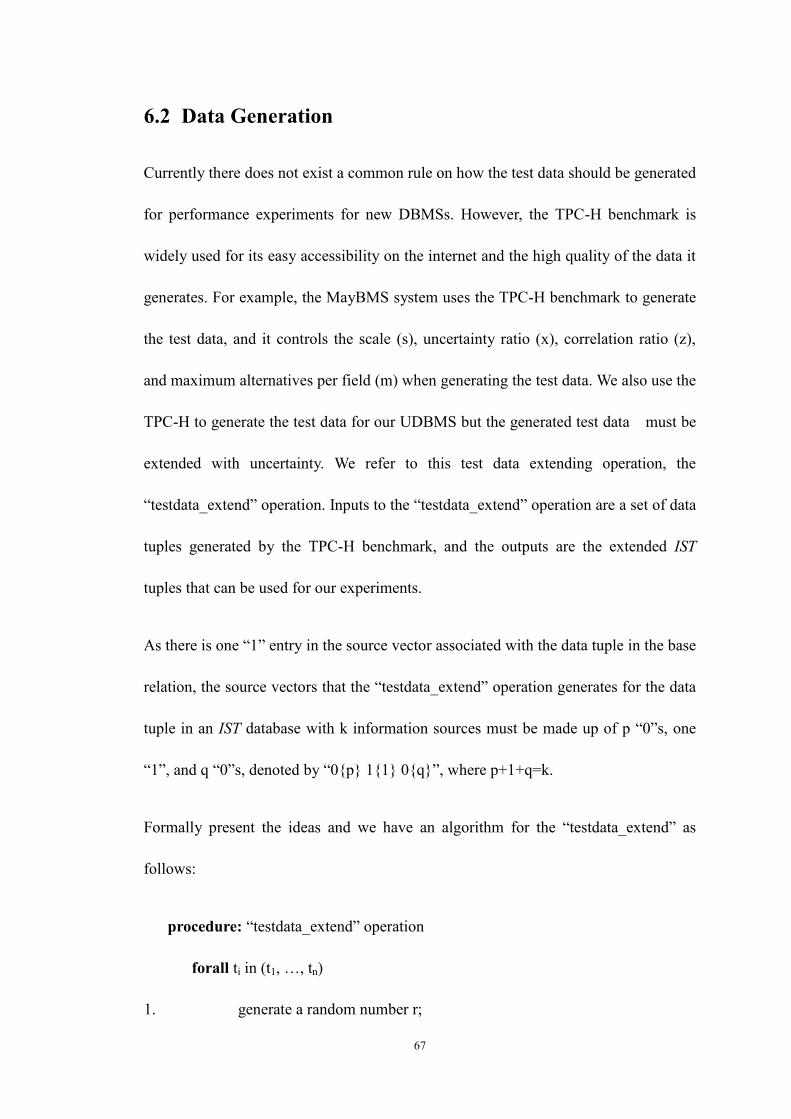
67
6.2 Data Generation
Currently there does not exist a common rule on how the test data should be generated
for performance experiments for new DBMSs. However, the TPC-H benchmark is
widely used for its easy accessibility on the internet and the high quality of the data it
generates. For example, the MayBMS system uses the TPC-H benchmark to generate
the test data, and it controls the scale (s), uncertainty ratio (x), correlation ratio (z),
and maximum alternatives per field (m) when generating the test data. We also use the
TPC-H to generate the test data for our UDBMS but the generated test data must be
extended with uncertainty. We refer to this test data extending operation, the
“testdata_extend” operation. Inputs to the “testdata_extend” operation are a set of data
tuples generated by the TPC-H benchmark, and the outputs are the extended IST
tuples that can be used for our experiments.
As there is one “1” entry in the source vector associated with the data tuple in the base
relation, the source vectors that the “testdata_extend” operation generates for the data
tuple in an IST database with k information sources must be made up of p “0”s, one
“1”, and q “0”s, denoted by “0{p} 1{1} 0{q}”, where p+1+q=k.
Formally present the ideas and we have an algorithm for the “testdata_extend” as
follows:
procedure: “testdata_extend” operation
forall ti in (t1, …, tn)
1. generate a random number r;
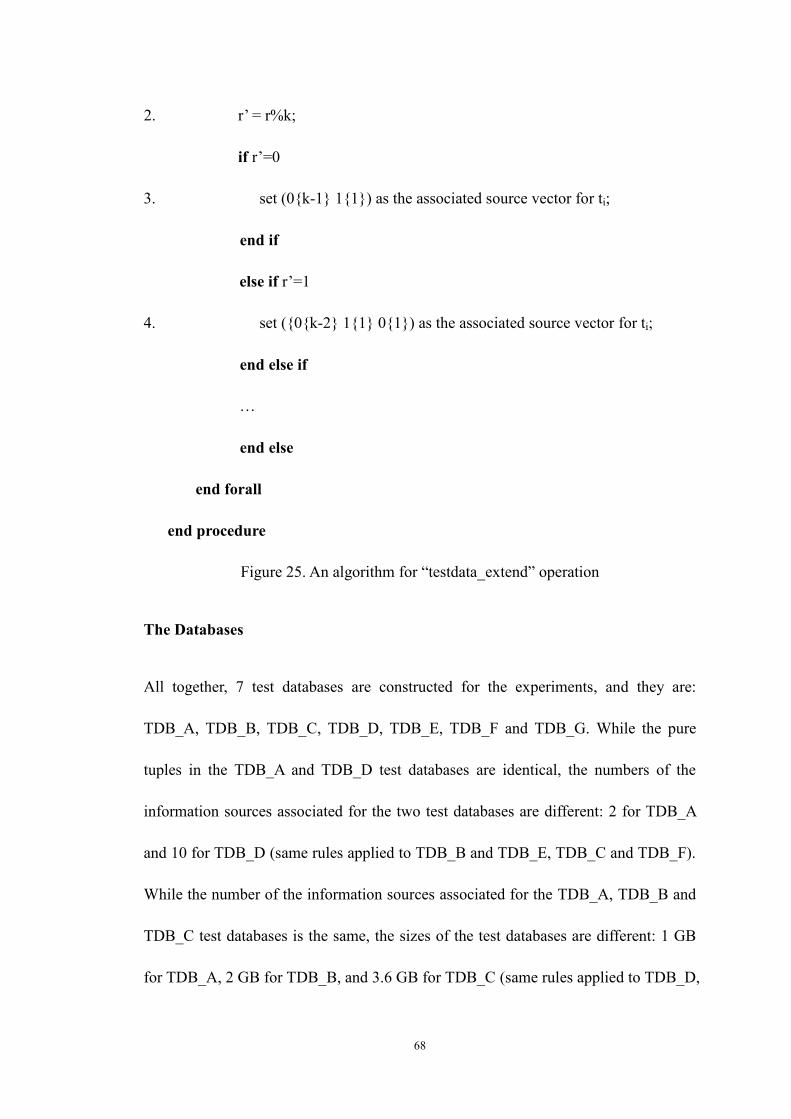
68
2. r‟ = r%k;
if r‟=0
3. set (0{k-1} 1{1}) as the associated source vector for ti;
end if
else if r‟=1
4. set ({0{k-2} 1{1} 0{1}) as the associated source vector for ti;
end else if
…
end else
end forall
end procedure
Figure 25. An algorithm for “testdata_extend” operation
The Databases
All together, 7 test databases are constructed for the experiments, and they are:
TDB_A, TDB_B, TDB_C, TDB_D, TDB_E, TDB_F and TDB_G. While the pure
tuples in the TDB_A and TDB_D test databases are identical, the numbers of the
information sources associated for the two test databases are different: 2 for TDB_A
and 10 for TDB_D (same rules applied to TDB_B and TDB_E, TDB_C and TDB_F).
While the number of the information sources associated for the TDB_A, TDB_B and
TDB_C test databases is the same, the sizes of the test databases are different: 1 GB
for TDB_A, 2 GB for TDB_B, and 3.6 GB for TDB_C (same rules applied to TDB_D,

69
TDB_E and TDB_F). TDB_G is a special test database for it only contains one
“LINEITEM” base relation whose size is 4.66 GB.
More specially, we list the detailed information for the 7 test databases as follows:
1. TDB_A (size: 1GB; number of information sources: 2)
6001215 tuples in “LINEITEM” relation;
1500000 tuples in “ORDERS” relation;
800000 tuples in “PARTSUPP” relation;
200000 tuples in “PART” relation;
150000 tuples in “CUSTOMER” relation;
10000 tuples in “SUPPLIER” relation;
25 tuples in “NATION” relation;
5 tuples in “REGION” relation;
2. TDB_B (size: 2GB; number of information sources:2)
11997996 tuples in “LINEITEM” relation;
3000000 tuples in “ORDERS” relation;
1600000 tuples in “PARTSUPP” relation;
400000 tuples in “PART” relation;
300000 tuples in “CUSTOMER” relation;
20000 tuples in “SUPPLIER” relation;
25 tuples in “NATION” relation;
5 tuples in “REGION” relation;
3. TDB_C (size: 3.6GB; number of information sources:2)

70
18820846 tuples in “LINEITEM” relation;
4705347 tuples in “ORDERS” relation;
3200000 tuples in “PARTSUPP” relation;
800000 tuples in “PART” relation;
600000 tuples in “CUSTOMER” relation;
4000 tuples in “SUPPLIER” relation;
25 tuples in “NATION” relation;
5 tuples in “REGION” relation;
4. TDB_D (size: 1GB; number of information sources:10)
6001215 tuples in “LINEITEM” relation;
1500000 tuples in “ORDERS” relation;
800000 tuples in “PARTSUPP” relation;
200000 tuples in “PART” relation;
150000 tuples in “CUSTOMER” relation;
10000 tuples in “SUPPLIER” relation;
25 tuples in “NATION” relation;
5 tuples in “REGION” relation;
5. TDB_E (size:2GB; number of information sources:10)
11997996 tuples in “LINEITEM” relation;
3000000 tuples in “ORDERS” relation;
1600000 tuples in “PARTSUPP” relation;
400000 tuples in “PART” relation;

71
300000 tuples in “CUSTOMER” relation;
20000 tuples in “SUPPLIER” relation;
25 tuples in “NATION” relation;
5 tuples in “REGION” relation;
6. TDB_F (size: 3.6 GB; number of information sources:10)
18820846 tuples in “LINEITEM” relation;
4705347 tuples in “ORDERS” relation;
3200000 tuples in “PARTSUPP” relation;
800000 tuples in “PART” relation;
600000 tuples in “CUSTOMER” relation;
4000 tuples in “SUPPLIER” relation;
25 tuples in “NATION” relation;
5 tuples in “REGION” relation;
7. TDB_G (size: 4.66 GB; number of information sources:2)
36000148 tuples in “LINEITEM” relation;
And we list the reliability value for the information sources 1 to 10 as follows:
Information Source No. Reliability Information Source No. Reliability
S1 0.343 S2 0.59
S3 0.49 S4 0.52
S5 0.623 S6 0.734
S7 0.765 S8 0.81
S9 0.85 S10 0.67
Table 2. Reliability values for the 10 information sources

72
6.3 Queries Selection
Similar to the test data generation case, there does not exist a common rule on how
the test queries should be selected. But based on the test queries suggested by the
TPC-H benchmark, 7 queries (listed as below) are selected and extended as the test
queries for our experiments. Queries 1 to 4 are the simple queries that Query 1 is
interested the conditions under which the data tuples are valid, Query 2 is interested in
the reliability of data tuples, Query 3 sorts and displays the data tuples in decreasing
order by their reliability values and Query 4 is interested in the data tuples that have
the largest reliability value. Queries 5 and 6 are exclusive queries, and Query 7 is a
type-S nested query.
Query 1: List the details of the line items that are ordered by the customer from Asia
between August 1st, 1995 and December 31
st, 1995 and the conditions under which
the results are valid.
SELECT L_EXTENDEDPRICE, L_DISCOUNT, L_ORDERKEY,
L_SHIPDATE
WITH SV
FROM CUSTOMER, ORDERS, LINEITEM, NATION, REGION
WHERE O_ORDERKEY = L_ORDERKEY AND R_NAME =”Asia” AND
R_REGIONKEY = N_REGIONKEY AND C_NATIONKEY =
N_NATIONKEY AND C_CUSTKEY = O_CUSTKEY AND
O_ORDERDATE >= DATE „1995/08/01” AND O_ORDERDATE <= DATE

73
„1995/12/31‟;
Query 2: List the details of the line items that are ordered by the customer from Asia
between August 1st, 1995 and December 31
st, 1995 along with their reliability values.
SELECT L_EXTENDEDPRICE, L_DISCOUNT, L_ORDERKEY,
L_SHIPDATE
WITH RE
FROM CUSTOMER, ORDERS, LINEITEM, NATION, REGION
WHERE O_ORDERKEY = L_ORDERKEY AND R_NAME =”Asia” AND
R_REGIONKEY = N_REGIONKEY AND C_NATIONKEY =
N_NATIONKEY AND C_CUSTKEY = O_CUSTKEY AND
O_ORDERDATE >= DATE „1995/08/01” AND O_ORDERDATE <= DATE
„1995/12/31‟;
Query 3: List and sort the details of the line items that are ordered by the customer
from Asia between August 1st, 1995 and December 31
st, 1995 by their reliability
values.
SELECT L_EXTENDEDPRICE, L_DISCOUNT, L_ORDERKEY,
L_SHIPDATE
FROM CUSTOMER, ORDERS, LINEITEM, NATION, REGION
WHERE O_ORDERKEY = L_ORDERKEY AND R_NAME =”Asia” AND
R_REGIONKEY = N_REGIONKEY AND C_NATIONKEY =
N_NATIONKEY AND C_CUSTKEY = O_CUSTKEY AND
74
O_ORDERDATE >= DATE „1995/08/01” AND O_ORDERDATE <= DATE
„1995/12/31‟
ORDER BY RE;
Query 4: List the details of the line items with the largest reliability value that are
ordered by the customer from Asia between August 1st, 1995 and December 31
st,
1995.
SELECT L_EXTENDEDPRICE, L_DISCOUNT, L_ORDERKEY,
L_SHIPDATE
FROM CUSTOMER, ORDERS, LINEITEM, NATION, REGION
WHERE O_ORDERKEY = L_ORDERKEY AND R_NAME =”Asia” AND
R_REGIONKEY = N_REGIONKEY AND C_NATIONKEY =
N_NATIONKEY AND C_CUSTKEY = O_CUSTKEY AND
O_ORDERDATE >= DATE „1995/08/01” AND O_ORDERDATE <= DATE
„1995/12/31‟
HAVING MAX RE;
Query 5: List and sort the details of the line items that have not been returned and are
shipped between October 1st, 1995 and October 31
st, 1995 by their reliability values.
SELECT L_QUANTITY, (L_EXTENDEDPRICE*(1-L_DISCOUNT)) AS
DISC_PRICE, (L_EXTENDEDPRICE*(1-L_DISCOUNT)*(1+L_TAX))
AS CHARGE
WITH RE

75
FROM LINEITEM
WHERE LINEITEM.L_RETURNFLAG NOT IN (“r”) AND L_SHIPDATE >=
DATE „1995/10/01” AND L_SHIPDATE <= DATE „1995/10/31‟;
Query 6: List the details of the orders which do not involve customers from china
between May 1st, 1995 and July 31
st, 1995 along with their reliability values.
SELECT O_ORDERSTATUS, O_TOTALPRICE, O_CLERK
WITH RE
FROM ORDERS, CUSTOMER, NATION
WHERE C_NATIONKEY = N_NATIONKEY AND NATION.N_NAME NOT
IN (“china”) AND O_CUSTKEY = C_CUSTKEY AND
O_ORDERDATE >= DATE „1995/05/01” AND O_ORDERDATE <=
DATE „1995/07/31‟;
Query 7: List the details of the line items with the largest reliability value that are
mostly liked to be supplied by supplier from china and are shipped between May 1st,
1995 and May 31st, 1995.
SELECT L_QUANTITY, (L_EXTENDEDPRICE*(1-L_DISCOUNT) AS
DISC_PRICE, (L_EXTENDEDPRICE*(1-L_DISCOUNT)*(1+L_TAX)) AS
CHARGE
FROM LINEITEM
WHERE L_SUPPKEY IN (
SELECT S_SUPPKEY
76
FROM SUPPLIER, NATION
WHERE S_NATIONKEY = N_NATIONKEY AND N_NAME=“china”)
AND L_SHIPDATE >= DATE „1995/05/01” AND L_SHIPDATE <= DATE
„1995/07/01‟
HAVING MAX RE;
6.4 Performance Evaluation
Strictly speaking, we cannot compare the performances between our UDBMS and the
conventional DBMSs as the relational data models they are based on are different. But
as our UDBMS provides supports for the conventional databases managements,
experiments can be conducted to study the overhead (if any) posed by our UDBMS to
the conventional queries. More particularly, test databases TDB_A, TDB_B, TDB_C
and the test query 1 are chosen for experiments.
Uncertainty associated for the three test databases are removed (and the new test
databases are TDB_A‟, TDB_B‟, TDB_C‟) and the test query 1 is modified to a
conventional query, called the test query 0, as follows:
SELECT L_EXTENDEDPRICE, L_DISCOUNT, L_ORDERKEY,
L_SHIPDATE
FROM CUSTOMER, ORDERS, LINEITEM, NATION, REGION
WHERE O_ORDERKEY = L_ORDERKEY AND R_NAME =”Asia” AND
R_REGIONKEY = N_REGIONKEY AND C_NATIONKEY =
N_NATIONKEY AND C_CUSTKEY = O_CUSTKEY AND
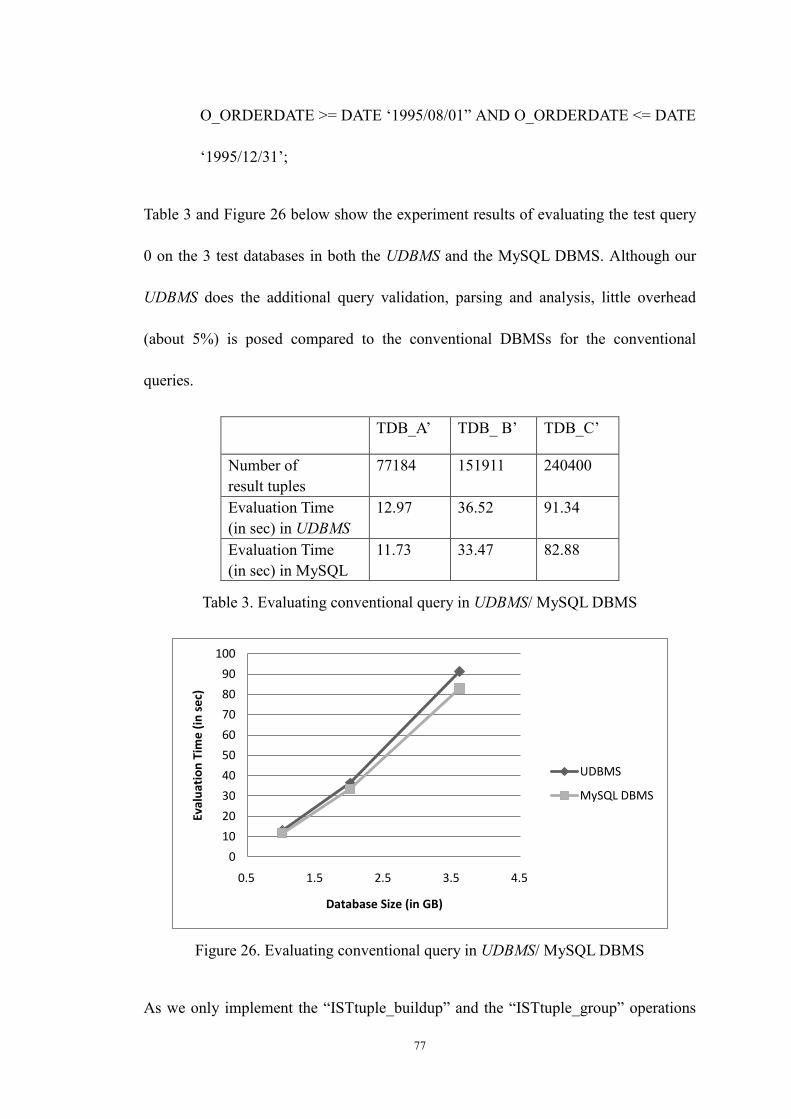
77
O_ORDERDATE >= DATE „1995/08/01” AND O_ORDERDATE <= DATE
„1995/12/31‟;
Table 3 and Figure 26 below show the experiment results of evaluating the test query
0 on the 3 test databases in both the UDBMS and the MySQL DBMS. Although our
UDBMS does the additional query validation, parsing and analysis, little overhead
(about 5%) is posed compared to the conventional DBMSs for the conventional
queries.
TDB_A‟ TDB_ B‟ TDB_C‟
Number of
result tuples
77184 151911 240400
Evaluation Time
(in sec) in UDBMS
12.97 36.52 91.34
Evaluation Time
(in sec) in MySQL
11.73 33.47 82.88
Table 3. Evaluating conventional query in UDBMS/ MySQL DBMS
Figure 26. Evaluating conventional query in UDBMS/ MySQL DBMS
As we only implement the “ISTtuple_buildup” and the “ISTtuple_group” operations
0
10
20
30
40
50
60
70
80
90
100
0.5 1.5 2.5 3.5 4.5
Eval
uat
ion
Tim
e (
in s
ec)
Database Size (in GB)
UDBMS
MySQL DBMS

78
in the naïve approach (discussed in Section 5.3.1), exclusive queries, nested queries
and queries with the “WITH RE”, “(MAX|MIN) RE”, “ORDER BY RE”, “RE
(<|<=|=|>=|>) <value>” keywords are therefore cannot be evaluated in the naïve
UDBMS (UDBMS that is constructed by following the naïve approach).
As for our test queries set, only the 1st test query can be evaluated and the experiment
results of evaluating the test query 1 in the naïve UDBMS are shown in Table 4.
TDB_A TDB_B TDB_C TDB_D TDB_E TDB_F
Evaluation Time (in
sec) on the original test
databases
245.28 632.12 2145.28 273.07 692.53 2535.85
Table 4. Evaluating test query 1 in the naïve UDBMS
In order to compare the performance differences between the naïve UDBMS and the
improved UDBMS (UDBMS that is constructed by following the improved approach),
we present the experiment results of running the test query 1 in the improved UDBMS
in Table 5. We also present the experiment results of running the test query 1 on the 6
test databases when the information sources associated with the test databases are
fully reliable sources (with reliability 1.0) in Table 5.
TDB_A TDB_B TDB_C TDB_D TDB_E TDB_F
Evaluation Time (in sec)
on the original test
databases
19.63 41.56 102.36 29.51 56.75 115.45
Evaluation Time (in sec)
on test databases with
fully reliable sources
18.39 43.87 102.85 31.12 55.64 116.59
Table 5. Evaluating test query 1 in the improved UDBMS
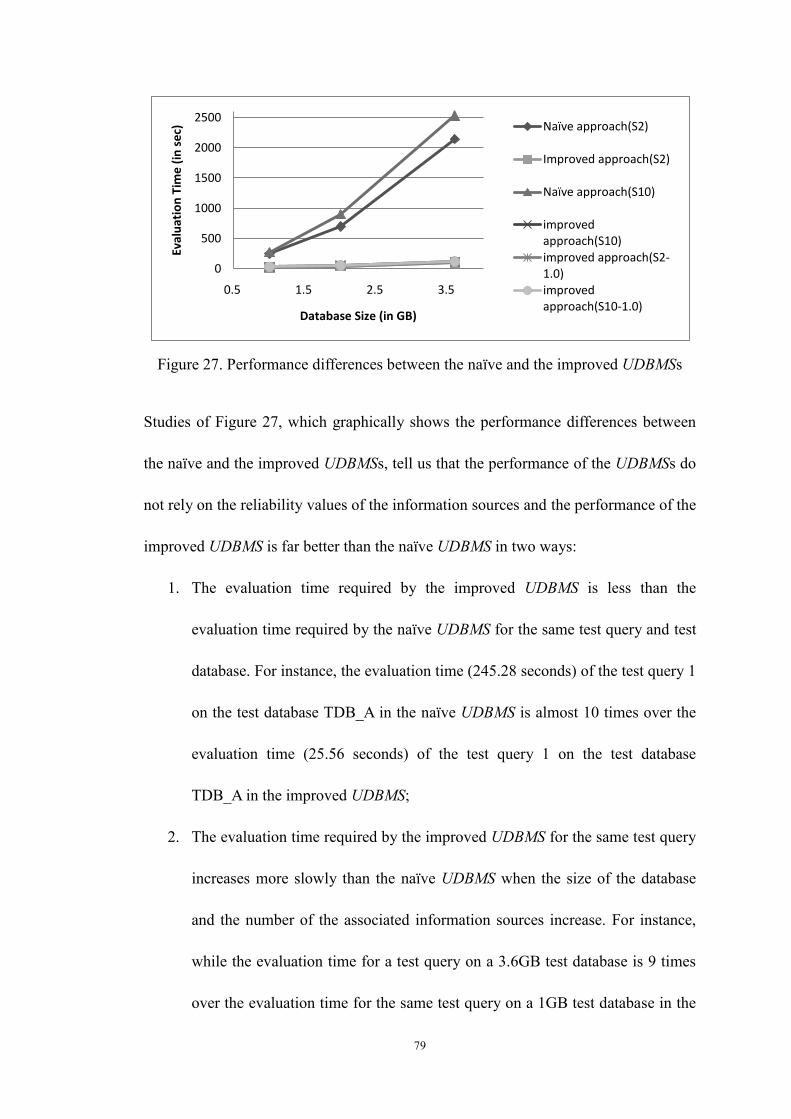
79
Figure 27. Performance differences between the naïve and the improved UDBMSs
Studies of Figure 27, which graphically shows the performance differences between
the naïve and the improved UDBMSs, tell us that the performance of the UDBMSs do
not rely on the reliability values of the information sources and the performance of the
improved UDBMS is far better than the naïve UDBMS in two ways:
1. The evaluation time required by the improved UDBMS is less than the
evaluation time required by the naïve UDBMS for the same test query and test
database. For instance, the evaluation time (245.28 seconds) of the test query 1
on the test database TDB_A in the naïve UDBMS is almost 10 times over the
evaluation time (25.56 seconds) of the test query 1 on the test database
TDB_A in the improved UDBMS;
2. The evaluation time required by the improved UDBMS for the same test query
increases more slowly than the naïve UDBMS when the size of the database
and the number of the associated information sources increase. For instance,
while the evaluation time for a test query on a 3.6GB test database is 9 times
over the evaluation time for the same test query on a 1GB test database in the
0
500
1000
1500
2000
2500
0.5 1.5 2.5 3.5
Eval
uat
ion
Tim
e (
in s
ec)
Database Size (in GB)
Naïve approach(S2)
Improved approach(S2)
Naïve approach(S10)
improved approach(S10)improved approach(S2-1.0)improved approach(S10-1.0)

80
naïve UDBMS, the time only increases 6 times over the 1GB test database‟s
case in the improved UDBMS;
Reasons for these huge performance differences between the naïve and the improved
UDBMS, as we have discussed in Section 5.3, lie in the fact the time-consuming
“ISTtuple_group” operation is not longer required by the improved UDBMS for the
HashSet structure that is used to internally represent the data sets guarantees
duplicate-free collection of the elements it keeps.
In what follows, we study the performance of the improved UDBMS in a more
detailed level.
If we regard the experiment results of evaluating the test query 0 as the basis for
comparison, we can then study the performance of the source vectors‟ calculations by
evaluating the test query 1 in the system, we can study the performance of the
reliability calculations by evaluating the test query 2 in the system, we can study the
performance of the “ISTtuple_sort” operation by evaluating the test query 3 in the
system, and we can study the largest overhead that may be posed by our improved
UDBMS to the USQL queries by evaluating the test query 4 in the system.
Table 6 below shows the experiment results of running the test queries 1 to 4 in the
improved UDBMS (we list the experiment results of running test query 0 in Table 5
again for comparison purpose).
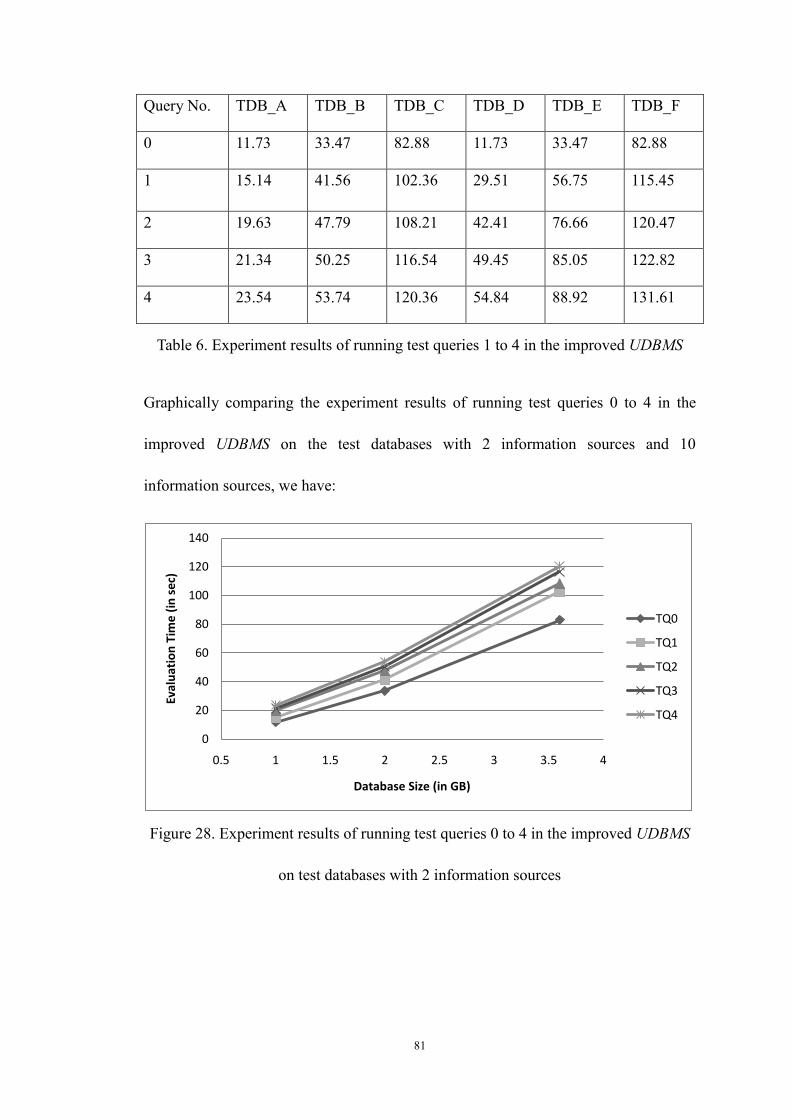
81
Query No. TDB_A TDB_B TDB_C TDB_D TDB_E TDB_F
0 11.73 33.47 82.88 11.73 33.47 82.88
1 15.14
41.56 102.36 29.51 56.75 115.45
2 19.63 47.79 108.21 42.41 76.66 120.47
3 21.34 50.25 116.54 49.45 85.05 122.82
4 23.54 53.74 120.36 54.84 88.92 131.61
Table 6. Experiment results of running test queries 1 to 4 in the improved UDBMS
Graphically comparing the experiment results of running test queries 0 to 4 in the
improved UDBMS on the test databases with 2 information sources and 10
information sources, we have:
Figure 28. Experiment results of running test queries 0 to 4 in the improved UDBMS
on test databases with 2 information sources
0
20
40
60
80
100
120
140
0.5 1 1.5 2 2.5 3 3.5 4
Eval
uat
ion
Tim
e (
in s
ec)
Database Size (in GB)
TQ0
TQ1
TQ2
TQ3
TQ4

82
Figure 29. Experiment results of running test queries 0 to 4 in the improved UDBMS
on test databases with 10 information sources
Analysis of the Figures 28 and 29 tell us that:
1. As we have to calculate the source vectors associated with the result tuples to
calculate their reliability values and we have to sort the result tuples by their
reliability values to find the data tuples with the largest reliability value, more
time is required to evaluate the test query 4 than the test queries 3, 2, 1, and 0.
But the calculations of the source vectors associated with the result tuples, the
calculations of the reliability values for the result tuples, and the
“ISTtuple_sort” operation all reach high performance so that the time required
to evaluate the test query 4 only increases by 50% over the time required to
evaluate the test query 0 in the test database with 3.6 GB size and 10
information sources;
2. More time is required to evaluate the queries on the test databases with more
information sources, but the increment of the time is not so obvious, for
0
20
40
60
80
100
120
140
0.5 1 1.5 2 2.5 3 3.5 4
Eval
uat
ion
Tim
e (
in s
ec)
Database Size (in GB)
TQ0
TQ1
TQ2
TQ3
TQ4

83
instance, the time required to evaluate the test query 4 in the improved
UDBMS on the test databases TDB_F (test database with 10 information
sources) is only 10% more over the time required on the test databases
TDB_C;
Experiment results of running test queries 5, 6 and 7 in the improved UDBMS are
shown in Table 7 as below.
Query No. TDB_A TDB_B TDB_C TDB_D TDB_E TDB_F
5 10.76 23.49 35.53 17.93 29.58 43.71
6 6.89 74.05 143.19 9.66 102.54 173.83
7 45.28 93.06 143.89 68.39 109.89 159.01
Table 7. Experiment results of running test queries 5 to 7 in the improved UDBMS
Although the time required by the UDBMS to evaluate these queries is longer than the
time required by the UDBMS to evaluate the simple queries on average, supports for
the exclusive and the nested queries are quite good in the improved UDBMS. From
what we can see in Figure 30, the time required to evaluate the nested and the
exclusive queries grows linearly with respect to the number of the tuples and
information sources.

84
Figure 30. Experiment results of running test queries 5 to 7 in the improved UDBMS
Finally, efforts are paid to study the scalability of our UDBMS. As large amount of
disk I/Os are required to read data from the databases when the they cannot be loaded
completely into the main memory and the “add” operation for the HashSet becomes
extremely expensive when the operating system could not cache the hash codes for all
the elements of the HashSet in the main memory, we believe that our proposed
UDBMS can only be used to answer queries on the databases (relations) when they
can be loaded completely to the main memory.
Experiments are conducted accordingly to study the performance of the improved
UDBMS when the test databases cannot be loaded completely into the main memory.
Test database TDB_G is chosen, and the test queries are evaluated in the improved
UDBMS on TDB_G. Unfortunately we fail to measure the time required for the
improved UDBMS to evaluate the test queries as our system terminates when the
operating system runs out of memory.
0
20
40
60
80
100
120
140
160
180
200
0.5 1 1.5 2 2.5 3 3.5 4
Eval
uat
ion
Tim
e (
in s
ec)
Database Size (in GB)
TQ5(S2)
TQ5(S10)
TQ6(S2)
TQ6(S10)
TQ7(S2)
TQ7(S10)
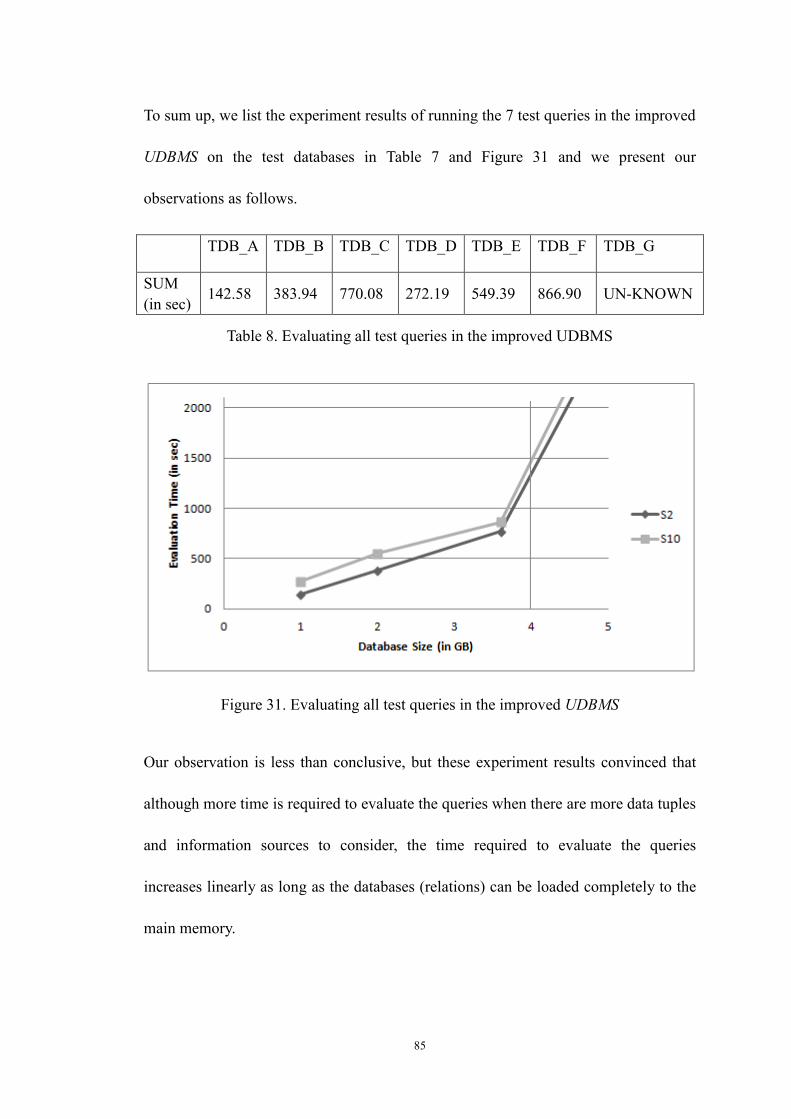
85
To sum up, we list the experiment results of running the 7 test queries in the improved
UDBMS on the test databases in Table 7 and Figure 31 and we present our
observations as follows.
TDB_A TDB_B TDB_C TDB_D TDB_E TDB_F TDB_G
SUM
(in sec) 142.58 383.94 770.08 272.19 549.39 866.90 UN-KNOWN
Table 8. Evaluating all test queries in the improved UDBMS
Figure 31. Evaluating all test queries in the improved UDBMS
Our observation is less than conclusive, but these experiment results convinced that
although more time is required to evaluate the queries when there are more data tuples
and information sources to consider, the time required to evaluate the queries
increases linearly as long as the databases (relations) can be loaded completely to the
main memory.

86
Chapter 7
Conclusion and Future Research
Our motivation in this work laid in the lack of efficient uncertain database
management systems in the database and the artificial intelligence fields. Our goal
was to primarily develop an efficient database management system for manipulation
with uncertain data.
To reach our goal, we classified the two existing approaches to build DBMS for
uncertain data, we explained their differences and we justified why we choose the
“light weight” way to construct the new system. We reviewed the IST formulism
proposed by Sadri, and we extended SQL to USQL to define the transaction rules in
the new UDBMS. New query parsing, analyzing and evaluation techniques were
introduced, and for the purpose of further enhancing the evaluation efficiency,
different data storing mechanisms and algorithms were proposed.
Two UDBMS prototypes were built and a bunch of experiments were conducted to
study the performance of our proposed techniques. Our experiment results show that
the improved UDBMS yields faster evaluation than the naïve UDBMS. And although
more time is required by the improved UDBMS to evaluate the queries on bigger
databases and databases with more information sources, the time required increases
linearly.
87
Despite the facts that our UDBMS is based on the IST formulism and it uses MySQL
DBMS as its back-end DBMS, the techniques and approaches we have studied in this
thesis can be easily modified and adapted to build new uncertain database
management systems that are based on other uncertain theories or use other
conventional DBMSs as the back-end DBMS.
Note that since the proposed UDBMS is an in-memory, single-user system, supports
for large size databases are inadequate. As databases can get really huge and usually
they cannot be loaded completely in the main memory, future researches can be
dedicated to study the problem of efficient evaluating queries on large size databases.
Another research direction is to provide full supports for the SQL features in the
USQL. Until now, our UDBMS only provides portions of the supports for the
uncertain data, thus the future works can be done to provide full supports for the
“LIKE” operator, the “index” mechanisms in the USQL language.
88
References
[Adar 07] Eytan Adar and Christopher Re. “Managing Uncertainty in Social
Networks”. In: IEEE Computer Society Technical Committee on Data
Engineering (TCDE), 2007.
[Agra 06] P. Agrawal, O. Benjelloun, A. Das Sarma, C. Hayworth, S. Nabar, T.
Sugihara, and J. Widom. “TRIO: A System for Data, Uncertainty and
Lineage”. In: Proc. 32nd Intl. Conf. on Very Large Data Bases (VLDB),
pages 1151-1154, 2006.
[Agar 09] Charu C. Agarwal, and Philip S. Yu. “A survey of Uncertain Data
Algorithms and Applications”. In: IEEE Transactions on Knowledge and
Data Engineering (TKDE), Vol. 21, No. 5, 2009.
[Antlr] “ANTLR Homepage”. http://www.antlr.org.
[Anto 07a] L. Antova, C. Koch, and D. Olteanu. “From Complete to Incomplete
Information and Back”. In: Proc. of ACM SIGMOD Int’l. conf. on
Management of data, 2007.
[Anto 07b] L. Antova, C. Koch, and D. Olteanu. “10^(10^6) Words and Beyond:
Efficient Representation and Processing of Incomplete Information”. In:
Proc. 23rd IEEE Int’l Conf. Data Eng. (ICDE), 2007.
[Anto 08] L. Antova, T. Jansen, C. Koch, and D. Olteanu. “Fast and Simple
89
Relational Processing of Uncertain Data”. In: Proc. 24th IEEE Int’l Conf.
Data Eng. (ICDE), 2008.
[Bell 99] S. Bell. “A Beginner's Guide to Uncertainty of Measurement”. In:
Measurement Good Practice Guide, No. 11, Issue 2, 2001.
[Benj 06] O. Benjelloun, A. Das Sarma, A. Halevy, and J. Widom. “ULDBs:
Databases with Uncertainty and Lineage”. In: Proc. 32nd Int’l Conf.
Very Large Data Bases (VLDB), 2006.
[Benj 08] O. Benjelloun, A. Das Sarma, A. Halevy, M. Theobald, and J. Widom.
“Databases with Uncertainty and Lineage”, In: Int’l Conf. on Very Large
Data Bases (VLDB), Vol. 17, Issue 2, 2008.
[Bos 02] Kees van den Bos and E. Allan Lind. “Uncertainty Management by
Means of Fairness Judgments”. In: Advances in Experimental Social
Psychology, Vol.34, pp. 1-60, 2002.
[Chen 03] R. Cheng, Dmitri V. Kalashnikov, and S. Prabhakar. “Evaluating
Probabilistic Queries over Imprecise Data”. In: Proc. of the 2003 ACM
SIGMOD Int’l Conf. on Management of Data, 2003.
[Das 92] Amar K. Das, Samson W. Tu, Gretchen P. Purcell, and Mark A. Musen.
“An Extended SQL for Temporal Data Management in Clinical
Decision-Support Systems”. In: Proc. of the Annual Symposium on
Computer Application in Medical Care (SCAMC), 1992.

90
[Dey 97] D. Dey, and S. Sarkar. “Extended SQL Support for Uncertain Data”, In:
Proc. of the 16th Int’l Conf. on Conceptual Modeling (ER’97), 1997.
[Egeh 94] Max. J. Egehofer. “Spatial SQL: A Query and Presentation Language”.
In: IEEE Transactions on Knowledge and Data Engineering (TKDE),
Vol. 6, 1994.
[Gare 79] M. R. Garey, and D. S. Johnson. “Computers and Intractability, A Guide
to the Theory of NP-Completeness”. Computers and Intractability; A
Guide to the Theory of NP-Completeness, W. H. Freeman & Co.,
ISBN:0716710455, 1979.
[Ge 09] Tingjian Ge. “Query Processing on Uncertain Data”, Ph.D. Thesis,
Brown University, 2009.
[Gotz 09] M. Gotz, and C. Koch. “A Compositional Framework for Complex
Queries over Uncertain Data”. In: '09 Proceedings of the 12th Int’l Conf.
on Database Theory (ICDT), pp. 149-161, 2009.
[Heuv 07] Gerard Heuvelink. “Error-aware GIS at work: real-world applications of
the Data Uncertainty Engine”. In: Int’l Workshop on Uncertainty in
Environmental Modeling, 2007.
[Kian 05] A. Kiani, and N. Shiri. “A Framework for Information Integration with
Uncertainty”. In: Lecture Notes in Computer Science, Vol. 3563/2005,
194-206, DOI: 10.1007/11533962_17, 2005.

91
[KieB 02] W. KieBling, and G. Kostler. “Preference SQL – Design,
Implementation, Experiences”. In: Proc. of the 28th Int’l Conf. Very
Large Data Bases (VLDB), 2002.
[Laks 01] Laks V.S. Lakshmanan and Nematollaah Shiri, "Logic Programming and
Deductive Databases with Uncertainty: A Survey". In: Encyclopedia of
Computer Science and Technology, Vol. 45, pp 155-176, Marcel Dekker,
Inc., 2001.
[Lore 97] Nikos A. Lorentzos, and Yannis G. Mitsopoulos. “SQL Extension for
Interval Data”. In: IEEE Transactions on Knowledge and Data
Engineering (TKDE), Vol. 9, No. 3, 1997.
[Mano 01] I. Manolescu, D. Florescu, and D. Kossmann. “Answering XML Queries
over Heterogeneous Data Sources”. In: Proc. of the 27th Int’l Conf. Very
Large Data Bases (VLDB), 2001.
[Motr 94] A. Motro. “Management of uncertainty in database systems”. Modern
database systems: The Object Model, Interoperability, and Beyond,
1994.
[Motw 03] R. Motwani, J. Widom, A. Arasu, B. Babcock, S. Babu, M. Datar, G.
Manku, C. Olston, J. Rosenstein, and R. Varma. “Query Processing,
Resource Management, and Approximation in a Data Stream
Management System”. In: Proc. of the Conf. on Innovative Data Systems

92
Research (CIDR), 2003.
[Orion] “The Orion 2.0 Documentation”. http://orion.cs.purdue.edu/doc.html.
[Pars 96] S. Parsons. “Current Approaches to Handling Imperfect Information in
Data and Knowledge Bases”. In: IEEE Transactions on Knowledge and
Data Engineering (TKDE), 8(3):353--372, 1996.
[Pira 92] H. Pirahesh, Joseph M. Hellerstein, and W. Hasan. “Extensible/Rule
Based Query Rewrite Optimization in Starburst”. In: Proc. of ACM
SIGMOD Int’l. conf. on Management of data, 1992.
[Riez 03] S. Riezler, and Yi Liu. “Query Rewriting using Monolingual Statistical
Machine Translation”. In: Journal of Computational Linguistics, Vol. 36,
No. 3, 2003.
[Sadr 91a] F. Sadri. “Reliablity of Answers to Queries in Relational Database”. In:
IEEE Transactions on Knowledge and Data Engineering (TKDE), Vol. 3,
No.2, pp. 245-251, 1991.
[Sadr 91b] F. Sadri. “Modeling Uncertainty in Databases”. In: 7th Int’l Conf. on
Data Engineering (ICDE), pp. 122-131, 1991.
[Sadr 94] F. Sadri. “Aggregate Opertaions in the Information Source Tacking
Method”. In: Theoretical Computer Science. Vol. 133, Issue 2, pp.
421-442, 1994.

93
[Sadr 95] F. Sadri. “Integrity Constraints in the Information Source Tracking
Method”. In: IEEE Transactions on Knowledge and Data Engineering
(TKDE), Vol. 7, No. 1, 1995.
[Sard 90] Nandlal L. Sarda. “Extensions to SQL for Historical Databases”. In:
IEEE Transactions on Knowledge and Data Engineering (TKDE), Vol. 2,
No. 2, 1990.
[Sarm 06] A. Das Sarma, O. Benjelloun, A. Halevy, and J. Widom. “Working
Model for Uncertain Data”. In: Proc of 22nd IEEE Int’l Conf. on Data
Engineering (ICDE), 2006.
[Sarm 09] Anish Das Sarma. “Managing Uncertainty Data”. Ph.D. Thesis, Stanford
University, 2009.
[Shir 04] N. Shiri and Z.H. Zheng. “Challenges in Fixpoint Computation with
Multisets". In Proc. of 3rd Int’l Symposium on Foundations of
Information and Knowledge Systems (FoIKS), pp. 273-290, LNCS 2942,
2004.
[Sing 08] Sarvjeet Singh, Chris Mayfield, Sagar Mittal, Sunil Prabhakar, Susanne
Hambrusch, Rahul Shah. “Orion 2.0: Native Support for Uncertain
Data”. In: Proc. of ACM SIGMOD Int’l. conf. on Management of data,
2008.
[X Ch 03] Cindy X. Chen, J. Kong, and C. Zaniolo. “Design and Implementation of

94
a Temporal Extension of SQL”. In: 19th Int’l Conf. on Data Engineering
(ICDE), ISBN: 0-7803-7665-X, 2003.
[Yan 01] Qi Yang, Weining Zhang, Jing Wu, H. Nakajima, and Naphtali D. Rishe.
“Efficient Processing of Nested Fuzzy SQL queries in a Fuzzy
Database”. In: IEEE Transactions on Knowledge and Data Engineering
(TKDE), Vol. 13, No. 6, 2001.
[Yao 03] Yong Yao, and J. Gehrke. “Query Processing for Sensor Networks”, In
Proc. of the Conf. on Innovative Data Systems Research (CIDR), 2003.
[Yu 04] Cong Yu, and L. Popa. “Constraint-Based XML Query Rewriting for
Data Integration”. In: Proc. of the ACM SIGMOD Int’l Conf. on
Management of Data, 2004.
[Zade 65] L. Zadeh. “Fuzzy sets”. In: Information and Control, Vol. 8, pp. 338–353,
1965.
[Zhan 08] Wenjie Zhang, Xuemin Lin, Jian Pei, and Ying Zhang. “Managing
Uncertain Data: Probabilistic Approaches”. In Proc. of the 9th
Int’l Conf.
on Web-Age Information Management, 2008.
[Zhen 04] Zhi hong Zheng, “On Efficient Fixpoint Computation of Deductive
Databases with Uncertainty”. Master’s Thesis, Concordia University,
2004.
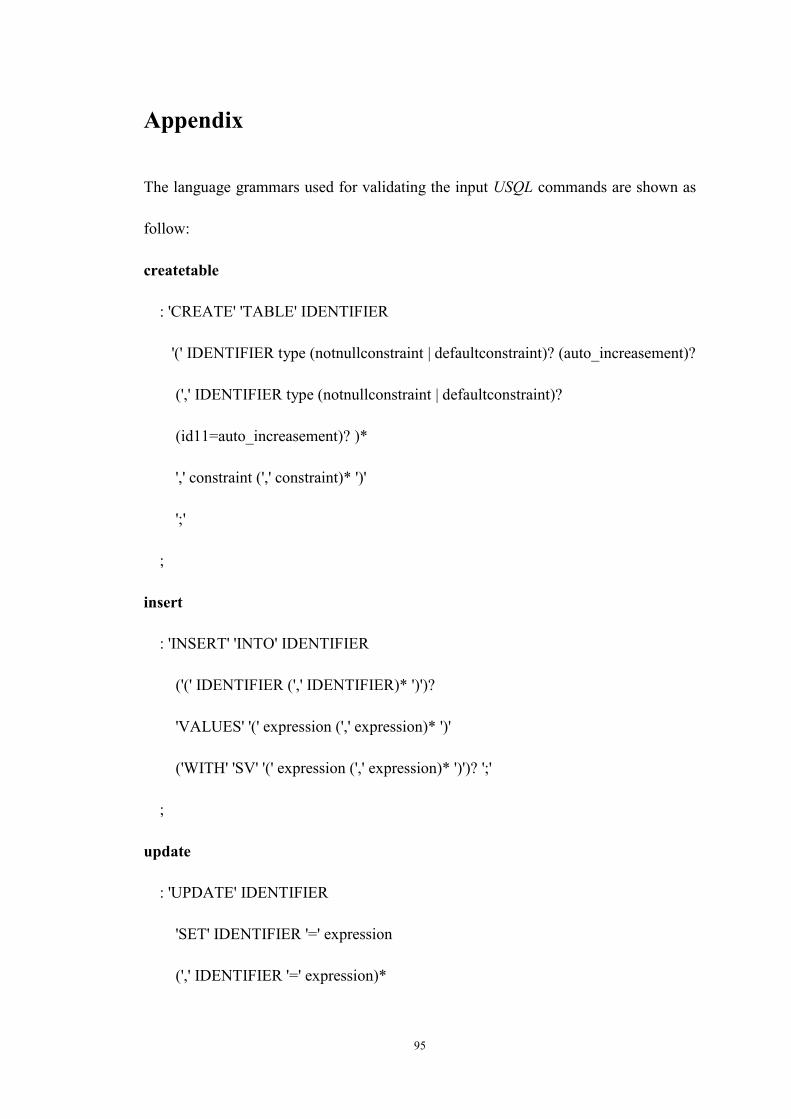
95
Appendix
The language grammars used for validating the input USQL commands are shown as
follow:
createtable
: 'CREATE' 'TABLE' IDENTIFIER
'(' IDENTIFIER type (notnullconstraint | defaultconstraint)? (auto_increasement)?
(',' IDENTIFIER type (notnullconstraint | defaultconstraint)?
(id11=auto_increasement)? )*
',' constraint (',' constraint)* ')'
';'
;
insert
: 'INSERT' 'INTO' IDENTIFIER
('(' IDENTIFIER (',' IDENTIFIER)* ')')?
'VALUES' '(' expression (',' expression)* ')'
('WITH' 'SV' '(' expression (',' expression)* ')')? ';'
;
update
: 'UPDATE' IDENTIFIER
'SET' IDENTIFIER '=' expression
(',' IDENTIFIER '=' expression)*
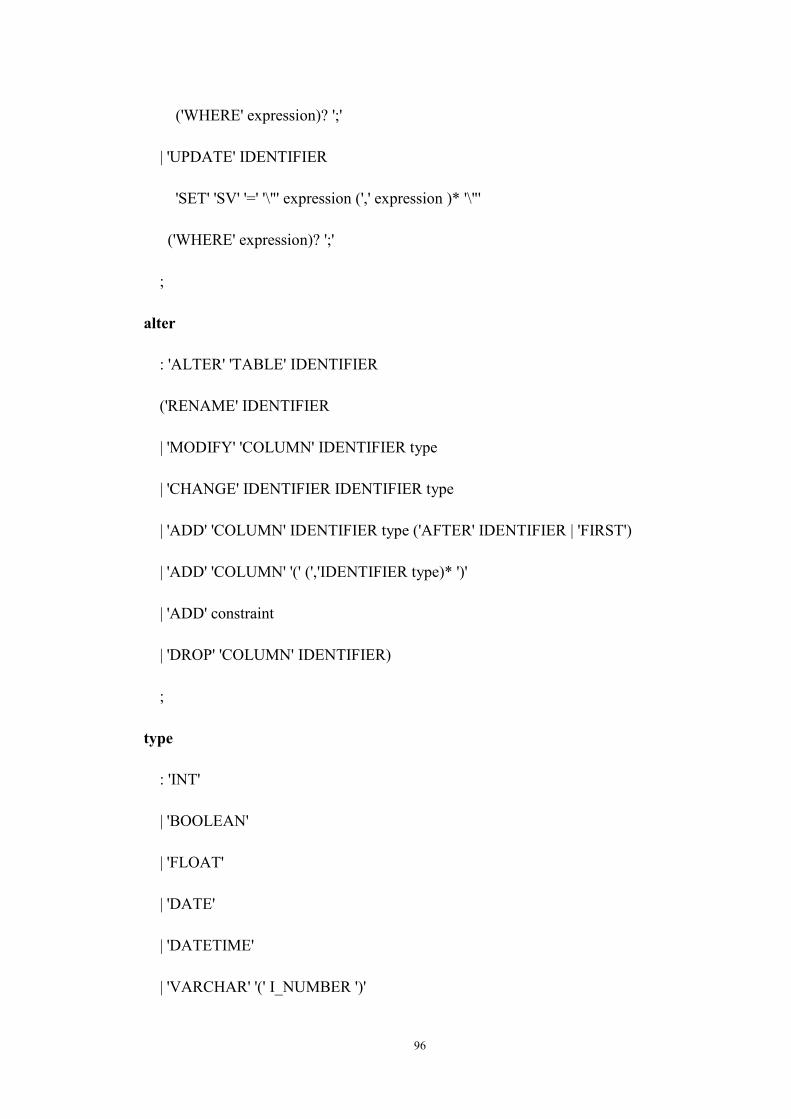
96
('WHERE' expression)? ';'
| 'UPDATE' IDENTIFIER
'SET' 'SV' '=' '\"' expression (',' expression )* '\"'
('WHERE' expression)? ';'
;
alter
: 'ALTER' 'TABLE' IDENTIFIER
('RENAME' IDENTIFIER
| 'MODIFY' 'COLUMN' IDENTIFIER type
| 'CHANGE' IDENTIFIER IDENTIFIER type
| 'ADD' 'COLUMN' IDENTIFIER type ('AFTER' IDENTIFIER | 'FIRST')
| 'ADD' 'COLUMN' '(' (','IDENTIFIER type)* ')'
| 'ADD' constraint
| 'DROP' 'COLUMN' IDENTIFIER)
;
type
: 'INT'
| 'BOOLEAN'
| 'FLOAT'
| 'DATE'
| 'DATETIME'
| 'VARCHAR' '(' I_NUMBER ')'
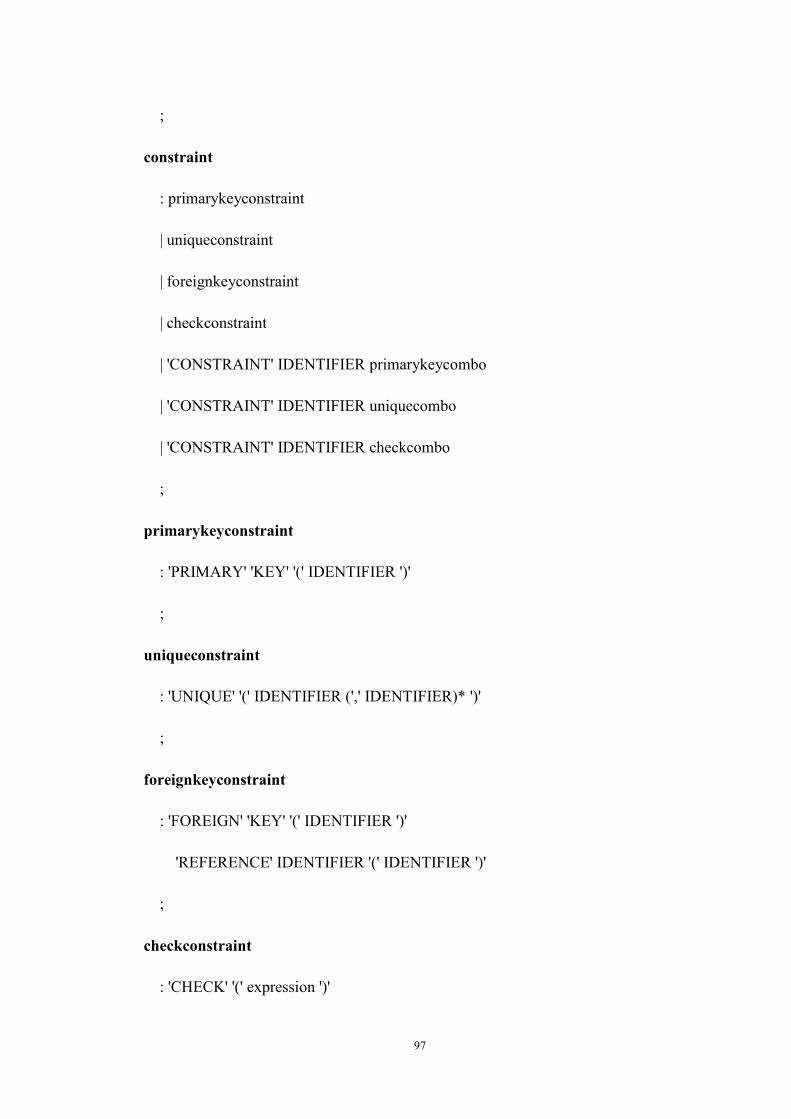
97
;
constraint
: primarykeyconstraint
| uniqueconstraint
| foreignkeyconstraint
| checkconstraint
| 'CONSTRAINT' IDENTIFIER primarykeycombo
| 'CONSTRAINT' IDENTIFIER uniquecombo
| 'CONSTRAINT' IDENTIFIER checkcombo
;
primarykeyconstraint
: 'PRIMARY' 'KEY' '(' IDENTIFIER ')'
;
uniqueconstraint
: 'UNIQUE' '(' IDENTIFIER (',' IDENTIFIER)* ')'
;
foreignkeyconstraint
: 'FOREIGN' 'KEY' '(' IDENTIFIER ')'
'REFERENCE' IDENTIFIER '(' IDENTIFIER ')'
;
checkconstraint
: 'CHECK' '(' expression ')'

98
;
primarykeycombo
: 'PRIMARY' 'KEY' '(' IDENTIFIER (',' IDENTIFIER)* ')'
;
uniquecombo
: 'UNIQUE' '(' IDENTIFIER (',' IDENTIFIER)* ')'
;
checkcombo
: 'CHECK' '(' expression (',' expression)* ')'
;
selection
: query_clause
(('UNION' ('ALL')? | 'INTERSECT' | 'MINUS') query_clause)*
';'
;
query_clause
: 'SELECT' expression (with_clause)?
'FROM' expression
('WHERE' expression)?
('ORDER BY RE')?
('HAVING' (('MAX' | 'MIN') RE | RE ('<'|'<='|'='|'>='|'>') D_NUMBER)?

99
;
with_clause
:'WITH'
('SV'|'RE')
;
term
: IDENTIFIER
| STAR
| I_NUMBER
| D_NUMBER
| '\"' IDENTIFIER '\"'
| '(' expression ')'
| '(' query_clause ')'
| 'DATE' '\'' I_NUMBER '/' I_NUMBER '/' I_NUMBER '\''
;
unary
: ('-'| '+' )* term
;
mult
: unary (('*'| '/'| 'MOD') unary)*
;
add
100
: mult (('+'| '-') mult)*
;
relation
: add
( '=' add
| '<>' add
| '>' add
| '>=' add
| '<' add
| '<=' add)*
;
logic
: relation
( 'AND' relation
| 'OR' relation
| 'IN' relation
| 'NOT IN' relation)*
;
expression
: logic ('.' (IDENTIFIER| STAR))? ('AS' IDENTIFIER)?
(',' logic ('.' (IDENTIFIER | STAR))? ('AS' IDENTIFIER)?)*
;

101
STAR: '*';
IDENTIFIER: ('_'|'a'..'z'|'A'..'Z')+ (I_NUMBER)?;
WS: (' ' | '\t' | '\n' | '\r' | '\f')+ {$channel = HIDDEN;};
I_NUMBER: '0'..'9'+;
D_NUMBER: I_NUMBER '.' (I_NUMBER)*;
Related Documents