IAERE Fourth Annual Conference 11-12 February 2016, Bologna Supporting the UN SDGs Transition: Methodology for Sustainability Assessment and Worldwide Ranking Carlo Carraro, Lorenza Campagnolo Fabio Eboli, Luca Farnia

Welcome message from author
This document is posted to help you gain knowledge. Please leave a comment to let me know what you think about it! Share it to your friends and learn new things together.
Transcript

IAERE Fourth Annual Conference 11-12 February 2016, Bologna
Supporting the UN SDGs Transition: Methodology for Sustainability
Assessment and Worldwide Ranking
Carlo Carraro, Lorenza CampagnoloFabio Eboli, Luca Farnia

Multi-fold objectives
- Contribute to establishing the most appropriate set of sustainable development indicators
- Propose a methodology to have composite / aggregate / synthetic indices
- Develop a modeling framework to project (predict?) future trends in indicators (and their interactions) across different scenarios
- Highlight unfilled gaps as well as assess costs and benefits of social and environmental policies
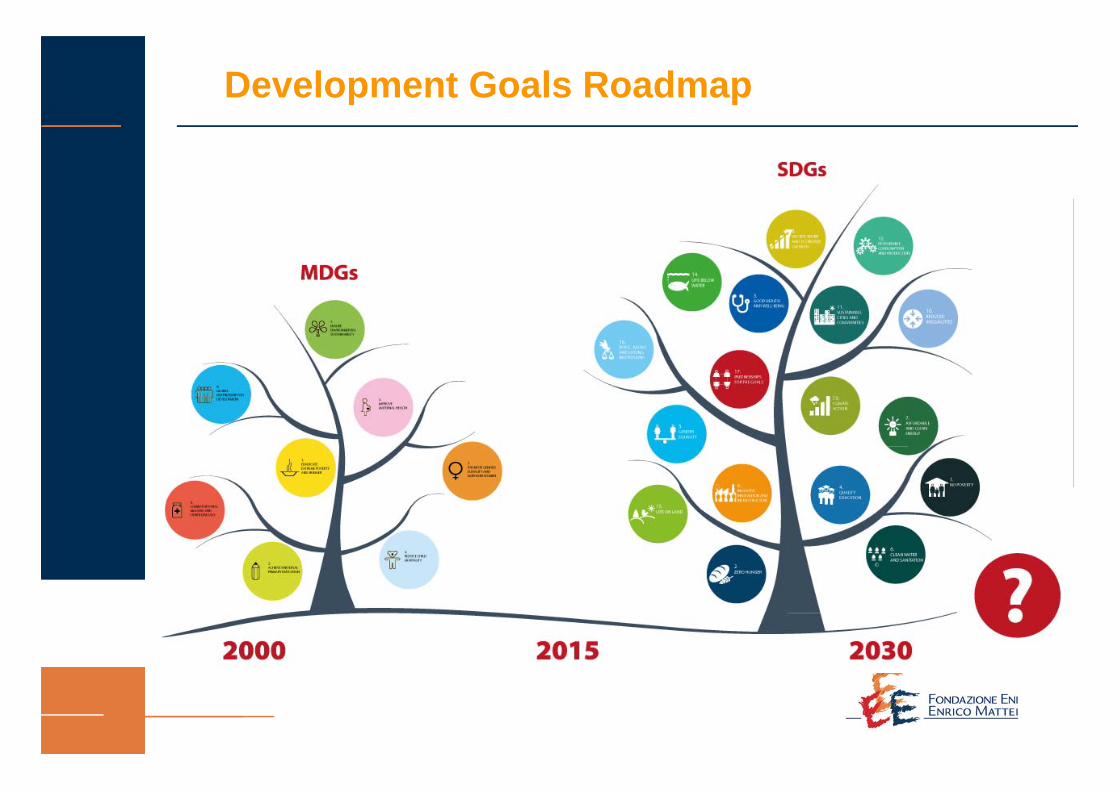
Development Goals Roadmap
Source: https://sustainabledevelopment.un.org/milestones

How to define the best indicators?
DEFINITION OF GOALS / TARGETS 17 SDGs (UN)
169 TARGETS (OWG, 2014)
CHOICE OF INDICATORS UN IAEG
(Inter-agency Expert Group on SDG Indicators) => report to be presented and evaluated in March 2016
DATA COLLECTION AND MONITORING UN IEAG
(Indepedendent Expert Advisory Group on a Data Revolution for Sustainable Development)
=> A WORLD THAT COUNTS

Two-Step assessment
Ex Post: Assess the present state of sustainability by measuring SDGs through appropriate statistical indicators:
=> common set of statistical indicators recorded for all world countries
Ex Ante: Assess the likely dynamics of sustainability by projecting SDGs into the future=> Extended macro-economic modelling framework
integrated with social and environmental modules to compute SDGs endogenously
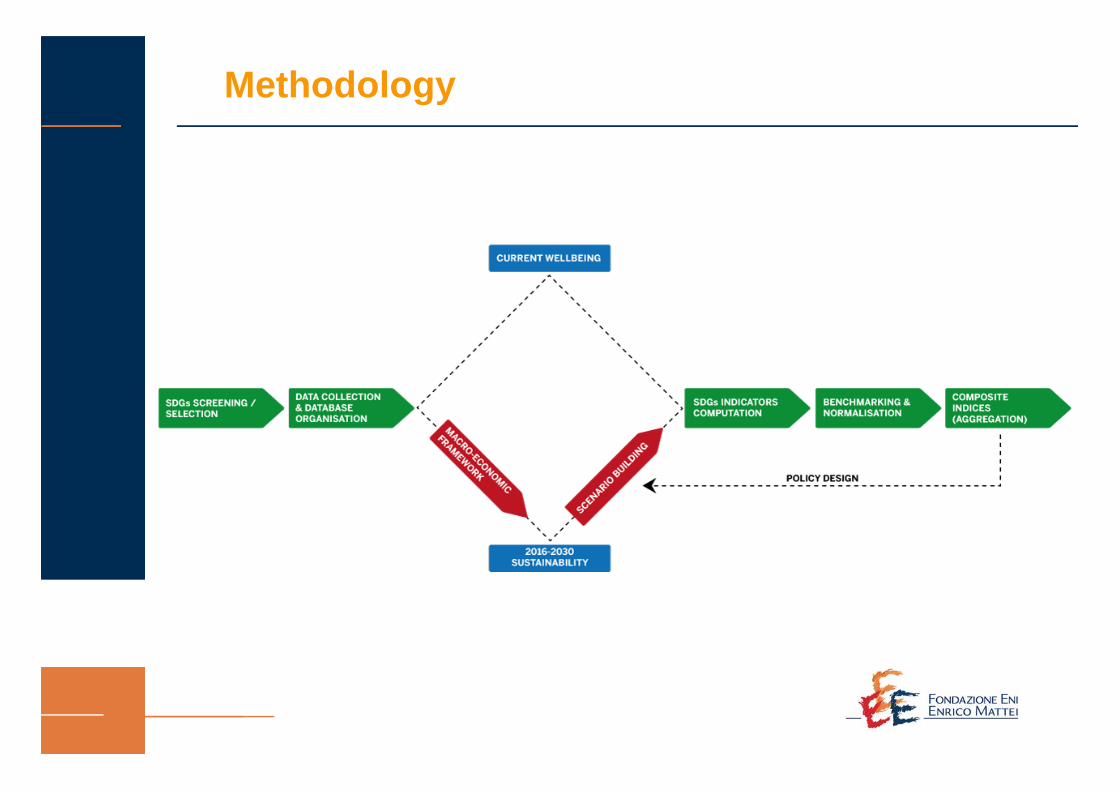
Methodology
Criteria: Covering the 17 UN SDGs (at least with one indicator) Data availability for most countries in the world (data are
collected for the last available year) Projections of future trends can be modelled
Structure: Indicators are grouped to provide an assessment of
sustainability by SDG and Pillar, as well as through a comprehensive multi-dimensional sustainability index
Only countries with indicators available for the whole set and all three dimensions of sustainability have been considered(139 countries).
Screening, Collection, Organization
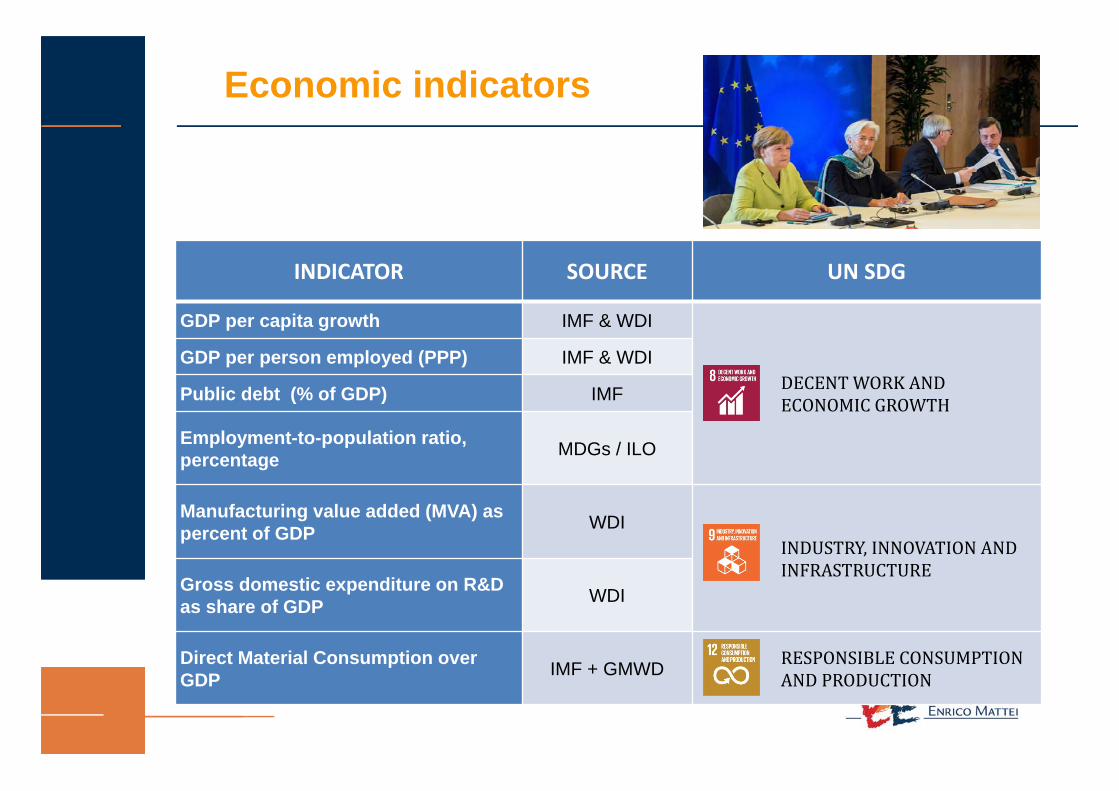
INDICATOR SOURCE UN SDG
GDP per capita growth IMF & WDI
DECENTWORKANDECONOMICGROWTH
GDP per person employed (PPP) IMF & WDI
Public debt (% of GDP) IMF
Employment-to-population ratio, percentage MDGs / ILO
Manufacturing value added (MVA) as percent of GDP WDI
INDUSTRY,INNOVATIONANDINFRASTRUCTURE
Gross domestic expenditure on R&D as share of GDP WDI
Direct Material Consumption over GDP IMF + GMWD RESPONSIBLECONSUMPTION
ANDPRODUCTION
Economic indicators

INDICATOR SOURCE UN SDG
Population below $1.25 (PPP) per day, percentage WDI / MDGs ENDPOVERTY
Undernourished population, percentage MDGs ZEROHUNGER
Physician density (per 1000 population) WDI
GOODHEALTHANDWELL‐BEINGHealthy Life Expectancy (HALE) at birth (years) WHO
Literacy rate of 15-24 year olds, both sexes, percentage
UNESCO / MDGs QUALITYEDUCATION
Access to electricity (% of total population) WDI AFFORDABLEANDCLEANENERGY
Palma ratio PovcalNet (WB) REDUCEDINEQUALITIES
Corruption Perception Index TI PEACE,JUSTICEANDSTRONGINSTITUTIONS
Social indicators

INDICATOR SOURCE UN SDG
Proportion of total water resources used MDGs CLEANWATERANDSANITATION
Share of electricity from renewables WDIAFFORDABLEANDCLEANENERGY
Rate of primary energy intensity IEA
Total energy and industry-related GHG emissions over value added IMF / CAIT INDUSTRY,INNOVATIONAND
INFRASTRUCTUREMean urban air pollution of particulate matter (PM2.5) WDI SUSTAINABLECITIESAND
COMMMUNITIESCO2 intensity of residential sector over energy volumes IEA
Net GHG emissions in the agriculture, forestry and other land use (AFOLU) sectors (weighted by total land)
FAO / WDICLIMATEACTION
CO2 intensity of power and transport over energy volumes IEA
Proportion of terrestrial and marine protected areas MDGs LIFEBELOWWATER
Forest area (% of land area) WDI
LIFEONLANDShare of endangered and vulnerable (animals and plants) species (% of total species) IUCN
Environmental indicators

Indicator TypeECONOMY
GDP per capita growth a 0 7GDP per person employed (PPP) a 5 50Public debt as share of GDP b 70 20Employment-to-population ratio, percentage a 40 80Manufacturing value added (MVA) as percent of GDP a 5 15Gross domestic expenditure on R&D as share of GDP a 0.5 3Direct Material Consumption over GDP a 0.5 2
SOCIETYPopulation below $1.25 (PPP) per day, percentage b 40 0.5Population undernourished, percentage b 20 5Physician density (per 1000 population) a 2 3Healthy Life Expectancy (HALE) at birth (years) a 55 70Literacy rate of 15-24 years old, both sexes, percentage a 85 99Access to electricity (% of total population) a 5 99Palma ratio b 2 1.2Corruption Perception Index a 3 6
ENVIRONMENTProportion of total water resources used b 30 5Share of electricity from renewables b 5 60Rate of primary energy intensity b 10 3Total energy and industry-related GHG emissions overvalue added b 2 1
Mean urban air pollution of particulate matter (PM2.5) b 25 5CO2 intensity of residential sector over energy volumes b 3 0Net GHG emissions in the AFOLU sector over total surface b 3 2CO2 intensity of power and transport over energy volumes b 3 0Proportion of terrestrial and marine protected areas a 5 20Forest area (% of land area) a 10 50Share of endangered and vulnerable (animals & plants)species (% of total species) b 10 5
Each indicator isnormalized between[0, 1].
Two types of indicators:a) The higher the
betterb) The lower the
better
Benchmarking=> Max and Minlevels (x) based on policy objectives, scientific literature or observed data
Benchmarking & Normalization

Two steps aggregation:
• Within each pillar(equal weighting)
• Across pillars(fuzzy measures +Choquet Integralbased upon experts’ elicitation)
Aggregation

Economy Society
Environment Multi‐dimensional Sustainability
Sustainability Maps …
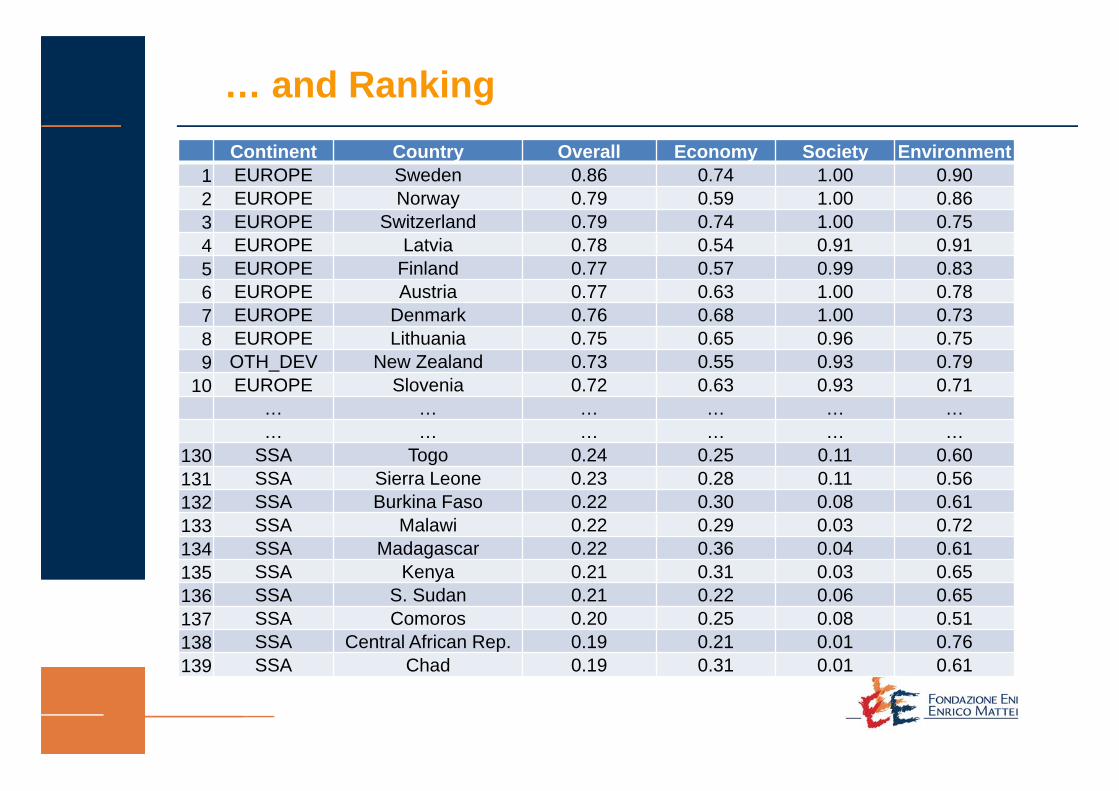
Continent Country Overall Economy Society Environment1 EUROPE Sweden 0.86 0.74 1.00 0.902 EUROPE Norway 0.79 0.59 1.00 0.863 EUROPE Switzerland 0.79 0.74 1.00 0.754 EUROPE Latvia 0.78 0.54 0.91 0.915 EUROPE Finland 0.77 0.57 0.99 0.836 EUROPE Austria 0.77 0.63 1.00 0.787 EUROPE Denmark 0.76 0.68 1.00 0.738 EUROPE Lithuania 0.75 0.65 0.96 0.759 OTH_DEV New Zealand 0.73 0.55 0.93 0.79
10 EUROPE Slovenia 0.72 0.63 0.93 0.71… … … … … …… … … … … …
130 SSA Togo 0.24 0.25 0.11 0.60131 SSA Sierra Leone 0.23 0.28 0.11 0.56132 SSA Burkina Faso 0.22 0.30 0.08 0.61133 SSA Malawi 0.22 0.29 0.03 0.72134 SSA Madagascar 0.22 0.36 0.04 0.61135 SSA Kenya 0.21 0.31 0.03 0.65136 SSA S. Sudan 0.21 0.22 0.06 0.65137 SSA Comoros 0.20 0.25 0.08 0.51138 SSA Central African Rep. 0.19 0.21 0.01 0.76139 SSA Chad 0.19 0.31 0.01 0.61
… and Ranking
Sweden
NorwaySwitzerlandLatvia
Denmark
New ZealandBrunei
GermanyHungaryCosta Rica
United Arab EmiratesUruguay ChileBrazil Japan
RussiaAlbania United StatesEl Salvador
BahrainTurkey
BhutanBelize
China
Kazakhstan TurkmenistanUkraineJamaica
Jordan BangladeshIndiaGuyanaIraqGhana Mali
Niger Cote d'Ivoire
NigeriaDem. Rep. CongoYemenGambia
Sudan
Central African Rep. Chad
0.0
0.1
0.2
0.3
0.4
0.5
0.6
0.7
0.8
0.9
1.0
0.0 0.1 0.2 0.3 0.4 0.5 0.6 0.7 0.8 0.9 1.0
MULTI‐D
IMEN
SIONAL
SUSTAINAB
ILITY INDEX
ECONOMIC INDEX
Sweden
Norway SwitzerlandLatviaDenmark
New ZealandBrunei
GermanyHungaryCosta Rica
United Arab EmiratesUruguay ChileBrazil Japan
RussiaAlbania United StatesEl Salvador
BahrainTurkey
BhutanBelize
ChinaKazakhstan TurkmenistanUkraine
JamaicaJordan BangladeshIndiaGuyana
IraqGhana MaliNiger Cote d'Ivoire
NigeriaDem. Rep. CongoYemenGambia
Sudan
Central African Rep. Chad
0.0
0.1
0.2
0.3
0.4
0.5
0.6
0.7
0.8
0.9
1.0
0.0 0.1 0.2 0.3 0.4 0.5 0.6 0.7 0.8 0.9 1.0
MULTI‐D
IMEN
SIONAL
SUSTAINAB
ILITY INDEX
ECONOMIC INDEX
0.000.200.400.600.801.00
Soc
EnvEco
Norway Russia China
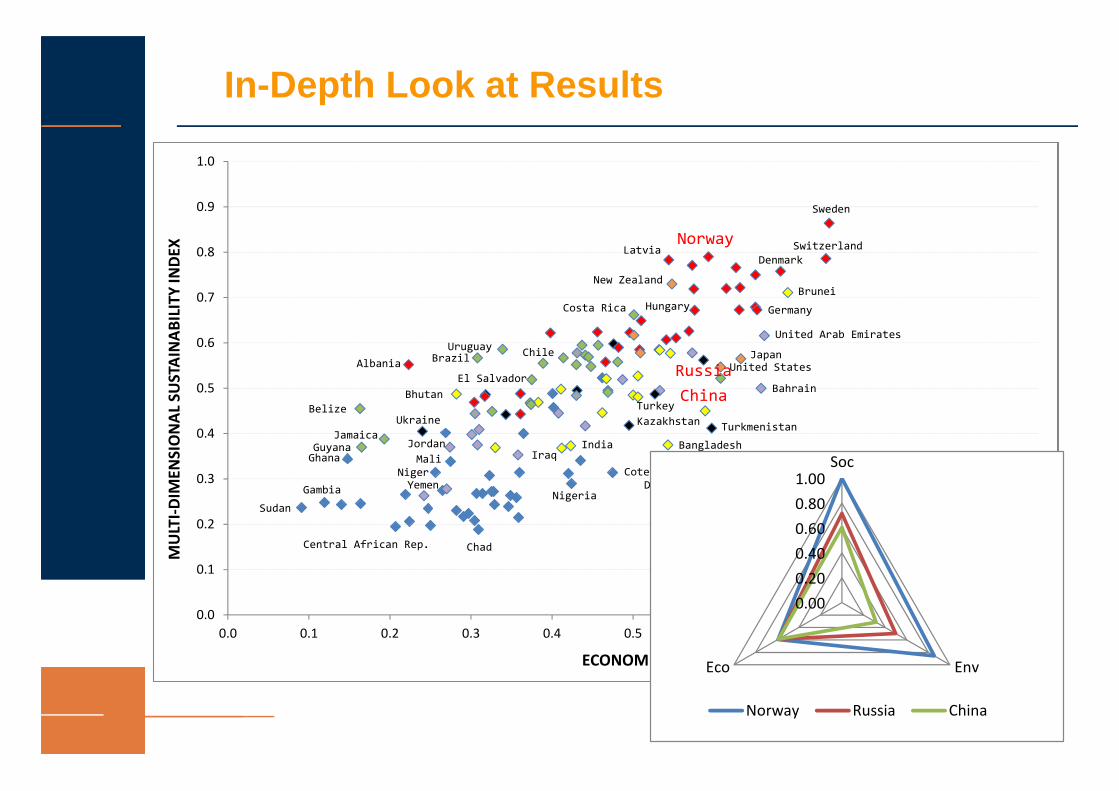
In-Depth Look at Results

Sweden
NorwaySwitzerlandLatvia
Denmark
New ZealandBrunei
GermanyHungaryCosta Rica
United Arab EmiratesUruguay ChileBrazil Japan
RussiaAlbania United StatesEl Salvador
BahrainTurkey
BhutanBelize
China
Kazakhstan TurkmenistanUkraineJamaica
Jordan BangladeshIndiaGuyanaIraqGhana Mali
Niger Cote d'Ivoire
NigeriaDem. Rep. CongoYemenGambia
Sudan
Central African Rep. Chad
0.0
0.1
0.2
0.3
0.4
0.5
0.6
0.7
0.8
0.9
1.0
0.0 0.1 0.2 0.3 0.4 0.5 0.6 0.7 0.8 0.9 1.0
MULTI‐D
IMEN
SIONAL
SUSTAINAB
ILITY INDEX
ECONOMIC INDEX
Sweden
Norway SwitzerlandLatviaDenmark
New ZealandBrunei
GermanyHungaryCosta Rica
United Arab EmiratesUruguay ChileBrazil Japan
RussiaAlbania United StatesEl Salvador
BahrainTurkey
BhutanBelize
ChinaKazakhstan TurkmenistanUkraine
JamaicaJordan BangladeshIndiaGuyana
IraqGhana MaliNiger Cote d'Ivoire
NigeriaDem. Rep. CongoYemenGambia
Sudan
Central African Rep. Chad
0.0
0.1
0.2
0.3
0.4
0.5
0.6
0.7
0.8
0.9
1.0
0.0 0.1 0.2 0.3 0.4 0.5 0.6 0.7 0.8 0.9 1.0
MULTI‐D
IMEN
SIONAL
SUSTAINAB
ILITY INDEX
ECONOMIC INDEX
Sweden
NorwaySwitzerlandLatvia
Denmark
New ZealandBrunei
GermanyHungaryCosta RicaUnited Arab Emirates
Uruguay ChileBrazil JapanRussiaAlbania United States
El SalvadorBahrain
TurkeyBhutan
BelizeChina
Kazakhstan TurkmenistanUkraineJamaica
Jordan BangladeshIndiaGuyanaIraqGhana Mali
Niger Cote d'Ivoire
NigeriaDem. Rep. CongoYemenGambia
Sudan
Central African Rep. Chad
0.0
0.1
0.2
0.3
0.4
0.5
0.6
0.7
0.8
0.9
1.0
0.0 0.1 0.2 0.3 0.4 0.5 0.6 0.7 0.8 0.9 1.0
MULTI‐D
IMEN
SIONAL
SUSTAINAB
ILITY INDEX
ECONOMIC INDEX
0.000.200.400.600.801.00
Soc
EnvEco
Norway Russia China
0.000.200.400.600.801.00
Soc
EnvEco
Costa Rica Germany
In-Depth Look at Results

Recursive dynamic macro-economic model to project SDGsinto the future for all world countries. Main features: interactions among countries and sectors to account for
externalities of economic development (input-output intersectoral structure, time dynamics, international trade)
connections with and feedbacks from social and environmental variables and indicators
GTAP8 database enriched with social and environmentalindicators Detailed results for 45 countries / regions Sectoral Detail => 22 sectors (public sectors and
renewables singled out) Socio-economic scenarios based on SSPs (Shared Socio-
Economic Pathways) from 2007 to 2030.
Database, Model, Scenario Building

• Assessment of sustainability:over timeacross countries (ranking) through states of the world (scenario analysis)as a consequence of policy measures
• Policy for sustainability:Verify fulfillment of targets in the reference scenarioAssess distance-to-targetDesign policy and compute investments and
mechanisms to achieve targets Detect hidden trade-offs among indicators
Assessment of future trends and policies

www.feemsdgs.org
Related Documents


