www.sciencemag.org/cgi/content/full/317/5839/815/DC1 Supporting Online Material for Divergence of Transcription Factor Binding Sites Across Related Yeast Species Anthony R. Borneman, Tara A. Gianoulis, Zhengdong D. Zhang, Haiyuan Yu, Joel Rozowsky, Michael R. Seringhaus, Lu Yong Wang, Mark Gerstein, Michael Snyder* *To whom correspondence should be addressed. E-mail: [email protected] Published 10 August 2007, Science 317, 815 (2007) DOI: 10.1126/science.1140748 This PDF file includes: Materials and Methods Fig. S1 to S5 References Other Supporting Online Material for this manuscript includes the following: (available at www.sciencemag.org/cgi/content/full/317/5839/815/DC1) Tables S1 to S14

Welcome message from author
This document is posted to help you gain knowledge. Please leave a comment to let me know what you think about it! Share it to your friends and learn new things together.
Transcript
www.sciencemag.org/cgi/content/full/317/5839/815/DC1
Supporting Online Material for
Divergence of Transcription Factor Binding Sites Across Related Yeast Species
Anthony R. Borneman, Tara A. Gianoulis, Zhengdong D. Zhang, Haiyuan Yu, Joel Rozowsky, Michael R. Seringhaus, Lu Yong Wang, Mark Gerstein,
Michael Snyder*
*To whom correspondence should be addressed. E-mail: [email protected]
Published 10 August 2007, Science 317, 815 (2007)
DOI: 10.1126/science.1140748
This PDF file includes:
Materials and Methods Fig. S1 to S5 References
Other Supporting Online Material for this manuscript includes the following: (available at www.sciencemag.org/cgi/content/full/317/5839/815/DC1)
Tables S1 to S14

Supporting Online Material.
Materials and Methods
Yeast strains, growth conditions and epitope taggingYeast strains used in this study were the S. bayanus NRRL Y-11845, S. mikatae
IFO 1815 and C. albicans BWP17(1). S. bayanus, S. mikatae were both transformed by a PCR-based approach used for S. cerevisiae. As each strain is diploid, sequential transformations were performed using G418 resistance (kanMX)(2) as a marker, with marker conversion to nourseothricin (nat) resistance (natMX)(3) performed to allow reuse of the kanMX marker prior to tagging of the second allele. For S. mikatae, G418 and nat were used at 200 µg/ml and 100 µg/ml respectively for selection of transformants, whereas for S. bayanus, 50 µg/ml and 20 µg/ml were used. C. albicans was also transformed using a PCR based approach, with sequential rounds of tagging performed using modified versions of pFA6a-13myc-kanMX6(4) where kanMX was replaced by URA3 and ARG4 as selectable markers. For each strains, protein expression was examined by immunoblot analysis and tagged proteins were produced of the expected size. The tagged strains appeared functional as cell elongation in the tagged strains appeared similar to that of wild type strains under conditions that induce pseudohyphal or dimorphic growth.
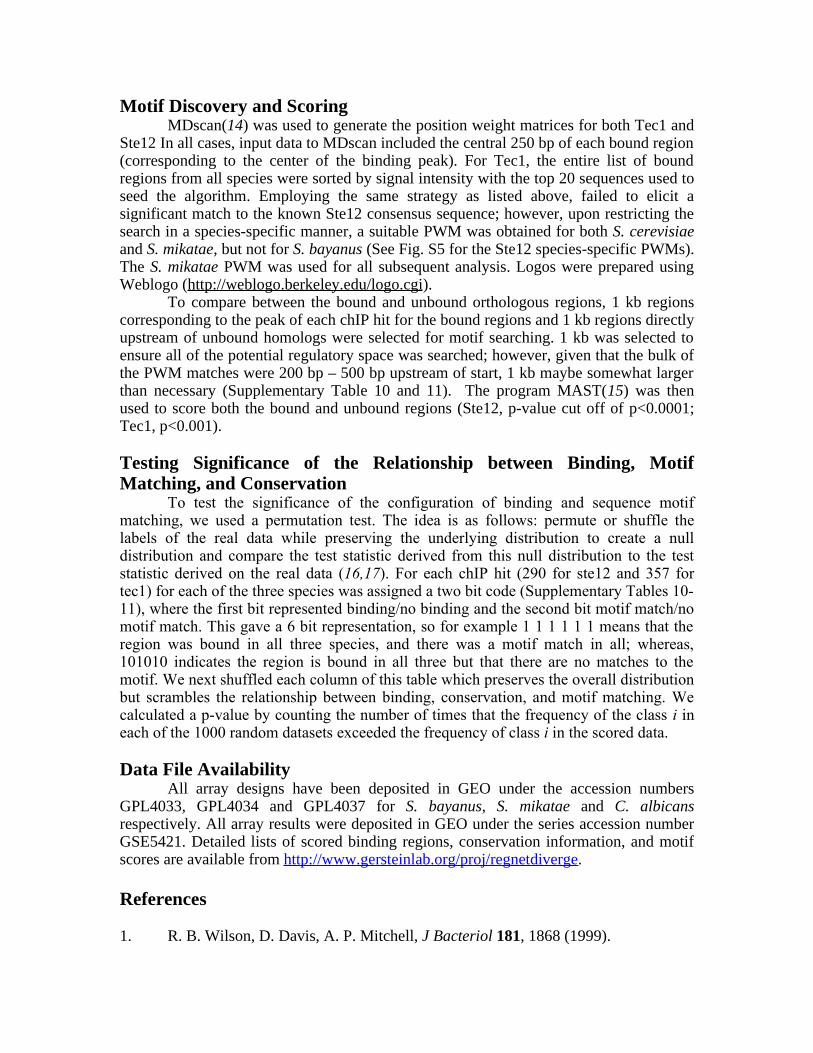
Array designArrays were designed to the available genome sequences of S. mikatae, S.
bayanus(5) by selecting 50 bp oligonucleotides every 60 bp on both strands of each sequencing contig, with top and bottom strand oligonucleotides offset by 30bp (see Fig. S1). For C. albicans, 50 bp oligonucleotides were also designed every 60 bp across the published genome sequence(6), although due to microarray feature constraints, tiling of the bottom strand was limited to one 50 bp oligonucleotide every 120 bp.
Immunoprecipitations, DNA labelling and microarray hybridisationFor immunoprecipitations, S. bayanus and S. mikatae were grown using
conditions similar to those used for S. cerevisiae(7), except with the time in nitrogen starvation medium altered to reflect the differences in doubling time of S. mikatae (3 hrs induction) and S. bayanus (6hrs induction). For C. albicans, cells were grown at 25°C to an OD600 of 0.3 in Lee’s medium(8) prior to being induced for 4hrs at 37°C Lee’s medium. Cells were fixed with formaldehyde and immunoprecipitations, DNA labelling and array hybridisations were carried out as described elsewhere (7, 9).
Microarray analysis and scoringFollowing scanning, the two files corresponding to each channel (in .pair file
format) were uploaded to the Tilescope pipeline for high-density tiling array data normalization and scoring (http://Tilescope.gersteinlab.org (10)). Tilescope processes the data in a sequential fashion. These steps can be approximately grouped into three stages: normalization, tile scoring, and feature identification. We describe some of the key steps in our system below in detail.
Normalization. For each array in an experimental set, the relative contributions of the test and reference signals are compared. Ideally, if nucleic acid probes have equal

concentration in the test and reference samples, the signals of the two dyes should be relatively equal (i.e. the ratio of the two signals should be close to one for probes hybridizing to an equal degree in both fluorescence channels). In practice, the signals can be rather different due to different chemical properties of dyes and non-specific or incomplete hybridization to the array. Normalization is used to compensate for these effects by either applying a scale factor to equalize signals from probes with unchanged concentration or imposing the same empirical distribution of signal intensities. Tilescope uses Quantile normalization. This not only normalizes data between channels and across arrays simultaneously but also removes the dependency of the log-ratio on the intensity in one step. It imposes the same empirical distribution of intensities to each channel of every array. Quantile normalization is fast and has been demonstrated to outperform other normalization methods (11).
Tile scoring. Tilescope pools the normalized log-ratios of all tiles on every array into a matrix and sorts them based on the tiles’ genomic locations regardless of which strand they come from. At the tile scoring step, the program identifies tiles that exhibit differential hybridization. These tiles ultimately correspond to the locations of transcription factor binding sites.
Instead of considering each tile across array replicates separately, a sliding window around each tile that incorporates the hybridization intensity of its neighboring tiles is used. For each tile, given its neighboring tiles across replicates, Tilescope calculates its signal, the pseudo-median log-ratio value S = median[ (log-ratio i + log-ratio j)/2 ] from all (i, j) pairs of tiles in the sliding window across arrays. Due to the small sample size in each sliding window, whether the intensity distribution is normal or not in a given window cannot be reliably assessed. Without making the normality assumption about the intensity distribution, Tilescope uses the nonparametric Wilcoxon signed-rank test (12) to compare the test with the reference signal intensities and quantifies the degree of significance by which the former consistently deviates from the latter across the window. At the scoring step, Tilescope generates two tile maps, the signal map and the p-value map. Two values are calculated for each tile position: the pseudo-median of log-ratios, the signal, as a measure of the hybridization difference between test and reference samples at this genomic location and the probability, the p-value, that the null hypothesis (the local intensities of the test and the reference samples are the same) is true.
Feature identification. Given the tile map annotated with pseudo-medians and p-values, Tilescope filters away tiles that are below user-specified thresholds. Retained tiles are used to identify binding sites. Based on the observation that a tile is usually too short to constitute a feature alone, the Max-gap and min-run method, modified from the scoring scheme used in Cawley et al.(13), groups together qualified tiles that are close to each other along the genomic sequence into ‘proto-features’ and then discards any proto-features that are too short. To use this method, a user needs to specify the maximum genomic distance (‘max-gap’) below which two adjacent qualified tiles can be joined and the minimum length (‘min-run’) of a proto-feature for it to be qualified as a feature.
Experimental scoring variables. For all experiments, max-gap was set at 60 bp and min-run at 120bp. p-value cut offs were set at ≤1 X 10⁻⁴, with pseudo-median cut offs of ≥1.25 (Sc Tec1, Sc Ste12, Sm Tec1, Sm Ste12), ≥1.10 (Sb Tec1) and ≥1.00 (Ca Cph1) used.
Independent confirmation of the chIP chip procedure was performed by qPCR for binding targets from across the range of binding strengths, plus two non-enriched controls; all positives targets which gave PCR signals were enriched compared to the

negative controls (Table S13).
Array ReproducibilityTo determine the reproducibility of the chIP chip and high-density microarray
methodology, duplicate Ste12 and Tec1 binding experiments (each consisting of three additional biological replicates) were performed in S. cerevisiae at the beginning and end of the study. In this second set of samples, Ste12 bound 290 targets, while Tec1 bound 357 targets. The two duplicate datasets showed a high degree of congruence, with 97% (Ste12) and 95% (Tec1) of the targets from the smaller dataset contained within the larger set such that nearly all of the observed differences were due to variations near the signal threshold used (Fig. 1B; Tables S1 and S2).
Species-specific arrays and sequence independenceIn order to compare the results of the species-specific arrays, we perform tests to
ensure that the actual sequences printed on the arrays did not significantly affect the hybridization results and any subsequent binding sites scoring. To calculate the sequence-independent array reproducibility, three biological replicates were chosen and alternating probes from each replicate were separated into two new result files. These new files were then scored independently for binding events using Tilescope. Comparison of the files showed that 93% of the total binding peaks arrays were shared, with each pair of peaks differing in average signal enrichment by +/-5% and starting and stopping on average +/-68bp from each other (Table S14).
Genome Alignment and StandardizationAs the S. mikatae and S. bayanus genome sequences are in draft form, difficulties
arose in directly comparing results from different species as regions from one species may not necessarily be present in all. To guard against a lack of sequence representation influencing our results, the genomes of all three species were aligned to ensure that orthologous sequences were present in all three species for any bound region (Tables S7 and S8). This was performed using conserved gene sequences and chromosomal synteny to position sequence contigs from S. mikatae and S. bayanus onto the S. cerevisiae genome.
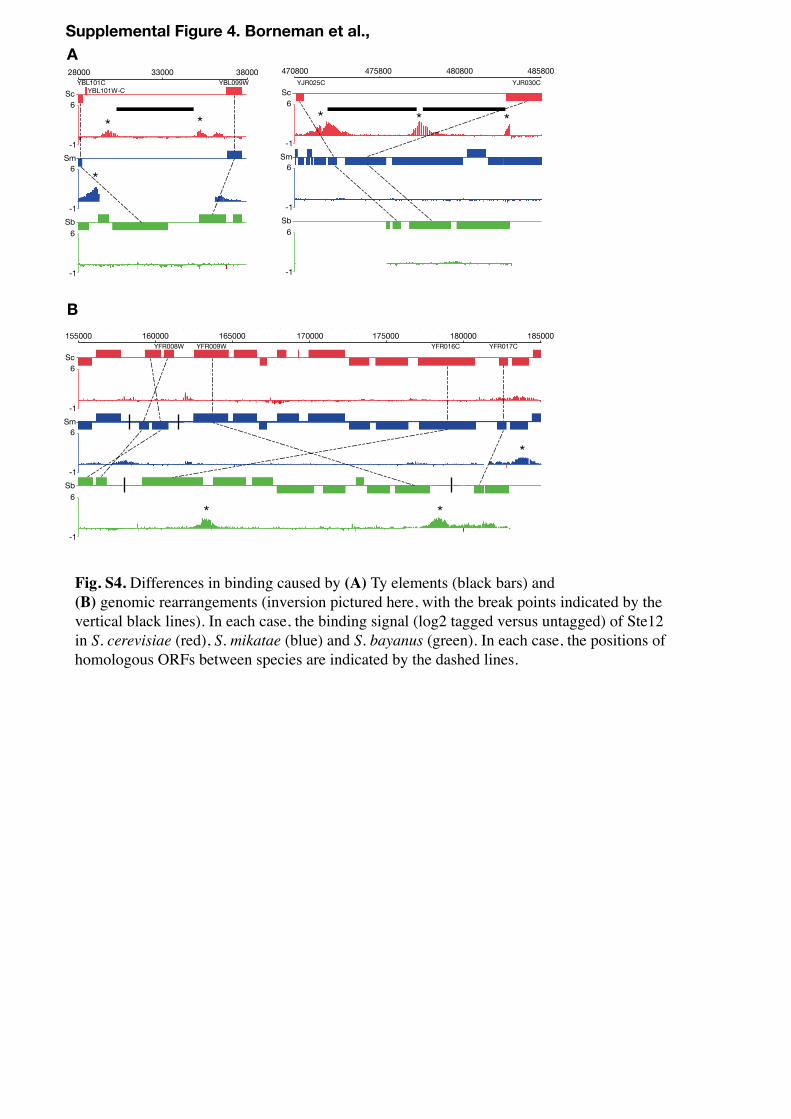
Over 250 instances were identified in which differences in binding between at least two of the three species were attributed to species-specific gene annotation, missing sequences or contig breaks (often due to the presence of repetitive Ty elements, which are bound strongly by both Ste12 and Tec1, Fig. S4). To prevent these ambiguous regions from affecting further analyses, they were excluded from any subsequent calculations.
Measuring Threshold Effects To examine the effect of setting different thresholds on the amount of binding
conservation, we set one species as the reference and examined the signal distribution of all regions in the remaining two species (Fig. S2). We next determined the number of orthologous unbound regions in each of these two remaining species where the intensity was just below threshold but still above background. In the case where 2 of 3 species had binding, we showed that 6, 9, and 6 for S. cerevisiae, S. mikatae, and S. bayanus respectively had regions that fit these criteria (Fig. S2).
Motif Discovery and ScoringMDscan(14) was used to generate the position weight matrices for both Tec1 and
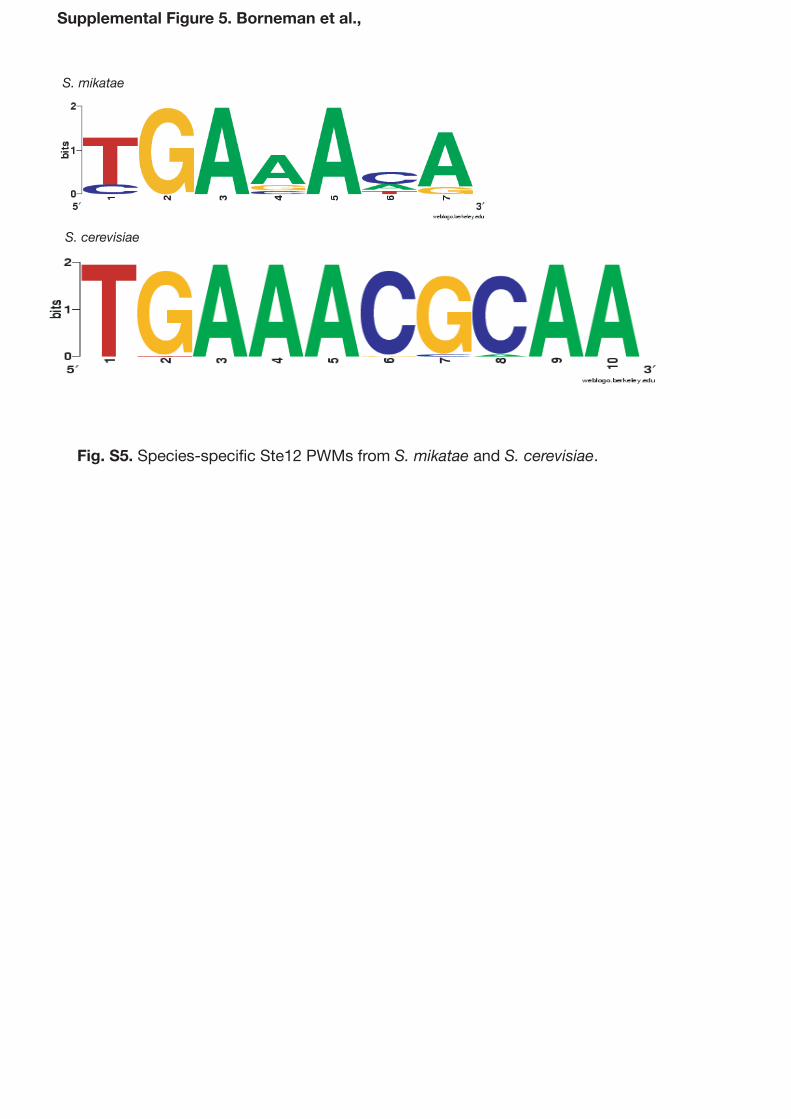
Ste12 In all cases, input data to MDscan included the central 250 bp of each bound region (corresponding to the center of the binding peak). For Tec1, the entire list of bound regions from all species were sorted by signal intensity with the top 20 sequences used to seed the algorithm. Employing the same strategy as listed above, failed to elicit a significant match to the known Ste12 consensus sequence; however, upon restricting the search in a species-specific manner, a suitable PWM was obtained for both S. cerevisiae and S. mikatae, but not for S. bayanus (See Fig. S5 for the Ste12 species-specific PWMs). The S. mikatae PWM was used for all subsequent analysis. Logos were prepared using Weblogo (http://weblogo.berkeley.edu/logo.cgi).
To compare between the bound and unbound orthologous regions, 1 kb regions corresponding to the peak of each chIP hit for the bound regions and 1 kb regions directly upstream of unbound homologs were selected for motif searching. 1 kb was selected to ensure all of the potential regulatory space was searched; however, given that the bulk of the PWM matches were 200 bp – 500 bp upstream of start, 1 kb maybe somewhat larger than necessary (Supplementary Table 10 and 11). The program MAST(15) was then used to score both the bound and unbound regions (Ste12, p-value cut off of p<0.0001; Tec1, p<0.001).
Testing Significance of the Relationship between Binding, Motif Matching, and Conservation
To test the significance of the configuration of binding and sequence motif matching, we used a permutation test. The idea is as follows: permute or shuffle the labels of the real data while preserving the underlying distribution to create a null distribution and compare the test statistic derived from this null distribution to the test statistic derived on the real data (16,17). For each chIP hit (290 for ste12 and 357 for tec1) for each of the three species was assigned a two bit code (Supplementary Tables 10-11), where the first bit represented binding/no binding and the second bit motif match/no motif match. This gave a 6 bit representation, so for example 1 1 1 1 1 1 means that the region was bound in all three species, and there was a motif match in all; whereas, 101010 indicates the region is bound in all three but that there are no matches to the motif. We next shuffled each column of this table which preserves the overall distribution but scrambles the relationship between binding, conservation, and motif matching. We calculated a p-value by counting the number of times that the frequency of the class i in each of the 1000 random datasets exceeded the frequency of class i in the scored data.
Data File AvailabilityAll array designs have been deposited in GEO under the accession numbers
GPL4033, GPL4034 and GPL4037 for S. bayanus, S. mikatae and C. albicans respectively. All array results were deposited in GEO under the series accession number GSE5421. Detailed lists of scored binding regions, conservation information, and motif scores are available from http://www.gersteinlab.org/proj/regnetdiverge.
References
1. R. B. Wilson, D. Davis, A. P. Mitchell, J Bacteriol 181, 1868 (1999).

2. A. Wach, A. Brachat, R. Pohlmann, P. Philippsen, Yeast 10, 1793 (1994).3. A. L. Goldstein, J. H. McCusker, Yeast 15, 1541 (1999).4. M. S. Longtine et al., Yeast 14, 953 (1998).5. M. Kellis, N. Patterson, M. Endrizzi, B. Birren, E. S. Lander, Nature 423, 241
(2003).6. T. Jones et al., Proc. Natl. Acad. Sci USA 101, 7329 (2004).7. A. R. Borneman et al., Genes Dev 20, 435 (2006).8. K. L. Lee, H. R. Buckley, C. C. Campbell, Sabouraudia 13, 148 (1975).9. A. R. Borneman et al., Func. Integ. Genomics (2007).10. Z. D. Zhang, J. S. Rozowsky, H. Y. K. Lam, M. Snyder, M. Gerstein, Genome
Biol. 8, R81 (2007).11. B. M. Bolstad, R. A. Irizarry, M. Astrand, T. P. Speed, Bioinformatics 19, 185
(2003).12. O. G. Troyanskaya, M. E. Garber, P. O. Brown, D. Botstein, R. B. Altman,
Bioinformatics 18, 1454 (2002).13. S. Cawley et al., Cell 116, 499 (2004).14. X. S. Liu, D. L. Brutlag, J. S. Liu, Nat. Biotechnol. 20, 835 (2002).15. T. L. Bailey, M. Gribskov, Bioinformatics 14, 48 (1998).16. DeGroot MH and Schervish, Probability and Statistics 3 rd ed , NY: Addision
Wiley, 2001. 17. Ptacek, et al, Nature. 438, 679 (2005).
50bp
60bp
30bp
60bp
50bp
0bp 100,000bp 200,000bp
0bp 1000bp
5‘ 3‘
5‘3‘
Supplemental Figure 1. Borneman et al.,
Supplemental Figure 1. Tiling array designs used in S. mikatae, S. bayanus and C. albicans. For each species, oligos were deisgned to tile the genome sequence contigs with a 50bp oligonucleotide every 60 bp on the Watson strand. For S. mikatae and S. bayanus, this same spacing was used on the Crick strand offset 30 bp compared to those oligonucleotide on the Watson strand. For C .albicans, limitations on the number a features allowed on the arrays resulted in a 50 bp oligonucleotide being spaced every 120 bp, offset 30 bp.

Bound in Two of Three Species 0<X<1.2
Bound in SC, SM NOT SB 12
Bound in SC, SB NOT SM 18
Bound in SM, SB NOT SC 12
Total below threshold but above background 42
Bound in One of Three (at least one below theshold but above background) 0<X<1.2
Bound in SC, NOT SM or SB 17
Bound in SM, NOT SC or SB 19
Bound in SB, NOT SM or SC 27
Total below threshold but above background 64
Bound in One of Three (both below threshold but above background) 0<X<1.2
Bound in SC, NOT SM or SB 6
Bound in SM, NOT SC or SB 5
Bound in SB, NOT SM or SC 1
Total below threshold but above background 18
*where X refers to the target's log ratio signal intensity
Supplemental Figure 2. Borneman et al.,
Fig. S2. (A) Distribution of orthologs of Ste12 bound regions from S. cerevisiae. (B) Distribution of orthologs of Tec1 bound regions from S. cerevisiae. Bluebars, enrichment signals higher than the threshold, red bars, below the cut off threshold. Background intesity is equal to 0 (C) Total numbersof binding events which were below the signal enrichment threshold, but which had signals which were detectable above background levels.
0 0.5 1 1.5 2 2.5 30
50
100
SB Region Log Ratio corresponding to SC Bound Regions
0 0.5 1 1.5 2 2.5 3 3.50
50
100
SM Region Log Ratio corresponding to SC Bound Regions
1 1.2 1.4 1.6 1.8 2 2.2 2.4 2.6 2.80
50
100
SC Bound Region Log Ratio1 1.2 1.4 1.6 1.8 2 2.2 2.4 2.60
20
40
60
80
0 0.5 1 1.5 2 2.50
50
100
150
200
0 0.5 1 1.5 2 2.5 30
50
100
150
200
SB Region Log Ratio corresponding to SC Bound Regions
SM Region Log Ratio corresponding to SC Bound Regions
SC Bound Region Log Ratio
A B
C
Sc iYBL017C
Sm iYBL017C
Sb iYBL017C
10 20 30 40 50 60 70 80 90
T A A C G T G T G A T G A C T A C T G G A C A C T T C A G G G C T T T T C C A G A T A T A C A G A G C T T T A T A A T A C A A T C T A A G G G C A A A
T C T A A
G G C G T G C G G T G A T T A A A G G A G C A G A T G C C T T T T A G A G C T T T T A T T A A A T G T C A C T A T T T T T T A T G A T A T T C A A T C T A G T G A C A G A A T A A A
Sc iYBL017C
Sm iYBL017C
Sb iYBL017C
100 110 120 130 140 150 170 170 180
A T A A A A A A G G A A A A - A G A G T A C G G T A G T T G A G A A A A A A A C C G G A A A G G A A T T G C T T T A A A G A T C T T A G T A G A A T G A A A T A G T A C C A C C T A
A T A G A T A C A A T C A A - A A A A T A G A G G G A G A A A G A G A A A A A T - G G A A A G A A A T T G C T G T T G A T A T A C C A G T A G A A T G A A A T G G T A C T A T T T G
A A A A A A G G A G A A A G G A G G G G A C A A G T G A A A A A A A A A A A G T G A A C A G G A A A T T G T C T G A G A A A G A T T A G T A G A A A G T A A T C G T A G T - T C T A
Sc iYBL017C
Sm iYBL017C
Sb iYBL017C
190 200 210 220 230 240 250 260 270
C T C G C C T C C T T T T T T T G - T G C T T C T T - - - G A G A G G T C T T T T G A G C T G T T G C A T - C A T - - G C T G T T A T T T A G A G G T T A T T T T T T G A C C T T G
T C T G C T T C T T T C C T T T A A T G C T T A C T T G G G G G A G G T C C T T T A A G C T T T T G T T G - C A T - - A A T A T T A C T T G A A A A G T T A T T T T T G A A C T T C
G T T G C C T C C T T T C T T G A A T G C T T T G T G T T G G A A G A C T C T T G A A C C T G T T G C A C A C A T C G A T T G C T T C C T G A A A A G C T A T T T T C G A A T G C C
Sc iYBL017C
Sm iYBL017C
Sb iYBL017C
280 290 300 310 320 330 340 350 360
G T T T T T C C T T C T T T T C G - C C G T A C T C A G C C C G A G A A A A A A G C A G C G A C T G C A C T A A A C T A G A G G A A - - - A G A A G G C T T A A A A C A T C A C G C
G T T T T T C C T T C C C T A C A - C T G T A C T C A G C C C G A - A A A A A A G C A G C A A A A G C A T G A A A T G G G G G A A C - - - G A A G G C C T A A A A A C A T C A C G C
T T T T T A C T T T T C C T T T G A C C G T G T G T G T A A T C A T A A A A A C C C G A A A A A A A A A A A C A G C G G C A G A G A T G G G G A G G C T T G A A A A C A T T T C A A
Sc iYBL017C
Sm iYBL017C
Sb iYBL017C
370 380 390 400 410 420 430 440 450
G A T C C A T A T A A A G A C C C G A G T A G T T G G A G A G A T T G A C T A C T T G A C G T T C A A A A G A A C A T A C A T A A G G A T A A A T T C G T T C G G A C T T T T T A A
G A T C T A A A G T A A G A C C C G A G T A G T T G C A G - G A T T G G C C A C A T G A C G A G C A A A A G A C T A C A T G T A - G A A A A A A T T C A T T T G A G T C T T G C A A
G A G C - A A A C A A G C A C G C G A A A A G A C A T A T - - - - - - - - - G C A A G G G G G G A G G G A G T G T A G T T T T T T T T T T T C T T T T A T T G A C G C C T T G A G A
Sc iYBL017C
Sm iYBL017C
Sb iYBL017C
460 470 480 490 500 510 520 530 540
C T T A C A C A C A T C T T T T G G T G T T C A T T - - C A A G G G G C G G T A G T G C T - - - - T G T A G T C C G C A C A G G C G G A T A C T T T T T A G T T T G G G A A G A G T
G A T T A T C G T G C C T T T T T T T G G T C T T T A T C A A G G C G T A A T A T T A T A G A - - T A T A G A C A G T A T T G C C C T G A C A T T C T T G G T T T A A G A A T A G G
T G A G C A G C T A A A T A C G A T A T T C T T T T C T C A C T T T G T A A T A C C T T G G G T G T G T G G T C G G C A T T C C C G C G A T G G T T G T G G C T G T A C A G T G C -
Sc iYBL017C
Sm iYBL017C
Sb iYBL017C
550 560 570 580 590 600 610 620 630
T A A C T G G A G A - G G G C A G T T T A C T T T C A C A T A C T C T T T T A T C T T T C T G A A G T A A A A T G T G A T G T A C C T A C A A G C A A T G C A T A A G C T C T T G A
G A A T G G G G G T C G A G T A G G T C T T T C G G A T G T G C T C T T T - A T C T G T T G A A A G T A A A A T A T A A A G C A T T T G C A - - T C A A G T G T G A T T T C T T G A
- - - C A G A A A C C G A G A G A G T T - - - - - G A T G T A T C T G T T - - - - - - - T G A A A G A T A T A C G C T A C C T G G C A T G A A G C G C A A C C A A C G C C T G G G A
Sc iYBL017C
Sm iYBL017C
Sb iYBL017C
640 650 660 670 680 690 700 710 720
G T T T - T A G A T C T G T T T C A C C C T G G A A C T C A A A A T T C T T T T A C T C G A A A T T T T T A C T T T T T T T T T T T T T G T T T C T G C A T T C T C T C A G A T T T
G T T T - C G T A T G T G T T T C A C G C T G A A A C T C A A A - T C C T T T T G A T C A G A A T C T A T T C A T T T T T T T T C T T C A - - - - - - C A T T C T C C T A G C T T T
G T T T G C G C G G G C G T T T C A C A C T A A A A C C T A A A - T T C T T T T A C T C G A A G T T T T T T T T T T T T T T T T T T C T G - - - - - - C A T T C T C C T G A T T T C
Sc iYBL017C
Sm iYBL017C
Sb iYBL017C
730 740 750 760 770 780 790 800 810
T A G A T G A T G C G G T T T T T T A C A G G G C A T T G A A A C A A T T G - C A G A A A A G C A A C A T A C T A A T A T A T C A T A A C T T T T T A C T C T T G C C T C T C A G A
C A G A T G A T G C G G T T T T C G A C A C G G C A T T G A A A C A A C T G - C A G A A A A G C A G C A T A C - A A T T T A T C T G G A C T T C T T A T T C T T C T C T C C G A G A
C A G A T G A T G C G G T T T T T T A C A C G G C A T T G A A A C G T T G G G C A G A A A A G C A G C A T A A G G T G G A A C C A T T T A T A T A T A T C A T A C A T A T C C T C T
Sc iYBL017C
Sm iYBL017C
Sb iYBL017C
820 830 840 850 860 870 880 890 900
A A C T A T A T A T A C G T T G T A A T C A T T T T C T T T C T T C T A A T A G C T A G T T C G T T T G A A C T A C A A G G A A A T A A G G C A G A G A A A A A G A A A G G A A A A
A A C T A T A T A T A C G T T G C G A T - G C T T T T T T T C T T C T A T A
T G T T C T G T T C T C G A G A A A A A G T G T A T A T A T A G A C G T A G C C A G T G T C C A T C C G A A C C A A G G G A A A A G A G A C C A G A C C A A A A T A A A A
Sc iYBL017C
Sm iYBL017C
Sb iYBL017C
910 920 930 940 950 960 970 980 990
T A A T A
Sc iYNL193W
Sm iYNL193W
Sb iYNL193W
10 20 30 40 50 60 70 80 90
T G A A A T T A C G T A C A T A T A C A T A A G T A G A A G A T A A T T C G T T G C G C A T A T G C T A C A A G A A C C C T T G G T G A A A C G A A A T T T G A T A C A A G T A A A
T A A A A T T A G G T A C G T A C A T A T A - - T A G A T G C A A A T A C A T T G T A C A T A C G T G G C A - G A A T C C T C G G T G A A A C A A C T T T T A A T T C A A A A C G A
Sc iYNL193W
Sm iYNL193W
Sb iYNL193W
100 110 120 130 140 150 160 170 180
T A C A T G C A G G A A A C A T A - C A T T A C C T C T G A A A C A A A G C C G A G A C G G G G C C C A G C A G T C T T T T T T T A G A A A T C G C G T G G C T T G G T A A C G C G
T G C A T G T A G G A A T C A T A A T G C T A T A T C T G A A A C A A A C C C G A G - - - G G A C C C A G C A A G C T T T T T T T A G A A A C C G C G T G G C T T G G T A A C G C G
A C A G G A A A C A C A - - C T T C C A T C T G A A A C A A A G C C G A C A C - G G G C C C A G C A A T C T T T T T T T A G A A A T C G C G T G G C T T G G T A A T A C G
Sc iYNL193W
Sm iYNL193W
Sb iYNL193W
190 200 210 220 230 240 250 260 270
A T A A T G A C G C G A C A C A G C C A T T A G T G T G A A A T T T G A T T T T C T T G G C C A A A C T A G G T A T A A T A T T T G T T A C A A A T T A T T G - A T T T T A A T A T
A T A A T G A C G C G A C A C A G C C A T T A G T G G G A A A A A T G A T T C T A A T G G C C A A A T C A G G T A T A A C A C T T G C T A C A G A G T A G T T - G T T T G A T T A T
A T A T T G A C G C G A C A C A G C C A T T G G C G T G A A A T T T G A T T C T C T T G G C C A A A T C A G G T A T A A C G C T T G G T A C A A A A A A C C G T G T T T G C T T A T
Sc iYNL193W
Sm iYNL193W
Sb iYNL193W
280 290 300 310 320 330 340 350 360
A T A T C T C G G G T T C A T T T T T T A C G T C G G T A C T C C A A A G G A T C A A A A C A C T T A C A T T T T G A G G C C T A C C G G A C C T T G C A G T A C T G C T T G T T T
A T A T C T C G G G T T C A T T T T T T A C A T C A A A A G T C T A G G A G A C C A T C T T A C C T G A A A T T C A A C G C C T A C C A G A C C A T A C C A T A C T G C T G G T T T
A T A T C T C G G G T T C A T T C T C A A T A - C G A G G C T C C A A A A G A T T A G T T T G G T T G T A - T T C A G C C C C C G C C A G T G C A T G C T A C G C T A T T T G C T T
Sc iYNL193W
Sm iYNL193W
Sb iYNL193W
370 380 390 400 410 420 430 440 450
A A A T A C G C A G T A T A C A T T T C T T C T T C T T C T T C T C T C T T C T T T C C T T C C T C G A A G A G - T C A C T A A A T T A A T - - - - A C T G G G A A G C C A A A C C
A A A T A C G C A G T A T C C A T T T T T C T A T T C T C T C T T C T - - - - T T C C C T T C A T C G A A G A G A T C A C T G A G T C G A C - - - - A T T C G A A A - C T A A A C T
A A A T A C A C A G T G C C C A T T T T C A C A T C T C T C T T C C A - - - - - T C T C T T C C T C G A A G A C A T T T C C A G A T C G A T C G G C A T T T A G A A G C T A A G C A
Sc iYNL193W
Sm iYNL193W
Sb iYNL193W
460 470 480 490 500 510 520 530 540
A A A A A A A C T A T A C A
A A T A T T A A G A T A T A A C A
A A C A C A A G A A A G G A A A A A G A A A T A A C C
A
B
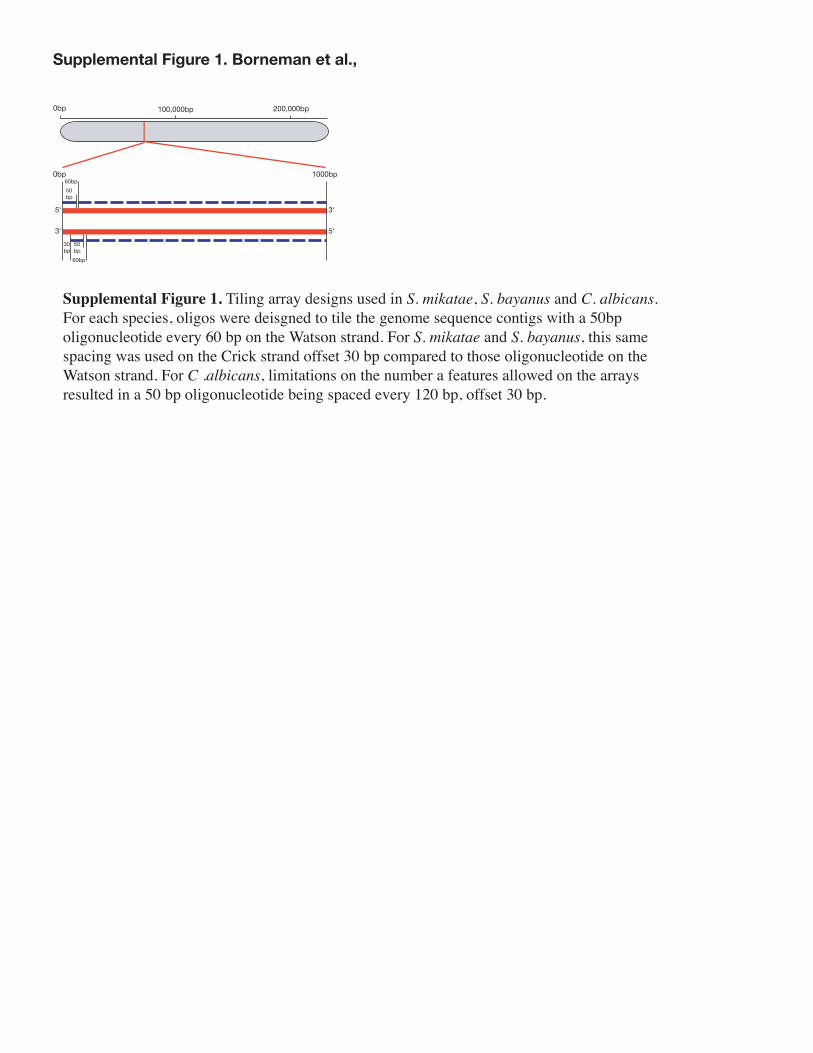
Supplemental Figure 3. Sequence alignments of (A) the YBL017C/YBL016C and (B) the YNL193W/YNL192W intergenic region from S. cerevisiae, S. mikatae andS. bayanus. The position of Ste12 (yellow) and Tec1 (blue) consensus sequencesare also highlighted.
Supplemental Figure 3. Borneman et al.
A28000 3800033000
Sc
Sm
Sb
6
-1
6
-1
6
-1
470800 475800
Sc
Sm
Sb
6
-1
6
-1
6
-1
485800
B155000 170000160000
Sc
Sm
Sb
6
-1
6
-1
6
-1
185000175000
480800
* *
*
*
* * * *
YJR025C YJR030CYBL101C YBL099WYBL101W-C
YFR016C
165000 180000YFR009WYFR008W YFR017C
*
Supplemental Figure 4. Borneman et al.,
Fig. S4. Differences in binding caused by (A) Ty elements (black bars) and (B) genomic rearrangements (inversion pictured here, with the break points indicated by the vertical black lines). In each case, the binding signal (log2 tagged versus untagged) of Ste12 in S. cerevisiae (red), S. mikatae (blue) and S. bayanus (green). In each case, the positions of homologous ORFs between species are indicated by the dashed lines.
Supplemental Figure 5. Borneman et al.,
S. mikatae
S. cerevisiae
Fig. S5. Species-specific Ste12 PWMs from S. mikatae and S. cerevisiae.
Related Documents