Supporting Information Manoli et al. 10.1073/pnas.1302764110 SI Materials and Methods Constructs and Generation of Mut -/- ;Tg INS-Alb-Mut Mice. Methyl- malonyl-CoA mutase (Mut) knockout mice have been described previously (1, 2). These mice harbor a deletion of exon 3 in the Mut gene that abolishes the production of mature RNA, protein, and enzymatic activity. Mice homozygous for this mutation (C57BL/6 Mut −/− ) display immediate neonatal lethality. A transgene, Tg INS-Alb-Mut , was engineered to express the Mut gene in the liver. In brief, a full-length murine Mut cDNA that had been functionally validated to encode a highly active Mut enzyme (3) was cloned into the multiple cloning site of the pLIVE in vivo expression and reporter vector (Mirus Bio), a cassette that uses well-established regulatory elements to direct transgene expres- sion in murine hepatocytes (4), excised, and cloned between two full-length tandem repeated chromatin barrier [hypersensitive site 4 from the chicken β-globin cluster locus control region (cHS4)] insulator elements to generate INS-Alb-Mut, which, after restriction digestion and purification, was microinjected into fertil- ized C57BL/6 eggs (5). Founder animals were screened for the presence of the INS-Alb-Mut transgene and bred to C57BL/6 mice to test transmission. Mouse Genotyping. Mouse genotyping was performed on tail genomic DNA extracted using standard protocols. PCR amplifications were performed across the loxP site of the targeting construct, as well as across the Mut cDNA to detect the INS-Alb-Mut transgene. The primers used were as follows: 5′-loxP site, 5′-CCATTCTGGGA- AGGCTTCTA-3′; and 3′-loxP site, 5′-TGCACAGAGTGCTA- GTTTCCA-3′. For the murine Mut cDNA, the following were used: forward, 5′-CATGTTGAGAGCTAAGAATC-3′; and re- verse, 5′-TAGAAGTTCATTCCAATCCC-3′. Results of the gen- otyping reactions and assignment of genotypes are provided in Fig S1 A and B. Control and mutant mice were surveyed by genotyping 40 single-nucleotide polymorphisms (SNPs) distributed along mouse chromosomes 1–19 and X. A low percentage of 129/SvEv SNPs were detected (12–17%), predominantly on chromosome 17, which is where the targeted locus resides. Thus, although the back- ground of this murine model is not fixed, no recurrent SNPs other than those near the Mut locus were observed, suggesting that background effects are not expected to significantly con- tribute to the phenotype. Diet and Antioxidant Therapy. A 70% (wt/wt) casein or 61% protein chow was fed ad libitum to the mice (TD.06723; Harlan Labo- ratories) for 2 or 6 mo. For the ubiquinone and vitamin E (VitE) studies, mice were placed on the same diet with 0.5% ubiqui- none, CoQ 10 (HydroQsorb powder, a γ-cyclodextrin/trans-ubi- decarenone complex; Tishcon) and 0.2% VitE (TD.10862 Custom Diet; Harlan Laboratories) added. FITC-Labeled Inulin-Clearance Studies. Glomerular filtration rate (GFR) was assessed by the FITC-inulin clearance method, as described previously (6). Under 1–3% isoflurane anesthesia, mice were given a single bolus retroorbital injection of 5% FITC- inulin (3.74 μL/g body weight). Heparinized serial blood collec- tions (5-μL volume) were performed from tail cuts at 3, 7, 10, 15, 35, 55, and 75 min after FITC-labeled inulin administration. Plasma was separated under centrifugation (3 min; 12,000 × g). Because pH affects FITC fluorescence values, each plasma sample was buffered by mixing 1 μL of plasma with 9 μL of 500 mM Hepes solution (pH 7.4). The amount of FITC label present in the samples was then measured using a fluorospectrometer at 538-nm emission (Thermo Scientific; NanoDrop 3300). A two- compartment clearance model was used to calculate GFR. Plasma fluorescence data were fit to a two-phase exponential-decay curve using nonlinear regression (GraphPad Prism; GraphPad Soft- ware). GFR (microliters per minute) was calculated using the equation: GFR = I/(A/α + B/β), where I is the amount of FITC- inulin delivered by injection, A and B are the y-intercept values of the two decay rates, and α and β are the decay constants for the distribution and elimination phases, respectively (6, 7). Glomerular and Tubular Function of Single Nephrons. Experiments were performed in mice anesthetized with 100 mg/kg body weight thiobutabarbital (Inactin; Sigma) i.p. and 100 mg/kg body weight ketamine s.c. Preparation for these studies involved maintenance of body temperature at 37.5 °C, cannulation of the left carotid artery for measurement of arterial blood pressure and blood withdrawal, cannulation of the right jugular vein for the infusion of [ 125 I]iothalamate (Glofil-125; Iso-Tex Diagnostics; ∼40 μCi/h), cannulation of the bladder for urine collections, exposure of the left kidney from an abdominal flank incision, and placement of the kidney in a lucite holder. Nephron-filtration and -absorption rates were determined by free-flow micropuncture as described previously (8). Following tubular identification by dye injection, proximal collections were done in the last surface segment (col- lection times, 2.5–3.5 min) using oil-filled pipettes. Fluid volume was determined from column length in a constant bore capillary. Samples were transferred into a counting vial and radioactivity was determined in a γ counter. Blood samples were collected in heparinized 5-μL microcaps at the beginning and at the end of the experiment. [ 125 I]Iothalamate radioactivity was measured in duplicates using 500-nL samples of plasma and urine. Propionate Oxidation Studies. Closed-circuit, constant-volume re- spiratory chambers for the collection and quantitation of 13 CO 2 from mice were used as described previously (9). Mice were injected i.p. with a tracer dose (1 μg/g body weight) of [1- 13 C] sodium propionate and placed in the chamber, and aliquots of expired air were removed every 5 min for analysis of 13 CO 2 en- richment (isotope ratio 13 C/ 12 C) using isotope ratio mass spec- troscopy (Metabolic Solutions), whereas the CO 2 production rate was directly measured by a CO 2 probe. The percentage of dose metabolized at each time point was calculated as follows: per- centage of dose metabolized = total 13 C excreted [mmol/dose (mmol) × 100%]. Clinical Chemistry Screen. Terminal blood collections were ob- tained retroorbitally from mice using heparinized glass capillary tubes (Drummond Scientific) following i.p. injection of pento- barbital (5 mg/mL; dose of 0.2–0.3 mL/10 g body weight). The samples were centrifuged (4 °C; 10 min; 10,000 rpm), and the plasma removed and stored at −80 °C in a screw-top tube for later analysis. Methylmalonic acid was analyzed by gas chroma- tography–mass spectrometry with stable isotopic internal cali- bration, as described previously (10). Urine was isolated from the mice by restraining them over a piece of parafilm and gently massaging their bladder. This technique was repeated at two separate time points during the day to increase sample volume. Urine was collected in centrifuge tubes, centrifuged (4 °C; 10 min; 10,000 rpm), and the super- natant collected and stored in a similar fashion as the plasma. Manoli et al. www.pnas.org/cgi/content/short/1302764110 1 of 11

Welcome message from author
This document is posted to help you gain knowledge. Please leave a comment to let me know what you think about it! Share it to your friends and learn new things together.
Transcript
Supporting InformationManoli et al. 10.1073/pnas.1302764110SI Materials and MethodsConstructs and Generation of Mut−/−;TgINS-Alb-Mut Mice. Methyl-malonyl-CoA mutase (Mut) knockout mice have been describedpreviously (1, 2). These mice harbor a deletion of exon 3 in theMut gene that abolishes the production of mature RNA, protein,and enzymatic activity. Mice homozygous for this mutation(C57BL/6Mut−/−) display immediate neonatal lethality. A transgene,TgINS-Alb-Mut, was engineered to express the Mut gene in theliver. In brief, a full-length murine Mut cDNA that had beenfunctionally validated to encode a highly active Mut enzyme (3)was cloned into the multiple cloning site of the pLIVE in vivoexpression and reporter vector (Mirus Bio), a cassette that useswell-established regulatory elements to direct transgene expres-sion in murine hepatocytes (4), excised, and cloned between twofull-length tandem repeated chromatin barrier [hypersensitivesite 4 from the chicken β-globin cluster locus control region(cHS4)] insulator elements to generate INS-Alb-Mut, which, afterrestriction digestion and purification, was microinjected into fertil-ized C57BL/6 eggs (5). Founder animals were screened for thepresence of the INS-Alb-Mut transgene and bred to C57BL/6mice to test transmission.
MouseGenotyping.Mouse genotyping was performed on tail genomicDNA extracted using standard protocols. PCR amplifications wereperformed across the loxP site of the targeting construct, as well asacross the Mut cDNA to detect the INS-Alb-Mut transgene. Theprimers used were as follows: 5′-loxP site, 5′-CCATTCTGGGA-AGGCTTCTA-3′; and 3′-loxP site, 5′-TGCACAGAGTGCTA-GTTTCCA-3′. For the murine Mut cDNA, the following wereused: forward, 5′-CATGTTGAGAGCTAAGAATC-3′; and re-verse, 5′-TAGAAGTTCATTCCAATCCC-3′. Results of the gen-otyping reactions and assignment of genotypes are provided inFig S1 A and B.Control and mutant mice were surveyed by genotyping 40
single-nucleotide polymorphisms (SNPs) distributed along mousechromosomes 1–19 and X. A low percentage of 129/SvEv SNPswere detected (12–17%), predominantly on chromosome 17, whichis where the targeted locus resides. Thus, although the back-ground of this murine model is not fixed, no recurrent SNPsother than those near the Mut locus were observed, suggestingthat background effects are not expected to significantly con-tribute to the phenotype.
Diet and Antioxidant Therapy.A 70% (wt/wt) casein or 61% proteinchow was fed ad libitum to the mice (TD.06723; Harlan Labo-ratories) for 2 or 6 mo. For the ubiquinone and vitamin E (VitE)studies, mice were placed on the same diet with 0.5% ubiqui-none, CoQ10 (HydroQsorb powder, a γ-cyclodextrin/trans-ubi-decarenone complex; Tishcon) and 0.2% VitE (TD.10862Custom Diet; Harlan Laboratories) added.
FITC-Labeled Inulin-Clearance Studies. Glomerular filtration rate(GFR) was assessed by the FITC-inulin clearance method, asdescribed previously (6). Under 1–3% isoflurane anesthesia,mice were given a single bolus retroorbital injection of 5% FITC-inulin (3.74 μL/g body weight). Heparinized serial blood collec-tions (5-μL volume) were performed from tail cuts at 3, 7, 10, 15,35, 55, and 75 min after FITC-labeled inulin administration.Plasma was separated under centrifugation (3 min; 12,000 × g).Because pH affects FITC fluorescence values, each plasmasample was buffered by mixing 1 μL of plasma with 9 μL of 500mM Hepes solution (pH 7.4). The amount of FITC label present
in the samples was then measured using a fluorospectrometer at538-nm emission (Thermo Scientific; NanoDrop 3300). A two-compartment clearance model was used to calculate GFR. Plasmafluorescence data were fit to a two-phase exponential-decay curveusing nonlinear regression (GraphPad Prism; GraphPad Soft-ware). GFR (microliters per minute) was calculated using theequation: GFR = I/(A/α + B/β), where I is the amount of FITC-inulin delivered by injection, A and B are the y-intercept valuesof the two decay rates, and α and β are the decay constants forthe distribution and elimination phases, respectively (6, 7).
Glomerular and Tubular Function of Single Nephrons. Experimentswere performed in mice anesthetized with 100 mg/kg body weightthiobutabarbital (Inactin; Sigma) i.p. and 100 mg/kg body weightketamine s.c. Preparation for these studies involved maintenanceof body temperature at 37.5 °C, cannulation of the left carotidartery for measurement of arterial blood pressure and bloodwithdrawal, cannulation of the right jugular vein for the infusionof [125I]iothalamate (Glofil-125; Iso-Tex Diagnostics; ∼40 μCi/h),cannulation of the bladder for urine collections, exposure of theleft kidney from an abdominal flank incision, and placement ofthe kidney in a lucite holder. Nephron-filtration and -absorptionrates were determined by free-flow micropuncture as describedpreviously (8). Following tubular identification by dye injection,proximal collections were done in the last surface segment (col-lection times, 2.5–3.5 min) using oil-filled pipettes. Fluid volumewas determined from column length in a constant bore capillary.Samples were transferred into a counting vial and radioactivitywas determined in a γ counter. Blood samples were collected inheparinized 5-μL microcaps at the beginning and at the end ofthe experiment. [125I]Iothalamate radioactivity was measured induplicates using 500-nL samples of plasma and urine.
Propionate Oxidation Studies. Closed-circuit, constant-volume re-spiratory chambers for the collection and quantitation of 13CO2from mice were used as described previously (9). Mice wereinjected i.p. with a tracer dose (1 μg/g body weight) of [1-13C]sodium propionate and placed in the chamber, and aliquots ofexpired air were removed every 5 min for analysis of 13CO2 en-richment (isotope ratio 13C/12C) using isotope ratio mass spec-troscopy (Metabolic Solutions), whereas the CO2 production ratewas directly measured by a CO2 probe. The percentage of dosemetabolized at each time point was calculated as follows: per-centage of dose metabolized = total 13C excreted [mmol/dose(mmol) × 100%].
Clinical Chemistry Screen. Terminal blood collections were ob-tained retroorbitally from mice using heparinized glass capillarytubes (Drummond Scientific) following i.p. injection of pento-barbital (5 mg/mL; dose of 0.2–0.3 mL/10 g body weight). Thesamples were centrifuged (4 °C; 10 min; 10,000 rpm), and theplasma removed and stored at −80 °C in a screw-top tube forlater analysis. Methylmalonic acid was analyzed by gas chroma-tography–mass spectrometry with stable isotopic internal cali-bration, as described previously (10).Urine was isolated from the mice by restraining them over
a piece of parafilm and gently massaging their bladder. Thistechnique was repeated at two separate time points during the dayto increase sample volume. Urine was collected in centrifugetubes, centrifuged (4 °C; 10 min; 10,000 rpm), and the super-natant collected and stored in a similar fashion as the plasma.
Manoli et al. www.pnas.org/cgi/content/short/1302764110 1 of 11
Plasma creatinine concentrations were measured using stableisotope dilution liquid chromatography–tandem mass spectrom-etry on a tandem quadrupole electrospray ionization-triple quad-rupole tandem mass spectrometer equipped with an acquityultra-performance, liquid chromatography system (Waters Corpo-ration). Twenty-five microliters of plasma were mixed with 10 μLof a 2.4 μg/mL [2H3]creatinine internal standard, deproteinizedby the addition of 100 μL of acetonitrile, vortex-mixed, andcentrifuged at 15,000 × g for 5 min. The supernatant liquid wasdried at room temperature under nitrogen, reconstituted in10 mmol/L ammonium acetate in 65:35 acetonitrile:deionizedH2O (vol/vol) (solvent A), and filtered by centrifugation in a 0.2-μm nylon microspin filter tube (Grace). Five microliters ofsample were injected onto a 5 μm, 2.0 × 100 mm TSK-GELamide-80 column (Tosoh Bioscience) and separated using sol-vent A as the mobile phase at a flow rate of 0.13 mL/min. Cre-atinine and the internal standard were detected using selectedreaction monitoring of the transitions m/z 114 to 44 and m/z 117to 47, respectively. The ratio of the ion intensities for creatinineto that of the internal standard were converted to a concentra-tion by means of a calibration curve, which ranged from 0.9 to26.5 μmol/L.For human samples, plasma methylmalonic acid (MMA) was
determined by liquid chromatography–tandem mass spectrome-try stable isotope dilution analysis (Mayo Medical Laboratories).Estimated GFR was based on 24-h urine collections used tocalculate creatinine clearance and corrected for body surface area(data presented as milliliters per minute per 1.73 m2).
Respiratory-Chain Enzymatic Activities, Immunohistochemistry, andCoQ10 Level Measures. To visualize histological features and mi-tochondrial abnormalities, frozen sections of kidney and liverwere cut in a cryostat and stained with COX, succinate de-hydrogenase (SDH), and combined COX-SDH reactions (11).Sections were examined with an Olympus BX51 microscope witha computer-assisted image analysis system, and the images werescanned under uniform light conditions with the Q-capturecomputer program.To measure activities of mitochondrial respiratory complexes,
40–70 mg of tissue was homogenized in CPT medium (0.5 MTris·HCl, 0.15 M KCl; pH 7.5) and centrifuged at 2,500 × g for20 min at 4 °C to obtain 10% extracts. The supernatant was usedfor protein determination and enzymatic assays. Complex I ac-tivity was measured following the oxidation of NADH at 340 nm,and cytochrome c oxidase (COX or complex IV) activity wasmeasured following the reduction of cytochrome c at 550 nm, asdescribed previously (12). Citrate synthase (CS) activity wasmeasured following the reduction of 100 mM 5,5′-dithiobis(2-nitrobenzoic acid) (TNB) at 412 nm (30 °C) in the presence of 60μg of sample protein, 300 mM acetyl-CoA, 10 mM Tris·HCl (pH7.5), and 500 mM oxalacetic acid. The results were expressed innanomoles of TNB consumed per minute per milligram proteinand normalized to CS. Because of the variability of CS activity,activities of respiratory-chain enzymes were also normalized toprotein.CoQ9 in kidney tissue was extracted in 1-propanol. The lipid
component of the extract was separated by HPLC on a reverse-phase Symmetry C18 column (3.5 μm; 4.6 × 150 mm; Waters),using a mobile phase consisting of methanol, ethanol, 2-prop-anol, acetic acid (500:470:15:15), and 50 mM sodium acetate ata flow rate of 0.8 mL/min. The electrochemical detector, Cou-lochem II (ESA), was used with the following settings: guard cell(upstream of the injector) at +650 mV, conditioning cell at −650mV (downstream of the column), followed by the analytical cellat +450 mV. CoQ concentration was estimated by comparison ofthe peak area with those of standard solutions of known concen-tration and expressed in micrograms per milligram proteins (13).
Microarray Analyses. For transcriptional profiling, four biologicalreplicates of each genotype (Mut+/+, Mut+/−;TgINS-Alb-Mut andMut−/− ;TgINS-Alb-Mut transgenic female mice) were collected (total,12 samples) after the mice were on the high-protein (HP) chowfor 2 mo. After removal, kidneys were snap-frozen in liquidnitrogen. Total RNA from one whole kidney was extracted usingthe RNeasy Mini Kit (74104; Qiagen). cDNA was labeled by theAmbion WT Expression Kit (4411973; Ambion) and hybridizedto Affymetrix GeneChip Mouse Gene 1.0 ST Arrays (901168;Affymetrix) according to the manufacturer’s protocols. Data wereanalyzed using Partek Genomics Suite software (Partek), andpathway analysis was conducted using Ingenuity Pathway Anal-ysis (Ingenuity Systems).We performed principal component analysis and generated
histograms to assess the biological variability of the microarrays.Using hierarchical cluster analysis, the transcriptomes of Mut+/+,Mut+/−;TgINS-Alb-Mut, and Mut−/−;TgINS-Alb-Mut mice showed sat-isfactory segregation and differential clustering. One heterozy-gote segregated distinctly from the remaining three, suggestingsample degradation and was, therefore, excluded from furtheranalysis.Hierarchical cluster analysis showed satisfactory segregation
and differential clustering of the mutant samples compared withthe heterozygote and wild-type littermates. Differential expres-sion was analyzed for three comparisons (Mut+/+ vs. Mut+/−;TgINS-Alb-Mut, Mut+/−;TgINS-Alb-Mut vs. Mut−/−;TgINS-Alb-Mut, andMut+/+ vs. Mut−/−;TgINS-Alb-Mut transgenic mice). To explore bi-ological patterns, we performed canonical pathway enrichmentanalysis using Ingenuity Pathway Analysis and calculated a P valuefor each pathway that was adjusted for multiple testing using theBenjamini–Hochberg method (14). A P value of 0.05 afterBenjamini–Hochberg multiple testing was used to determine sta-tistically significant pathways.The microarray data were deposited in Gene Expression
Omnibus (GEO) database (accession no. GSE41044).
Quantitative Real-Time PCR Analysis. Total RNA from frozen tissuewas extracted using the RNeasy Mini Kit (74104; Qiagen). DNasedigestion was performed using DNA-free (AM1906; Ambion),and 2 μg of RNA was reverse transcribed using the High Ca-pacity cDNA Kit (4368814; Applied Biosystems). TaqMan gene-expression assays were performed in triplicate according to themanufacturer’s instructions using the Fast Universal PCR Mas-ter Mix (4352042; Applied Biosystems) and the Applied Bio-systems 7500 Fast Real-Time PCR System. TaqMan probesspecific to murine Mut (Mm00485312_m1), lipocalin-2 (Lcn2)(Mm01324470_m1), PPARα (Mm00440939_m1), Cyp4a12a(Mm00514494_m1), or Cyp4a12b (Mm00655431_gH) were used(Applied Biosystems). mRNA expression levels were normalizedto GAPDH (Mm99999915_g1; Applied Biosystems), and quan-tification of relative gene expression, presented as percentage ofthe relevant baseline, was calculated using the 2−ΔΔCT (com-parative threshold) method.
Western Analysis and ELISA. Tissue samples were homogenizedwith a 2-mL Tenbroeck tissue grinder (Wheaton) in ice-coldtissue protein extraction reagent (Pierce Biotechnology) in thepresence of Halt protease inhibitor mixture (Pierce Bio-technology). Lysates were centrifuged at 10,000 rpm for 10 minat 4 °C, and supernatants were collected. Twenty to 30 μg ofclarified protein extract were analyzed by Western blot using anaffinity-purified, rabbit polyclonal antisera raised against themurine Mut enzyme at a dilution of 1:1,000. The Complex IIIsubunit Core 2 monoclonal antibody was used as a loadingcontrol at a dilution of 1:3,000 (MS304; MitoSciences). Horse-radish peroxidase-labeled anti-rabbit IgG (NA934VS; Amer-sham Biosciences) or anti-mouse IgG (NA931VS; Amersham)was used as the secondary antibody at a dilution of 1:10,000 or
Manoli et al. www.pnas.org/cgi/content/short/1302764110 2 of 11
1:30,000, respectively. Signal was visualized using the SuperSignalWest Pico chemiluminescence substrate (34080; Thermo Scien-tific).Urine and plasma LCN2 levels were measured in both mice and
humans using ELISA (DLCN20 and MLCN20; R&D Systems).Specimens, standards, and reagents were prepared according tothe manufacturer’s instructions. All experiments were performedin duplicate. Urine LCN2 levels were normalized to creatinineconcentration.
Mouse Histology, Immunohistochemistry, and Electron Microscopy.Tissues for histology were immediately fixed in 10% formalin,embedded into paraffin blocks and subsequently stained withH&E. For immunohistochemistry, kidneys were snap-frozen inliquid-nitrogen-cooled isopentane. The tissues were cryosec-tioned and stained for COX and SDH activities, as describedpreviously (15). Transmission electron microscopy (EM) wasperformed on mouse tissues fixed overnight at 4 °C in 2% glu-taraldehyde in 0.1 M cacodylate buffer (pH 7.4) and washed withcacodylate buffer three times. The tissues were fixed with 2%OsO4 for 2 h, washed again with 0.1 M cacodylate buffer threetimes, washed with water, and placed in 1% uranyl acetate for1 h. The tissues were subsequently serially dehydrated in ethanoland propylene oxide and embedded in EMBed 812 resin (Elec-
tron Microscopy Sciences). Thin sections, ∼80 nm thick, wereobtained by using the Leica ultracut-UCT ultramicrotome (Leica)and placed onto 300-mesh copper grids and stained with satu-rated uranyl acetate in 50% methanol and then with lead citrate.The grids were viewed in the JEM-1200EXII electron microscope(JEOL) at 80 kV, and images were recorded on the XR611M,mid-mounted, 10.5 million pixel, CCD camera (Advanced Micros-copy Techniques).
Statistical Analyses. All data were prepared for analysis withstandard spreadsheet software (Microsoft Excel). Statisticalanalysis was done with Microsoft Excel, Prism 4.0 (GraphPad), orIBM SPSS Version 21 statistical software. Data are presented asthe means ± SEM. All shown data reflect a minimum of threeanimals or three subjects per test. Statistical comparisons wereperformed using two-tailed Student t test or one-way ANOVA,followed by Bonferroni or Tukey–Kramer post hoc test for multiplecomparisons. When data were not normally distributed or groupswere of unequal size, the Kruskal–Wallis one-way ANOVA testingwas performed. Pearson’s correlation coefficient and linear re-gression were used for correlations. Kaplan–Meier analysis wasused to evaluate survival and weight loss. A P value of less than0.05 was considered significant.
1. Chandler RJ, Venditti CP (2008) Adenovirus-mediated gene delivery rescuesa neonatal lethal murine model of mut(0) methylmalonic acidemia. Hum Gene Ther19(1):53–60.
2. Chandler RJ, et al. (2007) Metabolic phenotype of methylmalonic acidemia in miceand humans: The role of skeletal muscle. BMC Med Genet 8:64.
3. Chandler RJ, et al. (2006) Propionyl-CoA and adenosylcobalamin metabolism inCaenorhabditis elegans: Evidence for a role of methylmalonyl-CoA epimerase inintermediary metabolism. Mol Genet Metab 89(1-2):64–73.
4. Wooddell CI, Reppen T, Wolff JA, Herweijer H (2008) Sustained liver-specifictransgene expression from the albumin promoter in mice following hydrodynamicplasmid DNA delivery. J Gene Med 10(5):551–563.
5. Frazar TF, et al. (2003) Variegated expression from the murine band 3 (AE1) promoterin transgenic mice is associated with mRNA transcript initiation at upstream start sitesand can be suppressed by the addition of the chicken beta-globin 5′ HS4 insulatorelement. Mol Cell Biol 23(14):4753–4763.
6. Qi Z, et al. (2004) Serial determination of glomerular filtration rate in conscious miceusing FITC-inulin clearance. Am J Physiol Renal Physiol 286(3):F590–F596.
7. Sturgeon C, Sam AD, 2nd, Law WR (1998) Rapid determination of glomerularfiltration rate by single-bolus inulin: A comparison of estimation analyses. J ApplPhysiol 84(6):2154–2162.
8. Hashimoto S, Adams JW, Bernstein KE, Schnermann J (2005) Micropuncturedetermination of nephron function in mice without tissue angiotensin-convertingenzyme. Am J Physiol Renal Physiol 288(3):F445–F452.
9. Chandler RJ, Venditti CP (2010) Long-term rescue of a lethal murine model ofmethylmalonic acidemia using adeno-associated viral gene therapy. Mol Ther 18(1):11–16.
10. Marcell PD, Stabler SP, Podell ER, Allen RH (1985) Quantitation of methylmalonic acidand other dicarboxylic acids in normal serum and urine using capillary gaschromatography-mass spectrometry. Anal Biochem 150(1):58–66.
11. Tanji K, Bonilla E (2008) Light microscopic methods to visualize mitochondria on tissuesections. Methods 46(4):274–280.
12. DiMauro S, et al. (1987) Cytochrome c oxidase deficiency in Leigh syndrome. AnnNeurol 22(4):498–506.
13. López LC, et al. (2006) Leigh syndrome with nephropathy and CoQ10 deficiency dueto decaprenyl diphosphate synthase subunit 2 (PDSS2) mutations. Am J Hum Genet79(6):1125–1129.
14. Benjamini Y, Hochberg Y (1995) Controlling the false discovery rate: A practical andpowerful approach to multiple testing. J R Stat Soc Series B 57(1):289–300.
15. Sciacco M, Bonilla E (1996) Cytochemistry and immunocytochemistry of mitochondriain tissue sections. Methods Enzymol 264:509–521.
Manoli et al. www.pnas.org/cgi/content/short/1302764110 3 of 11
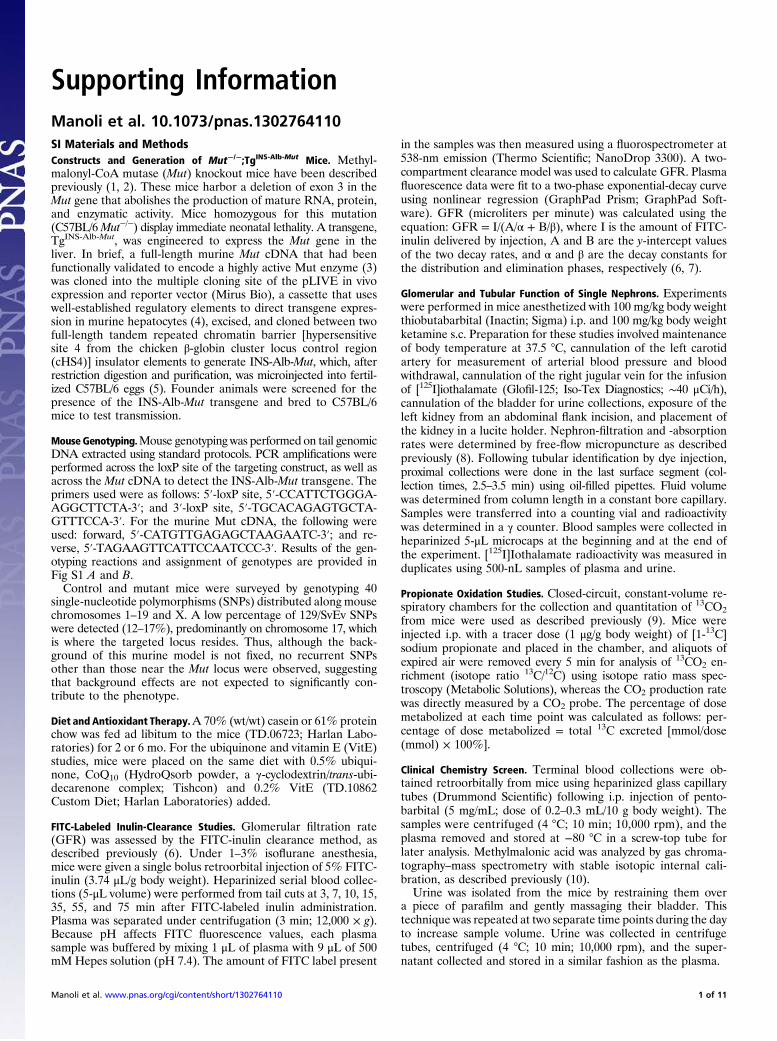
Fig. S1. Generation ofMut−/−;TgINS-Alb-Mut mice, genotyping, and Mut expression assays. (A) Schematic representation of theMut knockout allele and the INS-Alb-Mut construct used to produce the transgenic model, Mut−/−;TgINS-Alb-Mut. (B) Results of genotyping reactions across the 5′-loxP site and the INS-Alb-Mutlocus. (C) Quantitative RT-PCR analysis of Mut expression in the liver. Results are provided as percentage of the levels obtained in wild-type (Mut+/+) animals,corrected for Gapdh expression (mean ± SEM; n = 3–6; ***P < 0.001). The hepatic Mut mRNA expression from the transgene ranged between 8% and 20% ofthat observed inMut+/+ mice in the three founder lines generated. The line chosen for further studies consistently demonstrated hepaticMutmRNA expressionat levels of 8.2 ± 1% compared with Mut+/+ littermates at age 2–6 mo. (D) Transgene expression, measured by q-RT-PCR, in kidney, muscle, and brain tissuesfrom Mut−/−;TgINS-Alb-Mut mice.
Manoli et al. www.pnas.org/cgi/content/short/1302764110 4 of 11

Fig. S2. Kidney and liver pathology and ultrastructure on different dietary regimens. (A) Kidney ultrastructure on a regular diet (RD) at the age of 9 mo. Theproximal tubule brush border, nuclei, and mitochondria have normal appearance, density, and cristae formation in the heterozygote female mice (Left),whereas proximal tubules of the Mut−/−;TgINS-Alb-Mut mice exhibit disfigured nuclei, increased mitochondrial number and size, decreased matrix density, andrarefication of their cristae. The Inset and arrow highlight mitochondria with multiple matrix granules/deposits (Right). (Scale bars: 1 μm.) Distal tubulesand glomeruli had a normal appearance. The histology of the liver, pancreas, spleen, heart, muscle, and brain showed no significant changes between Mut−/−;TgINS-Alb-Mut andMut+/−;TgINS-Alb-Mut animals when they were maintained on regular chow. (B) Liver pathology and ultrastructure after a dietary challenge withHP for 6 mo. No significant differences were observed between the livers of the heterozygote animals and Mut−/−;TgINS-Alb-Mut mice. It is important to em-phasize that the hepatic histology and ultrastructure were preserved in the mutant animals despite the presence of massively elevated plasma MMA levels(>1,000× normal).
Manoli et al. www.pnas.org/cgi/content/short/1302764110 5 of 11
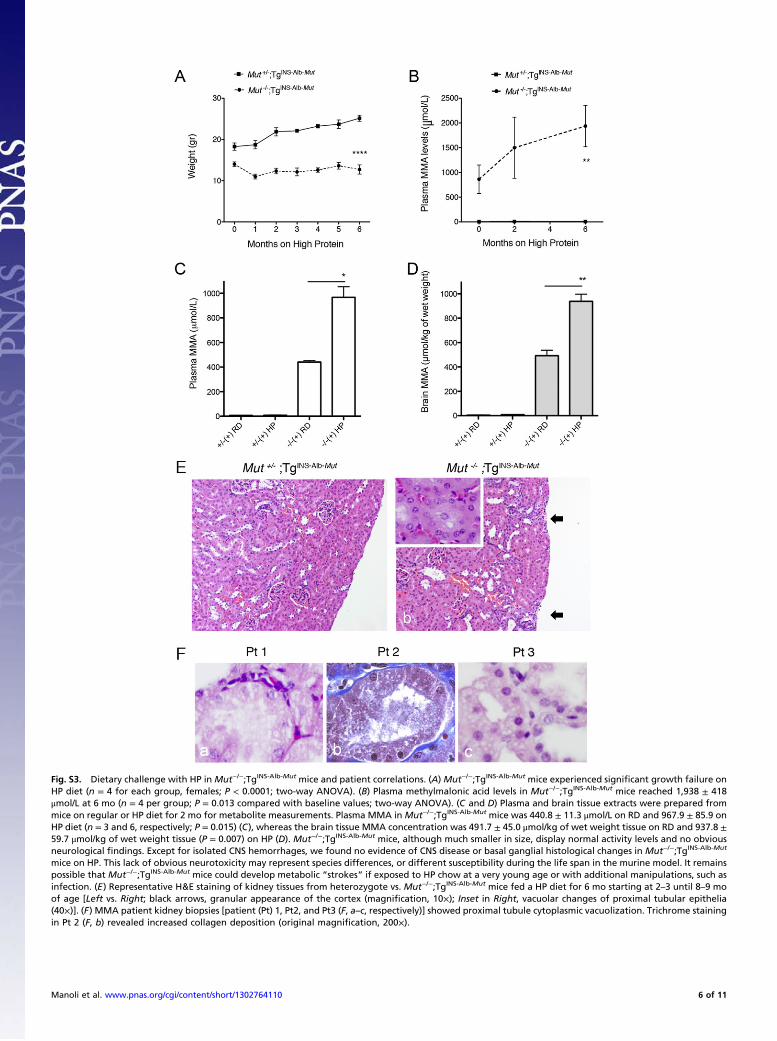
Fig. S3. Dietary challenge with HP in Mut−/−;TgINS-Alb-Mut mice and patient correlations. (A) Mut−/−;TgINS-Alb-Mut mice experienced significant growth failure onHP diet (n = 4 for each group, females; P < 0.0001; two-way ANOVA). (B) Plasma methylmalonic acid levels in Mut−/−;TgINS-Alb-Mut mice reached 1,938 ± 418μmol/L at 6 mo (n = 4 per group; P = 0.013 compared with baseline values; two-way ANOVA). (C and D) Plasma and brain tissue extracts were prepared frommice on regular or HP diet for 2 mo for metabolite measurements. Plasma MMA in Mut−/−;TgINS-Alb-Mut mice was 440.8 ± 11.3 μmol/L on RD and 967.9 ± 85.9 onHP diet (n = 3 and 6, respectively; P = 0.015) (C), whereas the brain tissue MMA concentration was 491.7 ± 45.0 μmol/kg of wet weight tissue on RD and 937.8 ±59.7 μmol/kg of wet weight tissue (P = 0.007) on HP (D). Mut−/−;TgINS-Alb-Mut mice, although much smaller in size, display normal activity levels and no obviousneurological findings. Except for isolated CNS hemorrhages, we found no evidence of CNS disease or basal ganglial histological changes in Mut−/−;TgINS-Alb-Mut
mice on HP. This lack of obvious neurotoxicity may represent species differences, or different susceptibility during the life span in the murine model. It remainspossible that Mut−/−;TgINS-Alb-Mut mice could develop metabolic “strokes” if exposed to HP chow at a very young age or with additional manipulations, such asinfection. (E) Representative H&E staining of kidney tissues from heterozygote vs. Mut−/−;TgINS-Alb-Mut mice fed a HP diet for 6 mo starting at 2–3 until 8–9 moof age [Left vs. Right; black arrows, granular appearance of the cortex (magnification, 10×); Inset in Right, vacuolar changes of proximal tubular epithelia(40×)]. (F) MMA patient kidney biopsies [patient (Pt) 1, Pt2, and Pt3 (F, a–c, respectively)] showed proximal tubule cytoplasmic vacuolization. Trichrome stainingin Pt 2 (F, b) revealed increased collagen deposition (original magnification, 200×).
Manoli et al. www.pnas.org/cgi/content/short/1302764110 6 of 11
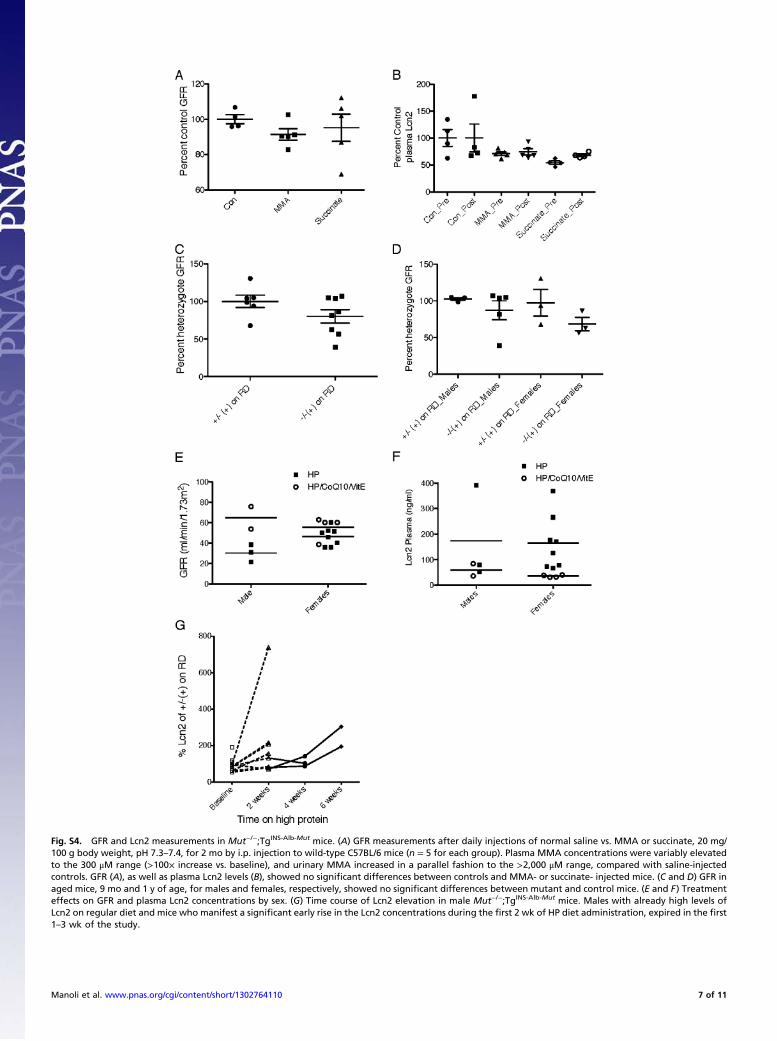
Fig. S4. GFR and Lcn2 measurements in Mut−/−;TgINS-Alb-Mut mice. (A) GFR measurements after daily injections of normal saline vs. MMA or succinate, 20 mg/100 g body weight, pH 7.3–7.4, for 2 mo by i.p. injection to wild-type C57BL/6 mice (n = 5 for each group). Plasma MMA concentrations were variably elevatedto the 300 μM range (>100× increase vs. baseline), and urinary MMA increased in a parallel fashion to the >2,000 μM range, compared with saline-injectedcontrols. GFR (A), as well as plasma Lcn2 levels (B), showed no significant differences between controls and MMA- or succinate- injected mice. (C and D) GFR inaged mice, 9 mo and 1 y of age, for males and females, respectively, showed no significant differences between mutant and control mice. (E and F) Treatmenteffects on GFR and plasma Lcn2 concentrations by sex. (G) Time course of Lcn2 elevation in male Mut−/−;TgINS-Alb-Mut mice. Males with already high levels ofLcn2 on regular diet and mice who manifest a significant early rise in the Lcn2 concentrations during the first 2 wk of HP diet administration, expired in the first1–3 wk of the study.
Manoli et al. www.pnas.org/cgi/content/short/1302764110 7 of 11
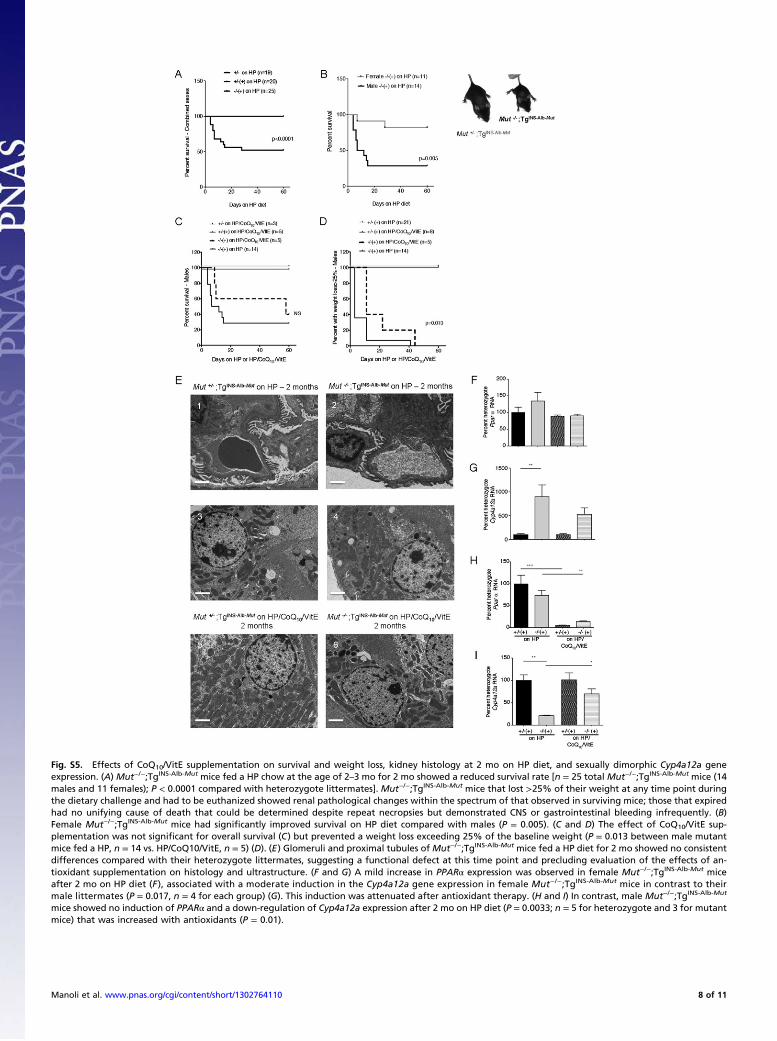
Fig. S5. Effects of CoQ10/VitE supplementation on survival and weight loss, kidney histology at 2 mo on HP diet, and sexually dimorphic Cyp4a12a geneexpression. (A) Mut−/−;TgINS-Alb-Mut mice fed a HP chow at the age of 2–3 mo for 2 mo showed a reduced survival rate [n = 25 total Mut−/−;TgINS-Alb-Mut mice (14males and 11 females); P < 0.0001 compared with heterozygote littermates]. Mut−/−;TgINS-Alb-Mut mice that lost >25% of their weight at any time point duringthe dietary challenge and had to be euthanized showed renal pathological changes within the spectrum of that observed in surviving mice; those that expiredhad no unifying cause of death that could be determined despite repeat necropsies but demonstrated CNS or gastrointestinal bleeding infrequently. (B)Female Mut−/−;TgINS-Alb-Mut mice had significantly improved survival on HP diet compared with males (P = 0.005). (C and D) The effect of CoQ10/VitE sup-plementation was not significant for overall survival (C) but prevented a weight loss exceeding 25% of the baseline weight (P = 0.013 between male mutantmice fed a HP, n = 14 vs. HP/CoQ10/VitE, n = 5) (D). (E) Glomeruli and proximal tubules of Mut−/−;TgINS-Alb-Mut mice fed a HP diet for 2 mo showed no consistentdifferences compared with their heterozygote littermates, suggesting a functional defect at this time point and precluding evaluation of the effects of an-tioxidant supplementation on histology and ultrastructure. (F and G) A mild increase in PPARα expression was observed in female Mut−/−;TgINS-Alb-Mut miceafter 2 mo on HP diet (F ), associated with a moderate induction in the Cyp4a12a gene expression in female Mut−/−;TgINS-Alb-Mut mice in contrast to theirmale littermates (P = 0.017, n = 4 for each group) (G). This induction was attenuated after antioxidant therapy. (H and I) In contrast, male Mut−/−;TgINS-Alb-Mut
mice showed no induction of PPARα and a down-regulation of Cyp4a12a expression after 2 mo on HP diet (P = 0.0033; n = 5 for heterozygote and 3 for mutantmice) that was increased with antioxidants (P = 0.01).
Manoli et al. www.pnas.org/cgi/content/short/1302764110 8 of 11
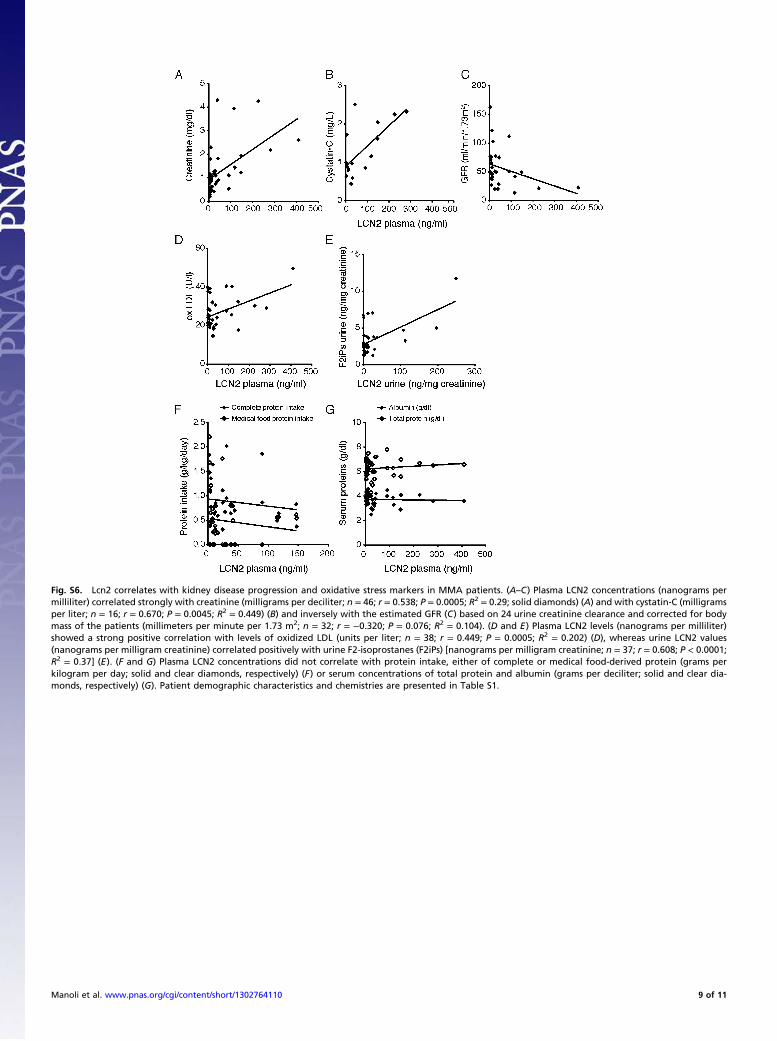
Fig. S6. Lcn2 correlates with kidney disease progression and oxidative stress markers in MMA patients. (A–C) Plasma LCN2 concentrations (nanograms permilliliter) correlated strongly with creatinine (milligrams per deciliter; n = 46; r = 0.538; P = 0.0005; R2 = 0.29; solid diamonds) (A) and with cystatin-C (milligramsper liter; n = 16; r = 0.670; P = 0.0045; R2 = 0.449) (B) and inversely with the estimated GFR (C) based on 24 urine creatinine clearance and corrected for bodymass of the patients (millimeters per minute per 1.73 m2; n = 32; r = −0.320; P = 0.076; R2 = 0.104). (D and E) Plasma LCN2 levels (nanograms per milliliter)showed a strong positive correlation with levels of oxidized LDL (units per liter; n = 38; r = 0.449; P = 0.0005; R2 = 0.202) (D), whereas urine LCN2 values(nanograms per milligram creatinine) correlated positively with urine F2-isoprostanes (F2iPs) [nanograms per milligram creatinine; n = 37; r = 0.608; P < 0.0001;R2 = 0.37] (E). (F and G) Plasma LCN2 concentrations did not correlate with protein intake, either of complete or medical food-derived protein (grams perkilogram per day; solid and clear diamonds, respectively) (F) or serum concentrations of total protein and albumin (grams per deciliter; solid and clear dia-monds, respectively) (G). Patient demographic characteristics and chemistries are presented in Table S1.
Manoli et al. www.pnas.org/cgi/content/short/1302764110 9 of 11
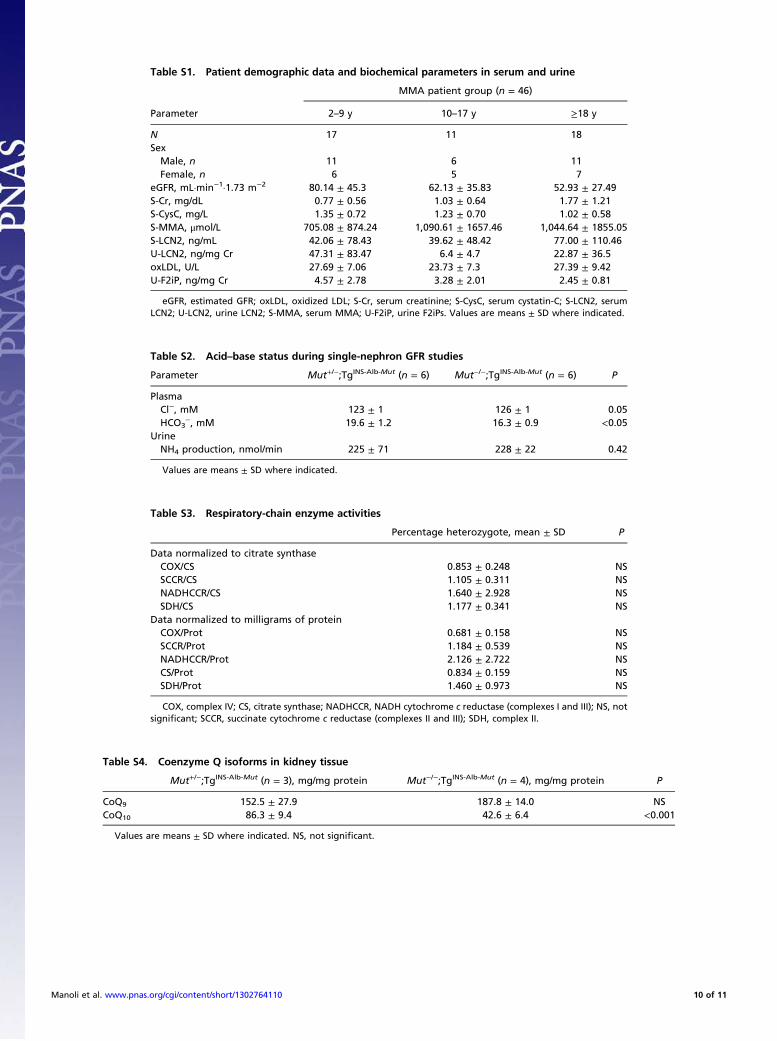
Table S1. Patient demographic data and biochemical parameters in serum and urine
Parameter
MMA patient group (n = 46)
2–9 y 10–17 y ≥18 y
N 17 11 18SexMale, n 11 6 11Female, n 6 5 7
eGFR, mL·min−1·1.73 m−2 80.14 ± 45.3 62.13 ± 35.83 52.93 ± 27.49S-Cr, mg/dL 0.77 ± 0.56 1.03 ± 0.64 1.77 ± 1.21S-CysC, mg/L 1.35 ± 0.72 1.23 ± 0.70 1.02 ± 0.58S-MMA, μmol/L 705.08 ± 874.24 1,090.61 ± 1657.46 1,044.64 ± 1855.05S-LCN2, ng/mL 42.06 ± 78.43 39.62 ± 48.42 77.00 ± 110.46U-LCN2, ng/mg Cr 47.31 ± 83.47 6.4 ± 4.7 22.87 ± 36.5oxLDL, U/L 27.69 ± 7.06 23.73 ± 7.3 27.39 ± 9.42U-F2iP, ng/mg Cr 4.57 ± 2.78 3.28 ± 2.01 2.45 ± 0.81
eGFR, estimated GFR; oxLDL, oxidized LDL; S-Cr, serum creatinine; S-CysC, serum cystatin-C; S-LCN2, serumLCN2; U-LCN2, urine LCN2; S-MMA, serum MMA; U-F2iP, urine F2iPs. Values are means ± SD where indicated.
Table S2. Acid–base status during single-nephron GFR studies
Parameter Mut+/−;TgINS-Alb-Mut (n = 6) Mut−/−;TgINS-Alb-Mut (n = 6) P
PlasmaCl−, mM 123 ± 1 126 ± 1 0.05HCO3
−, mM 19.6 ± 1.2 16.3 ± 0.9 <0.05UrineNH4 production, nmol/min 225 ± 71 228 ± 22 0.42
Values are means ± SD where indicated.
Table S3. Respiratory-chain enzyme activities
Percentage heterozygote, mean ± SD P
Data normalized to citrate synthaseCOX/CS 0.853 ± 0.248 NSSCCR/CS 1.105 ± 0.311 NSNADHCCR/CS 1.640 ± 2.928 NSSDH/CS 1.177 ± 0.341 NS
Data normalized to milligrams of proteinCOX/Prot 0.681 ± 0.158 NSSCCR/Prot 1.184 ± 0.539 NSNADHCCR/Prot 2.126 ± 2.722 NSCS/Prot 0.834 ± 0.159 NSSDH/Prot 1.460 ± 0.973 NS
COX, complex IV; CS, citrate synthase; NADHCCR, NADH cytochrome c reductase (complexes I and III); NS, notsignificant; SCCR, succinate cytochrome c reductase (complexes II and III); SDH, complex II.
Table S4. Coenzyme Q isoforms in kidney tissue
Mut+/−;TgINS-Alb-Mut (n = 3), mg/mg protein Mut−/−;TgINS-Alb-Mut (n = 4), mg/mg protein P
CoQ9 152.5 ± 27.9 187.8 ± 14.0 NSCoQ10 86.3 ± 9.4 42.6 ± 6.4 <0.001
Values are means ± SD where indicated. NS, not significant.
Manoli et al. www.pnas.org/cgi/content/short/1302764110 10 of 11

Table S5. Pathway-enrichment analysis
Pathway name P
Immune response, alternative complement pathway 1.49115 × e−12
Immune response, lectin induced complement pathway 8.22158 × e−12
Immune response, classical complement pathway 1.27553 × e−11
RXR-dependent regulation of lipid metabolism by PPAR, RAR, VDR 0.002122205Leucine, valine, and isoleucine metabolism 0.013714678Mitochondrial ketone body biosynthesis and metabolism 0.060712457Ligand-dependent activation of the ESR1/SP pathway 0.067238444Cell survival 0.075872963Androstenedione and testosterone biosynthesis and metabolism 0.078019731
ESR1/SP, estrogen receptor-1/specificity protein 1 transcription factor; PPAR, peroxisome proliferator-acti-vated receptor; RAR, retinoic acid receptor; RXR, retinoid X receptor; VDR, vitamin D receptor.
Table S6. Differentially expressed genes after 2 mo on HP
Gene Gene name Fold change
Up-regulated in Mut−/−;TgINS-Alb-Mut
Fabp1 fatty acid binding protein 1 6.896Lcn2 lipocalin-2 4.354Cyp4a12b cytochrome P450, family 4, subfamily a, polypeptide 12a 4.091Havcr1 hepatitis A virus cellular receptor 1 4.076Cyp4a12a cytochrome P450, family 4, subfamily a, polypeptide 12a 3.661C3 complement component 3 2.963Cyp27b1 cytochrome P450, family 27, subfamily b, polypeptide 1 2.643Serpina1d serine (or cysteine) peptidase inhibitor, clade A, member 1D 2.440Npy6r neuropeptide Y receptor Y6 2.277Hmgcs2 3-hydroxy-3-methylglutaryl-coenzyme A synthase 2 2.162Sprr1a small proline-rich protein 1A 2.091Angptl4 angiopoietin-like 4 2.031Slc16a1 solute carrier family 16, member 1 (monocarboxylic acid transporter 1) 2.024
Down-regulated in Mut−/−;TgINS-Alb-Mut
Akr1c18 aldo-keto reductase family 1, member C18 14.715Kap kidney androgen regulated protein 5.871Igf2 insulin-like growth factor 2 4.921Slc6a15 solute carrier family 6 (neurotransmitter transporter), member 15 3.228Akr1c14 aldo-keto reductase family 1, member C14 3.013Ttr transthyretin 3.003Ccl28 chemokine (C-C motif) ligand 28 2.997Alb albumin 2.976Mut methylmalonyl CoA mutase 2.951Dio1 deiodinase, iodothyronine, type I 2.654Slc9a8 solute carrier family 9 (sodium/hydrogen exchanger), member 8 2.517Slc22a7 solute carrier family 22 (organic anion transporter), member 7 2.296Mfsd2a major facilitator superfamily domain containing 2A 2.148
In addition to Lcn2, increased expression was also observed in genes regulated by RXR/PPARα, including Cyp4a12a and -b, Hmgcs2, and 25-hydroxyvitamin D1α-hydroxylase (Cyp27b1), the enzyme regulating the synthesis of 1,25-dihydroxyvitamin D in the kidney. Down-regulated genes included those involved innumerous biosynthetic pathways, including synthesis of steroid hormones and prostaglandins, like Akr1c3 and Akr1c14 and Kap, as well as other genes,including Alb and Ttr. Among the down-regulated genes were Dio1, a type 1 iodothyronine deiodinase that catalyzes the deiodination of thyroxine to thebioactive T3; Slc22a7 (OAT2), an organic anion transporter type 2; and Slc6a15, an orphan neutral amino acid transporter.
Manoli et al. www.pnas.org/cgi/content/short/1302764110 11 of 11
Related Documents