Supporting Information section Photo-Induced Sequence Defined Macromolecules via Hetero Bifunctional Synthons Nicolas Zydziak, a,b Florian Feist, a,b Birgit Huber, a Jan O. Mueller a,b and Christopher Barner-Kowollik a,b * a Soft Matter Synthesis Laboratory, Institut für Biologische Grenzflächen, Karlsruhe Institute of Technology (KIT), Hermann-von-Helmholtz-Platz 1, 76344 Eggenstein-Leopoldshafen, Germany, [email protected], www.macroarc.de b Preparative Macromolecular Chemistry, Institut für Technische Chemie und Polymerchemie, Karlsruhe Institute of Technology (KIT), Engesserstr. 18, 76131 Karlsruhe, Germany. Electronic Supplementary Material (ESI) for ChemComm. This journal is © The Royal Society of Chemistry 2014

Welcome message from author
This document is posted to help you gain knowledge. Please leave a comment to let me know what you think about it! Share it to your friends and learn new things together.
Transcript
Supporting Information section
Photo-Induced Sequence Defined Macromolecules via Hetero Bifunctional Synthons
Nicolas Zydziak,a,b Florian Feist,a,b Birgit Huber,a Jan O. Muellera,b and Christopher
Barner-Kowollika,b*
a Soft Matter Synthesis Laboratory, Institut für Biologische Grenzflächen, Karlsruhe Institute
of Technology (KIT), Hermann-von-Helmholtz-Platz 1, 76344 Eggenstein-Leopoldshafen,
Germany, [email protected], www.macroarc.de
b Preparative Macromolecular Chemistry, Institut für Technische Chemie und
Polymerchemie, Karlsruhe Institute of Technology (KIT), Engesserstr. 18, 76131 Karlsruhe,
Germany.
Electronic Supplementary Material (ESI) for ChemComm.This journal is © The Royal Society of Chemistry 2014
2
Table of contents
Materials and Methods ....................................................................................................... 3
Synthesis of (2E,4E)-hexa-2,4-dien-1-yl 4-((2-formyl-3-methylphenoxy)methyl)benzoate 1 ............. 5
Synthesis of (phenacylthio)acetic acid 2-(3,5-dioxo-10-oxa-4aza-tricyclo[5.2.1.02,6]dec-8-en-4-
yl)ethyl ester 2 ..................................................................................................................................... 6
Synthesis 1,6-hexanebismaleimide (core) ........................................................................................... 6
Synthesis of S1 (Sequence 1) ............................................................................................................... 7
Synthesis of S2 (Sequence 2) ............................................................................................................... 7
Synthesis of S2d (furan cleavage) ........................................................................................................ 7
Synthesis of S3 (Sequence 3) ............................................................................................................... 8
Synthesis of S4 (Sequence 4) ............................................................................................................... 8
Synthesis of S4d (furan cleavage) ........................................................................................................ 8
Synthesis of S5 (Sequence 5) ............................................................................................................... 8
Characterization of synthon 1 ............................................................................................. 9
Characterization of synthon 2 ........................................................................................... 10
Characterization of 1,6-hexanebismaleimide (core) .......................................................... 12
UV-VIS spectra .................................................................................................................. 15
NMR spectroscopy tests ................................................................................................... 16
Characterization of S1 ....................................................................................................... 17
Characterization of S2 ....................................................................................................... 22
Characterization of S2d ..................................................................................................... 26
Characterization of S3 ....................................................................................................... 29
Characterization of S4 ....................................................................................................... 30
Characterization of S4d ..................................................................................................... 31
Characterization of S5 ....................................................................................................... 32
ESI-MS .............................................................................................................................. 33
CID experiments of S1 and S2 ........................................................................................................... 33
Detailed spectra of S1, S2 and S3 ...................................................................................................... 36
MALDI-TOF-MS of S5......................................................................................................... 37
SEC traces of S2d and S4d ................................................................................................. 37
References and Notes ....................................................................................................... 37
3
The detailed synthesis and characterization of the reported compounds is collated in the
Supporting Information section. NMR, IR and ESI-MS spectra from the starting materials, i.e.
synthon 1, 2 and 1,6-hexanebismaleimide, are found in Figure S1 to S10, as well as their
respective UV spectra (Figure S11). The control experiments performed via NMR
spectroscopy evidencing the stability of the reaction mixture for the first sequence in the
dark at several temperatures are depicted in Figure S12. Several analyses were performed to
characterize the sequence product S1 (refer to the NMR spectra in Figure S13 to S15 and
FTIR spectrum in Figure S17). The NMR spectra of the sequence products S2 to S5 and their
assignment are reported in Figure S19 as well as in Figs. S23 to S28. For S1 and S2, additional
2D NMR spectra, H-H COSY (Figure S15 and S16) and C-H HMQC (Figure S20 and S21), were
recorded and enabled the assignment of the terminal and the backbone located atoms,
which are of importance for the assignment for higher order sequence products. The
depicted ESI-MS spectra of the core, S1 and S2 (respectively Figure S10, S18 and S22 as well
as Table S4) confirm the success of the first and second reactions reported in the main text.
Concomitantly, Collision Induced Decay (CID) experiments were performed on S1 and S2,
and the observed fragments proved the symmetry of the molecules (Figure S29 to S31 and
Table S4). The detailed ESI-MS spectra discussed in the main text (performed under different
conditions as the above cited CID experiments) for S1, S2 and S3 are found in Figure S32 and
the results are collated in Table S5. Finally, the SEC traces of S2d and S4d are reported in
Figure S33.
Materials and Methods
2,3-dimethylanisole (97%, Alfa Aesar), copper sulfate pentahydrate (>99%, Acros), potassium
peroxodisulfate (97%, Sigma Aldrich), aluminium chloride (anhydrous, >99%, Roth), methyl-
4-(bromomethyl)benzoate (97%, ABCR), 18-crown-6 (>95%, VWR), maleic anhydride (99%,
Merck), furan (99%, ABCR), ethanolamine (99%, Acros), thioglycolic acid (97%, ABCR),
triethylamine (≥99.5%, Sigma Aldrich), phenacyl chloride (99%, ABCR), 4-
dimethyminopyridine (DMAP, ≥99%, Sigma Aldrich), N,N’-dicyclohexylcarbodiimide (DCC,
≥99%, Fluka), anhydrous sodium acetate (99%, Roth), acetic anhydride (≥99%, Merck),
acetonitrile (>99%, Acros), sodium iodide (NaI, >99%, Merck), cetyltriethylammonium
bromide (CTAB, 98%, Alpha Aesar), sodium chloride (NaCl, 99.5%, Fluka), 1,8,9-
anthracenetriol (DIT, 98%, Fischer), dry N,N-dimethylformamide (DMF, 99.8%, Acros) and
dry dichloromethane (DCM, 99.8%, Acros) were used as received. Sorbyl alcohol (98%, ABCR)
was recrystallized from petroleum ether and stored under inert atmosphere at -20 °C.
Tetrahydrofuran (THF), methanol (MeOH), ethanol (EtOH), diethylether (Et2O), acetone,
acetonitrile, dichloromethane (DCM) , chloroform, n-hexane, ethyl acetate were purchased
from VWR in the highest purity. 4-((2-formyl-3-methylphenoxy)methyl)benzoic acid1, 4-(2-
hydroxyethyl)-10-oxo-4-azatricyclo[5.2.1.02,6]dec-8-ene-3,5-dione,2 (phenacylthio)acetic
acid3 and 1,6-hexanebismaleimide,4,5 were synthesized according to the literature.
4
Size Exclusion Chromatography (SEC)
SEC measurements were performed on a TOSOH Eco-SEC HLC-8320 GPC System, comprising
an autosampler, a SDV 5 μm beadsize guard column (50 × 8 mm, PSS) followed by three SDV
5 μm columns (300 × 7.5 mm, subsequently 100 Å, 1000 Å and 105 Å pore size, PSS), and a
differential refractive index (DRI) detector using tetrahydrofuran (THF) as the eluent at 30 °C
with a flow rate of 1 mL·min-1. The SEC system was calibrated using linear polystyrene
standards ranging from 266 to 2.52 106 g·mol-1. Calculation of the molecular weight
proceeded via the Mark-Houwink-Sakurada (MHS) parameters for polystyrene (PS) in THF at
30 °C, i.e., K = 13.63 10-3 mL g-1, α = 0.714.
Nuclear Magnetic Resonance (NMR) spectroscopy 1H NMR sprectroscopy, H-H proton correlation spectroscopy (H-H COSY) and C-H correlation
spectroscopy (Heteronuclear Multiple-Quantum Correlation, HMQC) were performed on a
Bruker AM 500 spectrometer (500 MHz for 1H / 125 MHz for 13C). The analytes were
dissolved in CDCl3 and the residual solvent peaks were employed for shift correction. The
following abbreviations were used to describe peak patterns when appropriate: s (singlet), d
(doublet), dd (doublet of doublets), ddd (doublet of doublets of doublets), t (triplet) and m
(multiplet).
Electrospray Ionization Mass-Spectrometry (ESI-MS)
ESI-MS Spectra were recorded on an LXQ mass spectrometer (Thermo-Fisher Scientific, San
Jose, CA) equipped with an atmospheric pressure ionization source operating in the
nebulizer assisted electrospray mode. The instrument was calibrated in the m/z range
195−1822 using a standard containing caffeine, Met-Arg-Phe-Ala acetate (MRFA) and a
mixture of fluorinated phosphazenes (Ultramark 1621) (all from Aldrich). A constant spray
voltage of 4.5 kV was used and nitrogen at a dimensionless sweep gas flow rate of 2
(approximately 3 L·min-1) and a dimensionless sheath gas flow rate of 5 (approximately
0.5 L·min-1) were applied. The capillary voltage, the tube lens offset voltage and the capillary
temperature were set to 34 V, 90 V, and 275 °C respectively. The samples were dissolved
with a concentration of 0.1 mg·mL-1 either in a mixture of THF and MeOH (3:2) containing
sodium iodide at a concentration of 0.14 µg·L-1 (solution A), or a 0.14 µg·L-1 CTAB solution in
DCM (solution B), and infused with a flow of 10 μL·min-1. In the case of measurements
performed in solution B, the molecular ion peak is identified as a cetyltriethylammonium
(CTA) adduct (labelled [M-CTA]). The ionization was performed with solution A for synthon 1
and 2, 1,6-hexanebismaleimide, S1 and S2. The CID experiments for S1 and S2 were
performed in the same conditions. However, in the main text, the presented results in Figure
5 were performed with solution B.
Fourier Transform Infrared (FTIR) spectroscopy
Infrared measurements were performed via attenuated total reflectance (ATR) using a
Bruker research spectrometer VERTEX 80.
5
UV-VIS spectroscopy (UV-VIS)
UV-VIS spectroscopy was conducted on a Varian Cary 300 Bio spectrophotometer.
Matrix Assisted Laser Desorption Ionization – Time Of Flight Mass-Spectrometry (MALDI-
TOF-MS)
The MALDI-TOF mass-spectra were recorded with an Autoflex III Smartbeam (from Bruker
Daltonik GmbH, Bremen, Germany) equipped with an Nd:YAG laser (355 nm, 200 Hz). 0.5 µL
of the analyte solution (1 mg·mL-1) in DCM was dropped on the target and let to dry under
ambient conditions. 0.5 µL of DIT solution (50 mmol·L-1 in HCCl3:EtOH 1:1) was added to the
analyte on the target and let to dry under ambient conditions. 0.5 µL of saturated NaCl
aqueous solution (Milli-Q water) was finally deposited and led to crystallization on the target
with the analyte and DIT.
Flash chromatography
Flash chromatography was performed on an Isolera Biotage One (OS 578). The fractions
were collected via a UV detector (254 nm). A SNAP Ultra (10 g) cartridge was employed for
the purification in direct mode, and a SNAP C18 (12 g) cartridge for the reverse mode (both
column volume of 15 mL). The analyte was dried on an adapted samplet prior to purification.
Synthesis of (2E,4E)-hexa-2,4-dien-1-yl 4-((2-formyl-3-methylphenoxy)methyl)benzoate 1
All operations were performed under inert atmosphere. In a flame-dried Schlenk tube, 4-((2-
formyl-3-methylphenoxy)methyl)benzoic acid, PE (1.71 g, 7.39 mmol, 1 eq.) and DMAP
(154 mg, 1.28 mmol, 0.2 eq.) were dried overnight. Sorbyl alcohol (725 mg, 7.39 mmol,
1 eq.) was evacuated in a separate flame-dried Schlenk tube. Sorbyl alcohol was dissolved in
dry DMF (3 mL) introduced via a syringe, and the obtained solution was transferred via
cannula into the tube containing PE and DMAP. Dry DCM (15 mL) was added to the mixture
to dissolve the components. DCC (1.69 g, 8.2 mmol, 1.3 eq.) was introduced into a separate
dry Schlenk tube and evacuated. DCC was dissolved in dry DMF (5 mL) and transferred via a
syringe into the solution mixture, which was cooled at 0 °C for 30 minutes. Dry DCM (17 mL)
was added to the reaction mixture and stirred for 3 days at ambient temperature. After
filtration and the removal of the volatiles under reduced pressure, the solid residue was
dissolved in ethyl acetate and subsequently washed with 0.1 N HCl, saturated NaHCO3
solution and brine. The organic phase was dried over MgSO4, filtered over silica gel in DCM
and dried under vacuum. The solid residue was purified by column chromatography (ethyl
acetate : n-hexane (1:9), Rf = 0.32) after solid deposition on silica obtained from DCM. The
purified compound was dried under vacuum. The reddish solution was dried under vacuum
to deliver a white solid, purified via precipitation in n-hexane (1.53 g, 59%). 1H NMR
(500 MHz, CDCl3): δ 10.67 (s, 1H, CHO), 7.41 (d, J = 8.3 Hz, 2H, ArH), 7.28 (t, J = 8.0 Hz, 1H,
ArH), 6.77 (d, J = 8.3 Hz, 2H, ArH), 6.27 (dd, J = 15.1, 10.5 Hz, 1H, CH=CH), 6.01 (ddd, J = 14.7,
10.5, 1.2 Hz, 1H, CH=CH), 5.77–5.61 (m, 2H, CH=CH), 5.14 (s, 2H, O–CH2), 4.75 (d, J = 6.6 Hz,
2H, O–CH2–CH), 2.51 (s, 3H, Ar–CH3), 1.70 (d, J = 6.9 Hz, 3H, CH–CH3); 13C NMR (125 MHz,
6
CDCl3): δ 192.0, 166.0, 161.9, 142.3, 141.3, 135.1, 134.4, 131.5, 130.4, 130.1, 126.8, 124.7,
123.7, 123.6, 110.3, 69.9, 65.6, 21.5, 18.2; IR (ATR, cm-1): 2956, 2923, 2852, 1703, 1679,
1614, 1596, 1579, 1512, 1467, 1448, 1409, 1377, 1298, 1269, 1211, 1182, 1170, 1116, 1099,
1076, 1033, 1016, 993, 960, 921, 874, 844, 827, 804, 771, 750, 717, 680, 634, 619; ESI-MS
(m/z): [1-Na]+ calcd. for C22H22O4Na, 373.14; found, 373.20, [1-1-Na]+ (two adducts) calcd. for
C44H43O8Na, 722.29; found, 722.94.
Synthesis of (phenacylthio)acetic acid 2-(3,5-dioxo-10-oxa-4aza-tricyclo[5.2.1.02,6]dec-8-en-
4-yl)ethyl ester 2
All operations were performed under inert atmosphere. In a flame-dried Schlenk tube,
(phenacylthio)acetic acid (2.00 g, 9.51 mmol, 1 eq.), 4-(2-hydroxyethyl)-10-oxo-4-
azatricyclo[5.2.1.02,6]dec-8-ene-3,5-dione (1.99 g, 9.51 mmol, 1 eq.) and DMAP (232 mg,
1.9 mmol, 0.2 eq.) were dried overnight. Dry DMF (20 mL) was added to the reaction mixture
via syringe. DCC (2.55 g, 12.36 mmol, 1.3 eq.) was evacuated in a separate flame-dried
Schlenk tube, to be subsequently dissolved in dry DMF (20 mL). The DCC solution was
transferred via cannula to the reaction mixture, cooled at 0 °C for 30 minutes and stirred at
ambient temperature for 3 days. The reaction mixture was filtered and the volatiles
removed under reduced pressure. The solid residue was dissolved in ethyl acetate and
subsequently washed with 0.1 N HCl, saturated NaHCO3 solution and brine. The organic
phase was dried over MgSO4, filtered over silica gel in DCM and dried under vacuum. The
solid residue was purified by column chromatography (ethyl acetate : n-hexane (6:4),
Rf = 0.33) after solid deposition obtained from DCM. The slightly brown solution was dried
under vacuum, and the residue recrystallized from n-hexane : chloroform (2:1 v/v) solution
to deliver a white solid (2.05 g, 5.11 mmol, 54%). 1H NMR (500 MHz, CDCl3): δ 7.89 (dd,
J = 8.3, 1.1 Hz, 2H, ArH), 7.51 (t, J = 7.4 Hz, 1H, ArH), 7.40 (t, J = 7.8 Hz, 2H, ArH), 6.42 (s, 2H,
C=CH), 5.18 (s, 2H, CO–CH), 4.22 (t, J = 5.2Hz, 2H, O–CH2), 3.96 (s, 2H, S–CH2–CO), 3.71 (t,
J = 5.3 Hz, 2H, N–CH2), 3.23 (s, 2H, S–CH2–COO), 2.80 (s, 2H, C–CH); 13C NMR (125 MHz,
CDCl3): δ 193.5, 175.4, 169.1, 135.8, 134.7, 132.8, 128.0, 127.9, 80.2, 60.8, 46.8, 37.3, 37.0,
32.5; IR (ATR, cm-1): 3454, 3336, 3110, 3089, 3072, 3043, 2999, 2964, 2943, 2918, 2891,
2852, 1774, 1733, 1699, 1676, 1596, 1583, 1473, 1450, 1434, 1404, 1365, 1342, 1307, 1296,
1247, 1220, 1199, 1166, 1155, 1141, 1124, 1099, 1080, 1047, 1020, 999, 960, 948, 937, 914,
877, 850, 825, 804, 779, 759, 715, 690, 651, 640, 609; ESI-MS (m/z): [2-Na]+ calcd. for
C20H19NO6SNa, 424.08; found, 424.1, [2-2-Na]+ (two adducts) calcd. for C40H38N2O12S2Na,
825.18; found, 825.53.
Synthesis 1,6-hexanebismaleimide (core)
1,6-hexanebismaleimide was purified by column chromatography protected from light (ethyl
acetate : n-hexane ((4: 6, Rf = 0.53), recrystallized from acetone and stored in the dark. 1H
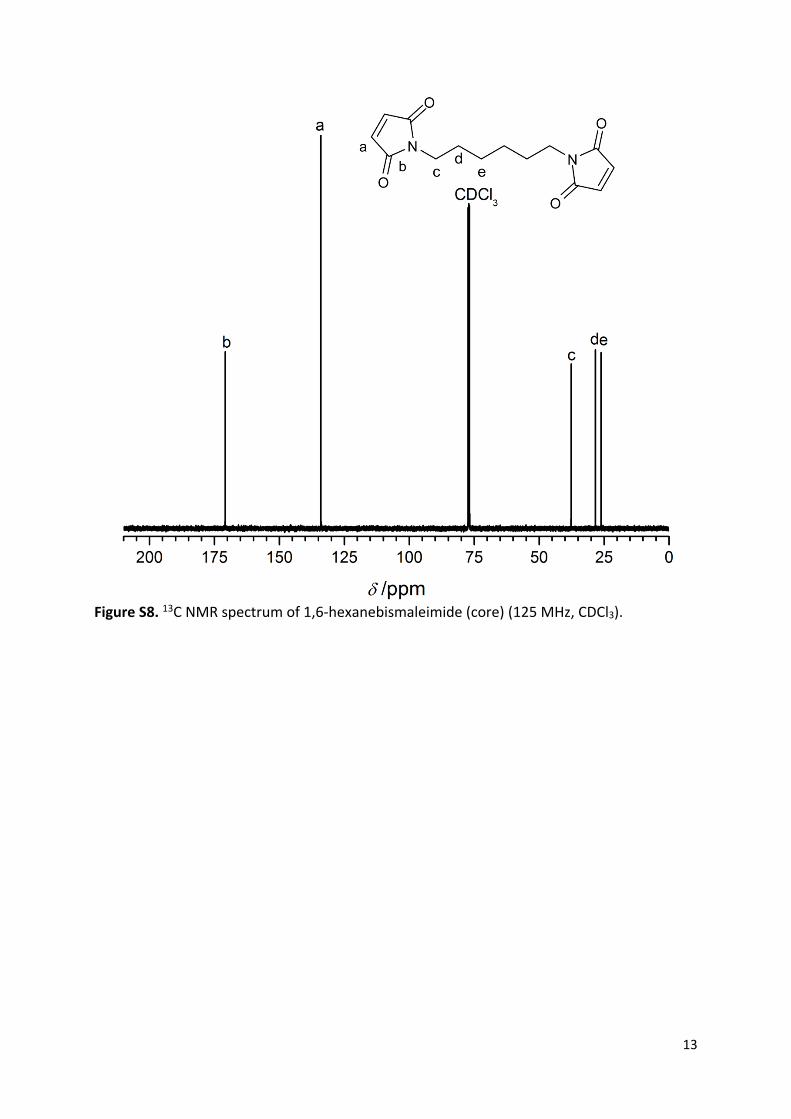
NMR (500 MHz, CDCl3): δ 6.62 (s, 4H, C=C–H), 3.43 (t, J = 7.2 Hz, 4H, N–CH2), 1.50 (m, 4H,
NCH2–CH2), 1.22 (m, 4H, N–C2H4–CH2); 13C NMR (125 MHz, CDCl3): δ 170.8, 134.1, 37.7, 28.3,
26.2; IR (ATR, cm-1): 3448, 3166, 3087, 2966, 2945, 2925, 2852, 1766, 1743, 1689, 1610,
1583, 1483, 1444, 1404, 1353, 1326, 1245, 1191, 1130, 1064, 1054, 1026, 954, 904, 833, 769,
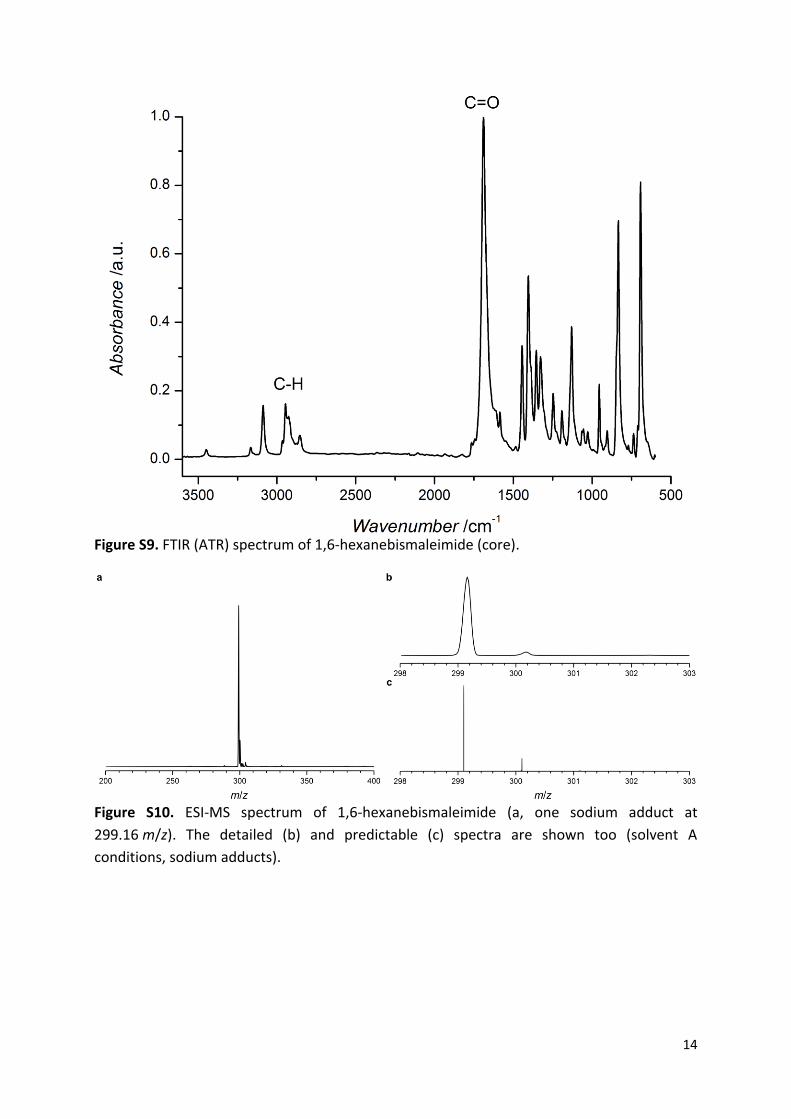
736, 709, 692, 644; ESI-MS (m/z): [M-Na]+ calcd. for C14H16N2O4Na, 299.10; found, 299.16.
7
Synthesis of S1 (Sequence 1)
In a dry Schlenk round bottom flask, 1 (1.066 g, 3.04 mmol, 2 eq) and 1,6-
hexanebismaleimide (525.47 mg, 1.9 mmol, 1.25 eq) were mixed and evacuated/filled with
nitrogen three times. Under inert atmosphere, dry DCM (634 mL) was added and the
reaction stirred in the dark until complete dissolution. Transparent vials were filled with
8 mL of the reaction mixture, sealed and kept in the dark. The solutions were purged for 10
minutes with nitrogen to be finally exposed to UV light for 45 minutes. The solutions were
gathered and dried under vacuum. After purification by column chromatography (solid
deposition on silica from DCM, ethyl acetate : n-hexane (5:5), Rf = 0.50), 1.45 g of a white
solid were isolated (97.3% yield). 1H NMR (500 MHz, CDCl3): δ 7.94 (dd, J = 13.8, 8.1 Hz, 4H),
7.38 (d, J = 8.0 Hz, 4H), 7.12 (t, J = 7.8 Hz, 2H), 6.79 (dd, J = 7.1, 3.6 Hz, 2H), 6.71 (t, J = 7.4 Hz,
2H), 6.27 (dd, J = 14.7, 10.9 Hz, 2H), 6.06–5.92 (m, 2H), 5.88 (s, 2H), 5.79–5.58 (m, 4H), 5.12–
4.94 (m, 4H), 4.81–4.61 (m, 4H), 3.58–3.35 (m, 4H), 3.17–2.96 (m, 6H), 2.96–2.82 (m, 2H),
2.77 (m, 1H), 2.61 (m, 1H), 1.70 (d, J = 6.4 Hz, 6H), 1.52 (m, 4H), 1.24 (m, 4H); 13C NMR
(125 MHz, CDCl3, assignments referring to Figure S14): δ 180.2 (4), 177.7 (15), 166.1 (21),
154.7 (11), 141.8 (17), 138.7 (7), 135.1 (24), 131.5 (23), 130.4 (25), 130.0 (26), 129.9 (19),
129.6 (9), 126.9 (18), 126.2 (12), 123.6 (20), 121. (8), 110.8 (10), 69.8 (16), 65.5 (22), 61.1
(13), 46.6 (14), 38.6 (5), 38.2 (3), 27.8 (6), 27.2 (2), 25.7 (1), 18.2 (27); IR (ATR, cm-1): 3450,
3022, 2927, 2854, 1770, 1691, 1674, 1606, 1587, 1510, 1470, 1439, 1404, 1371, 1348, 1300,
1271, 1174, 1151, 1107, 1053, 1018, 989, 958, 918, 875, 844, 821, 789, 754, 731, 692, 665,
650, 621; ESI-MS (m/z): [S1-Na]+ calcd. for C58H60N2O12Na, 999.40; found, 999.48, and [S1-
CTA]+ calcd. for C77H102N3O12, 1260.75; found, 1260.34 (under CTAB ionization conditions).
Synthesis of S2 (Sequence 2)
The reaction was conducted similarly to the synthesis of S1, except that the reagent S1
(148.0 mg, 151.4 µmol, 1 eq) and 2 (180.3 mg, 536.0 µmol, 3 eq) were dissolved in 80 mL of
dry DCM. The purification was conducted via column chromatography (ethyl acetate : n-
hexane (5:5)), after solid deposition from DCM, to eliminate photochemically released
acetophenone. With a ternary eluent (ethyl acetate : n-hexane : MeOH 45.5:45.5:9), S2 was
isolated (Rf = 0.23) to deliver a slight yellowish solid (36% yield). ESI-MS (m/z): [S2-Na]+ calcd.
for C82H82N4O22S2Na, 1561.48; found, 1561.32, and [S2-CTA]+ calcd. for C101H124N5O22S2,
1822.82; found, 1822.72 (under CTAB ionization conditions).
Synthesis of S2d (furan cleavage)
Under inert atmosphere and protected from light, S2 was dissolved in cyclohexane and
heated at 80 °C for 3 days. After evaporation under vacuum, the residue was additionally
heated at 80 °C for 24 h, under vacuum and protected from light. The purification was
conducted via flash chromatography with ethyl acetate : n-hexane (5:5), and a MeOH
gradient (1% per 10 column volume, 10 mL·min-1). The product was eluted as the MeOH
content reached 3 to 4% in the mobile phase and dried to deliver a white solid (41% yield,
Rf = 0.43 in ethyl acetate : n-hexane : MeOH 45.5:45.5:9).
8
Synthesis of S3 (Sequence 3)
Similarly to compound S1, S2d was led to react with 1 in dry DCM. The purification was
performed via flash chromatography with ethyl acetate : n-hexane (5:5), and a MeOH
gradient (1% per 10 column volumes, 10 mL·min-1). The product was eluted as the MeOH
content reached 0 to 3% in the mobile phase and dried to deliver a white solid (59% yield).
ESI-MS (m/z): [S3-CTA]+ calcd. for C137H160N5O28S2, 2387.07; found, 2386.86 (under CTAB
ionization conditions).
Synthesis of S4 (Sequence 4)
Similarly to compound S2, S3 was led to react with 2 in dry DCM. The purification was
performed via reverse phase flash chromatography with MeOH and a DCM gradient (2.4%
per 10 column volumes, 10 mL·min-1). The product was eluted as the DCM content reached
16 to 32% in the mobile phase (52% yield).
Synthesis of S4d (furan cleavage)
The deprotection was performed under similarly as for compound S2d. The purification was
performed via reverse phase flash chromatography with MeOH and a DCM gradient (10%
per 4 column volumes, 10 mL·min-1). The product was eluted as the DCM content reached 0
to 10% in the mobile phase (58% yield).
Synthesis of S5 (Sequence 5)
Similarly to compound S2, S4d was led to react with 1 in dry DCM. The purification was
performed via reverse phase flash chromatography with MeOH and a DCM gradient (2.5%
per 4 column volumes, 10 mL·min-1). The product was eluted as the DCM content reached 0
to 10% in the mobile phase (47% yield). MALDI-TOF-MS (m/z): [S5-Na]+ calcd. for
C178H176N6O44S4Na, 3253.05; found, 3253.05.
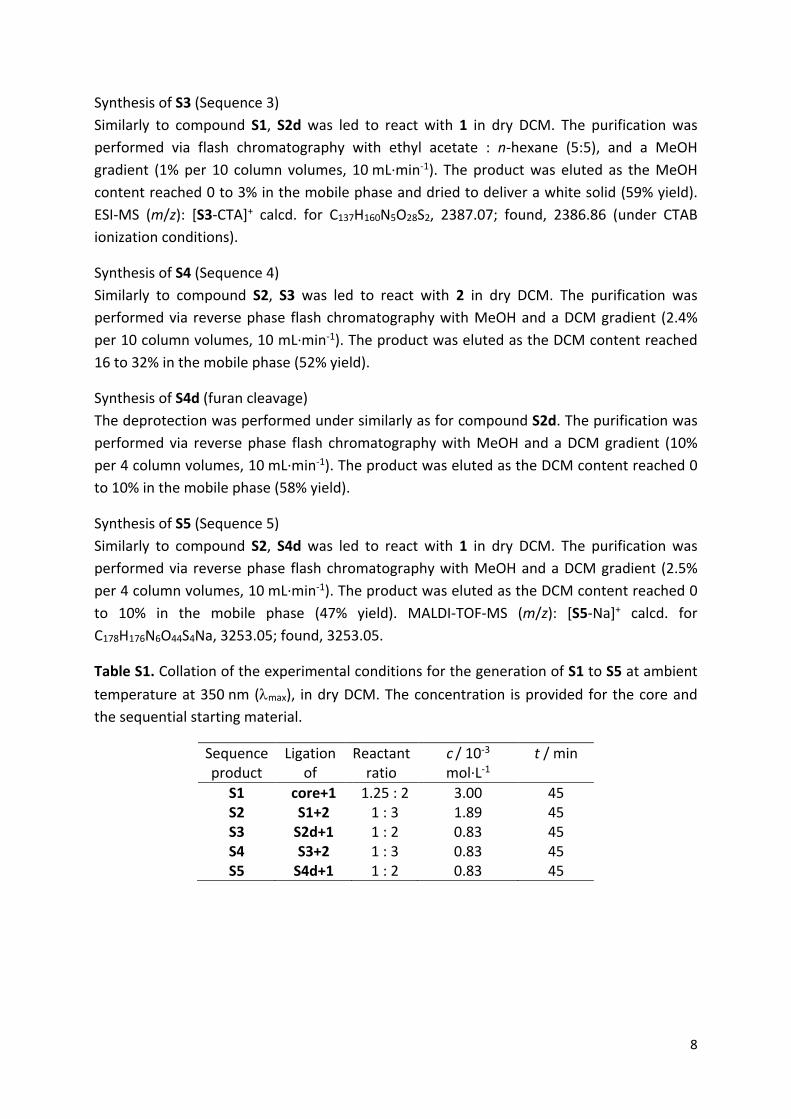
Table S1. Collation of the experimental conditions for the generation of S1 to S5 at ambient
temperature at 350 nm (max), in dry DCM. The concentration is provided for the core and
the sequential starting material.
Sequence product
Ligation of
Reactant ratio
c / 10-3 mol·L-1
t / min
S1 core+1 1.25 : 2 3.00 45 S2 S1+2 1 : 3 1.89 45 S3 S2d+1 1 : 2 0.83 45 S4 S3+2 1 : 3 0.83 45 S5 S4d+1 1 : 2 0.83 45
9
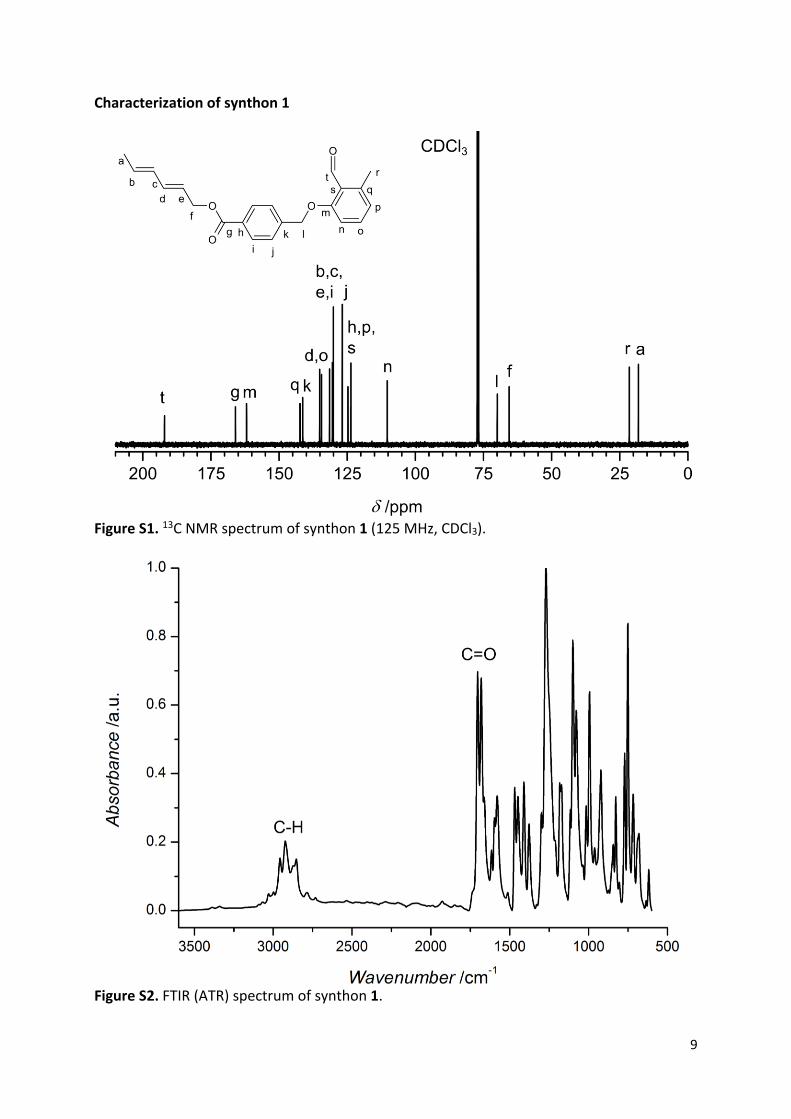
Characterization of synthon 1
Figure S1. 13C NMR spectrum of synthon 1 (125 MHz, CDCl3).
Figure S2. FTIR (ATR) spectrum of synthon 1.
10
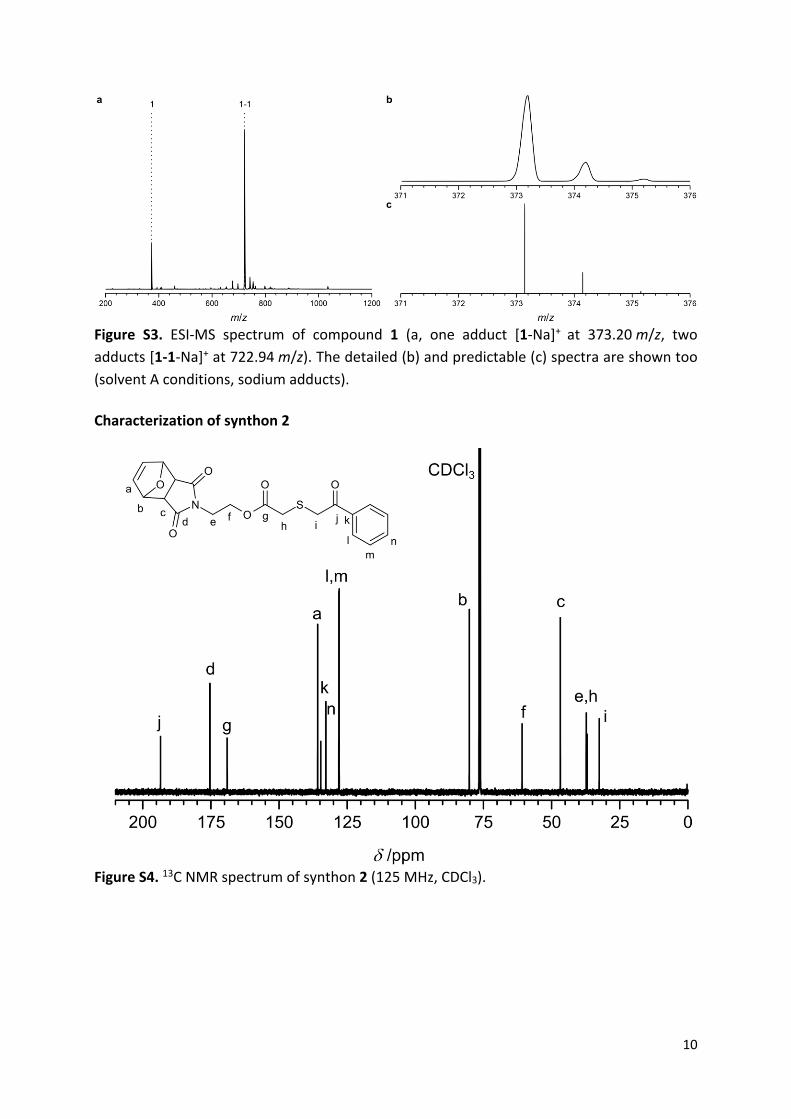
Figure S3. ESI-MS spectrum of compound 1 (a, one adduct [1-Na]+ at 373.20 m/z, two
adducts [1-1-Na]+ at 722.94 m/z). The detailed (b) and predictable (c) spectra are shown too
(solvent A conditions, sodium adducts).
Characterization of synthon 2
Figure S4. 13C NMR spectrum of synthon 2 (125 MHz, CDCl3).
11
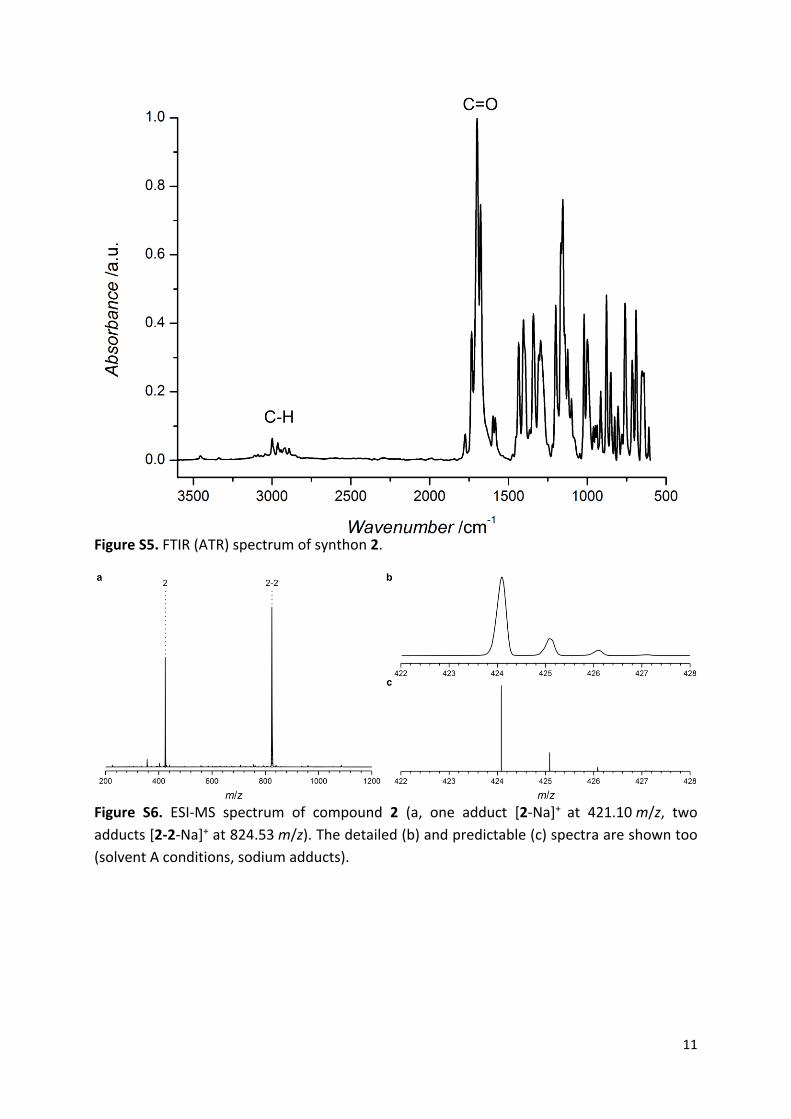
Figure S5. FTIR (ATR) spectrum of synthon 2.
Figure S6. ESI-MS spectrum of compound 2 (a, one adduct [2-Na]+ at 421.10 m/z, two
adducts [2-2-Na]+ at 824.53 m/z). The detailed (b) and predictable (c) spectra are shown too
(solvent A conditions, sodium adducts).
12
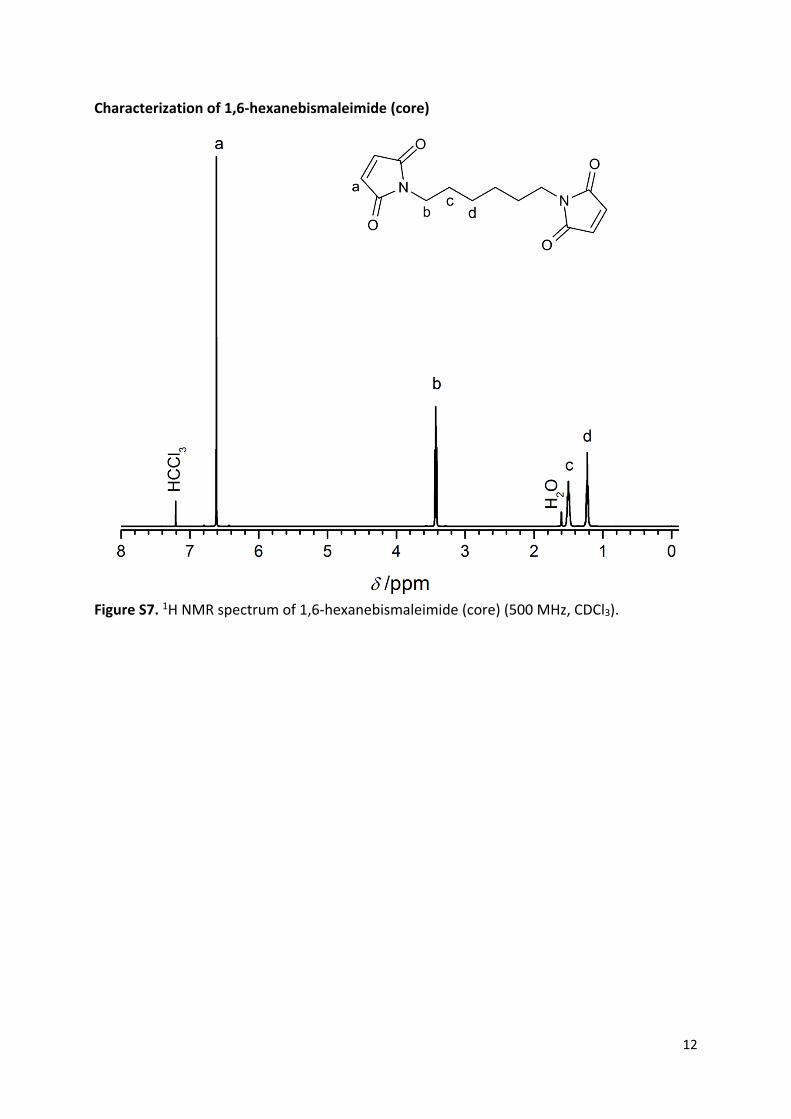
Characterization of 1,6-hexanebismaleimide (core)
Figure S7. 1H NMR spectrum of 1,6-hexanebismaleimide (core) (500 MHz, CDCl3).
13
Figure S8. 13C NMR spectrum of 1,6-hexanebismaleimide (core) (125 MHz, CDCl3).
14
Figure S9. FTIR (ATR) spectrum of 1,6-hexanebismaleimide (core).
Figure S10. ESI-MS spectrum of 1,6-hexanebismaleimide (a, one sodium adduct at
299.16 m/z). The detailed (b) and predictable (c) spectra are shown too (solvent A
conditions, sodium adducts).
15
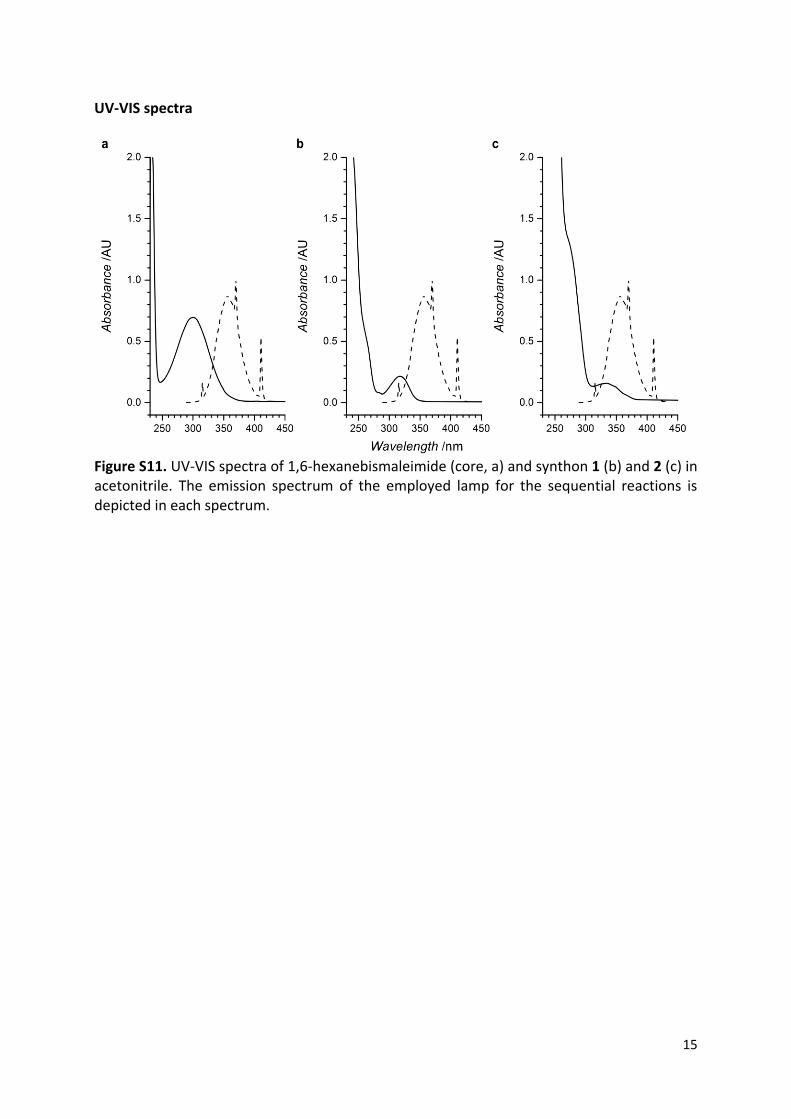
UV-VIS spectra
Figure S11. UV-VIS spectra of 1,6-hexanebismaleimide (core, a) and synthon 1 (b) and 2 (c) in acetonitrile. The emission spectrum of the employed lamp for the sequential reactions is depicted in each spectrum.
16
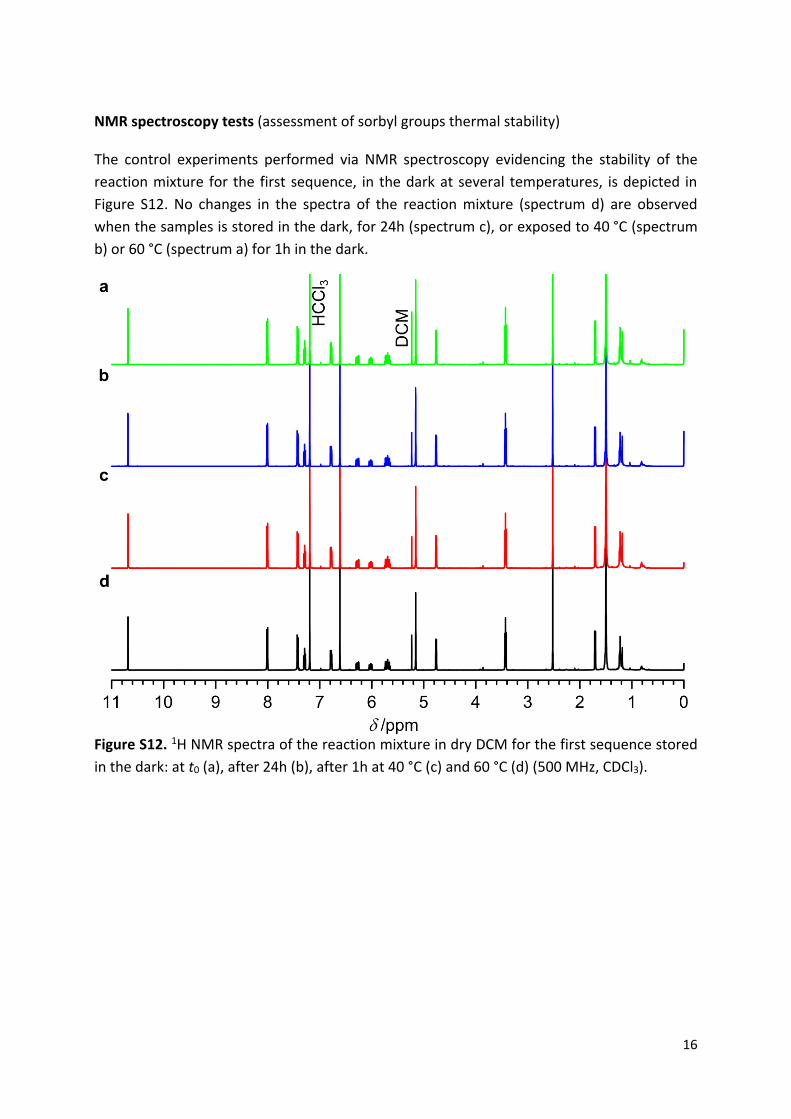
NMR spectroscopy tests (assessment of sorbyl groups thermal stability)
The control experiments performed via NMR spectroscopy evidencing the stability of the
reaction mixture for the first sequence, in the dark at several temperatures, is depicted in
Figure S12. No changes in the spectra of the reaction mixture (spectrum d) are observed
when the samples is stored in the dark, for 24h (spectrum c), or exposed to 40 °C (spectrum
b) or 60 °C (spectrum a) for 1h in the dark.
Figure S12. 1H NMR spectra of the reaction mixture in dry DCM for the first sequence stored
in the dark: at t0 (a), after 24h (b), after 1h at 40 °C (c) and 60 °C (d) (500 MHz, CDCl3).
17
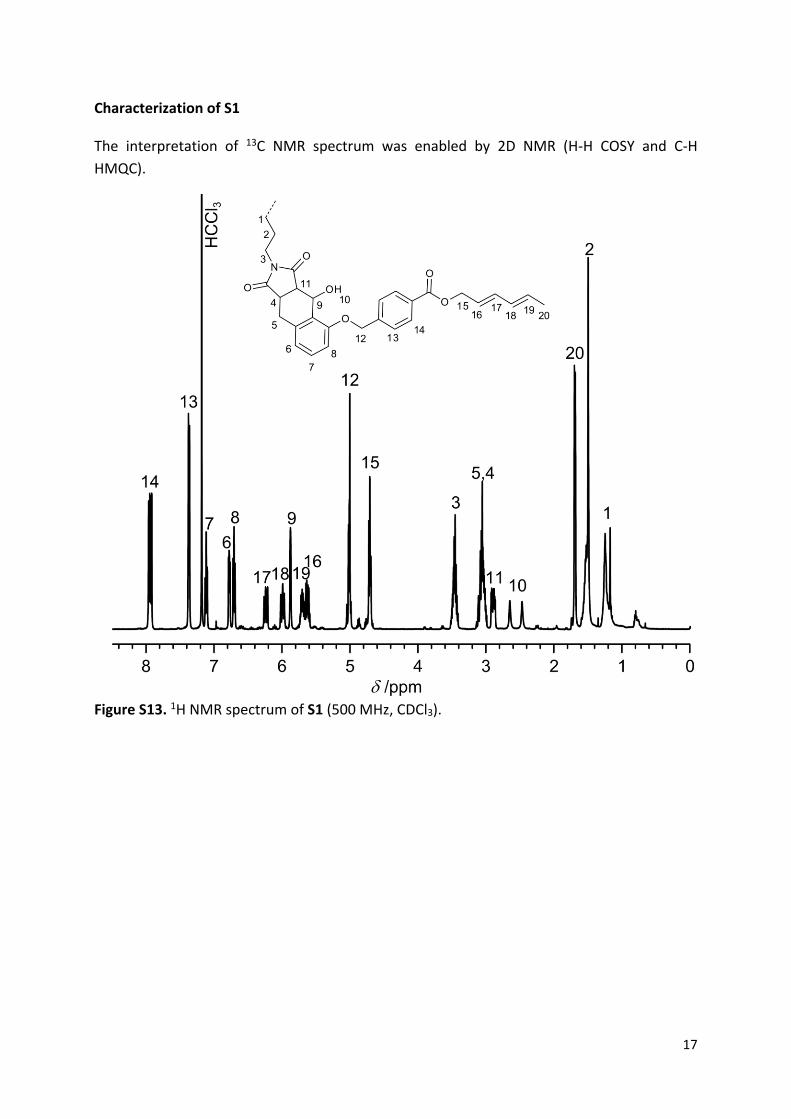
Characterization of S1
The interpretation of 13C NMR spectrum was enabled by 2D NMR (H-H COSY and C-H
HMQC).
Figure S13. 1H NMR spectrum of S1 (500 MHz, CDCl3).
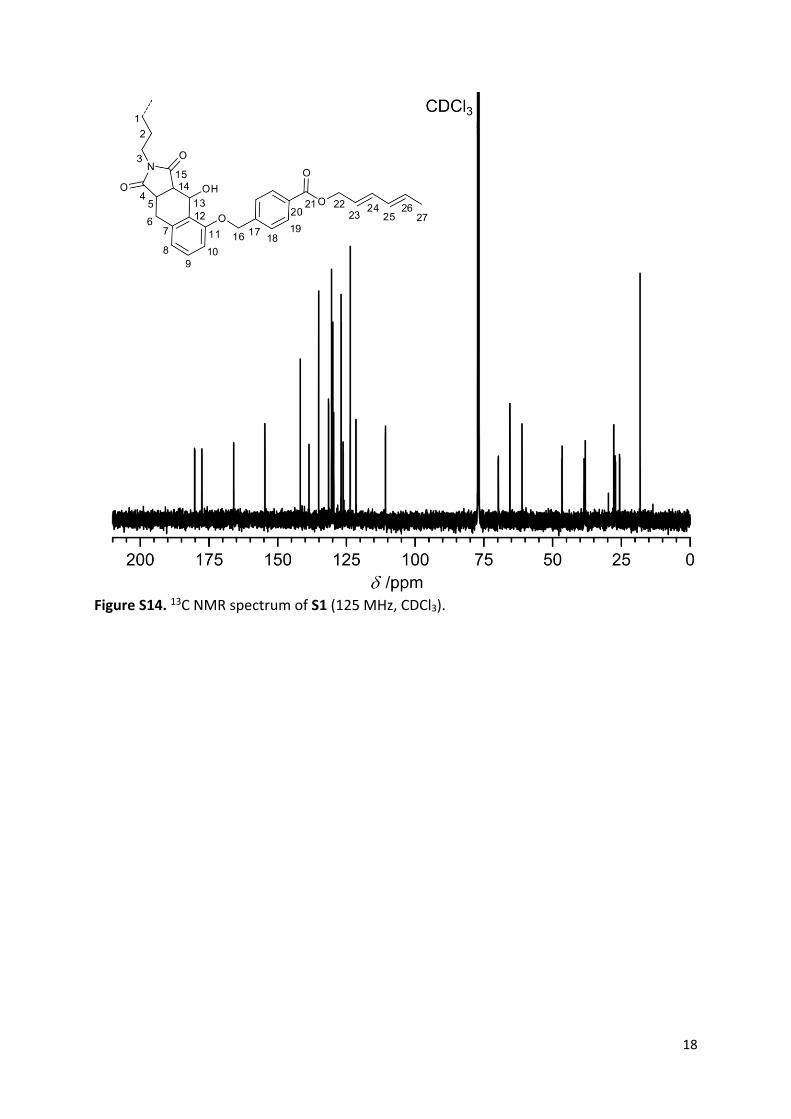
18
Figure S14. 13C NMR spectrum of S1 (125 MHz, CDCl3).
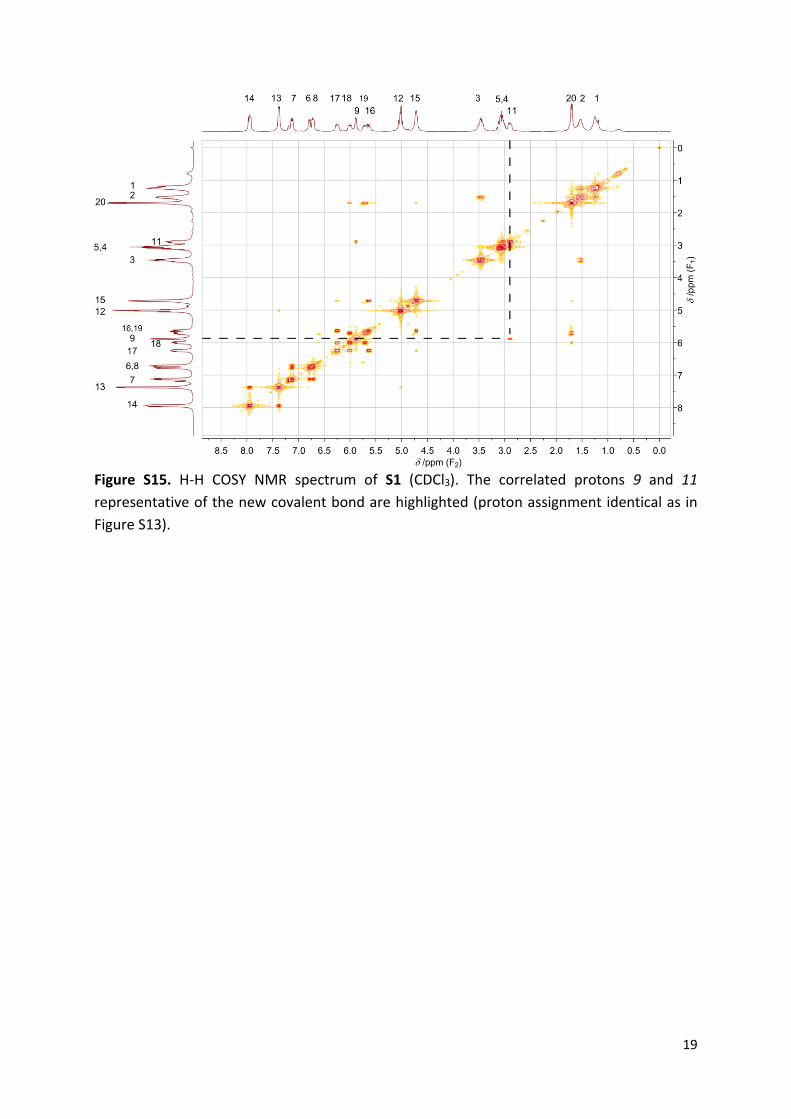
19
Figure S15. H-H COSY NMR spectrum of S1 (CDCl3). The correlated protons 9 and 11
representative of the new covalent bond are highlighted (proton assignment identical as in
Figure S13).
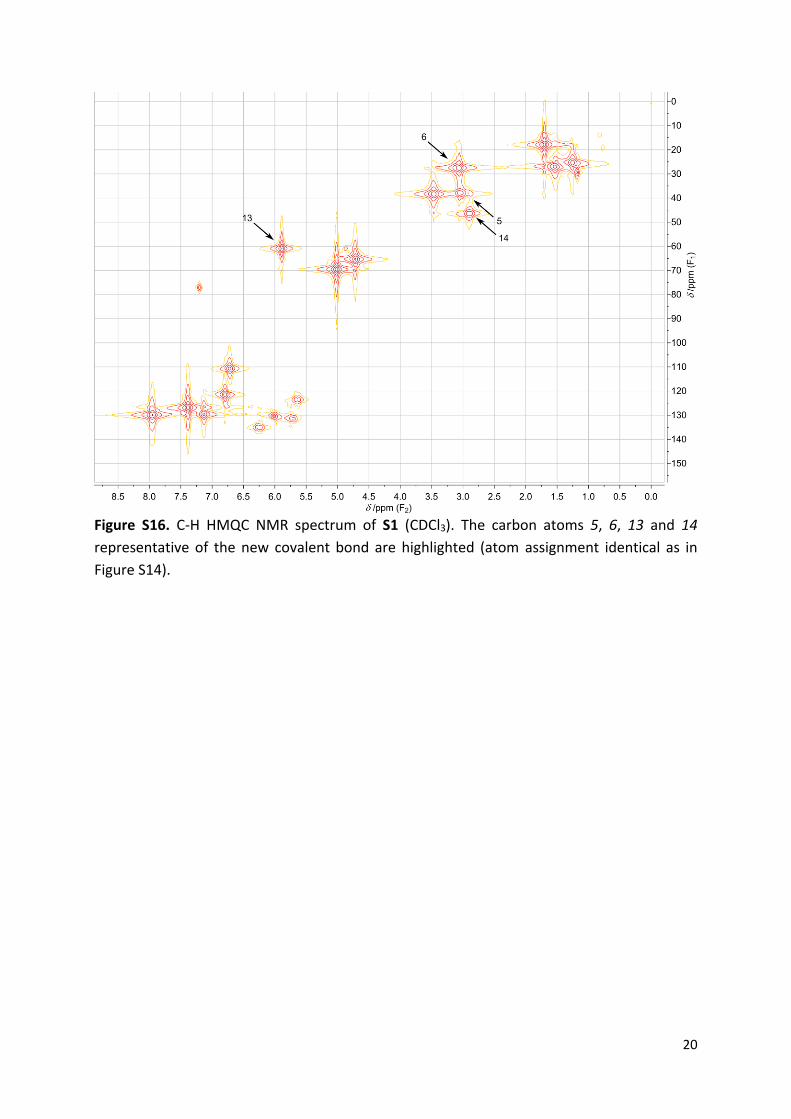
20
Figure S16. C-H HMQC NMR spectrum of S1 (CDCl3). The carbon atoms 5, 6, 13 and 14
representative of the new covalent bond are highlighted (atom assignment identical as in
Figure S14).
21
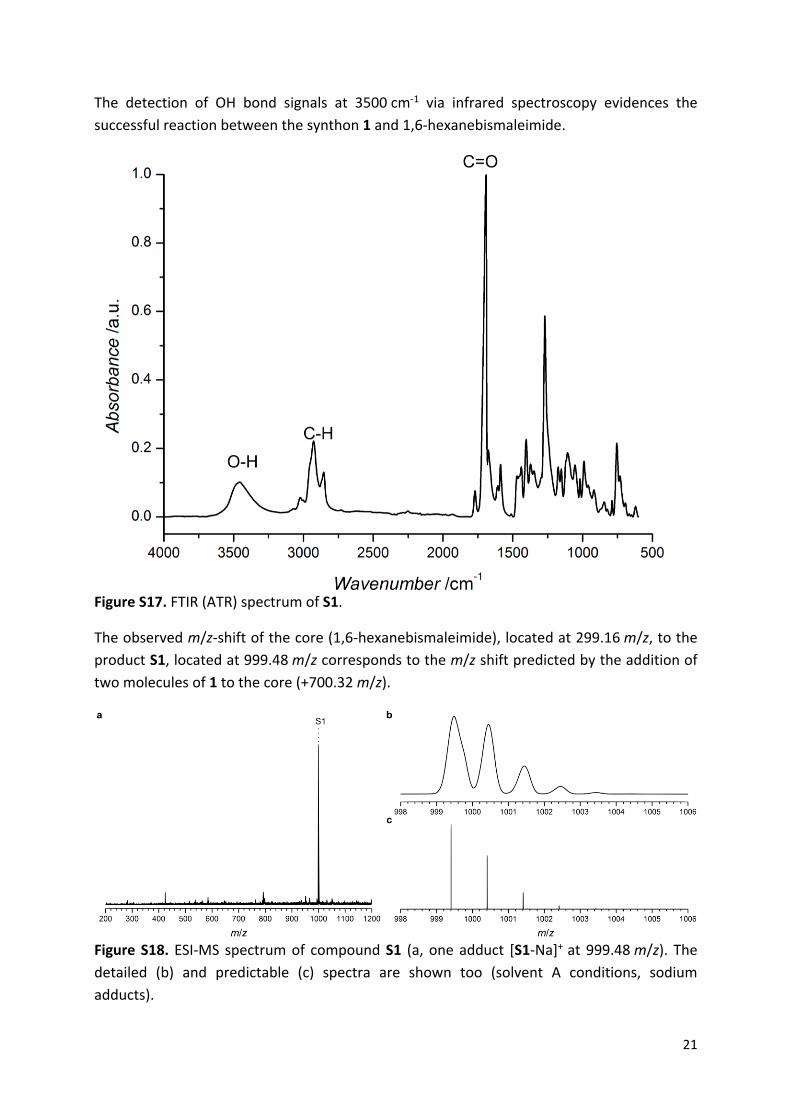
The detection of OH bond signals at 3500 cm-1 via infrared spectroscopy evidences the
successful reaction between the synthon 1 and 1,6-hexanebismaleimide.
Figure S17. FTIR (ATR) spectrum of S1.
The observed m/z-shift of the core (1,6-hexanebismaleimide), located at 299.16 m/z, to the
product S1, located at 999.48 m/z corresponds to the m/z shift predicted by the addition of
two molecules of 1 to the core (+700.32 m/z).
Figure S18. ESI-MS spectrum of compound S1 (a, one adduct [S1-Na]+ at 999.48 m/z). The
detailed (b) and predictable (c) spectra are shown too (solvent A conditions, sodium
adducts).
22
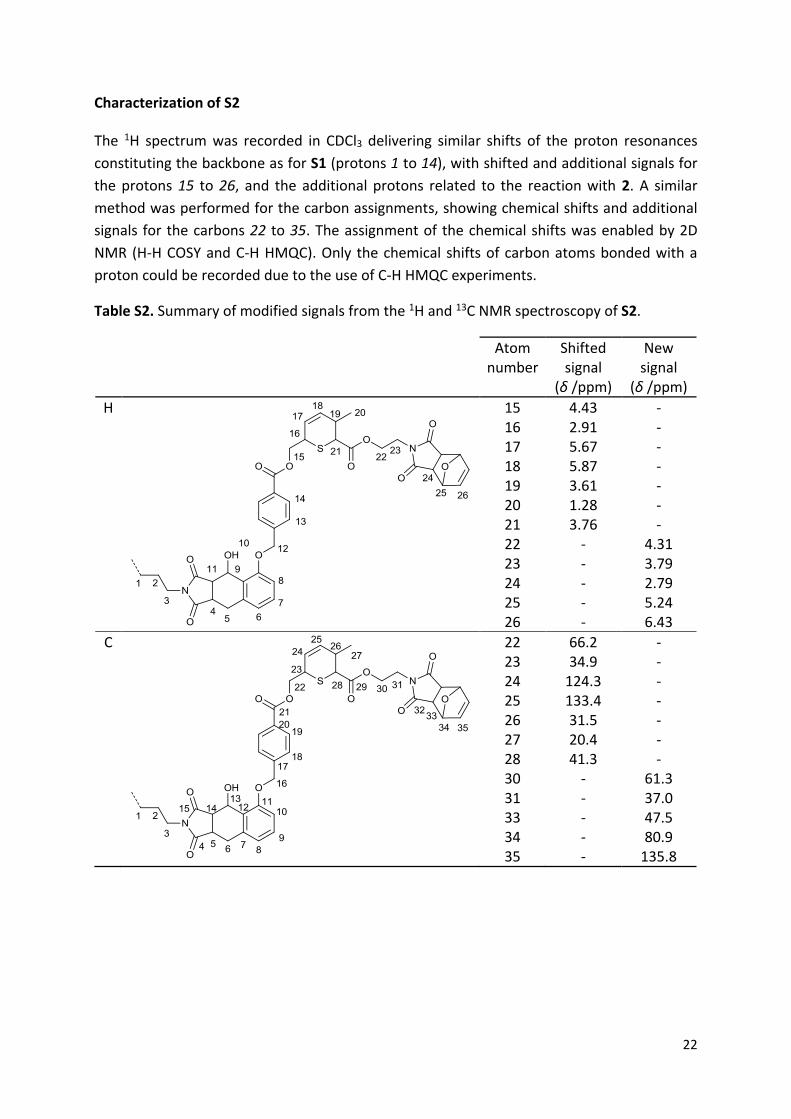
Characterization of S2
The 1H spectrum was recorded in CDCl3 delivering similar shifts of the proton resonances
constituting the backbone as for S1 (protons 1 to 14), with shifted and additional signals for
the protons 15 to 26, and the additional protons related to the reaction with 2. A similar
method was performed for the carbon assignments, showing chemical shifts and additional
signals for the carbons 22 to 35. The assignment of the chemical shifts was enabled by 2D
NMR (H-H COSY and C-H HMQC). Only the chemical shifts of carbon atoms bonded with a
proton could be recorded due to the use of C-H HMQC experiments.
Table S2. Summary of modified signals from the 1H and 13C NMR spectroscopy of S2.
Atom number
Shifted signal
(δ /ppm)
New signal
(δ /ppm)
H
15 16 17 18 19 20 21 22 23 24 25 26
4.43 2.91 5.67 5.87 3.61 1.28 3.76
- - - - -
- - - - - - -
4.31 3.79 2.79 5.24 6.43
C
22 23 24 25 26 27 28 30 31 33 34 35
66.2 34.9
124.3 133.4 31.5 20.4 41.3
- - - - -
- - - - - - -
61.3 37.0 47.5 80.9
135.8
23
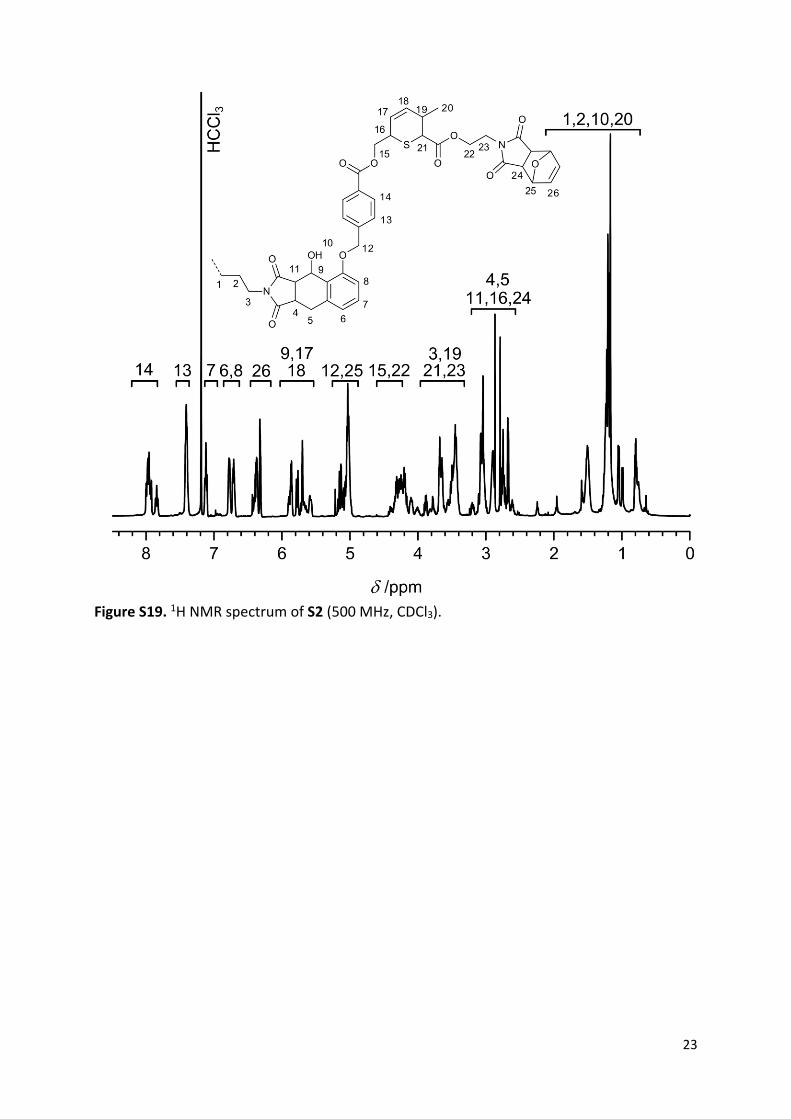
Figure S19. 1H NMR spectrum of S2 (500 MHz, CDCl3).
24
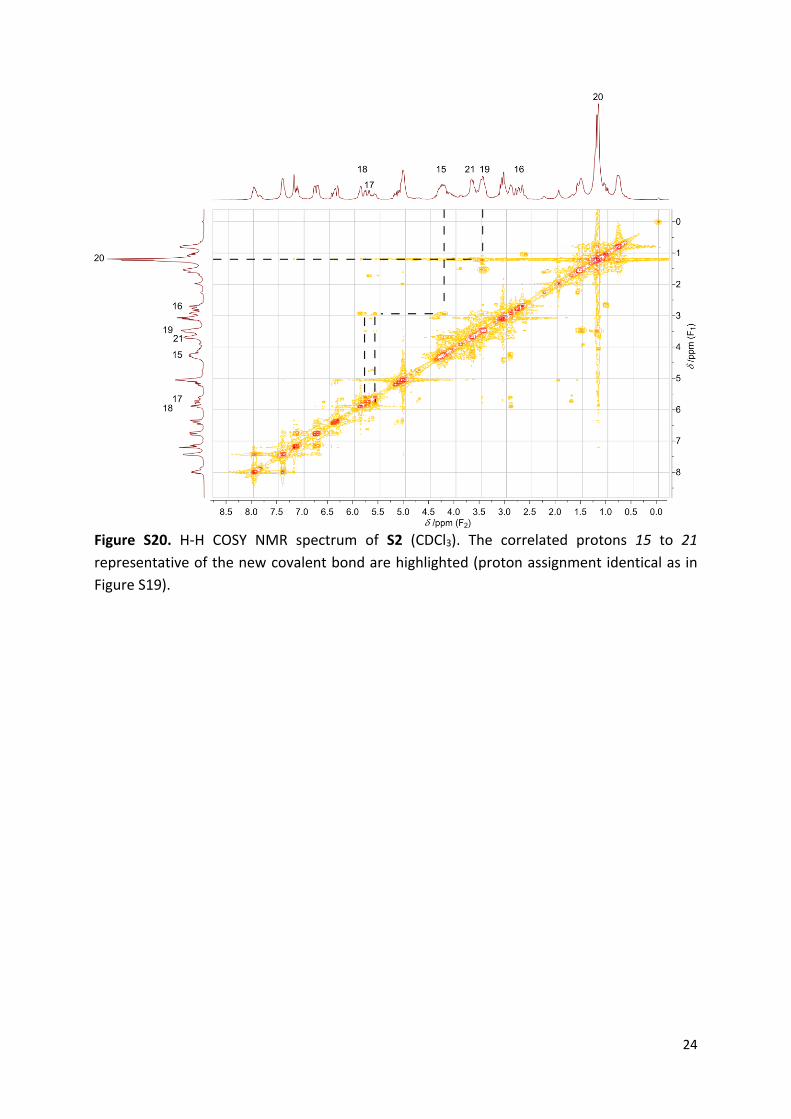
Figure S20. H-H COSY NMR spectrum of S2 (CDCl3). The correlated protons 15 to 21
representative of the new covalent bond are highlighted (proton assignment identical as in
Figure S19).
25
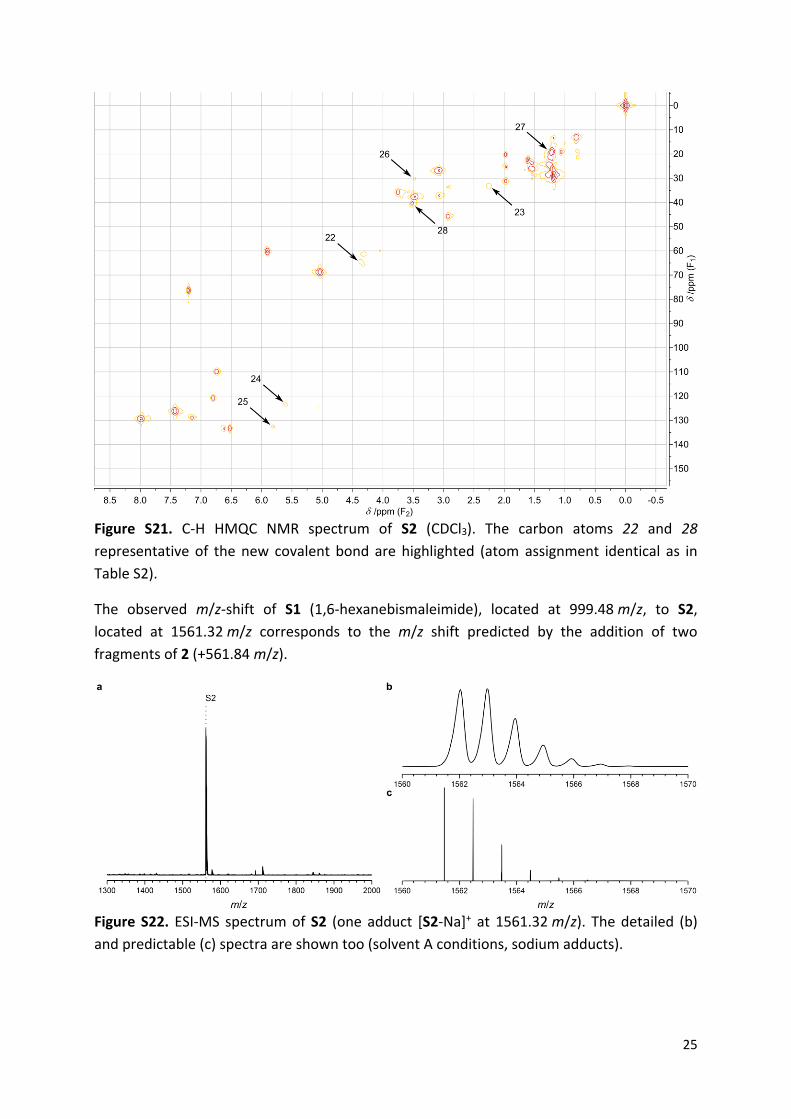
Figure S21. C-H HMQC NMR spectrum of S2 (CDCl3). The carbon atoms 22 and 28
representative of the new covalent bond are highlighted (atom assignment identical as in
Table S2).
The observed m/z-shift of S1 (1,6-hexanebismaleimide), located at 999.48 m/z, to S2,
located at 1561.32 m/z corresponds to the m/z shift predicted by the addition of two
fragments of 2 (+561.84 m/z).
Figure S22. ESI-MS spectrum of S2 (one adduct [S2-Na]+ at 1561.32 m/z). The detailed (b)
and predictable (c) spectra are shown too (solvent A conditions, sodium adducts).
26
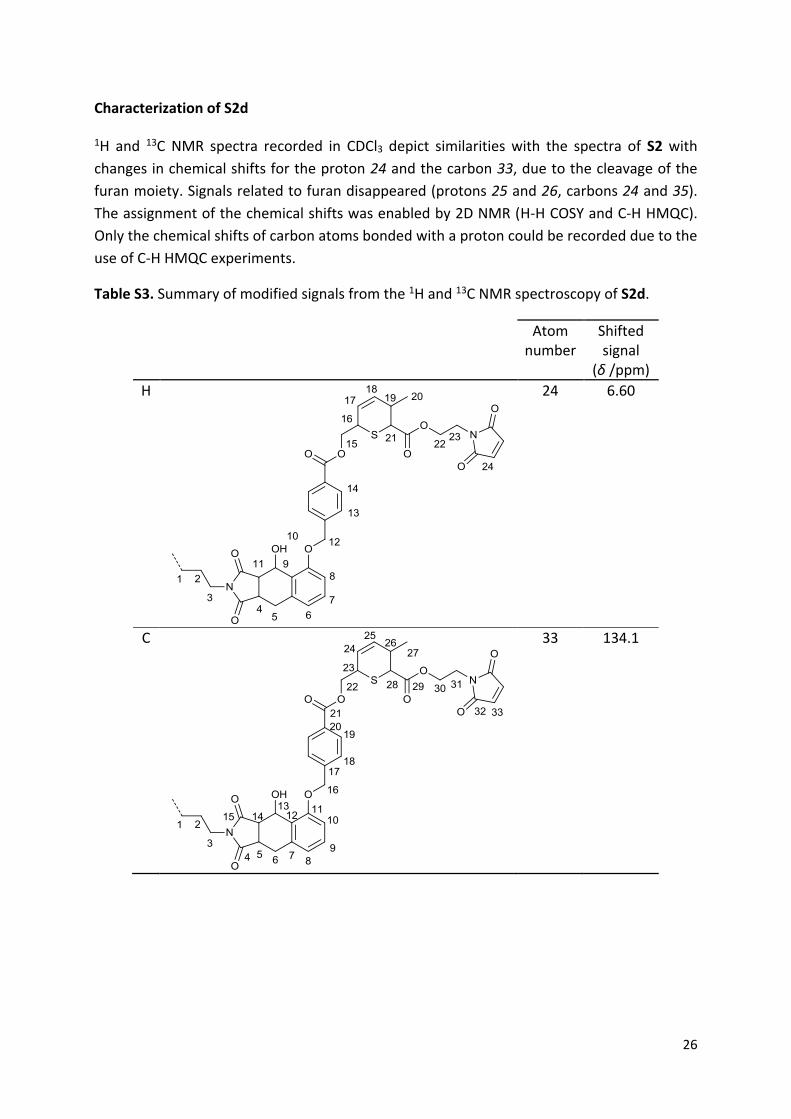
Characterization of S2d
1H and 13C NMR spectra recorded in CDCl3 depict similarities with the spectra of S2 with
changes in chemical shifts for the proton 24 and the carbon 33, due to the cleavage of the
furan moiety. Signals related to furan disappeared (protons 25 and 26, carbons 24 and 35).
The assignment of the chemical shifts was enabled by 2D NMR (H-H COSY and C-H HMQC).
Only the chemical shifts of carbon atoms bonded with a proton could be recorded due to the
use of C-H HMQC experiments.
Table S3. Summary of modified signals from the 1H and 13C NMR spectroscopy of S2d.
Atom number
Shifted signal
(δ /ppm)
H
24
6.60
C
33
134.1
27
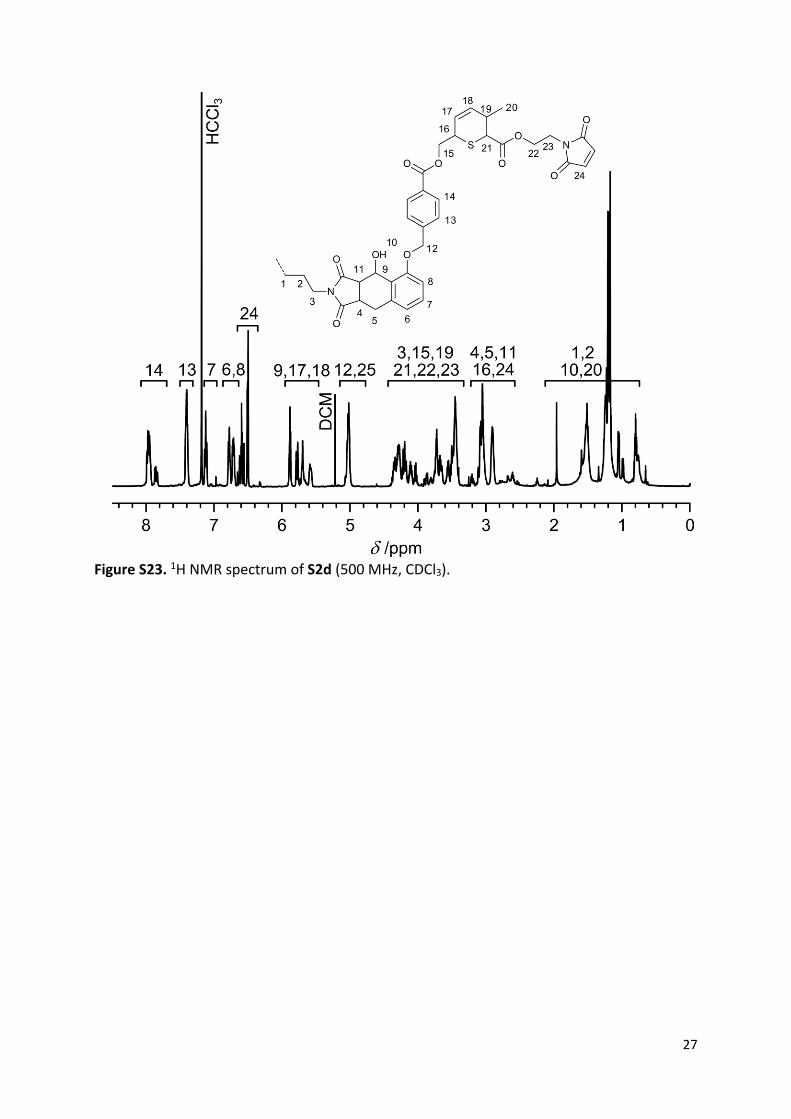
Figure S23. 1H NMR spectrum of S2d (500 MHz, CDCl3).
28
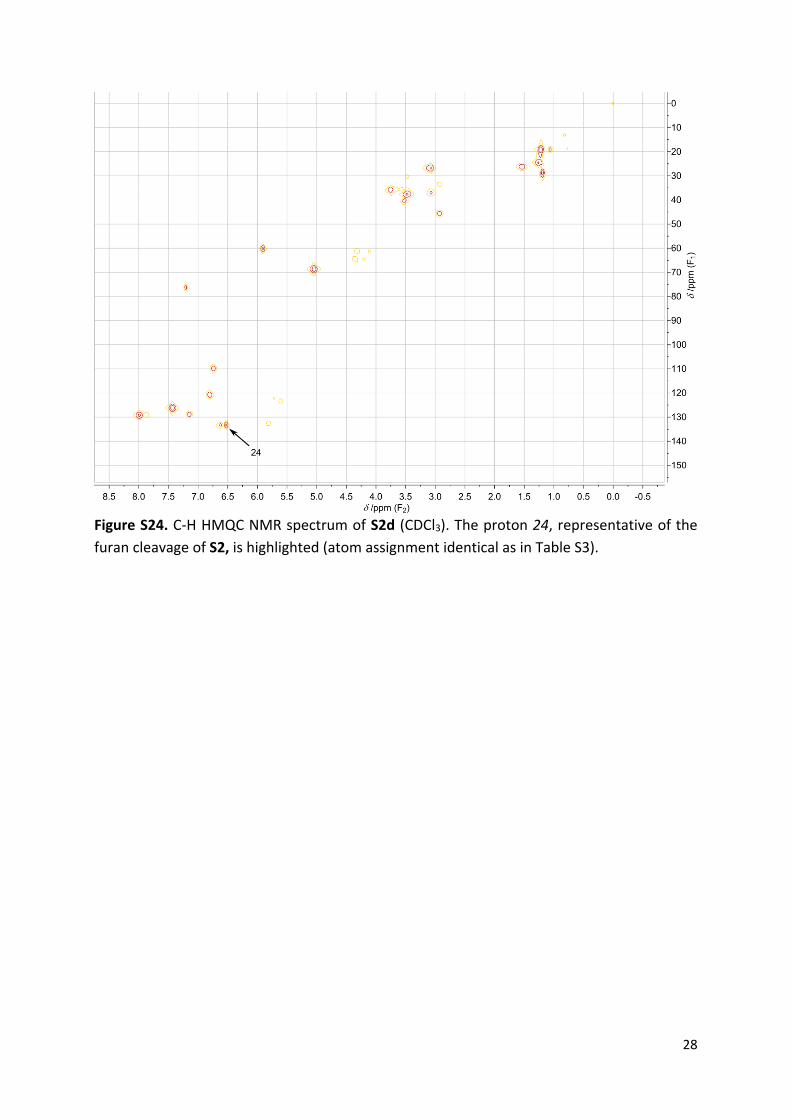
Figure S24. C-H HMQC NMR spectrum of S2d (CDCl3). The proton 24, representative of the
furan cleavage of S2, is highlighted (atom assignment identical as in Table S3).
29
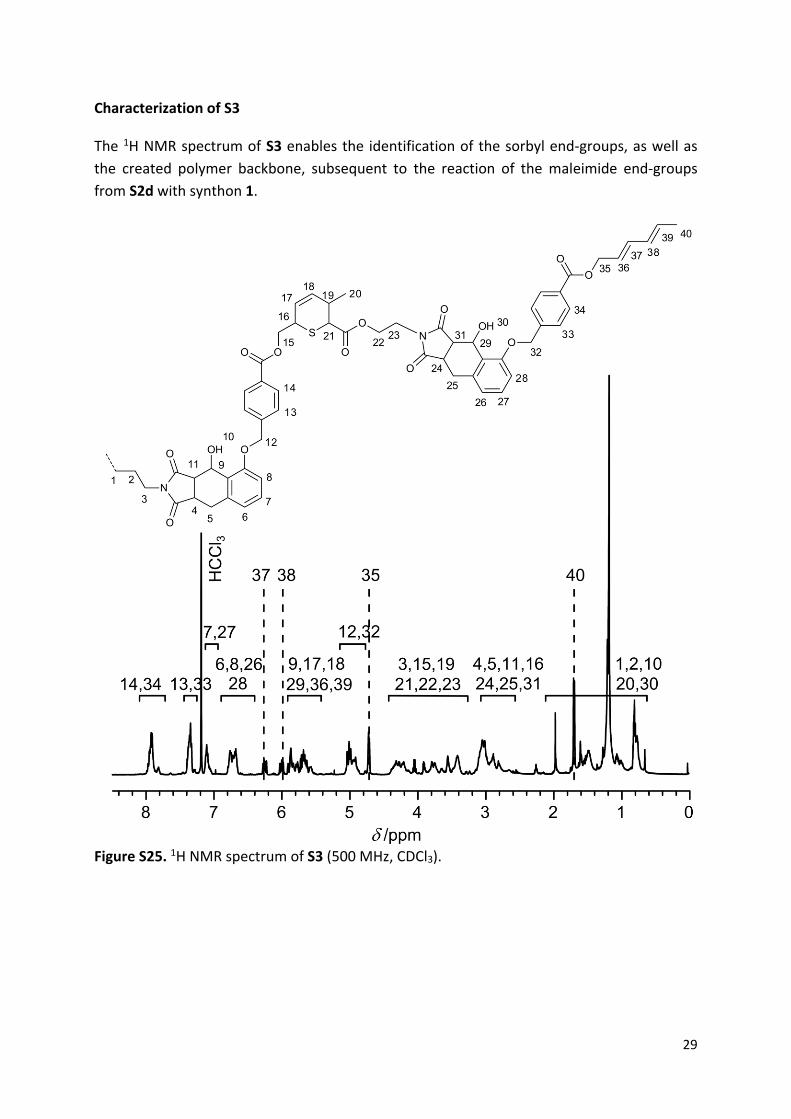
Characterization of S3
The 1H NMR spectrum of S3 enables the identification of the sorbyl end-groups, as well as
the created polymer backbone, subsequent to the reaction of the maleimide end-groups
from S2d with synthon 1.
Figure S25. 1H NMR spectrum of S3 (500 MHz, CDCl3).
30
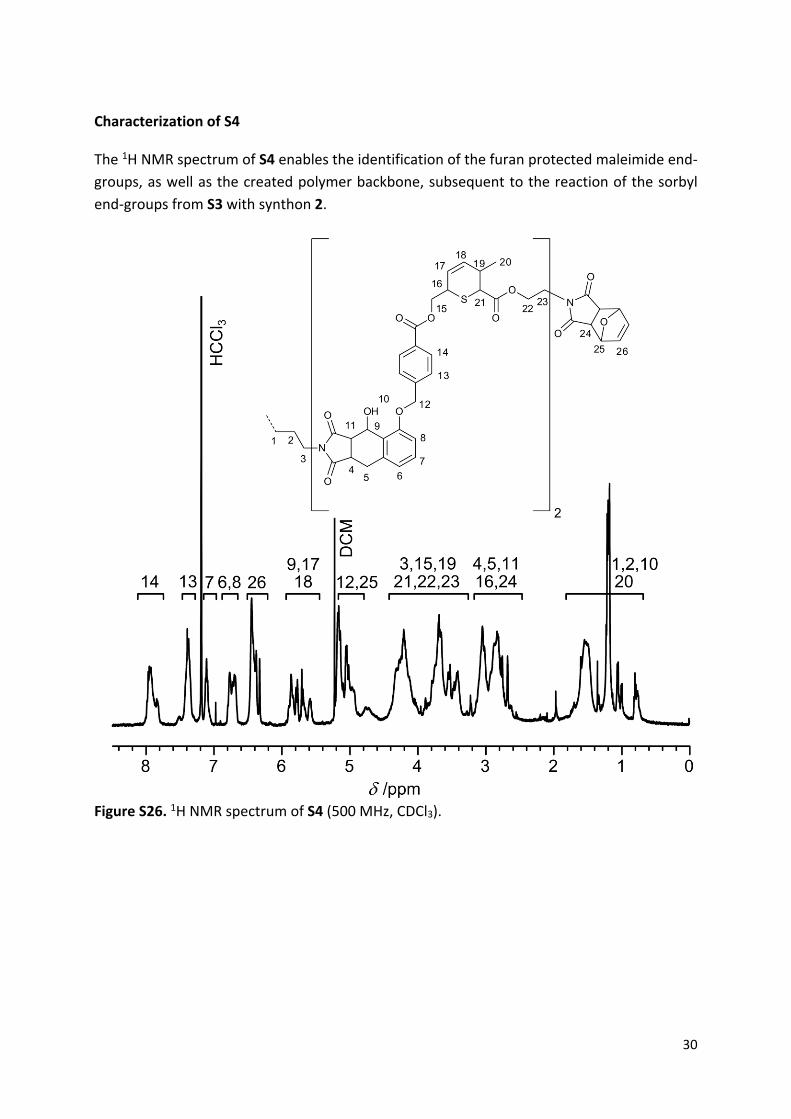
Characterization of S4
The 1H NMR spectrum of S4 enables the identification of the furan protected maleimide end-
groups, as well as the created polymer backbone, subsequent to the reaction of the sorbyl
end-groups from S3 with synthon 2.
Figure S26. 1H NMR spectrum of S4 (500 MHz, CDCl3).
31
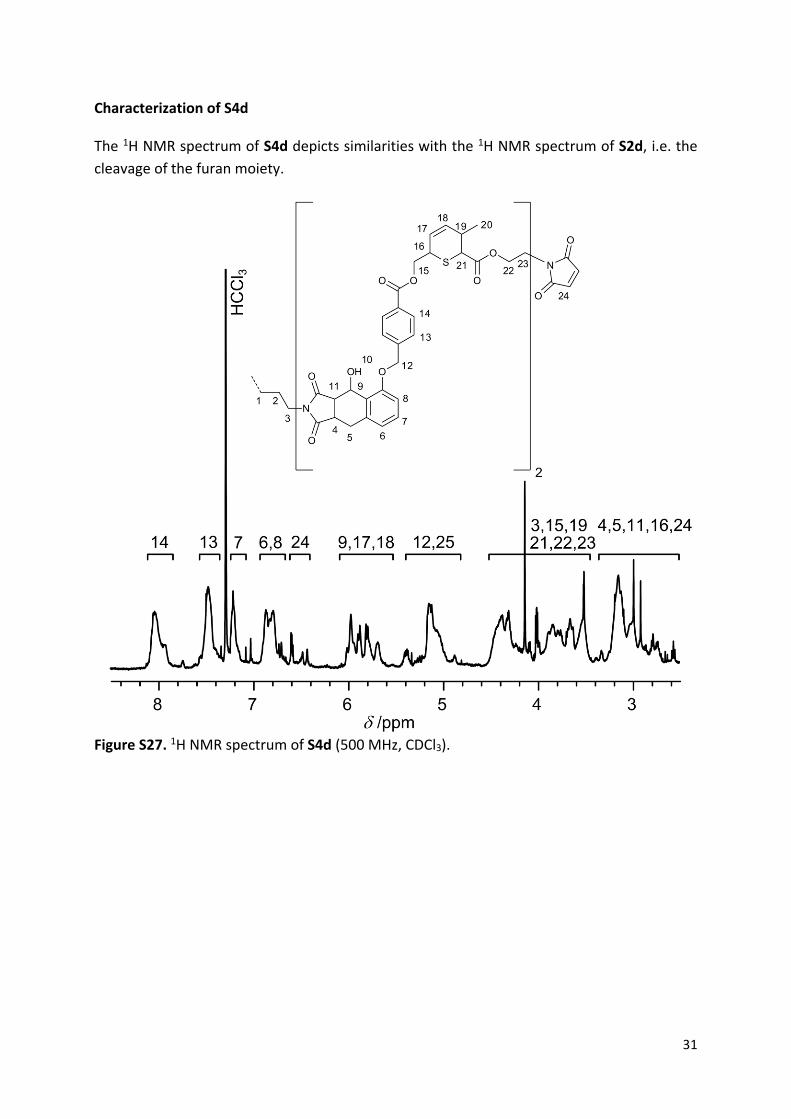
Characterization of S4d
The 1H NMR spectrum of S4d depicts similarities with the 1H NMR spectrum of S2d, i.e. the
cleavage of the furan moiety.
Figure S27. 1H NMR spectrum of S4d (500 MHz, CDCl3).
32
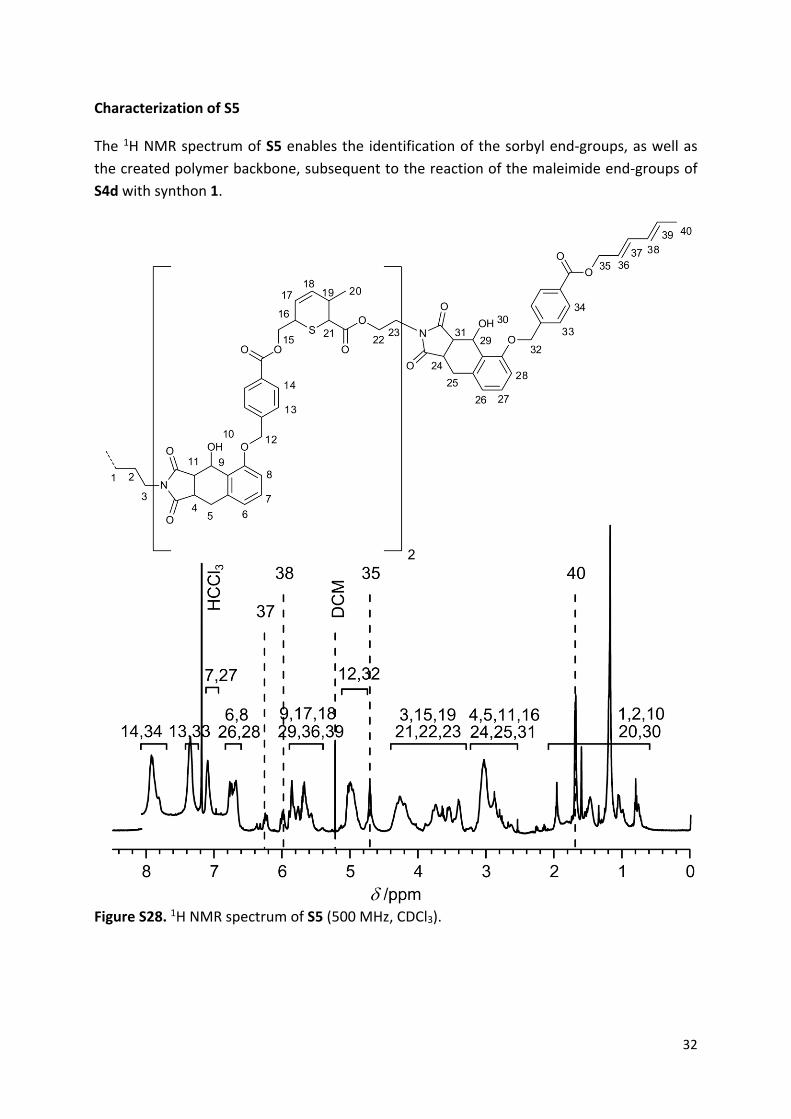
Characterization of S5
The 1H NMR spectrum of S5 enables the identification of the sorbyl end-groups, as well as
the created polymer backbone, subsequent to the reaction of the maleimide end-groups of
S4d with synthon 1.
Figure S28. 1H NMR spectrum of S5 (500 MHz, CDCl3).
33
ESI-MS
CID experiments of S1 and S2
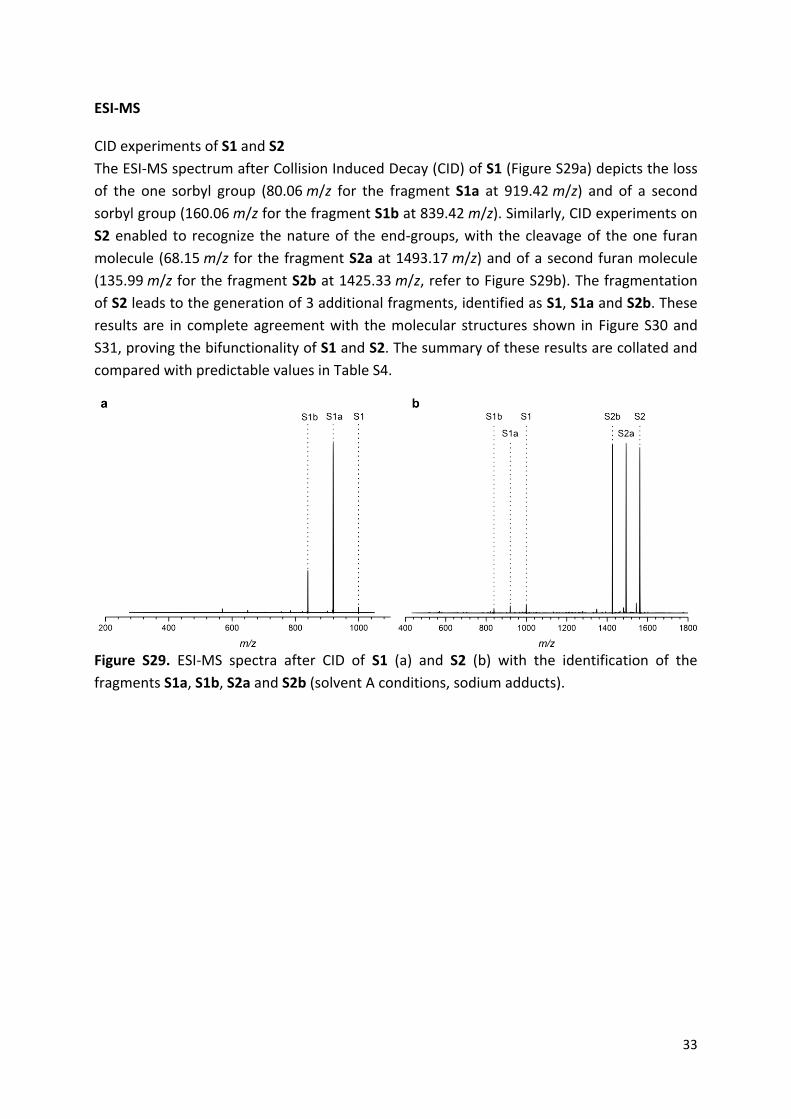
The ESI-MS spectrum after Collision Induced Decay (CID) of S1 (Figure S29a) depicts the loss
of the one sorbyl group (80.06 m/z for the fragment S1a at 919.42 m/z) and of a second
sorbyl group (160.06 m/z for the fragment S1b at 839.42 m/z). Similarly, CID experiments on
S2 enabled to recognize the nature of the end-groups, with the cleavage of the one furan
molecule (68.15 m/z for the fragment S2a at 1493.17 m/z) and of a second furan molecule
(135.99 m/z for the fragment S2b at 1425.33 m/z, refer to Figure S29b). The fragmentation
of S2 leads to the generation of 3 additional fragments, identified as S1, S1a and S2b. These
results are in complete agreement with the molecular structures shown in Figure S30 and
S31, proving the bifunctionality of S1 and S2. The summary of these results are collated and
compared with predictable values in Table S4.
Figure S29. ESI-MS spectra after CID of S1 (a) and S2 (b) with the identification of the
fragments S1a, S1b, S2a and S2b (solvent A conditions, sodium adducts).
34
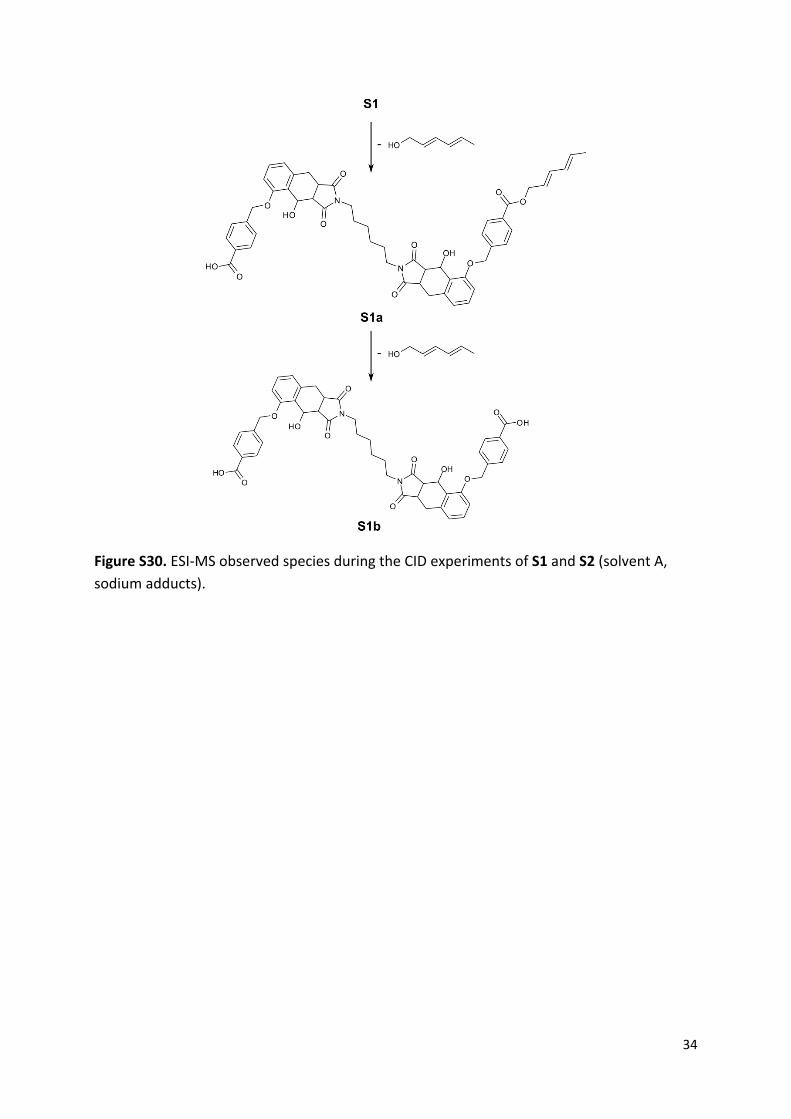
Figure S30. ESI-MS observed species during the CID experiments of S1 and S2 (solvent A,
sodium adducts).
35
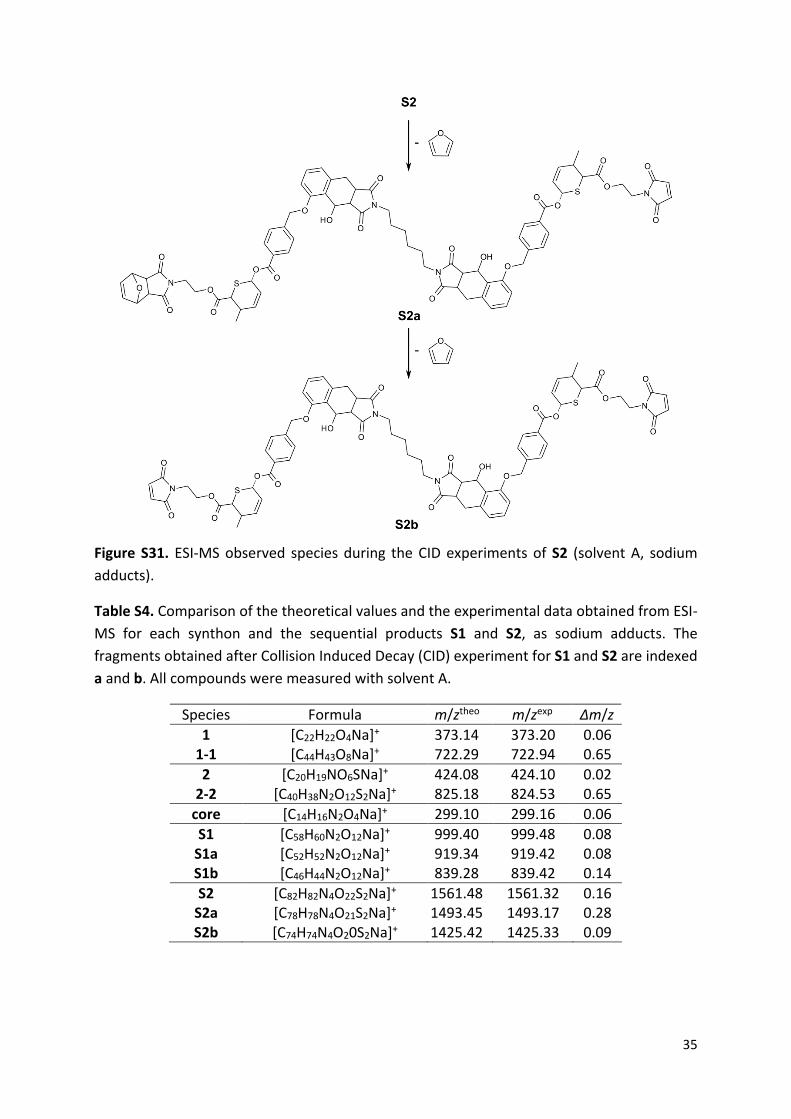
Figure S31. ESI-MS observed species during the CID experiments of S2 (solvent A, sodium
adducts).
Table S4. Comparison of the theoretical values and the experimental data obtained from ESI-
MS for each synthon and the sequential products S1 and S2, as sodium adducts. The
fragments obtained after Collision Induced Decay (CID) experiment for S1 and S2 are indexed
a and b. All compounds were measured with solvent A.
Species Formula m/ztheo m/zexp Δm/z
1 [C22H22O4Na]+ 373.14 373.20 0.06 1-1 [C44H43O8Na]+ 722.29 722.94 0.65
2 [C20H19NO6SNa]+ 424.08 424.10 0.02 2-2 [C40H38N2O12S2Na]+ 825.18 824.53 0.65
core [C14H16N2O4Na]+ 299.10 299.16 0.06
S1 [C58H60N2O12Na]+ 999.40 999.48 0.08 S1a [C52H52N2O12Na]+ 919.34 919.42 0.08 S1b [C46H44N2O12Na]+ 839.28 839.42 0.14
S2 [C82H82N4O22S2Na]+ 1561.48 1561.32 0.16 S2a [C78H78N4O21S2Na]+ 1493.45 1493.17 0.28 S2b [C74H74N4O20S2Na]+ 1425.42 1425.33 0.09
36
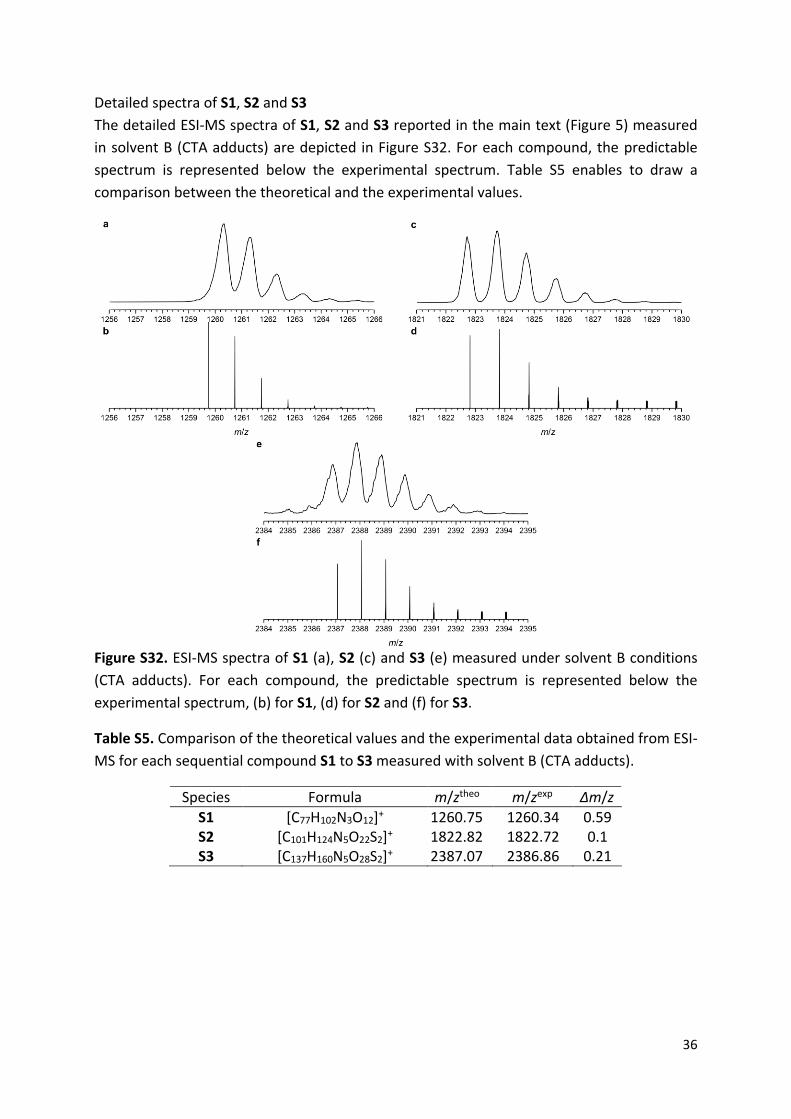
Detailed spectra of S1, S2 and S3
The detailed ESI-MS spectra of S1, S2 and S3 reported in the main text (Figure 5) measured
in solvent B (CTA adducts) are depicted in Figure S32. For each compound, the predictable
spectrum is represented below the experimental spectrum. Table S5 enables to draw a
comparison between the theoretical and the experimental values.
Figure S32. ESI-MS spectra of S1 (a), S2 (c) and S3 (e) measured under solvent B conditions
(CTA adducts). For each compound, the predictable spectrum is represented below the
experimental spectrum, (b) for S1, (d) for S2 and (f) for S3.
Table S5. Comparison of the theoretical values and the experimental data obtained from ESI-
MS for each sequential compound S1 to S3 measured with solvent B (CTA adducts).
Species Formula m/ztheo m/zexp Δm/z
S1 [C77H102N3O12]+ 1260.75 1260.34 0.59 S2 [C101H124N5O22S2]+ 1822.82 1822.72 0.1 S3 [C137H160N5O28S2]+ 2387.07 2386.86 0.21
37
MALDI-TOF-MS of S5
Table S6. Comparison of the theoretical values and the experimental data obtained from
MALDI-TOF-MS for S5 from the DIT matrix (sodium adducts). The difference between the
calculated and experimental value (Δm/z) is higher than measurements performed via ESI-
MS, and can be caused by a protonation during the ionization.
Species Formula m/ztheo m/zexp Δm/z
S5 [C178H176N6O44S4Na]+ 3253.05 3257.01 3.96
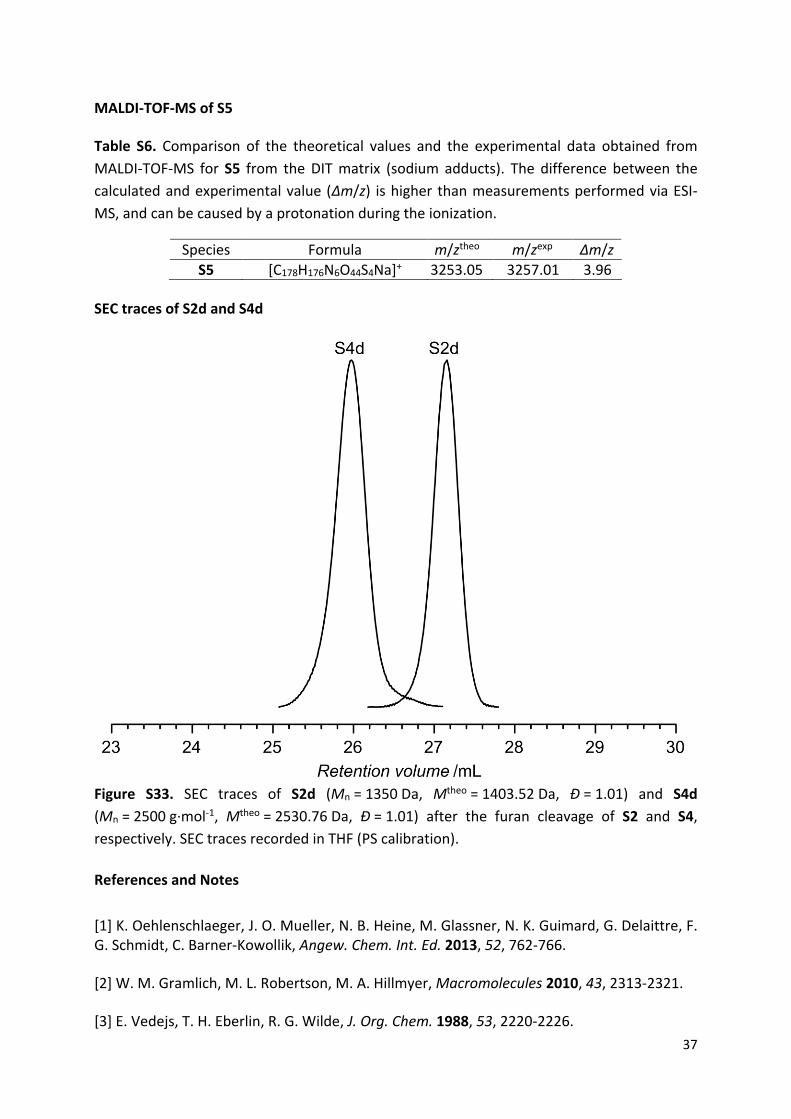
SEC traces of S2d and S4d
Figure S33. SEC traces of S2d (Mn = 1350 Da, Mtheo = 1403.52 Da, Đ = 1.01) and S4d
(Mn = 2500 g·mol-1, Mtheo = 2530.76 Da, Đ = 1.01) after the furan cleavage of S2 and S4,
respectively. SEC traces recorded in THF (PS calibration).
References and Notes
[1] K. Oehlenschlaeger, J. O. Mueller, N. B. Heine, M. Glassner, N. K. Guimard, G. Delaittre, F. G. Schmidt, C. Barner-Kowollik, Angew. Chem. Int. Ed. 2013, 52, 762-766.
[2] W. M. Gramlich, M. L. Robertson, M. A. Hillmyer, Macromolecules 2010, 43, 2313-2321.
[3] E. Vedejs, T. H. Eberlin, R. G. Wilde, J. Org. Chem. 1988, 53, 2220-2226.

38
[4] J. Canadell, H. Fischer, G. De With, R. A. T. M. Van Benthem, J. Polym. Sci. A Polym. Chem. 2010, 48, 3456-3467.
[5] T. Dispinar, W. Van Camp, L. J. De Cock, B. G. De Geest, F. E. Du Prez, Macromol. Biosci.
2012, 12, 383-394.
Related Documents