Supporting Information Probing the pseudo-1-D ion diffusion in lithium titanium niobate anode for Li-ion battery Suman Das, a Dipak Dutta, a Rafael B. Araujo, b Sudip Chakraborty, c Rajeev Ahuja, c Aninda J. Bhattacharyya *a a Solid State and Structural Chemistry Unit, Indian Institute of Science, Bangalore-560012, India b Applied Materials Physics, Department of Materials and Engineering, Royal Institute of Technology (KTH), S-100 44 Stockholm, Sweden c Condensed Matter Theory Group, Department of Physics and Astronomy, Box 516, Uppsala University, S-75120 Uppsala, Sweden. Email: [email protected] Electronic Supplementary Material (ESI) for Physical Chemistry Chemical Physics. This journal is © the Owner Societies 2016

Welcome message from author
This document is posted to help you gain knowledge. Please leave a comment to let me know what you think about it! Share it to your friends and learn new things together.
Transcript

Supporting Information
Probing the pseudo-1-D ion diffusion in lithium titanium niobate anode for
Li-ion battery
Suman Das,a Dipak Dutta,a Rafael B. Araujo,b Sudip Chakraborty,c Rajeev Ahuja,c Aninda J.
Bhattacharyya*a
aSolid State and Structural Chemistry Unit, Indian Institute of Science, Bangalore-560012, IndiabApplied Materials Physics, Department of Materials and Engineering, Royal Institute of Technology
(KTH), S-100 44 Stockholm, SwedencCondensed Matter Theory Group, Department of Physics and Astronomy, Box 516, Uppsala
University, S-75120 Uppsala, Sweden.
Email: [email protected]
Electronic Supplementary Material (ESI) for Physical Chemistry Chemical Physics.This journal is © the Owner Societies 2016

EXPERIMENTAL: SYNTHESIS AND CHARACTERIZATION
Synthesis of KTiNbO5: KTiNbO5 is synthesized by a sol-gel method reported elsewhere.33
Briefly, 2.95 ml (0.01 mol) of titanium tetra-isopropoxide (TTIP) (Sigma-Aldrich) is
dissolved in ~ 33 ml of ethylene glycol (EG) resulting a clear solution. 28.8 g (0.15 mol) of
citric acid (CA) and 0.7455 g (0.01 mol) of KCl are added to this solution such that a
transparent solution is formed. 2.7 g (0.01 mol) of niobium pentachloride (NbCl5) (Sigma-
Aldrich) is dissolve in ~ 60 ml of dried methanol (MeOH) separately. The Nb-salt alcohol
solution is added to the Ti-solution and condensed to form a gel at 130 ˚C. The gel is
pyrolyzed at 400 ˚C for 4 h to form a black powder precursor. This sample further on heating
at 700 ˚C in air for 2 h leads to the formation of white colored KTiNbO5.
Synthesis of LixK1-xTiNbO5 (Li-Ti-niobate): LixK1-xTiNbO5 is synthesized from the as-
synthesized KTiNbO5 by an ion-exchange method. In a typical procedure, 100 mg of
KTiNbO5 is dispersed in aqueous solution (20 ml) of Li2SO4 followed by stirring under N2
atmosphere at around 55- 60 ˚C for 3 days. To ensure the maximum ion-exchange, the
concentration of Li2SO4 is taken 20 times mole excess of KTiNbO5. The as-synthesized Li-
Ti-niobate is separated by centrifugation at 8000 rpm followed by washing the precipitate
with de-ionized water, ethanol and finally dried at 70 ˚C in vacuum.
The as-synthesized LixK1-xTiNbO5 particles is downsized (d-Li-Ti-niobate) by ball milling
100 mg of as-prepared LiTiNbO5 in pulverisette 23 planetary ball miller with three balls of
total weight 6 g. Carbon coated downsized LixK1-xTiNbO5 (cd-Li-Ti-niobate) sample is
prepared by hydrothermal carbonization of glucose solution.
Instrumentation: Powder X-ray diffraction (PXRD) pattern of the synthesized samples are
recorded in the 2θ range of 5˚-80˚ in nickel filtered Philips X’pert diffractometer using Cu Kα
radiation, (λ = 1.5418 Å). Raman spectra of the samples are collected on a LabRam HR
system with 532 nm diode pump solid state LASER. The AXIS-Ultra, instrument of Kratos

using monochromatic AlKα radiation (225 W, 15 mA, 15 kV) is used to record the X-ray
photo electron spectroscopy (XPS) data. Elemental analysis of the samples is carried out by
inductively coupled plasma optical emission spectroscopy (ICP-OES) in Themo-iCAP 6000
series model ICP-OES spectrometer. KCl, Nb2O5, TiO2, and LiCl are chosen as the standards
for the respective elements present in the electrode sample, LixK1-xTiNbO5 respectively. The
concentration of the cations are measured at the emission wavelength of 670 nm, 766.5 nm,
510 nm and 327 nm for Li+, K+, Nb5+and Ti4+ respectively. Thermogravimetric analysis
(TGA) is performed using a Mettler Toledo thermogravimetric system from room
temperature (30 ˚C) to 800 ˚C under oxygen atmosphere with a heating rate of 5 ˚C/min.
Transmission electron microscopy (TEM), high resolution transmission electron microscopy
(HRTEM) and the selected area electron diffraction (SAED) patterns are recorded on a FEI
TecnaiTM F30 machine operating at 300 kV. Cyclic voltammogram (CH Instrument-
CH608C) of Li-Ti-niobate has been carried out in the voltage range (0.01- 3.5) V at a scan
rate of 0.25 mV/s in a Swagelok cell, where metallic Li acts as both reference and counter
electrode. The galvanostatic charge/discharge cycling are performed on an Arbin Corp.
(Model BT 2000), USA at different C-rates (1C = 353 mA g-1) in the voltage range of (0.2-
2.75) V (versus Li+ /Li). To study the kinetics of lithium diffusion inside the electrode
material, galvanostatic intermittent titration technique (GITT) is performed on Arbin
Instrument. For GITT the testing cells are first galvanostatically discharged and charged for
one cycle to avoid the contribution of extra lithium storage during SEI formation. From the
subsequent cycle the cells are discharged for 30 min at C/25 current rate and kept at rest for 5
h to reach its equilibrium potential. This protocol is repeated until the lower cut-off voltage is
reached. The same protocol is followed in the charging process and the cells are charged until
the upper cut-off voltage is reached.
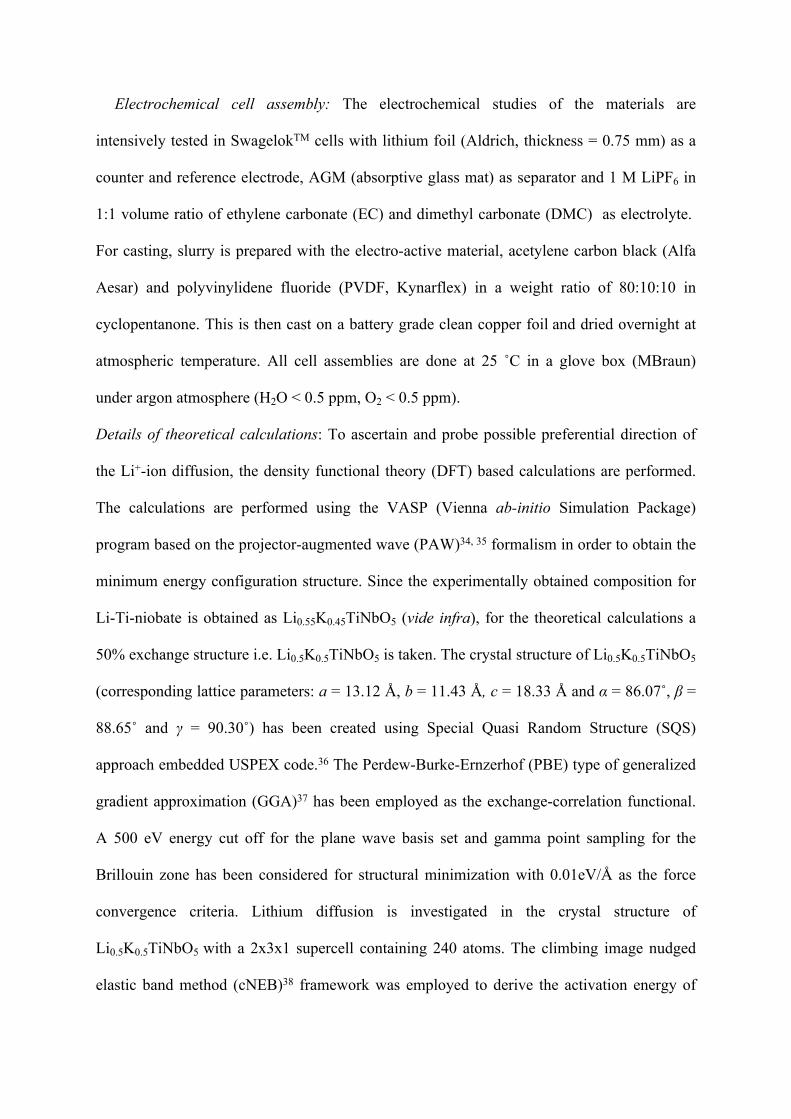
Electrochemical cell assembly: The electrochemical studies of the materials are
intensively tested in SwagelokTM cells with lithium foil (Aldrich, thickness = 0.75 mm) as a
counter and reference electrode, AGM (absorptive glass mat) as separator and 1 M LiPF6 in
1:1 volume ratio of ethylene carbonate (EC) and dimethyl carbonate (DMC) as electrolyte.
For casting, slurry is prepared with the electro-active material, acetylene carbon black (Alfa
Aesar) and polyvinylidene fluoride (PVDF, Kynarflex) in a weight ratio of 80:10:10 in
cyclopentanone. This is then cast on a battery grade clean copper foil and dried overnight at
atmospheric temperature. All cell assemblies are done at 25 ˚C in a glove box (MBraun)
under argon atmosphere (H2O < 0.5 ppm, O2 < 0.5 ppm).
Details of theoretical calculations: To ascertain and probe possible preferential direction of
the Li+-ion diffusion, the density functional theory (DFT) based calculations are performed.
The calculations are performed using the VASP (Vienna ab-initio Simulation Package)
program based on the projector-augmented wave (PAW)34, 35 formalism in order to obtain the
minimum energy configuration structure. Since the experimentally obtained composition for
Li-Ti-niobate is obtained as Li0.55K0.45TiNbO5 (vide infra), for the theoretical calculations a
50% exchange structure i.e. Li0.5K0.5TiNbO5 is taken. The crystal structure of Li0.5K0.5TiNbO5
(corresponding lattice parameters: a = 13.12 Å, b = 11.43 Å, c = 18.33 Å and α = 86.07˚, β =
88.65˚ and γ = 90.30˚) has been created using Special Quasi Random Structure (SQS)
approach embedded USPEX code.36 The Perdew-Burke-Ernzerhof (PBE) type of generalized
gradient approximation (GGA)37 has been employed as the exchange-correlation functional.
A 500 eV energy cut off for the plane wave basis set and gamma point sampling for the
Brillouin zone has been considered for structural minimization with 0.01eV/Å as the force
convergence criteria. Lithium diffusion is investigated in the crystal structure of
Li0.5K0.5TiNbO5 with a 2x3x1 supercell containing 240 atoms. The climbing image nudged
elastic band method (cNEB)38 framework was employed to derive the activation energy of

each considered Li+ migration pathway with a sufficient number of images. The diffusion
coefficient for each pathway is, then, evaluated as where d is the average D d 20 exp Ea
kbT
hop distance, is the attempt frequency, is the activation energy, is the Boltzmann 0 Ea kb
constant and T is the temperature.
Table-S1: Comparison of 2and d-spacing value of (00l) peaks of KTiNbO5 and Li-Ti-niobate.
KTiNbO5 Li-Ti-niobate Difference in
2 d value/Ǻ 2 d value/Ǻ 2 d value/Ǻ
(002) 9.5 9.2 9.3 9.5 0.2 0.2
(004) 19.2 4.6 18.8 4.7 0.4 0.1
Fig. S1. ICP-OES results for elemental compositions of Li-Ti-niobate

Fig. S2 Indexing of FFT pattern of HRTEM image shown in Figure 3d
Fig. S3 Equilibrium potential versus √t plot

Fig. S4 (a), (b) and (c) are the HRTEM images showing lattice fringes (the FFT patterns are shown as inset of the respective image) of Li-Ti-niobate. (d), (e) and (f) are the images (inverse FFT patterns) generated by extracting only the (002), (200) and (020) planes respectively from the FFT patterns in (a), (b) and (c) respectively. Insets in (d-f) represent patterns that are masked to obtain the respective inverse FFT patterns.
Fig. S5 A zoomed-in view of cyclic voltammogram of Li-Ti-Niobate. Peaks at 2.4 V and 2.65 V correspond to the Nb5+ | Nb4+ and Nb4+ | Nb5+ redox processes.

Fig. S6 (a-d) are the derivative plot of cathodic scan of (1-4) cycles respectively. The vertical line at around 0.65 V indicates the formation of Ti2+ over the cycles
Fig. S7 GITT curve of Li-Ti-niobate versus Li+|Li electrode in the voltage range 1-3V

Fig. S8 TEM image of (a) d- Li-Ti-niobate and (b) cd-Li-Ti-niobate.
Fig. S9 Capacity vs cycle no. plot of d- Li-Ti-niobate (without carbon coating) in the voltage range 0.2-2.75 V at C/10 current.

Fig. S10 Coulombic efficiency of Li-Ti-niobate in two different voltage range and downsized carbon coated Li-Ti-niobate.
Related Documents