S1 Supporting Information for The effect of permodified cyclodextrins encapsulation on the photophysical properties of a polyfluorene with randomly distributed electron-donor and rotaxane electron-acceptor units Aurica Farcas 1 *, Ana-Maria Resmerita 1 , Pierre-Henri Aubert 2 , Flavian Farcas 3 , Iuliana Stoica 1 and Anton Airinei 1 Address: 1 Inorganic Polymers, ‘‘Petru Poni’’ Institute of Macromolecular Chemistry, Grigore Ghica Voda Alley, 700487 Iasi, Romania, 2 Laboratoire de Physicochimie des Polymères et des Interfaces (EA 2528), Institut des Matériaux, Université de Cergy- Pontoise, F-95031 Cergy-Pontoise Cedex, France and 3 “Gh. Asachi” Technical University, 61–63 Mangeron Blvd, 700050 Iasi, Romania Email: Aurica Farcas - [email protected] * Corresponding author Characterization data of the compounds: FTIR, 1 H NMR, fluorescence lifetimes and the diagram with HOMO/LUMO energy levels of the copolymers

Welcome message from author
This document is posted to help you gain knowledge. Please leave a comment to let me know what you think about it! Share it to your friends and learn new things together.
Transcript

S1
Supporting Information
for
The effect of permodified cyclodextrins encapsulation
on the photophysical properties of a polyfluorene with
randomly distributed electron-donor and rotaxane
electron-acceptor units
Aurica Farcas1*, Ana-Maria Resmerita1, Pierre-Henri Aubert2, Flavian Farcas3, Iuliana
Stoica1 and Anton Airinei1
Address: 1 Inorganic Polymers, ‘‘Petru Poni’’ Institute of Macromolecular Chemistry,
Grigore Ghica Voda Alley, 700487 Iasi, Romania, 2 Laboratoire de Physicochimie des
Polymères et des Interfaces (EA 2528), Institut des Matériaux, Université de Cergy-
Pontoise, F-95031 Cergy-Pontoise Cedex, France and 3“Gh. Asachi” Technical
University, 61–63 Mangeron Blvd, 700050 Iasi, Romania
Email: Aurica Farcas - [email protected]
* Corresponding author
Characterization data of the compounds: FTIR, 1H NMR, fluorescence lifetimes
and the diagram with HOMO/LUMO energy levels of the copolymers
S2
Table of Contents
FTIR spectrum of TMS-β-CD macrocyclic molecule S2
1H NMR spectrum of TMS-β-CD macrocyclic molecule S4
FTIR spectra of the reference 4, 4a and 4b polyrotaxane copolymers S5
1H NMR spectrum of the non-rotaxane 4 copolymer S6
1H NMR spectrum of the polyrotaxane 4b copolymer S7
The fluorescence lifetime of the non-rotaxane 4 copolymer S8
The fluorescence lifetime of the polyrotaxane 4b copolymer S8
The diagram with HOMO/LUMO levels S9
References S10
S1. FTIR spectrum of TMS-β-CD macrocyclic molecule
The total silylation of native β-CD and -CD was proved using FTIR and H NMR
spectroscopy of the resulting TMS-β-CD and TMS--CD macrocyclic compounds, see
Figures S1 and S2.
S3
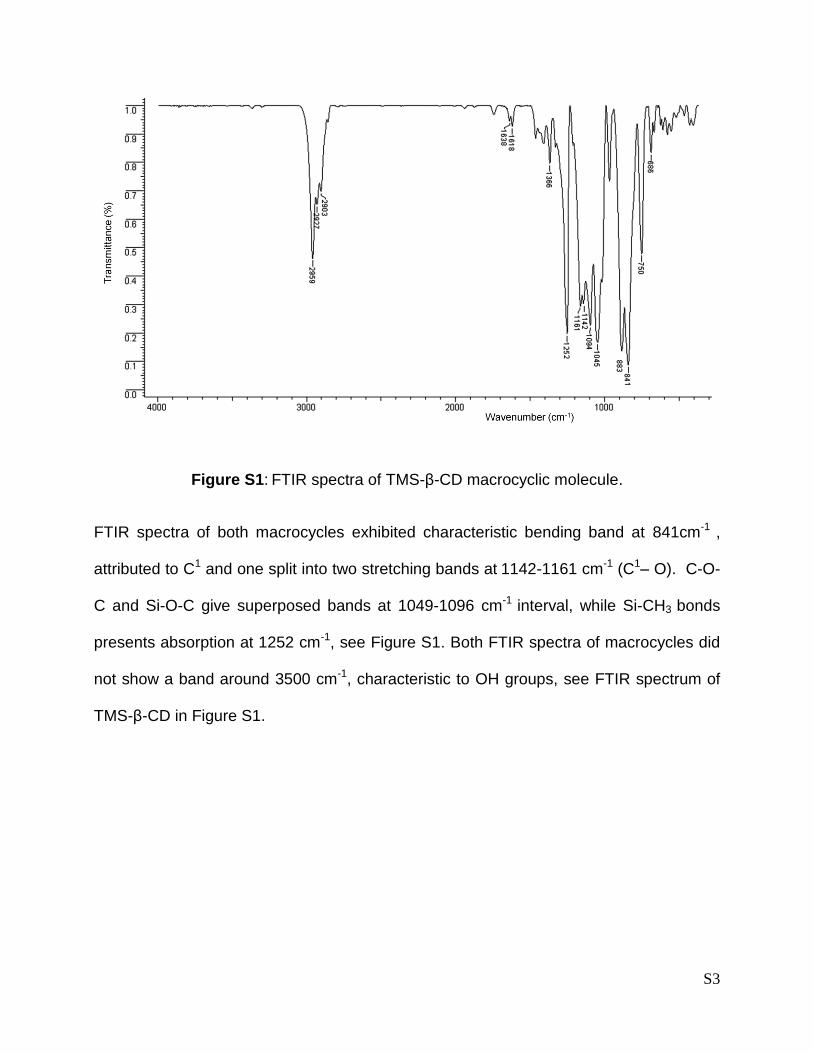
Figure S1: FTIR spectra of TMS-β-CD macrocyclic molecule.
FTIR spectra of both macrocycles exhibited characteristic bending band at 841cm-1 ,
attributed to C1 and one split into two stretching bands at 1142-1161 cm-1 (C1– O). C-O-
C and Si-O-C give superposed bands at 1049-1096 cm-1 interval, while Si-CH3 bonds
presents absorption at 1252 cm-1, see Figure S1. Both FTIR spectra of macrocycles did
not show a band around 3500 cm-1, characteristic to OH groups, see FTIR spectrum of
TMS-β-CD in Figure S1.
S4
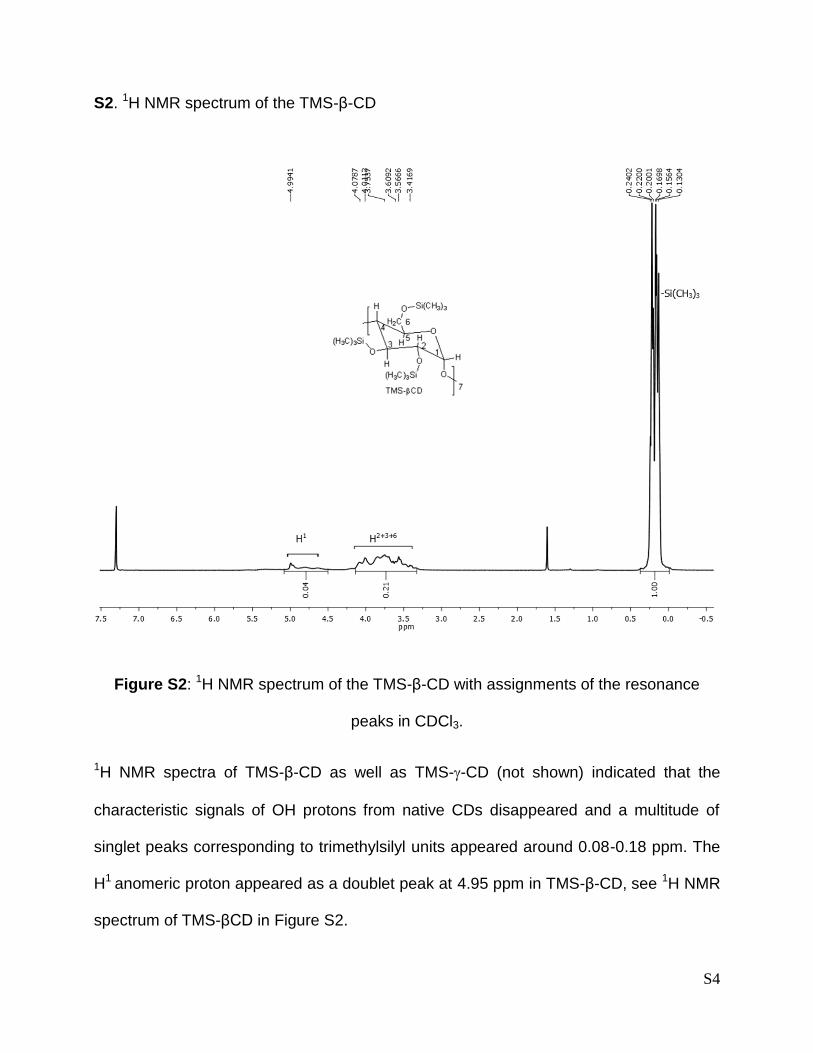
S2. 1H NMR spectrum of the TMS-β-CD
Figure S2: 1H NMR spectrum of the TMS-β-CD with assignments of the resonance
peaks in CDCl3.
1H NMR spectra of TMS-β-CD as well as TMS--CD (not shown) indicated that the
characteristic signals of OH protons from native CDs disappeared and a multitude of
singlet peaks corresponding to trimethylsilyl units appeared around 0.08-0.18 ppm. The
H1 anomeric proton appeared as a doublet peak at 4.95 ppm in TMS-β-CD, see 1H NMR
spectrum of TMS-βCD in Figure S2.

S5
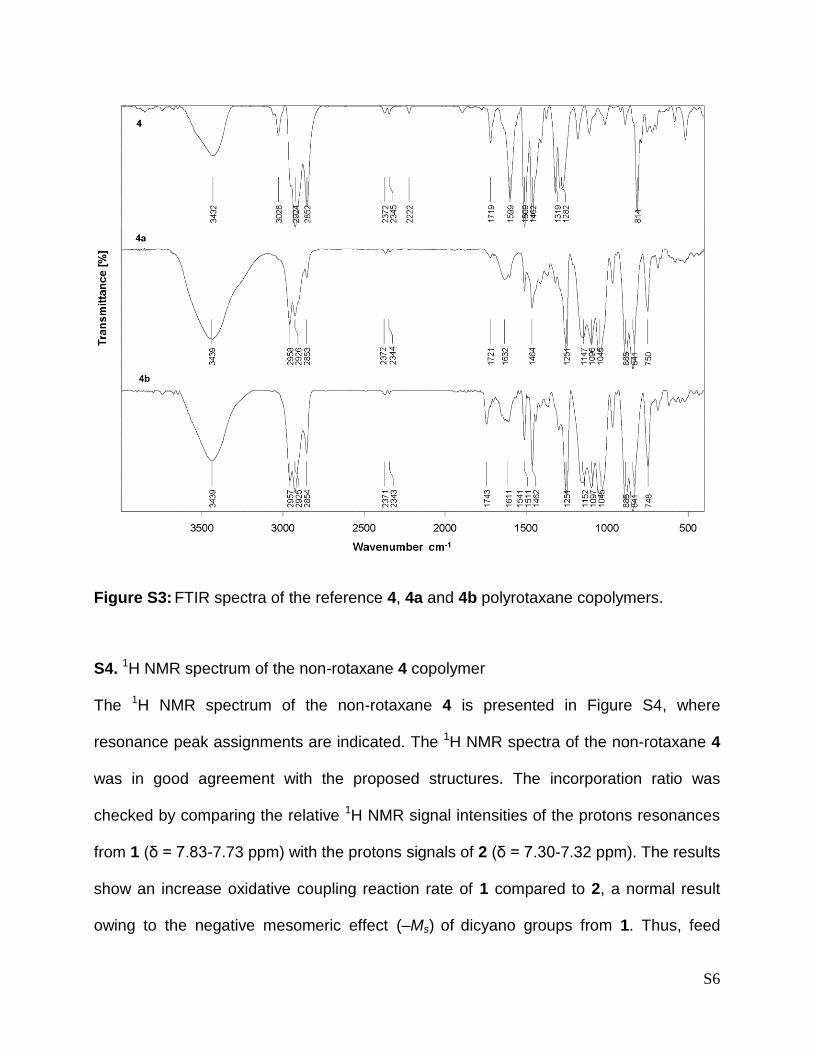
S3. FTIR spectra of the reference 4, 4a and 4b polyrotaxane copolymers
Figure S3 compares the FTIR spectra of the non-rotaxane 4, and polyrotaxanes 4a and
4b. FTIR spectra of all polymers exhibited characteristics stretching vibration at about
2924 cm-1 (aromatic β C-H and ɸ C-H stretching), 2852 cm-1 (aliphatic C-H stretching)
that are shifted towards lower frequencies in the spectra of 4a and 4b encapsulated
compounds. In addition, cyan groups in 4 shows a short band at 2345 cm-1 that is shifted
at 2344 and 2343 cm-1 in the spectra of 4a and 4b polyrotaxanes. Some strong (1719,
1599, 1509, 1462 cm-1) bands of 4 are slightly shifted (2-4 cm-1) to the lower frequencies
in 4a and 4b polyrotaxanes. Surprisingly, in all FTIR spectra can be observed a band at
approximately 3432 cm-1. Therefore, its presence in the FTIR spectra of 4a and 4b
polyrotaxanes (not present in the FTIR spectra of TMS-β-CD and TMS--CD
macrocycles), can not be attributed to the partial removal of the trimethylsilyl groups
during synthesis or purification. The authors would rather suggest the presence of a
small amount of water that was not properly removed during the drying of polymer
samples, which can be responsible for the presence of this band in the FTIR spectra of
all copolymers.
S6
Figure S3: FTIR spectra of the reference 4, 4a and 4b polyrotaxane copolymers.
S4. 1H NMR spectrum of the non-rotaxane 4 copolymer
The 1H NMR spectrum of the non-rotaxane 4 is presented in Figure S4, where
resonance peak assignments are indicated. The 1H NMR spectra of the non-rotaxane 4
was in good agreement with the proposed structures. The incorporation ratio was
checked by comparing the relative 1H NMR signal intensities of the protons resonances
from 1 (δ = 7.83-7.73 ppm) with the protons signals of 2 (δ = 7.30-7.32 ppm). The results
show an increase oxidative coupling reaction rate of 1 compared to 2, a normal result
owing to the negative mesomeric effect (–Ms) of dicyano groups from 1. Thus, feed
S7
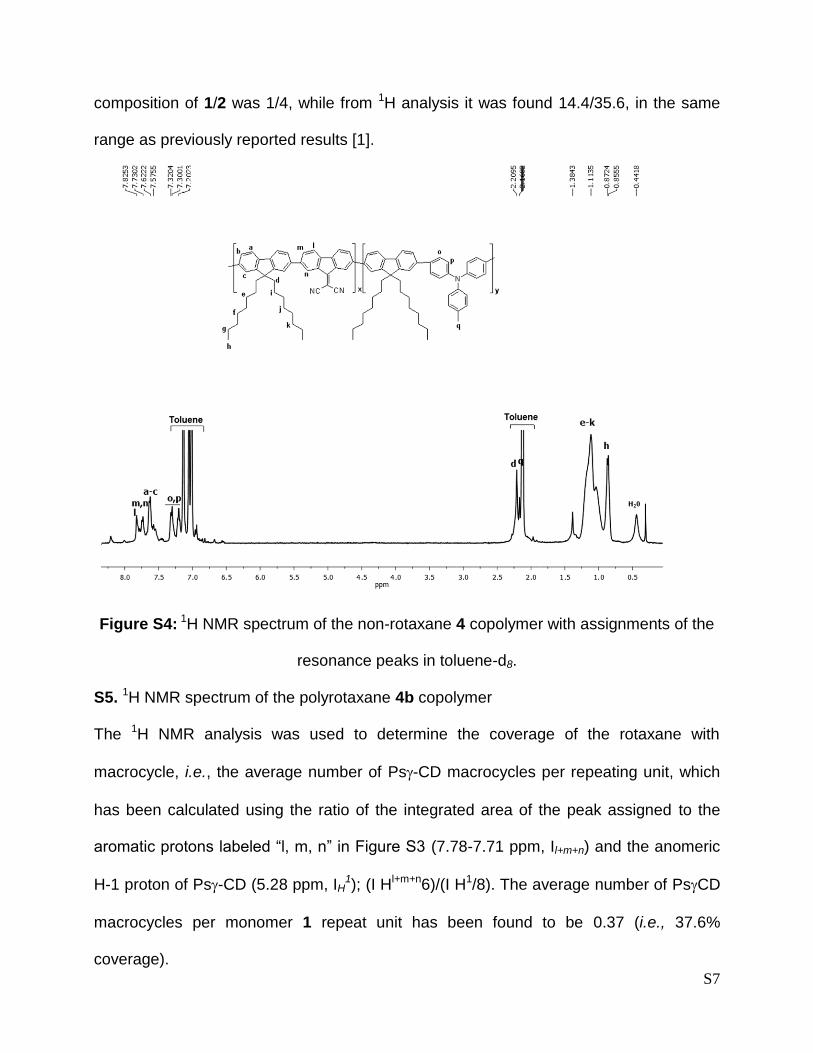
composition of 1/2 was 1/4, while from 1H analysis it was found 14.4/35.6, in the same
range as previously reported results [1].
Figure S4: 1H NMR spectrum of the non-rotaxane 4 copolymer with assignments of the
resonance peaks in toluene-d8.
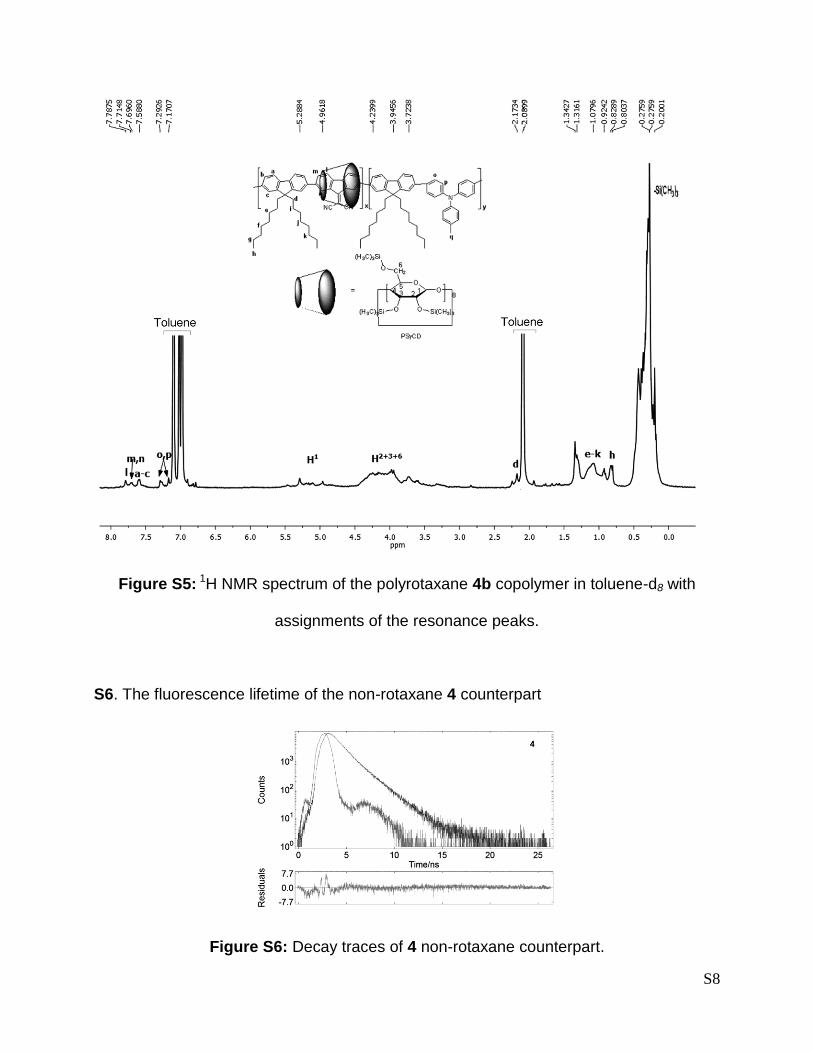
S5. 1H NMR spectrum of the polyrotaxane 4b copolymer
The 1H NMR analysis was used to determine the coverage of the rotaxane with
macrocycle, i.e., the average number of Ps-CD macrocycles per repeating unit, which
has been calculated using the ratio of the integrated area of the peak assigned to the
aromatic protons labeled “l, m, n” in Figure S3 (7.78-7.71 ppm, Il+m+n) and the anomeric
H-1 proton of Ps-CD (5.28 ppm, IH1); (I Hl+m+n6)/(I H1/8). The average number of PsCD
macrocycles per monomer 1 repeat unit has been found to be 0.37 (i.e., 37.6%
coverage).
S8
Figure S5: 1H NMR spectrum of the polyrotaxane 4b copolymer in toluene-d8 with
assignments of the resonance peaks.
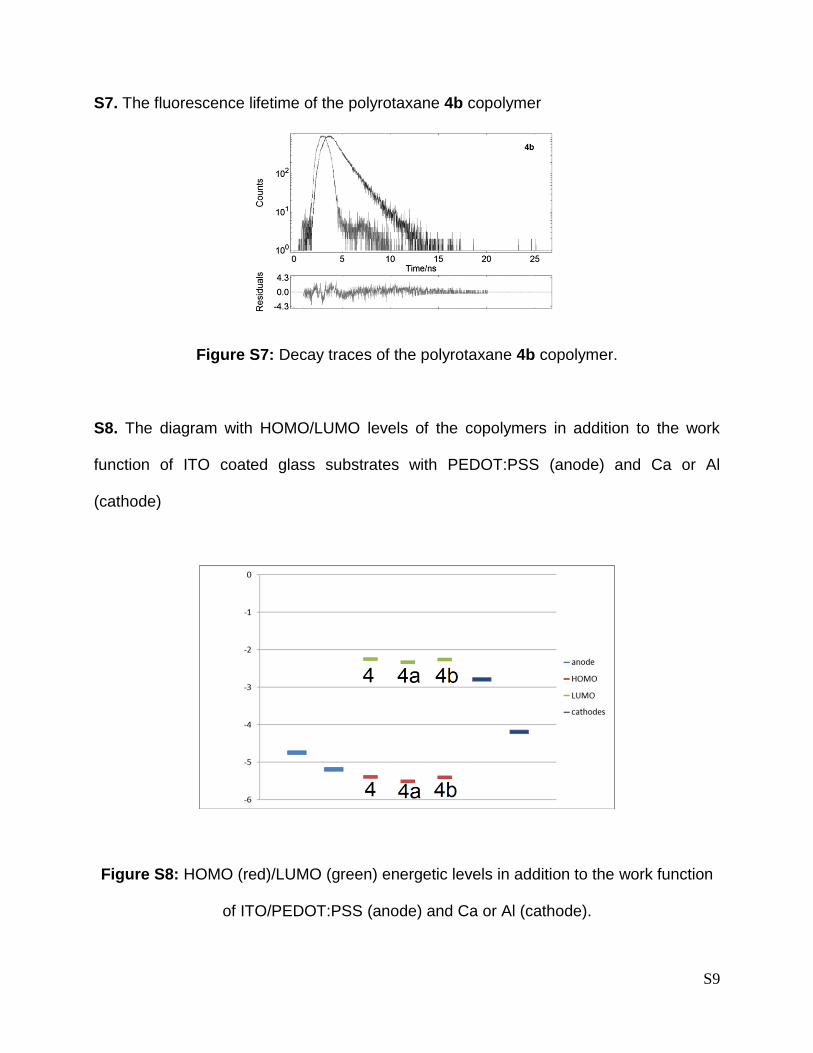
S6. The fluorescence lifetime of the non-rotaxane 4 counterpart
Figure S6: Decay traces of 4 non-rotaxane counterpart.
S9
S7. The fluorescence lifetime of the polyrotaxane 4b copolymer
Figure S7: Decay traces of the polyrotaxane 4b copolymer.
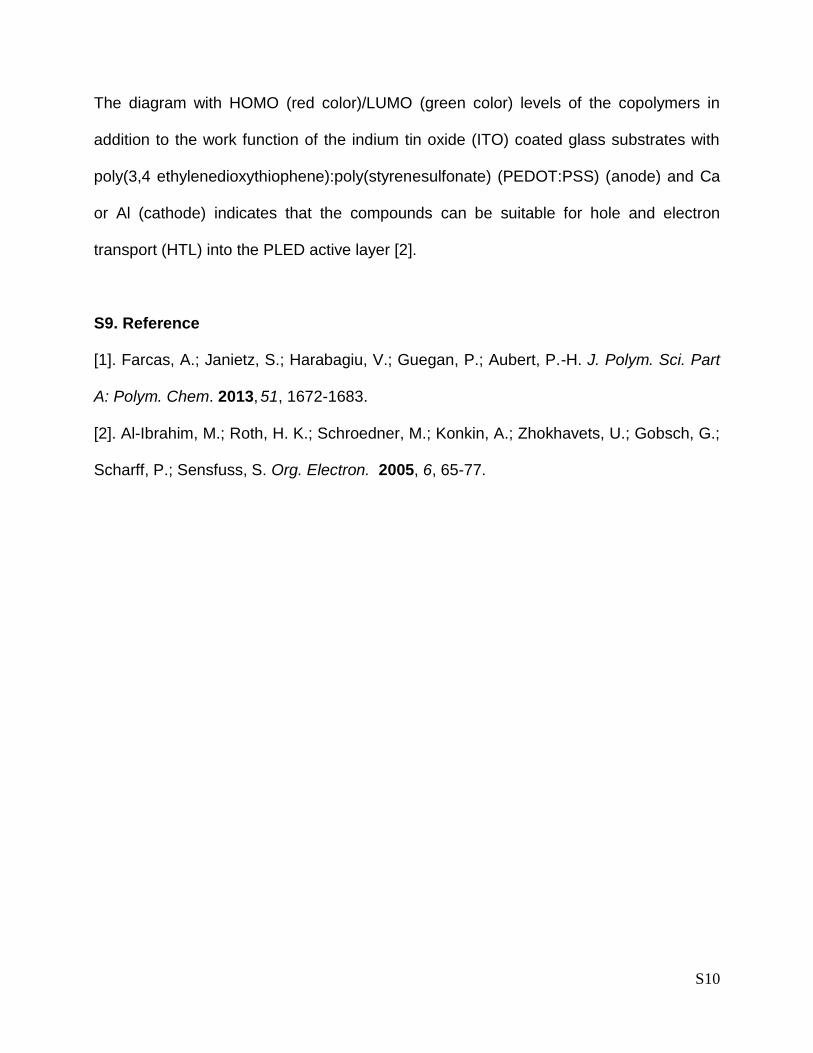
S8. The diagram with HOMO/LUMO levels of the copolymers in addition to the work
function of ITO coated glass substrates with PEDOT:PSS (anode) and Ca or Al
(cathode)
Figure S8: HOMO (red)/LUMO (green) energetic levels in addition to the work function
of ITO/PEDOT:PSS (anode) and Ca or Al (cathode).
S10
The diagram with HOMO (red color)/LUMO (green color) levels of the copolymers in
addition to the work function of the indium tin oxide (ITO) coated glass substrates with
poly(3,4 ethylenedioxythiophene):poly(styrenesulfonate) (PEDOT:PSS) (anode) and Ca
or Al (cathode) indicates that the compounds can be suitable for hole and electron
transport (HTL) into the PLED active layer [2].
S9. Reference
[1]. Farcas, A.; Janietz, S.; Harabagiu, V.; Guegan, P.; Aubert, P.-H. J. Polym. Sci. Part
A: Polym. Chem. 2013, 51, 1672-1683.
[2]. Al-Ibrahim, M.; Roth, H. K.; Schroedner, M.; Konkin, A.; Zhokhavets, U.; Gobsch, G.;
Scharff, P.; Sensfuss, S. Org. Electron. 2005, 6, 65-77.
Related Documents


