Supporting Information A bestatin-based chemical biology strategy reveals distinct roles for malarial M1- and M17-family aminopeptidases Michael B. Harbut 1 , Geetha Velmourougane 1 , Seema Dalal 2 , Gilana Reiss 1 , James Whisstock 3 , Ozlem Onder 4 , Dustin Brisson 4 , Sheena McGowan 3 , Michael Klemba 2 , and Doron C. Greenbaum 1 * 1 Department of Pharmacology, University of Pennsylvania, 433 S. University Avenue, 304G Lynch Laboratories, Philadelphia, PA 19104-6018, USA. 2 Department of Biochemistry, Virginia Polytechnic Institute and State University, 306 Engel Hall, Blacksburg, VA 24061 3 Department of Biochemistry and Molecular Biology and Australian Research Council Centre of Excellence in Structural and Functional Microbial Genomics, Monash University, Clayton, VIC 3800, Australia. 4 Department of Biology, University of Pennsylvania, 326 Leidy Laboratory, Philadelphia, PA 19104.

Welcome message from author
This document is posted to help you gain knowledge. Please leave a comment to let me know what you think about it! Share it to your friends and learn new things together.
Transcript

Supporting Information
A bestatin-based chemical biology strategy reveals distinct roles for
malarial M1- and M17-family aminopeptidases
Michael B. Harbut 1, Geetha Velmourougane1, Seema Dalal2, Gilana Reiss1,
James Whisstock3, Ozlem Onder4, Dustin Brisson4, Sheena McGowan3, Michael
Klemba2, and Doron C. Greenbaum1*
1Department of Pharmacology, University of Pennsylvania, 433 S. University
Avenue, 304G Lynch Laboratories, Philadelphia, PA 19104-6018, USA.
2Department of Biochemistry, Virginia Polytechnic Institute and State University,
306 Engel Hall, Blacksburg, VA 24061
3Department of Biochemistry and Molecular Biology and Australian Research
Council Centre of Excellence in Structural and Functional Microbial Genomics,
Monash University, Clayton, VIC 3800, Australia.
4Department of Biology, University of Pennsylvania, 326 Leidy Laboratory,
Philadelphia, PA 19104.
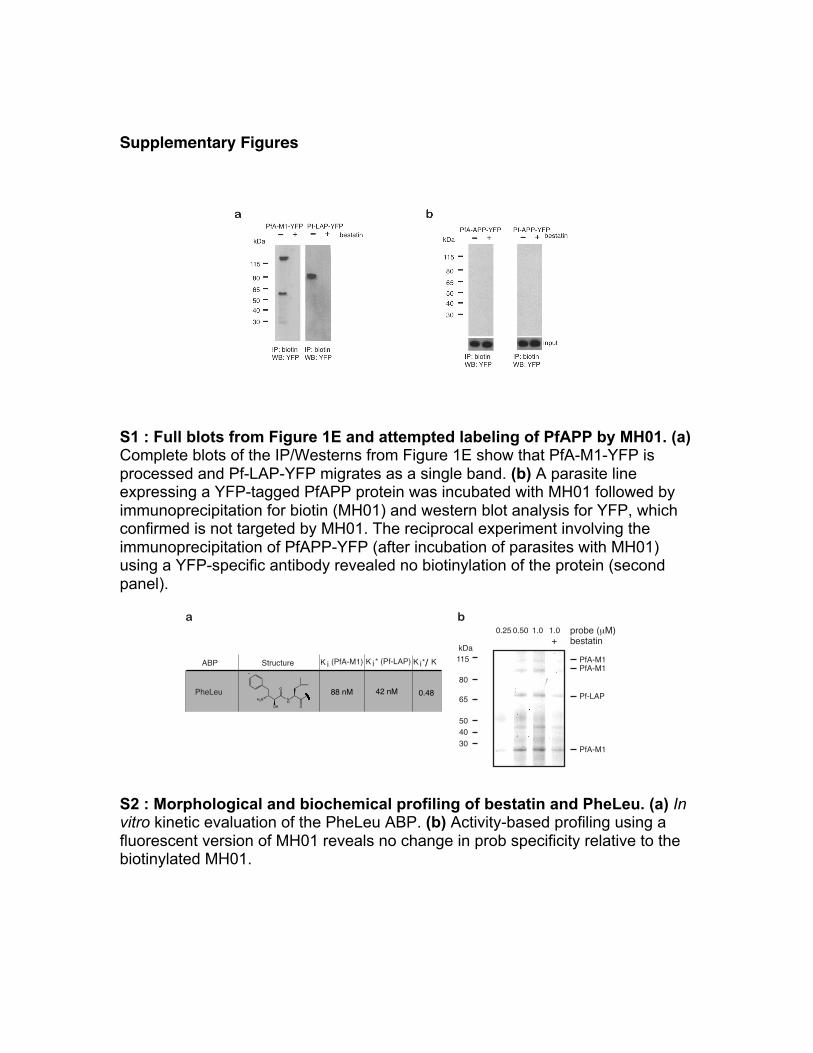
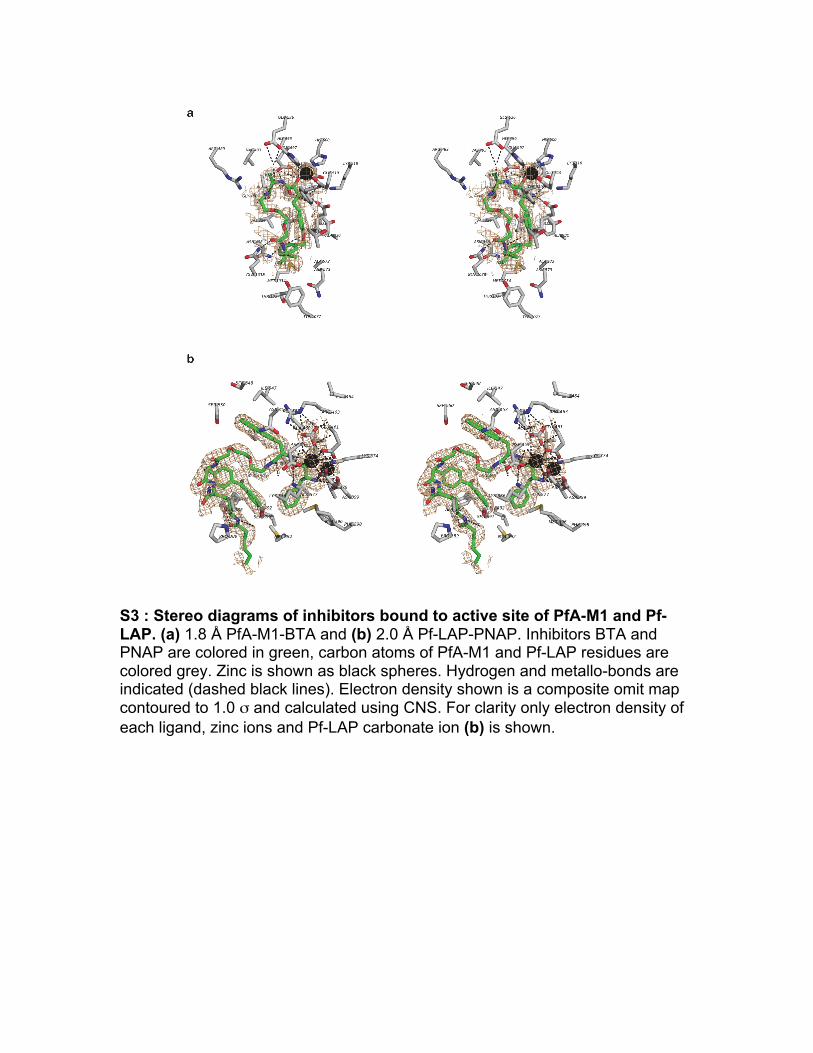
Supplementary Figures S1 : Full blots from Figure 1E and attempted labeling of PfAPP by MH01. (a) Complete blots of the IP/Westerns from Figure 1E show that PfA-M1-YFP is processed and Pf-LAP-YFP migrates as a single band. (b) A parasite line expressing a YFP-tagged PfAPP protein was incubated with MH01 followed by immunoprecipitation for biotin (MH01) and western blot analysis for YFP, which confirmed is not targeted by MH01. The reciprocal experiment involving the immunoprecipitation of PfAPP-YFP (after incubation of parasites with MH01) using a YFP-specific antibody revealed no biotinylation of the protein (second panel). S2 : Morphological and biochemical profiling of bestatin and PheLeu. (a) In vitro kinetic evaluation of the PheLeu ABP. (b) Activity-based profiling using a fluorescent version of MH01 reveals no change in prob specificity relative to the biotinylated MH01.
a
30
40
115
80
50
kDa
65
b
0.25 0.50 1.0 1.0
bestatin+
PfA-M1PfA-M1
PfA-M1
Pf-LAP
probe (µM)
88 nM 42 nMPheLeu
* (Pf-LAP)K i (PfA-M1)K iABP Structure KK i */
0.48H2N
OH
O
NH
O
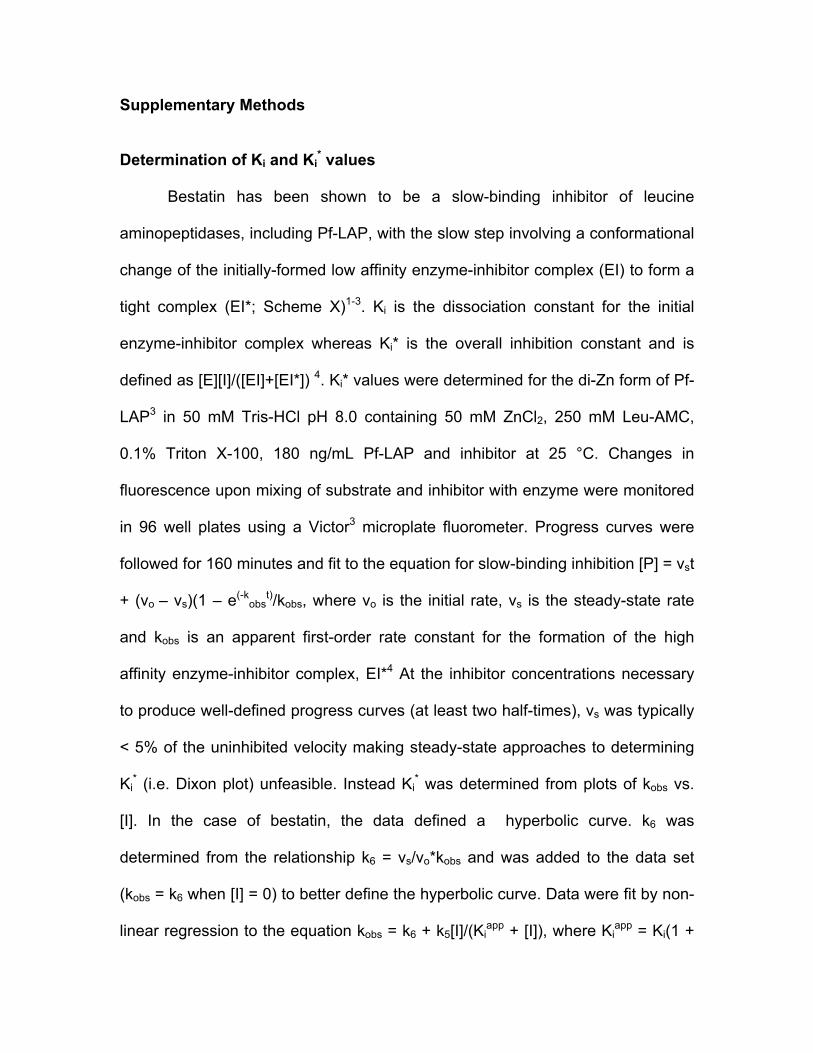
S3 : Stereo diagrams of inhibitors bound to active site of PfA-M1 and Pf-LAP. (a) 1.8 Å PfA-M1-BTA and (b) 2.0 Å Pf-LAP-PNAP. Inhibitors BTA and PNAP are colored in green, carbon atoms of PfA-M1 and Pf-LAP residues are colored grey. Zinc is shown as black spheres. Hydrogen and metallo-bonds are indicated (dashed black lines). Electron density shown is a composite omit map contoured to 1.0 σ and calculated using CNS. For clarity only electron density of each ligand, zinc ions and Pf-LAP carbonate ion (b) is shown.

S4 : Cartoon diagrams of the biologically functional Pf-LAP hexamer colored by chain: A (green); B (cyan); C (wheat); D (yellow); E (salmon); F (grey). (a) The cartoon diagram of PNAP bound to active sites of biological unit of Pf-LAP. PNAP is colored in magenta. Zinc ions are shown as black spheres. (b) cartoon diagram of Pf-LAP-PNAP where chains D-F are excluded to show PNAP binding to active sites of chains A-C that line the interior cavity of the hexamer.
S5 : Bestatin and PheLeu probe treatments do not cause DV swelling. (a) Parasites expressing YFP-tagged plasmepsin II, which localizes to the DV, were treated with bestatin or PheLeu probe (each 10 µM) and imaged by fluorescence microscopy. (b) Quntitation of DV size of the treated PMII-YFP parasites indicates a lack of DV swelling upon treatement with either compound. (c) A concentration-response curve showing the effect of bestatin-treatment on P. falciparum culture in I-Media versus media containing all amino acids.

S6 : DV-localised endoproteases are not inhibited by BTA. Activity assays for falciparin 2/2’, DPAP1 and PfAPP show that no inhibition occurs at 30 µM BTA. S7 : Inhibition of PfA-M1 causes DV swelling but does not prevent proteoytic cleavage of full length Hb. Parasites treated with BTA (1 mM) and PNAP (0.25 mM) are capable of initiating Hb degradation, as shown by an absence of full length Hb subunits (17 kDa) in both untreated and BTA-treated parasites, in contrast to parasites treated with E64-d, which disrupts the initial endoproteolytic cleavage of Hb.

S8 : Small dipeptide species accumulate in BTA-treated parasites. (a) The LC trace identifies a peak that increases in the lysates of BTA-treated parasites. (b)The MS profile identifies the species with a molecular weight of 282 Da, which may corresponds to a Thr-Tyr dipeptide from Hb. Another MS trace identifies a putative Hb-derived His-Lys dipeptide, with a molecular weight of 283. (d) A table of the putative dipeptides species identified in BTA-treated parasites.

Supplementary Table 1 | Data Collection and refinement statistics
aValues in parentheses refer to the highest resolution shell.
bAgreement between intensities of repeated measurements of the same reflections and can be defined as: ∑(Ih,i – <Ih>)/∑ Ih,i, where Ih,i are individual values and < Ih > is the mean value of the intensity of reflection h.
Data collection rPfA-M1_BTA Pf-LAP-PNAP Space Group P212121 P212121 Cell dimensions (Å) a=75.5, b=108.8,
c=118.3, b=90.0°
a=173.8, b=177.1, c=231.2, b=90.0°
Resolution (Å) 46.57 – 1.8 (1.90- 1.80)
88.64 – 2.0 (2.11 – 2.0)
Total number of observations
1109709 5836680
Number of unique observations
90083 477295
Multiplicity 12.3 (11.4) 12.2 (12.2) Data Completeness (%) 99.1 (96.6) 100.0 (100.0) <I/σI> 14.7 (2.3) 6.3 (2.1)
Rpim(%)b
4.2 (30.5) 10.9 (43.4)
Structurerefinement
Nonhydrogenatoms
Protein 7233 47062
Solvent 1006 4536 Ligand 40 876 Zn2+ ions 1 24 PEG/SO4 - 512 Rfree (%) 19.8 20.0 Rcryst (%) 16.0 16.4 Bond lengths (Å) 0.01 0.01 Bond angles (°) 0.99 1.09 Ramachandran plot Favoured (%) Allowed (%)
98.4 100.0
98.3 99.9
B factors (Å2) Mean main chain 16.6 16.3 Mean side chain 21.8 22.4 Mean ligand 42.4 53.0 Mean water molecule 32.2 28.2 r.m.s.d. bonded Bs Main chain Side chain
1.61 3.94
1.80 4.47
Supplementary Methods Determination of Ki and Ki
* values
Bestatin has been shown to be a slow-binding inhibitor of leucine
aminopeptidases, including Pf-LAP, with the slow step involving a conformational
change of the initially-formed low affinity enzyme-inhibitor complex (EI) to form a
tight complex (EI*; Scheme X)1-3. Ki is the dissociation constant for the initial
enzyme-inhibitor complex whereas Ki* is the overall inhibition constant and is
defined as [E][I]/([EI]+[EI*]) 4. Ki* values were determined for the di-Zn form of Pf-
LAP3 in 50 mM Tris-HCl pH 8.0 containing 50 mM ZnCl2, 250 mM Leu-AMC,
0.1% Triton X-100, 180 ng/mL Pf-LAP and inhibitor at 25 °C. Changes in
fluorescence upon mixing of substrate and inhibitor with enzyme were monitored
in 96 well plates using a Victor3 microplate fluorometer. Progress curves were
followed for 160 minutes and fit to the equation for slow-binding inhibition [P] = vst
+ (vo – vs)(1 – e(-kobs
t)/kobs, where vo is the initial rate, vs is the steady-state rate
and kobs is an apparent first-order rate constant for the formation of the high
affinity enzyme-inhibitor complex, EI*4 At the inhibitor concentrations necessary
to produce well-defined progress curves (at least two half-times), vs was typically
< 5% of the uninhibited velocity making steady-state approaches to determining
Ki* (i.e. Dixon plot) unfeasible. Instead Ki
* was determined from plots of kobs vs.
[I]. In the case of bestatin, the data defined a hyperbolic curve. k6 was
determined from the relationship k6 = vs/vo*kobs and was added to the data set
(kobs = k6 when [I] = 0) to better define the hyperbolic curve. Data were fit by non-
linear regression to the equation kobs = k6 + k5[I]/(Kiapp + [I]), where Ki
app = Ki(1 +

[S]/Km). Under our assay conditions the Km for Leu-AMC was 1.1 mM. Ki* was
calculated from the relationship Ki* = k6Ki/(k5 + k6) where Ki and (k5 + k6) were
determined from curve fits and k6 was determined as described above. For
bestatin probe, Phe-Ala probe and BTA probe, plots of kobs vs. [I] were linear, a
situation that can arise if Ki is much greater than the inhibitor concentrations used
in the assays3,5. In these cases kobs vs. [I] plots were fit by linear regression
yielding a slope of k6/Ki*app; determination of k6 as described above enabled
calculation of Ki*app and thus Ki*. With BTA probe, the combination of low affinity
for Pf-LAP and insolubility at high micromolar concentrations restricted the range
of kobs values that could be determined compared to those for bestatin and Phe-
Ala probes. However, sufficient data were available to allow an estimate for the
Ki* value to be made.
Scheme 1:
k3 k5 E + I EI EI*
k4 k6
X-ray Crystallography
Diffraction images were processed using MOSFLM6 and SCALA7 from the CCP4
suite8. 5% of each dataset was flagged for calculation of RFree9 with neither a
sigma nor a low-resolution cut-off applied to the data. Subsequent
crystallographic and structural analysis was performed using the CCP4i
interface10 to the CCP4 suite8, unless stated otherwise. The inhibitor complex
was initially solved and refined against the unbound PfA-M1 and Pf-LAP

structure (protein atoms only) as described previously11 and clearly showed
unbiased features in the active site for both structures. Superposition of BTA into
the Pf-LAP active site was performed using the X-ray crystal structure of Pf-LAP-
bestatin (3KR4.pdb) where the bestatin scaffold was used to superpose BTA.
Superposition of PNAP into the PfA-M1 active site was performed using the X-
ray crystal structure of PfA-M1-bestatin (3EBH.pdb) where the bestatin scaffold
was used to superpose PNAP. Pymol12 was used to produce structural
representations (http://www.pymol.org). Hydrogen bonds (excluding water-
mediated bonds) were calculated using Lig_contact and CONTACT8. CCP4MG
was used to produce electrostatic diagrams10. Lys and Arg residues were
assigned a single positive charge, and Asp and Glu residues were assigned a
single negative charge; all other residues were considered neutral. The
calculation was done assuming a uniform dielectric constant of 80 for the solvent
and 2 for the protein interior. The ionic strength was set to zero. The color of the
surface represents the electrostatic potential at the protein surface, going from
blue (potential of +10 kT/e) to red (potential of -10 kT/e), where T is temperature,
e is the charge of an electron, and k is the Boltzmann constant. The probe
radius used was 1.4 Å. The coordinates and structure factors will be available
from the Protein Data Bank (XXX.pdb and XXX.pdb). Raw data and images will
be available from TARDIS13 (www.tardis.edu.au).
Fluorescence imaging
Trophozoite state parasites were treated for 12 hr with the compounds and

concentrations as shown in the figure. Images were obtained using a Leica
DMI6000 B microscope and Leica LAS AF software. Parasite and DV sizes were
quantified using ImageJ.
Mass spectrometry-based peptide profiling
No reduction and alkylation was performed. The resulting peptide extracts
were desalted and concentrated on ZipTip (Millipore) according to manufacturer’s
instruction and then analyzed by nanoLC-MS/MS using an LCQ Deca XP Plus
ion trap mass spectrometer equipped with a nanoelectrospray ion source
(Thermo Fisher Scientific Inc., San Jose, CA) coupled to an Ultimate Nano liquid
chromatography system (Dionex Corporation, Sunnyvale, CA). Fully automated
analyte sampling, chromatography, and production and acquisition of MS and
MS-MS data were performed essentially as described earlier14 with slight
modifications. A Famos 48-well plate autosampler (Dionex) was used to sample
the peptide extract in batch mode with a user-defined program to withdraw 1 µl
from each sample. The aqueous buffer (A) (5% acetonitrile in water containing
0.1% formic acid) and the organic buffer (B) (80% acetonitrile in water containing
0.1% formic acid) were delivered by an Ultimate (Dionex) micropump as follows:
5% B in the first 6 min, 5 to 50% B from 6 to 96 min, 50 to 95% B from 96 to 97
min, 95% B from 97 to 101 min, 95 to 5% B from 101 to 102 min, and 5% B from
102 to 122 min. The peptide mixture was fractioned on a Dionex PepMap C18
column (75-µm [inner diameter] by 150 mm) with a 3-µm particle size and a 100-
Å-pore diameter. Mass spectrometry scans as well as HPLC solvent gradients

were controlled via the Xcalibur 2.0.7 SP1 software (Thermo Fisher Scientific
Inc.). The eluted peptides were directly introduced into the MS equipment via
nanoESI source. The LCQ DecaXP was operated in a data-dependent mode
where the machine measured intensity of all the ions in the mass range from 200
to 800 (mass-to-charge ratios) and isolated the three most intense ion peaks for
collision-induced dissociation using a normalized collision energy level of 35%.
Dynamic exclusion was enabled at repeat count 2, repeat duration 0.5 min,
exclusion list size 25, exclusion duration 3 min and exclusion mass width ±1.5
m/z. Data analysis was accomplished with SEQUEST (BioWorks 3.3.1 SP1,
Thermo Fisher Scientific Inc.) using both hemoglobin a and b sequences.
Following dta generation parameters were used: peptide mass range, 200–800
Da; minimal total ion intensity threshold, 50,000; minimal number of fragment
ions, 15; precursor mass tolerance, 1.4 Da; group scan, 0; group count, 1. “No
enzyme” was selected for database search. Mass tolerance for precursor and
fragment ions was 2 and 1.0 Da, respectively. No chemical or posttranslational
modifications were considered.
Peptide Synthesis
The peptide VDPENF was synthesized on an Argonaut synthesizer using
standard Fmoc solid phase peptide synthesis on Rink-amide resin. Peptides
were purchased from Bachem (Switzerland). Rink-amide resin (0.69 mmol/g)
was purchased from Novabiochem (San Diego, CA). All other chemicals and
reagents were purchased from Fisher Scientific (Pittsbrugh, PA). Peptide

assembly was performed using HBTU (2-(1H—benzotriazole-1-yl)-1,1,3,3-
tetramethyluronium hexafluorophosphate) activation (5 and 10 equivalents
respectively) of amino acids (5 eq) in DIEA (N,N’-diisopropylethylamine) and
NMP (N-methylpyrrolidone). The Fmoc protecting group was removed with 20%
piperidine in DMF, for 5 min. After deprotection and again after amino acid
coupling, the reaction vessel was rinsed 3 times with NMP followed by 3 rinses
with DMF. The N-terminus of the peptide was not capped. The peptide was
cleaved from the resin using 93% TFA (trifluoroacetic acid), 2% TIPS
(triisopropylsilane), and 5% water. The peptide was precipitated twice in 40 mL
cold diethyl ether and dried overnight. To purify, the peptide was dissolved in
95% water, 5% acetonitrile and 0.1% formic acid (Solvent A) and run on a semi-
preparative C18 column on an Agilent HPLC (15% to 35%, Solvent B) (Agilent
Technologies). Pure fractions were confirmed by ES-API (calculated m/z 719.31,
found m/z 719.2).
Synthesis procedures:
I) General method for solid-phase peptide synthesis of bestatin based
ABPs (P1’ library): Standard solid-phase peptide synthesis was performed on
Rink amide resin, using HBTU/HOBt/DIEA in an equimolar ratio in DMF for 30
min at RT. Coupling of the α-hydroxy-β-amino acid required HATU for 1 hr. Each
amino acid was double coupled. Fmoc protecting groups were removed with
20% piperidine/DMF (30 min). The deprotection of the Aloc group was
conducted under a positive flow of argon. The resin was solvated with
dichloromethane for 5 min. The solvent was drained, and PhSiH3 (24 eq.) in
CH2Cl2 was added to the resin followed by Pd(PPh3)4 (0.25 eq.) in CH2Cl2. After
agitating the resin for 1 h by bubbling with argon, the solution was drained, and
the resin was washed with CH2Cl2 (3x). To cleave products from resin, a solution
of 95%TFA:2.5%TIS:2.5%H2O was added to the resin. After standing for 2 h, the
cleavage mixture was collected, and the resin was washed with fresh cleavage
solution (Scheme 1). The combined fractions were evaporated to dryness and
the product was purified by reverse phase-HPLC. Fractions containing product
were pooled and lyophilized. Reverse phase HPLC was conducted on a C18
column using an Agilent 1200 HPLC. Purifications were performed at room
temperature and compounds were eluted with a concentration gradient 0-70% of
acetonitrile (0.1% Formic acid). LC/MS data were acquired using LC/MSD SL
system (Agilent). HRMS was recorded at the UCRiverside mass spectrometry
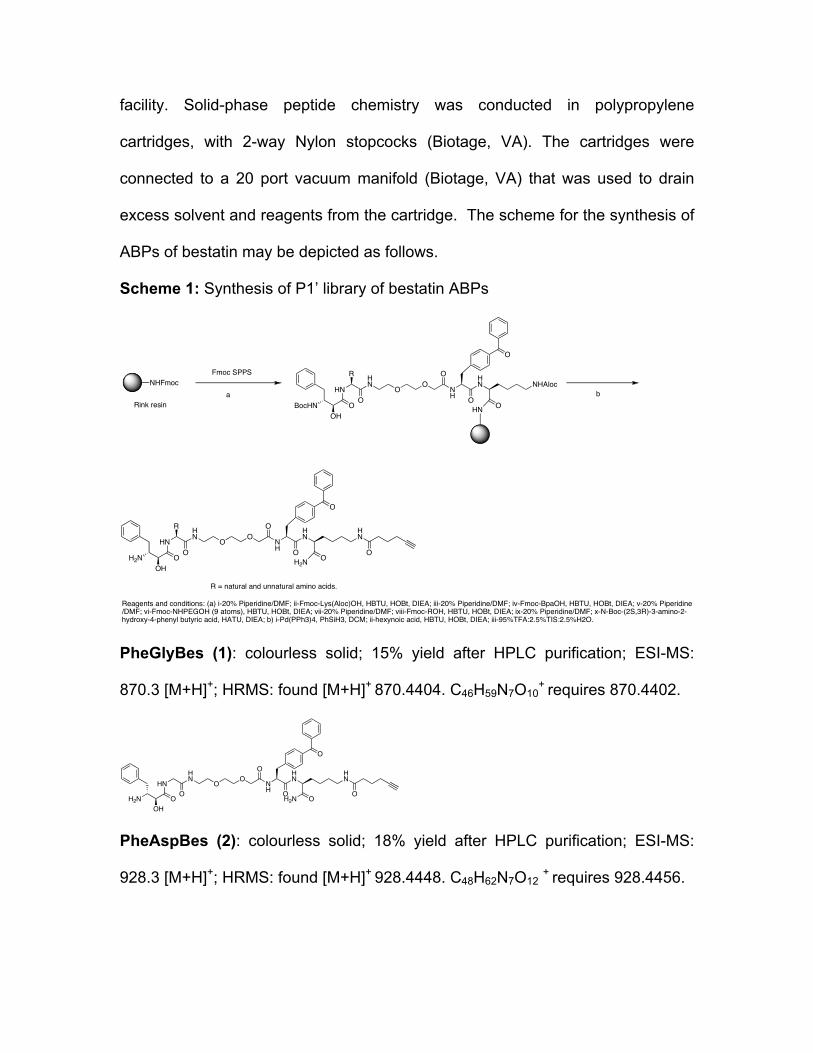
facility. Solid-phase peptide chemistry was conducted in polypropylene
cartridges, with 2-way Nylon stopcocks (Biotage, VA). The cartridges were
connected to a 20 port vacuum manifold (Biotage, VA) that was used to drain
excess solvent and reagents from the cartridge. The scheme for the synthesis of
ABPs of bestatin may be depicted as follows.
Scheme 1: Synthesis of P1’ library of bestatin ABPs
NHFmoc
Rink resina b
Fmoc SPPS
H2NOH
O
HNHN O O
R
ONH
HN
O
O
O
HN
OH2NO
BocHNOH
O
HNHN O O
R
ONH
HN
O
O
O
NHAloc
OHN
R = natural and unnatural amino acids.
Reagents and conditions: (a) i-20% Piperidine/DMF; ii-Fmoc-Lys(Aloc)OH, HBTU, HOBt, DIEA; iii-20% Piperidine/DMF; iv-Fmoc-BpaOH, HBTU, HOBt, DIEA; v-20% Piperidine/DMF; vi-Fmoc-NHPEGOH (9 atoms), HBTU, HOBt, DIEA; vii-20% Piperidine/DMF; viii-Fmoc-ROH, HBTU, HOBt, DIEA; ix-20% Piperidine/DMF; x-N-Boc-(2S,3R)-3-amino-2-hydroxy-4-phenyl butyric acid, HATU, DIEA; b) i-Pd(PPh3)4, PhSiH3, DCM; ii-hexynoic acid, HBTU, HOBt, DIEA; iii-95%TFA:2.5%TIS:2.5%H2O.
PheGlyBes (1): colourless solid; 15% yield after HPLC purification; ESI-MS:
870.3 [M+H]+; HRMS: found [M+H]+ 870.4404. C46H59N7O10+ requires 870.4402.
NH
HN
HN
OOH2NO
OOO
HNHN
OOOH
H2N
O
PheAspBes (2): colourless solid; 18% yield after HPLC purification; ESI-MS:
928.3 [M+H]+; HRMS: found [M+H]+ 928.4448. C48H62N7O12 + requires 928.4456.

NH
HN
HN
OOH2NO
OOO
HNHN
OOOH
H2N
OHOOC
PheHisBes (3): colourless solid; 16% yield after HPLC purification; ESI-MS:
950.3 [M+H]+; HRMS: found [M+H]+ 950.4763. C50H64N9O10 + requires 950.4776.
NH
HN
HN
OOH2NO
OOO
HNHN
OOOH
H2N
ONHN
PheNleBes (4): colourless solid; 16% yield after HPLC purification; ESI-MS:
926.3 [M+H]+; HRMS: found [M+H]+ 926.5032. C50H68N7O10+ requires 926.5028.
NH
HN
HN
OOH2NO
OOO
HNHN
OOOH
H2N
O
PheGlnBes (5): colourless solid; 16% yield after HPLC purification; ESI-MS:
941.3 [M+H]+; HRMS: found [M+H]+ 941.4780. C49H65N8O11+ requires 941.4773.
NH
HN
HN
OOH2NO
OOO
HNHN
OOOH
H2N
OCONH2
PheIleBes (6): colourless solid; 15% yield after HPLC purification; ESI-MS: 926.3
[M+H]+; HRMS: found [M+H]+ 926.5036. C50H68N7O10+ requires 926.5028.
NH
HN
HN
OOH2NO
OOO
HNHN
OOOH
H2N
O

PhePheBes (7): colourless solid; 18% yield after HPLC purification; ESI-MS:
960.3 [M+H]+; HRMS: found [M+H]+ 960.4863. C53H66N7O10+ requires 960.4871.
NH
HN
HN
OOH2NO
OOO
HNHN
OOOH
H2N
O
PheLeuBes (8): colourless solid; 18% yield after HPLC purification; ESI-MS:
926.3 [M+H]+; HRMS: found [M+H]+ 926.5004. C50H68N7O10+ requires 926.5028.
NH
HN
HN
OOH2NO
OOO
HN
OOOH
H2N
O
HN
PheGluBes (9): colourless solid; 16% yield after HPLC purification; ESI-MS:
942.3 [M+H]+; HRMS: found [M+H]+ 942.4617. C49H64N7O12 + requires 942.4613.
NH
HN
HN
OOH2NO
OOO
HNHN
OOOH
H2N
OCOOH
PheAsnBes (10): colourless solid; 18% yield after HPLC purification; ESI-MS:
927.2 [M+H]+; HRMS: found [M+H]+ 927.4619. C48H63N8O11+ requires 927.4616.
NH
HN
HN
OOH2NO
OOO
HNHN
OOOH
H2N
OH2NOC
PheThrBes (11): colourless solid; 20% yield after HPLC purification; ESI-MS:
914.3 [M+H]+; HRMS: found [M+H]+ 914.4661. C48H64N7O11+ requires 914.4664.

NH
HN
HN
OOH2NO
OOO
HNHN
OOOH
H2N
OOH
PheProBes (12): colourless solid; 19% yield after HPLC purification; ESI-MS:
910.3 [M+H]+; HRMS: found [M+H]+ 910.4693. C49H64N7O10+ requires 910.4715.
NH
HN
HN
OOH2NO
OOO
HN
OOOH
H2N
O
N
PheValBes (13): colourless solid; 18% yield after HPLC purification; ESI-MS:
912.3 [M+H]+; HRMS: found [M+H]+ 912.4884. C49H66N7O10+ requires 912.4871.
NH
HN
HN
OOH2NO
OOO
HNHN
OOOH
H2N
O
PheSerBes (14): colourless solid; 15% yield after HPLC purification; ESI-MS:
900.2 [M+H]+; HRMS: found [M+H]+ 900.4508. C47H62N7O11+ requires 900.4507.
NH
HN
HN
OOH2NO
OOO
HNHN
OOOH
H2N
OOH
PheTrpBes (15): colourless solid; 16% yield after HPLC purification; ESI-MS:
999.3 [M+H]+; HRMS: found [M+H]+ 999.4979. C55H67N8O10+ requires 999.4980.

NH
HN
HN
OOH2NO
OOO
HNHN
OOOH
H2N
OHN
PheTyrBes (16): colourless solid; 19% yield after HPLC purification; ESI-MS:
976.3 [M+H]+; HRMS: found [M+H]+ 976.4822. C53H66N7O11+ requires 976.4820.
NH
HN
HN
OOH2NO
OOO
HNHN
OOOH
H2N
OHO
PheAlaBes (17): colourless solid; 18% yield after HPLC purification; ESI-MS:
884.3 [M+H]+; HRMS: found [M+H]+ 884.4511. C47H62N7O10+ requires 884.4558.
NH
HN
HN
OOH2NO
OOO
HNHN
OOOH
H2N
O
PheArgBes (18): colourless solid; 17% yield after HPLC purification; ESI-MS:
969.3 [M+H]+; HRMS: found [M+H]+ 969.5196. C50H69N10O10+ requires 969.5198.
NH
HN
HN
OOH2NO
OOO
HNHN
OOOH
H2N
OHN
H2N NH
PheLysBes (19): colourless solid; 17% yield after HPLC purification; ESI-MS:
941.3 [M+H]+; HRMS: found [M+H]+ 941.5158. C50H69N8O10+ requires 941.5137.

NH
HN
HN
OOH2NO
OOO
HNHN
OOOH
H2N
O
NH2
PheLys(Z)Bes (20): colourless solid 18% yield after HPLC purification; ESI:
1075.3 [M+H]+; HRMS: found [M+H]+ 1075.5522. C58H75N8O12+ requires
1075.5499.
NH
HN
HN
OOH2N
O
OO
OHN
HNO
OOH
H2N
O
HN
O
O
PheBipBes (21): colourless solid 16% yield after HPLC purification; ESI: 1036.3
[M+H]+; HRMS: found [M+H]+ 1036.5198. C59H70N7O10+ requires 1036.5179.
NH
HN
HN
OOH2N
O
OO
OHN
HNO
OOH
H2N
O
PheTyr(Bzl)Bes (22): colourless solid 17% yield after HPLC purification; ESI:
1066.3 [M+H]+; HRMS: found [M+H]+ 1066.5291. C60H72N7O11+ requires
1066.5284.
NH
HN
HN
OOH2N
O
OO
OHN
HNO
OOH
H2N
OO
PheNaphBes (23): colourless solid 15% yield after HPLC purification; ESI:
1010.2 [M+H]+; HRMS: found [M+H]+ 1010.5042. C57H68N7O10+ requires
1010.5022.

NH
HN
HN
OOH2N
O
OO
OHN
HNO
OOH
H2N
O
II) Synthesis of P1 library ABPs with Ala at the P1’ site: The synthesis of the P1 library required a strategy for the synthesis of α-hydroxy-
β-amino acids. Details of the synthesis of α-hydroxy-β-amino acids and its
purification will be described elsewhere (Velmourougane, G and Greenbaum, D.
C. et al., manuscript accepted in J. Med. Chem.). The scheme for the synthesis
of α-hydroxy-β-amino acids is as follows (Scheme 2).
Scheme 2: Synthesis of α-hydroxy-β-aminoacids
BocHNO
H
BocHN BocHN BocHN
R
R R R
OHOH
OH
O
diastereomeric mixtureseparated by HPLC29 : 30 (2R,3R : 2S,3R)
LiAlH4, Et2O
-33 oC to 0 oC, 30 min
CH3PPh3Br, KHMDS
THF, - 78 oC to r.t., 2 h
26
AD-mix alpha, CH3SO2NH2
tBuOH:H2O (1:1) 0 oC, 36 h
TEMPO, NaClO2, NaOCl,
NaH2PO4 (pH 6.7):CH3CN (1:1) 30 h
a: R = Hb: R = isopropylc: R = diphenyld: R = naphthyle: R = biphenylf: R = p-benzyloxy phenyl
BocHNO
OH
R
BocHNO
N
R OMe
Me
NHOMe(Me).HCl
NMM, EDAC.HClDCM, -15 oC to r.t., 5 h
24 25
27 28OH
The α-hydroxy-β-amino acid 30a-f were converted to the P1 library ABP’s as per
the scheme depicted below. The yields of the products ranged from 12 to 15%
(Scheme 3).
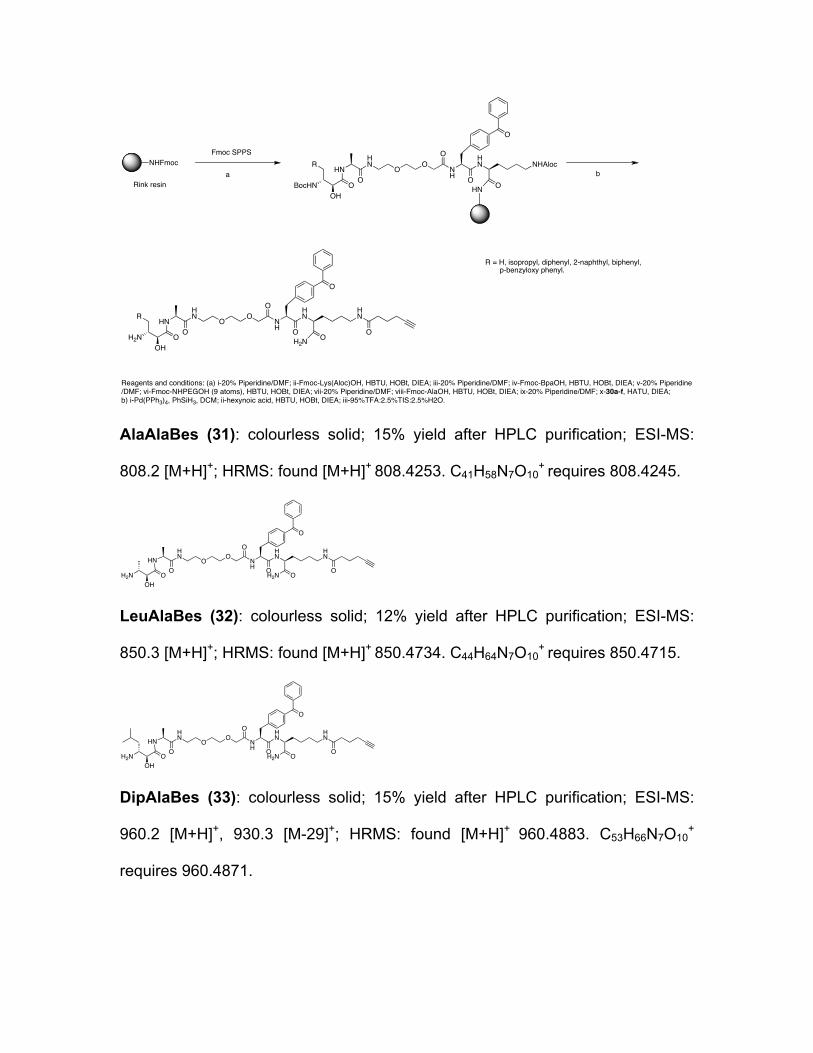
Scheme 3: Synthesis of P1 library of Bestatin ABPs.
NHFmoc
Rink resina b
Fmoc SPPS
H2NOH
O
HNHN O O
ONH
HN
O
O
O
HN
OH2NO
BocHNOH
O
HNHN O O
ONH
HN
O
O
O
NHAloc
OHN
Reagents and conditions: (a) i-20% Piperidine/DMF; ii-Fmoc-Lys(Aloc)OH, HBTU, HOBt, DIEA; iii-20% Piperidine/DMF; iv-Fmoc-BpaOH, HBTU, HOBt, DIEA; v-20% Piperidine/DMF; vi-Fmoc-NHPEGOH (9 atoms), HBTU, HOBt, DIEA; vii-20% Piperidine/DMF; viii-Fmoc-AlaOH, HBTU, HOBt, DIEA; ix-20% Piperidine/DMF; x-30a-f, HATU, DIEA; b) i-Pd(PPh3)4, PhSiH3, DCM; ii-hexynoic acid, HBTU, HOBt, DIEA; iii-95%TFA:2.5%TIS:2.5%H2O.
R = H, isopropyl, diphenyl, 2-naphthyl, biphenyl, p-benzyloxy phenyl.
R
R
AlaAlaBes (31): colourless solid; 15% yield after HPLC purification; ESI-MS:
808.2 [M+H]+; HRMS: found [M+H]+ 808.4253. C41H58N7O10+ requires 808.4245.
NH
HN
HN
OOH2N
O
OO
OHN
OO
OHH2N
O
HN
LeuAlaBes (32): colourless solid; 12% yield after HPLC purification; ESI-MS:
850.3 [M+H]+; HRMS: found [M+H]+ 850.4734. C44H64N7O10+ requires 850.4715.
NH
HN
HN
OOH2N
O
OO
OHN
OO
OHH2N
O
HN
DipAlaBes (33): colourless solid; 15% yield after HPLC purification; ESI-MS:
960.2 [M+H]+, 930.3 [M-29]+; HRMS: found [M+H]+ 960.4883. C53H66N7O10+
requires 960.4871.

NH
HN
HN
OOH2NO
OOO
HN
OOOH
H2N
O
Ph HNPh
NaphAlaBes (34): colourless solid; 13% yield after HPLC purification; ESI-MS:
934.3 [M+H]+; HRMS: found [M+H]+ 934.4702. C51H64N7O10+ requires 934.4715.
NH
HN
HN
OOH2NO
OOO
HN
OOOH
H2N
O
HN
BipAlaBes (35): colourless solid; 16% yield after HPLC purification; ESI-MS:
960.2 [M+H]+; HRMS: found [M+H]+ 960.4862. C53H66N7O10+ requires 960.4871.
NH
HN
HN
OOH2NO
OOO
HN
OOOH
H2N
O
HN
Tyr(Bzl)AlaBes (BTA) or (36): colourless solid; 15% yield after HPLC
purification; ESI-MS: 990.3 [M+H]+; HRMS: found [M+H]+ 990.4944.
C54H68N7O11+ requires 990.4977.
NH
HN
HN
OOH2NO
OOO
HN
OOOH
H2N
O
HN
O
Synthesis of LysBiotinacetic azide (37):
The synthesis of the LysBiotinacetic azide was performed on Rink resin. Fmoc
deprotection on the Rink resin was carried out using 20% Piperidine in DMF for
20 minutes. The free amine was treated with Fmoclys(biotin)OH under standard

coupling conditions (3 eq. HBTU, 3 eq. HOBt, 6 eq. DIEA). Fmoc deprotection
followed by coupling with Bromoacetic acid using HATU and DIEA provided the
precursor bromo derivative. This on treatment with sodium azide in DMF at 60 oC
for 48 h generated the azide. Cleavage of the resin using
95%TFA:2.5%TIS:2.5%H2O and the extract was concentrated, precipitated using
cold ether and purified by HPLC (Scheme 4).
ESIMS of LysBiotinacetic azide found [M+H]+ 455.2. C18H31N8O4S+ requires
455.21.
Scheme 4: Synthesis of LysBiotinacetic azide.
NH
NH
O NH3 OS
HN NHH
H
O
N3
O
NHFmoc
1) 20% Pip/DMF2) FmocLys(Biotin)OH, HBTU,HOBt, DIEA3) 20% Pip/DMF4) BrCH2COOH, HATU, DIEA5) NaN3, DMF, 60 oC6) 95%TFA:2.5%TIS:2.5%H2O
Rink resin
37
III) Synthesis of BiotinBTA click probe (38):
O
H2N
HNHN O O N
H
HN
OHO O
O
O
OH2N O
HN
NN
N
HN NH2
OHN
O
O
S
HNNH
O
H
H
O
The BiotinBTA click probe was synthesized by reacting the BTA alkyne (1.2 eq.)
with LysBiotin acetic azide 37 (1 eq.) using copper sulphate (0.05 eq.), sodium
ascorbate (0.15 eq.) in dichloromethane and water (1:1) at 55 oC for 12 h. After
12 h the solvent was evaporated to dryness and the residue was purified by
reverse phase HPLC to yield the BiotinBTA click probe 38 in 42% yield as
colourless solid after HPLC purification. ESIMS: 1444.4 [M+H]+; HRMS: found
[M+H]+ 1444.7054. C72H98N15O15S + requires 1444.7088.
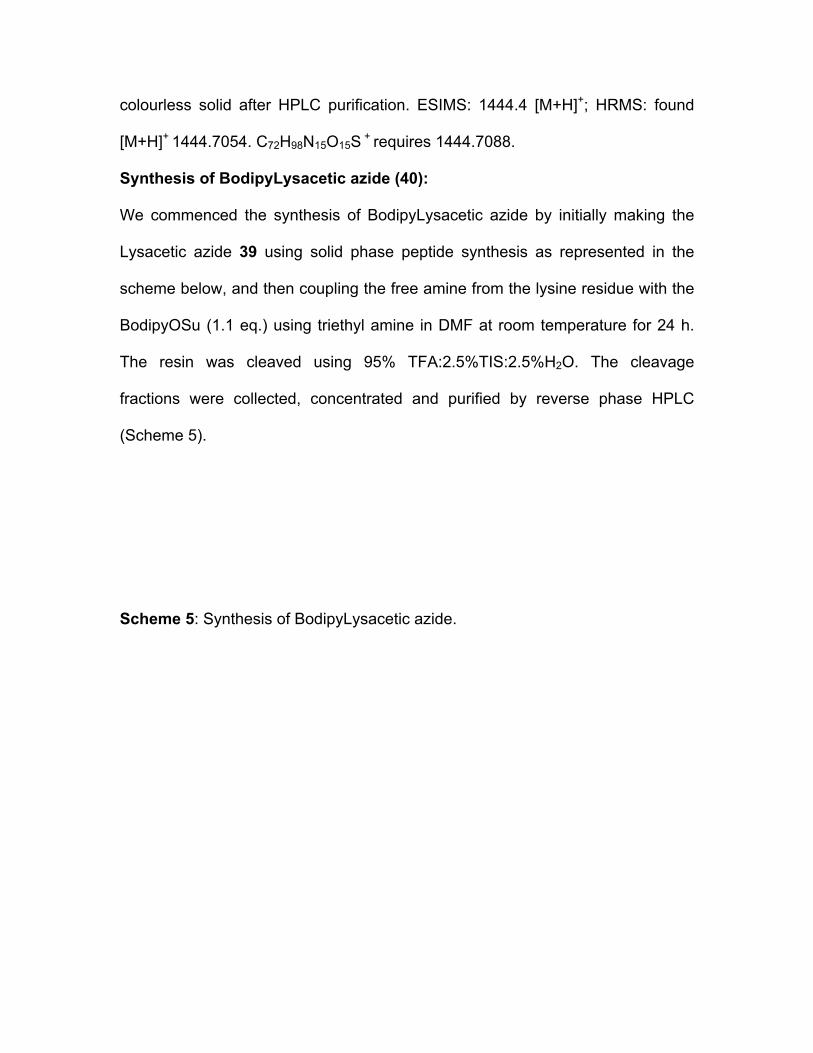
Synthesis of BodipyLysacetic azide (40):
We commenced the synthesis of BodipyLysacetic azide by initially making the
Lysacetic azide 39 using solid phase peptide synthesis as represented in the
scheme below, and then coupling the free amine from the lysine residue with the
BodipyOSu (1.1 eq.) using triethyl amine in DMF at room temperature for 24 h.
The resin was cleaved using 95% TFA:2.5%TIS:2.5%H2O. The cleavage
fractions were collected, concentrated and purified by reverse phase HPLC
(Scheme 5).
Scheme 5: Synthesis of BodipyLysacetic azide.

NH
NH2
O NH2
N3
O
NHFmoc
1) 20% Pip/DMF2) FmocLys(Boc)OH, HBTU,HOBt, DIEA
3) 20% Pip/DMF4) BrCH2COBr, DIEA, DMAP (cat.)5) NaN3, DMF, 60 oC6) 95%TFA:2.5%TIS:2.5%H2O
Rink resin
BodipyOSu,Et3N in DMFr.t., 24 h
NH
NH
O NH2
N3
OO
NBN
FF
H3CCH3
39
40
ESIMS of BodipyLysacetic azide C24H33BF2N8O3 Calculated Mass 530.27, found
553.1 (M+Na+).
IV) Synthesis of BodipyBTA click probe (41):
NH
HN
HN
OOH2NO
OOO
HNHN
OOOH
H2N
OO
NN
N
O
HN
HN
O NH2O
NB NF FH3C
CH3
The synthesis of the BodipyBTA click probe was done employing the same
protocol for the click reaction as for the BiotinBTA click probe using BTA alkyne
and BodipyLysacetic azide 40. The product 41 was obtained in 45% yield as a
colourless solid. ESIMS: 1520.5 [M+H]+; HRMS: found [M+H]+ 1520.7716.
C78H101BF2N15O14+ requires 1520.7714.
V) Synthesis of BodipyPheNaph click probe (42):
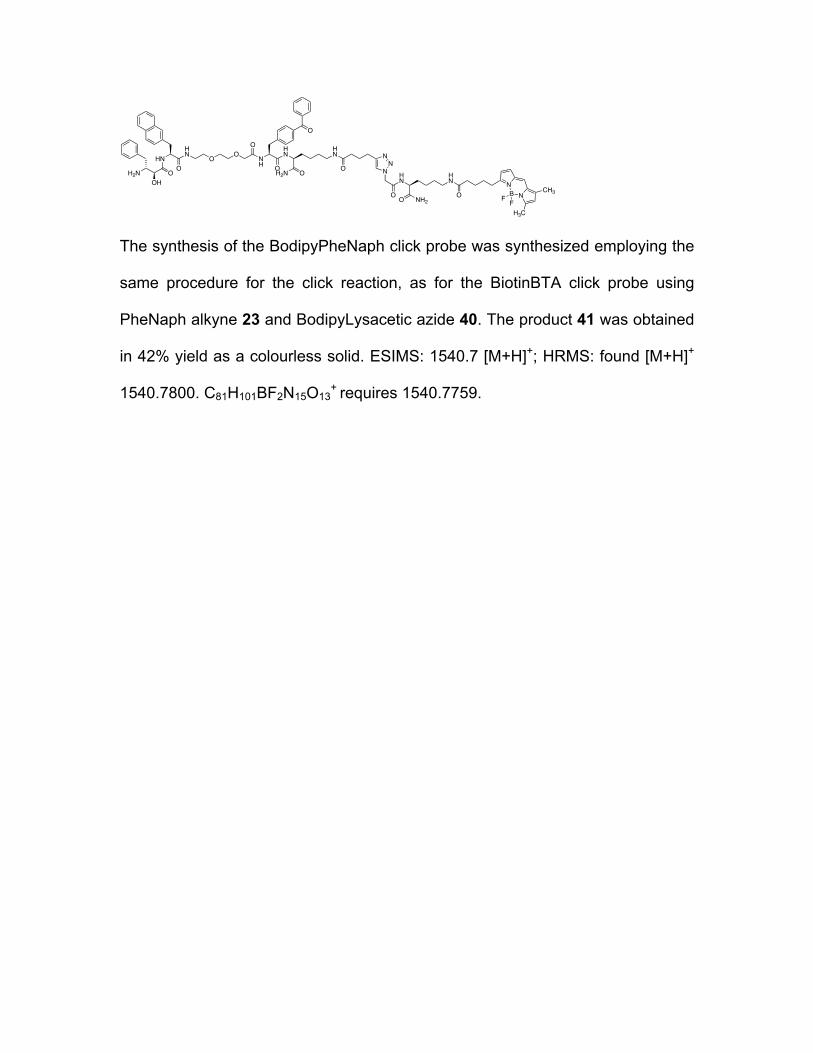
NH
HN
HN
OOH2NO
OOO
HNHN
OOOH
H2N
O
NN
N
O
HN
HN
O NH2O
NB NF FH3C
CH3
The synthesis of the BodipyPheNaph click probe was synthesized employing the
same procedure for the click reaction, as for the BiotinBTA click probe using
PheNaph alkyne 23 and BodipyLysacetic azide 40. The product 41 was obtained
in 42% yield as a colourless solid. ESIMS: 1540.7 [M+H]+; HRMS: found [M+H]+
1540.7800. C81H101BF2N15O13+ requires 1540.7759.

Supplementary references 1. Wilkes, S.H. & Prescott, J.M. The slow, tight binding of bestatin and
amastatin to aminopeptidases. J Biol Chem 260, 13154-62 (1985). 2. Stack, C.M. et al. Characterization of the Plasmodium falciparum M17
leucyl aminopeptidase. A protease involved in amino acid regulation with potential for antimalarial drug development. J Biol Chem 282, 2069-80 (2007).
3. Maric, S. et al. The M17 leucine aminopeptidase of the malaria parasite Plasmodium falciparum: importance of active site metal ions in the binding of substrates and inhibitors. Biochemistry 48, 5435-9 (2009).
4. Morrison, J.F. & Walsh, C.T. The behavior and significance of slow-binding enzyme inhibitors. Adv Enzymol Relat Areas Mol Biol 61, 201-301 (1988).
5. Rich, D.H., Moon, B.J. & Harbeson, S. Inhibition of aminopeptidases by amastatin and bestatin derivatives. Effect of inhibitor structure on slow-binding processes. J Med Chem 27, 417-22 (1984).
6. Leslie, A.G.W. Joint CCP4+ESF-EAMCB Newsletter on Protein Crytallography.
7. Evans, P. Scaling and assessment of data quality. Acta Crystallogr D Biol Crystallogr 62, 72-82 (2006).
8. The CCP4 suite: programs for protein crystallography. Acta Crystallogr D Biol Crystallogr 50, 760-3 (1994).
9. Brunger, A.T. Assessment of phase accuracy by cross validation: the free R value. Methods and applications. Acta Crystallogr D Biol Crystallogr 49, 24-36 (1993).
10. Potterton, E., Briggs, P., Turkenburg, M. & Dodson, E. A graphical user interface to the CCP4 program suite. Acta Crystallogr D Biol Crystallogr 59, 1131-7 (2003).
11. McGowan, S. et al. Structural basis for the inhibition of the essential Plasmodium falciparum M1 neutral aminopeptidase. Proc Natl Acad Sci U S A 106, 2537-42 (2009).
12. DeLano, W.L. The PyOL Molecular Graphics System. (DeLano Scientific, San Carlos, CA USA, 2002).
13. Androulakis, S. et al. Federated repositories of X-ray diffraction images. Acta Crystallogr D Biol Crystallogr D64, 810-4 (2008).
14. Onder, O., Turkarslan, S., Sun, D. & Daldal, F. Overproduction or absence of the periplasmic protease DegP severely compromises bacterial growth in the absence of the dithiol: disulfide oxidoreductase DsbA. Mol Cell Proteomics 7, 875-90 (2008).
Related Documents