Support for Redistribution in an Age of Rising Inequality: New stylized facts and some tentative explanations BPEA Conference Draft, March 19–20, 2015 Vivekinan Ashok, Yale Department of Political Science Ilyana Kuziemko, Princeton Department of Economics Ebonya Washington, Yale Department of Economics We thank Angus Deaton, David Romer, Matt Weinzierl, Justin Wolfers, and seminar participants at Princeton for incredibly helpful feedback. Khurram Ali provided invaluable research assistance.

Welcome message from author
This document is posted to help you gain knowledge. Please leave a comment to let me know what you think about it! Share it to your friends and learn new things together.
Transcript

Support for Redistribution in an Age of Rising Inequality:
New stylized facts and some tentative explanations
BPEA Conference Draft, March 19–20, 2015
Vivekinan Ashok, Yale Department of Political ScienceIlyana Kuziemko, Princeton Department of EconomicsEbonya Washington, Yale Department of Economics
We thank Angus Deaton, David Romer, Matt Weinzierl, Justin Wolfers, and seminar participants at Princeton for incredibly helpful feedback. Khurram Ali provided invaluable research assistance.

Support for Redistribution in an Age of Rising
Inequality: New stylized facts and some tentative
explanations∗
Vivekinan Ashok, Ilyana Kuziemko, Ebonya Washington
March 9, 2015
Abstract
Despite the large increases in economic inequality since 1970, American survey
respondents exhibit no increase in support for redistribution, in contrast to the pre-
dictions from standard theories of redistributive preferences. We replicate these results
but further demonstrate substantial heterogeneity by demographic groups. In particu-
lar, the two groups who have most moved against income redistribution are the elderly
and African-Americans, two groups relatively more reliant on it. We find little evidence
that these subgroup trends are explained by relative economic gains or growing cul-
tural conservatism, two common explanations. We further show that the elderly trend
is uniquely American, at least relative to other developed countries with comparable
survey data. One story consistent with the data on elderly trends is that they worry
that redistribution will come at their expense, in particular via cuts to Medicare. We
find that the elderly have grown increasingly opposed to government provision of health
insurance and that controlling for this tendency explains roughly half of their declining
relative support of redistribution. For blacks, controlling for their declining support of
race-targeted aid explains a large portion of their differential decline in redistributive
preferences (raising the question of why support for race-targeted aid has fallen during
a period when black income catch-up to whites has stalled).
Keywords: redistributive preferences; inequality
∗We thank Angus Deaton, David Romer, Matt Weinzierl, Justin Wolfers, and seminar par-ticipants at Princeton for incredibly helpful feedback. Khurram Ali provided invaluable researchassistance. Ashok, Yale Department of Political Science, Kuziemko, Princeton Department of Eco-nomics; Washington, Yale Department of Economics.

Introduction
Since the 1970s the United States has witnessed two trends whose coexistence calls into
question predictions from standard political economy models (e.g., Meltzer and Richard,
1981). As documented extensively in Piketty and Saez (2003) as well as their annual updates,
the U.S. income distribution has grown substantially more concentrated since the 1970s. As
Figure 1 shows, the share of income accruing to the top one percent more than doubled
between 1978 and 2007.1 The growth of inequality has not been limited to the top “one
percent” but also appears in broader distributional measures (Autor, 2014).
The workhorse political economy model suggests that an individual’s demand for redis-
tribution is a function of mean income minus own income. As inequality increases, a greater
share of the population has income below the mean and thus demand for redistribution rises.
Yet, in reality, demand for income redistribution in the US has remained flat by some mea-
sures and decreased for others (see, e.g., Kuziemko et al. (2013), and we further document
this fact later in the paper). Beyond the US, citizens of other OECD countries that have
seen rising income inequality have generally not exhibited greater demand for redistribution
(Kenworthy and McCall, 2008).
Explaining this puzzle has inspired a large literature, ranging from racial politics to belief
in upward mobility.2 Our goal in this paper is not to offer a new explanation. Instead, we offer
new “clues” to the puzzle by delving deeper into the U.S. survey data, as well as comparing
it to trends from other developed countries. Our hope is that future work trying to explain
the evolution of redistributive preferences would try to fit the new stylized facts we establish
in this study.
In the first part of the paper, we replicate past work showing that trends in the demand
for redistribution among Americans has been largely flat or perhaps slightly negative over
this period. We show that this result is robust to different redistributive questions as well as
different datasets.
We then document (for the first time to our knowledge) the great heterogeneity in trends
for support for redistribution during this time period. We first largely focus on “immutable”
demographic characteristics, so as to put aside worries about compositional changes. Two
groups—the elderly and African-Americans—have significantly decreased their support for
redistribution, relative to other respondents. While race and age differences are pronounced
1See their online updates at http://eml.berkeley.edu/~saez/TabFig2012prel.xls.2See, e.g., Lee and Roemer (2006), Benabou and Ok (2001), and citations therein.
1

and robust in the data, we do not find significant gender differences in trends in redistributive
preferences. If anything, there is a slight increase in redistributive sentiment among richer
Americans, though this result is not as robust as the race and age results.
The second part of the paper explores potential explanations for our two most robust
heterogeneity results: the relative decline in redistributive support among the elderly and
African Americans. We begin with the standard model of economic self-interest: have these
groups made relative gains in income or other measures of economic well-being?
In fact, we make little progress explaining these subgroup trend divergences with economic
and even broader well-being measures. One exception is that educational gains (perhaps
acting as a proxy to permanent income) can explain roughly one-fourth of the differential
elderly trend (though it remains negative and statistically significant). Otherwise, household
income, perceived place in the income distribution, perceived social class, self-reported health
or subjective well-being and perceived inter- and intra-generational mobility do little to
“explain away” the relative decline in redistributive support among the elderly and blacks.
A more psychological model of redistributive preferences emphasizes the role of cognitive
dissonance—if an individual becomes more conservative on social issues (e.g., abortion), she
will also become more economically conservative so as to remain consistent in an ideological
or partisan sense.3 We thus subject our differential trend results to a variety of partisan and
ideological controls, as well as control for views on particular hot-button issues: religious
attendance, abortion, gay rights and gun rights. We find no evidence that a general right-
ward movement ideologically or culturally among the elderly and blacks has dragged their
redistributive views to the right.
Having failed to explain our divergent trends with common models of redistributive pref-
erences, we attempt explanations drawn from the particular historical or institutional fea-
tures specific to each of these groups. The U.S. elderly have enjoyed tremendous gains in
life expectancy and years of retirement, which our self-reported health and other wellbeing
measures may not capture. These gains have generally been enjoyed by the elderly across the
OECD. To the extent that these broad trends can explain the decline in the elderly’s sup-
port for redistribution, we should see the same results elsewhere. In fact, in every developed
country where comparable data have been collected, the elderly’s support for redistribution
follows either a parallel trend to the rest of adults, or is differentially increasing. Thus, the
decline we find among American elderly appears unique.
3The classic citation on cognitive dissonance is Festinger (1957) but we review the more modernliterature and in particular its connection to partisan identity later in the paper.
2

This international evidence leads us to think of whether there exist aspects of U.S redis-
tributive policy that, relative to other countries, is unique in how it treats the elderly. The
most obvious candidate is that in the US the elderly are uniquely guaranteed health insur-
ance by the government, whereas this coverage is universal in other developed countries. As
Campbell (2003) has noted, the threat of Medicare cuts politically energizes U.S. seniors. We
ask whether U.S. seniors have grown increasingly against extending government guarantee of
health coverage and, if so, if this trend can explain their movement away from redistribution.
We show evidence across two different datasets in support of these hypotheses.
Finally, to explain the declining support for redistribution among blacks, we are motivated
by the large literature showing that those who believe economic outcomes are the result of
a fair process are more opposed to redistribution. In surveys, blacks are far less likely to
agree that economic outcomes are fair than are whites, not surprising given the legacy of
slavery and segregation, and perhaps as a result are far more likely to support race-based
government aid. We show, however, that over the past several decades blacks have moved
significantly toward the white view on these questions. In particular, controlling for views on
race-based government aid explains nearly half the decline in black redistributive preferences.
We are thus able to provide a proximate determinant of the decline in black redistributive
preferences, which only raises the question of why blacks’ support for race-based aid has
fallen during a period when their economic catch-up to whites has stalled.
The remainder of the paper proceeds as follows. In Section 1 we replicate past findings
on the flat trend in overall redistributive demand in the US over the past several decades,
as well as establish new facts on heterogeneity by demographic sub grounds. In Section 2
we explore how well standard models do in explaining these divergent subgroup results. In
Section 3 we explore hypotheses specific to the elderly and in Section 4 we do the same for
blacks. Section 5 offers some concluding thoughts and suggests areas for future work.
1 Trends in redistributive demand
While aggregate demand for redistribution has not increased over this period of rising in-
equality, in this section we document substantial heterogeneity in this pattern across sub-
groups. To ensure that our hetereogenous patterns are not driven by data or coding differ-
ences between our paper and previous work, we first demonstrate that we can replicate the
earlier finding of flat aggregate demand using our survey measures.
3

1.1 Aggregate trends in redistributive demand
We have identified four questions on redistribution that have been fielded regularly since the
1970s. Our first and focal question is drawn from our primary dataset the General Social
Survey, a representative survey of American households. The GSS asks, “Some people think
that the government in Washington ought to reduce the income differences between the rich
and the poor, perhaps by raising the taxes of wealthy families or by giving income assistance
to the poor. Others think that the government should not concern itself with reducing this
income difference between the rich and the poor. Here is a card with a scale from 1 to 7.
Think of a score of 1 as meaning that the government ought to reduce the income differences
between rich and poor, and a score of 7 meaning that the government should not concern
itself with reducing income differences. What score between 1 and 7 comes closest to the
way you feel?.” We subtract this variable from eight so that it is increasing in support
for redistribution and refer to it as the “reduce differences” variable. It is our preferred
measure because it specifically mentions differences in the rich and the poor, whereas the
other measures focuses more on the poor.
Figure 2 shows a scatterplot, with best-fit lines, of mean response to the “reduce dif-
ferences” question over time. 4 The fitted line depicts a slight decrease in demand for re-
distribution, at least as reflected by this variable. Measured against the left-hand axis, the
drop is about 10% of a point on the seven-point “reduce differences” scale. Because the
seven-point scale has no intuitive interpretation, on the right-hand axis we measure the drop
in “partisan units.” That is, we normalize the measure so that zero represents the view of
the average respondent over the sample period, and an increase of one unit for this variable
is equal to moving the distance between the average Republican’s views and the average
Democrat’s view on this question. The roughly 0.1 unit decrease on the left-hand axis means
that since 1978, Americans have moved (in the Republican direction) about 10% of the
Democrat-Republican difference on this question.
We present two best fit lines in this graph and those that follow. The longer is the fit
through all years for which we have data. The shorter line, our preferred estimate, is the best
fit through 2006 (the last time the question is asked in the pre-Great Recession period).
We prefer to restrict attention to this shorter period for at least four reasons. First,
4Throughout the paper we weight samples using the provided survey weights. In the GSS, toinclude those respondents from years in which over-samples were conducted, we use the product ofthe wtssall and oversamp variables as our weight.
4
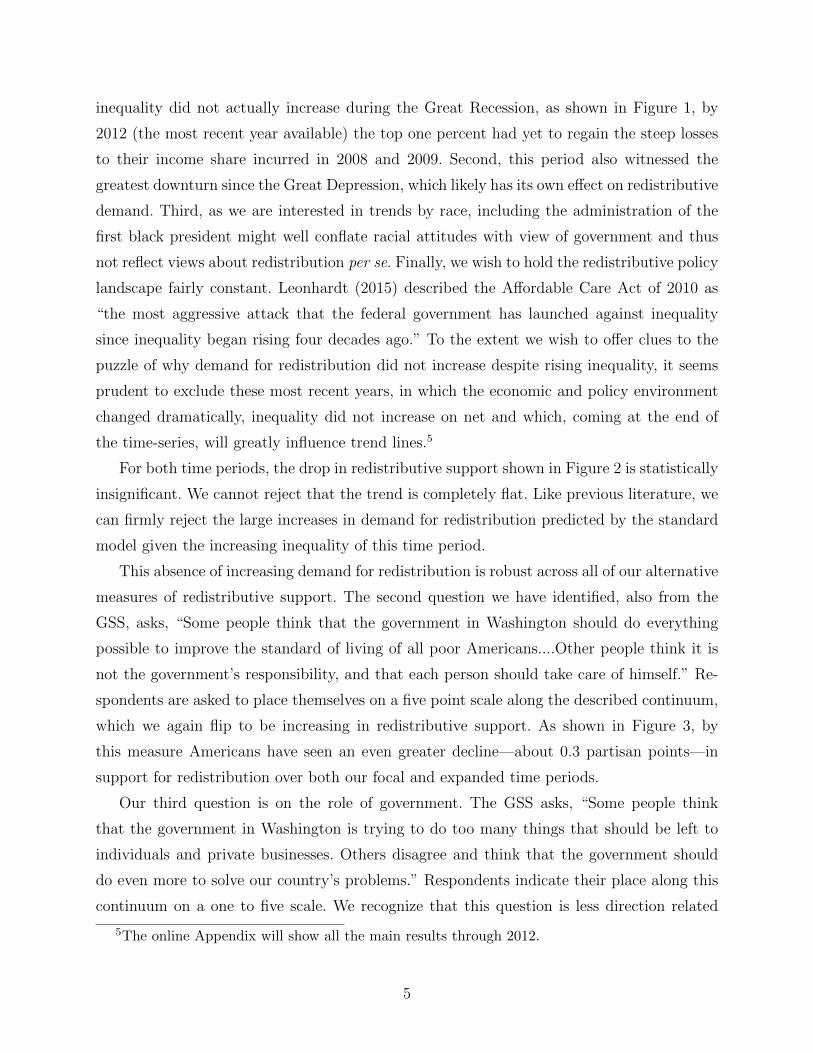
inequality did not actually increase during the Great Recession, as shown in Figure 1, by
2012 (the most recent year available) the top one percent had yet to regain the steep losses
to their income share incurred in 2008 and 2009. Second, this period also witnessed the
greatest downturn since the Great Depression, which likely has its own effect on redistributive
demand. Third, as we are interested in trends by race, including the administration of the
first black president might well conflate racial attitudes with view of government and thus
not reflect views about redistribution per se. Finally, we wish to hold the redistributive policy
landscape fairly constant. Leonhardt (2015) described the Affordable Care Act of 2010 as
“the most aggressive attack that the federal government has launched against inequality
since inequality began rising four decades ago.” To the extent we wish to offer clues to the
puzzle of why demand for redistribution did not increase despite rising inequality, it seems
prudent to exclude these most recent years, in which the economic and policy environment
changed dramatically, inequality did not increase on net and which, coming at the end of
the time-series, will greatly influence trend lines.5
For both time periods, the drop in redistributive support shown in Figure 2 is statistically
insignificant. We cannot reject that the trend is completely flat. Like previous literature, we
can firmly reject the large increases in demand for redistribution predicted by the standard
model given the increasing inequality of this time period.
This absence of increasing demand for redistribution is robust across all of our alternative
measures of redistributive support. The second question we have identified, also from the
GSS, asks, “Some people think that the government in Washington should do everything
possible to improve the standard of living of all poor Americans....Other people think it is
not the government’s responsibility, and that each person should take care of himself.” Re-
spondents are asked to place themselves on a five point scale along the described continuum,
which we again flip to be increasing in redistributive support. As shown in Figure 3, by
this measure Americans have seen an even greater decline—about 0.3 partisan points—in
support for redistribution over both our focal and expanded time periods.
Our third question is on the role of government. The GSS asks, “Some people think
that the government in Washington is trying to do too many things that should be left to
individuals and private businesses. Others disagree and think that the government should
do even more to solve our country’s problems.” Respondents indicate their place along this
continuum on a one to five scale. We recognize that this question is less direction related
5The online Appendix will show all the main results through 2012.
5

to redistribution than are the first two, but show the results for the sake of robustness. As
shown in Figure 4, during this period of increased inequality, Americans have not increased
in their desire for government intervention.
Our final measure of redistributive preferences comes from the American National Elec-
tion Studies (ANES), a representative sample of voting eligible Americas. ANES asks “Some
people feel that the government in Washington should see to it that every person has a job
and a good standard of living....Others think the government should just let each person
get ahead on his/their own.” Respondents place themselves on a seven-point scale on this
continuum, which we subtract from eight to make the measure increasing in redistributive
support. We plot the result in Figure 5. While the sign of the ANES results differs from that
using the various GSS measures, like our main GSS outcome, it is essentially flat.6 Across
the four measures, we are able to replicate the finding of previous literature of no increase
in support for redistribution over this period of increased inequality. As we noted from the
onset this lack of increased support is puzzling. In an effort to provide clues for solving this
puzzle, in the next section we demonstrate, we believe for the first time, that these aggregate
trends mask substantial heterogeneity across demographic groups.
1.2 Trends by subgroup
In this section we examine how the trend in support for redistribution varies by subgroup. To
avoid endogenous composition concerns, we begin by examining trends by basic immutable
demographic characteristics: age, race and sex.
1.2.1 Trends by age
In Figure 6 we return to our focal GSS “reduce differences” question and demonstrate re-
markable heterogeneity in the trends of younger and older respondents. Over our 28 year
sample period, while those under 65 saw no significant change in mean desire for the reduction
of income inequality, those aged 65 or older grew increasingly negative toward redistribution.
Looking at our standardized party scale on the right-hand axis, we see that across our 28
year sample period, the elderly decreased their support by 60% of the Democrat-Republican
difference. The result is robust to using our redistribution question drawn from the ANES
(Figure 7, in which the elderly show a decrease in support of roughly 50% of the party dif-
6Our last ANES datapoint is 2008. The question is fielded again in 2012, but currently onlypreliminary data are available for that wave.
6

ference. By either measure, the relative position of the elderly has flipped—the group begins
the time period more in favor of redistribution than the rest of the population, but end the
time series far less supportive.
We flesh out the picture of relative redistributive support by age in two ways. First,
we recognize that the non-elderly are a large heterogenous group which may have varying
views. Therefore in Appendix Figure 1 we examine the trends by multiple age categories in
both datasets. To minimize clutter, we suppress the scatter plot and show only the fitted
lines. Both pictures suggest that those below age 40 accord with the standard prediction.
As inequality has increased so too has their demand for redistribution. In the flat aggregate
trend, of course this increase is masked by decrease in support amongst older Americans.
We find almost identical patterns in the ANES (see Online Appendix).
Second, we decompose the decrease amongst the elderly into aging and cohort effects.
For each 10 year birth cohort, we graph mean support by year in the GSS. Appendix Figure
2 demonstrates that our elderly pattern is driven both by cohort and aging effects. Each
successive cohort—with the exception of one—is more opposed toward redistribution when
first observed in 1978. As these younger cohorts make up a larger fraction of the elderly, the
elderly’s mean view toward redistribution declines due to compositional change. This decline
is reinforced by aging effects. The negative slopes for each cohort, indicate a within-cohort
decrease for support over time.
1.2.2 Trends by race
The second demographic split we investigate is race. Because of sample size limitations,
we are able to examine only two racial groups: blacks and whites.7 Like with age, we find
remarkable differences in trends by race in both the GSS (Figure 8) and the ANES (Figure
9). While blacks have a much higher desire for redistribution on average, in both datsets the
black-white gap narrows markedly—from 30 to 40% of the party difference—over the time
period.
1.2.3 Trends by gender
Unlike for race and age, we find no heterogeneity by gender in either dataset. In both the
GSS (Figure 10) and the ANES (Online Appendix) we see that women have a higher demand
for redistribution then men, but that the trend in support is similar for both sexes. Both men
7Moreover, the GSS only asks about Hispanic ethnicity consistently beginning in 2000.
7

and women in the GSS show a small insignificant decrease in support over the time period
but are on parallel trends. This non-result is somewhat surprising given the large income
gains women have made relative to men over the same time period.
1.2.4 Trends by income.
In the remainder of this section we explore heterogeneity by income. We recognize that com-
positional changes to those of various income groups complicate the interpretation. Nonethe-
less, we present these results because of their direct link to the Meltzer-Richards framework.
Their model predicts that those who are most economically advantaged—for whom redistri-
bution would entail the largest net loss—should be most opposed.
We use the GSS realinc measure, converted to 2014 dollars. We then adjust for household
size as in Stevenson and Wolfers (2013). For each sample year, we divide households by
quintiles based on this measure.8 For the income analysis, we drop the roughly ten percent
of observations who refuse to report their income.
Figure 11, showing trends in support for redistribution, by income level, does demon-
strate a higher demand for redistribution for the bottom four quintiles of GSS respondents.
More notably the figure shows that this gap has decreased over time, as the highest income
Americans have increased their support by one-third the distance between parties by our
standardized measure.
The ANES bins household income into different quantiles, and thus the closest we can
replicate the GSS analysis is to examine those individual who the ANES reports as being
in the top third or the top five percent of household income. In Appendix Figure 3 we
find, consistent with the GSS result, that those in the top five percent have become more
supportive of redistribution relative to others. However, when we examine the top third of
the income distribution, their trends are essentially parallel to the rest of the ANES sample
(not shown).
As our income result is not as robust as the age and race results, we do not pursue
it further in this study. Given the large income gains over this period going to the top
quantiles of the income distribution, the fact that we find even suggestive evidence that
they in fact have grown more sympathetic to redistribution is intriguing given the reverse
is strongly predicted by standard models. Our result may lend support to McCarthy, Poole
8Because of the lumpiness of the underlying realinc variable, dividing into finer bins is prob-lematic as in some years the bins will be unevenly divided.
8

and Rosenthal’s (2013) thesis that increased polarization of party by income is driven not
by economic inequality but by increased party polarization.
Finally, we note that measuring economic advantage by educational attainment also
produces mixed results. The GSS shows an increase in support amongst the college educated
while the ANES shows a decrease.
1.3 Discussion
While Americans overall have exhibited no marked trend in their support for redistribution
over the past four decades, our subgroup analysis have identified two groups with markedly
negative trends over time: the elderly and African-Americans. These groups are in fact among
the most dependent on transfers, making their redistributive trends a priori surprising.9 In
the next section, we explore whether commonly used models of redistributive preferences
may explain the divergent trends of these two subgroups.
2 Can standard models of redistributive preferences explain sub-
group trends
In this section, we explore to what extent we can “explain away” the black and elderly
differential trends that we uncovered in the previous section, using controls suggested by
common models of redistributive preferences.
2.1 Economic self-interest
The workhorse political economy model has voters maximizing after-tax income, with de-
mand for redistribution an increasing function of the difference between their income and
that of the average tax-payer. We thus begin our exploration of why the elderly and African-
Americans have differentially moved against redistribution by examining the robustness of
their differential trends to a myriad of income controls. As we tend to prefer the main GSS
redistribution question (i.e., our “reduce differences” question), we focus on that data source
in the analysis that follows, though all results are robust to using the ANES and for some
key results we will report the parallel ANES analysis.
9Between 1978 and 2006, the average share of total income coming from government transfersfor the elderly was 63%; as opposed to 8% for the non-elderly. Similarly, over the same period, theaverage share for African Americans was 24%; as opposed to 16% for whites.Author’s calculationsusing CPS data.
9

Col. (1) of Table 1 quantifies the relative decline among the elderly in support for redis-
tribution, essentially replicating Figure 6 in regression form. With no controls besides the
Elderly dummy and year fixed effects, the elderly (relative to others) decrease their answer
to this question by roughly 0.21 points (on a seven-point scale) per year. Again, as the units
of this coefficient have no intuitive interpretation, as with the figures, we also divide the co-
efficient by the Democrat-Republican difference on this question, and report it as the “scaled
effect” below the coefficient estimate.10 As the coefficient is in terms of 100 years whereas
our GSS sample period typically spans 28 years (depending on the outcome question), the
“scaled effect” listed in col. (1) suggests that over this period, the elderly have differentially
shifted their views on this question (in the Republican direction) by an amount equal to
roughly sixty percent (1.96 · 0.28) of the partisan gap on this question.11
Col. (5) shows the parallel analysis for blacks. The coefficient of interest suggests that
over our 28-year sample period, they have traveled (in the Republican direction) a distance
equal to 37% (1.423 ·0.28) of the Democrat-Republican gap on this question, consistent with
Figure 8.
In columns (2) and (6) we add household income controls. We use the GSS realinc
measure, converted to 2014 dollars, and again adjust for household size as in Stevenson and
Wolfers (2013). We also have a separate control for the roughly ten percent of respondents
who have missing information for this variable. Below the coefficient estimates, we also
report the “share explained” (merely one minus the coefficient of interest after we include
controls divided by the original coefficient). For both groups, controlling for household income
has essentially no effect on the coefficient of interest. For the elderly, the income controls
“explain” roughly three percent of the original effect. For blacks, including income controls
actually increases the magnitude of the group’s differential trend, though, again, in both
cases the effect is close to zero.
Especially for the elderly (many of whom are retired), actual income may be a noisy
proxy for economic well-being, and thus in cols. (3) and (7) we use education (fixed effects
for highest degree attained) as a proxy for permanent income. For the elderly (col. 3), this
control has some explanatory power, reducing the original coefficient by roughly one-fourth
10The GSS asks individuals to rank themselves 1-7 on a Republican-Democrat scale, with 4 being“independent.” We calculate the difference in the outcome variable between those answering 1-3(Republican) and those answering 4-7 (Democrat). We then divide the coefficient by this difference.
11For this outcome, self-described Democrats give an average answer of 4.73, compared to 3.57for Republicans.
10
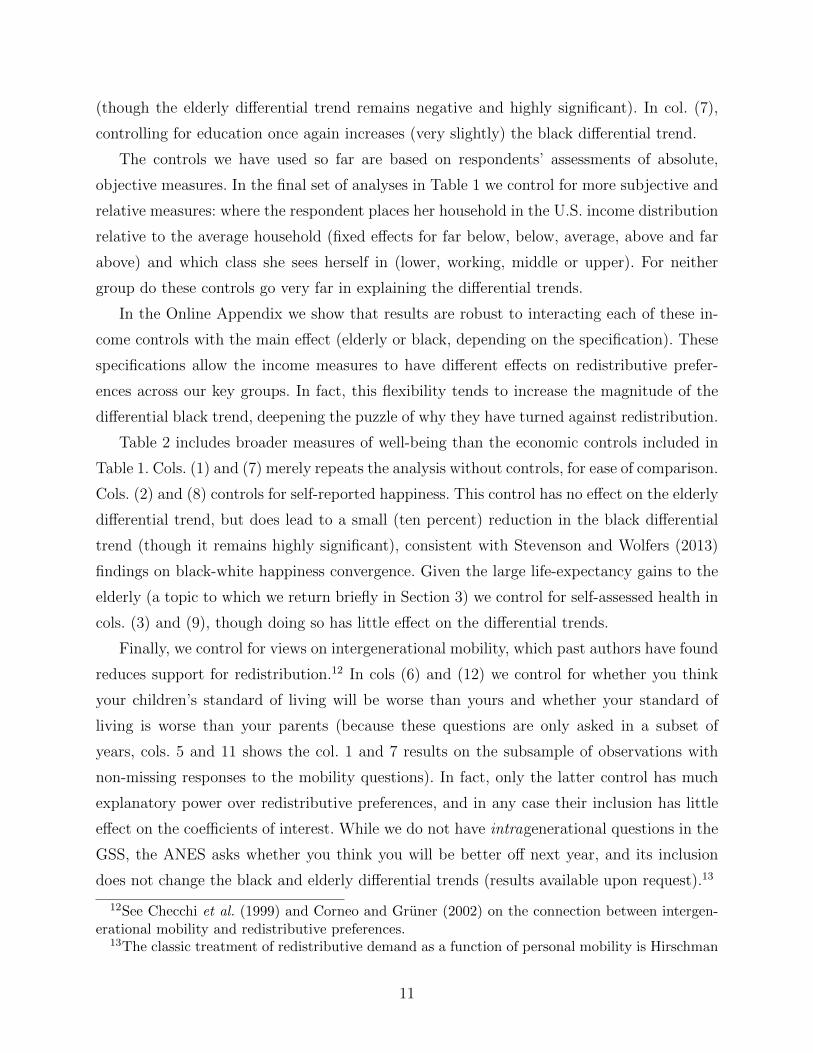
(though the elderly differential trend remains negative and highly significant). In col. (7),
controlling for education once again increases (very slightly) the black differential trend.
The controls we have used so far are based on respondents’ assessments of absolute,
objective measures. In the final set of analyses in Table 1 we control for more subjective and
relative measures: where the respondent places her household in the U.S. income distribution
relative to the average household (fixed effects for far below, below, average, above and far
above) and which class she sees herself in (lower, working, middle or upper). For neither
group do these controls go very far in explaining the differential trends.
In the Online Appendix we show that results are robust to interacting each of these in-
come controls with the main effect (elderly or black, depending on the specification). These
specifications allow the income measures to have different effects on redistributive prefer-
ences across our key groups. In fact, this flexibility tends to increase the magnitude of the
differential black trend, deepening the puzzle of why they have turned against redistribution.
Table 2 includes broader measures of well-being than the economic controls included in
Table 1. Cols. (1) and (7) merely repeats the analysis without controls, for ease of comparison.
Cols. (2) and (8) controls for self-reported happiness. This control has no effect on the elderly
differential trend, but does lead to a small (ten percent) reduction in the black differential
trend (though it remains highly significant), consistent with Stevenson and Wolfers (2013)
findings on black-white happiness convergence. Given the large life-expectancy gains to the
elderly (a topic to which we return briefly in Section 3) we control for self-assessed health in
cols. (3) and (9), though doing so has little effect on the differential trends.
Finally, we control for views on intergenerational mobility, which past authors have found
reduces support for redistribution.12 In cols (6) and (12) we control for whether you think
your children’s standard of living will be worse than yours and whether your standard of
living is worse than your parents (because these questions are only asked in a subset of
years, cols. 5 and 11 shows the col. 1 and 7 results on the subsample of observations with
non-missing responses to the mobility questions). In fact, only the latter control has much
explanatory power over redistributive preferences, and in any case their inclusion has little
effect on the coefficients of interest. While we do not have intragenerational questions in the
GSS, the ANES asks whether you think you will be better off next year, and its inclusion
does not change the black and elderly differential trends (results available upon request).13
12See Checchi et al. (1999) and Corneo and Gruner (2002) on the connection between intergen-erational mobility and redistributive preferences.
13The classic treatment of redistributive demand as a function of personal mobility is Hirschman
11

2.2 Increased conservatism and cognitive dissonance
A second hypothesis that we explore is that the declines in redistributive support amongst
the elderly and blacks are part of a larger trend of increased conservatism amongst these
groups. Kelly and Enns (2010), find that increased income inequality is associated with
increased conservatism. To the extent that this effect was differentially large for blacks and
the elderly, they may have become more conservative over time.
To explore the possibility of increasing conservatism more generally as a cause of in-
creased conservatism in redistributive views, in Table 3 we examine the extent to which our
differential trends by age (race) are “explained” by controls for conservatism. We recognize,
however, that a significant correlation between redistributive attitudes and other attitudes
could result from redistributive views as either cause or effect. Scholars have demonstrated
the relevance of the theory of cognitive dissonance (Festinger, 1957)—which posits a need
for internal consistency—to political views. (See for example Beasley and Joslyn, 2001, Mul-
lainathan and Washington (2009) and Gerber et al. (2010).)
But in fact the results of Table 3 demonstrate that for neither blacks nor the elderly is
the decline in redistributive support explained by a general movement toward conservatism.
In column 1 (5) we repeat the basic uncontrolled age (race) specification for comparison.
In cols. (2) and (6) we control for party identification (a one to seven scale running from
strong Democrat through strong Republican). For both blacks and the elderly, controlling for
party identification makes the magnitude of the differential redistributive trend even larger
(meaningfully so in the case of blacks). As these coefficient patterns suggest, despite their
movement away from redistribution, blacks and the elderly have become no more relatively
Republican (and in fact blacks have become, relatively, significantly more Democratic, as
whites have moved away from the party while blacks have remained loyal).
Cols. 3 and 7 show that, unlike party identification, controlling for political ideology (a
seven-point scale from extremely liberal through extremely conservative) does not increase
the magnitude of the black and elderly differential trends, but its effect on the coefficient
of interest is very small. Finally, as Layman (1997) and others since have noted, religious
attendance has become increasingly linked with conservatism, so in cols. (4) and (8) we add
a nine-point scale of attendance (from never attend to more than weekly) as a control. As
with political ideology, the effect on the coefficients of interest is very limited.
and Rothschild (1973). A more recent application with Russian data is Ravallion and Lokshin(2000).
12

In a final test of the general conservatism hypothesis we explore how views on certain
politically “hot-button” issues—abortion, homosexual sex and gun control—serve to explain
our patterns. We relegate these results to the Online Appendix because of loss of sample
size. Nonetheless, like the more global attitudinal measures, these single issues explain less
than 10 percent of our trends in redistributive views by age and race. We find no evidence
that the decline in redistributive support for either blacks or the elderly is part of a wider
trend toward conservatism.
2.3 Discussion
In general, controls associated with common models of redistributive preferences have limited
power to explain why the elderly and African-Americans have moved against redistribution,
relative to other Americans. In the case of the elderly, we find some evidence that the standard
model of economic self-interest may hold, as controlling for education (potentially a better
proxy of permanent income for this largely retired population than is current annual income)
reduces the differential elderly trend by one-fourth. For blacks, these standard controls enjoy
even less success in reducing the magnitude of the coefficient of interest. These “non-results”
do not appear driven by overly restrictive specifications—in the Online Appendix we show
results allowing each of these controls to have a different effect for the subgroup in question,
which in many cases reduces their ability to explain the differential subgroup trend for
redistribution.
In the final two sections of the paper, we move beyond standard redistributive theories
and instead explore whether historical or institutional factors specific to each of these groups
can provide clues to their declining support for redistribution.
3 Explanations specific to the elderly
3.1 Do unobserved changes to elderly wellbeing explain their trend?
While we are able to observe and control for economic and attitudinal shifts among the
elderly in our sample period, our controls perhaps imperfectly capture large, underlying
trends for this group. Life expectancy over our sample period has significantly increased,
and along with it the total years of retirement that individuals can expect to enjoy. Perhaps
as a reaction, a policy response has been increasing pressure to raise the official retirement
age, which could affect the elderly’s redistributive preferences.
13
In the United States, life expectancy for men (women) at age 65 increased from 13.2 (16.9)
years in 1970 to 17.8 (20.4) in 2011.14 And, indeed those 65 and over reporting good or very
good health between 1982 and 2011 grew from 65% to 75%.15 While we tried controlling for
health in our regression analysis, we may not be fully capturing these gains in wellbeing, nor
the effect of the corresponding policy pressure on retirement ages.
The parallel trends of increasing life expectancy at age 65 and the postponement of full
retirement benefits generally holds across OECD countries. In this section we ask, is the
relative decline in redistributive support among the elderly replicated in other developed
countries?
3.2 Comparing the elderly: international evidence
The General Social Survey and the ANES are relatively unusual in providing the ability
to examine several-decades-long trends regarding redistributive preferences. Multi-country
surveys such as the World Values Survey or the European Social Survey have only been
fielded three or four times (and in the case of the latter, only once before the 2008 economic
crisis) and are thus of limited use for long-run trend analysis. To place our results for the
American elderly in a comparative context we performed a comprehensive search of the
survey data from 17 developed countries 16 and found only four had similar data: the UK,
Germany, Sweden and Australia. In all three cases the available span of years was more
limited. While more data would have been ideal, these countries give us coverage from two
other Anglo-Saxon economies, as well as continental Europe and Scandinavia.
The immutability of age and the fact that all our case countries have state-run pension
programs, allows us to examine elderly support for redistribution cross-nationally. Each
of these countries have exhibited similar gains in life expectancy conditional on reaching
the retirement age, and all but one (Sweden) have planned increases in their “pensionable
ages.”17 As such, if these broad trends were causing the decline in the American elderly’s
14OECD (2015), Life expectancy at 65 (indicator). doi: 10.1787/0e9a3f00-en (Accessed on 08March 2015)
15OECD Health Statistics (2015). doi: 10.1787/health-data-en (Accessed on 08 March 2015)16Our universe was the 17 OECD nations including the United States with the highest per capita
income in 2012 according to The World Bank. These nations are in order: Norway, Switzerland,Luxembourg, Australia, Denmark, Sweden, (the United States), Canada, Austria, the Netherlands,Finland, Japan, Germany, Belgium, Iceland, France and the United Kingdom. We detail our searchincluding surveys consulted and the wording and years of relevant questions in Appendix A
17See “Trends in Pension Eligibility Ages and Life Expectancy, 1950-2050,” OECD publication.
14
redistributive preferences, we should see similar evidence abroad.
3.2.1 United Kingdom
The British Social Attitudes (BSA) survey has been administered annually since 1983. Sam-
pling aims to be representative of the British population and each year roughly 3,000 re-
spondents are interviewed in their homes. Britain is an especially useful comparison to the
US given its historical connections but also because the country has seen a marked rise in
pre-tax income inequality (though somewhat smaller than the increase in the US) since the
1980s.
In roughly half of the years since 1983, the BSA has asked three questions related to
redistributive preferences. The first asks whether the government should “reduce income
differences.” Respondents indicate their agreement with the idea on a five-point scale. The
second asks about the gaps between high and low incomes (“too small” being coded as one,
while “too large” coded as three). Finally, related to the first question, a third question
asks whether “the government should redistribute income” and again gives respondents a
five-point scale to indicate their agreement.
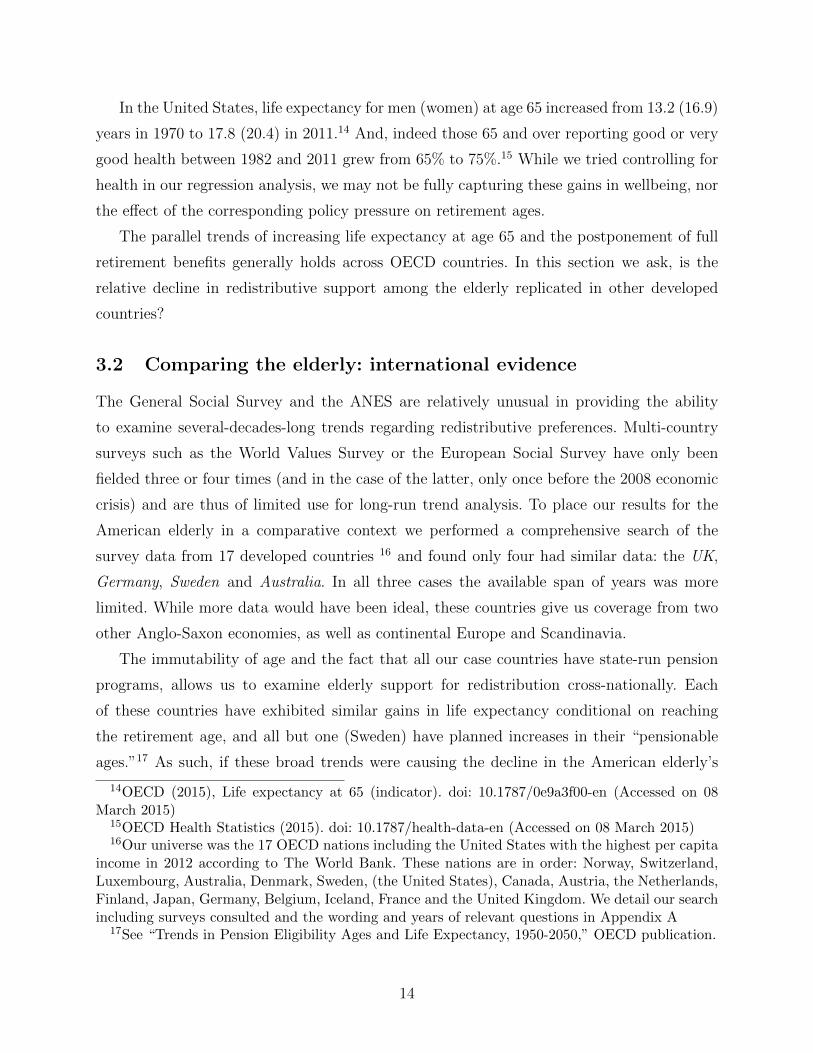
Figure 12 shows how the elderly versus other respondents answer the “reduce income
differences” question, which we believe provides the tightest comparison to Figure 6 from
the GSS. Before discussing differential trends by age, it is worth noting that, like in the US,
there is no obvious upward trend in support for redistribution, despite rising inequality. In
sharp contrast to the US, the elderly and non-elderly in the UK are on very similar trends,
and in fact the small difference is in a more positive trend for the elderly. In the Online
Appendix we show trends for the elderly are similar or if anything increasing in support of
redistribution relative to the non-elderly for the other redistributive questions as well.
3.2.2 Germany
The German General Social Survey has been fielded roughly every other year since 1980.18
Unfortunately, the German GSS redistributive questions are both less comparable to the
American GSS and asked less frequently than those in the BSA. The German GSS asks
individuals to place themselves on a four-point scale based on agreement with: “The state
18According to the German Social Survey (ALLBUS) Program, prior to 1990 the sample ofrespondents was drawn from West Germany and West Berlin. Following reunification, an additionalsurvey was conducted in 1991 where half the respondents were drawn from the former East andWest.
15
must ensure that people can live on a decent income, even in illness, hardship, unemployment
and old age.” In another question, again using a four-point scale, individuals are asked to
react to the statement “Income should not be based solely on individual achievement. Instead,
everybody should have what they and their family need for a decent life” as well as “Only
when differences in income and in social standing are large enough, is there an incentive for
individual achievement.” Given that the first statement involves the role of government, we
take it as the one closest to the GSS “reduce income differences” question.
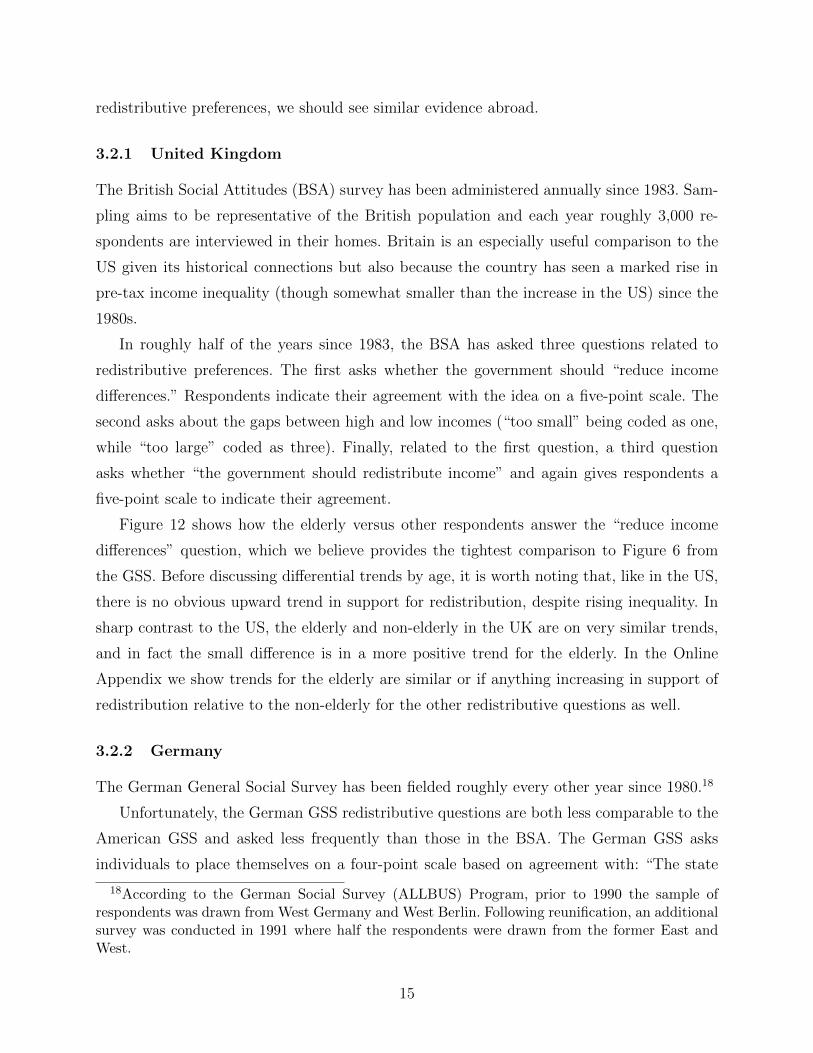
Figure 13 shows the evolution of answers to this question, again separately for the elderly
and non-elderly. Although the question was only fielded six times (and only five pre-recession
years), a clear negative trend for both groups emerges.19 As with the UK data, there is no
hint in the German trends that the elderly are differentially turning away from redistribution
and in fact the non-elderly are if anything increasingly skeptical of it. The Online Appendix
shows that this conclusion holds with the other outcome variables as well.
3.2.3 Sweden
The Swedish National Election Studies Program has fielded a question on redistributive pref-
erences six times between 1988 and 2006, asking respondents to indicate their agreement on
a five point scale with the statement: “Here are a number of proposals that have appeared in
the political debate. What is your opinion about...the proposal to: Reduce income differences
in society.”
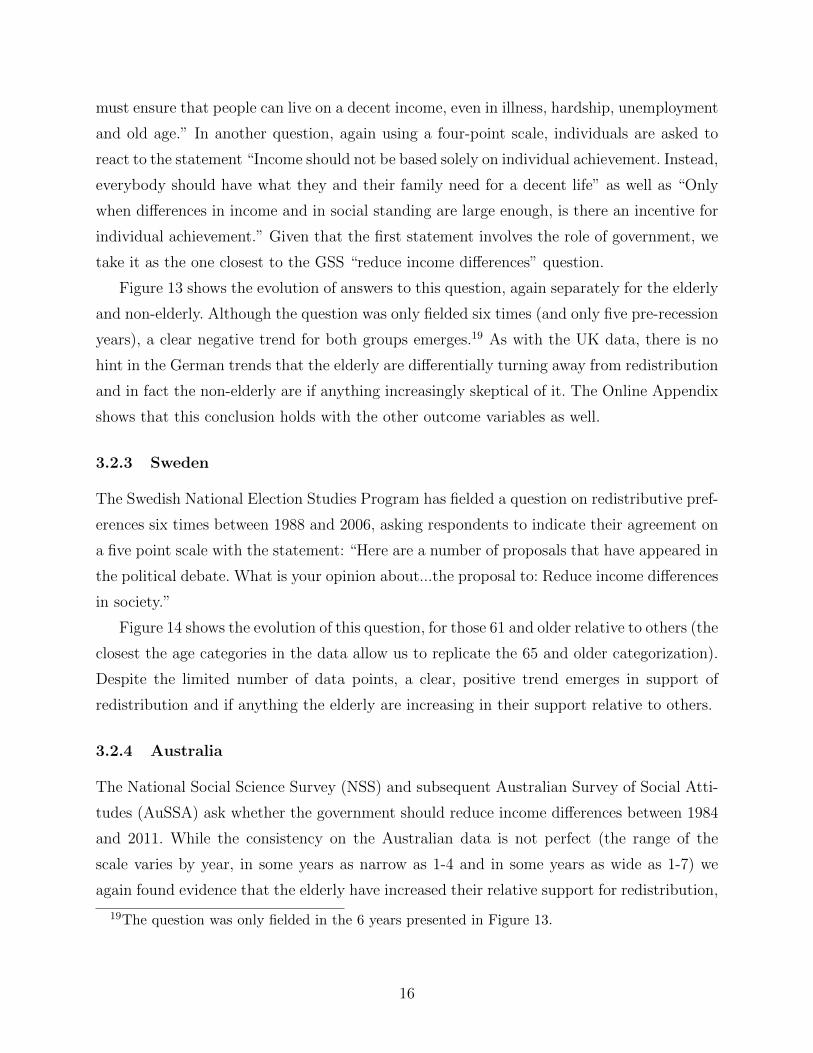
Figure 14 shows the evolution of this question, for those 61 and older relative to others (the
closest the age categories in the data allow us to replicate the 65 and older categorization).
Despite the limited number of data points, a clear, positive trend emerges in support of
redistribution and if anything the elderly are increasing in their support relative to others.
3.2.4 Australia
The National Social Science Survey (NSS) and subsequent Australian Survey of Social Atti-
tudes (AuSSA) ask whether the government should reduce income differences between 1984
and 2011. While the consistency on the Australian data is not perfect (the range of the
scale varies by year, in some years as narrow as 1-4 and in some years as wide as 1-7) we
again found evidence that the elderly have increased their relative support for redistribution,
19The question was only fielded in the 6 years presented in Figure 13.
16

as shown in Figure 15. Like in the UK, Germany, and Sweden the elderly show no sign of
decreasing their support relative to other respondents.
3.2.5 Discussion of international evidence
At least in relation to countries with comparable data, the elderly’s turning away from redis-
tribution appears to be a uniquely American phenomenon. Past work has found that relative
to other developed countries, American social spending is more tilted toward the elderly (see,
e.g., Lynch, 2001 and Tepe and Vanhuysse, 2010). In fact, these calculations typically exclude
health spending, suggesting elderly-bias is understated in the US, as until very recently the
elderly were one of the few groups guaranteed health insurance. The disproportionate gains
to the American elderly in terms of social spending over the past several decades may make
them wary of further extending redistributive programs. The next section explores this idea
in the context of health insurance.
3.3 Do views on government health insurance explain the elderly
trend?
As the previous section noted, the elderly in the US have many important similarities with
their counterparts in other OECD countries. But until the introduction of the Affordable Care
Act (after the end of our main sample period), the U.S. social insurance system exhibited a
key difference, relative to that in other developed countries, vis-a-vis the elderly: they alone
were guaranteed government provided health insurance.
Extending that protection to the rest of the population has been a key policy goal for
the American left for decades. Indeed, the last two Democratic presidents made passing
universal health insurance their first major policy goal upon taking office, though only the
current president, Barack Obama, can be said to have achieved that goal. In fact, views
about whether “it is the government’s responsibility to pay for doctor’s and hospital bills”
predict both Democratic party identification and self-identifying as “liberal” as strongly as
does views on redistribution.20
In this section we explore the idea that seniors, a group unique in having guaranteed
health insurance during our sample period, may increasingly feel that expansions of re-
distributive programs could come at their expense. Past work has shown that the fear of
20Authors’ calculations using the GSS.
17

Medicare cuts triggers seniors’ political activism (Campbell (2003)).21 In this section we ask
two questions: have seniors become increasingly opposed to government health insurance over
our sample period and, if so, can it explain their general decline of redistributive sentiment?
3.3.1 Seniors views on government health insurance
Both the GSS and ANES ask respondents about their views on government health insurance.
We focus on the GSS as this question is asked more often, though demonstrate robustness
with the ANES. Figure 16 shows the evolution over our sample period of views on the GSS
question of whether the government has the responsibility to pay for medical bills, separately
for seniors and other adults. Seniors show a significant decline in their support on this
question, moving (in the Republican direction) over half the partisan gap on this question.
In contrast, other adults have become more favorable toward the idea that government
bears some responsibility for covering medical costs (and, in fact, this trend is statistically
significant).
One might ask how, by the end of our sample period, seniors can be less supportive
of the idea that government cover medical bills given that they, uniquely, are categorically
entitled to this coverage. Mettler (2010) analyzes a 2008 survey, finding that 40% of Medicare
recipients answer that “they do not used a government social program,” suggesting a lower
bound of 40% of Medicare recipients who do not consider Medicare a government social
program. Most Medicare recipients pay a premium (that covers 25% of Part B costs), perhaps
leading them to think they cover the actuarial cost of the program. Finally, an increasing
share of Medicare beneficiaries join private Medicare Advantage health plans (fully financed
by capitation payments paid by the federal government), perhaps further weakening the
program’s association with government.
3.3.2 Views on government health insurance and redistribution
In Table 4, we explore whether respondents’ views on government’s role in covering medical
bills explains the divergent trends of the elderly and African-Americans on redistribution.
The first two columns of the table focus on the elderly results, with col. (1) replicating
the results with no additional controls, but including only the subsample that answer the
government health insurance question. Col. (2) adds the control for views on government
21This idea was certainly emphasized by media outlets that broadcasted video of irate seniorswith “Get your hands off my Medicare” signs at town hall meetings during the ACA debates.
18

covering medical bills. Not surprisingly, views on health insurance strongly prediction views
on redistribution: moving one unit on this 1-5 question (so, from support to strongly support
the idea that government should cover medical bills) increases support for redistribution by
0.50 points (or 40% of the partisan gap on redistribution).
More relevant for our analysis, controlling for this variable has a meaningful effect on the
elderly differential trend over redistributive preferences, reducing the coefficient of interest by
40%, though it is still significant at the ten percent level. This result is robust to controlling
more flexibly for view on health insurance (allowing it to enter as a fixed effect for each level
of support, instead of continuously, and interacting it with the elderly indicator), and results
are available upon request.
Given how many potential stories we have tested in the GSS and found had little ex-
planatory power, we worry that random chance might suggest that one story might show
statistical significance even if it had no true explanatory power. To somewhat assuage these
concerns, we replicate these patterns of results in the ANES. Most years since the 1970s, the
ANES has fielded the following question: “Some people feel there should be a government
insurance plan which would cover all medical and hospital expenses for everyone...Others feel
that medical expenses should be paid by individuals, and through private insurance plans.
Where do you place yourself on this scale?” We flip the variable so that it is increasing in
support for government health insurance.”
Figure 17 shows how the elderly versus others have evolved on this question. As with the
GSS, the elderly started the sample period as being more supportive than other adults, but
have substantially moved against the idea, so that by the end of the sample period they are
well below the rest of adults in their support. As in the GSS, non-elderly adults have become
more supportive of the idea of government insurance. The magnitude of these movements
relative to the partisan gap on this question also match those in the GSS.
In the Online Appendix we replicate the Table 4 analysis using ANES data. In fact, the
results are somewhat more dramatic: controlling for views on government insurance reduces
the coefficient of interest by nearly sixty percent, and it is no longer statistically significant.
A final point to discuss about both the GSS and ANES regression results is that the effect
of controlling for views on health insurance is much more muted for the regressions comparing
black and non-black redistributive trends. Blacks have slightly reduced their support for
government insurance relative to others, but the differential trend is small and insignificant,
supporting the idea that growing reservations about government health insurance is a trend
19

unique to the elderly during this period.
4 Blacks and fairness
There is a large literature linking redistributive preferences to perceptions of fairness. Those
who believe the distribution of income is fair are less likely to support government redistri-
bution. (See for example Alesina and Angeletos (2005) and Durante et al. (2013)). Blacks
fit this model. Although we have shown their support is declining, the level of black support
for income redistribution remains higher than that of whites. Blacks are on also on average
less likely than whites to say that economic rewards are fairly earned, a belief that is not
surprising given a legacy of slavery and segregation.
There are reasons to believe, however, that black views about fairness may be changing.
Although the black-white earnings gap is remarkably persistent, 22 Stevenson and Wolfers
(2013) document in the GSS a decline in the black-white happiness gap, a finding the authors
attribute to social gains in the arena of civil rights. In this section we ask two questions.
First, do blacks believe that economic rewards are becoming more fairly distributed And
if so, does this changing view “explain” in a regression sense, their decreased support for
redistribution?
We measure respondents’ sense of fairness using three questions across two surveys. Our
first question, drawn from the GSS, asks “Some people say that people get ahead by their
own hard work; others say that lucky breaks or help from other people are more important.
Which do you think is most important?” Valid answers are 1) hard work 2) equally important
and 3) luck. We refer to this as our “luck” question. In Figure 18 we graph responses by
race. Two things are notable. First, as expected blacks are on average more likely than whites
to say luck is more important than hard work. But second, the back-white gap has closed
substantially over our sample period. In fact, on average the black view has shifted nearly
twice the distance of the difference in the views of members of the two parties.
We next complement the fairness measure by examining views on aid targeted specifically
to blacks. Is an increasing sense of fairness coupled with a view that race specific aid is less
desirable? Both the GSS and the ANES have questions on this issue. The GSS asks, “Some
people feel that the government in Washington should make every possible effort to improve
22See Altonji and Blank (1999) on the stalling of the black-white wage convergence. In the mostrecent decade, the black-white gap has in fact grown (see www.census.gov/prod/2013pubs/p60-
245.pdf).
20
the social and economic position of blacks and other minority groups, even if it means giving
them preferential treatment. (Suppose these people are at one end of the scale at point
number 1.) Others feel that the government should not make any special effort to help
minorities because they should help themselves. (Suppose these people are at the other end,
at point 7. And of course, some other people have opinions somewhere in between at points
(2, 3, 4, 5, or 6.) Where would you place yourself on this scale, or haven’t you thought much
about this?” The ANES question, although varying slightly over time, is quite similar. ANES
asks, “Some people feel that the government in Washington should make every possible effort
to improve the social and economic position of blacks and other minority groups. (Suppose
these people are at one end of a scale, at point 1. Others feel that the government should not
make any special effort to help blacks because they should help themselves. Suppose these
people are at the other end, at point 7. And, of course, some other people have opinions
somewhere in between, at points 2,3,4,5 or 6. Where would you place yourself on this scale,
or haven’t you thought much about it?” We refer to these questions as our GSS and ANES
“black aid” questions.
Responses to the ANES and GSS questions show similar patterns. In both cases, blacks
are, unsurprisingly, more likely than whites to support government aid to blacks in particular.
But what is remarkable is that the views by race are converging, as over time blacks have
become less supportive of special treatment for blacks by the government. And like the
movement on the luck measure, the trend for blacks on government aid to blacks is quite
steep. The scaled drop in support is the full party distance in the ANES and 1.5 times that
distance in the GSS. Blacks view the economic system as becoming increasingly fair and are
decreasingly supportive of the government targeted aid based on race.
Does this changing sense of fairness “explain” blacks’ decreased support of redistribution?
We examine this question in Table 5. In columns 1 and 2 (5 and 6 for the age patterns) we
limit focus to the sample for which we have non-missing responses to the “luck” question.
We find like previous literature that a belief that luck determines outcomes positive pre-
dicts support for redistribution. Nonetheless, controlling for this belief only accounts for two
percent of the black-white redistribution trend gap. (The luck control explains none of the
elderly pattern.) In the remaining columns of the table we restrict attention to the sample
for which we have non-missing responses to the “black aid” question. Support for “black
aid” predicts support for redistribution. And controlling for “black aid” explains 45% of the
decline in black support for redistribution. But this “explanation” is not unique to blacks.
21
The control explains over 20% of the decline in elderly support.
Thus although we have “explained” in a regression sense nearly half of the black trend
in redistribution, we recognize that this “explanation” creates new puzzles: Why, in the face
of stalled economic catch up, are blacks decreasingly supportive of racially targeted aid?
5 Conclusion
Americans have had a puzzling reaction to rising economic inequality. Across a 40 year
period of increasing inequality, survey respondents have failed to increase their support for
redistribution. While we do not claim to have resolved the mystery, we have tried to offer a
number of clues.
First, we demonstrated that the overall flat trend in support for redistribution, masks con-
siderable and surprising heterogeneity. Blacks and the elderly, two groups who are relatively
more reliant on government assistance, have significantly decreased support for redistribution
over the sample period.
Second, we probed various hypotheses as to why redistributive support has trended down-
ward amongst these populations. These trends are not substantially explained by more com-
mon models of redistribution. Measures of economic and more general well-being fail to
explain either trend, with the exception of the education control (perhaps a proxy for per-
manent income in a retired population) which explains about a quarter of the elderly trend.
Nor do we find evidence that these trends reflect a wider movement towards conservatism
amongst these groups. In fact, blacks have identified increasingly as Democrats over the
period.
Third, we moved beyond the more basic models to generate and test hypotheses unique to
each group. In this case of the elderly, we can rule out that the trend is driven by something
particular to the aging process in this new millennium, as we do not see a similar pattern in
OECD countries with comparable data. Instead, we hypothesize that the trend derives from
a uniquely American concern. The elderly in the US are the only immutable group entitled
to government health insurance. Thus we ask in this period in which universal health care
has moved in and out of policy discussions, whether seniors, perhaps concerned about the
crowd out of funding for their own care, have grown increasingly unsupportive of extending
guaranteed government health care. We find not only a trend of decreasing support for
universal care, but that this variable “explains” 40% of the elderly’s decreased support for
redistribution.
22

For blacks, we offer not as much of a hypothesis, but the identification of a concur-
rent trend. We find that blacks, while more likely than whites to support racially-targeted
government aid, are converging toward the opinion of whites. (Concurrently and perhaps
relatedly, blacks are increasingly likely to say that economic outcomes can be attributed to
hard work over luck.) We find this decrease in support for race-based aid “explains” nearly
50% of blacks’ decreased support for redistribution, a finding that deepens the puzzle: Why
is support for race-targeted aid decreasing during a period in which the black-white wage
gap has stagnated?
We present these ideas of elderly Medicare threat and blacks’ increased sense of fairness,
not as conclusions but as hopefully useful staring points for researchers who may confirm or
challenge these ideas as they seek to explain the trend of redistributive views in the United
States during this period of rising inequality.

REFERENCES
Altonji, J. G. and Blank, R. M. (1999). Race and gender in the labor market. Handbookof labor economics, 3, 3143–3259.
Autor, D. H. (2014). Skills, education, and the rise of earnings inequality among the other99 percent. Science, 344 (6186), 843–851.
Beasley, R. K. and Joslyn, M. R. (2001). Cognitive dissonance and post-decision atti-tude change in six presidential elections. Political Psychology, 22 (3), 521–540.
Benabou, R. and Ok, E. (2001). Social mobility and the demand for redistribution: ThePOUM hypothesis. Quarterly Journal of Economics, 116 (2), 447–487.
Campbell, A. L. (2003). Participatory reactions to policy threats: Senior citizens and thedefense of social security and medicare. Political Behavior, 25 (1), 29–49.
Checchi, D., Ichino, A. and Rustichini, A. (1999). More equal but less mobile?: Ed-ucation financing and intergenerational mobility in italy and in the us. Journal of publiceconomics, 74 (3), 351–393.
Corneo, G. and Gruner, H. P. (2002). Individual preferences for political redistribution.Journal of public Economics, 83 (1), 83–107.
Festinger, L. (1957). A Theory of Cognitive Dissonance. Row, Peterson & Co.
Hirschman, A. O. and Rothschild, M. (1973). The changing tolerance for income in-equality in the course of economic development. The Quarterly Journal of Economics, pp.544–566.
Kelly, N. and Enns, P. (2010). Inequality and the dynamics of public opinion: The self-reinforcing link between economic inequality and mass preferences. American Journal ofPolitical Science.
Kenworthy, L. and McCall, L. (2008). Inequality, public opinion and redistribution.Socio-Economic Review, 6 (1), 35.
Kuziemko, I., Norton, M. I., Saez, E. and Stantcheva, S. (2013). How Elastic ArePreferences for Redistribution? Evidence from Randomized Survey Experiments. WorkingPaper 18865, National Bureau of Economic Research.
Layman, G. C. (1997). Religion and political behavior in the united states: The impactof beliefs, affiliations, and commitment from 1980 to 1994. Public Opinion Quarterly, pp.288–316.
Lee, W. and Roemer, J. E. (2006). Racism and redistribution in the United States: Asolution to the problem of American exceptionalism. Journal of Public Economics, 90 (6),1027–1052.
24
Lynch, J. (2001). The age-orientation of social policy regimes in oecd countries. Journal ofSocial Policy, 30 (03), 411–436.
Meltzer, A. and Richard, S. (1981). A rational theory of the size of government. TheJournal of Political Economy, 89 (5), 914–927.
Mettler, S. (2010). Reconstituting the submerged state: The challenges of social policyreform in the obama era. Perspectives on Politics, 8 (03), 803–824.
Mullainathan, S. and Washington, E. (2009). Sticking with your vote: Cognitive dis-sonance and political attitudes. American Economic Journal: Applied Economics, 1 (1),86–111.
Piketty, T. and Saez, E. (2003). Income inequality in the united states, 1913–1998. TheQuarterly Journal of Economics, 118 (1), 1–41.
Ravallion, M. and Lokshin, M. (2000). Who wants to redistribute?: The tunnel effectin 1990s russia. Journal of public Economics, 76 (1), 87–104.
Stevenson, B. and Wolfers, J. (2013). Subjective and objective indicators of racialprogress. Tech. rep., National Bureau of Economic Research.
Tepe, M. and Vanhuysse, P. (2010). Elderly bias, new social risks and social spending:change and timing in eight programmes across four worlds of welfare, 1980-2003. Journalof European Social Policy, 20 (3), 217–234.
25

Figure 1: Income share of the top one percent
Notes: Taken from http://eml.berkeley.edu/~saez/TabFig2012prel.xls
26
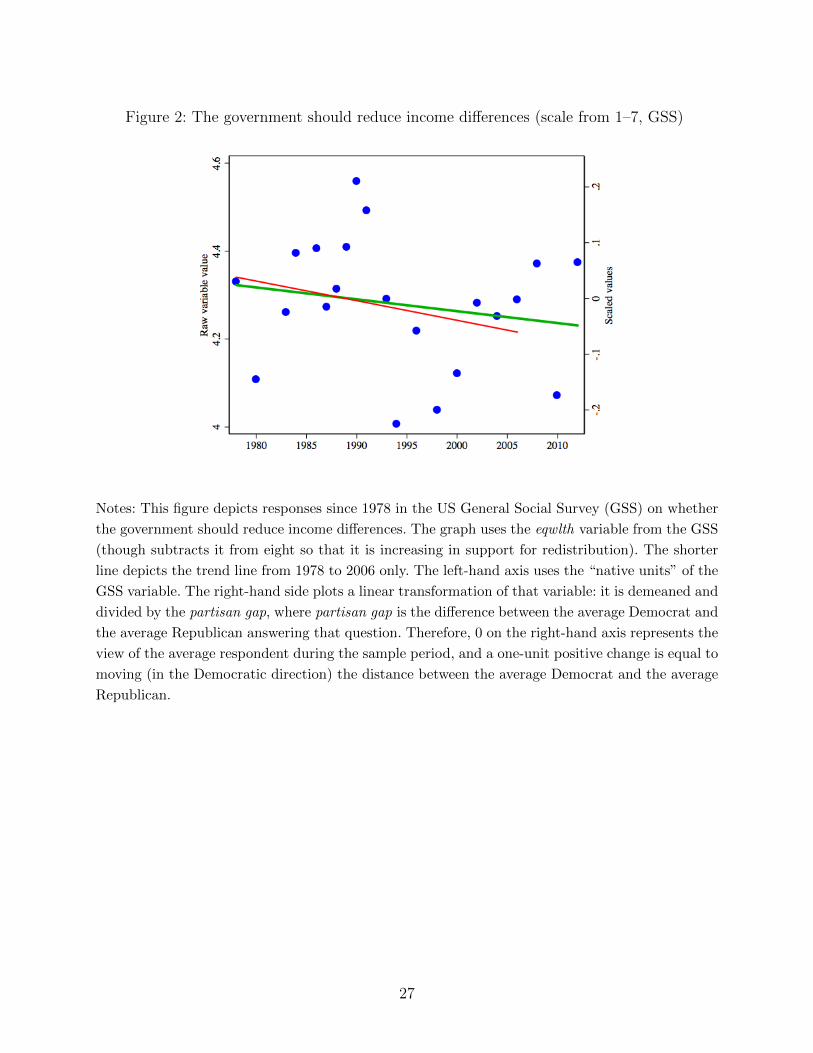
Figure 2: The government should reduce income differences (scale from 1–7, GSS)
Notes: This figure depicts responses since 1978 in the US General Social Survey (GSS) on whether
the government should reduce income differences. The graph uses the eqwlth variable from the GSS
(though subtracts it from eight so that it is increasing in support for redistribution). The shorter
line depicts the trend line from 1978 to 2006 only. The left-hand axis uses the “native units” of the
GSS variable. The right-hand side plots a linear transformation of that variable: it is demeaned and
divided by the partisan gap, where partisan gap is the difference between the average Democrat and
the average Republican answering that question. Therefore, 0 on the right-hand axis represents the
view of the average respondent during the sample period, and a one-unit positive change is equal to
moving (in the Democratic direction) the distance between the average Democrat and the average
Republican.
27

Figure 3: The government should guarantee basic standard of living (scale from 1–7, GSS)
Notes: This figure depicts responses since 1978 in the US General Social Survey (GSS) on whether
the government should provide a basic standard of living. The graph uses the helppoor variable
from the GSS (though subtracts it from six so that it is increasing in support for redistribution).
The shorter line depicts the trend line from 1978 to 2006 only. The left-hand axis uses the “native
units” of the GSS variable, whereas the right-hand axis scaled them by the difference between the
average Democrat and Republican. See Figure 2 for a fuller description of the scaled values.
28

Figure 4: The government should guarantee basic standard of living (scale from 1–7, GSS)
Notes: This figure depicts responses since 1978 in the US General Social Survey (GSS) on whether
the government should provide a basic standard of living. The graph uses the helpnot variable from
the GSS (though subtracts it from six so that it is increasing in support for redistribution). The
shorter line depicts the trend line from 1978 to 2006 only. The left-hand axis uses the “native units”
of the GSS variable, whereas the right-hand axis scaled them by the difference between the average
Democrat and Republican. See Figure 2 for a fuller description of the scaled values.
29

Figure 5: The government should guarantee job and living standards (scale from 1–7, ANES)
Notes: This figure depicts responses since 1972 in the American National Election Studies (ANES)
on whether the government should see that every person has a job and good standard of living.
The left-hand axis uses the “native units” of the ANES variable. The right-hand side plots a linear
transformation of that variable: it is demeaned and divided by the partisan gap, where partisan
gap is the difference between the average Democrat and the average Republican answering that
question. Therefore, 0 on the right-hand axis represents the view of the average respondent during
the sample period, and a one-unit positive change is equal to moving (in the Democratic direction)
the distance between the average Democrat and the average Republican.
30

Figure 6: The government should reduce income differences, by age (GSS)
Notes: This figure depicts responses since 1978 in the US General Social Survey (GSS) on whether
the government should reduce income differences. The graph uses the eqwlth variable from the GSS
(though subtracts it from eight so that it is increasing in support for redistribution). The shorter
line depicts the trend line from 1978 to 2006 only. The left-hand axis uses the “native units” of the
GSS variable. The right-hand side plots a linear transformation of that variable: it is demeaned and
divided by the partisan gap, where partisan gap is the difference between the average Democrat and
the average Republican answering that question. Therefore, 0 on the right-hand axis represents the
view of the average respondent during the sample period, and a one-unit positive change is equal to
moving (in the Democratic direction) the distance between the average Democrat and the average
Republican.
31

Figure 7: The government should guarantee jobs and living standards, by age (ANES)
Notes: This figure depicts responses since 1972 in the American National Election Studies
(ANES) on whether the government should see that every person has a job and good standard
of living. The left-hand axis uses the “native units” of the ANES variable. The right-hand side
plots a linear transformation of that variable: it is demeaned and divided by the partisan
gap, where partisan gap is the difference between the average Democrat and the average
Republican answering that question. Therefore, 0 on the right-hand axis represents the view
of the average respondent during the sample period, and a one-unit positive change is equal
to moving (in the Democratic direction) the distance between the average Democrat and the
average Republican.
32

Figure 8: The government should reduce income differences, by race (GSS)
Notes: This figure depicts responses since 1978 in the US General Social Survey (GSS) on whether
the government should reduce income differences. The graph uses the eqwlth variable from the GSS
(though subtracts it from eight so that it is increasing in support for redistribution). The shorter
line depicts the trend line from 1978 to 2006 only. The left-hand axis uses the “native units” of the
GSS variable. The right-hand side plots a linear transformation of that variable: it is demeaned and
divided by the partisan gap, where partisan gap is the difference between the average Democrat and
the average Republican answering that question. Therefore, 0 on the right-hand axis represents the
view of the average respondent during the sample period, and a one-unit positive change is equal to
moving (in the Democratic direction) the distance between the average Democrat and the average
Republican.
33

Figure 9: The government should guarantee jobs and living standards, by race (ANES)
Notes: This figure depicts responses since 1972 in the American National Election Studies (ANES)
on whether the government should see that every person has a job and good standard of living.
The left-hand axis uses the “native units” of the ANES variable. The right-hand side plots a linear
transformation of that variable: it is demeaned and divided by the partisan gap, where partisan
gap is the difference between the average Democrat and the average Republican answering that
question. Therefore, 0 on the right-hand axis represents the view of the average respondent during
the sample period, and a one-unit positive change is equal to moving (in the Democratic direction)
the distance between the average Democrat and the average Republican.
34

Figure 10: The government should reduce income differences, by gender (GSS)
Notes: This figure depicts responses since 1978 in the US General Social Survey (GSS) on whether
the government should reduce income differences. The graph uses the eqwlth variable from the GSS
(though subtracts it from eight so that it is increasing in support for redistribution). The shorter
line depicts the trend line from 1978 to 2006 only. The left-hand axis uses the “native units” of the
GSS variable. The right-hand side plots a linear transformation of that variable: it is demeaned and
divided by the partisan gap, where partisan gap is the difference between the average Democrat and
the average Republican answering that question. Therefore, 0 on the right-hand axis represents the
view of the average respondent during the sample period, and a one-unit positive change is equal to
moving (in the Democratic direction) the distance between the average Democrat and the average
Republican.
35

Figure 11: The government should reduce income differences, by income category (GSS)
Notes: This figure depicts responses since 1978 in the US General Social Survey (GSS) on whether
the government should reduce income differences. The graph uses the eqwlth variable from the GSS
(though subtracts it from eight so that it is increasing in support for redistribution). The shorter
line depicts the trend line from 1978 to 2006 only. The left-hand axis uses the “native units” of the
GSS variable. The right-hand side plots a linear transformation of that variable: it is demeaned and
divided by the partisan gap, where partisan gap is the difference between the average Democrat and
the average Republican answering that question. Therefore, 0 on the right-hand axis represents the
view of the average respondent during the sample period, and a one-unit positive change is equal to
moving (in the Democratic direction) the distance between the average Democrat and the average
Republican.
36

Figure 12: Agreement that government should reduce income differences, elderly versus oth-ers, British Social Attitudes survey
3.25
3.50
3.75
1985
1986
1987
1990
1991
1993
1996
1999
2000
2004
2006
2009
2010
2012
Gov
t sho
uld
redu
ce in
com
e di
ffs?
Age Group Ages 18−64 Ages 65 and older
Notes: This figure depicts responses since 1985 in the British Social Attitudes (BSA) on whetherthe government should reduce income differences. The graph uses the incdiff variable from the BSA(though subtracts it from six so that it is increasing in support for government activism). Note,for 2006 and 2012 the four-point GovResp7 variable was recoded to a five-point increasing scale(the middle category was omitted) and used for the analysis. The shorter line depicts the trend linefrom 1985 to 2004 only.
37

Figure 13: Agreement that state should ensure decent income, elderly versus others, GermanGeneral Social Survey (ALLBUS)
3.2
3.3
3.4
3.5
1984
1991
1994
2000
2004
2010
Sta
te e
nsur
e pe
ople
live
on
dece
nt in
com
e?
Age Group Ages 18−64 Ages 65 and older
Notes: This figure depicts responses since 1984 in the German General Social Survey (ALLBUS)on whether the state should ensure people a decent income. The graph uses the V183 variablefrom the ALLBUS (though subtracts it from five so that it is increasing in support for governmentactivism). The shorter line depicts the trend line from 1984 to 2004 only.
38

Figure 14: Agreement with proposal to reduce income differences in society, elderly versusothers, Swedish National Election Studies (SNES) Program
3.6
3.7
3.8
3.9
4.0
1988
1991
1994
1998
2002
2006
Red
uce
inco
me
diffe
renc
es in
soc
iety
?
Age Group Ages 18−60 Ages 61 and older
Notes: This figure depicts responses since 1988 in the Swedish National Election Studies (SNES)Program on whether the government should reduce income differences. The graph uses the v121,v130, v131, v142, v153, and v406 variables from the SNES in the years presented above, respectively(though subtracts it from six so that it is increasing in support for government activism).
39

Figure 15: Agreement that government should reduce income differences, elderly versus oth-ers, Australian National National Social Science Survey (NSSS)
3.2
3.4
3.6
1984
1986
1987
1989
1993
1994
1995
2007
2009
2011
Gov
t sho
uld
redu
ce in
com
e di
ffs?
Age Group Ages 18−64 Ages 65 and older
Notes: This figure depicts responses since 1984 in the Australian National National Social ScienceSurvey (NSSS) on whether the government should reduce income differences. The graph uses theEQUALITY, RICHPOR3, LESSINEQ, LESSINEQ, LESSINE3, P22Q15B, and P56Q15B vari-ables from the NSSS in the years presented above, respectively (responses are converted to afive-point scale that is increasing in support for government activism).
40

Figure 16: The government should cover medical bills, by age (GSS)
Notes: The graph uses the help sick variable from the GSS. The shorter line depicts the trend
through 2006 only. The left-hand axis uses the “native units” of the GSS variable. The right-hand
side plots a linear transformation of that variable: it is demeaned and divided by the partisan gap,
where partisan gap is the difference between the average Democrat and the average Republican
answering that question. Therefore, 0 on the right-hand axis represents the view of the average
respondent during the sample period, and a one-unit positive change is equal to moving (in the
Democratic direction) the distance between the average Democrat and the average Republican.
41
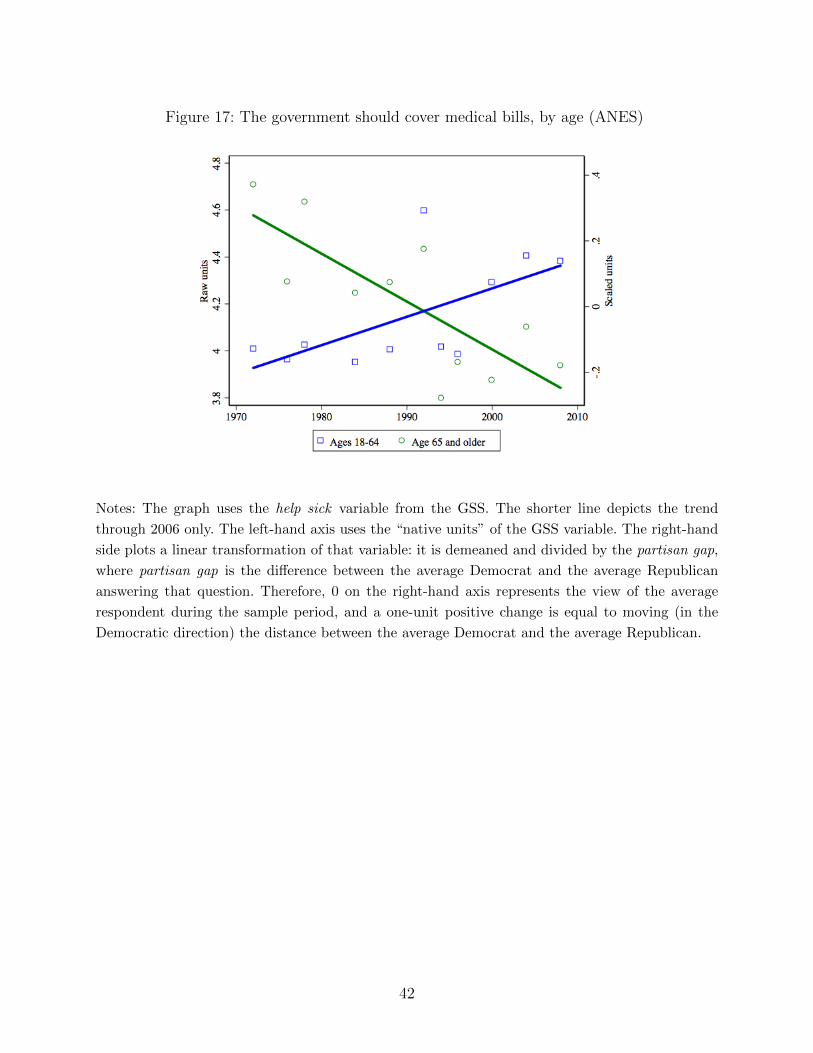
Figure 17: The government should cover medical bills, by age (ANES)
Notes: The graph uses the help sick variable from the GSS. The shorter line depicts the trend
through 2006 only. The left-hand axis uses the “native units” of the GSS variable. The right-hand
side plots a linear transformation of that variable: it is demeaned and divided by the partisan gap,
where partisan gap is the difference between the average Democrat and the average Republican
answering that question. Therefore, 0 on the right-hand axis represents the view of the average
respondent during the sample period, and a one-unit positive change is equal to moving (in the
Democratic direction) the distance between the average Democrat and the average Republican.
42

Figure 18: Luck and help key to success, by race (GSS)
Notes: The graph uses the getahead variable from the GSS. The shorter line depicts the trend line
through 2006 only. The left-hand axis uses the “native units” of the GSS variable. The right-hand
side plots a linear transformation of that variable: it is demeaned and divided by the partisan gap,
where partisan gap is the difference between the average Democrat and the average Republican
answering that question. Therefore, 0 on the right-hand axis represents the view of the average
respondent during the sample period, and a one-unit positive change is equal to moving (in the
Democratic direction) the distance between the average Democrat and the average Republican.
43

Figure 19: The government should treat blacks specially, by race (GSS)
Notes: The graph uses the helpblacks variable from the GSS. The shorter line depicts the trend line
through 2006 only. The left-hand axis uses the “native units” of the GSS variable. The right-hand
side plots a linear transformation of that variable: it is demeaned and divided by the partisan gap,
where partisan gap is the difference between the average Democrat and the average Republican
answering that question. Therefore, 0 on the right-hand axis represents the view of the average
respondent during the sample period, and a one-unit positive change is equal to moving (in the
Democratic direction) the distance between the average Democrat and the average Republican.
44
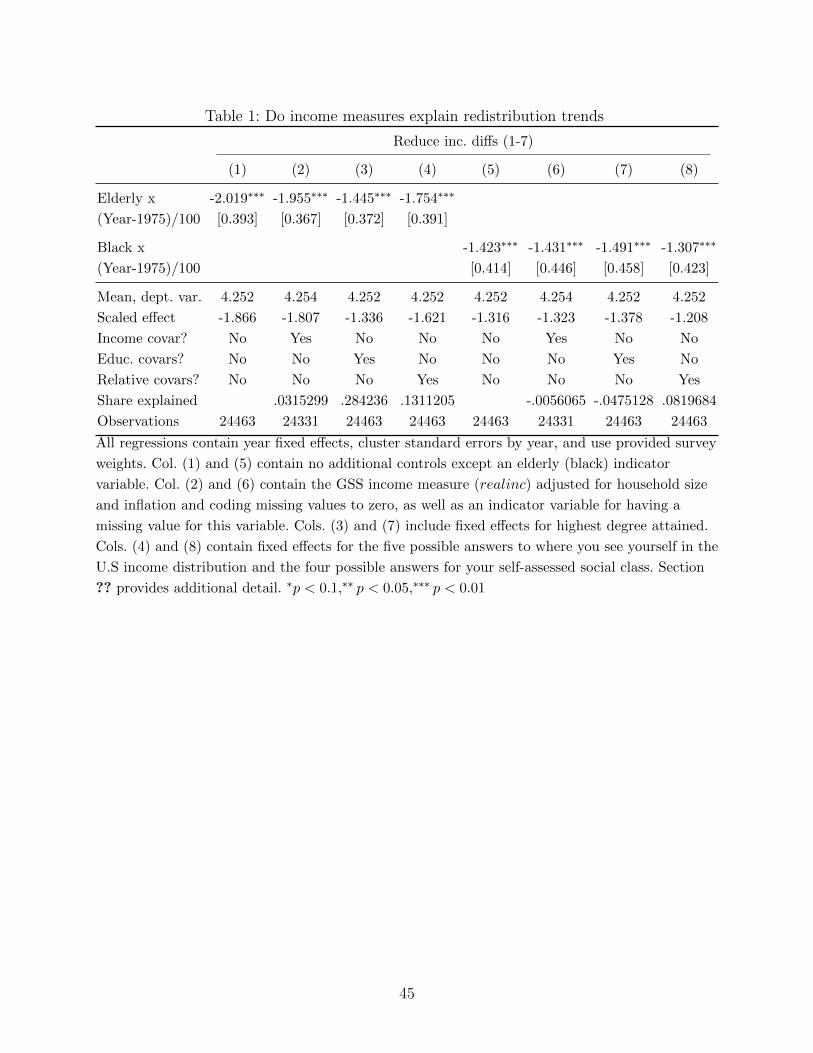
Table 1: Do income measures explain redistribution trends
Reduce inc. diffs (1-7)
(1) (2) (3) (4) (5) (6) (7) (8)
Elderly x -2.019∗∗∗ -1.955∗∗∗ -1.445∗∗∗ -1.754∗∗∗
(Year-1975)/100 [0.393] [0.367] [0.372] [0.391]
Black x -1.423∗∗∗ -1.431∗∗∗ -1.491∗∗∗ -1.307∗∗∗
(Year-1975)/100 [0.414] [0.446] [0.458] [0.423]
Mean, dept. var. 4.252 4.254 4.252 4.252 4.252 4.254 4.252 4.252
Scaled effect -1.866 -1.807 -1.336 -1.621 -1.316 -1.323 -1.378 -1.208
Income covar? No Yes No No No Yes No No
Educ. covars? No No Yes No No No Yes No
Relative covars? No No No Yes No No No Yes
Share explained .0315299 .284236 .1311205 -.0056065 -.0475128 .0819684
Observations 24463 24331 24463 24463 24463 24331 24463 24463
All regressions contain year fixed effects, cluster standard errors by year, and use provided survey
weights. Col. (1) and (5) contain no additional controls except an elderly (black) indicator
variable. Col. (2) and (6) contain the GSS income measure (realinc) adjusted for household size
and inflation and coding missing values to zero, as well as an indicator variable for having a
missing value for this variable. Cols. (3) and (7) include fixed effects for highest degree attained.
Cols. (4) and (8) contain fixed effects for the five possible answers to where you see yourself in the
U.S income distribution and the four possible answers for your self-assessed social class. Section
?? provides additional detail. ∗p < 0.1,∗∗ p < 0.05,∗∗∗ p < 0.01
45
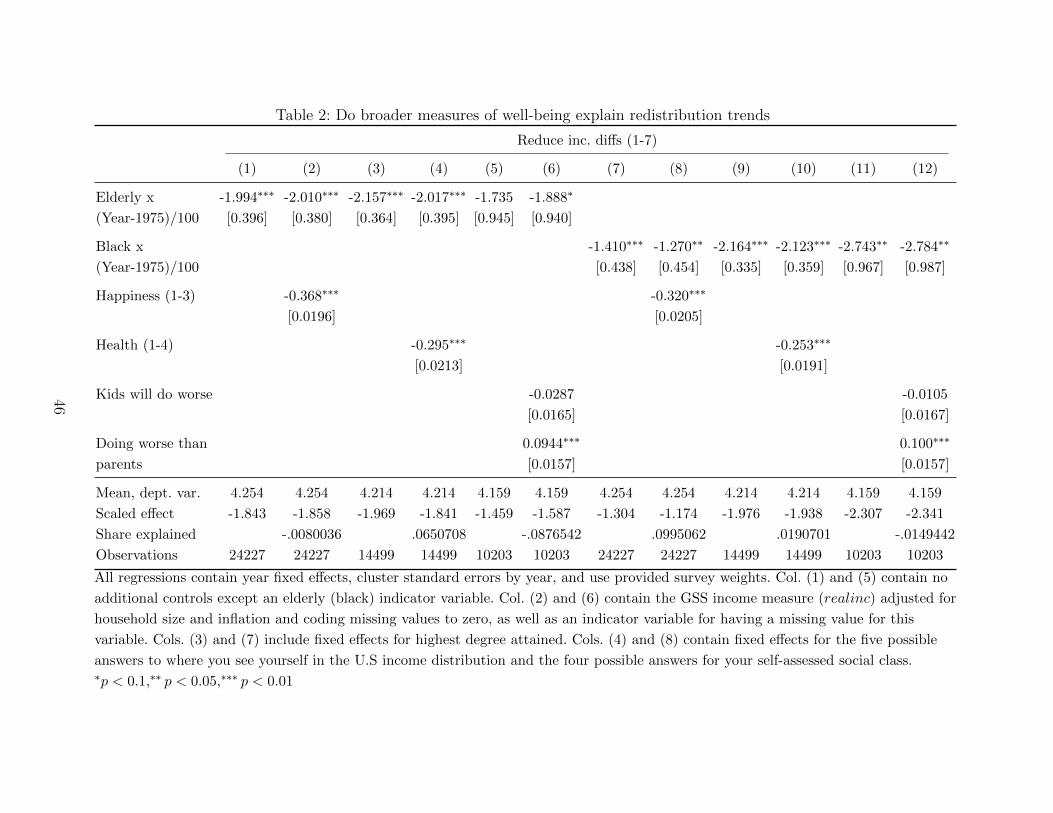
Table 2: Do broader measures of well-being explain redistribution trends
Reduce inc. diffs (1-7)
(1) (2) (3) (4) (5) (6) (7) (8) (9) (10) (11) (12)
Elderly x -1.994∗∗∗ -2.010∗∗∗ -2.157∗∗∗ -2.017∗∗∗ -1.735 -1.888∗
(Year-1975)/100 [0.396] [0.380] [0.364] [0.395] [0.945] [0.940]
Black x -1.410∗∗∗ -1.270∗∗ -2.164∗∗∗ -2.123∗∗∗ -2.743∗∗ -2.784∗∗
(Year-1975)/100 [0.438] [0.454] [0.335] [0.359] [0.967] [0.987]
Happiness (1-3) -0.368∗∗∗ -0.320∗∗∗
[0.0196] [0.0205]
Health (1-4) -0.295∗∗∗ -0.253∗∗∗
[0.0213] [0.0191]
Kids will do worse -0.0287 -0.0105
[0.0165] [0.0167]
Doing worse than 0.0944∗∗∗ 0.100∗∗∗
parents [0.0157] [0.0157]
Mean, dept. var. 4.254 4.254 4.214 4.214 4.159 4.159 4.254 4.254 4.214 4.214 4.159 4.159
Scaled effect -1.843 -1.858 -1.969 -1.841 -1.459 -1.587 -1.304 -1.174 -1.976 -1.938 -2.307 -2.341
Share explained -.0080036 .0650708 -.0876542 .0995062 .0190701 -.0149442
Observations 24227 24227 14499 14499 10203 10203 24227 24227 14499 14499 10203 10203
All regressions contain year fixed effects, cluster standard errors by year, and use provided survey weights. Col. (1) and (5) contain no
additional controls except an elderly (black) indicator variable. Col. (2) and (6) contain the GSS income measure (realinc) adjusted for
household size and inflation and coding missing values to zero, as well as an indicator variable for having a missing value for this
variable. Cols. (3) and (7) include fixed effects for highest degree attained. Cols. (4) and (8) contain fixed effects for the five possible
answers to where you see yourself in the U.S income distribution and the four possible answers for your self-assessed social class.∗p < 0.1,∗∗ p < 0.05,∗∗∗ p < 0.01
46

Table 3: Does general conservatism explain redistribution trends?
Reduce income differences (1-7)
(1) (2) (3) (4) (5) (6) (7) (8)
Elderly x -2.096∗∗∗ -2.200∗∗∗ -1.906∗∗∗ -2.064∗∗∗
(Year-1975)/100 [0.398] [0.437] [0.372] [0.404]
Black x -1.500∗∗∗ -1.720∗∗∗ -1.462∗∗∗ -1.391∗∗∗
(Year-1975)/100 [0.453] [0.434] [0.498] [0.451]
Identify Republ. (1-7) -0.265∗∗∗ -0.241∗∗∗
[0.00877] [0.00995]
Lib to cons (1-7) -0.305∗∗∗ -0.290∗∗∗
[0.0117] [0.0127]
Relig. attendence -0.0267∗∗∗ -0.0372∗∗∗
(1-9) [0.00516] [0.00593]
Mean, dept. var. 4.232 4.232 4.232 4.232 4.232 4.232 4.232 4.232
Scaled effect -1.959 -2.056 -1.782 -1.929 -1.402 -1.608 -1.366 -1.301
Share explained -.049555 .090515 .0154611 -.1466506 .0254986 .0724976
Observations 22172 22172 22172 22172 22172 22172 22172 22172
See notes for Table 1. ∗p < 0.1,∗∗ p < 0.05,∗∗∗ p < 0.01
Table 4: Do views on public health insurance explain redistributive trends?
Reduce inc. diffs
(1) (2) (3) (4)
Black x -1.279∗∗ -1.090∗
(Year-1975)/100 [0.444] [0.555]
Elderly x -1.597∗∗ -0.973∗
(Year-1975)/100 [0.550] [0.477]
Gov’t medical care 0.504∗∗∗ 0.479∗∗∗
[0.0222] [0.0221]
Mean, dept. var. 4.263 4.263 4.263 4.263
Scaled effect -1.432 -0.873 -1.148 -0.978
Share explained – .3903931 – .1482657
Observations 21773 21773 21773 21773
See notes for Table 1. ∗p < 0.1,∗∗ p < 0.05,∗∗∗ p < 0.01
47
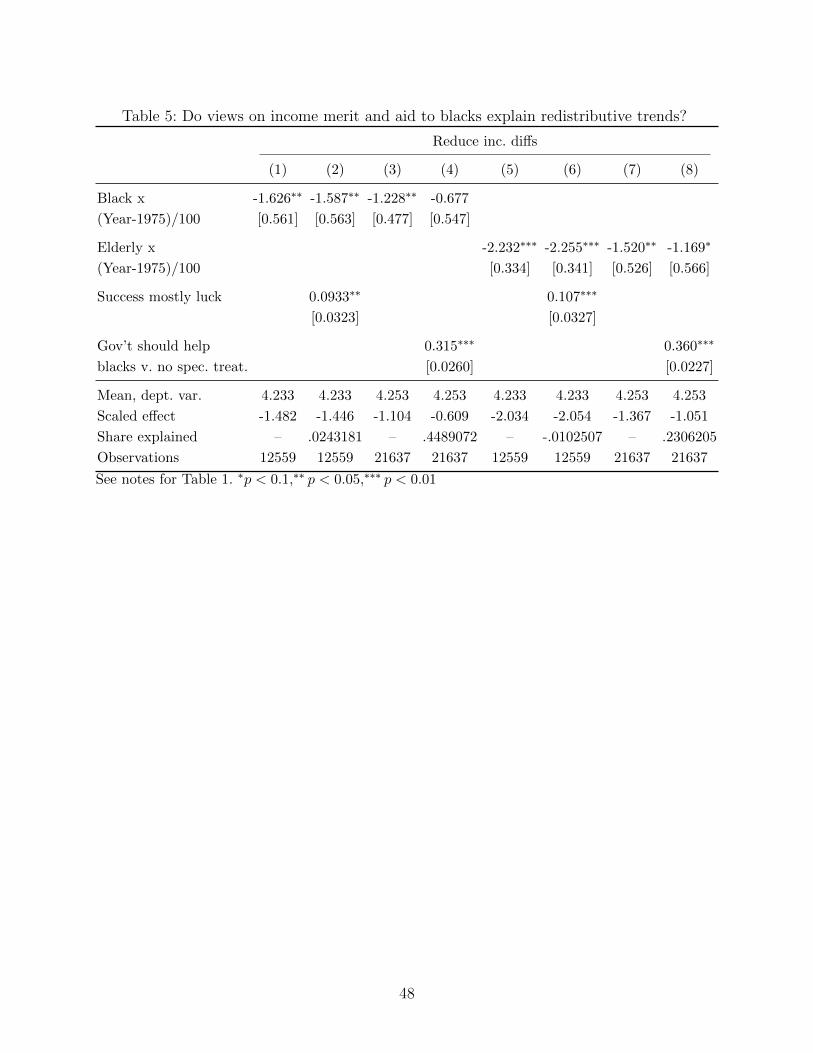
Table 5: Do views on income merit and aid to blacks explain redistributive trends?
Reduce inc. diffs
(1) (2) (3) (4) (5) (6) (7) (8)
Black x -1.626∗∗ -1.587∗∗ -1.228∗∗ -0.677
(Year-1975)/100 [0.561] [0.563] [0.477] [0.547]
Elderly x -2.232∗∗∗ -2.255∗∗∗ -1.520∗∗ -1.169∗
(Year-1975)/100 [0.334] [0.341] [0.526] [0.566]
Success mostly luck 0.0933∗∗ 0.107∗∗∗
[0.0323] [0.0327]
Gov’t should help 0.315∗∗∗ 0.360∗∗∗
blacks v. no spec. treat. [0.0260] [0.0227]
Mean, dept. var. 4.233 4.233 4.253 4.253 4.233 4.233 4.253 4.253
Scaled effect -1.482 -1.446 -1.104 -0.609 -2.034 -2.054 -1.367 -1.051
Share explained – .0243181 – .4489072 – -.0102507 – .2306205
Observations 12559 12559 21637 21637 12559 12559 21637 21637
See notes for Table 1. ∗p < 0.1,∗∗ p < 0.05,∗∗∗ p < 0.01
48

Appendix Figure 1: The government should reduce income differences, by age categories
(GSS)
Notes: This figure depicts responses since 1978 in the US General Social Survey (GSS) on whether
the government should reduce income differences. The graph uses the eqwlth variable from the GSS
(though subtracts it from eight so that it is increasing in support for redistribution). The shorter
line depicts the trend line from 1978 to 2006 only. The left-hand axis uses the “native units” of the
GSS variable. The right-hand side plots a linear transformation of that variable: it is demeaned and
divided by the partisan gap, where partisan gap is the difference between the average Democrat and
the average Republican answering that question. Therefore, 0 on the right-hand axis represents the
view of the average respondent during the sample period, and a one-unit positive change is equal to
moving (in the Democratic direction) the distance between the average Democrat and the average
Republican.
49

Appendix Figure 2: Separating elderly trend into age and cohort effects
3.5
4.0
4.5
5.0
1978
1980
198319
8419
8619
8719
8819
8919
9019
9119
9319
9419
9619
9820
0020
0220
0420
0620
0820
1020
12
Sup
port
Cohort Born 1902−1911 Born 1912−1921 Born 1922−1931 Born 1932−1941 Born 1942−1951 Born 1952−1961 Born 1962−1971
Support for redistribution, by cohort
Notes: See notes to Figure 6..
50

Appendix Figure 3: The government should guarantee job and living standards, by income
groups (scale from 1–7, ANES)
Notes: This figure depicts responses from ANES on whether the government should provide jobs
and a basic standard of living.
51
Related Documents