
Welcome message from author
This document is posted to help you gain knowledge. Please leave a comment to let me know what you think about it! Share it to your friends and learn new things together.
Transcript
Ved P. Gandhi
Liam P. EbrillGeorge A. MackenzieLuis A. Manas-Anton
Jitendra R. ModiSomchai Richupan
Fernando Sanchez-UgarteParthasarathi Shome
International Monetary FundWashington, D.C. • 1987
SUPPLY-SIDETAX POLICY
Its Relevance toDeveloping Countries
©International Monetary Fund. Not for Redistribution
© 1987 International Monetary FundReprinted March 1995
Cover design by the IMF Graphics Section
Library of Congress Cataloging-in-Publication Data
Supply-side tax policy.
Bibliography: p.1. Taxation-Developing countries. 2. Supply-side
economics-Developing countries. I. Gandhi, Ved P.(Ved Parkash)HJ2351.7.S86 1987 336.2'009172'4. 87-29890ISBN 0-939934-91-4
Price: $20.00
©International Monetary Fund. Not for Redistribution
Contents
Foreword vii
Preface ix
Part I. Overview and Summary
Chapter 1. Relevance of Supply-Side Tax Policy toDeveloping Countries: A Summary Ved P. Gandhi 3
Scope of Supply-Side Economics 4The Scope of the Studies and Overall Conclusions 11Validity and Relevance of Popular Supply-Side Tax Policy 16Tax Policy for Efficiency and Growth 28Supply-Side Tax Reforms for Developing Countries 33
Part II. Income Taxes and Growth: Evidence onPopular Supply-Side Tax Policy
Chapter 2. A Simple Model of the Effects of Income TaxRate Reductions on Economic Growth andAggregate Supply George A. Mackenzie 45
Incorporating Marginal Income Tax Rates in theOne-Sector Neoclassical Model 47
Assumed Elasticities and Simulation Results 49Conclusions 54
Chapter 3. Are Labor Supply, Savings, and InvestmentPrice-Sensitive in Developing Countries? A Survey of theEmpirical Literature Liam P. Ebrill 60
Labor Supply 62Savings Behavior 69Investment Behavior 75Conclusions 82
i i i
©International Monetary Fund. Not for Redistribution
iv CONTENTS
Chapter 4. Optimal Taxation of Financial Savings inDeveloping Countries: Relevance ofSupply-Side Tax Policies Liam P. Ebrill 91
Institutional Background 92Evaluation of Reform Proposals 95Conclusions 109
Chapter 5. Income Taxes and Investment:Some Empirical Relationships forDeveloping Countries Liam P. Ebrill 115
The Theoretical Framework 116Empirical Results 123Conclusions 133
Chapter 6. Determinants of Income Tax Evasion:Role of Tax Rates, Shape of Tax Schedules, andOther Factors Somchai Richupan 140
Standard Models of Tax Evasion 141Theoretical Studies on Factors Affecting Tax Evasion 147Empirical Studies on Factors Affecting Tax Evasion 755Limitations of the Literature 158The Role of Tax Factors 161The Role of Nontax Factors in Developing Countries 166Conclusions 172
Chapter 7. Evidence on the Laffer Curve:The Cases of Jamaica and India Liam P. Ebrill 175
The Supply-Side Approach 176Supply-Side Effects and the Personal Income Tax 180Overview and Conclusions 192
Chapter 8. Relationship Between Income Tax Ratios andGrowth Rates in Developing Countries:A Cross-Country Analysis Luis A. Mañas-Anton 198
Strategy of the Empirical Analysis 200Empirical Analysis 207Concluding Remarks 217
©International Monetary Fund. Not for Redistribution
CONTENTS V
Part III. Tax Policy for Efficiency and Growth:Aspects of Basic Supply-Side Tax Policy
Chapter 9. Tax Structure for Efficiency and Supply-SideEconomics in Developing Countries Ved P. Gandhi 225
Supply-Side Objectives of the Tax System—in Theory 226Tax Bases for Supply-Side Economics or Efficient
Tax Bases 232Rate Design for Supply-Side Economics or Optimal
Tax Rates 236A Popular Supply-Side Economist Versus an
Optimal Tax Economist 239A Tax System Dictated by Popular Supply-Side Economics:
Some Implications 241
Chapter 10. Rationality of Income TaxIncentives in Developing Countries:A Supply-Side Look Fernando Sanchez-Ugarte 250
The Economic Rationality for Tax Incentives 252General Considerations in the Design of Tax Incentives 258The Efficiency of Specific Tax Incentives 262The Effectiveness of Tax Incentives 269Concluding Remarks 273
Chapter 11. Are Export Duties Optimal inDeveloping Countries? Some Supply-Side ConsiderationsFernando Sanchez-Ugarte and Jitendra R. Modi 279
The Rationale for Export Taxes 281Methodology for Estimating Country Optimal Export
Duties and Their Effects 287Appraisal of the Impact of Existing Export Taxes 291Conclusions 305
Chapter 12. Limitations of the Role of Tax Policy inEconomic Development Parthasarathi Shome 321
The Determinants of Development 322Tax Policy and the Determinants of Development 327Concluding Remarks 330
©International Monetary Fund. Not for Redistribution
vi CONTENTS
Appendices
Appendix I. Statistical TablesJitendra R. Modi, Somchai Richupan, and Chris Wu 337
Appendix II. Selected Bibliography 386
©International Monetary Fund. Not for Redistribution
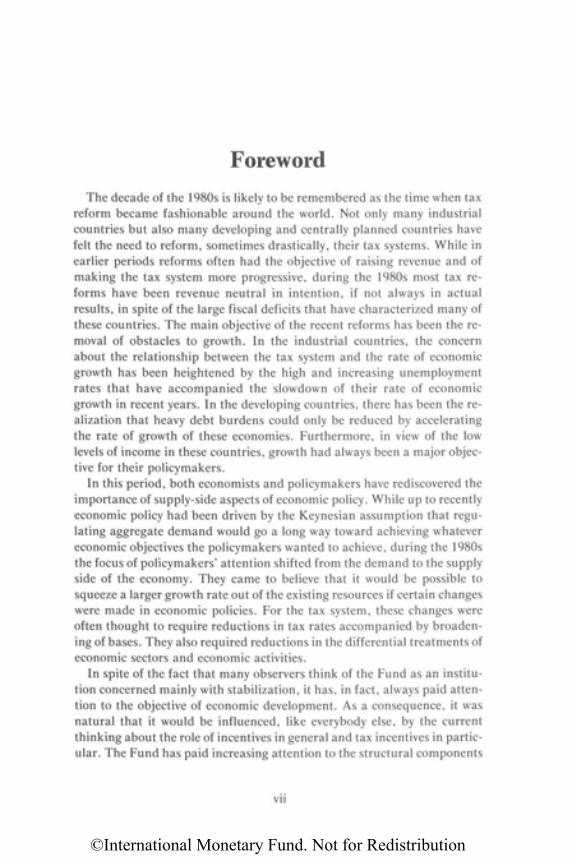
ForewordThe decade of the 1980s is likely to be remembered as the time when tax
reform became fashionable around the world. Not only many industrialcountries but also many developing and centrally planned countries havefelt the need to reform, sometimes drastically, their tax systems. While inearlier periods reforms often had the objective of raising revenue and ofmaking the tax system more progressive, during the 1980s most tax re-forms have been revenue neutral in intention, if not always in actualresults, in spite of the large fiscal deficits that have characterized many ofthese countries. The main objective of the recent reforms has been the re-moval of obstacles to growth. In the industrial countries, the concernabout the relationship between the tax system and the rate of economicgrowth has been heightened by the high and increasing unemploymentrates that have accompanied the slowdown of their rate of economicgrowth in recent years. In the developing countries, there has been the re-alization that heavy debt burdens could only be reduced by acceleratingthe rate of growth of these economies. Furthermore, in view of the lowlevels of income in these countries, growth had always been a major objec-tive for their policymakers.
In this period, both economists and policymakers have rediscovered theimportance of supply-side aspects of economic policy. While up to recentlyeconomic policy had been driven by the Keynesian assumption that regu-lating aggregate demand would go a long way toward achieving whatevereconomic objectives the policymakers wanted to achieve, during the 1980sthe focus of policymakers' attention shifted from the demand to the supplyside of the economy. They came to believe that it would be possible tosqueeze a larger growth rate out of the existing resources if certain changeswere made in economic policies. For the tax system, these changes wereoften thought to require reductions in tax rates accompanied by broaden-ing of bases. They also required reductions in the differential treatments ofeconomic sectors and economic activities.
In spite of the fact that many observers think of the Fund as an institu-tion concerned mainly with stabilization, it has, in fact, always paid atten-tion to the objective of economic development. As a consequence, it wasnatural that it would be influenced, like everybody else, by the currentthinking about the role of incentives in general and tax incentives in partic-ular. The Fund has paid increasing attention to the structural components
vii
©International Monetary Fund. Not for Redistribution
viii FOREWORD
of adjustment policies. It has accepted the conclusion that without majorstructural adjustments developing countries might achieve stability, butonly at the cost of a slower rate of growth. Stability with growth requiresthat many changes in the structure of their economies must take place inthese countries. There must be changes in the external sector through theliberalization of imports and the removal of impediments to exports, inaddition to the more traditional adjustments in the exchange rate. Theremust be changes in the financial markets, through the removal of obstaclesto the flow of financial resources within the economy, through the raisingof real interest rates to realistic levels, and through the reduction of theproportion of total credit that is administratively allocated. There must berealignments in relative prices in order to eliminate disincentives to pro-ducers, when the prices that they receive are too low to keep them produc-ing the cash crops for which the countries have comparative advantages.There must also be changes in the relative prices of consumer goods toreduce the consumption of products that must be imported or that couldbe exported in larger quantities.
The restructuring of economies will inevitably involve also the reform ofthe tax system. This is the aspect addressed in this book. Under the direc-tion of Ved Gandhi, Chief of the Tax Policy Division, the Fiscal AffairsDepartment has made a systematic attempt at surveying what is knownabout the disincentive effects of taxes. This research has relied on hardevidence in order not to be swayed by claims that may be fashionable butthat are often not fully substantiated. This reliance on hard evidence hasobvious scientific merits, but it has also some shortcomings. The merits arethat the conclusions reached are based on firm evidence. The shortcom-ings are that those conclusions are based on work which has already beendone; that work may itself have been biased by earlier preconceptionsabout the effect of taxes. In any case, I hope that enough interesting con-clusions are provided by this book to make it a valuable addition to theliterature on taxation in developing countries. I also hope that policymak-ers will find some of its conclusions useful for the conduct of their eco-nomic policy. I should perhaps conclude by adding that the views pre-sented reflect the thinking of the authors and do not necessarily reflectofficial Fund positions.
VITO TANZI
DirectorFiscal Affairs Department
©International Monetary Fund. Not for Redistribution
Preface
A striking feature of the 1980s has been the sharp decline in the rates ofgrowth witnessed by countries in the developing world. According to theWorld Bank's World Development Report, 1986, the average annual rateof growth of these countries declined from 6.6 percent during 1965-73 and5.4 percent in 1973-80 to 2 percent in 1982 and 1983 (Statistical AppendixTable A.3, page 115). Countries all over Africa as well as Latin Americaand the Caribbean have experienced a significant erosion of the standardof living of their populations in recent years, as their economic growthrates have fallen far short of their population growth rates, and there islittle hope for early reversal of these trends. Given the uncertain prospectsfor growth, many economists have expressed the belief that exclusive reli-ance on traditional demand management policies, which can certainlyachieve successful stabilization around a trend growth path, may not beenough to improve economic welfare and that these policies may have to becombined with policies aimed at raising the trend growth path itself. Thisbelief has renewed the interest of economists and policymakers alike in thedeterminants of growth and supply-side economics with its fundamentalclaim to enhancing the country's potential for growth.
Although supply-side economics addresses all aspects of aggregate sup-ply, it focuses particularly on the appropriate role of government in en-couraging growth through its expenditure and taxation policies. This bookexamines the relevance to developing countries of the tax policy recom-mendations of supply-side economists and attempts to delineate policyguidelines to ensure that fiscal management enhances rather than inhibitsgrowth and efficiency in the wider economy.
The book is the product of a research project initiated in 1984 in theFiscal Affairs Department of the International Monetary Fund to assessthe relevance to the special circumstances of developing countries of taxpolicy aspects of the popular supply-side revolution in the United States.The main emphasis of the popular version of this revolution has been tostress the negative effects of high income tax rates on incentives to pro-duce, save, and invest and, through these, on the growth of the economy.
Assessing the relevance of supply-side tax policy for developing coun-tries is no easy task. First, there are many forms of taxes and the effects ofeach tax on incentives have many aspects. Effects of tax rates, the primary
ix
©International Monetary Fund. Not for Redistribution
x PREFACE
focus of the popular supply-siders, on the behavior of the economic agentsare interwoven with the type and scope of the tax base, tax reliefs, and taxincentives, and many other special provisions of the tax system. Second,tax policy frequently interacts with other economic policies of the govern-ment in very many complicated ways so that the economic effects of a taxcut become a function of the institutional and economic policy environ-ment within which it operates. Furthermore, statistical and other informa-tion relevant to estimating the disincentive effects of various tax policies orthe incentive effects of the reform of such policies are not readily available.
The book does not purport to be comprehensive; it covers only selectedaspects of supply-side tax policy. In particular, it attempts to deal with thefollowing eleven questions:
• What are the most important price elasticities that determine the ef-fects of income tax reductions on aggregate supply?
• How price-sensitive are labor supply, savings, and investment in de-veloping countries?
• To what extent do income tax policies, given certain other economicpolicies, reduce financial savings in developing countries?
• To what extent do income and corpopate tax policies, given generoustax incentives and other tax provisions, reduce corporate investmentin developing countries?
• Do high and progressive income tax rates significantly increase in-come tax evasion in developing countries?
• Are there certain examples from the developing world where a reduc-tion of top marginal income tax rates has increased government reve-nue significantly in the short run as predicted by the "Laffer curve?"
• What is the econometric evidence on the negative relationship be-tween reliance of developing countries on income taxes and theirgrowth rates?
• What will the tax systems of developing countries look like in theory ifincentives and efficient allocation of resources were the major concernof policymakers?
• How efficient are the generous tax incentives that are frequently givento investors in developing countries in order to induce economicgrowth?
• Under what circumstances are export duties justified on grounds ofefficiency and growth?
• What is the precise role of tax policy in removing the various struc-tural bottlenecks to economic development and helping the growth ofdeveloping countries?
©International Monetary Fund. Not for Redistribution
PREFACE xi
Chapters 2 through 12 deal with each of these questions, while Chapter 1brings together the findings and conclusions of the analyses and suggestsideas for supply-side tax reform relevant for developing countries.
The research project was carried out by a staff team headed by Ved P.Gandhi of the Tax Policy Division of the Fiscal Affairs Department. Inaddition, the team consisted of Liam P. Ebrill, Jitendra R. Modi, SomchaiRichupan, Fernando Sanchez-Ugarte, and Parthasarathi Shome. The pa-pers included in this book were prepared by the staff members as and whenthey found time in the course of their regular operational work for theFund. The papers by George A. Mackenzie and Luis A. Mañas-Antonwere not prepared as a part of the project; the former was completed be-fore the research project was initiated, while the latter was prepared whenthe author served as a summer intern in the Tax Policy Division.
The research project was a cooperative effort, and the author of eachpaper has benefited from the comments of the other members of the staffteam. In addition, many friends and colleagues in the Fiscal Affairs De-partment, as well as in other departments of the Fund, took pains to readthe draft papers and provide guidance, and their advice is gratefully ac-knowledged. The team is particularly indebted to Vito Tanzi, Director ofthe Fiscal Affairs Department, who took interest in the research projectfrom its inception, provided an exciting environment, and guided the workof the team; the book owes a great deal to him. The team also wishes tothank Alan Tait, Leif Muten, Robert Schneider, Richard Hemming,Sheetal Chand, David Nellor, and Charles Sisson, who gave constructivecriticisms on one or more draft papers. Extensive comments on the entiremanuscript and valuable suggestions were received from Professor RoyBahl of Syracuse University and Professor Charles McLure, Jr., of Stan-ford University and the authors wish to express their gratitude to them.However, none of the foregoing can be held responsible for any errors oromissions that may remain. The authors also wish to express appreciationfor the painstaking and skillful editing of the manuscript by Esha Ray.Finally, thanks are due to Lyndsey Livingstone and Ahwerah Vichailak fortheir patience and superb job of typing and retyping successive drafts ofeach paper until the final manuscript stage.
VED P. GANDHI
©International Monetary Fund. Not for Redistribution

This page intentionally left blank
©International Monetary Fund. Not for Redistribution
PART I
Overview and Summary
©International Monetary Fund. Not for Redistribution

This page intentionally left blank
©International Monetary Fund. Not for Redistribution
1Relevance of Supply-Side Tax Policy to
Developing Countries
A Summary
Ved P. Gandhi
Within the short span of a few years, "supply-side economics" has cometo be considered in some quarters to be the "new" economics that is mostrelevant to policymaking for solving the economic problems of the 1980s.However, the basic propositions of supply-side economics, including thebelief that taxes affect economic behavior and the substitution effects oftaxes are important for the efficient allocation of resources, are as old asneoclassical economics itself. What is new is the conviction of some supply-side economists that a substantial reduction of tax burdens, in general,and the rates of income tax, in particular, will have significant effects onthe level of output and growth rates. In 1984, the Fiscal Affairs Depart-ment of the International Monetary Fund undertook a research project toanalyze the relevance to developing countries of the tax policy recommen-dations of supply-side economics made in the context of developed coun-tries. This volume contains the studies that were prepared as part of thisresearch project.
As explained in greater detail in Section I of this chapter, there are atleast two interpretations of supply-side economics, and, consequently, ofsupply-side tax policy—the traditional or the "basic" view and the new orthe "popular" view. Most of the studies included in this book assess thevalidity of the arguments of popular supply-side economics, while othersdeal with the validity of selected propositions of basic supply-side eco-nomics.
The volume is in three parts. Part I provides an overview and summaryof findings and conclusions. Part II presents seven papers reviewing theevidence on the validity of popular supply-side tax policy. Part III contains
3
©International Monetary Fund. Not for Redistribution
4 VED P. GANDHI
four papers dealing with selected aspects of basic supply-side tax policy ortax policy for efficiency and growth. The book also has two appendices.Appendix I contains statistical information that is readily available on therevenue structures of developing and developed countries relevant to thevarious studies. Appendix II presents a selected bibliography of publica-tions on popular supply-side economics of interest to the general reader.
The term supply-side economics originated in the United States in themid-1970s primarily as a reaction to government economic policies basedon Keynesian macroeconomic theory and represents a new way of lookingat government economic policies.1 The term, however, has evolved overtime and has come to mean different things to different people. It is, there-fore, important at the outset to clarify in broad terms what supply-sideeconomics stands for and then to define with greater precision those as-pects of supply-side tax policy that have received the most attention in theUnited States and whose relevance is analyzed in the context of developingcountries in the papers included in this volume.
These concepts are explained in Section I of this chapter. Section II de-scribes the scope of the project and the broad conclusions reached under it.Sections III and IV contain the main findings and conclusions of individ-ual papers on the validity and relevance of popular supply-side tax policyand tax policy for efficiency and growth. Finally, Section V summarizesseveral supply-side-oriented proposals for tax reform that have emergedfrom the various studies.
I. Scope of Supply-Side Economics
Supply-side writers have founded their work on the strong convictionthat free markets, with few exceptions, allocate resources most efficiently.2
This belief drives both their economic tenets and the way they view politicsand the social order.
On the political side, supply-side economists see governments, which areusually monopolists and not subject to the requirement of profit maximi-zation, as inherently inefficient because of their lack of market disciplineand as subject to a tendency to grow without bound. Because the agents ofgovernment have personal objectives which, by definition, differ from the
1Bartlett (1985, p. 18) points out that the term was coined by Professor Herbert Stein of theUniversity of Virginia in April 1976, as described in Stein (1984, p. 241).
2Supply-siders accept that the existence of pure public goods, such as defense and internalsecurity, and some merit goods, such as protecting the welfare of the extremely needy, pro-vides a rationale for social action. However, they believe that policymakers would not neces-sarily provide even these goods in the optimum quantity or at the lowest possible cost.
©International Monetary Fund. Not for Redistribution
SUPPLY-SIDE TAX POLICY: A SUMMARY 5
goals of the society at large, neither politicians nor bureaucrats in policy-making positions can be trusted to act effectively in the social interest.3
On the economic side, the belief that any policy that distorts free-market-determined relative prices distorts resource allocation has led sup-ply-siders to espouse at least three important propositions that have majorconsequences for government policy. (1) Most government regulationsaimed at protecting consumers and workers are generally costly and inde-fensible in terms of their cost-benefit ratios; eliminating them would,therefore, improve resource allocation in the economy; (2) most welfareand entitlement programs discourage work effort (including retraining);limiting access to such programs to the really needy would, therefore, re-store work incentives; and (3) personal income tax is inherently biasedagainst work effort (on the ground that work is taxed but leisure is not), aswell as against savings (since income saved is taxed twice, while incomeconsumed is taxed only once) and investment (since productive investmentis taxed but unproductive investment is not) and that high marginal in-come tax rates exacerbate these biases significantly; reducing marginalincome tax rates would, therefore, increase labor supply, savings, and in-vestment. As will be shown below, many of the propositions of supply-sideeconomists are implicit in the behavioral and market structure assump-tions made by most neoclassical economists.
In general, thus, supply-side economists emphasize minimizing the dis-tortions in market-determined relative prices that result from regulations,subsidies, and high income taxes and believe that the reduction of suchdistortions would encourage savings and production by allowing the eco-nomic incentives of a free market to work. They also believe that the pri-vate sector is generally capable of bringing about sustained economicgrowth, so that there is no need to tolerate the inefficiencies of large gov-ernment in the economy. At least two interpretations of supply-side eco-nomics, and, consequently, of supply-side tax policy have evolved withinthis general framework over time. These interpretations have been referredto in this volume as basic supply-side economics and popular supply-sideeconomics.
Basic Supply-Side Economics: Return to Classical andNeoclassical Economics
The first interpretation, basic supply-side economics, is simply an appli-cation of classical and neoclassical economic theory to government policy-
3The political philosophy underlying supply-side economics derives from the writings ofDowns (1957), Buchanan and Tullock (1969), Niskanen (1971), and Breton (1974).
©International Monetary Fund. Not for Redistribution
6 VED P. GANDHI
making. According to this view of supply-side economics, government eco-nomic policies should focus on aggregate supply rather than on aggregatedemand. As aggregate supply is the result of the economic behavior of pro-ducers, they, rather than consumers, should be considered the drivingforce in the economy and their economic behavior should be considered themost important determinant of real and nominal economic activity. Asgovernment economic policies can, and frequently do, have significantnegative substitution effects (drive economic agents away from rational—welfare maximizing—economic decisions), they should be structured insuch a way so as to minimize the substitution effect.
If one follows this interpretation, supply-side economics is essentially nodifferent from mainstream classical and neoclassical economics. It empha-sizes the objective of efficient allocation of resources more than any otherobjective of economic policy and recognizes the importance of negativesubstitution effects of government economic policies and, particularly, oftax policies. These beliefs were also held by Smith, Say, Mill, Marshall,Pigou, and Ramsey and others who obviously were supply-siders long be-fore the term was coined.
A basic supply-side economist believes that government tax policy can,and does, create a "wedge" between pretax and posttax producer prices aswell as rates of return to factors of production and, given the negative sub-stitution effect, is likely to distort the economic behavior of producers aswell as the suppliers of factor inputs. Given the importance of efficientresource allocation to aggregate output, a basic supply-side economistseeks to reduce distortions in resource allocation that individual taxes andtax structures can cause. Distortions can arise because of a number of fac-tors such as (1) the economic aggregate or the base on which taxes arelevied; (2) tax rules and provisions that affect the taxable base for individ-ual producers and factor suppliers; (3) the height of nominal tax rates andthe degree of progression in the tax rate schedule; and (4) the interactionbetween inflation, the taxable base, and tax liabilities. A basic supply-sideeconomist is one who seeks to reform all of these aspects of a tax structure.
The recommendation that tax policy be reformed along these lines isalso not new; it is well known in public finance literature. Most books ontraditional public finance, for example, contain detailed analyses of theeffects of various forms of taxation on the efficiency of resource allocation.4
The relative merits of income and consumption as alternative tax bases
4Recent literature on "optimal taxation" also deals extensively with this subject. The opti-mal taxation literature takes this objective and the neoclassical framework as starting pointsbut reaches very different conclusions on tax reform. For a discussion of the difference be-tween a supply-side tax economist and an optimal tax economist, see Gandhi (Chapter 9).
©International Monetary Fund. Not for Redistribution
and their possible effects on savings are frequently discussed at length.Similarly, the effects of alternative tax rules and provisions—relating todepreciation allowances and inventory valuation, loss-offset and carry-forward privileges, debt versus equity, etc.—on capital formation, risk-taking, and financial policies are discussed in considerable detail in theliterature. The argument that the "excess burden" of a tax depends on thenominal rate of the tax is also well known to students of public finance.5
The resource allocation costs of the lack of inflation-adjustment of the in-come tax system, which have been dealt with extensively as the rates ofinflation have accelerated in the 1970s, are also well known.
Thus, basic supply-side tax policy would seem to be no different fromthe views of fiscal economists who, on efficiency grounds, recommend thereform of (1) the economic base on which taxes are levied; (2) various taxbreaks and loopholes that signify distortionary economic signals; (3) thelevels and progressivity of nominal tax rates; and (4) tax rules and provi-sions that raise the effective tax rates in inflationary times. If these are theaims of supply-side tax policy, then fiscal economists such as Pigou,Simon, Haig, Kaldor, Harberger, Feldstein, Boskin, and McLure obvi-ously were supply-siders long before the term "supply-side tax policy" wasconceived.6
In a sense, supply-side economics is as old as economics itself, if all thatit stands for is that efficiency of resource allocation is an important objec-tive of economic policy and that market-determined resource allocation isbasically optimal. Most economists would find it hard to disagree with itscontents in theory and under normal circumstances. As a clone of classicaland neoclassical economics, basic supply-side economics contains policyprescriptions based on the latter's specific assumptions relating to, first,what the proper role of the government should be and, second, how devel-oped the commodity and factor markets are or how well they function. But
5The argument that "excess burden" rises monotonically with the nominal tax rate belongsto the partial equilibrium tax theory. According to this argument, an income tax by its verynature causes an excess burden vis-a-vis a lump sum tax (i.e., it causes a reduction of utility inexcess of that which would have occurred had the tax been collected as a lump sum) and thatpartial equilibrium analysis suggests that, in an economy completely free of distortions, in-cluding distortions caused by other taxes, the higher the rate of tax, the higher the excessburden. In fact, under highly simplified assumptions regarding the shapes of demand andsupply curves, the excess burden of a tax (which is not lump sum) is given by the square of therate of the tax. Theoretically, thus, the rate of the tax does have a very significant effect on theeconomic behavior of the taxpayers. See Rosen (1985, Chapter 12).
6Ture (1982b), Hall and Rabushka (1983), and the authors of the report by the U.S. Trea-sury Department (1984) also belong to the basic supply-side school since they seek tax reformin a wider sense, as described above.
SUPPLY-SIDE TAX POLICY: A SUMMARY 7
©International Monetary Fund. Not for Redistribution
8 VED P. GANDHI
one can still question whether both of these assumptions are strictly validin the special circumstances of developing countries. To what extent, forexample, should one whole-heartedly accept the "appropriate" role of thegovernment implicit in supply-side economics (as well as in classical andneoclassical economics) which states that the main aim of the governmentshould be ensure an efficient allocation of the economy's resources throughprivate initiative and enterprise and that all other roles of state, such as itsrole as an active agent of income redistribution or of economic stabilizationor of the growth of the economy, whenever in conflict with the former,should receive lesser priority? Similarly, to what extent should one acceptthe fundamental faith of supply-side economists (as well as of classical andneoclassical economists) that private markets are capable of delivering"appropriate" levels of goods and services and that, in the interest ofachieving maximum welfare of the society, governments should ensure asmooth working of free markets and provide few goods and services otherthan essential public goods, such as defense and internal security?
Popular Supply-Side Economics: Elasticity Optimism
It is not the views of the basic supply-siders, however, that have caughtthe public attention since the mid-1970s. Rather, it is the views of what canbe called popular supply-side economics and the extravagant claims madeby its proponents for efficiency-enhancing government economic policies,in general, and income tax policies, in particular, that have become thesubject of major debate in the United States and other developed coun-tries.7 The major proponents of popular supply-side economics have writ-ten a number of articles and books during the last few years.8
Of the many policy recommendations of popular supply-side economics,the lowering of marginal income tax rates is the most important and alsothe best known. As one leading popular supply-side economist has stated,"The term supply-side economics has in recent years become closely asso-ciated with . . . a set of policy prescriptions, the most prominent of whichhas been a recommendation that tax rates be lowered both in the UnitedStates and in many other countries."9
Never before have economists given so much importance to the marginal
7Cf., Feldstein (1986).8For the views of popular supply-siders, see Laffer and Seymour (1979); Meyer (1981); U.S.
Congress (1981); Bartlett (1982); Fink (1982); Raboy (1982); Hailstones (1982a, 1982b); Ro-berts (1982, 1984); Gilder (1981); and Canto, Joines, and Laffer (1983). Also see Appendix IIfor additional references.
9Canto, Joines, and Laffer (1983, p. ix).
©International Monetary Fund. Not for Redistribution
SUPPLY-SIDE TAX POLICY: A SUMMARY 9
rates of income taxation, and particularly to the top marginal income taxrates, and made reduction of the progressivity of income taxation the cen-terpiece of reform of government economic policies. This elevation by pop-ular supply-siders of nominal marginal income tax rates to such a height isa reaction to two major trends of recent years.
First, it is a reaction to the perceived overwhelming equity bias of tradi-tional literature on taxation. With its preoccupation with the ability-to-paybasis of taxation and the principles of sacrifice, traditional literature gen-erally justifies the progressivity of nominal rates of income taxation.
Second, it is a reaction to the progressive income tax systems found in allcountries. The progressivity has been accentuated in recent years becauseof the interaction between rates of inflation and tax brackets based onnominal incomes, as a result of which taxpayers have been constantlypushed into higher income brackets during inflationary times and havebeen subjected to even higher tax rates under unindexed income tax sys-tems.10 Such steep progressivity, in the opinion of popular supply-siders,intensifies the relative price effects and biases of taxation and creates"crushing" effects on all incentives to produce.11
Therefore, the first characteristic of popular supply-siders that setsthem apart from basic supply-side economists is their preoccupation withtax policy and, within tax policy, a focus on the nominal progressivity ofincome taxation and the top marginal income tax rates rather than on thereform of the tax system in all its aspects.
Another characteristic that distinguishes the popular supply-siders fromthe basic supply-siders is the extravagance of their claims with regard tothe effects of a reduction of marginal income tax rates on the economy. It istheir conviction that because the negative substitution effects of incometaxes are extremely high, reductions in marginal income tax rates willresult in "rapid growth, dramatic increases in tax revenue, a sharp rise insaving, and a relatively painless reduction in inflation."12 The popularsupply-siders believe that a reduction in marginal income tax rates, espe-cially the top rates, would increase the supply of labor significantly by in-ducing marked shifts from leisure to work and from nonmarket to marketactivity as after-tax wages increase, thereby raising marketed output andslowing down the rate of inflation. It would also increase the supply ofsavings and capital significantly by encouraging large shifts from con-
10"Under current law, everyone will face the top rate sooner or later," Kemp (1981, p. 94).11Wanniski(1981, p. 38).l2This is how Feldstein (1986, p. 27) has summed up the position of popular supply-siders;
he, however, does not believe in it.
©International Monetary Fund. Not for Redistribution
10 VED P. GANDHI
sumption to savings, thereby lowering interest rates. Finally, it would redi-rect resources from unproductive investment and nonmarket activity tomore productive uses of capital and market activity, thereby lowering unitcosts, raising productivity, and removing supply bottlenecks. In short, areduction of marginal rates of income taxes will significantly change theeconomic behavior of households and businesses in favor of work, savings,and productive investments and against leisure, consumption, and unpro-ductive investments. Lower top marginal income tax rates and less pro-gressive income taxation would also greatly discourage tax avoidance andreduce tax evasion. In a word, the popular supply-siders believe that theshort-run price elasticity in the behavior of various economic agents is ex-tremely large. Feldstein, therefore, rightly points out, "what distinguishedthe new [popular] supply siders from the traditional [basic] supplysider . . . was not the policies they advocated, but the claims that theymade for those policies."13
It is this elasticity optimism that also underlies the "Laffer curve," sup-ported by all popular supply-siders. According to its author, ArthurLaffer, government revenues first rise with tax rates (as long as tax ratesare in the "normal range"), reaching a peak (the "Laffer hill"), and thenfalling (as tax rates rise to a "prohibitive range").14 A reduction of incometax rates from the prohibitive range is believed by Laffer and all leadingpopular supply-siders to result in a very large expansion of economic activ-ity and tax compliance, and hence income tax revenues.15
Thus, the popular supply-side economist aims to reduce the "excise-ness" (relative price effects) of income tax rates.16 As high marginal in-come tax rates have large negative substitution effects, the popular supply-siders would like particularly to see the marginal rates of personal incometax reduced and expect significant increases in output and real incomes
13Feldstein (1986, p. 27).14For an elaboration of the Laffer curve, see Canto, Joines, and Laffer (1983, pp. 2-24) and
Wanniski (1983, pp. 97-115). The Laffer curve is not essential to the basic premise of supply-side economics that leaner governments are better.
15Comments on the Laffer curve can be found in Hemming and Kay (1980), Blinder (1981),Moszer (1982), Henderson (1982), Buchanan and Lee (1982), Fullerton (1982), Mirowski(1982), and Malcolmson (1986). For a test of the validity of the Laffer curve in one developedcountry and two developing countries, see Feige and McGee (1983) and Ebrill (Chapter 7),respectively. Also see Wanniski (1983, Chapter 11).
16See Kemp (1981, p. 68). Comments on supply-side economics can be found in Tobin(1982).
©International Monetary Fund. Not for Redistribution
SUPPLY-SIDE TAX POLICY: A SUMMARY 11
even in the short run.17 They believe that an income tax cut would actuallyincrease tax revenue (by moving the economy back from the "prohibitiverange" of the Laffer curve) rather than raise the budget deficit, because itwould unleash an enormously depressed supply of labor and work effortand reduce tax evasion. And even if a tax cut did lead to an increasedbudget deficit, that would not "crowd out" resources available for privateinvestment and capital formation, because a tax cut would significantlyraise the private savings rate by increasing the after-tax rewards to savers.Nor would the increased budget deficit result in inflation, because in-creased nominal demand resulting from a budget deficit would bematched by an increased supply of goods and services, resulting from in-creased incentive to work and save, due to the tax cut.18
To conclude Section I, the tax systems as well as economic and otherconditions of developing countries are quite different from those of devel-oped countries. Therefore, the views of popular supply-side economists ontax policy, espoused primarily in the context of developed countries, aswell as the validity of market and other assumptions made by basic supply-side economists, need to be scrutinized closely before appropriate conclu-sions can be drawn regarding the nature of tax reforms that would be ofrelevance to developing countries.
II. The Scope of the Studies and Overall Conclusions
Sections II and III highlight the findings and conclusions of individualstudies included in this book. However, it is important to define the scopeof the studies as well as clarify what the studies do and do not cover. Mostdeveloping countries depend on import duties and domestic commodity
17Wanniski (1981, p. 43) and Ture (1982a, p. 26). The nominal marginal tax rates areimportant for incentives, while the average effective tax rates are important for their implica-tions about the size of government and income distribution. Both Wanniski and Kemp wouldlike to see the marginal income tax rates ultimately range between 5 percent and 35 percent.See Wanniski (1981, pp. 45-46 and p. 49) and Kemp (1981, p. 52). Both of them favor thetop rate of 35 percent, which is merely expression of an opinion and is not derived from anytheoretical or economic arguments. The popular supply-siders do not want, as one mightthink, to do away with progressivity in the marginal rates of income taxation in the short run,although they would probably prefer a flat but low rate income tax in the long run. In theiropinion, excessive progressivity of tax rates is often evaded and avoided, and never achievesthe intended reduction in income inequalities.
18Keynes also believed in tax cuts, but only if they were not accompanied by expenditurecuts, so as to make fiscal deficits stimulative during recessions. Popular supply-siders, on theother hand, do not consider the size of the budget deficit to be of any macroeconomic rele-vance. See also Bechter (1982).
©International Monetary Fund. Not for Redistribution
12 VED P. GANDHI
taxes to a significant extent (see Tables A2 and A3 in the Statistical Ap-pendix) and some countries depend heavily on mineral taxation. Thesetaxes have not been analyzed from a supply-side perspective in this book inview of existing research on the subject.19 The supply-side effects of exces-sive effective protection, implicit in the high and complicated structures ofimport duties prevalent in most developing countries, are well known inthe literature on international trade and development economics. Also wellknown are their negative effects on the efficiency of resource allocation,export prospects, and growth rates, especially when they are combinedwith quotas and other trade restrictions, as is also usually the case in devel-oping countries.20 Various studies carried out by the World Bank and theFund have also convincingly alluded to the distortionary effects and anti-export biases of high import duties. Papers produced in the Fund's FiscalAffairs Department have reviewed natural resource taxation and excisetaxation in developing countries, respectively, from the viewpoint of effi-ciency.21 The studies prepared under this research project, therefore, con-centrated primarily on the economic effects of direct taxes, viz., incometax, corporation tax, and export duties, and attempted to review their opti-mality in the real (second-best) world prevalent in developing countries.22
19Nontax revenue policies of the government, including prices charged for various govern-ment services as well as outputs of autonomous public enterprises, can also have taxes orsubsidies implicit in them. The supply-side effects of such implicit taxes, if any, were notanalyzed under the research project either.
20For a theoretical exposition of and empirical evidence on this see Corden (1974, 1975).Empirical work on the effect of foreign trade regimes on the economic development of tendeveloping countries has been carried out under the auspices of the National Bureau ofEconomic Research. The results of this work are summarized in Bhagwati (1978) andKrueger (1978). See also Balassa (1971).
21See Palmer (1980), Nellor (1984), and Ferron (1986).22Given the importance of foreign investment to the growth of most developing countries,
the effects of tax policies on foreign investment should have been covered. However, this wasomitted because experience shows that foreign investment decisions are usually affected by anumber of economic (e.g., market size, availability of raw materials and skilled manpower),financial (e.g., development of capital market, registration and financial disclosure require-ments for mobilizing domestic equity), institutional (e.g., entry and ownership regulations),and political factors, and tax policy is frequently of lesser importance in these decisions. Tothe extent tax policy is important, however, it seems from the survey of the literature that eachdeveloping country's tax policy will have to be tailor-made to suit its special circumstances. Inthis process, all tax rules and tax incentives (not tax rates alone) affecting the net return onretentions in, and remittances from, the "host" developing country will have to be reformed.The tax policies of neighboring countries and of countries in similar situations will have to betaken into account. Full account will also have to be taken of the tax systems of the "home"country of potential investors, including the availability of tax deferral, tax sparing, and for-eign tax credit provisions. The scope of the double taxation treaty agreements between the
©International Monetary Fund. Not for Redistribution
SUPPLY-SIDE TAX POLICY: A SUMMARY 13
Although the research project focused primarily on the tax policy recom-mendations of the popular supply-side economists and their relevance todeveloping countries, some comments on the objective of efficient resourceallocation emphasized by all supply-side economists seem necessary. De-veloping countries have some very special circumstances which make theneoclassical model (achievement of efficient allocation of resourcesthrough primary reliance on private initiative and enterprise) underlyingsupply-side economics less than fully valid. Many of these countries, espe-cially the low-income ones, suffer from a number of disadvantages, such as(1) highly skewed income distribution; (2) "population trap," that is, largeand rapidly growing population with high levels of absolute poverty; (3)large structural unemployment, both rural and urban, with little hope of asolution for want of appropriate labor-intensive technology; (4) dominanceof agriculture, particularly less-productive peasant agriculture, sometimesresulting from existing land tenure systems; (5) unstable prices of exportcommodities; and (6) lack of adequate economic infrastructure, educa-tion, and human resources.23 Thus, to the extent that the governments ofsuch countries have to concern themselves with objectives other than theefficient allocation of given resources, for example, income redistribu-tion,24 economic stabilization,25 or the creation of social and economic in-frastructure for economic growth,26 the supply-side approach generally hastended to be seen as being of limited relevance to these countries. Simi-larly, to the extent that most factor, product, and financial markets areinadequately developed in these countries, their development by the gov-ernment has been considered an important objective in itself. As a result,the role of the state has been seen as far larger than that "implicit" in thesupply-side approach.27 Finally, as Shome (Chapter 12) stresses, savings
"host" country and the "home" country will also need to be considered. Finally, the nature offoreign investment (whether it is "footloose" or "country-specific") and its volatility as well asthe existence of tax havens will also be relevant. For the importance of some of these factorssee International Monetary Fund (1985b). Also see Ebrill (Chapter 3).
23Cf., Todaro (1985, especially Part II).24There is ample evidence that the distribution of income is far more skewed in developing
countries than in developed countries. See Lecaillon and others (1984, especially Table 9and p. 41).
25See Killick and others (1984, especially Part I).26Cf., World Bank (1980, especially pp. 36-39 and Chapters 5 and 6).27As Todaro (1985) has pointed out, "whether one likes it or not, Third World governments
must inevitably assume a more active responsibility for the future well-being of their countriesthan the governments of the more developed nations. . . . Central to this new role will beinstitutional and structural reform in the fields of land tenure, taxation [to mobilize resourcesfor investment, lacking private financial markets], asset ownership and distribution, educa-
©International Monetary Fund. Not for Redistribution
14 VED P. GANDHI
alone are not enough for growth, they require "complementary factors" ifthey are to become investment in reality, especially the removal of externalconstraints (such as foreign exchange availability) and domestic con-straints (such as expanding the size of the market, facilitating the transferof technology, and establishing adequate financial intermediary institu-tions).28 Also, growth by itself would not mean development unless it isaccompanied by certain institutional reforms involving human capital for-mation and the creation of essential social and economic structure, agri-cultural reforms, population control, etc. Growth and development of de-veloping countries are, thus, objectives that are much more complex thanensuring the efficient allocation of given resources only, and they call for amuch bigger role of the state than supply-side economists are perhaps will-ing to concede.
The broad conclusion of the research project is that the supply-side taxpolicy which focuses on marginal income tax rates alone (the popular ver-sion) is too narrow and is of limited relevance to many developing coun-tries, especially the low-income countries. The view of supply-side tax pol-icy which stresses broadening the tax base and rationalizing the rates ofnot only income tax but also of other taxes so as to remove all tax-relateddistortions (the basic version) is of greater relevance to such countries.29 Inaddition, the research project has established that the impact of the taxsystem of a developing country on the potential for its development de-pends on a variety of factors such as (1) the reliance of the tax system onincome-related taxes; (2) the interaction between tax rates, the tax base,specific tax incentives for savings and capital formation, and the tax ad-ministrative capacity, as they each affect savers and income earners; (3)the rate of inflation and the degree of inflation-indexation of depreciationand other provisions of the tax system, which determine the effective taxburdens of producers and income earners and their after-tax rewards; (4)the interaction between tax policy and other macroeconomic policies of thegovernment, which affects the prices of foreign exchange, capital, and la-bor; and (5) the degree of imperfection in or the level of development of thelabor market, the capital market, the foreign exchange market, financial
tional and health delivery systems, credit rationing, labor market relations, pricing policies,the organization and orientation of technological research and experimentation . . . and thevery machinery of government and planning itself" (pp. 526-27).
28Cf., Streeten (1979, pp. 21-52).29Recent income tax reform efforts in Indonesia, India, the Philippines, and Jamaica and a
few other developing countries reflect this strategy. See Gillis (1985), India, Ministry of Fi-nance (1985), Yoingco (1986), and Bahl and others (1987) for descriptions of these efforts.
©International Monetary Fund. Not for Redistribution
SUPPLY-SIDE TAX POLICY: A SUMMARY 15
institutions, credit markets, etc. As is shown by the papers that follow,these factors are of fundamental importance and developing countrieshave some very special circumstances with respect to all of these, so thatthe advice of lowering the marginal income tax rates must be examined inthis wider context. Once this approach is taken, the high degree of elastic-ity and growth optimism, which the popular supply-siders frequently takefor granted subsequent to a reduction of high marginal income tax rates,must be moderated in the special circumstances of the developingcountries.
More specifically, the research project has established that while thepopular view of supply-side tax policy (that the height of nominal tax ratesmatters for incentives) has to be valid for developing countries, other taxand nontax factors are equally important, if not more important forgrowth and development. While tax policy undeniably affects the behaviorof taxpayers, factors such as inflation and rigid nontax policies of develop-ing countries are frequently more severe disincentives to economic agents.Similarly, though labor supply, financial savings, and investment in devel-oping countries do respond to economic incentives and tax policy, they arefrequently affected by market imperfections and institutional factors aswell and their price elasticities tend to be low in the short run. In relation toincome taxation in particular, the finding is that the overall reliance ofdeveloping countries, particularly the low-income ones, on this tax is ex-tremely low. Hence, any policy reform in the area of income taxation can,at best, be expected to have a limited impact on the growth of the economy.Furthermore, while the present nominal levels of personal income taxationare high in many developing countries, their negative economic effects oncapital incomes are frequently neutralized, partially if not fully, by the verygenerous tax incentives granted to savers and investors. Indeed, loweringmarginal personal income tax rates, while at the same time broadening thetax base and removing the liberal tax incentives in order to contain theshort-run revenue loss, in the context of many developing countries couldwell lead to an increase in the tax burden on savings and investments.There is also some evidence that in developing countries, given their infla-tionary situations, the disincentive effects of high rates of taxes other thanindividual income tax, such as of export duties, and certain provisions ofcorporation tax, such as historic cost depreciation, first-in-first-out basisof inventory valuation, and other provisions, are far greater than those ofhigh marginal income tax rates on individuals. In light of all this, severalefficiency and growth-oriented tax reform ideas have emerged from theresearch project, which are consistent with the views of basic supply-sidetax policy. These are highlighted in Section V, below.
©International Monetary Fund. Not for Redistribution
16 VED P. GANDHI
III. Validity and Relevance of PopularSupply-Side Tax Policy
This section summarizes the findings and conclusions of the papers con-tained in Part II of the book which assess the validity and relevance of thepolicy prescriptions of popular supply-side economics in the context of thespecial circumstances of developing countries.
Validity of Popular Supply-Side Tax Policy
The validity of the popular supply-side tax policy prescription for devel-oping countries requires positive answers to the following five questions.
• Are labor supply, savings, and investment highly price-sensitive?• Do income tax policies (tax rates combined with liberal tax incentives
for savings) significantly reduce savings, especially the availability offinancial savings?
• Do income tax policies (tax rates combined with generous tax incen-tives and other tax provisions affecting investors) significantly reduceinvestment?
• Do high and progressive income tax rates significantly increase in-come tax evasion?
• Have government revenues increased significantly in the short run, inline with the Laffer curve, when top marginal income tax rates havebeen reduced?
A positive answer to all these questions in the institutional and economiccircumstances of the developing world would imply that the tax policy pre-scriptions of the popular supply-side school are valid and require carefulconsideration by the policymakers of developing countries. Six papers in-cluded in Part II of this book attempt to answer the above-mentioned fivequestions, while the seventh paper reviews some econometric evidence onthe interrelationship between reliance of developing countries on incometaxes and their growth rates.
Price Responsiveness of Labor Supply, Savings,and Investment
Using some simple macroeconomic models, Mackenzie (Chapter 2) es-tablishes that, theoretically, a reduction of income tax rates can have ag-gregate supply effects as well as effects on aggregate demand and liquidity.However, he also shows that the supply effects are far less significant thanthe demand and liquidity effects unless the income tax reductions are dras-tic and the price elasticities of labor supply and savings are very high. Toillustrate his point, he takes the readily available empirical estimates of
©International Monetary Fund. Not for Redistribution
SUPPLY-SIDE TAX POLICY: A SUMMARY 17
elasticities for a well-integrated and well-functioning competitive marketeconomy as that of the United States. (Economies of some middle-incomedeveloping countries may well have similar features.) Even for such aneconomy, he establishes that for the income tax cut to be self-financing,labor supply elasticity will have to be 15, when savings elasticity is assumedto be within the limits of reported empirical research. He shows that if thelabor supply and savings elasticities are low (as they, in fact, are for theUnited States where savings elasticity has been estimated by some studiesto be between 0.2 and 0.4 and labor supply elasticity has been estimatedto be around 0.2), the increases in the rate of growth of real output wouldnot be particularly great in the first ten years following a significant reduc-tion of income tax rates. He estimates that a 20 percent across-the-boardreduction of income tax rates for both capital and labor, given a savingselasticity of 0.4 and a labor supply elasticity of 0.2, and other economicparameters similar to those of the U.S. economy, will raise the averageannual growth rate of 3 percent over a ten-year period to at most 3.14 per-cent. In the extreme case, when both elasticities equal 1.0 and the tax rateon labor incomes is reduced by 20 percent and that on capital incomes by50 percent, the average annual growth rate of 3 percent over a ten-yearperiod increases to 3.77 percent. Mackenzie, thus, concludes from his the-oretical analysis that some positive supply-side effects are certain from anacross-the-board reduction of income tax rates but how large the effect willbe will depend upon the price elasticities of labor supply, savings, and in-vestment. The size of these elasticities is an empirical question and mustdepend on the structural features of the economy or economies in question.However, on balance, the potential impact of sweeping income tax ratecuts on the growth rates of a representative economy of the type some mid-dle-income developing countries may have does not seem to be very high.
Ebrill (Chapter 3) surveys the empirical evidence on the price respon-siveness of labor supply, savings, and investment in developing countries.He finds a dearth of solid empirical work and the direct evidence on priceresponsiveness to be rather limited. He, therefore, looks for indirectevidence.
On labor supply, he reviews studies on subjects such as rural-urban mi-gration, the effects of minimum wage laws, and the determinants of earn-ing functions and concludes that "some indirect support" does exist for theproposition "that supply-side considerations have a role in the determina-tion of the equilibrium wage" (p. 67). He also concludes that "althoughthe empirical work supports the existence of a well-defined aggregate laborsupply function, it appears not to be very elastic" (p. 67). In rural areas, inparticular, the evidence is that labor supply decisions are determined by avariety of factors other than the wage rate (labor markets are frequently
©International Monetary Fund. Not for Redistribution
18 VED P. GANDHI
interlocked with other factor markets and widespread land-lease contractsand sharecropping arrangements make for imperfect labor markets). As aresult, the labor supply function is price inelastic.
On savings, he finds that savings data in developing countries are veryinadequate and that the development economics literature has dealt littlewith the question of interest elasticity of savings. Ebrill, therefore, seeksout indirect evidence again. Most available estimates of consumption func-tions in developing countries, for example, reveal that aggregate savingsare affected more by income as well as by noneconomic factors, such asdemographic factors, income distribution, life span, occupational pat-terns, and urban-rural distinction, than by interest rates. However, theempirical literature evaluating the effects of financial repression (artifi-cially low interest rate ceilings) widely prevalent in developing countriesdemonstrates that financial savings may be sensitive to changes in interestrates. He, therefore, concludes that "even though aggregate savings maynot be very interest-sensitive, the allocation of that aggregate between con-ventional financial assets and alternatives such as curb market funds andworks of art is indeed responsive to economic incentives" (p. 74). Ofcourse, changes in income tax rates may be powerless in influencing eventhe allocation of aggregate savings if financial policy is "wrong."
On investment, Ebrill finds much of the empirical evidence from devel-oping countries to be against the neoclassical framework which explainsinvestment simply in terms of the cost of capital. Foreign investment is saidto be influenced by factors such as the presence of natural resources,proven record of economic performance of a country, threat of expropria-tion, degree of urbanization, and the availability of advanced infrastruc-ture rather than by the availability of fiscal incentives. Domestic invest-ment, on the other hand, is shown to be influenced by factors such as theavailability of domestic savings, retained earnings of businesses, public in-vestment outlays in support of private productive activity, trade policy,and the degree of protection, and, in the specific case of agricultural in-vestment, by distortions associated with price support systems and market-ing boards. Ebrill, therefore, concludes that while investors do react toeconomic incentives, "investment [in developing countries] is influencedby a number of factors" (p. 81).
Ebrill sums up his findings on the subject of price responsiveness in de-veloping countries as follows: "Although the empirical literature examin-ing the impact of tax policy on labor supply, savings, and investment leavesmuch to be desired, it nonetheless appears that changes in tax policy willhave some effects. The behavior of these aggregates appears, however, tobe determined as much by other elements. . . . Given the existence ofwidespread market failure in many developing countries, the impact of
©International Monetary Fund. Not for Redistribution
SUPPLY-SIDE TAX POLICY: A SUMMARY 19
changes in tax policies may be quite difficult to predict. . . [and] it may bethe case that a more promising supply-side approach might be one thatalso aims at alleviating the most obvious sources of market failure" (p. 82).
Tax Policies and Financial Savings
What is the optimal tax policy toward financial savings in developingcountries and is the sharp reduction of marginal income tax rates its mostimportant element? In Chapter 4, Ebrill reviews the existing literature insearch of a theoretical answer to these questions and finds that the litera-ture is inconclusive; in addition, the literature does not adequately accom-modate the special circumstances of developing countries. He identifies atleast four characteristics of developing country situations (they exist in alldeveloping countries although their magnitudes may vary): (1) artificiallylow interest rate ceilings which, given the rates of inflation, frequentlyresult in financial repression; (2) relatively underdeveloped financial insti-tutions and capital markets; (3) the existence of unorganized capital mar-kets; and (4) the use of compulsory savings schemes by the governments.
Ebrill then develops a modified illustrative optimal tax framework totake into account some of the characteristics of the financial structures ofdeveloping countries, in particular the existence of financial repressionand curb markets. To start with, his model shows that, under normal cir-cumstances, the optimal tax on financial savings depends on its own-priceelasticity. While the evidence indicates that financial savings are interest-elastic to some degree, he admits that no useful point estimates can bemade of the relevant price elasticity and, therefore, of the optimal taxrates. Once, however, the special circumstances of developing countriesare taken into account, the model suggests that the optimal taxation offinancial savings changes. If the degree of financial repression in a devel-oping country is large, and if for some reason this distortion cannot beremoved, his modified optimal tax framework indicates that "a subsidyrather than a tax is appropriate" (p. 106). In turn, if the use of subsidies isprecluded for fiscal or other reasons, then "consumption . . . is more ap-propriate than income as a tax base" (p. 106).
Ebrill argues that the optimal tax treatment of financial savings dependscritically on the degree of financial repression, which varies widely bothacross countries and over time. "Accordingly, there is no single recom-mended policy such as reducing marginal tax rates. Each country has to beconsidered individually" (p. 108). Depending on the particular countrythat is under consideration, "the optimal tax treatment of financial sav-ings runs the gamut from subsidies to substantial taxation" (p. 92).
©International Monetary Fund. Not for Redistribution
20 VED P. GANDHI
Tax Policies and Investment
The rate of tax affects the cost of capital and, therefore, affects the levelof investment—this much is built into the neoclassical framework of in-vestment behavior. In many developing countries, the nominal rate of cor-poration income tax is high but, as Table A15 in the Statistical Appendixshows, tax incentives and deductions for investment are relatively liberaland it is the combination of both of these, along with the rate of inflation asit interacts with capital allowances, capital gains, and interest deductibil-ity provisions, that determines the cost of capital. In Chapter 5 Ebrill re-views the income and corporate tax structures of 31 developing countriesand makes cost-of-capital estimates. His results show that "Indeed . . .the tax system in many countries subsidizes the cost of investment at lowinflation rates." At high rates of inflation, on the other hand, their tax sys-tems (especially those featuring depreciation allowances and inventory val-uations based on historic costs) are such as to be a "source of investmentdisincentives." For several countries with very high inflation rates, he findsthe disincentive effects to be pronounced (p. 126).
Relating the share of gross domestic investment in gross domestic prod-uct (GDP) to his cost-of-capital estimates for 31 developing countries,Ebrill shows that while after-tax cost of capital has a significant impact oninvestment levels, other variables, especially the rate of inflation and thegrowth of exports, are equally important which, at least, "raises the ques-tion of which is the most promising path for policy to take" (p. 132).
He concludes, therefore, that strong policy recommendations concern-ing the effectiveness of income and corporate tax rate reductions alone forencouraging investment in developing countries should be resisted and at-tention should be paid to controlling inflation and alleviating distortions toexports. All this suggests "that supply-side based tax reform proposals[advocated by popular supply-siders] are only of limited use" (pp. 133-34)and additional tax reforms, such as indexation of depreciation allowancesor taxing corporations on a cash flow basis (i.e., full expensing of all in-vestment and disallowing the deductibility of interest payments on debt),are equally important.
Progressivity and Income Tax Evasion
The effect of high and progressive taxation on income tax evasion iscommonly taken for granted and with ample justification. Richupan(Chapter 6) surveys the theoretical and empirical literature on income taxevasion to locate the basis of this perceived relationship. He concludes that"the theoretical literature does not support the claim that an increase inthe tax rate will lead to an increase in tax evasion" (p. 148) or "that a
©International Monetary Fund. Not for Redistribution
SUPPLY-SIDE TAX POLICY: A SUMMARY 21
progressive tax rate schedule stimulates tax evasion" (p. 151). The empiri-cal studies on the subject are, however, sketchy and indirect and do notyield a definitive conclusion on the subject.
Richupan, however, finds that the theoretical literature containsstronger conclusions regarding the role of other tax and nontax factors inencouraging income tax evasion. In particular, high penalty rates and highprobability of detection are shown to have a negative effect on tax evasion.Income tax evasion is also shown to be strongly influenced by nontax fac-tors such as the type of income and perception of fiscal equity. In the spe-cial circumstances of developing countries, nontax factors such as pricecontrols, government regulations, and civil service salaries, are all shownto contribute positively to income tax evasion.
Thus, Richupan ends up doubting the effect that a reduction of incometax rates alone or even income tax reforms generally will have on the degreeof income tax evasion which is far higher in developing countries than indeveloped countries.
Evidence on the Laffer Curve
One important assumption of popular supply-side economics is that iftax rates are sufficiently high (the "prohibitive range") then a reduction intax rates would lead to an increase in tax revenues. The implicit assump-tion in this relationship is that the substitution effect of a tax cut is positiveand the factor elasticities are very large.
Ebrill (Chapter 7) tests the validity of this assumption and the Laffercurve with data from Jamaica and India, two developing countries that hadvery high marginal income tax rates and where in the 1970s the top mar-ginal income tax rates were significantly reduced. He points out that anideal test of the Laffer curve would involve relating income tax yield amongthe highest income groups with proxies for tax rate reductions and otherexplanatory variables. Using the data for PAYE taxpayers in Jamaica be-tween 1979 and 1981 only, and adjusting it for changes in income distribu-tion, real growth rates, and inflation over time, Ebrill concludes that "dataare consistent with the existence of a Laffer curve in Jamaica" (p. 188);however, he mentions many reservations about this conclusion. Data avail-ability is better for India and Ebrill's analysis of the effects of a marginalincome tax reduction introduced in that country in 1975 leads him to con-clude that "the data on India, at least for the years selected . . . do notsupport the Laffer curve hypothesis" (p. 192).
Ebrill recognizes the limitations of his methodology, which had to betailored to use the available (rather poor quality and inadequate) data, andadmits that existence of market imperfections, improvements in income
©International Monetary Fund. Not for Redistribution
22 VED P. GANDHI
tax administration, and other variables may account for his results. Never-theless, he concludes that "assertions to the effect that developing coun-tries are operating in regions of the Laffer curve, where tax rate reductionswould lead to revenue increases, should be treated with caution" (p. 175)and that "the results [obtained for Jamaica and India] could easily be ra-tionalized using non-Laffer curve explanations" (p. 193). He, therefore,cautions that none of his results can be seen as a complete endorsement ofthe narrow (popular) supply-side approach (marginal income tax rate re-ductions) and that the broader (basic) supply-side approach (removal oftax distortions irrespective of the source) may still induce significant sup-ply-side response.
The answers to the five questions set out at the beginning of this subsec-tion can be summed up as follows. Although there is some indirect evi-dence that the assumptions underlying the popular supply-side tax policymay be valid for developing countries, the research has highlighted manyother factors, special to the circumstances of developing countries, whichmay be of equal or greater importance to the expansion of labor supply,savings, and investment as well as the reduction of income tax evasion,considered desirable by supply-side economists. In particular, the researchshows that developing countries need to pay attention to the developmentof labor and capital markets and to removing other economic policy distor-tions such as high minimum wages, overvalued exchange rates, interestrate ceilings, and inflationary financing of the budget. Even in the area ofincome tax policy, the alternatives of inflation-adjustment of depreciationallowances and inventory valuations, conversion of income tax to someform of consumption tax (i.e., the exemption of savings or, at least, a mod-eration of the tax burden on capital incomes), and the replacement of acorporation tax based on profits by a tax based on cash flow may affectsavings and investment more significantly than a simple reduction of mar-ginal income tax rates. Similarly, raising income tax penalties and increas-ing the probability of detection of income tax evaders, through legislativeand administrative improvements, may also be more effective in reducingincome tax evasion in developing countries than just lowering marginal taxrates and reducing the progressivity of income taxation.
Thus, the conclusion of the research is that it is not that the popularsupply-side tax policy prescription of reducing the excessively high mar-ginal income tax rates, in the interest of improving growth prospects, isinvalid but that there are other important tax and nontax determinants ofthe behavior of economic agents and economic growth in developing coun-tries. The fact that developing countries are quite heterogeneous and thattheir governments must, at this stage of development, pursue a variety ofobjectives (including redistribution, economic stabilization, and mobiliz-
©International Monetary Fund. Not for Redistribution
SUPPLY-SIDE TAX POLICY: A SUMMARY 23
ing revenue for providing essential social and economic infrastructure andits maintenance) further complicates the task of arriving at a unique con-clusion about the levels and structure of taxation that will be valid for alldeveloping countries. Advice on tax policies must, therefore, struggle withthis multiplicity of objectives; in doing so it must also take into account theuses to which government revenues are put and assess their economic andsocial necessity.30
Relevance of Popular Supply-Side Tax Policy
In assessing the relevance to developing countries of the popular view ofsupply-side tax policy, one needs to assess the reliance of developing coun-tries on income taxes, in particular (1) the relative importance of incometax revenues in such countries; (2) the height of their income tax rates; and(3) the scope and generosity of various tax reliefs to savings and invest-ments and the impact of these on the effective tax rates on capital incomes.These topics are treated below. Furthermore, one also needs to considerthe empirical evidence on the growth rates of the developing countries thatrely heavily on income taxes, which is explored by Mañas-Anton in Chap-ter 8.
Relative Insignificance of Individual Income Taxation
The data given in Tables A2-A4 in the Statistical Appendix confirm thatthe individual income tax is a relatively unimportant source of revenue inmany developing countries, particularly in those that do not have large andsignificant mining sectors. While there are important differences amongcountries of the developing world, on average, the individual income taxaccounts for only 2 percent of GDP and 11 percent of all tax revenue, com-pared with 8 percent and 29 percent, respectively, in developed countries.From a limited number of developing countries for which it has been possi-ble to collect information (see Tables A5 and A6 in the Statistical Appen-
30As Rosen (1985) points out, "The fact that a tax generates an excess burden is not neces-sarily 'bad.' One hopes, after all, that the tax will be used to obtain something beneficial forsociety either in terms of purchase of public goods or income redistribution" (p. 296). Theuses to which government revenues are put are, therefore, not entirely irrelevant. Availabledata suggest that central governments of developing countries devote an average of over 40percent of their total expenditure (including net lending) to the provision of economic services(viz., agriculture, electricity, roads, and transport and communications) and for capital for-mation as against an average of about 15 percent by those of developed countries. See Inter-national Monetary Fund (1985a, pp. 46-63). Unfortunately, expenditure data are not readilyavailable to make a similar comparison for all levels of government.
©International Monetary Fund. Not for Redistribution
24 VED P. GANDHI
dix), it is clear that individual income tax, on average, is paid by less than5 percent of the population (mostly wage and salary earners) and the in-come assessed to tax is less than 14 percent of GDP (mostly through with-holding taxes). Richupan (1985) has listed a variety of factors that may beresponsible for the relative insignificance of personal income taxation indeveloping countries.31
Even though income tax is an unimportant source of tax revenue andaffects a relatively small proportion of high income earners, the progressiv-ity of its nominal rate structure may still be such as to have serious disin-centive effects on income earners who matter. Data given in Table A9 ofthe Statistical Appendix throw light on the rate structures of personal in-come taxation in selected developing countries.
Levels of Individual Income Taxation
The income tax rate schedules of 32 developing countries, summarizedin Table A9 of the Statistical Appendix, show that the top marginal in-come tax rate exceeds 55 percent in nearly one half of the 32 selected coun-tries. In 4 developing countries, the top marginal rates exceed 65 percent(Table 1). The threshold levels of income at which income tax starts apply-ing in most developing countries are the equivalent of about one time theper capita GDP before personal allowances are taken into account and lessthan twice the per capita GDP after personal allowances are taken intoaccount (see Table A12 in the Statistical Appendix). The availability ofpersonal allowances, deductions, and preferences (see Statistical Appen-dix Table A10) does neutralize some of the burden of high marginal taxrates, and in most developing countries the top marginal income tax ratesapply only to very high income levels, as high as 50 times the per capitaincome. However, in 3 developing countries, top marginal tax rates arepayable by income earners earning less than 10 times the per capita GDP(Table 2), which is relatively low.
Tax Reliefs for Personal Savings and Investments
Individual income taxpayers in many developing countries enjoy a num-ber of incentives for personal savings and investments which reduce the
31In addition to fundamental factors such as the underdeveloped structure of the economy(e.g., the prevalence of subsistence agriculture and small and poorly equipped productionand business units in the manufacturing and service sectors) and the consequent lack of ade-quate tax handles, Richupan stresses the roles of government economic policies and the lowefficiency of tax administration.
©International Monetary Fund. Not for Redistribution
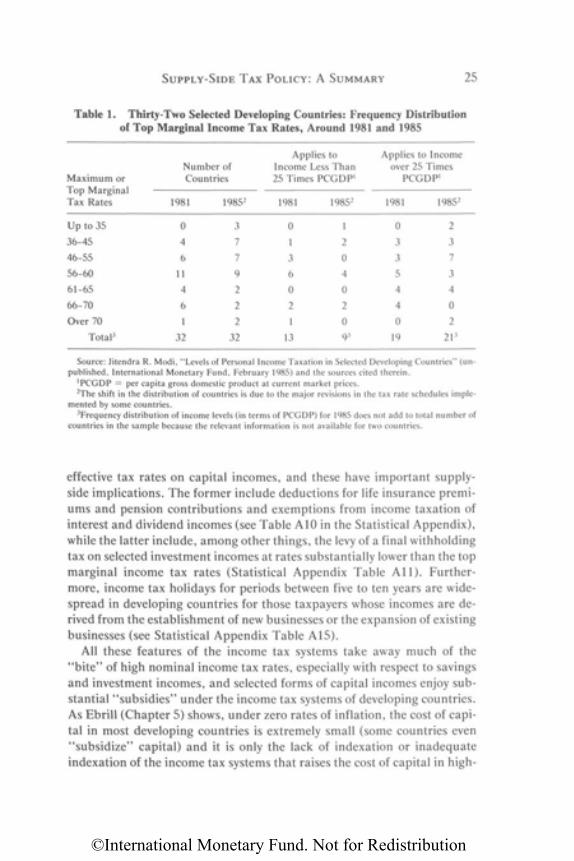
SUPPLY-SIDE TAX POLICY: A SUMMARY 25
Table 1. Thirty-Two Selected Developing Countries: Frequency Distributionof Top Marginal Income Tax Rates, Around 1981 and 1985
Maximum orTop MarginalTax Rates
Up to 35
36-45
46-55
56-60
61-65
66-70
Over 70
Total3
Number ofCountries
1981
0
4
6
11
4
6
1
32
19852
3
7
7
9
2
2
2
32
Applies toIncome Less Than25 Times PCGDP1
1981
0
1
3
6
0
2
1
13
19852
1
2
0
4
0
2
09 3
Applies to Incomeover 25 Times
PCGDP1
1981
0
3
3
5
4
4
0
19
19852
2
3
7
3
4
0
2
213
Source: Jitendra R. Modi, "Levels of Personal Income Taxation in Selected Developing Countries" (un-published, International Monetary Fund, February 1985) and the sources cited therein.
1PCGDP = per capita gross domestic product at current market prices.2The shift in the distribution of countries is due to the major revisions in the tax rate schedules imple-
mented by some countries.3Frequency distribution of income levels (in terms of PCGDP) for 1985 does not add to total number of
countries in the sample because the relevant information is not available for two countries.
effective tax rates on capital incomes, and these have important supply-side implications. The former include deductions for life insurance premi-ums and pension contributions and exemptions from income taxation ofinterest and dividend incomes (see Table A10 in the Statistical Appendix),while the latter include, among other things, the levy of a final withholdingtax on selected investment incomes at rates substantially lower than the topmarginal income tax rates (Statistical Appendix Table All) . Further-more, income tax holidays for periods between five to ten years are wide-spread in developing countries for those taxpayers whose incomes are de-rived from the establishment of new businesses or the expansion of existingbusinesses (see Statistical Appendix Table A15).
All these features of the income tax systems take away much of the"bite" of high nominal income tax rates, especially with respect to savingsand investment incomes, and selected forms of capital incomes enjoy sub-stantial "subsidies" under the income tax systems of developing countries.As Ebrill (Chapter 5) shows, under zero rates of inflation, the cost of capi-tal in most developing countries is extremely small (some countries even"subsidize" capital) and it is only the lack of indexation or inadequateindexation of the income tax systems that raises the cost of capital in high-
©International Monetary Fund. Not for Redistribution
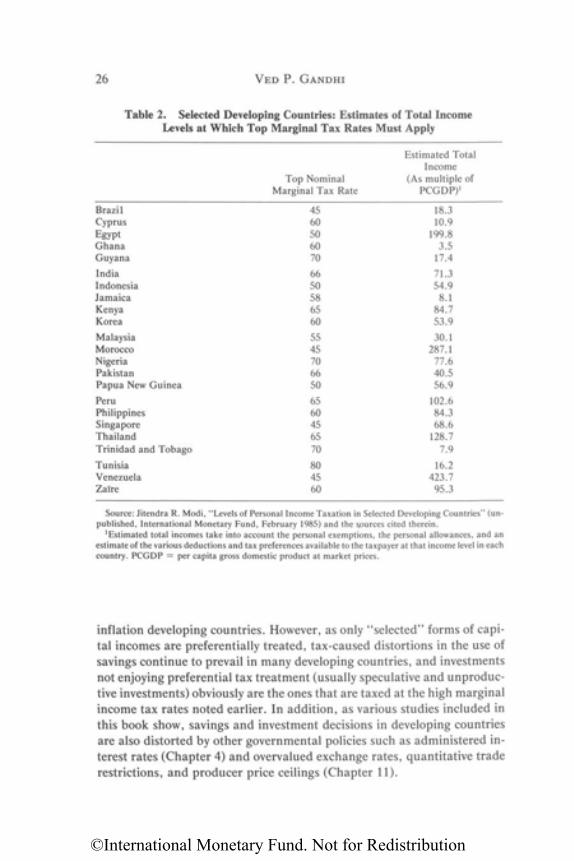
26 V E D P. GANDHI
Table 2. Selected Developing Countries: Estimates of Total IncomeLevels at Which Top Marginal Tax Rates Must Apply
inflation developing countries. However, as only "selected" forms of capi-tal incomes are preferentially treated, tax-caused distortions in the use ofsavings continue to prevail in many developing countries, and investmentsnot enjoying preferential tax treatment (usually speculative and unproduc-tive investments) obviously are the ones that are taxed at the high marginalincome tax rates noted earlier. In addition, as various studies included inthis book show, savings and investment decisions in developing countriesare also distorted by other governmental policies such as administered in-terest rates (Chapter 4) and overvalued exchange rates, quantitative traderestrictions, and producer price ceilings (Chapter 11).
Source: Jitendra R. Modi, "Levels of Personal Income Taxation in Selected Developing Countries" (un-published, International Monetary Fund, February 1985) and the sources cited therein.
1Estimated total incomes take into account the personal exemptions, the personal allowances, and anestimate of the various deductions and tax preferences available to the taxpayer at that income level in eachcountry. PCGDP = per capita gross domestic product at market prices.
BrazilCyprusEgyptGhanaGuyanaIndiaIndonesiaJamaicaKenyaKoreaMalaysiaMoroccoNigeriaPakistanPapua New Guinea
PeruPhilippinesSingaporeThailandTrinidad and Tobago
TunisiaVenezuelaZaire
Top NominalMarginal Tax Rate
4560506070
6650586560
5545706650
6560456570
804560
Estimated TotalIncome
(As multiple ofPCGDP)1
18.310.9
199.83.5
17.4
71.354.9
8.184.753.9
30.1287.1
77.640.556.9
102.684.368.6
128.77.9
16.2423.7
95.3
©International Monetary Fund. Not for Redistribution
SUPPLY-SIDE TAX POLICY: A SUMMARY 27
Relationship Between Income Tax Ratios and Growth Rates
If the levels of income taxation have the significantly detrimental effectson growth rates that popular supply-siders claim, countries whose govern-ments rely less heavily on income taxation should enjoy relatively highergrowth rates than those whose governments rely more heavily on such taxa-tion. Taking this as his starting point, Mañas-Anton (Chapter 8) presentssome empirical evidence on the interrelationship in selected developingcountries between output growth and the reliance on income taxes. He usesreadily available cross-country and pooled cross-country time-series dataand estimates of multiple regression equations with a variety of specifica-tions, all containing important determinants of growth derived from theDennison growth accounting tradition.
His regressions show that the ratio of income taxes to total tax revenue(as well as to GDP) and the growth rate of output are negatively relatedand that the regression coefficients are significant, but this result does nothold in all specifications. When the ratios of individual and corporateincome taxes to total tax revenue are related to growth rates, the regressioncoefficients are still negative but statistically insignificant in both cases.
Mañas-Anton, therefore, concludes that "while there is some evidencesupporting a negative relationship between output growth rates and thereliance of a country on income taxes, this relationship cannot be assertedwith much confidence" (p. 218). He calls this conclusion "tentative" andrecognizes the many limitations of his analysis: cross-section regressionanalysis, for example, can be easily criticized as an improper test of a time-series proposition; the model specification itself was limited by the avail-able data and, therefore, may be inadequate.
Evidence thus far suggests that, given the limited scope of income taxa-tion in most low-income developing countries, and the very few taxpayerswho are subject to top marginal income tax rates in many developing coun-tries, lowering the top marginal income tax rates alone (the popular sup-ply-side tax policy) may well be of lesser consequence from an efficiencypoint of view than reforming the scope of the tax base, various tax rulesand provisions, and other aspects of the income tax structure. For supply-side tax policy to be relevant to developing countries, it must also encom-pass reforms in the rates and bases of taxes other than income tax, whichare more important in developing countries and which may have more sig-nificant supply-side effects than the level and structure of income tax rates.A review of the other characteristics of the tax systems of developing coun-tries is, therefore, essential and a supply-side look at other aspects of theirtax policies is called for. The papers included in Part III of the book reviewselected aspects of the tax systems of developing countries that are signifi-cant from the point of view of efficiency and growth.
©International Monetary Fund. Not for Redistribution
28 VED P. GANDHI
IV. Tax Policy for Efficiency and Growth
The overall level of taxation is claimed by all supply-side economists tohave significant effects on the growth rates in developing countries, andthe structure of taxation is believed to have significant effects on the incen-tives of economic agents and the efficiency of resource allocation in theeconomy. One must, therefore, ask the following questions.
• What will the tax systems of developing countries look like in theory ifincentives and the efficient allocation of resources were the major con-cern of the policymakers?
• How efficient are the very generous tax incentives that are frequentlygiven to agricultural, manufacturing, and other enterprises by thepolicymakers of developing countries in order to induce economicgrowth?
• When are export duties, which are so dominant in the revenue struc-tures of many low-income developing countries, justified on groundsof efficiency and growth?
• What is the precise role of tax policy in removing the various struc-tural bottlenecks to economic development and helping the growth ofdeveloping countries?
The answers to these questions are explored in the four papers includedin Part III.
Tax Structure for Incentives and Efficient Resource Allocation
Gandhi (Chapter 9) points out that taxation has always been an instru-ment with multiple objectives. It is not that the traditional literature ontaxation has ignored the efficiency objective of taxation, or the distor-tionary economic effects of various taxes, but that a tax system based solelyon efficiency criteria would not be viable on political and other grounds. Itwould ignore entirely the equity objective and is unlikely to generate ade-quate revenue to run a modern government or to allow for the provisionand maintenance of basic social and economic infrastructure that is neces-sary for economic development. Furthermore, it would contain certaintaxes that would not be easy to administer.
He establishes what the tax systems of developing countries would looklike if efficient allocation of resources were the sole concern of the policy-makers. They would consist of a poll tax, a tax on land area, a tax onwindfall profits, a tax on potential income, taxes on items with inelasticdemand or supply, and taxes for internalizing the negative production andconsumption externalities; they would not consist of any other taxes suchas income tax, corporation tax, capital gains tax, payroll tax, wealth tax,
©International Monetary Fund. Not for Redistribution
SUPPLY-SIDE TAX POLICY: A SUMMARY 29
gift tax, and inheritance tax. Export duties and import duties would alsonot be included in such tax systems except under very exceptional circum-stances. The rates of taxation under an "efficient" tax system would bestrictly dictated by optimizing formulas based on price elasticities andwould contain little or no progression—in any case, they could not beraised simply for revenue reasons. Also, there would be no place for specialtax incentives and preferences in such a tax system. The efficiency-oriented tax structure is, thus, shown by Gandhi to be no more than atheoretical ideal which could not be realistically adopted by any developingcountry.
Role of Tax Incentives
Tables A13 to A15 in the Statistical Appendix examine the structure ofcorporation tax and corporate tax incentives in 32 developing countries.32
They show that only a few developing countries have high corporate taxrates (55 percent or over) but most do have very liberal tax deductions andincentives. Most developing countries offer tax depreciation allowances ona replacement basis or accelerated basis and investment tax credits or in-vestment allowances ranging between 5 percent and 30 percent of the costof capital assets. Many developing countries give special deductions forintangible expenditures, such as manpower training and research and de-velopment expenditures, as well as for expenditure related to export pro-duction. Carry forward of unutilized holiday period depreciation andlosses for almost indefinite periods is also permitted in most developingcountries. Many developing countries also offer favorable tax treatment ofcapital gains and partial indexation provisions, and almost one third of theselected developing countries permit liberal inventory valuations for taxpurposes. Shareholders frequently enjoy relief from double taxation of div-idends through partial imputation of the corporation tax. However, themost significant of all tax incentives to corporate investment is the com-plete income tax holidays, for varying durations (often extendable) and fora variety of purposes, which are offered in most developing countries; divi-dends and capital gains earned by individual and corporate stockholdersduring the tax holiday period are also frequently tax exempt.
Thus, in developing countries investment incentives are generousenough to reduce the cost of capital considerably and to lower the averagetax burden on capital incomes as compared to what is incorporated in the
32For a fuller description of the features of corporate tax structures in developing countries,see Modi (1987).
©International Monetary Fund. Not for Redistribution
30 VED P. GANDHI
nominal tax rate schedules. In fact, as Ebrill (Chapter 7) shows, the gov-ernments of many developing countries "subsidize" productive invest-ments in priority sectors of their economies.
Given the widespread use of liberal tax incentives in developing coun-tries to achieve a variety of developmental goals, Sanchez-Ugarte (Chapter10) looks at tax incentives from the supply-side point of view and concludesthat "even though the granting of tax incentives under certain circum-stances might be economically rational, this policy presents severe limita-tions and drawbacks. . . . The attempt by some developing countries touse a vast array of liberal tax incentives to counteract the negative eco-nomic effects of high marginal tax rates of narrowly based taxes and/orwrong economic policies with regard to wage rates, interest rates, ex-change rates, and so on is likely to be ineffective and even counterproduc-tive" (p. 273). Sanchez-Ugarte divides the efficiency case for tax incentivesinto a "pure" case and an "impure" case. A pure case for tax incentivesexists whenever externalities exist and tax incentives for regional develop-ment, encouragement of risk-taking and savings, dampening the short-run output disturbances, and promoting research and development are alljustified on this basis. The impure case for tax incentives exists only as anoffset to distortions created by other economic policies whose reform isconsidered infeasible by policymakers for one reason or another. Sanchez-Ugarte then describes the distortions created by inappropriate trade, tax,and wage policies and shows how tax incentives can be designed to coun-teract their distortionary effects. He concludes that tax incentives "arenever the most appropriate policy to follow" (p. 258) because they areprone to induce diverse and often unpredictable distortions in the economyand illustrates this by examining specific tax incentives in terms of the cri-terion of efficiency.
As stated earlier, Sanchez-Ugarte points out that tax incentives as ap-plied in most developing countries are often ineffective. For tax incentivesto be effective, he lists five conditions: (1) they should be directed to lim-ited objectives which should be economic and not political; (2) there shouldbe little red tape and discretion in granting them; (3) they should be pre-dictable, though not necessarily permanent; (4) the specific tax incentiveshould closely match the objective which is being pursued; and (5) the de-sign of the tax incentive should attempt to take into account its generalequilibrium effects on the economy. It is, thus, no simple task to designeffective tax incentives and Sanchez-Ugarte concludes that "tax incentivesare no substitute for an efficient tax system" (p. 274).
©International Monetary Fund. Not for Redistribution
SUPPLY-SIDE TAX POLICY: A SUMMARY 31
Optimality of Export Duties
Many low-income developing countries rely as much on export duties ason income tax. Sanchez-Ugarte and Modi (Chapter 11) examine a sampleof 71 developing countries that levy export duties and find that 29 coun-tries derive more than 10 percent of their tax revenue and more than1 percent of GDP from such duties. Almost all of the 71 developing coun-tries rely heavily on one or more export items, generally coffee, cocoa, tea,bananas, rubber, groundnuts, tin, bauxite, and phosphates, and the aver-age rates of these duties are frequently high, thus affecting incentives forproduction and exports.
Sanchez-Ugarte and Modi review the levels and structures of existingimposts, both explicit and implicit, on exports in selected developing coun-tries and reach three important conclusions. First, they find the actuallevel of export taxation in the majority of developing countries to be higherthan the level that can be considered even country optimal, let alone worldoptimal. This result arises primarily due to the high implicit export taxes,in the form of overvalued or multiple exchange rates, producer price ceil-ings, or quantitative restrictions on exports, prevalent in many developingcountries. Given the small but significant values of the supply elasticities ofagricultural products estimated in the literature, they show that the detri-mental effects of the high export taxation existing in many developingcountries on the level of their exports are significant. Second, they findthat the taxation of "windfall" profits through export taxes will be nondis-tortionary only when the tax is unexpected and temporary—which is diffi-cult to attain in practice. Finally, they show that the operation of producerincome stabilization schemes reduces significantly the present value of rev-enue to producers, without significantly reducing riskiness. Hence, suchschemes are distortionary and discourage production and exports.
Thus, Sanchez-Ugarte and Modi show that in the majority of developingcountries analyzed in the chapter, the reduction of export taxes can beexpected not only to increase exports but also to enhance the economicwell-being of the specific country and the world as a whole. However, theauthors conclude that over the short and medium runs the existence ofmarket imperfections in commodity markets could well preclude many de-veloping countries from benefiting from the supply-side effects of loweringexport taxes, while the government revenues would be lowered. With re-spect to revenues, they argue, however, that many developing countriescan reduce effective levels of export taxation without losing revenue (in afew cases even gaining revenue) if the nonrevenue-yielding implicit exporttaxes (exchange rate overvaluation, quantitative restrictions on exports,etc.) are removed, so that the base of explicit export taxes expands.
©International Monetary Fund. Not for Redistribution
32 VED P. GANDHI
Limits of Tax Policy for Economic Development
Shome (Chapter 12) forcefully argues that in a developing country, "taxpolicy can theoretically be a powerful instrument in targeting all . . . fac-tors of development" (p. 327) but only under appropriate conditions. Heshows how tax policies can and have in practice operated in certain devel-oping countries to influence the conditions of development such as raisingthe investment rate, closing the foreign exchange gap, encouraging finan-cial intermediation, assisting in human resource development, and con-trolling population, where necessary. But, then, taxation has its limita-tions and difficulties: it simply cannot be effective in the attainment of toomany objectives; frequently, not all individuals in a developing country arecovered by the tax regime; the capacity to administer even moderately so-phisticated taxes is limited in many of these countries; and the taxpayer'seconomic behavior is not always affected solely by prices. In addition, taxpolicy must be supported by complementary changes in other policies ofdeveloping countries, especially those relating to the monetary and finan-cial sector, as well as the removal of structural bottlenecks to development.Shome, therefore, rightly states, "Thus, while economists have to, and in-deed, do assign a major role to tax policy in tackling development andgrowth, and sometimes successfully, it must be done with perspicacity"(p. 330). Similar sentiment is expressed in other chapters, viz., in Ebrill(Chapter 4), where a strong case is made from the supply-side point of viewfor removing financial repression and other distortions to the developmentof the capital markets; in Ebrill (Chapter 5), where a strong case is madefor the control of inflation; and in Sanchez-Ugarte and Modi (Chapter 11),where a strong case is made for the removal of distortions to exports, in-cluding overvalued exchange rates.
To sum up Section IV, the research has established that tax structures ofmost developing countries depend a lot more on commodity taxes, such asimport and export duties, sales taxes, and excise duties, than on incometaxes. Even income taxes in these countries take on the characteristics ofconsumption taxes because of the very generous tax incentives and tax re-liefs granted to savings and investments. In addition, many facets of agiven tax, other than tax rate, such as the tax base, exemptions, and allow-ances, can significantly distort taxpayer behavior. If developing countriesare to reach their full growth potential, they may need efficiency-orientedreforms of the entire tax systems, corporate tax incentives, export duties,and other important elements of their tax structures, and not only of themarginal rates of income tax, considered sufficient by popular supply-siders.
©International Monetary Fund. Not for Redistribution
SUPPLY-SIDE TAX POLICY: A SUMMARY 33
V. Supply-Side Tax Reforms for Developing Countries
Various supply-side tax proposals relevant to developing countries, aswell as the limitations of tax policy in developing country circumstances,emerge from the papers included in the book. This section summarizeswhat should or should not be expected from strictly supply-side tax re-forms.
Acknowledging the limited influence of tax policy in the current devel-oping country environment, as stressed by Shome (Chapter 12), is the firststep toward adopting feasible supply-side tax reforms. Then there areother limitations that have to be acknowledged. For tax policy to have astrict efficiency orientation, it should not be used as an instrument of ma-jor redistribution. However, income and wealth distribution is highlyskewed in developing countries, and few policy instruments, other thanland reforms and social welfare expenditures, are readily available to gov-ernments to affect major redistribution. Consequently, the policymakersof developing countries will have to take bold political decisions on thisissue viz., the extent to which they want the tax system to be the maininstrument of redistribution and are willing to control tax avoidance andevasion and make the nominal tax structure truly effective. Finally, asGandhi (Chapter 9) argues, a tax system dictated by efficiency consider-ations would certainly be desirable except that the benefits of such a taxstructure would be large only when many assumptions, which may not bereadily descriptive of the special circumstances of developing countries,are satisfied. As a result, he shows that such a tax system is not going to beeasily accepted by policymakers. Indeed, very radical reforms in tax basesas well as tax rates will be needed strictly in the interest of efficiency objec-tives and may involve the substitution of existing taxes with entirely newand even administratively difficult taxes, such as replacing the income taxby the levy of a tax on ability and potential income.
In practice, tax systems in most countries attempt to fulfill multiple ob-jectives, including many politically motivated ones, and end up having dis-tortionary economic effects, and the tax systems of developing countriesare no exception. From a supply-side perspective, it would be desirable iftaxation were used only for the attainment of as few objectives as possible,for example, correcting "market failures" and providing adequate govern-ment revenues with minimal distortions to resource allocation and disin-centives to factor supplies. Achieving a limited degree of redistribution caneasily be accommodated in the framework of supply-side tax policy, if thatwere to be politically acceptable. The papers presented in this book con-tain a number of proposals for reform relevant to the longer-term tax sys-
©International Monetary Fund. Not for Redistribution
34 VED P. GANDHI
tems of developing countries that are, at once, practical and in the supply-side spirit.33
First, the tax systems should over time attempt to reduce their relianceon narrowly based taxes unless such taxes fall on real windfall profits andscarcity rents or correct some negative externality. The views of Gandhi(Chapter 9) on the efficient tax system and Sanchez-Ugarte and Modi(Chapter 11) on export duties more than amply bear this out.
Second, on income taxation, there is a case for lowering the excessivelyhigh marginal tax rates presently existing in many developing countrieswhile (1) expanding the tax base through the removal of most allowances,deductions, exclusions, and tax credits; (2) indexing the tax base for infla-tion; and (3) improving income tax laws and administration, particularlyraising the penalty rates and probability of detection. There is no case for aseparate capital gains tax; real capital gains can be treated as ordinaryincomes and taxed under income tax without any preferential tax treat-ment. Similarly there is no case for a separate payroll tax or social securitytaxes on labor incomes. The arguments in support of these positions areamplified in Ebrill (Chapter 5), Richupan (Chapter 6), and Gandhi (Chap-ter 9).
Third, in relation to income taxation again, a strong case is made byEbrill (Chapter 4) for the removal of savings from the base of income taxa-tion (i.e., for increased reliance on broad-based consumption taxation),especially in circumstances where, for a variety of noneconomic reasons,interest rates must remain at artificially low levels and adequate pretaxrates of return to savings are precluded.
Fourth, on corporate taxation, the case is made on efficiency grounds to(1) reduce the scope of tailor-made tax incentives and (2) index deprecia-tion allowances and inventory valuation for inflation. Sanchez-Ugarte(Chapter 10) suggests that tax incentives be restricted only to the effi-ciency-oriented ones, such as those that encourage risk-taking and sav-ings, research and development, and, under certain circumstances, re-gional distribution of economic activity. Ebrill (Chapter 5) proposesindexation of the corporate tax base and even taxation of corporations, ona cash-flow basis, which will allow all capital outlays to be immediatelyexpensed and disallow the deductibility of interest payments, thereby elim-inating many of the distortions of existing corporation taxes. Gandhi
33In the short run, the needs of economic stabilization and demand management could wellpreclude the immediate adoption of some of the reform proposals dictated by supply-sideobjectives. Under such circumstances, government revenue, needed to manage fiscal deficitsin the short run, should preferably be raised through consumption taxes and not through anincrease in the rates of income taxes if the negative supply-side effects are to be minimized.
©International Monetary Fund. Not for Redistribution
SUPPLY-SIDE TAX POLICY: A SUMMARY 35
(Chapter 9) restates various arguments made in the literature against thelevy of any separate corporation tax and for the removal of double taxationof dividends.
Fifth, on export taxation, the recommendation is made by Sanchez-Ugarte and Modi (Chapter 11), on efficiency grounds, that tax levels bereduced in most of the developing countries in the medium term; it is onlyunder circumstances of temporary high world prices that temporarily thelevy of high export duties to mop up excess demand generated by "windfallprofits" is justified. However, given the developing countries' present reli-ance on export tax revenue and the limitations of tax handles and tax ad-ministration capacity in these countries, the reforms in this area may haveto be gradual. Furthermore, the effectiveness of such a course of action willdepend on the removal of many obstacles to free world trade that still exist.Nevertheless, the unwanted supply-side effects of export duties can be re-duced by avoiding export duties on agricultural products with relativelyhigh supply elasticity and imposing them on others on a sliding scale of taxrates to approximate them as much as possible to a tax on "windfall" in-comes. In the long run, the rates of export duties should be such as to allowthe exporters to earn an "adequate" after-tax rate of return on labor andcapital; under no circumstance should this be less than what is achievablein other sectors of the economy. In relation to commodity stabilizationschemes, the suggestion is made in Sanchez-Ugarte and Modi (Chapter11) to streamline the administration of marketing boards in order to re-duce the costs of their operations and to return to producers, over time, allprofits generated in the process of commodity price stabilization.
Sixth, on wealth taxes, Gandhi (Chapter 9) shows that, in the interest ofneutrality and removing distortions in the use of savings, the tax systems ofdeveloping countries should not rely on the highly differentiated and nar-rowly based wealth taxes (such as taxes on income-generating agriculturalland). Nor should they rely on taxes that are levied on productive wealth(financial assets, capital equipment, and the like) if the wealth creationprocess is not to be damaged. Wealth taxes should primarily be directedtoward those elements of wealth that have inelastic supply, such as land, orare for personal use, such as homes, automobiles, and yachts. Taxation oftransfers of wealth, through gifts and bequests, is also justified, ongrounds of intergenerational equity, as are taxes on unproductive wealth,especially holdings of jewelry, precious metals, and land and real estate forspeculative purposes, on grounds of controlling negative externalities.34
34Taxation of unproductive wealth can present certain administrative and complianceproblems.
©International Monetary Fund. Not for Redistribution
36 VED P. GANDHI
Finally, on commodity taxes, though these have not been explicitly ana-lyzed in the papers contained in this volume, a few reform proposals sug-gest themselves in the interest of promoting efficiency and positive supply-side effects and growth.35 Among others, the following need to beparticularly mentioned: (1) Only final consumption goods, and not rawmaterials, intermediate goods, or capital goods, should be taxed to avoidcascading.36 (2) Commodity taxes should not discriminate between alter-native sources of supply for consumption, viz., domestic output and im-ports, through the levy of differential rates of taxation. (Separate taxes canbe imposed on imports if protection for "infant industry" is desired; how-ever, the policymakers must ensure that import taxes are not too high ortoo diverse to begin with and that a timetable has been set for their gradualremoval.) (3) Both consumer goods and consumer services should be taxedto avoid distortions in consumption patterns.37 (4) Commodity taxesshould be levied as close as possible to the retail stage of the production/distribution process to avoid pyramiding. All these can be achievedthrough the adoption of a broad-based retail sales tax or, better still, avalue-added tax of the consumption type preferably at rates which are notunreasonably high or excessively differentiated. (5) Excise duties can justi-fiably be levied on items that have relatively inelastic demand (such as se-lected necessities), or have negative externalities (such as alcohol, tobacco,and gasoline), or are complementary to leisure (such as recreational vehi-cles, ski equipment, and other "luxury" goods).38 Levy of excise duties assubstitutes for "user fees," whenever the latter are administratively diffi-cult, is also justified.39 (6) Exports, which are subject to domestic commod-ity taxes, deserve to receive complete drawback of such taxes. The argu-ments in support of some, though not all, of these reform proposals arediscussed in Gandhi (Chapter 9).
All the above-mentioned tax reform proposals are consistent with the
35Theoretically, from an efficiency point of view, there should be no commodity taxation ifthe income tax rate schedule has been chosen optimally. This is so because, under fairlyreasonable assumptions, the levy of differential commodity taxes is not likely to improve so-cial welfare. However, if for some reason, income tax is not optimal, differential commoditytaxes can be designed to improve welfare.
36Consumption of leisure being nontaxable, allocative efficiency requires that consumptionof goods and services should not be taxed too highly.
37Gandhi (1977).38The basic argument underlying the latter is the nontaxability of leisure itself. An efficient
tax system here is an equity-oriented tax system as well.39For example, if the use of roads by motorists causes wear and tear and road fees cannot be
easily collected, taxation of gasoline can be a good substitute for appropriate road usercharges.
©International Monetary Fund. Not for Redistribution
SUPPLY-SIDE TAX POLICY: A SUMMARY 37
efficiency objective, if not the equity objective; they are also consistent withthe view of basic supply-side tax policy as described at the beginning of thischapter. Quite a few of them could well imply a significant revenue loss inthe short run.40 Gandhi (Chapter 9), therefore, stresses that in the shortrun, supply-side and efficiency-oriented tax reforms must go hand-in-hand with expenditure reforms and reforms of public enterprise pricing ifhigh and unsustainable fiscal deficits and their inflationary consequencesare to be avoided by developing countries. He also points out that the posi-tive results of supply-side tax reforms on growth rates should more realisti-cally be expected in the longer run and then only if such tax reforms are (1)significant and permanent and (2) coupled with very substantial reforms inother macroeconomic policies (such as exchange rates, interest rates, wagerates, and agricultural and other prices). Mackenzie (Chapter 2) estab-lishes the importance of the former, while Ebrill (Chapters 3, 4, and 5),Sanchez-Ugarte (Chapter 10), and Sanchez-Ugarte and Modi (Chapter11) stress the importance of the latter. Finally, given the heterogeneity ofindividual country situations with respect to market conditions and exist-ing tax systems, it is clear from the research that supply-side and effi-ciency-oriented tax reform packages would need to be tailored to the spe-cific needs and circumstances of individual developing countries,including the distributional and stabilization objectives of their govern-ments, if any.
REFERENCES
Bahl, Roy, and others, Tax Reform and Private Sector Growth: Proceedings of aConference Held July 10, 1986, Monograph No. 18 (Syracuse, New York:Metropolitan Studies Program, Maxwell School of Citizenship and PublicAffairs, Syracuse University, February 1987).
Balassa, Bela, and associates, The Structure of Protection in Developing Countries(Baltimore: Johns Hopkins University Press, 1971).
Bartlett, Bruce R., Reaganomics: Supply Side Economics in Action (New York:Quill, updated ed., 1982).
, "Supply-Side Economics: Theory and Evidence," Quarterly Review,National Westminster Bank (London), February 1985, pp. 18-29.
Bechter, Dan M., "Budget Deficits and Supply-Side Economics: A TheoreticalDiscussion," Economic Review, Federal Reserve Bank of Kansas City, Vol. 67(June 1982), pp. 14-27.
40This is likely to be so as existing tax systems of developing countries frequently have (1)double or multiple taxation of the same base; (2) nonindexation of tax bases with respect toinflation; and (3) inefficient taxes such as export duties.
©International Monetary Fund. Not for Redistribution
38 VED P. GANDHI
Bhagwati, Jagdish N., Foreign Trade Regimes and Economic Development:Anatomy and Consequences of Exchange Control Regimes (Cambridge, Mas-sachusetts: Ballinger Publishing Co., 1978).
Blinder, Alan S., "Thoughts on the Laffer Curve," in The Supply-Side Effects ofEconomic Policy, ed. by Laurence H. Meyer (Boston, Massachusetts: Kluwer-Nijhoff, 1981).
Breton, Albert, The Economic Theory of Representative Government (Chicago:Aldine Publishing Co., 1974).
Buchanan, James M., and Dwight R. Lee, "Politics, Time, and the Laffer Curve,"Journal of Political Economy (Chicago), Vol. 90 (August 1982), pp. 816-19.
Buchanan, James M., and Gordon Tullock, The Calculus of Consent: LogicalFoundations of Constitutional Democracy (Ann Arbor, Michigan: Universityof Michigan Press, 1969).
Canto, Victor A., Douglas H. Joines, and Arthur B. Laffer, Foundations ofSupply-Side Economics: Theory and Evidence (New York: Academic Press,1983).
Corden, W.M., Trade Policy and Economic Welfare (Oxford: Clarendon Press,1974).
, "The Costs and Consequences of Protection: A Survey of EmpiricalWork," in International Trade and Finance: Frontiers for Research, ed. byPeter B. Kenen (Cambridge, England: Cambridge University Press, 1975).
Downs, Anthony, An Economic Theory of Democracy (New York: Harper & Row,1957).
Federal Reserve Bank of Atlanta and Emory University Law and Economics Cen-ter, Supply-Side Economics in the 1980s: Conference Proceedings (Westport,Connecticut: Quorum Books, 1982).
Feldstein, Martin, "Supply-Side Economics: Old Truths and New Claims," Amer-ican Economic Review, Papers and Proceedings of the Ninety-Eighth AnnualMeeting of the American Economic Association (Nashville, Tennessee), Vol.76 (May 1986), pp. 26-30.
Ferron, Mark J., "Issues in Excise Taxation," in Fiscal Issues in South-East Asia:Comparative Studies of Selected Economies, ed. by Parthasarathi Shome(Singapore: Oxford University Press, 1986).
Feige, Edgar L., and Robert T. McGee, "Sweden's Laffer Curve: Taxation and theUnobserved Economy," Scandinavian Journal of Economics (Stockholm),Vol. 85, No. 4 (1983), pp. 499-519.
Fink, Richard H., ed., Supply-Side Economics: A Critical Appraisal (Frederick,Maryland: University Publications of America, 1982).
Fullerton, Don, "On the Possibility of an Inverse Relationship Between Tax Ratesand Government Revenues," Journal of Public Economics (Amsterdam), Vol.19 (October 1982), pp. 3-22.
Gandhi, Ved P., "Sales Taxation of Services in Developing Countries" (unpub-lished, International Monetary Fund, December 1, 1977).
Gilder, George, Wealth and Poverty (New York: Basic Books Inc., 1981).
©International Monetary Fund. Not for Redistribution
SUPPLY-SIDE TAX POLICY: A SUMMARY 39
Gillis, Malcolm, "Micro and Macroeconomics of Tax Reform: Indonesia,"Journal of Development Economics (Amsterdam), Vol. 19 (December 1985),pp. 221-54.
Hailstones, Thomas J. (1982a), A Guide to Supply-Side Economics (Richmond,Virginia: Robert F. Dame, Inc., 1982).
(1982b), ed., Viewpoints on Supply-Side Economics (Richmond, Virginia:Robert F. Dame, Inc., 1982).
Hall, Robert E., and Alvin Rabushka, Low Tax, Simple Tax, Flat Tax (New York:McGraw-Hill, 1983).
Hemming, R., and J. A. Kay, "The Laffer Curve," Fiscal Studies (London), Vol. 1(March 1980), pp. 83-90.
Henderson, David, "Limitations of the Laffer Curve as a Justification for TaxCuts," in Supply-Side Economics: A Critical Appraisal, ed. by Richard H.Fink (Frederick, Maryland: University Publications of America, 1982).
India, Ministry of Finance, Department of Economic Affairs, Long Term FiscalPolicy (New Delhi, December 1985).
International Monetary Fund (1985a), Government Finance Statistics Yearbook,1985, Vol. 9 (Washington, 1985).
(1985b), Foreign Private Investment in Developing Countries: A Study bythe Research Department of the International Monetary Fund, OccasionalPaper No. 33 (Washington, January 1985).
Kemp, Jack, "The Classical Economic Case for Cutting Marginal Income TaxRates," in Supply-Side Economics, Hearing Before the Task Force on TaxPolicy of the Committee on the Budget, House of Representatives, 97th Con-gress, 1st Session, March 10, 1981 (Washington: Government Printing Office,1981).
Killick, Tony, ed., The Quest for Economic Stabilisation: The IMF and the ThirdWorld (New York: St. Martin's Press, 1984).
Krueger, Anne O., Foreign Trade Regimes and Economic Development: Liberali-zation Attempts and Consequences (Cambridge, Massachusetts: BallingerPress, 1978).
Laffer, Arthur B., and Jan P. Seymour, eds., The Economics of the Tax Revolt: AReader (New York: Harcourt Brace Jovanovich, 1979).
Lecaillon, Jacques, and others, Income Distribution and Economic Development:An Analytical Survey (Geneva: International Labor Office, 1984).
Malcomson, James M., "Some Analytics of the Laffer Curve," Journal of PublicEconomics (Amsterdam), Vol. 29 (April 1986), pp. 263-79.
Marsden, Keith, "Links Between Taxes and Economic Growth: Some EmpiricalEvidence," World Bank Staff Working Paper No. 605 (Washington, 1983).
Meyer, Laurence H., ed., The Supply-Side Effects of Economic Policy (Boston,Massachusetts: Kluwer-Nijhoff, 1981).
Mirowski, Philip, "What's Wrong With the Laffer Curve?" Journal of EconomicIssues (Sacramento, California), Vol. 16 (September 1982), pp. 815-28.
©International Monetary Fund. Not for Redistribution
40 V E D P. G A N D H I
Modi, Jitendra R., "Levels of Personal Income Taxation in Selected DevelopingCountries" (unpublished, International Monetary Fund, February 1985).
, "Major Features of Corporate Profit Taxes in Selected Developing Coun-tries," Bulletin, International Bureau of Fiscal Documentation (Amsterdam),Vol. 41 (February 1987), pp. 65-74.
Moszer, Max, "A Comment on the Laffer Model," in Supply-Side Economics: ACritical Appraisal, ed. by Richard H. Fink (Frederick, Maryland: UniversityPublications of America, 1982).
Nellor, David C.L., "Natural Resource Tax Policy in Developing Countries" (un-published, International Monetary Fund, March 2, 1984).
Niskanen, William A., Jr., Bureaucracy and Representative Government(Chicago: Aldine-Atherton, 1971).
Palmer, Keith F., "Mineral Taxation Policies in Developing Countries: An Appli-cation of Resource Rent Tax," Staff Papers, International Monetary Fund(Washington), Vol. 27 (September 1980), pp. 517-42.
Raboy, David G., ed., Essays in Supply Side Economics (Washington: Institute forResearch on the Economics of Taxation, 1982).
Richupan, Somchai, "Revenue Significance of the Individual Income Tax in De-veloping Countries" (unpublished, International Monetary Fund, April 22,1985).
Roberts, Paul C , "The Breakdown of the Keynesian Model," in Supply-SideEconomics: A Critical Appraisal, ed. by Richard H. Fink (Frederick, Mary-land: University Publications of America, 1982).
, The Supply-Side Revolution: An Insider's Account of Policy making inWashington (Cambridge, Massachusetts: Harvard University Press, 1984).
Rosen, Harvey S., Public Finance (Homewood, Illinois: Richard D. Irwin, 1985).
Stein, Herbert, Presidential Economics: The Making of Economic Policy fromRoosevelt to Reagan and Beyond (New York: Simon and Schuster, 1984).
Streeten, Paul, "Development Ideas in Historical Perspective," in Albert O.Hirschman and others, Toward a New Strategy for Development: A RothkoChapel Colloquium (New York: Pergamon Press, 1979).
Tobin, James, "Supply-Side Economics: What Is It? Will It Work?" in Viewpointson Supply-Side Economics, ed. by Thomas J. Hailstones (Richmond, Vir-ginia: Robert F. Dame, Inc., 1982).
Todaro, Michael P., Economic Development in the Third World (New York:Longman, 3rd ed., 1985).
Ture, Norman B. (1982a), "Supply Side Analysis and Public Policy," in Essays inSupply Side Economics, ed. by David G. Raboy (Washington: Institute forResearch on the Economics of Taxation, 1982).
(1982b), "The Economic Effects of Tax Changes: A Neoclassical Analy-sis," in Supply-Side Economics: A Critical Appraisal, ed. by Richard H. Fink(Frederick, Maryland: University Publications of America, 1982).
United States, Department of the Treasury, Tax Reform for Fairness, Simplicity,and Economic Growth: The Treasury Department Report to the President,Vols. I—III (Washington: Office of the Secretary, Department of the Treasury,November 1984).
©International Monetary Fund. Not for Redistribution
SUPPLY-SIDE TAX POLICY: A SUMMARY 41
U.S. Congress, House Committee on the Budget, Supply-Side Economics, HearingBefore the Task Force on Tax Policy of the Committee on the Budget, Houseof Representatives, 97th Congress, 1st Session, March 10, 1981 (Washington:Government Printing Office, 1981).
Wanniski, Jude, "Taxes, Revenues, and the 'Laffer Curve,' " The Public Interest,National Affairs, Inc. (New York), Winter 1978, pp. 3-16.
, Statement Before the Task Force on Tax Policy, in Supply-Side Eco-nomics, Hearing Before the Task Force on Tax Policy of the Committee on theBudget, House of Representatives, 97th Congress, 1st Session, March 10,1981 (Washington: Government Printing Office, 1981).
------, The Way the World Works (New York: Simon and Schuster, rev. andupdated ed., 1983).
World Bank, World Development Report, 1980 (New York: Oxford UniversityPress, 1980).
, World Development Report, 1981 (New York: Oxford University Press,1981).
Yoingco, Angel Q., "Tax Reform in the Philippines," in Tax Reform in the Asian-Pacific Countries: Papers Presented at the 4th Asian-Pacific Tax Conference,November 17-18, 1986 (Singapore: Asian-Pacific Tax and Investment Re-search Center, 1986).
©International Monetary Fund. Not for Redistribution

This page intentionally left blank
©International Monetary Fund. Not for Redistribution
PART II
Income Taxes and Growth: Evidence onPopular Supply-Side Tax Policy
©International Monetary Fund. Not for Redistribution

This page intentionally left blank
©International Monetary Fund. Not for Redistribution
A Simple Model of the Effects ofIncome Tax Rate Reductions on
Economic Growth andAggregate Supply
George A. Mackenzie
Both mainstream neoclassical economists and popular supply-side writ-ers have in recent years espoused the view that labor supply, investment,and savings may be a good deal more sensitive to their after-tax rate ofremuneration or return than had previously been supposed. If this is thecase, then a tax reform that reduces appreciably marginal rates of incometaxation may have a substantial impact on the rate of growth of the supplyof labor and the capital stock and hence on the rate of growth of potentialoutput.
The principal aim of this chapter is to illustrate the possible range of thisimpact with the aid of the basic one-sector neoclassical growth model. Theversion of the model presented here includes a tax on income from bothlabor and capital, and can be used to simulate the effect of a reduction inmarginal income tax rates once values are assumed for its parameters.
The limitations inherent in the use of such a rudimentary model need tobe stated at the outset. First, it should be stressed that the neoclassicalmodel of growth presupposes well-functioning markets and flexibility ofproduction techniques. Thus, it cannot be the model of choice for dealingwith such problems as the constraints on growth in developing countriesthat may be created because of a shortage of foreign exchange when pro-duction techniques allow little substitution between domestic labor andcapital and imported capital. Nor would it be appropriate for the analysisof financial repression, because it assumes in effect that the capital stock is
45
©International Monetary Fund. Not for Redistribution
46 GEORGE A. MACKENZIE
directly owned by savers. A further consequence of this is that the decisionto save is also a decision to invest, so that the two cannot be analyzed sepa-rately.
Second, the model incorporates only income taxes. However, revenuesfrom personal income taxes in industrial countries are generally muchhigher than in developing countries both in relation to gross domesticproduct and as a share of total tax revenue. Presumably, this explains whythe great bulk of the literature on the incentive effects of tax regimes and ofchanges in marginal tax rates on labor, savings, and investment decisionspertains to the developed world. Third, a one-sector model cannot be usedto analyze allocational questions such as the effect of different tax regimeson the composition of investment.
Finally, the model cannot be used to analyze the question of how the sizeof the supply response generated by income tax reductions might comparewith the increase in aggregate demand that income tax reductions mightgenerate. This question is examined in the Annex to this chapter.
Despite these limitations, the simple neoclassical model can shed somelight on the possible magnitude of the impact on growth of reductions inmarginal income tax rates and on the conditions under which marginal taxrate reductions could have an appreciable impact. Unless prices and wagesare of no consequence at all in the allocation of resources in developingcountries, changes in income tax rates that alter relative prices should havesome impact on decisions in the labor and capital markets. Moreover, thepersonal income tax is, or may become, an important source of revenue insome middle-income developing countries, and the marginal income taxrate faced by the average taxpayer might conceivably create disincentivesagainst working or saving.
The various experiments with the model illustrate the conditions underwhich reductions in marginal income tax rates are likely to have a substan-tial impact. One basic conclusion is that when other things, and in particu-lar the elasticities of savings and labor supply are held constant, the re-sponse to given proportional reductions in marginal tax rates is greater thehigher the marginal rates of income tax. Another important but more sur-prising conclusion is that when labor and capital are substitutable and themarginal product of labor is high relative to its average, that is, when la-bor's share of output is high, the response of output to a reduction in mar-ginal tax rates is more sensitive to changes in the assumed labor supplyelasticity than to changes in the savings elasticity. In other words, the elas-ticity of savings is by no means the only relevant parameter.
The experiments also underscore the limitations of a policy aimed ataccelerating the rate of growth of aggregate output in developing countriesby reducing marginal income tax rates alone. The conditions under which
©International Monetary Fund. Not for Redistribution
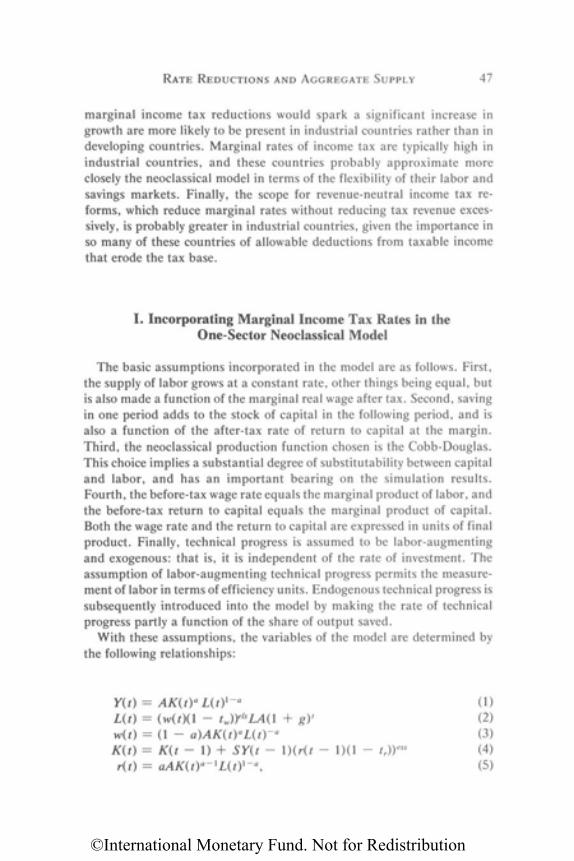
RATE REDUCTIONS AND AGGREGATE SUPPLY 47
marginal income tax reductions would spark a significant increase ingrowth are more likely to be present in industrial countries rather than indeveloping countries. Marginal rates of income tax are typically high inindustrial countries, and these countries probably approximate moreclosely the neoclassical model in terms of the flexibility of their labor andsavings markets. Finally, the scope for revenue-neutral income tax re-forms, which reduce marginal rates without reducing tax revenue exces-sively, is probably greater in industrial countries, given the importance inso many of these countries of allowable deductions from taxable incomethat erode the tax base.
I. Incorporating Marginal Income Tax Rates in theOne-Sector Neoclassical Model
The basic assumptions incorporated in the model are as follows. First,the supply of labor grows at a constant rate, other things being equal, butis also made a function of the marginal real wage after tax. Second, savingin one period adds to the stock of capital in the following period, and isalso a function of the after-tax rate of return to capital at the margin.Third, the neoclassical production function chosen is the Cobb-Douglas.This choice implies a substantial degree of substitutability between capitaland labor, and has an important bearing on the simulation results.Fourth, the before-tax wage rate equals the marginal product of labor, andthe before-tax return to capital equals the marginal product of capital.Both the wage rate and the return to capital are expressed in units of finalproduct. Finally, technical progress is assumed to be labor-augmentingand exogenous: that is, it is independent of the rate of investment. Theassumption of labor-augmenting technical progress permits the measure-ment of labor in terms of efficiency units. Endogenous technical progress issubsequently introduced into the model by making the rate of technicalprogress partly a function of the share of output saved.
With these assumptions, the variables of the model are determined bythe following relationships:
(1)(2)(3)(4)(5)
©International Monetary Fund. Not for Redistribution
48 GEORGE A. MACKENZIE
where
Y(t) = output at time t;K(t) — capital stock at time t;L(t) = labor supply at time t;w(t) = before-tax wage rate at time t;r(t) = before-tax rate of return to capital at time V,els — elasticity of labor supply with respect to after-tax wage;ess = elasticity of savings with respect to after-tax rate of return;
g = rate of increase in "efficiency units" of labor supply;tw = tax on labor income;tr = tax on capital income; andA = constant term.
Equation (1) represents the production function; equation (2) is the sup-ply curve of labor; equation (3) is an inverted demand for labor curve;equation (4) is the savings function; and equation (5) determines the rateof return to capital.
One very important characteristic of the one-sector neoclassical growthmodel when technical progress is exogenous is the constancy of the steady-state rate of growth, which is given by g, the rate of growth of labor mea-sured in efficiency units. This characteristic does not depend on the spe-cific parameters of the production function. It has the well-knownimplication that increases in the savings rate cannot permanently raise therate of growth, although they can raise it above its steady-state rate for asubstantial period of time.
Once initial values for the variables Y, L, and K and for the parametersa, g, tw, and tr are chosen, it is possible to simulate the impact of changesin the two income tax rates.1 The value of a, the share of capital income, isset initially at 0.2, and the value of g, the steady-state rate of growth ofoutput, at 3 percent. The estimates are not derived from an empiricalstudy of any one economy, but they would nonetheless approximate thecharacteristics of a number of industrial economies. It is not necessary toworry over the choice of the steady-state capital output and savings ratios,because, as may be shown, the choice does not affect the simulation.
The scale parameters in equations (2) and (4), LA and S, are madefunctions of els and ess in such a way that the economy remains on itssteady-state growth path when the two taxes are held at their initial valuesregardless of the assumed values for the two elasticities. This assumption
1The choice of initial values for Y, K, and L determines the value of A, the scale parameterin equation (1).
©International Monetary Fund. Not for Redistribution
RATE REDUCTIONS AND AGGREGATE SUPPLY 49
permits a comparison of the effect of changing the income tax rates undera variety of assumptions regarding the elasticity of savings and labor.
II. Assumed Elasticities and Simulation Results
The elasticities of labor and savings were each allowed to range from 0 to1.0. The upper bound of 1.0 substantially exceeds most estimates for theelasticity of aggregate savings and labor supply made for the UnitedStates, where most of the empirical work has been done. Nonetheless, itneeds to be emphasized that there is no firm consensus as to the most likelyvalue for either parameter, and in particular for the elasticity of savings.2
Rosen (1980) summarizes some earlier research on labor supply elastic-ity in two "stylized facts": (1) for prime-age males, the substitution effectof changes in the net wage on hours worked is small and often statisticallyinsignificant and the hours of work are unresponsive to changes in netwages; and (2) the hours of work and the decisions of married women as tolabor force participation are quite sensitive to changes in the net wage,with some elasticity estimates exceeding 1.0. Fullerton (1982) calculated ameasure of aggregate labor supply elasticity of 0.15 based on the estimatesof elasticities for male and female workers in various econometric studies.The study by Hausman (1981) estimated uncompensated supply elastici-ties for secondary female earners of close to 1.
An often-cited study by Boskin (1978) estimated the elasticity of savingswith respect to the expected after-tax interest rate at between 0.2 and 0.4.While this is not the highest estimate ever reported, it is higher than mostprevious studies.3 Boskin's estimate may even understate the elasticity offinancial savings with respect to changes in after-tax rates of interest, be-cause even if an increased rate of return has little effect on total saving, itmay increase the desired rate of accumulation of financial assets at theexpense of real assets (i.e., consumer durables and housing).
The first set of simulations of the model were performed with tw set at 40percent and tr set at 50 percent. The elasticities of labor supply and savingsranged from 0 to 1. A 30 percent reduction in both tax rates—that is, areduction of tw to 28 percent and tr to 35 percent—can generate substan-tial increases in growth in the initial years following the reduction, if the
2A discussion of the problems involved in the econometric estimation of savings elasticitiesmay be found in McLure (1980).
3Evans (1982, pp. 251-52), having surveyed some studies of the interest elasticity of sav-ings, notes that the more circumspect and careful studies favor a small positive interest elas-ticity of aggregate saving—in the United States—but that the issue is far from closed.
©International Monetary Fund. Not for Redistribution
50 GEORGE A. MACKENZIE
labor supply elasticity is sufficiently high, even if the savings elasticity iszero. For example, with a labor supply elasticity of 0.4, the model gener-ates an increase in the average annual rate of growth in the first ten yearsfollowing the tax reductions from its steady-state value of 3 percent to 3.59percent.
However, the initial increase in growth is not greatly affected by the in-crease in the elasticity of saving: for example, when this is 0.4 instead ofzero, the average annual rate of growth in the first ten years following thetax reductions is raised to 3.69.
The initial spurt in growth is not much influenced by the assumed sav-ings elasticity because even if savings—and thus investment—is boostedsubstantially by the income tax reductions, the impact on the total stock ofcapital cannot be very great. This point can be illustrated by a simple nu-merical example. With a savings rate of 9 percent and a capital outputratio of 3, savings and investment are 3 percent of the capital stock. Anincrease in savings of as much as 33 percent adds only 1 percent to thegrowth of the capital stock, and given the assumption that capital's shareis 0.2, this increase in the stock of capital adds just 0.2 percent to output.However, with a labor supply elasticity of 0.4, an increase in the after-taxreal wage at the margin of 10 percent generates an increase in labor supplyof 4 percent—and the increase in labor supply produces an increase in out-put of 3.2 percent.
The initial spurt in growth quickly tapers off, because the response oflabor to its after-tax real wage is immediate and not lagged. Thus, withboth the elasticity of savings and the elasticity of labor equal to 0.4, theaverage annual rate of growth in years 11-20 is 3.09 percent, which is notmuch different from its steady-state value (Table 1).
After the initial spurt in growth is over, growth is fostered by two pro-cesses. First, the initial increase in the supply of labor raises the ratio oflabor to capital, and hence output to capital. With a given savings rate, therate of accumulation of capital is raised and remains above its steady-staterate for some time. Second, if savings are responsive to their after-tax rateof remuneration, the savings rate increases, and this in turn increases therate at which capital accumulates.
Although in the initial impact on growth, the labor supply elasticity isthe more important parameter, in later years the savings elasticity's effectbecomes relatively more important as a result of the processes describedabove. For example, with a labor supply elasticity of 0.4 and a zero elastic-ity of savings, the average annual rate of growth tapers off to 3.03 percentby years 11-20. With a savings elasticity also equal to 0.4, growth is 3.09percent (Table 1).
What the simulations do make clear is that, given the assumptions of
©International Monetary Fund. Not for Redistribution
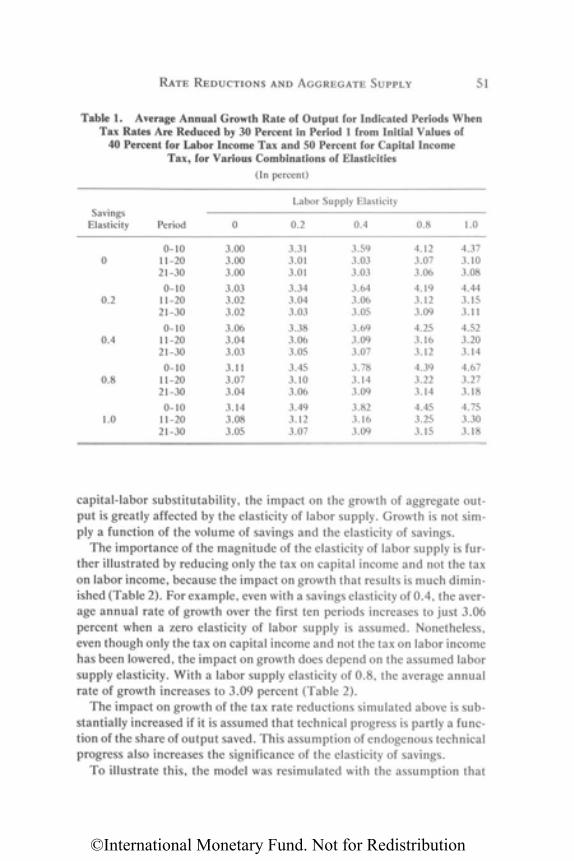
RATE REDUCTIONS AND AGGREGATE SUPPLY 51
Table 1. Average Annual Growth Rate of Output for Indicated Periods WhenTax Rates Are Reduced by 30 Percent in Period 1 from Initial Values of
40 Percent for Labor Income Tax and 50 Percent for Capital IncomeTax, for Various Combinations of Elasticities
(In percent)
SavingsElasticity
0
0.2
0.4
0.8
1.0
Period
0-1011-2021-30
0-1011-2021-30
0-1011-2021-30
0-1011-2021-30
0-1011-2021-30
Labor Supply Elasticity
0
3.003.003.00
3.033.023.02
3.063.043.03
3.113.073.04
3.143.083.05
0.2
3.313.013.01
3.343.043.03
3.383.063.05
3.453.103.06
3.493.123.07
0.4
3.593.033.03
3.643.063.05
3.693.093.07
3.783.143.09
3.823.163.09
0.8
4.123.073.06
4.193.123.09
4.253.163.12
4.393.223.14
4.453.253.15
1.0
4.373.103.08
4.443.153.11
4.523.203.14
4.673.273.18
4.753.303.18
capital-labor substitutability, the impact on the growth of aggregate out-put is greatly affected by the elasticity of labor supply. Growth is not sim-ply a function of the volume of savings and the elasticity of savings.
The importance of the magnitude of the elasticity of labor supply is fur-ther illustrated by reducing only the tax on capital income and not the taxon labor income, because the impact on growth that results is much dimin-ished (Table 2). For example, even with a savings elasticity of 0.4, the aver-age annual rate of growth over the first ten periods increases to just 3.06percent when a zero elasticity of labor supply is assumed. Nonetheless,even though only the tax on capital income and not the tax on labor incomehas been lowered, the impact on growth does depend on the assumed laborsupply elasticity. With a labor supply elasticity of 0.8, the average annualrate of growth increases to 3.09 percent (Table 2).
The impact on growth of the tax rate reductions simulated above is sub-stantially increased if it is assumed that technical progress is partly a func-tion of the share of output saved. This assumption of endogenous technicalprogress also increases the significance of the elasticity of savings.
To illustrate this, the model was resimulated with the assumption that
©International Monetary Fund. Not for Redistribution
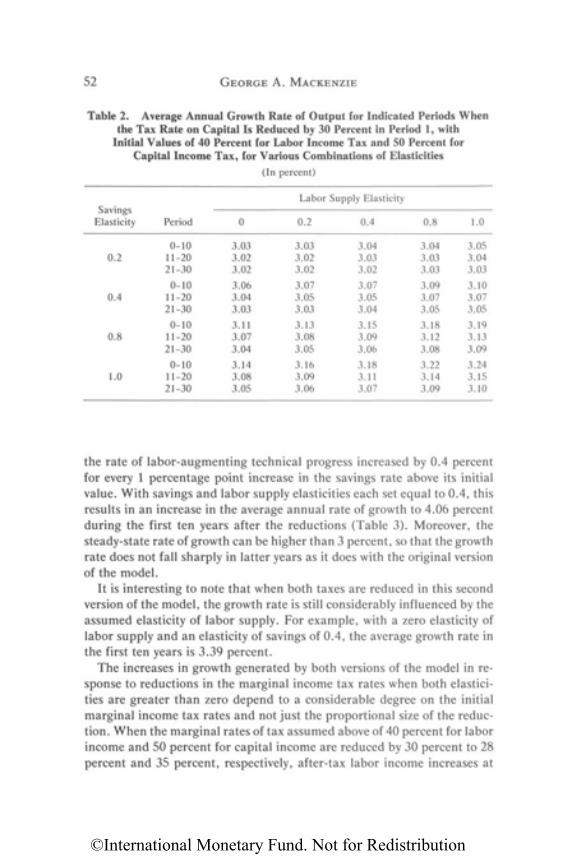
52 GEORGE A. MACKENZIE
Table 2. Average Annual Growth Rate of Output for Indicated Periods Whenthe Tax Rate on Capital Is Reduced by 30 Percent in Period 1, with
Initial Values of 40 Percent for Labor Income Tax and 50 Percent forCapital Income Tax, for Various Combinations of Elasticities
(In percent)
SavingsElasticity
0.2
0.4
0.8
1.0
Period
0-1011-2021-30
0-1011-2021-30
0-1011-2021-30
0-1011-2021-30
Labor Supply Elasticity
0
3.033.023.02
3.063.043.03
3.113.073.04
3.143.083.05
0.2
3.033.023.02
3.073.053.03
3.133.083.05
3.163.093.06
0.4
3.043.033.02
3.073.053.04
3.153.093.06
3.183.113.07
0.8
3.043.033.03
3.093.073.05
3.183.123.08
3.223.143.09
1.0
3.053.043.03
3.103.073.05
3.193.133.09
3.243.153.10
the rate of labor-augmenting technical progress increased by 0.4 percentfor every 1 percentage point increase in the savings rate above its initialvalue. With savings and labor supply elasticities each set equal to 0.4, thisresults in an increase in the average annual rate of growth to 4.06 percentduring the first ten years after the reductions (Table 3). Moreover, thesteady-state rate of growth can be higher than 3 percent, so that the growthrate does not fall sharply in latter years as it does with the original versionof the model.
It is interesting to note that when both taxes are reduced in this secondversion of the model, the growth rate is still considerably influenced by theassumed elasticity of labor supply. For example, with a zero elasticity oflabor supply and an elasticity of savings of 0.4, the average growth rate inthe first ten years is 3.39 percent.
The increases in growth generated by both versions of the model in re-sponse to reductions in the marginal income tax rates when both elastici-ties are greater than zero depend to a considerable degree on the initialmarginal income tax rates and not just the proportional size of the reduc-tion. When the marginal rates of tax assumed above of 40 percent for laborincome and 50 percent for capital income are reduced by 30 percent to 28percent and 35 percent, respectively, after-tax labor income increases at
©International Monetary Fund. Not for Redistribution
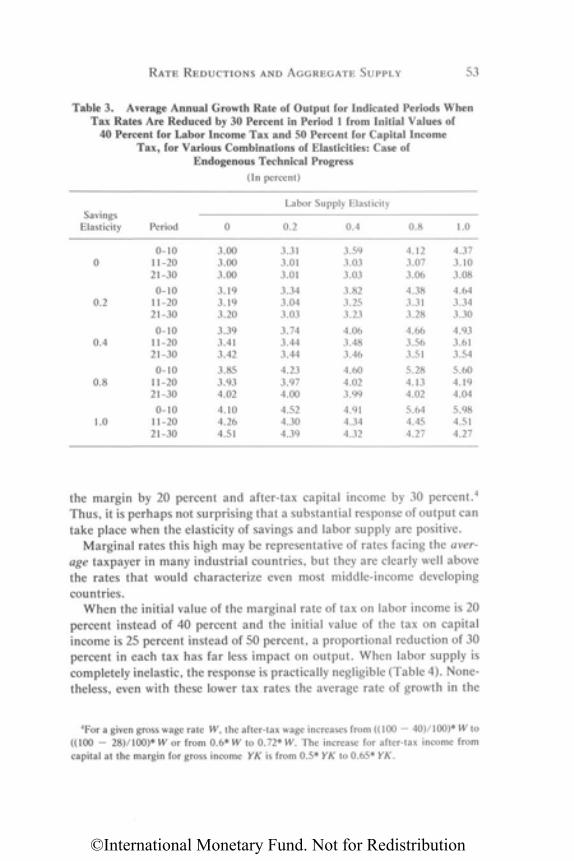
RATE REDUCTIONS AND AGGREGATE SUPPLY 53
Table 3. Average Annual Growth Rate of Output for Indicated Periods WhenTax Rates Are Reduced by 30 Percent in Period 1 from Initial Values of
40 Percent for Labor Income Tax and 50 Percent for Capital IncomeTax, for Various Combinations of Elasticities: Case of
Endogenous Technical Progress(In percent)
SavingsElasticity
0
0.2
0.4
0.8
1.0
Period
0-1011-2021-30
0-1011-2021-30
0-1011-2021-30
0-1011-2021-30
0-1011-2021-30
Labor Supply Elasticity
0
3.003.003.00
3.193.193.20
3.393.413.42
3.853.934.02
4.104.264.51
0.2
3.313.013.01
3.343.043.03
3.743.443.44
4.233.974.00
4.524.304.39
0.4
3.593.033.03
3.823.253.23
4.063.483.46
4.604.023.99
4.914.344.32
0.8
4.123.073.06
4.383.313.28
4.663.563.51
5.284.134.02
5.644.454.27
1.0
4.373.103.08
4.643.343.30
4.933.613.54
5.604.194.04
5.984.514.27
the margin by 20 percent and after-tax capital income by 30 percent.4
Thus, it is perhaps not surprising that a substantial response of output cantake place when the elasticity of savings and labor supply are positive.
Marginal rates this high may be representative of rates facing the aver-age taxpayer in many industrial countries, but they are clearly well abovethe rates that would characterize even most middle-income developingcountries.
When the initial value of the marginal rate of tax on labor income is 20percent instead of 40 percent and the initial value of the tax on capitalincome is 25 percent instead of 50 percent, a proportional reduction of 30percent in each tax has far less impact on output. When labor supply iscompletely inelastic, the response is practically negligible (Table 4). None-theless, even with these lower tax rates the average rate of growth in the
4For a given gross wage rate W, the after-tax wage increases from ((100 - 40)/100)* W to((100 - 28)/100)* W or from 0.6* W to 0.72* W. The increase for after-tax income fromcapital at the margin for gross income YK is from 0.5* YK to 0.65* YK.
©International Monetary Fund. Not for Redistribution
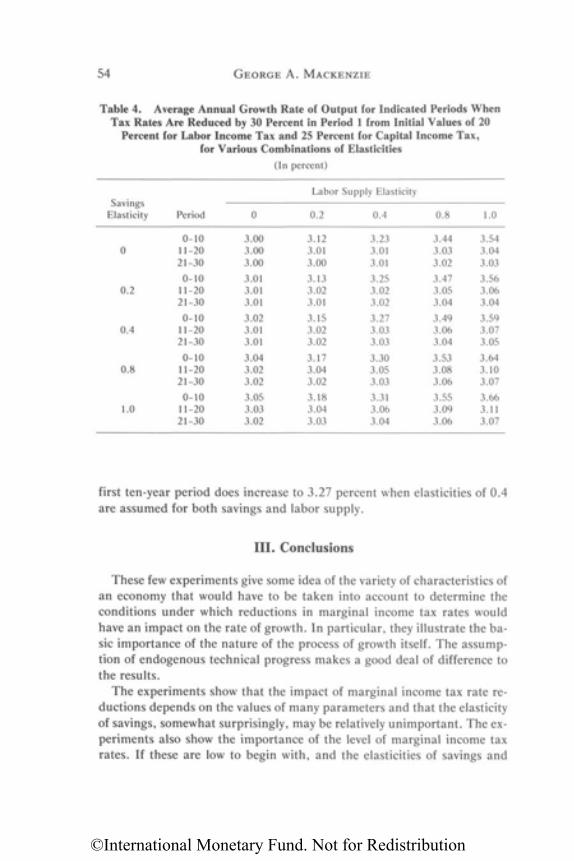
54 GEORGE A. MACKENZIE
Table 4. Average Annual Growth Rate of Output for Indicated Periods WhenTax Rates Are Reduced by 30 Percent in Period 1 from Initial Values of 20
Percent for Labor Income Tax and 25 Percent for Capital Income Tax,for Various Combinations of Elasticities
(In percent)
SavingsElasticity
0
0.2
0.4
0.8
1.0
Period
0-1011-2021-30
0-1011-2021-30
0-1011-2021-30
0-1011-2021-30
0-1011-2021-30
Labor Supply Elasticity
0
3.003.003.00
3.013.013.01
3.023.013.01
3.043.023.02
3.053.033.02
0.2
3.123.013.00
3.133.023.01
3.153.023.02
3.173.043.02
3.183.043.03
0.4
3.233.013.01
3.253.023.02
3.273.033.03
3.303.053.03
3.313.063.04
0.8
3.443.033.02
3.473.053.04
3.493.063.04
3.533.083.06
3.553.093.06
1.0
3.543.043.03
3.563.063.04
3.593.073.05
3.643.103.07
3.663.113.07
first ten-year period does increase to 3.27 percent when elasticities of 0.4are assumed for both savings and labor supply.
III. Conclusions
These few experiments give some idea of the variety of characteristics ofan economy that would have to be taken into account to determine theconditions under which reductions in marginal income tax rates wouldhave an impact on the rate of growth. In particular, they illustrate the ba-sic importance of the nature of the process of growth itself. The assump-tion of endogenous technical progress makes a good deal of difference tothe results.
The experiments show that the impact of marginal income tax rate re-ductions depends on the values of many parameters and that the elasticityof savings, somewhat surprisingly, may be relatively unimportant. The ex-periments also show the importance of the level of marginal income taxrates. If these are low to begin with, and the elasticities of savings and
©International Monetary Fund. Not for Redistribution
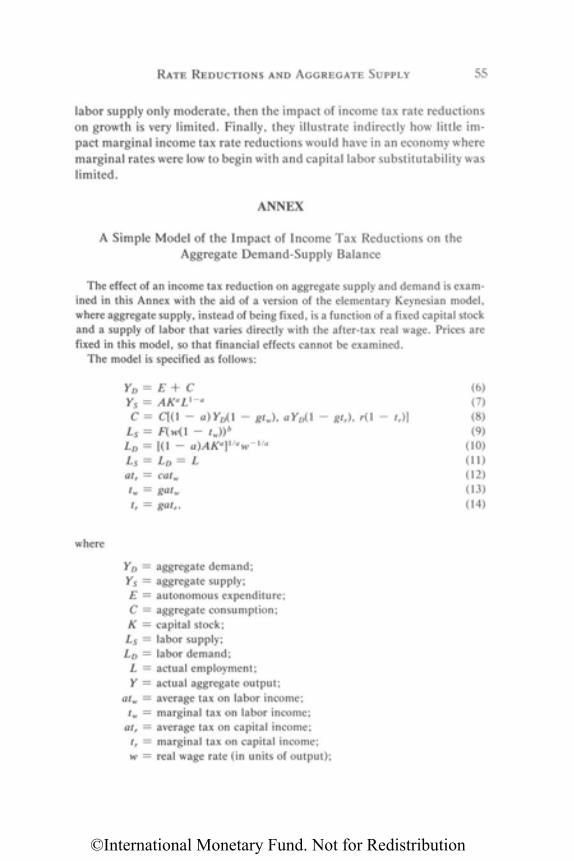
RATE REDUCTIONS AND AGGREGATE SUPPLY 55
labor supply only moderate, then the impact of income tax rate reductionson growth is very limited. Finally, they illustrate indirectly how little im-pact marginal income tax rate reductions would have in an economy wheremarginal rates were low to begin with and capital labor substitutability waslimited.
ANNEX
A Simple Model of the Impact of Income Tax Reductions on theAggregate Demand-Supply Balance
The effect of an income tax reduction on aggregate supply and demand is exam-ined in this Annex with the aid of a version of the elementary Keynesian model,where aggregate supply, instead of being fixed, is a function of a fixed capital stockand a supply of labor that varies directly with the after-tax real wage. Prices arefixed in this model, so that financial effects cannot be examined.
The model is specified as follows:
where
YD = aggregate demand;Ys = aggregate supply;E = autonomous expenditure;C = aggregate consumption;K = capital stock;Ls = labor supply;LD = labor demand;
L = actual employment;Y = actual aggregate output;
atw = average tax on labor income;tw = marginal tax on labor income;
atr = average tax on capital income;tr = marginal tax on capital income;w = real wage rate (in units of output);
(6)(7)(8)(9)
(10)(11)(12)(13)(14)
©International Monetary Fund. Not for Redistribution
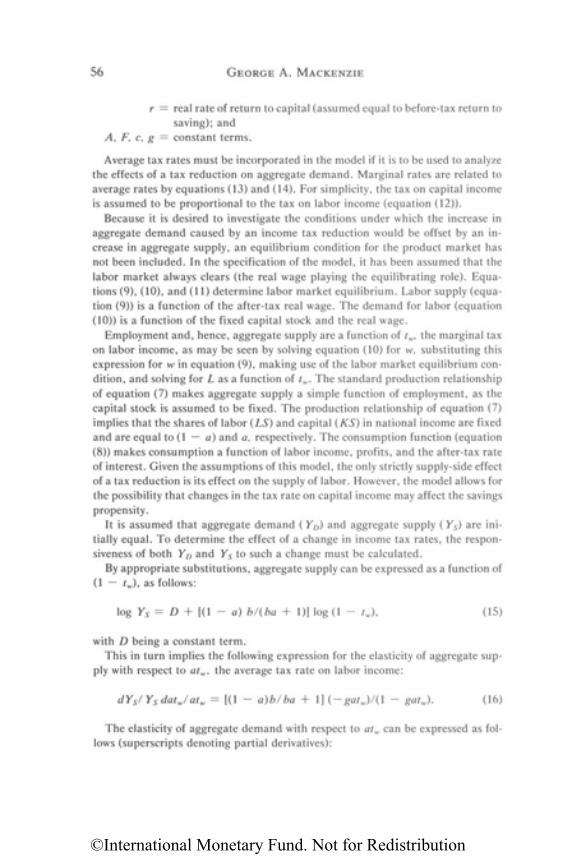
56 G E O R G E A. MACKENZIE
r = real rate of return to capital (assumed equal to before-tax return tosaving); and
A, F, c, g = constant terms.
Average tax rates must be incorporated in the model if it is to be used to analyzethe effects of a tax reduction on aggregate demand. Marginal rates are related toaverage rates by equations (13) and (14). For simplicity, the tax on capital incomeis assumed to be proportional to the tax on labor income (equation (12)).
Because it is desired to investigate the conditions under which the increase inaggregate demand caused by an income tax reduction would be offset by an in-crease in aggregate supply, an equilibrium condition for the product market hasnot been included. In the specification of the model, it has been assumed that thelabor market always clears (the real wage playing the equilibrating role). Equa-tions (9), (10), and (11) determine labor market equilibrium. Labor supply (equa-tion (9)) is a function of the after-tax real wage. The demand for labor (equation(10)) is a function of the fixed capital stock and the real wage.
Employment and, hence, aggregate supply are a function of tw, the marginal taxon labor income, as may be seen by solving equation (10) for w, substituting thisexpression for w in equation (9), making use of the labor market equilibrium con-dition, and solving for L as a function of tw. The standard production relationshipof equation (7) makes aggregate supply a simple function of employment, as thecapital stock is assumed to be fixed. The production relationship of equation (7)implies that the shares of labor (LS) and capital (KS) in national income are fixedand are equal to (1 — a) and a, respectively. The consumption function (equation(8)) makes consumption a function of labor income, profits, and the after-tax rateof interest. Given the assumptions of this model, the only strictly supply-side effectof a tax reduction is its effect on the supply of labor. However, the model allows forthe possibility that changes in the tax rate on capital income may affect the savingspropensity.
It is assumed that aggregate demand (YD) and aggregate supply (Ys) are ini-tially equal. To determine the effect of a change in income tax rates, the respon-siveness of both YD and Ys to such a change must be calculated.
By appropriate substitutions, aggregate supply can be expressed as a function of(1 — tw), as follows:
(15)
with D being a constant term.This in turn implies the following expression for the elasticity of aggregate sup-
ply with respect to atw, the average tax rate on labor income:
(16)
The elasticity of aggregate demand with respect to atw can be expressed as fol-lows (superscripts denoting partial derivatives):
©International Monetary Fund. Not for Redistribution
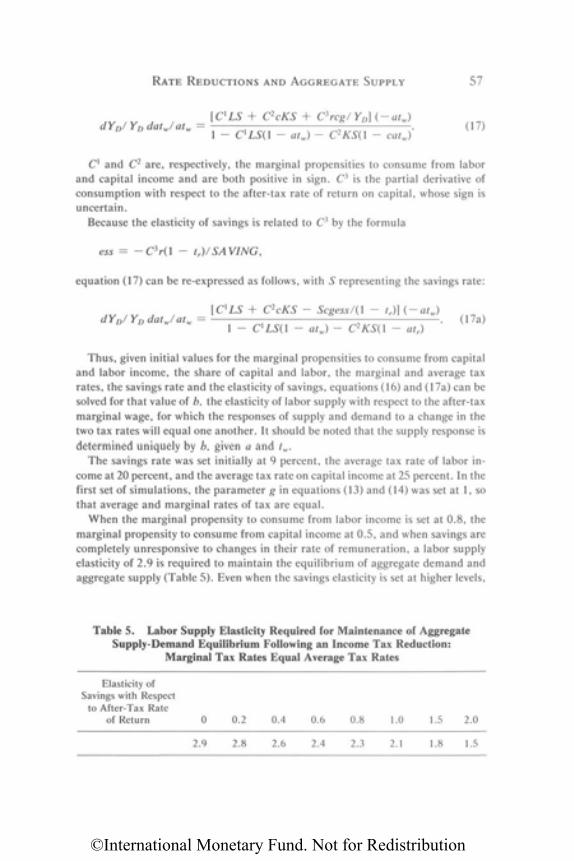
RATE REDUCTIONS AND AGGREGATE SUPPLY 57
(17)
C1 and C2 are, respectively, the marginal propensities to consume from laborand capital income and are both positive in sign. C3 is the partial derivative ofconsumption with respect to the after-tax rate of return on capital, whose sign isuncertain.
Because the elasticity of savings is related to C3 by the formula
ess = - C 3 r ( 1 - tr)/ SAVING,
equation (17) can be re-expressed as follows, with S representing the savings rate:
Thus, given initial values for the marginal propensities to consume from capitaland labor income, the share of capital and labor, the marginal and average taxrates, the savings rate and the elasticity of savings, equations (16) and (17a) can besolved for that value of b, the elasticity of labor supply with respect to the after-taxmarginal wage, for which the responses of supply and demand to a change in thetwo tax rates will equal one another. It should be noted that the supply response isdetermined uniquely by b, given a and tw.
The savings rate was set initially at 9 percent, the average tax rate of labor in-come at 20 percent, and the average tax rate on capital income at 25 percent. In thefirst set of simulations, the parameter g in equations (13) and (14) was set at 1, sothat average and marginal rates of tax are equal.
When the marginal propensity to consume from labor income is set at 0.8, themarginal propensity to consume from capital income at 0.5, and when savings arecompletely unresponsive to changes in their rate of remuneration, a labor supplyelasticity of 2.9 is required to maintain the equilibrium of aggregate demand andaggregate supply (Table 5). Even when the savings elasticity is set at higher levels,
Table 5. Labor Supply Elasticity Required for Maintenance of AggregateSupply-Demand Equilibrium Following an Income Tax Reduction:
Marginal Tax Rates Equal Average Tax Rates
Elasticity ofSavings with Respect
to After-Tax Rateof Return 0
2.9
0.2
2.8
0.4
2.6
0.6
2.4
0.8
2.3
1.0
2.1
1.5
1.8
2.0
1.5
©International Monetary Fund. Not for Redistribution
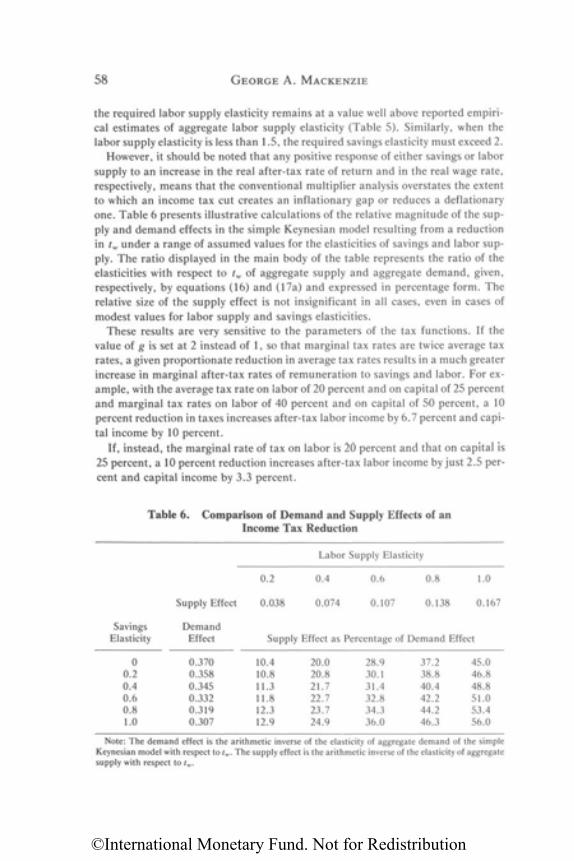
58 G E O R G E A. MACKENZIE
the required labor supply elasticity remains at a value well above reported empiri-cal estimates of aggregate labor supply elasticity (Table 5). Similarly, when thelabor supply elasticity is less than 1.5, the required savings elasticity must exceed 2.
However, it should be noted that any positive response of either savings or laborsupply to an increase in the real after-tax rate of return and in the real wage rate,respectively, means that the conventional multiplier analysis overstates the extentto which an income tax cut creates an inflationary gap or reduces a deflationaryone. Table 6 presents illustrative calculations of the relative magnitude of the sup-ply and demand effects in the simple Keynesian model resulting from a reductionin tw under a range of assumed values for the elasticities of savings and labor sup-ply. The ratio displayed in the main body of the table represents the ratio of theelasticities with respect to tw of aggregate supply and aggregate demand, given,respectively, by equations (16) and (17a) and expressed in percentage form. Therelative size of the supply effect is not insignificant in all cases, even in cases ofmodest values for labor supply and savings elasticities.
These results are very sensitive to the parameters of the tax functions. If thevalue of g is set at 2 instead of 1, so that marginal tax rates are twice average taxrates, a given proportionate reduction in average tax rates results in a much greaterincrease in marginal after-tax rates of remuneration to savings and labor. For ex-ample, with the average tax rate on labor of 20 percent and on capital of 25 percentand marginal tax rates on labor of 40 percent and on capital of 50 percent, a 10percent reduction in taxes increases after-tax labor income by 6.7 percent and capi-tal income by 10 percent.
If, instead, the marginal rate of tax on labor is 20 percent and that on capital is25 percent, a 10 percent reduction increases after-tax labor income by just 2.5 per-cent and capital income by 3.3 percent.
Note: The demand effect is the arithmetic inverse of the elasticity of aggregate demand of the simpleKeynesian model with respect to tw. The supply effect is the arithmetic inverse of the elasticity of aggregatesupply with respect to tw.
Table 6. Comparison of Demand and Supply Effects of anIncome Tax Reduction
Labor Supply Elasticity
0.2 0.4 0.6 0.8 1.0
Supply Effect 0.038 0.074 0.107 0.138 0.167
Savings Demand
Elasticity Effect Supply Effect as Percentage of Demand Effect
0 0.370 10.4 20.0 28.9 37.2 45.00.2 0.358 10.8 20.8 30.1 38.8 46.80.4 0.345 11.3 21.7 31.4 40.4 48.80.6 0.332 11.8 22.7 32.8 42.2 51.00.8 0.319 12.3 23.7 34.3 44.2 53.41.0 0.307 12.9 24.9 36.0 46.3 56.0
©International Monetary Fund. Not for Redistribution
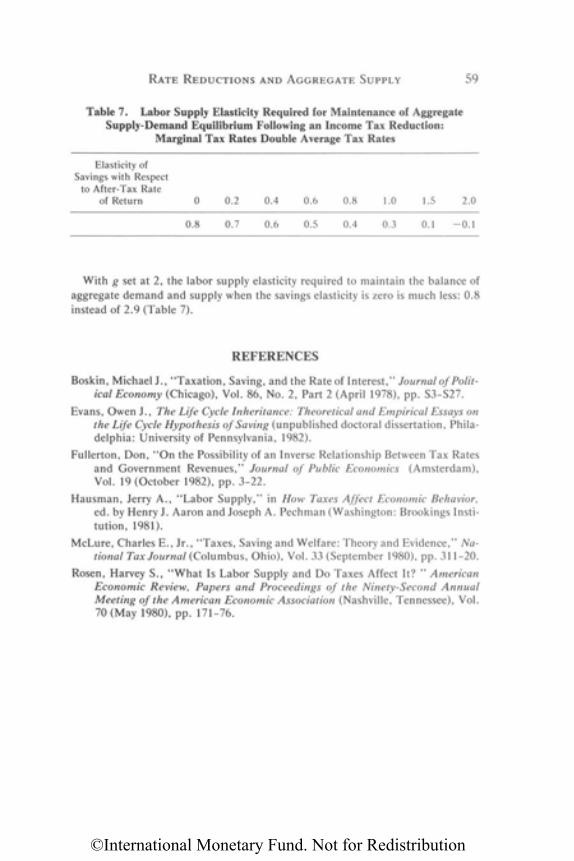
RATE REDUCTIONS AND AGGREGATE SUPPLY 59
Table 7. Labor Supply Elasticity Required for Maintenance of AggregateSupply-Demand Equilibrium Following an Income Tax Reduction:
Marginal Tax Rates Double Average Tax Rates
Elasticity ofSavings with Respect
to After-Tax Rateof Return 0 0.2 0.4 0.6 0.8 1.0 1.5 2.0
0.8 0.7 0.6 0.5 0.4 0.3 0.1 - 0 . 1
With g set at 2, the labor supply elasticity required to maintain the balance ofaggregate demand and supply when the savings elasticity is zero is much less: 0.8instead of 2.9 (Table 7).
REFERENCES
Boskin, Michael J., "Taxation, Saving, and the Rate of Interest," Journal of Polit-ical Economy (Chicago), Vol. 86, No. 2, Part 2 (April 1978), pp. S3-S27.
Evans, Owen J., The Life Cycle Inheritance: Theoretical and Empirical Essays onthe Life Cycle Hypothesis of Saving (unpublished doctoral dissertation, Phila-delphia: University of Pennsylvania, 1982).
Fullerton, Don, "On the Possibility of an Inverse Relationship Between Tax Ratesand Government Revenues," Journal of Public Economics (Amsterdam),Vol. 19 (October 1982), pp. 3-22.
Hausman, Jerry A., "Labor Supply," in How Taxes Affect Economic Behavior,ed. by Henry J. Aaron and Joseph A. Pechman (Washington: Brookings Insti-tution, 1981).
McLure, Charles E., Jr., "Taxes, Saving and Welfare: Theory and Evidence," Na-tional Tax Journal (Columbus, Ohio), Vol. 33 (September 1980), pp. 311-20.
Rosen, Harvey S., "What Is Labor Supply and Do Taxes Affect It? " AmericanEconomic Review, Papers and Proceedings of the Ninety-Second AnnualMeeting of the American Economic Association (Nashville, Tennessee), Vol.70 (May 1980), pp. 171-76.
©International Monetary Fund. Not for Redistribution
Are Labor Supply, Savings, andInvestment Price-Sensitive in
Developing Countries?
A Survey of the Empirical Literature
Liam P. Ebrill
This chapter aims to summarize the available empirical estimates of theimpact of a number of direct tax instruments on labor supply, investment,and savings in developing countries with a view to determining whethersupply-side policies are relevant for such countries. Theoretical contribu-tions are also discussed to the extent that they elucidate the empiricalresults.
Given that the concern is over the applicability of supply-side tax poli-cies to developing countries, some discussion of what is meant by the con-cept "supply-side policy" is appropriate. As the term has come to be usedin the context of developed economies and, in particular, in the context ofthe United States, it has, in general, referred to certain changes in taxpolicy—particularly those pertaining to corporate and personal incometaxes—that are viewed as likely to stimulate domestic savings, investment,and labor supply. It has also come to refer more specifically to the views ofthose who believe that the responses of the various relevant agents to rela-tive price changes are so elastic that tax rates can be reduced without anyloss in tax revenue (see Gandhi (Chapter 1)). It should be noted, however,that the views of these elasticity optimists are not unanimously accepted(Blinder (1981), Hausman (1981)).
Supply-side policies, as they apply to developing countries, must be de-fined more broadly. First, the role of government as an agent for savingsand capital formation is more important in developing countries. How
60
3
©International Monetary Fund. Not for Redistribution
PRICE-SENSITIVITY IN DEVELOPING COUNTRIES 61
should the government perform this role? Second, there is some concernover the implications of changes in tax rates for tax revenue but this con-cern is overshadowed by the belief that the judicious use of tax policies (forexample, tax incentives) will lead to an acceleration in growth rates. Thisemphasis on rates of economic growth immediately suggests that the appli-cability of supply-side concepts depends on income effects in addition torelative price effects. In particular, the availability of adequate savings in adeveloping country will depend not only on the interest elasticity of savingsbehavior but also on the marginal propensity to save.
Third, as noted above, supply-side analysis of developed countries con-centrates on the role of direct taxes, both corporate and personal, on in-come. In developing countries, although these taxes can be of importance,it would be unwise to ignore other commonly used tax instruments. Manydeveloping countries rely heavily on trade taxes both as a source of revenueand as an instrument of protection. Presumably, these taxes also have im-plications for the workings of the labor and capital markets in these coun-tries. Further, even though the broad range of existing taxes offers consid-erable scope for the implementation of tax based supply-side policies, theefficacy of such policies may nonetheless be quite limited. Thus, manyeconomists believe that developing countries suffer from structural prob-lems that cannot be greatly alleviated by tinkering with tax rates.
This survey attempts to accommodate such a broader definition of thesupply-side approach, although it cannot claim, in the space available, toprovide a comprehensive evaluation of the empirical significance of sup-ply-side effects in developing country contexts. It will conclude, however,that while reform of direct tax structures in developing countries in somecases would be useful, it may well be the case that alternative nontax re-form strategies would yield greater efficiency gains.
Before considering specific contributions, a comment on the quality ofmuch of the empirical work is appropriate. The time-series data availablefor developing countries is well known to be deficient. As a result, much ofthe empirical work uses data that typically consist of aggregate macroeco-nomic quantities. Such studies are of limited value, particularly for evalu-ating microeconomic tax reform proposals. Further, the cross-sectionanalyses abstract from the great heterogeneity of the countries selected. Itis a suspect strategy to proceed as if the data sources are observations ona typical country, ignoring the possibility of income-type effects associ-ated with the level of development. Taking tax systems as an example, ithas been shown that cross-country differences can be large and, what ismore important for regression analysis, systematic (Martin and Lewis
©International Monetary Fund. Not for Redistribution
62 LIAM P. EBRILL
(1956), Williamson (1961), Hinrichs (1965), Tanzi (1982, 1987), andAbizadeh and Wyckoff (1982)).1
The implications of tax policy for labor supply, saving, and investmentare discussed in Sections I, II, and III below.
I. Labor Supply
Theoretical Background
When evaluating the implications of tax policy for the labor market, thetraditional approach has been to estimate the elasticity of labor supplywith respect to real wage changes. The view has been that, given the as-sumption that factor taxes are borne where they are levied,2 such an elas-ticity estimate will indicate labor supply responses to tax changes. The ma-jor problem, as perceived by this traditional approach, is that economictheory provides little guidance on the magnitude of the elasticity since theSlutsky equation permits an ambiguous result.3
This view, that all the implications of the taxation of labor supply can beevaluated by considering the elasticity of labor supply with respect to realwage changes, can be challenged on a number of accounts. First, and mostobviously, in most frameworks the incidence of a tax on labor income andthe elasticity of labor supply are directly related. The more elastic the sup-ply of labor, the less the net wage received by labor will change and thegreater will be the effect of the introduction of the tax on other factor and
1It should be noted that, in the case of consumer analysis within a country, the discrepan-cies between cross-section and time-series results are frequently resolved by arguing thatcross-section observations include those who are experiencing transitory income blips (Fried-man (1957), Ando and Modigliani (1963)). Such a device, which permits the assumption of atypical consumer, does not carry over to countries with structural differences.
2As is traditional, unless otherwise stated, it is assumed that whatever revenue is raised isspent in a neutral fashion. There is, therefore, no need to take account of whether there arechanges in net wages, and hence, labor supply effects, because of government expenditures.
3In the absence of taxation, the relevant Slutsky equation is
where L refers to labor supply, w to the wage rate, and M to income; u refers to the fact thatthe first term on the right-hand side is compensated. This is the substitution effect and isknown to be positive. The second term is the income effect. Given that leisure is convention-ally assumed to be normal (aL/aM < 0), the net effect of an increase in the wage rate on aconsumer's labor supply is ambiguous (cf., Atkinson and Stiglitz (1980)). Note that the com-pensated elasticity of labor supply is the relevant quantity to consider when evaluating effi-ciency losses, while the uncompensated elasticity is relevant when evaluating the revenue im-plication of tax changes.
©International Monetary Fund. Not for Redistribution
PRICE-SENSITIVITY IN DEVELOPING COUNTRIES 63
goods markets. Second, as pointed out by Hausman (1983), the simpleSlutsky equation may not apply because of the presence of nonlabor in-come and nonlinear (i.e., nonproportional) tax structures. This has anumber of implications. The existence of nonlabor income makes the na-ture of the tax instruments important. Is it a wage tax or an income tax?Further, the nature of the income effect associated with tax changes be-comes more complicated—indeed, Hausman (1983) suggests that the in-teraction between typical nonproportional tax systems and earnings func-tions produces an income effect over and above the conventional Slutskyterm where this effect may well be the source of the backward-bendinglabor supply curve found in so many empirical studies.
The widespread use of nonproportional tax systems has a further seriousimplication. There is a possibility, particularly if there are positive transferreceipts at low-income levels, that the individual budget set is nonconvex,with the concomitant potential outcome of multiple equilibria. In graphi-cal terms, this means that there is the possibility of a budget line with mul-tiple kinks being tangent to the consumer's indifference curve at more thanone point. Accordingly, in order to predict accurately the impact of taxa-tion on labor supply in those circumstances, one would have to know thetypical individual's entire preference structure (Hausman (1983)).
The above observations refer to all labor supply analyses, irrespective ofwhether they pertain to developed or developing countries. A third chal-lenge to the view that tax policy analysis of the labor market can be re-duced to a simple aggregate elasticity estimate of labor supply is most rele-vant in the case of developing countries. It is contained implicitly in thecomponent of development literature that characterizes rural labor mar-kets as frequently being noncompetitive. Wages are assumed to be institu-tionally set with the resultant outcome of persistent underemployment andunemployment of labor (e.g., Lewis (1954), Ranis and Fei (1961), Sen(1966)). If this framework is accurate, then the incidence of a general taxon labor income may be dramatically altered. Instead of facing an inelasticsupply of labor in the aggregate, where this implies that labor will bear ageneral factor tax levied on its earnings, labor supply to the economy isnow infinitely elastic. The incidence of a wage/income tax then depends onthe institutional mechanisms in place and, in particular, on what happensto the net wage. More important, this nonneoclassical framework suggeststhat the net effect of tax policy will be determined on the demand side. Ifthere remains an excess supply of labor after the tax has been absorbed,then any change that occurs in employment will be because of changes indemand.
Finally, it should be noted that, as far as developing countries are con-cerned, the focus is on the labor supply behavior of urban households, as
©International Monetary Fund. Not for Redistribution
64 LIAM P. EBRILL
rural household incomes are taxed little if at all by means of direct taxessuch as the income tax.
As pointed out at the beginning of this section, it is often assumed thatthe incidence of an income/wage tax is such that it is borne by labor. In theshort run, this may well be an accurate assumption. It is worth noting,however, that, in the very long run, circumstances may be quite different.Indeed, following Feldstein (1974a, 1974b), if one uses a traditional neo-classical growth model to gauge long-run incidence effects, then the criti-cal factor in determining the impact of a tax is whether it affects aggregatesavings by changing the propensity to save. Feldstein shows that, withinthe context of his model for the case of wage tax, the steady-state equilib-rium is completely independent of the extent to which the supply of laborresponds to the net wage. The intuition is clear. In the long run in that typeof model, labor affects output growth through the rate of populationgrowth rather than through the labor participation rate. Accordingly,when assessing the impact of a wage/income tax, account must be taken ofhow the revenue raised is spent—in particular, is aggregate savings, andtherefore the rate of capital formation, unaltered? (Note that the Feldsteinapproach relaxes the assumption that tax revenue is neutrally spent.) Thisimplies that, if the full range of supply-side effects associated with wagetaxes are to be appreciated, it is not enough to consider only the elasticityof labor supply. We will return to this point in Section II where the behav-ior of savings is examined.
The above discussion has also implicitly assumed that the only taxes onlabor income are broad-based wage or income taxes. More specific taxessuch as taxes (subsidies) on the use of a factor in an industry or on the priceof the given output are also possible. In a neoclassical context, these taxeshave general equilibrium effects that occur as a result of differing capitallabor ratios and elasticities of substitution across industries and demandeffects precipitated by alterations in the distribution of income. Such ef-fects make it difficult to analyze the incidence of these taxes, as evidencedby Harberger (1962), Mieszkowski (1969), McLure (1975), and Vanden-dorpe and Friedlaender (1976). In the case of developing countries, theauthors typically have some modified two-sector model in the background.Notable examples of contributions in this area are afforded by Ahluwalia(1973) and Bird (1982). For example, Ahluwalia analyzes the implicationsof tax incentives for employment within the framework of a two-sector sur-plus labor economy. In this context, mention should also be made ofGandhi (1981), who discusses the efficacy of investment incentives for in-creasing employment. It should be noted that these papers focus on thecreation of a demand for labor rather than on the definition of circum-stances in which supply would be forthcoming.
©International Monetary Fund. Not for Redistribution
PRICE-SENSITIVITY IN DEVELOPING COUNTRIES 65
Empirical Evidence: Urban Workers
Unfortunately, even for the case of the aggregate labor supply elasticityof urban workers, the available empirical literature has little to offer.What direct evidence there is suggests that, at least for Africa, the aggre-gate supply curve for labor for the monetized economy as a whole is posi-tively sloped (Berg (1961)). This view is in marked contrast to the earlierpresumption that African labor supply functions were backward sloping.The two views are not contradictory. To elaborate, using data drawn fromthe copper belt of Africa and from Kenya, respectively, Miracle and Fetter(1970) and Miracle (1976) argue that the earlier observations of backward-sloping supply curves are consistent with conventional microeconomic the-ory when account is taken of the costs associated with working at that time.In particular, these two papers document that, in the early part of thetwentieth century, the risk of dying from a disease while at work in anurban area was considerable. It was not surprising, therefore, that the in-come effect associated with an increase in the wage rate tended to outweighthe substitution effect. The more recent findings of a positive labor supplyresponse to increases in wages may then be ascribed at least in part to areduction in the costs associated with urban employment and, in particu-lar, to an improvement in health conditions.
Although the remainder of the empirical literature does not directly pro-vide estimates on the labor supply behavior of urban workers, by docu-menting other aspects of the labor markets of developing countries, it doesprovide some useful indirect evidence.
One component of that literature considers the economics of urbaniza-tion. This component can be further subdivided into studies that examinethe determinants of migration and studies that document the migrant ex-perience in urban locations. Both streams are surveyed by Yap (1977). Theconsensus of this literature is that migration flows do respond to economicincentives in selecting employment locations. To take two recent examples,Schultz (1982), working with Venezuelan data, concluded that the elastic-ity of the migration rate with respect to destination wages ranges from 1.4to 2.9. This result is analogous to that discovered by Fields (1982) for thecase of Colombia.
Migrants appear not only to gain by moving to cities but to do so morerapidly than had been assumed hitherto. For example, in a paper on theexperience of migrants in Brazil, Yap (1976) argues that the evidence in-dicates that migrants are, within a short period of time, indistinguish-able from the urban born as far as income and employment patterns areconcerned.
The contributions on the experiences of migrants are closely related to
©International Monetary Fund. Not for Redistribution
66 LIAM P. EBRILL
studies estimating the earnings functions of urban workers in general. Thepicture that emerges is one of earnings being a function of objective mea-sures such as a skill level (years of schooling) (e.g., House and Rempel(1976)). Further, turning to the earnings functions that have been esti-mated for urban workers in the informal sectors of developing countries'economies, there is growing evidence that these sectors also respond tomarket forces and that, in particular, they offer to the workers they employa higher real income than had generally been believed to be the case(Teilhet-Waldorf and Waldorf (1983)). This observation is of interest in itsown right in that proponents of the Harris-Todaro framework view thissector as affording low living standards, given its presumed role of permit-ting migrants to queue up for employment in the modern sector (Fields(1975)).
The literature on statutory minimum wages also provides some indirectevidence on the behavior of labor supply. Irrespective of the motivation forintroducing a floor to wages (Starr (1981)), the effects of such a floor are ofinterest. In a study of the introduction of a minimum wage in Tanganyikain 1963, Chesworth (1967) noted that employment among the categories ofworkers covered by labor enumeration fell by 14.3 percent between 1962and 1963. Unfortunately, given the potential for disequilibrium in devel-oping country labor markets, it is impossible to discern whether this obser-vation is recording a movement along the demand curve or the supplycurve of labor. There is, however, some additional evidence. As pointedout by Watanabe (1976), minimum wage floors in developing countries arefrequently set at a relatively high level, which leads to widespread cheating.This suggests that, in these countries, there are well-defined demand andsupply schedules for labor.
Empirical Evidence: Rural Workers
Literature examining the behavior of rural labor markets is of interestnot only because of the further insight it provides into the labor supplybehavior of urban workers but also because rural labor may itself be af-fected by taxes such as those on international trade. The relevant literatureis large and varied. For example, in a paper estimating labor supply func-tions in peasant agriculture on the basis of a data set collected from some4,900 rural households, Bardhan (1979a) finds evidence against the exis-tence of the horizontal supply curve of labor predicted by the Lewis frame-work. In particular, he finds, "The wage response of labor supply seems tobe significantly positive for the set of agricultural laborers and small culti-vators, and also for that of women in the usual labor force. The wage re-sponse is not significant for total labor supply for the set of cultivators of
©International Monetary Fund. Not for Redistribution
PRICE-SENSITIVITY IN DEVELOPING COUNTRIES 67
all size groups taken together" (p. 81). The author concludes that laborsupply decisions are determined by factors other than the wage rate, thatis, the labor supply function is wage inelastic. Hansen (1969), working withdata drawn from rural Egypt, concludes that the evidence is consistentwith a competitive framework and that, in particular, there is a strong pos-itive correlation between rural wages and hours worked per day during theyear for males, females, and children. Rosenzweig (1980) also tested theassumption of competitive labor markets using household survey data col-lected in India. He concludes that, "Empirical results based on micro datafrom rural India stratified by sex and landholding status were generallysupportive of the neoclassical framework suggesting that the annual num-ber of [wage days] of employment observed for individuals in rural India ismainly supply rather than demand determined, as implied by competitivemodels" (p. 53). Finally, in a related demonstration of the thesis that ruralwage levels in developing countries are not exogenously determined,Rosenzweig (1978) observed the existence of a negative correlation betweenrural wage levels and a measure of landholding inequality. His data con-sisted of a survey of more than 5,000 households in India.4
Assessment
The above contributions afford some indirect support to those who ar-gue that supply-side considerations have a role in the determination of theequilibrium wage. However, although the empirical work supports the ex-istence of a well-defined aggregate labor supply function, it appears not tobe very elastic. Against this, the evidence does indicate that more elasticresponses can be observed at the disaggregated level. Nonetheless, in viewof the other reservations mentioned above, until some assumptions aremade concerning the aggregate structure of all the taxes on labor income,little can be said about the supply-side implications of tax changes.
It should be further noted that this research does not demonstrate thesuperiority of simple tax-based policies over alternative measures. A dis-tinguishing feature of developing countries is the degree to which theirmarkets appear to be distorted. There is a growing body of literature thatexplicitly addresses these imperfections and accordingly raises alternativepolicy prescriptions. This literature begins with the observation that inter-locking factor markets are observed in many rural communities wherethese may be, at least in part, an economic response to market imperfec-tions. To be more specific, the cost of hiring and supervising labor leads
4Further evidence on the endogeneity of wages can be found in Bardhan (1979b) and Sum-ner(1981).
©International Monetary Fund. Not for Redistribution
68 LIAM P. EBRILL
landowners to seek land-lease contracts. In addition, given that the inten-sity and quality of labor input is difficult to monitor, landowners tend toprefer sharecropping (i.e., risk-sharing) arrangements. Finally, capitalmarkets are not complete in the sense that, because of information costs,many farmers do not have ready access to them. Landlords tend to fill thisgap by providing loans, using the tenancy contract itself as collateral. Thisframework suggests that there are a series of nontax measures whereby thegovernment by its intervention could induce output increases. Examplesare the creation of futures markets and/or commodity price stabilizationprograms.5 This literature is extensively discussed in Bardhan (1980,1983), Newbery and Stiglitz (1981), and Braverman and Stiglitz (1982).
Although nontax policies of this type afford some possibility for outputincreases, they should be viewed as being primarily one-shot efforts. Thatis, they ensure that the existing stock of factors is more efficiently em-ployed but do not affect the long-run rate of growth.6
Even though the gains that would result from removing labor marketdistortions may be primarily static rather than dynamic, this is not to saythat they are necessarily negligible. Some empirical work exists in whichestimates of the welfare gains associated with the removal of distortions arepresented. For example, Harberger (1959) concluded that, for Chile, thetotal cost of both product and factor market distortions was between 9 per-cent and 15 percent of gross national product. Not all studies, however, areas optimistic about the potential welfare gains. In a more recent study inwhich they examine the effect of wage differentials between different in-dustrial sectors in Colombia, Dougherty and Selowsky (1973) concludethat the output effects associated with those differentials are relatively in-significant. The methodology of that paper was to ascribe unexplainedwage variations to distortions where the latter are presumably due to manyfactors. However, as pointed out by de Melo (1977), their approach was apartial equilibrium one in that they held product and factor prices fixed.For his part, reconsidering the case of removing labor market distortionsin Colombia in a general equilibrium context, de Melo (1977) finds thepotential gains to be significant.
We turn now to consider how tax policies affect savings and investment.
5It should be emphasized that the value of these measures lies solely in their increasing theefficiency of the market system. No account is taken of the equity implications either of thesharecropping arrangements or of the government policy measures. As pointed out byBraverman and Stiglitz (1982), interlinking markets can, but need not, increase the utility ofboth landlords and tenants since such arrangements unambiguously shift the utility possibili-ties schedule outward.
6This assertion has to be modified to the extent that devices such as price stabilizationsystems alter savings behavior. For a discussion of these possibilities, see Newbery andStiglitz (1981).
©International Monetary Fund. Not for Redistribution
PRICE-SENSITIVITY IN DEVELOPING COUNTRIES 69
II. Savings Behavior
Theoretical Background
The theoretical microeconomic literature on how savings behavior is af-fected by tax policy has tended to concentrate on the issue of how varioustax instruments affect the net rate of interest. The presumption of much ofthat literature is that, once the incidence of a tax has been determined, allthat remains is to calculate the interest elasticity of savings. In this, therelevant literature parallels that in which the effects of taxes on labor sup-ply are discussed. It is easy to show, within the context of a two-period life-cycle framework, that the impact of a change in interest rates is ambigu-ous, since it depends on a balancing of substitution and wealth effects(Atkinson and Stiglitz (1980)). Some of the ambiguity is removed when it isrecognized that the balanced-budget incidence analysis used in the opti-mal tax framework allows one to concentrate on the compensated ratherthan on the total price elasticity. Ambiguity remains, however, in that,within the two-period life-cycle framework, the elasticities are defined interms of consumption, whereas the compensated elasticity of savings tointerest rate changes is of greater concern to the analysis here. The conclu-sion is that that interest elasticity can take on any sign.7
Some writers question the relevance of the life-cycle framework, eitherbecause it is too limited, or because it represents an inappropriate specifi-cation of consumer preferences. Under the former critique is the work ofKotlikoff and Summers (1981), who argue for the inclusion of a bequestmotive, while, under the latter critique, should be included the work ofthose who favor a myopic consumption function (e.g., Ball and Drake(1964), Clower and Johnson (1968)). Indeed, in the Clower and Johnsonformulation of the myopic consumption function, interest rates do noteven play a direct role in the savings process.
The results of the literature on the myopic consumption function may beparticularly relevant for developing countries. Thus, it is quite possiblethat, in these countries, the precautionary motive for savings is more im-
7Following Feldstein (1978), savings are defined as S = PC, where S designates savings, Cretirement consumption, and P = 1/(1 + r) the "price" of consumption in retirement (r isthe interest rate). In compensated terms this yields
where aC/aP < 0 by assumption. The compensated effect of a change in the rate of interestis, therefore, ambiguous. A compensated increase in r (a decrease in the "price" of futureconsumption) is guaranteed to result in an increase in the demand for retirement consump-tion (C). However, savings might not increase since one does not have to save as much asbefore to ensure a given consumption level.
©International Monetary Fund. Not for Redistribution
70 LIAM P. EBRILL
portant than the life-cycle motive. For example, account must be taken ofthe role of children in providing for the retirement of their parents.8
As pointed out in the introduction, the supply-side perspective as it ap-plies to developing countries should also be concerned with the question ofsavings behavior in countries experiencing growth, that is, how does aggre-gate savings respond to increases in income? A substantial theoretical lit-erature exists on this subject. This literature was the outcome of an at-tempt to reconcile early empirical work undertaken in developed countriesin which it emerged that cross-section data indicated the existence of anonproportional relationship between consumption and income, whiletime-series data suggested that the relationship is proportional. The bestknown reconciliation (the permanent-income hypothesis) of these two ob-servations can be reduced to the argument that the cross-section regres-sions tend to estimate short-run consumption functions, while the time-series regressions estimate the analogous long-run function (Modiglianiand Brumberg (1954), Friedman (1957), and Ando and Modigliani(1963)). From a development perspective, the long-run function is mostrelevant. Should the proportional relation hold for developing countries, itimplies that the income elasticity of savings would be unity—with eco-nomic growth, the share of output devoted to savings would remain con-stant, everything else being held equal.
The above macroeconomic debate took place in the absence of tax con-siderations. When taxes are accommodated in this framework, as they are,for example, in Feldstein (1974a, 1974b), the crucial link is viewed as be-ing how the redistribution of income from the private sector to the govern-ment affects aggregate savings. If the government's marginal propensity tosave exceeds that of the private sector, the net effect of an increase in taxa-tion with a concomitant increase in government expenditures is an increasein capital formation.
Just as in the case of labor-market behavior, there are difficulties in un-critically applying the results of the above literature to developing coun-tries. Indeed, the situation in many developing countries is such that theefficacy of tax-based savings incentives programs may be questioned. Is-sues associated with the mobilization and deployment of domestic savingsare often viewed as being central. Financial institutions may not be welldeveloped (e.g., Miracle, Miracle, and Cohen (1980)). Further, the ex-
8Indeed, Kotlikoff and Spivak (1981) suggest that the current instability of family arrange-ments in the United States may in part be due to the improvement in the completeness of U.S.capital markets where this reduces the need for risk-sharing behavior on the part of thefamily!
©International Monetary Fund. Not for Redistribution
PRICE-SENSITIVITY IN DEVELOPING COUNTRIES 71
change rate and domestic climate may be such as to encourage capitalflight.
Finally, it has often been pointed out (e.g., Galbis (1979b)) that, inmany developing countries, interest rates are often set at artificially lowrates. This has resulted in a large literature in which it is argued that suchan institutional constraint will result in financial repression. Thus, withthe incentive for financial savings being greatly weakened (Galbis (1979a),World Bank (1983)), it is argued that the reduced supply of such savingsrequires the introduction of rationing mechanisms as far as investment isconcerned. The work of Shaw (1973) and McKinnon (1973) is perhaps thebest known. More recent contributions have refined their original work.Spellman (1976) attempts to introduce the role of financial intermediationinto a one-sector growth model; Vogel and Buser (1976) argue that thedegree of financial repression is sensitive to changes in risk as well as tochanges in the mean return to financial investments; van Wijnbergen(1983) examines the implications of relaxing McKinnon's assumption thatthe alternative investment opportunity to financial assets consists of "un-productive assets" by allowing for curb market funds, where these havebeen documented to be of considerable empirical importance (e.g., TunWai (1977)). Finally, Galbis (1981) raises the question that, in a second-best world, it may not be optimal for interest rates to be market deter-mined.9
Empirical Evidence
Much of the empirical development economics literature on savings be-havior has not addressed the issue of the interest elasticity of savings. Dataavailability is a major reason for this. As Mikesell and Zinser (1973) pointout in their survey, data on savings are inaccurate by the very nature oftheir method of calculation, that is, savings figures are frequently obtainedresidually. As a result, it is quite conceivable, for example, that the resultobtained by Krishna and Raychaudhuri (1982) for India of a marginal pro-pensity to save out of permanent income exceeding that out of transitoryincome—an unexpected outcome—is the product of inaccurate data. Fur-ther, given the widespread use of interest rate ceilings, it is not clear whatshould be the appropriate choice of a rate of return variable. As a result ofall of these difficulties, many of the empirical results should be approachedwith great caution. So as to emphasize that the difficulties are genuine, itshould be noted that Williamson (1968) found interest rates to have an
9Special conditions of financial markets in developing countries and their impact on opti-mal taxation of financial savings are highlighted in Ebrill (Chapter 4).
©International Monetary Fund. Not for Redistribution
72 LIAM P. EBRILL
insignificant impact on savings in India, while Gupta (1970), using a dif-ferent data set, found that, for some specifications, they had a significantpositive effect. (Some of the statistical and conceptual difficulties associ-ated with measuring saving (and investment) in India are discussed inGothoskar and Venkatachalam (1979).)
Instead, a large proportion of the available empirical research has beenconcerned more with the macroeconomic issues raised above. Thus, a ma-jor effort has been made to estimate consumption functions for developingcountries. Various hypotheses are tested. In particular, the life-cyclemodel is frequently tested, as is the hypothesis that savings rates increasewith income levels. Many of the early contributions have been exhaustivelysurveyed elsewhere (Mikesell and Zinser (1973), Snyder (1974)). A goodexample of this literature is Landau (1971). Also notable is Leff and Sato(1975), in which a simultaneous equations model of aggregate savings isdeveloped. Other examples of recent additions to this literature are Song(1981) and McDonald (1983). The consensus of this literature is that somerelationship between savings and income does exist and, further, thatsome versions of the life cycle/permanent income hypotheses are appropri-ate. More specifically, McDonald (1983), in his study of savings behaviorin Latin America, found that the income elasticities of consumption were,with a few exceptions, in the range of 0.7 to 1.1. This lends some support tothe hypothesis that the proportionality result of the permanent-incomeframework applies to developing countries. Of course, it also implies that,as countries develop, there is no particular tendency for the savings rate toincrease.
The empirical work also shows that there are other important determi-nants of savings, where these include demographic factors (e.g., depen-dency rates and age distribution (Bilsborrow (1979)), occupation, incomedistribution, life span (Ram and Schultz (1979)), and the urban-rural dis-tinction). Note that to the extent that growth affects these variables, sav-ings rates will change. Further, insofar as income distributions can be al-tered by tax policy (Goode (1961)), that provides a potential lever forgovernment intervention. The policy might prove to be unpalatable, how-ever, to the extent that the government tries to increase aggregate savingsby distributing income from the poor (low propensity to save) to the rich(high propensity to save).
A large number of papers examine the impact of the growth in the gov-ernment sector on aggregate savings. These papers constitute the empiri-cal analogue of Feldstein's (1974a, 1974b) theoretical contributions, al-though it must be emphasized that the concept of government savings isparticularly difficult to pin down. The relevant papers have concentratedon evaluating the "Please effect," where this can take either a strong or a
©International Monetary Fund. Not for Redistribution
PRICE-SENSITIVITY IN DEVELOPING COUNTRIES 73
weak form (Please (1967, 1970)). The strong form maintains that aggre-gate savings will decline with the growth of the share of tax revenues ingross domestic product (GDP), whereas the weak form contends that un-der such circumstances aggregate savings may increase but not by much.Papers in which this and related hypotheses are tested include those byBhatia (1967), Morss (1968), Thimmaiah (1977), and Tahari (1979). Theconsensus of this literature seems to be that the Please effect is not valid.Bhatia concludes that aggregate savings increase quite sharply on the basisof a cross-sectional study of 20 African countries—for every 1 percent in-crease in the tax-GDP ratio, private consumption declined by 0.21 percentof GDP, while public consumption increased by 0.05 percent of GDP.Morss, using data drawn from a cross-section of 46 developing countries,felt confident in rejecting the Please effect. Tahari reached a similar con-clusion. Thimmaiah, using time-series data from India, could not rejectthe weak form of the Please effect. On the other hand, Landau (1971) didfind evidence to support the Please effect in the case of Latin Americancountries.
There is also an important body of literature that attempts to evaluatethe empirical significance of the financial repression which is presumed tobe an inevitable outcome of institutionally setting interest rates at artifi-cially low rates. The consensus is that financial repression does exist andcan be a severe drag on economic development. For example, in a paper bythe Research Department of the Fund (International Monetary Fund(1983)), the authors concluded that there is good prima facie evidence tosupport the assertion that countries with positive real rates of interest expe-rience a higher rate of growth than that enjoyed by countries in which thereal rate of interest is negative. Fry (1980a) finds that savings are affectedpositively by the real deposit rate of interest. He argues that his estimatesof savings and growth functions are such as to allow him to conclude thatthe cost of financial repression is around one half of a percentage point ingrowth forgone for every percentage point by which the real rate falls belowthe equilibrium rate. In another paper, Fry (1978) finds further evidence ofthe importance of financial repression. He concludes that the specifictransmission mechanism proposed by Shaw (1973) appears to fit the factsbetter than that proposed by McKinnon (1973). In particular, McKin-non's twin assumptions to the effect that investments are lumpy and en-tirely self-financed which, taken together, imply that potential investorsmust accumulate money balances prior to investing, leads to the testablehypothesis that money and physical capital are complements. This hypoth-esis is not sustained by the data. Shaw's alternative approach, which as-sumes that investors are not constrained to self-finance because of theemergence of noninstitutional markets in response to financial repression,
©International Monetary Fund. Not for Redistribution
74 LIAM P. EBRILL
does receive support. Other papers, in which it is argued that financialrepression can be important, are Chandavarkar (1971) and Vogel andBuser (1976). Also noteworthy are two papers by Fry (1980b) and Leff andSato (1980), in which it is pointed out that artificially low interest ratesaffect not only long-term growth rates but also short-term macroeconomicadjustment processes.
All of the above suggests that, even though aggregate savings may not bevery interest-sensitive, the allocation of that aggregate between conven-tional financial assets and alternatives such as curb market funds andworks of art is indeed responsive to economic incentives.10 Presumably,this responsiveness extends to the behavior of asset holders as they deter-mine their portfolio allocations within the category of conventional finan-cial assets. There is, unfortunately, little empirical work addressing thisissue. An exception is a paper by Burkner (1982), in which he concludes onthe basis of financial data collected for the Philippines, that investors inthe Philippines react to relative changes in rates of return just as theircounterparts do in developed countries.
Assessment
To the extent that the empirical literature on savings behavior addressesthe concerns of supply-side economists, it does it best in its evaluation ofthe financial repression hypotheses of Shaw and McKinnon. While the em-pirical work in this area demonstrates that savings may be sensitive tochanges in interest rates and, therefore, are also sensitive to changes in taxpolicy, it also raises the issue of whether savings-based tax incentives repre-sent the most effective reform route for countries to pursue. Specifically,the distortion to savings decisions implied by the existence of financial re-pression may be far larger than that associated with the fact that interestincome is subject to income tax.11 To place the relative magnitudes of thesedistortions in some context, consider that, for Ghana during the late1970s, official market interest rates on savings deposits rarely exceeded10 percent, while the rate of inflation was frequently in the neighborhoodof 100 percent.
As for the remainder of the empirical literature, most of it is concernedwith macroeconomic aggregates rather than supply-side issues. In particu-
10In this context, note that the alternatives include placing savings overseas. This alterna-tive emphasizes the important role of confidence in the determination of savings allocationdecisions.
11This issue is treated in greater depth in the next chapter. That chapter also discussessome of the factors that should be taken into account when trying to determine how to usetaxes so as to enhance the return to financial savings.
©International Monetary Fund. Not for Redistribution
PRICE-SENSITIVITY IN DEVELOPING COUNTRIES 75
lar, inadequate attention has been devoted to the question of whether ag-gregate savings, as opposed to its components, is affected by the type of taxstructure. Is a consumption-based tax preferable to an income-based tax,for example, as argued by Due (1976)? This is an important issue since itraises the possibility that the substantial reliance of developing countrieson broad-based consumption taxes may have been conducive to savings.As an aside on this, it is interesting to note that Tahari (1979) has found onthe basis of his cross-section work that (private) savings behavior appearsto be stimulated more by direct than indirect taxation! While theoreticallypossible, too much store should not be placed on this somewhat surprisingconclusion given the heterogeneous nature of the countries in his sampleand the aggregative nature of his regression results. Besides, the net effectof government's actions on aggregate savings depends on the manner ofdisposition of the tax revenues.
As is well known, aggregate savings do not necessarily equal gross in-vestment for any single country. Thus, for a given country, investments canbe made by domestic or foreign investors. Further, since this survey is con-cerned with results that have implications for supply-side policies, the term"investment" is interpreted here in a restricted sense as referring to thoseincrements in the stock of a nation's capital which result in increases inmarket output. Investment in works of art and so on are accordingly ex-cluded. Given this potential difference between savings and investmentand given that there exists a wide range of specifically targeted tax instru-ments, for example, those aimed at manufacturing and tourism invest-ment, we turn now to consider investment behavior as a separate topic.
III. Investment Behavior
Theoretical Background
The theory of how investment behavior responds to changes in tax policyhas been heavily influenced by the neoclassical framework established byJorgenson (1963). The most important conclusions of the literature can befound in Hall and Jorgenson (1971), Stiglitz (1973), King (1975), Flem-ming (1976), Atkinson and Stiglitz (1980), and King and Fullerton (1984).For our purposes, it is important to note the observation that attempting togauge the impact of tax policy on the cost of capital (and, therefore, on therate of investment) by concentrating on the corporate tax rate is mislead-ing. In many countries, the corporate tax structure interacts with the per-sonal tax system (for example, through the tax treatment of dividends andcapital gains) and, further, the specific provisions of the corporate tax are
©International Monetary Fund. Not for Redistribution
76 LIAM P. EBRILL
of critical importance.12 On the latter point, the corporate tax will not af-fect the cost of capital if companies are allowed to make deductions againsttheir tax liabilities that accurately reflect the contribution of capital to theproduction process. For example, in the context of the U.S. tax system,there are two approaches to ensuring that the tax system would be neutralwith respect to the cost of capital. First, if the corporation uses debt fi-nance on the margin and if debt interest is deductible and depreciationallowances accurately measure the value of the capital used up (a difficultquantity to measure in an inflationary environment), then increases in thecorporate tax rate will leave the cost of capital unaffected. The alternativeapproach, easier to implement administratively, would disallow interestdeductions and replace depreciation allowances with expensing.13 The twoapproaches are equivalent in present value terms.14
The above literature refers to the effects of taxes in a world without risk.There is, however, an additional body of work that relaxes this constraintand allows for the existence of risk. The emphasis has been on the role ofthe government as a risk-sharer through its tax instruments. The questionof interest has been whether taxation encourages more or less risk taking.The answer depends on factors such as the degree of investor risk aversionand the extent of loss-offset provisions (cf., Atkinson and Stiglitz (1980)).It should be noted, with respect to the latter, that the present value of loss-offset provisions are of greatest relevance—the fact that many countriespermit full loss-offset for an indefinite period in nominal terms does nottake account of the cost associated with the postponement of the taxbenefits.
When one turns to consider that part of the theoretical literature con-cerned with developing country issues, one finds that it differs from thepapers cited above in a number of important respects. First, given the vari-ety of developing country experiences, it is more concerned with the multi-tude of direct tax structures in existence (cf., Lent (1967), Usher (1977)).Many of these tax structures employ devices not commonly used in devel-
l2Moreover, as emphasized by King and Fullerton (1984), within a country, capital incometaxes can be quite variable in their treatment of different transactions.
l3It might be worth noting that this alternative approach is also automatically inflation-proof.
14It must be recognized that, in practice, the two systems may not be equivalent. Thus, forexample, start-up companies will not in general have the profits against which they can de-duct their investment expenditures. While it is true that these companies can be compensatedby allowing them to carry their expensing allowances forward, for equivalence to be main-tained, these carry-forward provisions would have to be indexed for inflation and the real rateof return.
©International Monetary Fund. Not for Redistribution
PRICE-SENSITIVITY IN DEVELOPING COUNTRIES 77
oped countries. For example, Agell (1983) shows how tax holidays can beaccommodated with the neoclassical cost of capital model.
Second, there is a belief that the neoclassical model may not apply readi-ly to developing countries. Capital markets are imperfect. Therefore, fi-nancial policy and, in particular, policies concerning dividend/retainedearnings behavior, are no longer irrelevant to aggregate investment behav-ior. More important, the structure of a country's system of financial inter-mediation can be significant. Thus, as pointed out in the previous section,the fact that interest rates are maintained at an artificially low level insome countries could well lead to financial disintermediation with theresult that the demand for investment funds must be met by rationing.This manifestation of financial repression raises the possibility that invest-ment may increase with interest rates as a result of an increase in availablesavings.
Third, and related to the possibility that financial repression may implythat investment behavior is quantity-constrained rather than price-con-strained, is the argument that the growth performance of some countries(where this is influenced by their investment efforts) may be limited by theavailability of foreign exchange. This possibility, commonly referred to asthe two-gap hypothesis, is discussed by McKinnon (1964) among others.
Fourth, recognition of the fact that aggregate investment consists of anumber of components in addition to private domestic investment hasstimulated research. Attention has been devoted to the determinants offoreign direct investment and foreign aid. To what do these capital flowsrespond? It is clear, for example, that if a complete explanation of howtaxes affect private foreign investment flows is to be determined, the inter-actions of differing national tax systems must be taken into account. Forexample, Hartman (1981a) considers how U.S. foreign direct investmentmight be influenced by U.S. tax policies. An important element of the cur-rent U.S. tax structure is that income from foreign sources is liable to taxa-tion only on repatriation, which implies that firms should finance foreigninvestment out of foreign earnings to the greatest extent possible. Work inthis area is still at an early stage.15
Fifth, at this macroeconomic level, there has been concern over the de-gree of complementarity or substitutability between the components of ag-gregate investment. In particular, are capital inflows a substitute for do-mestic saving and investment? Thus, Chenery and Strout (1966) viewed allcapital inflows as net addition to a developing country's capital stock,
l5In particular, the interaction between national tax systems can be expected to have inter-esting side effects. For example, foreign capital may not be attracted by reductions in a devel-oping country's marginal tax rates due to tax treaties, tax sparing, etc.
©International Monetary Fund. Not for Redistribution
78 LIAM P. EBRILL
whereas Weisskopf (1972b) viewed such inflows as being a substitute fordomestic savings. Papanek (1972) argued for an intermediate position.There has also been concern over the impact of public investment on pri-vate investment.
Finally, as mentioned in the introduction, investment behavior can beinfluenced by taxes and distortions other than direct income-based taxes.Notable among these other instruments are trade taxes or marketingboards and agricultural price support systems. While these devices may beintroduced for a number of reasons (e.g., with a view to levying an opti-mum export tax whereby a country exploits its market power in world mar-kets (Corden (1974), Sanchez-Ugarte and Modi (Chapter 11)), they canfrequently have unintended effects, particularly at the level of individualindustries.
Empirical Evidence
The available empirical work reflects the bias mentioned above againstthe neoclassical framework. For example, Bilsborrow (1977) tests an eclec-tic theory of investment behavior that allows for variables representing theinternal financial structure of the firm. He finds, using data drawn fromColombia, that accelerator effects, cash flow effects, balance sheet riskvariables, and, most notably, the availability of foreign exchange were im-portant determinants of investment flows. However, the rate of return toinvestors can still be an important determinant of investment behavior. Inher study of the inflationary process in India, Ahluwalia (1979) found thatthe interest elasticity of private investment exceeded 2, which would sug-gest that a tax policy aimed at altering the rate of return could be stimula-tive. In contrast to this result, the papers cited earlier, in which the finan-cial repression hypotheses are evaluated, find—almost as a corollary to theexistence of artificially low interest rates—that investment is quantity-con-strained by rationing. For example, Fry (1978) finds for his sample ofcountries that an increase in the real rate of interest has a positive effect ongrowth. Related to this is the work of Thirlwall (1974), who discovered, forhis global sample of countries, that inflation exercises a positive influenceon investment, but on further examination found that, if the sample islimited to developing countries, this influence is negative. If the role of theinflation variable for the case of developing countries is interpreted as itsbeing a proxy for the degree of financial repression, then the sign of theeffect is understandable. (This result is similar to one reported in Ebrill(Chapter 5).) It should be noted that, to the extent that these effects areimportant, they reduce the effectiveness of tax incentive programs forinvestment.
©International Monetary Fund. Not for Redistribution
PRICE-SENSITIVITY IN DEVELOPING COUNTRIES 79
More neoclassical in nature is the example of Lim (1983). He concen-trates on the specifics of the investment incentive programs in peninsulaMalaysia, calling attention, in particular, to the role of generous tax holi-days that tend to be awarded on an indiscriminate basis. He finds thatthere is some evidence of investor reactions to these incentives—there issome tendency for both capital intensity and utilization rates to increase.
The empirical literature evaluating the two-gap hypothesis, that is, theargument that growth prospects are often constrained by the availability offoreign exchange, is inconclusive. Weisskopf (1972a) and Blomqvist(1976) cast some doubt on this argument. On the other hand, for the caseof Sudan, Wynn (1980) finds some evidence to support it. All authorsagree, however, that testing the hypothesis is particularly difficult since,given the accounting identity between the excess of imports over exportsand the corresponding excess of savings over investment, it is not easy toidentify ex post the true constraint on a country's development.
There is little empirical work on the determinants of foreign investmentflows. Hartman (1981b) finds that U.S. aggregate foreign direct invest-ment does, in fact, respond to changes in tax policy. In particular, it isinfluenced negatively and quite strongly by the after-tax rate of return todomestic investment. As further evidence of the sensitivity of foreign in-vestment flows to economic variables, Hartman (1982) shows that foreigninvestment flows into the United States respond to changes in U.S. taxpolicy. However, when one considers the experience of developing coun-tries, there are fewer grounds for optimism over the ability of tax policies toattract investment flows. Lim (1983) finds in his work on a cross-section of27 developing countries that the presence of natural resources and aproven record of economic performance were far more important than fis-cal incentives in attracting such flows. Although they do not consider theimpact of tax incentives per se, Root and Ahmed (1979) corroborate Lim'sresults for nonextractive industries in that they find that those countriesthat have attracted the most foreign investment have substantial urbaniza-tion, relatively advanced infrastructures, and so on.16
The issue of whether capital inflows are a substitute for domestic savingsand investment has been examined empirically by Papanek (1973), Stone-man (1975), and Gupta and Islam (1983), among others. Given their care-ful empirical methodology, Gupta and Islam's (1983) work would appearto be the most interesting. They find, after decomposing aggregate capitalinflows, that foreign aid had a more negative impact on savings than for-
16As an aside, it is worth noting that the other component of foreign capital flows, men-tioned above, namely, foreign aid, to the extent that is increasingly being associated withstructural adjustment, is responsive to changes in tax policy.
©International Monetary Fund. Not for Redistribution
80 LIAM P. EBRILL
eign investment, although these effects never appeared to be very large. Ina related paper looking at the other side of this issue, Feldstein andHorioka (1980) show that, for the developed countries, international dif-ferences in savings rates correspond to almost equal differences in domes-tic investment rates, again suggesting, as do Gupta and Islam (1983) in thecontext of developing countries, that domestic savings are the most impor-tant determinant of domestic investment.
Sundararajan and Thakur (1980), using data collected on India and Ko-rea, test a modified neoclassical framework to see the impact of publicinvestment on private investment. Simulations show that, in India, in-creases in public investment initially lead to substantial crowding out ofprivate investment with a weak reversal of this tendency occurring in sub-sequent periods. In Korea, in marked contrast, there is evidence of astrong complementarity between public and private investment. Tun Waiand Wong (1982), using data drawn from a number of countries, foundevidence of financial crowding out in some countries (Malaysia and Mex-ico). Further, on the subject of financial structure, they find that, in thecase of Korea, retained earnings play a less important role than creditavailability in determining investment flows, that is, again the financialstructure is important.
The allocation effects of various trade taxes, notably export taxes, andprice support systems have been extensively evaluated in the literature.The thrust of the work has been to estimate the relevant supply elasticitiesfor the commodities whose prices are affected, thereby providing addi-tional insight into the degree to which investment changes in response tochanges in incentives.
Most of the papers are concerned with agricultural commodities. Booth(1980), in her consideration of the role of export taxes in member countriesof the Association of South East Asian Nations, points out that Thailand'sexport tax on rice, levied at a fairly high rate in the 1970s, has led manyproducers to shift out of rice production. While the resultant productiondistortion is a cost to the economy, it does indicate that Thai farmers re-spond to economic circumstances.17 Further evidence of the sensitivity ofagricultural interests to government intervention can be found in Tolley,Thomas, and Wong (1982). They cite, for example, the fact that Korea
l7As an aside, it should be noted that, even though the export tax distorts Thailand's pro-duction, there could be a net benefit to the economy. Thailand has market power in the worldrice market and the net effect of the export tax with its concomitant reduction in the supply ofrice is for Thailand to get a higher price for its rice exports than previously (cf., Tolley,Thomas, and Wong (1982)).
©International Monetary Fund. Not for Redistribution
PRICE-SENSITIVITY IN DEVELOPING COUNTRIES 81
attained self-sufficiency in rice production during the 1970s, a period inwhich the Government's farm purchase price increased by more than70 percent in real terms. (They argue that a supply elasticity of 0.3 is ap-propriate for this case.) Finally, mention should be made of Tanzi (1976),who shows that the export tax levied by Haiti on its coffee exports has had amajor negative impact on production.
Intervention in agricultural markets need not take as explicit a form as aprice support. Marketing boards, which sell a country's product at a dif-ferent (usually higher) price than that which it pays to domestic suppliers,are indirectly performing the role of an export tax. In his discussion of thecase of the Cocoa Marketing Board in Ghana, Leith (1974) cites evidencewhich suggests that the short-run supply elasticities for cocoa are of theorder of 0.15 to 0.20, while the corresponding long-run elasticities rangefrom 0.71 to 1.0.
The above results draw on a large body of research in which agriculturalsupply response to price changes in general is evaluated. Much of this liter-ature, a good example of which is Dowling and Jessadachatr (1979), is sur-veyed in Askari and Cummings (1977). The short-run and long-run supplyelasticities (the latter are particularly important for perennials) of previousresearchers are tabulated. The authors comment that there is an enormousrange of elasticity estimates where, disturbingly, this range occurs not onlyacross commodities but also within commodities. It is also notable that themajority of the long-run elasticity estimates cited are less than unity. Thisimplies that substantial price incentives are needed to stimulate increasesin output.
Assessment
All of the above implies that investors do react to economic incentivesand that, therefore, a tax-based policy of incentives could have some roleto play. However, the empirical results above also suggest that investmentis influenced by a number of factors. These run the range from the exis-tence of capital market imperfections due to financial repression as evi-denced by the role of liquidity effects to the existence of other distortionssuch as those associated with price support systems and marketing boards.The fact that Askari and Cummings (1977) reported such a broad range ofsupply elasticities may be due not to the vagaries of the econometric tech-niques employed but rather to the differing circumstances that farmers indifferent countries experience. For example, is the market for inputs freeor regulated? If regulated, the observed supply elasticity might be lower.
©International Monetary Fund. Not for Redistribution
82 LIAM P. EBRILL
IV. Conclusions
Although the empirical literature examining the impact of tax policy onlabor supply, savings, and investment leaves much to be desired, it none-theless appears that changes in tax policies will have some effects. Thebehavior of these aggregates appears, however, to be determined as muchby other elements such as the sophistication of financial intermediariesand the completeness of capital markets as by these tax policies. Given theexistence of widespread market failure in many developing countries,the impact of changes in tax policies may be quite difficult to predict as thecosts associated with such changes are potentially large. This is not to denythat there may be circumstances in which most would agree on what wouldconstitute useful tax reforms. The reduction of large export taxes comes tomind in this respect (see Sanchez-Ugarte and Modi (Chapter 11)). How-ever, it may be the case that a more promising supply-side approach mightbe one that also aims at alleviating the most obvious sources of marketfailure. This fact seems to have been appreciated by researchers who exam-ine the economics of sharecropping structures and interlinked factormarkets.
REFERENCES
Abizadeh, Sohrab, and J.P. Wyckoff, "Tax System Components and EconomicDevelopment: An International Perspective," Bulletin, International Bureauof Fiscal Documentation (Amsterdam), Vol. 36 (November 1982), pp.483-91.
Agell, Jonas, "Subsidy to Capital Through Tax Incentives in the ASEAN Coun-tries: An Application of the Cost of Capital Approach Under Inflationary Sit-uations," Singapore Economic Review (Singapore), Vol. 28 (October 1983),pp. 98-128.
Ahluwalia, I.J., Behaviour of Prices and Outputs in India: A Macro-EconometricApproach (New Delhi: Macmillan, 1979).
Ahluwalia, Montek S., "Taxes, Subsidies, and Employment," Quarterly Journalof Economics (Cambridge, Massachusetts), Vol. 87 (August 1973), pp.393-409.
Ando, Albert, and Franco Modigliani, "The 'Life-Cycle' Hypothesis of Saving: Ag-gregate Implications and Tests," American Economic Review (Nashville,Tennessee), Vol. 53 (March 1963), pp. 55-84.
Askari, Hossein, and John Thomas Cummings, "Estimating Agricultural SupplyResponse with the Nerlove Model: A Survey," International Economic Review(Osaka, Japan), Vol. 18 (June 1977), pp. 257-92.
Atkinson, Anthony B., and Joseph E. Stiglitz, Lectures on Public Economics (NewYork: McGraw-Hill, 1980).
©International Monetary Fund. Not for Redistribution
PRICE-SENSITIVITY IN D E V E L O P I N G COUNTRIES 83
Ball, R.J., and Pamela S. Drake, "The Relationship Between Aggregate Con-sumption and Wealth," International Economic Review (Osaka, Japan), Vol.5 (January 1964), pp. 63-81.
Bardhan, Pranab K. (1979a), "Labor Supply Functions in a Poor Agrarian Econ-omy," American Economic Review (Nashville, Tennessee), Vol. 69 (March1979), pp. 73-83.
(1979b), "Wages and Unemployment in a Poor Agrarian Economy: A The-oretical and Empirical Analysis," Journal of Political Economy (Chicago),Vol. 87 (June 1979), pp. 479-500.
, "Interlocking Factor Markets and Agrarian Development: A Review ofIssues," Oxford Economic Papers (New Series), Vol. 32 (March 1980), pp.82-98.
, "Labor-Tying in a Poor Agrarian Economy: A Theoretical and EmpiricalAnalysis," Quarterly Journal of Economics (Cambridge, Massachusetts),Vol. 98 (August 1983), pp. 501-14.
Berg, Elliot J., "Backward-Sloping Labor Supply Functions in Dual Economies—The Africa Case," Quarterly Journal of Economics (Cambridge, Massachu-setts), Vol. 75 (August 1961), pp. 468-92.
Bhatia, Rattan J., "A Note on Consumption, Income, and Taxes" (unpublished,International Monetary Fund, November 2, 1967).
Bilsborrow, Richard E., "The Determinants of Fixed Investment by Manufactur-ing Firms in a Developing Country," International Economic Review (Osaka,Japan), Vol. 18 (October 1977), pp. 697-717.
, "Age Distribution and Savings Rates in Less Developed Countries," Eco-nomic Development and Cultural Change (Chicago), Vol. 28 (October 1979),pp. 23-45.
Bird, Richard M., "Taxation and Employment in Developing Countries," Finan-zarchiv (Tubingen), Vol. 40, No. 2 (1982), pp. 211-39.
Blinder, Alan S., "Thoughts on the Laffer Curve," in The Supply-Side Effects ofEconomic Policy, ed. by Laurence H. Meyer (Boston, Massachusetts: Kluwer-Nijhoff, 1981).
Blomqvist, A. G., "Empirical Evidence on the Two-Gap Hypothesis: A RevisedAnalysis," Journal of Development Economics (Amsterdam), Vol. 3 (July1976), pp. 181-93.
Booth, Anne, "The Economic Impact of Export Taxes in ASEAN," Malayan Eco-nomic Review (Singapore), Vol. 25 (April 1980), pp. 36-61.
Braverman, Avishay, and Joseph E. Stiglitz, "Sharecropping and the Interlinkingof Agrarian Markets," American Economic Review (Nashville, Tennessee),Vol. 72 (September 1982), pp. 695-715.
Burkner, Hans-Paul, "The Portfolio Behaviour of Individual Investors in Develop-ing Countries: An Analysis of the Philippine Case," Oxford Bulletin of Eco-nomics and Statistics, Vol. 44 (February 1982), pp. 127-44.
Chandavarkar, Anand G., "Some Aspects of Interest Rate Policies in Less Devel-oped Economies: The Experience of Selected Asian Countries," Staff Papers,International Monetary Fund (Washington), Vol. 18 (March 1971), pp.48-112.
©International Monetary Fund. Not for Redistribution
84 LIAM P. EBRILL
Chenery, Hollis B., and Alan M. Strout, "Foreign Assistance and Economic De-velopment," American Economic Review (Nashville, Tennessee), Vol. 56(September 1966), pp. 679-733.
Chesworth, D., "Statutory Minimum Wage Fixing in Tanganyika," InternationalLabor Review (Geneva), Vol. 96 (July 1967), pp. 43-66.
Clower, Robert W., and M. Bruce Johnson, "Income, Wealth, and the Theory ofConsumption," in Value, Capital, and Growth: Papers in Honour of Sir JohnHicks, ed. by J.N. Wolfe (Edinburgh: Edinburgh University Press; Chicago:Aldine Publishing Co., 1968).
Corden, W.M., Trade Policy and Economic Welfare (Oxford: Clarendon Press,1974).
de Melo, Jaime A.P., "Distortions in the Factor Market: Some General Equilib-rium Estimates," Review of Economics and Statistics (Cambridge, Massa-chusetts), Vol. 59 (November 1977), pp. 398-405.
Dougherty, Christopher, and Marcelo Selowsky, "Measuring the Effects of theMisallocation of Labour," Review of Economics and Statistics (Cambridge,Massachusetts), Vol. 55 (August 1973), pp. 386-90.
Dowling, J.M., and Phitsanes Jessadachatr, "The Supply Response of Sugar Canein Thailand," Malayan Economic Review (Singapore), Vol. 24 (October1979), pp. 74-88.
Due, John F., "Value-Added Taxation in Developing Economies," in Taxationand Development, ed. by Nian-Tzu Wang (New York: Praeger, 1976).
Feldstein, Martin S. (1974a), "Incidence of a Capital Income Tax in a GrowingEconomy with Variable Savings Rates," Review of Economic Studies (Edin-burgh), Vol. 41 (October 1974), pp. 505-13.
(1974b), "Tax Incidence in a Growing Economy with Variable Factor Sup-ply," Quarterly Journal of Economics (Cambridge, Massachusetts), Vol. 88(November 1974), pp. 551-73.
, "The Welfare Cost of Capital Income Taxation," Journal of PoliticalEconomy (Chicago), Vol. 86, No. 2, Part 2 (April 1978), pp. S29-S51.
, and C. Horioka, "Domestic Saving and International Capital Flows,"Economic Journal (London), Vol. 90 (June 1980), pp. 314-29.
Fields, Gary S., "Rural-Urban Migration, Urban Unemployment and Underem-ployment, and Job-Search Activity in LDCs," Journal of Development Eco-nomics (Amsterdam), Vol. 2 (June 1975), pp. 165-87.
, "Place-to-Place Migration in Colombia," Economic Development andCultural Change (Chicago), Vol. 30 (April 1982), pp. 539-58.
Flemming, J.S., "A Reappraisal of the Corporation Income Tax," Journal of Pub-lic Economics (Amsterdam), Vol. 6 (July-August 1976), pp. 163-69.
Friedman, M., A Theory of the Consumption Function (Princeton: Princeton Uni-versity Press, 1957).
Fry, Maxwell J., "Money and Capital or Financial Deepening in Economic Devel-opment?" Journal of Money, Credit and Banking (Columbus, Ohio), Vol. 10(November 1978), pp. 464-75.
©International Monetary Fund. Not for Redistribution
PRICE-SENSITIVITY IN D E V E L O P I N G COUNTRIES 85
(1980a), "Saving, Investment, Growth and the Cost of Financial Repres-sion," World Development (Oxford), Vol. 8 (April 1980), pp. 317-27.
(1980b), "Money, Interest, Inflation and Growth," Journal of MonetaryEconomics (Amsterdam), Vol. 6 (October 1980), pp. 535-45.
Galbis, Vicente (1979a), "Money, Investment, and Growth in Latin America,1961-1973," Economic Development and Cultural Change (Chicago), Vol. 27(April 1979), pp. 423-43.
(1979b), "Inflation and Interest Rate Policies in Latin America, 1967-76,"Staff Papers, International Monetary Fund (Washington), Vol. 26 (June1979), pp. 334-66.
, "Interest Rate Management: The Latin America Experience," Savingsand Development (Milan), Vol. 5, No. 1 (1981), pp. 5-44.
Gandhi, Ved P., "Unemployment in Developing Countries: Can Tax IncentivesHelp?" (unpublished, International Monetary Fund, February 3, 1981).
Goode, Richard, "Taxation of Saving and Consumption in Underdeveloped Coun-tries," National Tax Journal (Columbus, Ohio), Vol. 14 (December 1961),pp. 305-22.
Gothoskar, S.P., and T.R. Venkatachalam, "Household Saving and Investment inIndia," Margin (New Delhi), Vol. 12, No. 1 (October 1979), pp. 28-40.
Gupta, K.L., "Personal Saving in Developing Nations: Further Evidence," Eco-nomic Record (Melbourne), Vol. 46 (June 1970), pp. 243-49.
, and M. Anisul Islam, Foreign Capital, Savings, and Growth: An Interna-tional Cross-Section Study (Dordrecht, Netherlands; Boston, Massachusetts:Reidel Publishing Company, 1983).
Hall, R.E., and D.W. Jorgenson, "Application of the Theory of Optimum CapitalAccumulation," in Tax Incentives and Capital Spending, ed. by Gary Fromm(Washington: Brookings Institution, 1971).
Hansen, Bent, "Employment and Wages in Rural Egypt," American EconomicReview (Nashville, Tennessee), Vol. 59 (June 1969), pp. 298-313.
Harberger, Arnold C., "Using the Resources at Hand More Effectively," Ameri-can Economic Review, Papers and Proceedings of the Seventy-First AnnualMeeting of the American Economic Association (Nashville, Tennessee), Vol.49 (May 1959), pp. 134-46.
, "The Incidence of the Corporation Income Tax," Journal of PoliticalEconomy (Chicago), Vol. 70 (June 1962), pp. 215-40.
Hartman, David G. (1981a), "Tax Policy and Foreign Direct Investment," NBERWorking Paper No. 689 (Cambridge, Massachusetts: National Bureau of Eco-nomic Research, 1981).
(1981b), "Domestic Tax Policy and Foreign Investment: Some Evidence,"NBER Working Paper No. 784 (Cambridge, Massachusetts: National Bureauof Economic Research, 1981).
, "Tax Policy and Foreign Direct Investment in the United States," NBERWorking Paper No. 967 (Cambridge, Massachusetts: National Bureau of Eco-nomic Research, 1982).
©International Monetary Fund. Not for Redistribution
86 LIAM P. EBRILL
Hausman, Jerry A., "Income and Payroll Tax Policy and Labor Supply," in TheSupply-Side Effects of Economic Policy, ed. by Laurence H. Meyer (Boston,Massachusetts: Kluwer-Nijhoff, 1981).
, "Taxes and Labor Supply," NBER Working Paper No. 1102 (Cambridge,Massachusetts: National Bureau of Economic Research, 1983).
Hinrichs, H.H., "Determinants of Government Revenue Shares Among Less-De-veloped Countries," Economic Journal (London), Vol. 75 (September 1965),pp. 546-56.
House, William J., and Henry Rempel, "The Determinants of and Changes in theStructure of Wages and Employment in the Manufacturing Sector of theKenyan Economy, 1967-1972," Journal of Development Economics (Amster-dam), Vol. 3 (March 1976), pp. 83-98.
International Monetary Fund, Interest Rate Policies in Developing Countries: AStudy by the Research Department of the International Monetary Fund, Oc-casional Paper No. 22 (Washington, October 1983).
Jorgenson, Dale W., "Capital Theory and Investment Behavior," American Eco-nomic Review, Papers and Proceedings of the Seventy-Fifth Annual Meetingof the American Economic Association (Nashville, Tennessee), Vol. 53 (May1963), pp. 247-59.
King, Mervyn A., "Taxation, Corporate Financial Policy, and the Cost of Capital:A Comment," Journal of Public Economics (Amsterdam), Vol. 4 (August1975), pp. 271-79.
,and Don Fullerton, eds., The Taxation of Income from Capital: A Compar-ative Study in the United States, the United Kingdom, Sweden, and WestGermany (Chicago: University of Chicago Press, 1984).
Kotlikoff, Laurence J., and Avia Spivak, "The Family as an Incomplete AnnuitiesMarket," Journal of Political Economy (Chicago), Vol. 89 (April 1981), pp.372-91.
Kotlikoff, Laurence J., and Lawrence H. Summers, "The Role of Intergenera-tional Transfers in Aggregate Capital Accumulation," Journal of PoliticalEconomy (Chicago), Vol. 89 (August 1981), pp. 706-32.
Krishna, Raj, and G.S. Raychaudhuri, "Trends in Rural Savings and Capital For-mation in India, 1950-1951 to 1973-1974," Economic Development and Cul-tural Change (Chicago), Vol. 30 (January 1982), pp. 271-98.
Landau, Luis, "Saving Functions for Latin America," in Studies in DevelopmentPlanning, ed. by Hollis B. Chenery (Cambridge, Massachusetts: HarvardUniversity Press, 1971).
Leff, Nathaniel, "Macroeconomic Adjustment in Developing Countries: Instabil-ity, Short-Run Growth, and External Dependency," Review of Economicsand Statistics (Cambridge, Massachusetts), Vol. 62 (May 1980), pp. 170-79.
, and Kazuo Sato, "A Simultaneous-Equations Model of Savings in Devel-oping Countries," Journal of Political Economy (Chicago), Vol. 83 (Decem-ber 1975), pp. 1217-28.
Leith, J. Clark, Foreign Trade Regimes and Economic Development: Ghana (NewYork: National Bureau of Economic Research, 1974).
©International Monetary Fund. Not for Redistribution
PRICE-SENSITIVITY IN D E V E L O P I N G COUNTRIES 87
Lent, George E., "Tax Incentives for Investment in Developing Countries," StaffPapers, International Monetary Fund (Washington), Vol. 14 (July 1967), pp.249-323.
Lewis, W. Arthur, "Economic Development with Unlimited Supplies of Labour,"Manchester School of Economic and Social Studies, Vol. 22 (May 1954), pp.139-91.
Lim, David, "Fiscal Incentives and Direct Foreign Investment in Less DevelopedCountries," Journal of Development Studies (London), Vol. 19 (January1983), pp. 207-12.
, "Tax Incentives and Resource Utilization in Peninsular Malaysian Manu-facturing," in Further Readings on Malaysian Economic Development, ed.by David Lim (Kuala Lumpur: Oxford University Press, 1983).
Martin, Alison M., and W.A. Lewis, "Patterns of Public Revenue and Expendi-ture," Manchester School of Economic and Social Studies, Vol. 24 (Septem-ber 1956), pp. 203-44.
McDonald, D., "The Determinants of Saving Behavior in Latin America" (unpub-lished, International Monetary Fund, April 13, 1983).
McKinnon, Ronald I., "Foreign Exchange Constraints in Economic Developmentand Efficient Aid Allocation," Economic Journal (London), Vol. 74 (June1964), pp. 388-409.
, Money and Capital in Economic Development (Washington: BrookingsInstitution, 1973).
McLure, C.E., Jr., "General Equilibrium Incidence Analysis: The HarbergerModel After Ten Years," Journal of Public Economics (Amsterdam), Vol. 4(February 1975), pp. 125-61.
Mieszkowski, Peter, "Tax Incidence Theory: The Effects of Taxes on the Distribu-tion of Income," Journal of Economic Literature (Nashville, Tennessee), Vol.7 (December 1969), pp. 1103-24.
Mikesell, Raymond F., and James E. Zinser, "The Nature of the Savings Functionin Developing Countries: A Survey of the Theoretical and Empirical Litera-ture," Journal of Economic Literature (Nashville, Tennessee), Vol. 11 (March1973), pp. 1-26.
Miracle, Marvin P., "Interpretation of Backward-sloping Labor Supply Curves inAfrica," Economic Development and Cultural Change (Chicago), Vol. 24(January 1976), pp. 399-406.
, and Bruce Fetter, "Backward-sloping Labor-Supply Functions and Afri-can Economic Behavior," Economic Development and Cultural Change (Chi-cago), Vol. 18 (January 1970), pp. 240-51.
Miracle, Marvin P., Diane S. Miracle, and Laurie Cohen, "Informal Savings Mo-bilization in Africa," Economic Development and Cultural Change (Chi-cago), Vol. 28 (July 1980), pp. 701-24.
Modigliani, Franco, and Richard Brumberg, "Utility Analysis and the Consump-tion Function: An Interpretation of Cross-Section Data," in Post KeynesianEconomics, ed. by Kenneth K. Kurihara (New Brunswick, New Jersey:Rutgers University Press, 1954).
©International Monetary Fund. Not for Redistribution
88 LIAM P. EBRILL
Morss, Elliott R . , "Fiscal Policy, Savings, and Economic Growth in DevelopingCountries: A n Empirical Study" (unpublished, International Monetary Fund,July 17, 1968).
Newbery, David M . G . and Joseph E . Stiglitz, The Theory of Commodity PriceStabilization: A Study in the Economics of Risk (Oxford: Clarendon Press;New York: Oxford University Press, 1981).
Papanek, Gustav F. , "The Effects of Aid and Other Resource Transfers on Savingsand Growth in Less Developed Countries," Economic Journal (London), Vol.82 (September 1972), pp. 934-50.
_____, "Aid, Foreign Private Investment, Savings, and Growth in Less DevelopedCountries," Journal of Political Economy (Chicago), Vol. 81 (January/Febru-ary 1973), pp. 120-30.
Please, S., "Saving Through Taxation—Reality or Mirage?" Finance & Develop-ment (Washington), Vol. 4 (March 1967), pp. 24-32.
_____, "The 'Please Effect' Revisited," International Bank for Reconstructionand Development (World Bank), Working Paper No . 82 (July 1970).
R a m , Rati, and Theodore W . Schultz, "Life Span, Health, Savings, and Produc-tivity," Economic Development and Cultural Change (Chicago), Vol. 27(April 1979), pp. 399-421.
Ranis, Gustav, and John C . H . Fei, " A Theory of Economic Development," Amer-ican Economic Review (Nashville, Tennessee), Vol. 51 (September 1961), pp.533-65.
Root, Franklin R . , and A h m e d A . A h m e d , "Empirical Determinants of Manufac-turing Direct Foreign Investment in Developing Countries," Economic Devel-opment and Cultural Change (Chicago), Vol. 27 (July 1979), pp. 751-67.
Rosenzweig, Mark R . , "Rural Wages, Labor Supply, and Land Reform: A Theo-retical and Empirical Analysis," American Economic Review (Nashville, Ten-nessee), Vol. 68 (December 1978), pp. 847-61.
_____, "Neoclassical Theory and the Optimizing Peasant—An EconometricAnalysis of Market Family Labor Supply in a Developing Country," Quar-terly Journal of Economics (Cambridge, Massachusetts), Vol. 94 (February1980), pp. 31-56.
Schultz, T . Paul, "Lifetime Migration Within Educational Strata in Venezuela:Estimates of a Logistic Model," Economic Development and Cultural Change(Chicago), Vol. 30 (April 1982), pp. 559-93.
Sen, Amartya K . , "Peasants and Dualism with or without Surplus Labor," Jour-nal of Political Economy (Chicago), Vol. 74 (October 1966), pp. 425-50.
Shaw, Edward S., Financial Deepening in Economic Development (New York:Oxford University Press, 1973).
Snyder, Donald W . , "Econometric Studies of Household Saving Behaviour in De-veloping Countries: A Survey," Journal of Development Studies (London),Vol. 10 (January 1974), pp. 139-53.
Song, Byung-Nak, "Empirical Research on Consumption Behavior: Evidencefrom Rich and Poor L D C s , " Economic Development and Cultural Change(Chicago), Vol. 29 (April 1981), pp. 597-611.
©International Monetary Fund. Not for Redistribution
PRICE-SENSITIVITY IN DEVELOPING COUNTRIES 89
Spellman, Lewis J., "Economic Growth and Financial Intermediation," in Moneyand Finance in Economic Growth and Development: Essays in Honor of Ed-ward S. Shaw: Proceedings of the Conference Held at Stanford University, ed.by Ronald I. McKinnon (New York: Dekker, 1976).
Starr, Gerald, "Min imum W a g e Fixing: International Experience with AlternativeRoles," International Labor Review (Geneva), Vol. 120 (September-October1981), pp. 545-62.
Stiglitz, Joseph E . , "Taxation, Corporate Financial Policy, and the Cost of Capi-tal," Journal of Public Economics (Amsterdam), Vol. 2 (February 1973), pp.1-34.
_____, "The Corporation Tax," Journal of Public Economics (Amsterdam), Vol.5 (April-May 1976), pp. 303-11.
Stoneman, Colin, "Foreign Capital and Economic Growth," World Development(Oxford), Vol. 3 (January 1975), pp. 11-26.
Sumner, Daniel, A . , " W a g e Functions and Occupational Selection in a Rural LessDeveloped Country Setting," Review of Economics and Statistics (Cam-bridge, Massachusetts), Vol. 63 (November 1981), pp. 513-19.
Sundararajan, V . , and Subhash Thakur, "Public Investment, Crowding Out, andGrowth: A Dynamic Model Applied to India and Korea," Staff Papers, Inter-national Monetary Fund (Washington), Vol. 27 (December 1980), pp.814-55.
Tahari, A m o r , "The Impact of Taxation on Saving and Consumption in Develop-ing Countries: A Paradox?" (unpublished, International Monetary Fund,March 29, 1979).
Tanzi, Vito, "Export Taxation in Developing Countries: Taxation of Coffee inHaiti," Social and Economic Studies (Kingston, Jamaica), Vol. 25 (March1976), pp. 66-76.
_____, "Tax Policy in Middle-Income Countries: Some Lessons of Experience,"Bulletin, International Bureau of Fiscal Documentation (Amsterdam), Vol.36 (August/September 1982), pp. 411-20.
_____, "Quantitative Characteristics of the Tax Systems of Developing Coun-tries," in The Theory of Taxation for Developing Countries, ed. by DavidNewbery and Nicholas Stern (New York: Oxford University Press, 1987).
Teilhet-Waldorf, Saral, and William H . Waldorf, "Earnings of Self-Employed inan Informal Sector: A Case Study of Bangkok," Economic Development andCultural Change (Chicago), Vol. 31 (April 1983), pp. 587-607.
Thimmaiah, G . , "Taxation and Government Consumption," International Bu-reau of Fiscal Documentation, Bulletin (Amsterdam), Vol. 31 (December1977), pp. 551-57.
Thirlwall, A . P . , Inflation, Saving and Growth in Developing Economies (London:Macmillan; New York: St. Martin's, 1974).
Tolley, George S., Vinod Thomas, and Chung Ming W o n g , Agricultural PricePolicies and the Developing Countries (Baltimore: Johns Hopkins UniversityPress, 1982).
Tun Wai , U , " A Revisit to Interest Rates Outside the Organized Money Markets
©International Monetary Fund. Not for Redistribution
90 L I A M P. EBRILL
of Underdeveloped Countries," Quarterly Review, Banca Nazionale delLavoro (Rome), Vol. 30 (September 1977), pp. 291-312.
_____, and Chorng-huey W o n g , "Determinants of Private Investment in Devel-oping Countries," Journal of Development Studies (London), Vol. 19 (Octo-ber 1982), pp. 19-36.
Usher, Dan, "The Economics of Tax Incentives to Encourage Investment in LessDeveloped Countries," Journal of Development Economics (Amsterdam),Vol. 4 (June 1977), pp. 119-48.
Vandendorpe, A . L . , and A . F . Friedlaender, "Differential Incidence in the Pres-ence of Initial Distorting Taxes," Journal of Public Economics (Amsterdam),Vol. 6 (October 1976), pp. 205-29.
van Wijnbergen, S., "Interest Rate Management in L D C ' s , " Journal of MonetaryEconomics (Amsterdam), Vol. 12 (September 1983), pp. 433-52.
Vogel, Robert C . , and Stephen A . Buser, "Inflation, Financial Repression, andCapital Formation in Latin America," in Money and Finance in EconomicGrowth and Development: Essays in Honor of Edward S. Shaw: Proceedingsof the Conference Held at Stanford University, ed., by Ronald I. McKinnon(New York: Dekker, 1976).
Watanabe, Susumu, "Minimum Wages in Developing Countries: Myth and Real-ity," International Labor Review (Geneva), Vol. 113 (May-June 1976), pp.345-58.
Weisskopf, Thomas E . (1972a), " A n Econometric Test of Alternative Constraintson the Growth of Underdeveloped Countries," Review of Economics and Sta-tistics (Cambridge, Massachusetts), Vol. 54 (February 1972), pp. 67-78.
-(1972b), "The Impact of Foreign Capital Inflow on Domestic Savings inUnderdeveloped Countries," Journal of International Economics (Amster-dam) , Vol. 2 (February 1972), pp. 25-38.
Williamson, Jeffrey G . , "Public Expenditure and Revenue: A n International C o m -parison," Manchester School of Economic and Social Studies, Vol. 29 (Janu-ary 1961), pp. 34-56.
_____, "Personal Saving in Developing Nations: A n Intertemporal Cross-Sectionfrom Asia," Economic Record (Melbourne), Vol. 44 (March 1968), pp.194-210.
World Bank, World Development Report, 1983 (New York: Oxford UniversityPress, 1983).
W y n n , R . F . , "Foreign Capital, Trade and Savings: The Sudan 1955-71," TheMalayan Economic Review (Singapore), Vol. 25 (October 1980), pp. 14-29.
Yap, Lorene Y . L , "Rural-Urban Migration and Urban Underemployment in Bra-zil," Journal of Development Economics (Amsterdam), Vol. 3 (September1976), pp. 227-43.
_____, "The Attraction of Cities: A Review of the Migration Literature," Journalof Development Economics (Amsterdam), Vol. 4 (September 1977), pp.239-64.
©International Monetary Fund. Not for Redistribution
Optimal Taxation of Financial Savingsin Developing Countries
Relevance of Supply-Side Tax Policies
Liam P. Ebrill
This chapter evaluates, for the case of developing countries, the poten-tial impact of supply-side proposals for stimulating savings. S o m e supply-side economists argue, in the context of developed economies, that the in-teraction of inflation and high marginal rates of income taxation is such asto imply a serious disincentive to savings. Thus , they recommend sharpreductions in marginal tax rates.1 If applied to developing countries,would such reductions be either desirable or lead to a pronounced increasein savings?
In examining these issues, this chapter concentrates on savings chan-neled through organized financial markets. This emphasis can be justifiedon a n u m b e r of grounds, of which three are worth special mention. First, itis often argued that, while aggregate savings are generally not very sensi-tive to changes in the net rate of return, that is not the case with individualcomponents such as financial savings in organized markets, since changesin the rate of return that can be earned on any one form of savings can beexpected to induce significant shifts into substitute assets. Second, organ-ized financial markets are often central to the efficient allocation of avail-able funds. Third, and particularly important given the supply-side per-spective of our analysis, the specific disaggregation of aggregate savingsemployed here is useful precisely because the components can be distin-guished by whether they represent savings in organized as opposed to unor-ganized financial markets. Since supply-side proposals for reform are typi-cally directed at lowering high marginal rates of income taxation, the most
1This begs the question of whether a more direct response would be to index for inflation.
91
4
©International Monetary Fund. Not for Redistribution
92 L I A M P. EBRILL
immediate effect of these proposals in developing countries will be on thosesavings placed in the organized rather than the unorganized money mar -kets.
This chapter first describes the financial markets in developing coun-tries as the backdrop against which the appropriateness of supply-side pro-posals are evaluated. Particular attention is devoted to the significance offinancial repression, an indicator of which is the policy of institutionallysetting nominal interest rates at artificially low levels. The low (indeed,negative) real rates of return that result induce asset holders to shift out ofassets issued by organized financial markets into investments that are lessproductive, such as gold and housing. Should this effect be empiricallysignificant, it has important implications for this study given the study'sconcentration on savings behavior in organized financial markets.
Given this background, what are the appropriate tax reform policies?The chapter begins with a discussion of the reform proposals of the tradi-tional public finance theorists. It is argued that the existing optimal taxliterature does not adequately accommodate the circumstances of develop-ing countries. A modified optimal tax framework is suggested. The resultsof this exercise are contrasted with the recommendations of the supply-sideschool. The conclusion is that, while not necessarily incorrect, the pro-posals of the supply-side school are deficient in that they do not take ac-count of the heterogeneity of developing countries. This is a deficiency theyshare with the traditional public finance literature. Specifically, the modi-fied optimal tax framework developed in this chapter suggests that, de-pending on the particular country under consideration, the optimal taxtreatment of financial savings runs the gamut from subsidies to substantialtaxation.
All of the above treats the problem from a microeconomic perspective. Itis also pointed out, however, that the ramifications of financial repressionextend to macroeconomic policy, a factor that should be acknowledged inany study of tax policy in this area.
The traditional public finance literature, the supply-side approach, andthe modified optimal tax framework developed here do, however, share ac o m m o n theme: appropriate tax rates should depend on the sensitivity ofsavings behavior to changes in the rate of return.
I. Institutional Background
A n y tax reform recommendations must take account of the economicenvironment in which the reform takes place. The financial structures ofdeveloping countries have a number of features that, although not uniqueto these countries, are held to be more widely experienced by them. While
©International Monetary Fund. Not for Redistribution
OPTIMAL TAXATION OF FINANCIAL SAVINGS 93
this is undoubtedly correct, it should also be kept in mind, as these fea-tures are introduced and discussed, that the degree to which any feature isrelevant varies greatly from country to country. As argued later, this vari-ability has important implications for tax policy.
First, financial institutions in m a n y developing countries tend not to bewell developed (cf., Miracle, Miracle, and Cohen (1980)). This has a n u m -ber of implications. In particular, M c K i n n o n (1973) argued that in devel-oping countries, investors are constrained to using self-finance and thatinvestments are relatively lumpy. As a result, investors must accumulatemoney balances prior to their investments, leading to the hypothesis thatthe aggregate d e m a n d for money will be greater, the larger is the share ofinvestment in total expenditures. (This is McKinnon's complementarityhypothesis.)
Second, it has often been pointed out that in m a n y developing countries,interest rates on assets in organized markets are often set at low nominalrates given the rate of inflation (see Galbis (1979)). A large body of litera-ture exists in which it is argued that such institutional restraints can onlyresult in financial repression (Shaw (1973), M c K i n n o n (1973)).2 The exis-tence of these interest rate ceilings, it is held, leads to a reduced supply offinancial savings to organized markets, as savers turn to alternative non-productive investments such as property and precious metals. Dependingon foreign exchange market conditions, savings m a y even be placed over-seas. These effects, it is argued, require some type of investment rationingmechanism.
Financial repression m a y not only result in portfolio reallocations out oforganized financial markets but m a y also influence short-run macroeco-nomic developments in m a n y developing countries. Specifically, Leff andSato (1980) identify a couple of macroeconomic implications. First, exante investment will tend to exceed ex ante savings. Second, and more im-portant for short-run policy, interest rates cannot be used to maintainequilibrium in the savings-investment market. They argue that investmenttends to be relatively more buoyant than savings with the concomitant pos-sibility of instability. Price-level movements and foreign capital flows thenbecome central to absorbing shocks. The general conclusion is that infla-tion and dependency on foreign capital inflows are structurally rooted inm a n y developing countries.
A third distinctive feature of financial markets in some developing coun-tries is that investors enjoy the existence of unorganized curb markets (van
2Tables 1 and 2 in the Annex show that financial repression varies both across countriesand across time. The phenomenon is not as prevalent today as formerly. However, that onlyserves to emphasize the heterogeneity of developing country financial policies.
©International Monetary Fund. Not for Redistribution
94 L I A M P. E B R I L L
Wijnbergen (1983a) and Buffie (1984)).3 By emphasizing the role of curbmarkets for portfolio allocation decisions in developing countries, vanWijnbergen questions the presumption that the alternative asset to finan-cial holdings in organized markets must consist of nonproductive invest-ments. Instead, it m a y consist of holdings of financial assets issued in un-organized money markets of the curb market type (van Wijnbergen(1983b)). This possibility alters the implications of financial repression foreconomic policy. For example, an increase in interest rates in organizedmarkets m a y no longer result in the "free lunch" of financial flows at-tracted from nonproductive sources, but m a y instead lead to a general in-crease in the working cost of capital faced by firms. Further, the centralgovernments of many developing countries exercise a major claim on sav-ings channeled through organized money markets. If such governmentsinvest less efficiently than the private sector, an increase in interest ratesthen achieves the ambiguous result of alleviating the distortion faced bysavers at the expense of exacerbating the distortion associated with inap-propriate government investment decisions.
A fourth and final characteristic is that many developing country gov-ernments employ compulsory savings schemes.4 For example, Shome andSquire (1983) point out that some Asian countries such as Malaysia, SriLanka, and Singapore have, in varying degrees, funded social security sys-tems.
Given that the above features are not uniformly experienced, they alsoserve to emphasize the heterogeneity of developing country circumstances.In view of the prominence it has attained in the economic literature, thefollowing assessment of supply-side tax proposals will concentrate on the
3 H o w important are these curb markets? T u n W a i (1977) argues that the ratio of totalagricultural or rural indebtedness to the claims of the banking system on the private sector isthe best index of the size of unorganized money markets relative to that of the organizedmoney market. By that criterion, he concludes that for India, Nepal, and Pakistan the unor-ganized markets are larger than the organized markets. (The data he collects refers to1969/70, 1970, and 1971, respectively.) H e finds that, in general, these markets are less im-portant in those Latin American and Middle Eastern countries for which data were available.Chandavarkar (1971) confirmed these results for India, while, of course, the importance ofcurb markets in Korea has long been recognized (see, for example, Williamson (1979)). O nthis last case, van Wijnbergen (1982) uncovered evidence, some indirect, to the effect thatincreased savings are mainly channeled into the curb market over time. Specifically, he dis-covered that wealth effects were not significant in his M 2 demand equations. Since financialassets assuredly have positive wealth elasticities in the aggregate, curb markets must havebeen the beneficiary of increased wealth.
4 F r o m the perspective of this study, long-term schemes such as compulsory funded socialsecurity systems are the most important. However, as documented by Prest (1969), m a n ycountries have also resorted to shorter-term schemes.
©International Monetary Fund. Not for Redistribution
OPTIMAL TAXATION OF FINANCIAL SAVINGS 95
particular role played by financial repression. A n optimal tax frameworkwill be developed that will explicitly allow for such a phenomenon. Therobustness of this framework will then be assessed in light of the otherstructural features of developing country capital markets just discussed.The framework will also form a basis for evaluating the relevance of sup-ply-side tax policies as they apply to savings. Even at this stage, however,there is already the sense that the heterogeneity of the financial systems ofdeveloping countries implies that tax changes based on simplistic rules ofthumb are unlikely to be appropriate.
II. Evaluation of Reform Proposals
The recent supply-side literature is large. However, perhaps out of a de-sire to m a k e politically feasible tax policy recommendations, the actualnumber of recommendations contained in that literature is quite small.Though not bearing directly on the savings issue, the best known are thoseassociated with the Laffer curve, especially that high marginal tax ratesshould be sharply reduced. This type of recommendation has not beenm a d e solely with the United States in mind, however; Wanniski (1983), forexample, argues for the relevance of the Laffer curve for a number of de-veloping countries (see Ebrill (Chapter 7)).
More generally, it would appear to be in the spirit of the supply-sideapproach to say that they favor tax cuts aimed at stimulating (private) sav-ings. This, of course, begs the question of the adequacy of the pre-existinglevel of savings. Presumably the supply-siders believe that aggregate sav-ings are depressed in the first place due to the existence of the tax systemand other distortions. In fact, there is general agreement that savings indeveloping countries are low in relation to investment needs.
S u m m a r y of Theoretical Literature
O n e way of evaluating the supply-side approach is to contrast its recom-mendations on savings with those of the more traditional public financeliterature. In particular, there are a number of papers that address theissue of h o w to tax savings.5 The orientation of this literature has been todetermine whether the tax base should be income or expenditure (con-sumption). A m o n g the earlier commentators on this question, Mill (1921)argued for a consumption base, not so m u c h on efficiency as on equity
5This issue is logically different from that of h o w best to stimulate savings. However, to theextent that the literature provides qualitative results, it does provide a benchmark againstwhich the desirability of stimulating savings can be weighed.
©International Monetary Fund. Not for Redistribution
96 L I A M P. E B R I L L
grounds—income taxes tend to favor those who derive their income fromwealth rather than work effort. More recently, the consumption base re-ceived further support in the work of Kaldor (1955), who argued for anexpenditure tax on both efficiency and equity grounds.
Even more recently optimal tax theorists sought to resolve this questionby considering solely the efficiency implications. Their solution lay initiallyin a simple extension of the optimal commodity tax literature. Thus, Feld-stein (1978) gives the static framework associated with that literature anintertemporal flavor by labeling consumption in different periods as differ-ent commodities. A two-period life-cycle model is postulated. The con-sumer is then assumed to allocate his endowment across leisure (which isuntaxable), first-period consumption, and second-period consumption. Ingeneral, since leisure cannot be taxed, second-best theory suggests that it isoptimal to violate all first-order conditions. There are circumstances inwhich a consumption tax is optimal—as when a compensated changein the wage rate induces the same proportional changes in consumption inthe two periods.6 This type of result suggests that in general neither a con-sumption tax nor an income tax will be optimal—it will in most cases bepreferable to have separate tax rates on savings and consumption.
This inconclusiveness in the optimal tax literature is reinforced by morerecent work. For example, Atkinson and Sandmo (1980) develop an ex-plicit overlapping generations growth model and demonstrate that theFeldstein type of analysis can be generated within that framework if thegovernment possesses a range of additional instruments, such as an uncon-strained debt policy, to achieve the desired intertemporal allocation wherethe steady-state marginal product of capital equals the discount rate. Theythen consider the optimal tax solution in a second-best world where thegovernment cannot attain the first-best intertemporal equilibrium. Thispart of their analysis is of more interest to this paper since, as pointed outabove, the supply-side concern with stimulating savings is presumablypredicated on a belief that the capital stock is inadequate. The Feldsteinapproach, however, assumes that capital markets are efficient and askswhether savings should or should not be taxed in an overall package oftaxes levied with a view to raising a given amount of revenue with mini-m u m excess burden. Unfortunately, even when it is known that the capitalstock is below its "first-best" level, the effect of the recommended tax sys-
6This is implicitly an implication of the Ramsey Rule (Ebrill and Slutsky (1983)). Under thecircumstances laid out by Feldstein (1978), a labor income tax is optimal and is equivalent toa uniform consumption tax and vice versa. Accordingly, a consumption tax is all that is re-quired to guarantee a compensated proportionate reduction in all distortable commoditieswhere this is precisely a statement of the Ramsey Rule.
©International Monetary Fund. Not for Redistribution
O P T I M A L T A X A T I O N O F F I N A N C I A L S A V I N G S 97
tern remains ambiguous. Indeed, in the specific Cobb-Douglas examplethey consider, Atkinson and Sandmo (1980) point out that a tax on capitalincome is desirable, a result that depends on the shape of the aggregatesavings function.
In the absence of qualitative results concerning the optimal treatment ofsavings, some authors have taken the more pragmatic route of parame-terizing general equilibrium models and then evaluating the advisability ofvarious tax reform proposals. For example, Fullerton, Shoven, and W h a l -ley (1983) use a dynamic numerical general equilibrium model of the U . S .economy to determine the welfare implications of substituting a progres-sive consumption tax for the current income tax structure. The initial ef-fect is that individuals consume less. The welfare changes are influencedby both the transition and the steady-state balanced growth paths. Not-withstanding the initial drop in consumption, the net effect of the taxchange is welfare-enhancing. Of course, the outcome depends on the pre-cise parameters, as is evident from the range of opinions on the magnitudeof the transition costs implied by this type of tax change (Auerbach andKotlikoff (1983), Seidman (1984)). Nonetheless, there appears to be grow-ing interest in the proposition that, within the context of the models em-ployed, consumption is a more appropriate base for taxation than income.
The main thrust of this chapter is not to evaluate the conclusions of theoptimal tax literature concerning the appropriate treatment of aggregatesavings but to determine the implications of supply-side policies for finan-cial savings, where the latter are a component of aggregate savings. Whilethe traditional public finance literature has not explicitly addressed theoptimal tax treatment of this component, those papers concerned with de-termining the optimal rate of inflation are relevant. Inflation is viewed as atax on money balances, which is a component of financial savings. Begin-ning with Phelps (1973) and Siegel (1978), it has been argued that a posi-tive tax on liquidity (a positive rate of inflation) is in general desirable, onthe principle that the d e m a n d for all taxable goods ought to be proportion-ately reduced (the Ramsey Rule). Subsequent writers have pointed outthat, along lines analogous to those taken by Atkinson and S a n d m o (1980)above, the economy need not be on the golden-rule path. Since inflationcan affect the long-run capital intensity of the economy, its impact on thispre-existing distortion should be accommodated (Summers (1981)). Fur-ther, it is argued that account should be taken of the fact that money iscostless to produce (Drazen (1979)). As might be expected, since the out-come depends both on the degree to which other distortions are recognizedand on the empirical magnitude of numerous own- and cross-price deriva-tives, there are no unambiguous qualitative conclusions. In addition, ashas already been pointed out, neither stream of the optimal tax literature
©International Monetary Fund. Not for Redistribution
98 LIAM P. EBRILL
(i.e., that pertaining to aggregate savings and that to money balances) isdirectly applicable to circumstances in the developing world.
A n Opt imal T a x F r a m e w o r k for Financial Savings inDeveloping Countries
Given the deficiencies of the existing optimal tax literature, an alterna-tive, also highly simplified, optimal tax model is developed below, whichincorporates certain salient features of the financial structures of develop-ing countries as described earlier. In particular, financial repression is ex-plicitly allowed for, in a framework in which the rate of inflation is as-sumed to be exogenous. The m e n u of financial assets available to therepresentative consumer consists of money for transactions purposes, fi-nancial savings deposited in organized money markets, and other savings.7
Financial repression is allowed for in the form of pre-existing distortionson both money and financial savings.
The model does not allow for the fact that money for transactions pur-poses is costless to produce. This is not a serious problem since our pur-pose is to determine the optimal tax treatment of financial savings otherthan money (Ml) , given a rate of inflation and a degree of financial repres-sion, rather than to determine the optimal rate of inflation. Nor, since ituses a static framework, does the model allow for the possibility of a fur-ther distortion due to the typical economy being below the golden-rulepath. However, while such an effect will in general alter the magnitudes ofthe optimal tax changes, it is unlikely to change their direction. This pointwill be discussed in greater detail.
The important notations used in the model are defined below.
7Other savings can include savings held abroad.
C0 = consumption of leisure;C1 = consumption of current goods and services;C2 = consumption stream associated with nonfinancial savings;C 3 = consumption stream associated with financial savings other
than financial savings for transactions purposes;C 4 = consumption stream associated with financial savings for trans-
actions purposes (Ml);B = government's net revenue requirement;ti = ad valorem tax rate on C i ;ti = pre-existing proportional distortion on Ci, i = 3, 4;Pi = market price of C i ;0i = share of tax in total price of C i ;a = share of financial savings (C3) mediated through the govern-
ment;
©International Monetary Fund. Not for Redistribution
OPTIMAL TAXATION OF FINANCIAL SAVINGS 99
nij = compensated elasticity of d e m a n d for Ci with respect to Pj;u = multiplier on the government's budget constraint; andX = private marginal utility of income.
The underlying methodology of this type of exercise is well k n o w n (cf.,Atkinson and Stiglitz (1980)). Accordingly, where possible, the explana-tion below will concentrate on aspects of the formulation that are unique tothe problem at hand. Specifically, there are five commodities, includingleisure (C0), where leisure is untaxable. Of the other commodities, C 4 is aproxy for the consumption stream a typical consumer obtains from finan-cial wealth held for transactions purposes. The underlying stock that pro-vides this consumption stream is assumed to be M l . C 3 refers to the re-mainder of financial savings. It is assumed that organized money marketsact as intermediaries, so that these savings are productively invested. Ac-cordingly, C 3 is best viewed as a proxy for the consumption stream thatresults from that investment. As for the investment itself, a proportion, a,is financed by the government via borrowing. This proportion is assumedto be subject to government manipulation, implying that the private sectoris a residual investor. C2 refers to the consumption stream that results fromthe disposition of the remainder of aggregate savings. It might be useful toview this in terms of the "consumption" of owner-occupied housing, worksof art, and so on. Finally, C1 is a variable representing the aggregate ofcurrent consumption. Given this structure, it is clear, as pointed outabove, that this exercise does not accommodate the intertemporal invest-ment dimensions of the problem or the fact that M l is costless to produce.It is not a true general equilibrium exercise. Instead, the very fact that thevariables should be viewed as proxies indicates the illustrative nature of theframework. However, this illustrative nature can be defended on thegrounds that the model m a y nonetheless yield useful qualitative insights.
The market environment assumed for this exercise, in c o m m o n withmost other optimal tax exercises, presumes competitive behavior on thepart of private firms and consumers. The formulation of the consumer'sproblem requires some elaboration. Since the paper is concerned with eco-nomic efficiency rather than equity, the general equilibrium structure isset in the context of a representative price-taking individual w h o has atwice continuously differentiable, monotonic, strictly quasi-concave, util-ity function U(C0, C1 C 2 , C 3 , C 4 ) . The consumer's maximization problemis
©International Monetary Fund. Not for Redistribution
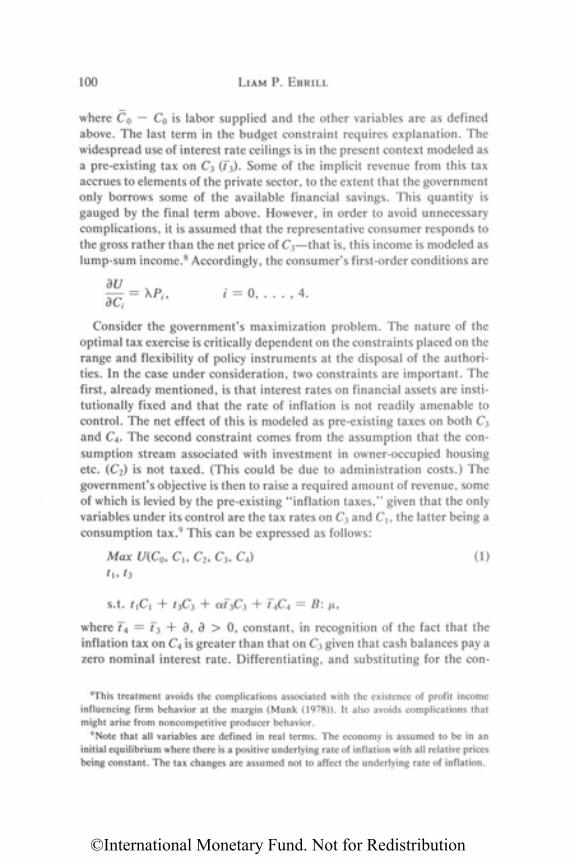
100 L I A M P. E B R I L L
where C0 — C0 is labor supplied and the other variables are as definedabove. The last term in the budget constraint requires explanation. Thewidespread use of interest rate ceilings is in the present context modeled asa pre-existing tax on C 3 (t3). S o m e of the implicit revenue from this taxaccrues to elements of the private sector, to the extent that the governmentonly borrows some of the available financial savings. This quantity isgauged by the final term above. However, in order to avoid unnecessarycomplications, it is assumed that the representative consumer responds tothe gross rather than the net price of C3—that is, this income is modeled aslump-sum income.8 Accordingly, the consumer's first-order conditions are
Consider the government's maximization problem. The nature of theoptimal tax exercise is critically dependent on the constraints placed on therange and flexibility of policy instruments at the disposal of the authori-ties. In the case under consideration, two constraints are important. Thefirst, already mentioned, is that interest rates on financial assets are insti-tutionally fixed and that the rate of inflation is not readily amenable tocontrol. The net effect of this is modeled as pre-existing taxes on both C 3and C 4 . The second constraint comes from the assumption that the con-sumption stream associated with investment in owner-occupied housingetc. (C2) is not taxed. (This could be due to administration costs.) Thegovernment's objective is then to raise a required amount of revenue, someof which is levied by the pre-existing "inflation taxes," given that the onlyvariables under its control are the tax rates on C 3 and C1 the latter being aconsumption tax.9 This can be expressed as follows:
(1)
8This treatment avoids the complications associated with the existence of profit incomeinfluencing firm behavior at the margin ( M u n k (1978)). It also avoids complications thatmight arise from noncompetitive producer behavior.
9Note that all variables are defined in real terms. The economy is assumed to be in aninitial equilibrium where there is a positive underlying rate of inflation with all relative pricesbeing constant. The tax changes are assumed not to affect the underlying rate of inflation.
where t4 = t3 + d, d > 0, constant, in recognition of the fact that theinflation tax on C 4 is greater than that on C 3 given that cash balances pay azero nominal interest rate. Differentiating, and substituting for the con-
©International Monetary Fund. Not for Redistribution
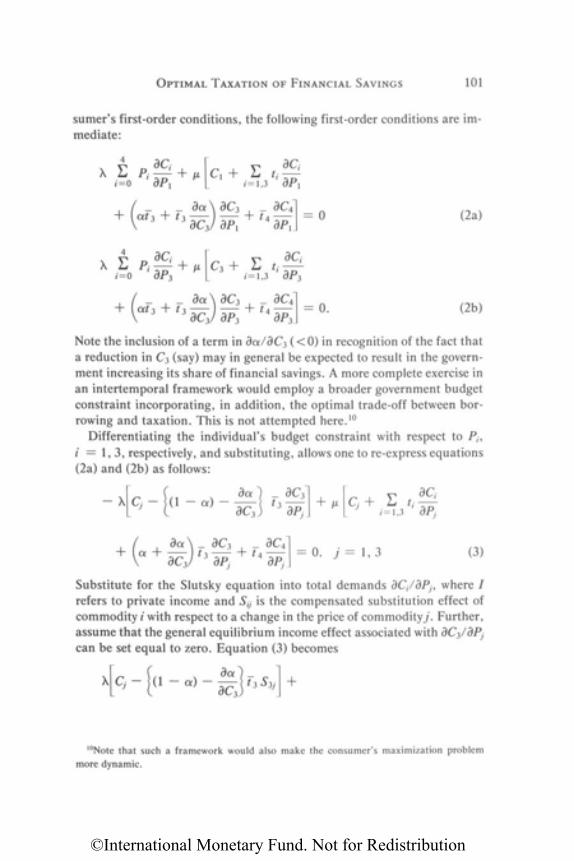
OPTIMAL TAXATION OF FINANCIAL SAVINGS 101
sumer's first-order conditions, the following first-order conditions are im-mediate:
Note the inclusion of a term in aa/aC3 (<0 ) in recognition of the fact thata reduction in C 3 (say) m a y in general be expected to result in the govern-ment increasing its share of financial savings. A more complete exercise inan intertemporal framework would employ a broader government budgetconstraint incorporating, in addition, the optimal trade-off between bor-rowing and taxation. This is not attempted here.10
Differentiating the individual's budget constraint with respect to Pi,
i = 1, 3, respectively, and substituting, allows one to re-express equations(2a) and (2b) as follows:
Substitute for the Slutsky equation into total demands dC i/dP j , where Irefers to private income and Sij is the compensated substitution effect ofcommodity i with respect to a change in the price of commodity j. Further,assume that the general equilibrium income effect associated with dC3/dPj
can be set equal to zero. Equation (3) becomes
10Note that such a framework would also make the consumer's maximization problemmore dynamic.
(2a)
(2b)
(3)
©International Monetary Fund. Not for Redistribution
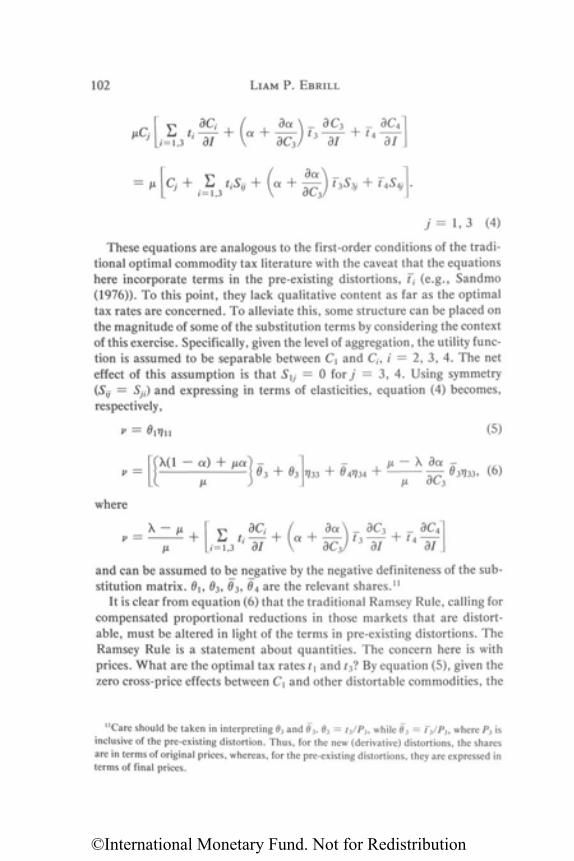
102 L I A M P. EBRILL
7 = 1,3 (4)
These equations are analogous to the first-order conditions of the tradi-tional optimal commodity tax literature with the caveat that the equationshere incorporate terms in the pre-existing distortions, ti (e.g., S a n d m o(1976)). T o this point, they lack qualitative content as far as the optimaltax rates are concerned. T o alleviate this, some structure can be placed onthe magnitude of some of the substitution terms by considering the contextof this exercise. Specifically, given the level of aggregation, the utility func-tion is assumed to be separable between C1 and C i , i = 2, 3, 4. The neteffect of this assumption is that S1j = 0 for j = 3, 4. Using symmetry(Sij = Sji) and expressing in terms of elasticities, equation (4) becomes,respectively,
v = 01n11 (5)
where
and can be assumed to be negative by the negative definiteness of the sub-stitution matrix. 01, 03, 03, 04 are the relevant shares.11
It is clear from equation (6) that the traditional Ramsey Rule, calling forcompensated proportional reductions in those markets that are distort-able, must be altered in light of the terms in pre-existing distortions. TheRamsey Rule is a statement about quantities. The concern here is withprices. W h a t are the optimal tax rates t1 and t3? By equation (5), given thezero cross-price effects between C1 and other distortable commodities, the
11Care should be taken in interpreting 03 and 0 3 . 03 = t3/P3, while 03 = t3/P3, where P3 isinclusive of the pre-existing distortion. T h u s , for the new (derivative) distortions, the sharesare in terms of original prices, whereas, for the pre-existing distortions, they are expressed interms of final prices.
(6)
©International Monetary Fund. Not for Redistribution
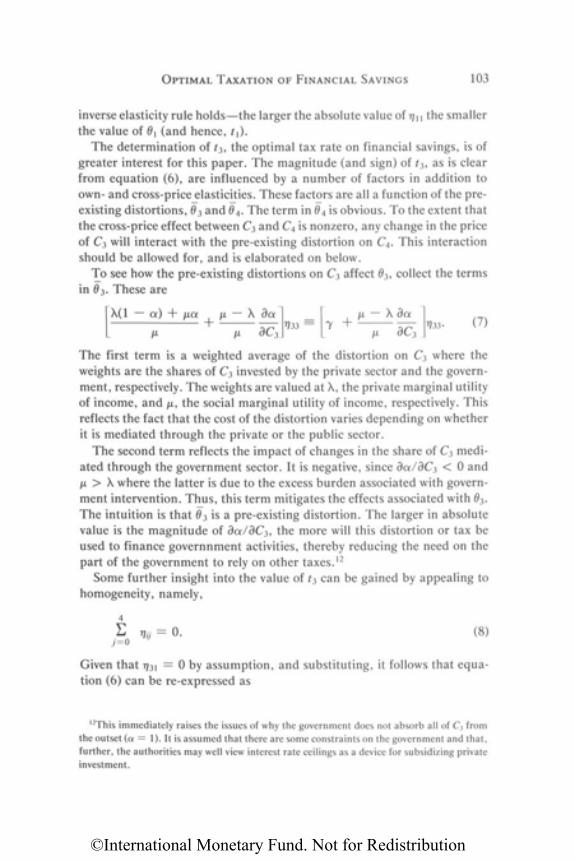
OPTIMAL TAXATION OF FINANCIAL SAVINGS 103
inverse elasticity rule holds—the larger the absolute value of n11 the smallerthe value of 01 (and hence, t1).
T h e determination of t3, the optimal tax rate on financial savings, is ofgreater interest for this paper. T h e magnitude (and sign) of t3, as is clearfrom equation (6), are influenced by a n u m b e r of factors in addition too w n - and cross-price elasticities. These factors are all a function of the pre-existing distortions, 0 3 and 0 4 . T h e term in 0 4 is obvious. T o the extent thatthe cross-price effect between C3 and C 4 is nonzero, any change in the priceof C 3 will interact with the pre-existing distortion on C 4 . This interactionshould be allowed for, and is elaborated on below.
T o see h o w the pre-existing distortions on C 3 affect 03, collect the termsin 0 3 . These are
(7)
The first term is a weighted average of the distortion on C3 where theweights are the shares of C 3 invested by the private sector and the govern-ment, respectively. The weights are valued at X , the private marginal utilityof income, and u, the social marginal utility of income, respectively. Thisreflects the fact that the cost of the distortion varies depending on whetherit is mediated through the private or the public sector.
T h e second term reflects the impact of changes in the share of C 3 medi-ated through the government sector. It is negative, since aa/aC3 < 0 andu > X where the latter is due to the excess burden associated with govern-ment intervention. Thus , this term mitigates the effects associated with 03.The intuition is that 0 3 is a pre-existing distortion. The larger in absolutevalue is the magnitude of a a / a C 3 , the more will this distortion or tax beused to finance governnment activities, thereby reducing the need on thepart of the government to rely on other taxes.12
S o m e further insight into the value of t3 can be gained by appealing tohomogeneity, namely,
(8)
Given that n31 = 0 by assumption, and substituting, it follows that equa-tion (6) can be re-expressed as
12This immediately raises the issues of why the government does not absorb all of C 3 fromthe outset (a = 1). It is assumed that there are some constraints on the government and that,further, the authorities m a y well view interest rate ceilings as a device for subsidizing privateinvestment.
©International Monetary Fund. Not for Redistribution
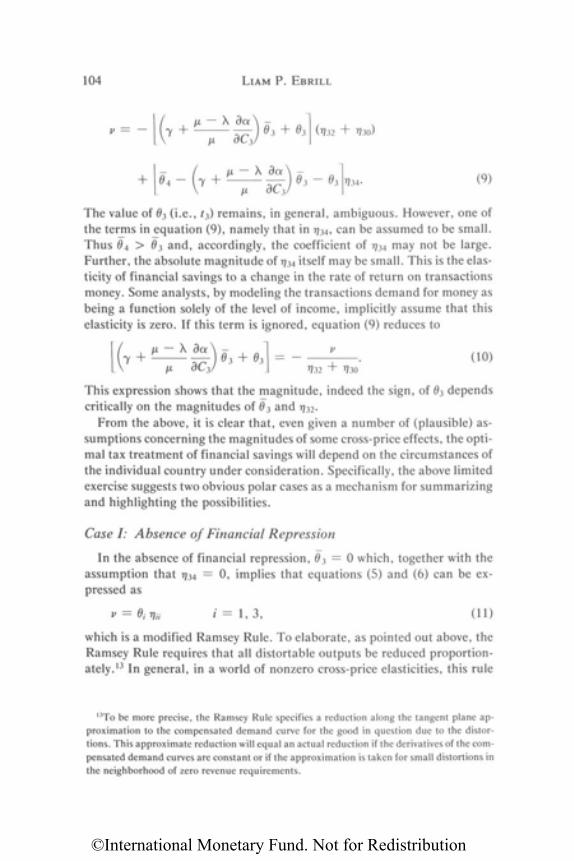
104 L I A M P. EBRILL
(9)
The value of 03 (i.e., t3) remains, in general, ambiguous. However, one ofthe terms in equation (9), namely that in n34, can be assumed to be small.Thus 0 4 > 0 3 and, accordingly, the coefficient of n34 m a y not be large.Further, the absolute magnitude of n34 itself m a y be small. This is the elas-ticity of financial savings to a change in the rate of return on transactionsmoney. S o m e analysts, by modeling the transactions d e m a n d for money asbeing a function solely of the level of income, implicitly assume that thiselasticity is zero. If this term is ignored, equation (9) reduces to
(10)
This expression shows that the magnitude, indeed the sign, of 03 dependscritically on the magnitudes of 03 and n32.
F r o m the above, it is clear that, even given a number of (plausible) as-sumptions concerning the magnitudes of some cross-price effects, the opti-mal tax treatment of financial savings will depend on the circumstances ofthe individual country under consideration. Specifically, the above limitedexercise suggests two obvious polar cases as a mechanism for summarizingand highlighting the possibilities.
Case I: Absence of Financial Repression
In the absence of financial repression, 03 = 0 which, together with theassumption that n34 = 0, implies that equations (5) and (6) can be ex-pressed as
which is a modified Ramsey Rule. T o elaborate, as pointed out above, theRamsey Rule requires that all distortable outputs be reduced proportion-ately.13 In general, in a world of nonzero cross-price elasticities, this rule
l 3 To be more precise, the Ramsey Rule specifies a reduction along the tangent plane ap-proximation to the compensated demand curve for the good in question due to the distor-tions. This approximate reduction will equal an actual reduction if the derivatives of the com-pensated demand curves are constant or if the approximation is taken for small distortions inthe neighborhood of zero revenue requirements.
(11)
©International Monetary Fund. Not for Redistribution
OPTIMAL TAXATION OF FINANCIAL SAVINGS 105
does not hold if there are pre-existing distortions. Pre-existing distortionsimply that the output of the goods associated with those distortions hasalready been reduced. Accordingly, w h e n introducing new distortions, ac-count must be taken of h o w these affect the equilibrium quantities of thepredistorted commodities. Ceteris paribus, the size of a new distortion willtend to be larger if the commodity on which it is levied is a substitute forthe goods with the pre-existing distortions. The new distortion will tend tocause d e m a n d to shift back into the predistorted goods. This argumentholds in reverse for goods that are complements. If the new distortion is tobe placed on a good with a pre-existing distortion, the new distortion is bythis line of reasoning reduced since any good is the perfect complement ofitself.
Turning to the case at hand, since 03 , the pre-existing distortion on fi-nancial savings, is zero, one does not have to be concerned, at least withinthe context of the model, about prior direct reductions in the equilibriumquantity of financial saving. As for the other pre-existing distortion, thaton cash balances, 04 , since the cross-price effects between the d e m a n d forcash balances and the d e m a n d for both financial savings C 3 and consump-tion C1 are assumed to be insignificant, one cannot use changes in the"price" of either of the latter two, that is, changes in 03 or 01, to mitigatethe effects of the pre-existing distortion on cash balances. It is in this sensethat the outcome is a modified Ramsey Rule. There is no guarantee thatthe d e m a n d for all distortable commodities will be proportionately re-duced. Rather, the rule is that the d e m a n d for both consumption C1 andfinancial savings C 3 be proportionately reduced irrespective of the priorreduction in the d e m a n d for cash balances, since the latter is unaffected bythe new distortions.
Proceeding from a statement of the optimal outcome in terms of quanti-ties to one in terms of prices, it can be seen from equation (11) that theoptimal tax rates depend inversely on the own-price elasticities. Concen-trating on the optimal tax treatment of financial savings and using theadding up condition implied by homogeneity, equation (10) becomes
(12)
Thus , the statement that the optimal tax on financial savings depends onthe own-price elasticity for financial savings has been restated in terms ofcross-price elasticities. In particular, the magnitude of the cross-price elas-ticity between financial savings, C3, and savings mediated through unor-ganized markets, C 2 , summarized by n32, is important. For large n32, 03
should be small.T h e intuition of this result is clear. T h e efficiency losses associated with
the taxation of savings in organized markets are the larger the greater is
©International Monetary Fund. Not for Redistribution
106 L I A M P. EBRILL
the sensitivity of savings flows to changes in the relative rates of return tobe earned in organized and unorganized money markets.
Case II: Existence of Financial Repression
The optimal tax treatment of consumption, C1, is unaffected by the exis-tence of financial repression. Since the cross-price elasticity between con-sumption and financial saving, n13, is taken to be zero, changes in 01 haveno effect on the d e m a n d for financial savings and therefore cannot miti-gate the effects of the distortion implied by financial repression.
As for the treatment of financial savings itself, equation (10) n o w ap-plies. In particular, if the degree of financial repression is large (03 is large)and if the capacity of the government to borrow at the margin at subsidizedrates is limited (aa/aC3 is small), then the pre-existing distortion on C3becomes of paramount importance. As a result, 03 could easily be nega-tive—a subsidy rather than a tax is appropriate.14 The intuition for thisresult lies in the fact that the distortion associated with the existence offinancial repression with the concomitant shifting of savings into other as-sets is such as to imply that the government should counteract it in spite ofthe revenue loss.
This is an important case since it m a y apply to m a n y developing coun-tries. If the further constraint of precluding the use of subsidies is im-posed, this case implies the interesting result that consumption (03 = 0) ismore appropriate than income as a tax base.
Evaluation of Limitations of Opt imal T a x F r a m e w o r k
S o m e further general comments on the relevance and completeness ofthe above optimal tax modeling exercise are in order. It has already beennoted that the model is not a true general equilibrium intertemporalframework. Neither does the model recognize that cash is effectively cost-less to produce. However, accommodating these discrepancies within amore complete framework is unlikely to change the qualitative results to agreat extent. It remains to be considered whether there are other, moresignificant, discrepancies between the optimal tax framework presentedabove and the description of the financial structures of developing coun-tries presented in the previous section.
A first observation is that the model has nothing to say about the public
14A parallel result can be found in Nellor (1983). In that paper, while considering the posi-tive question of h o w precisely to counter inflation, he points out that capital income subsidies(or their equivalent in terms of other tax instruments) m a y well be necessary.
©International Monetary Fund. Not for Redistribution
O P T I M A L T A X A T I O N O F F I N A N C I A L S A V I N G S 107
policy implications of whether the alternative asset to organized moneymarket assets consists of precious metals, property, investments heldabroad, and so on, or of an unorganized money market asset such as thatcreated by Korea's curb markets. In analytical terms, this appears to be are-emergence of the question of whether an economy is or is not on itsgolden-rule path. W h a t individuals view as savings and what constitutescapital from the point of view of society as a whole are not necessarily syn-onymous. Investments in such activities as land speculation increase theprobability that a given country's capital stock lies below its golden-rulelevel. This can be modeled in a more complete optimal tax framework as apre-existing distortion and, while the outcome is not certain (cf., Atkinsonand S a n d m o (1980)), it would appear to increase the probability that fi-nancial savings should be subsidized. Note that this effect is over andabove those direct effects described above associated with financial repres-sion.15
A further institutional feature not incorporated in this exercise is thecompulsory savings schemes employed by some governments (Datta andS h o m e (1981)). Introducing this element into the framework above wouldexcessively complicate matters. Given the short-term illiquidity of assetsimplied by forced investments in funded social security programs, thesesavings are not perfect substitutes for other forms of savings. That wouldrequire the introduction of a new variable into the utility function. Thisvariable would be quantity-constrained, which has implications for themarket behavior of other variables (cf., Neary and Roberts (1980)).
The role of forced savings, on the presumption that they are productivelyinvested, is analogous to the role discussed above of curb markets. Theirprimary influence m a y not be on the marginal first-order conditions butrather on the discrete issue of whether the economy is or is not on itsgolden-rule path. The intuitive implications, though they should be ex-pressed with reservations, again seem clear. For example, a country with alarge stock of forced savings and no financial repression is more likely to bea country where financial savings should be taxed.
The above reservations modify the analytical framework. M o r e funda-mental is the reservation that financial repression also influences the short-run macroeconomic performance of economies. This is a problem thatcannot be solved by recommending a specific tax rate—what is required is
15The optimal outcome depends, of course, not only on the nature of the alternative assetbut also on its institutional context. In the case where, for example, one of the alternativeassets consists of investments held abroad, the attitude of the authorities toward externalcapital flows is important. For our purposes, the influence of this type of consideration will becaptured in the magnitude of the relevant compensated price elasticity.
©International Monetary Fund. Not for Redistribution
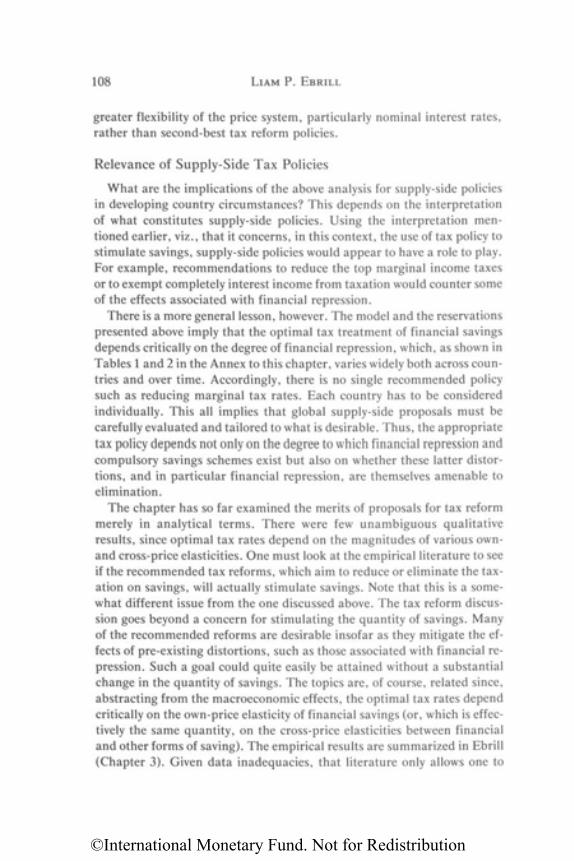
108 L I A M P. EBRILL
greater flexibility of the price system, particularly nominal interest rates,rather than second-best tax reform policies.
Relevance of Supply-Side T a x Policies
W h a t are the implications of the above analysis for supply-side policiesin developing country circumstances? This depends on the interpretationof what constitutes supply-side policies. Using the interpretation m e n -tioned earlier, viz., that it concerns, in this context, the use of tax policy tostimulate savings, supply-side policies would appear to have a role to play.For example, recommendations to reduce the top marginal income taxesor to exempt completely interest income from taxation would counter someof the effects associated with financial repression.
There is a more general lesson, however. The model and the reservationspresented above imply that the optimal tax treatment of financial savingsdepends critically on the degree of financial repression, which, as shown inTables 1 and 2 in the Annex to this chapter, varies widely both across coun-tries and over time. Accordingly, there is no single recommended policysuch as reducing marginal tax rates. Each country has to be consideredindividually. This all implies that global supply-side proposals must becarefully evaluated and tailored to what is desirable. Thus, the appropriatetax policy depends not only on the degree to which financial repression andcompulsory savings schemes exist but also on whether these latter distor-tions, and in particular financial repression, are themselves amenable toelimination.
The chapter has so far examined the merits of proposals for tax reformmerely in analytical terms. There were few unambiguous qualitativeresults, since optimal tax rates depend on the magnitudes of various o w n -and cross-price elasticities. O n e must look at the empirical literature to seeif the recommended tax reforms, which aim to reduce or eliminate the tax-ation on savings, will actually stimulate savings. Note that this is a some-what different issue from the one discussed above. The tax reform discus-sion goes beyond a concern for stimulating the quantity of savings. M a n yof the recommended reforms are desirable insofar as they mitigate the ef-fects of pre-existing distortions, such as those associated with financial re-pression. Such a goal could quite easily be attained without a substantialchange in the quantity of savings. The topics are, of course, related since,abstracting from the macroeconomic effects, the optimal tax rates dependcritically on the own-price elasticity of financial savings (or, which is effec-tively the same quantity, on the cross-price elasticities between financialand other forms of saving). The empirical results are summarized in Ebrill(Chapter 3). Given data inadequacies, that literature only allows one to
©International Monetary Fund. Not for Redistribution
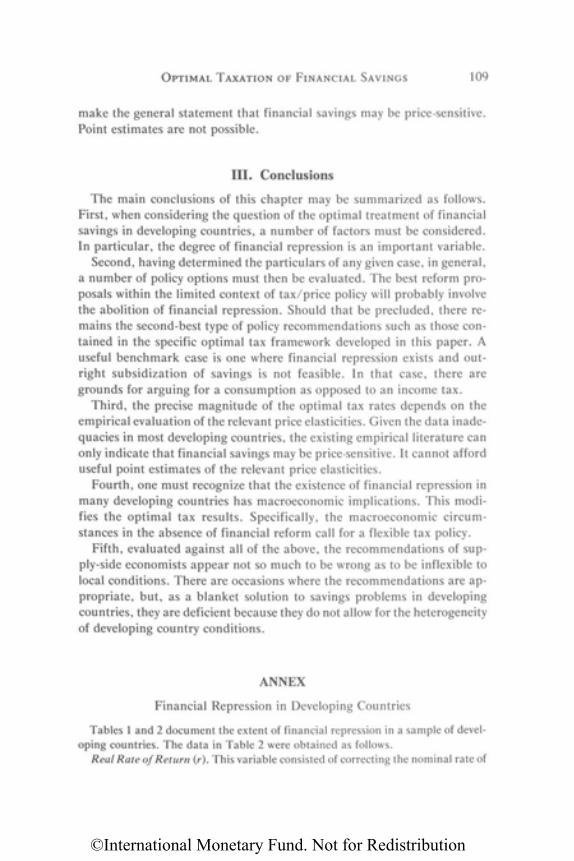
OPTIMAL TAXATION OF FINANCIAL SAVINGS 109
m a k e the general statement that financial savings m a y be price-sensitive.Point estimates are not possible.
III. Conclusions
The main conclusions of this chapter m a y be summarized as follows.First, when considering the question of the optimal treatment of financialsavings in developing countries, a number of factors must be considered.In particular, the degree of financial repression is an important variable.
Second, having determined the particulars of any given case, in general,a number of policy options must then be evaluated. The best reform pro-posals within the limited context of tax/price policy will probably involvethe abolition of financial repression. Should that be precluded, there re-mains the second-best type of policy recommendations such as those con-tained in the specific optimal tax framework developed in this paper. Auseful benchmark case is one where financial repression exists and out-right subsidization of savings is not feasible. In that case, there aregrounds for arguing for a consumption as opposed to an income tax.
Third, the precise magnitude of the optimal tax rates depends on theempirical evaluation of the relevant price elasticities. Given the data inade-quacies in most developing countries, the existing empirical literature canonly indicate that financial savings m a y be price-sensitive. It cannot afforduseful point estimates of the relevant price elasticities.
Fourth, one must recognize that the existence of financial repression inm a n y developing countries has macroeconomic implications. This modi-fies the optimal tax results. Specifically, the macroeconomic circum-stances in the absence of financial reform call for a flexible tax policy.
Fifth, evaluated against all of the above, the recommendations of sup-ply-side economists appear not so m u c h to be wrong as to be inflexible tolocal conditions. There are occasions where the recommendations are ap-propriate, but, as a blanket solution to savings problems in developingcountries, they are deficient because they do not allow for the heterogeneityof developing country conditions.
ANNEX
Financial Repression in Developing Countries
Tables 1 and 2 document the extent of financial repression in a sample of devel-oping countries. The data in Table 2 were obtained as follows.
Real Rate of Return (r). This variable consisted of correcting the nominal rate of
©International Monetary Fund. Not for Redistribution
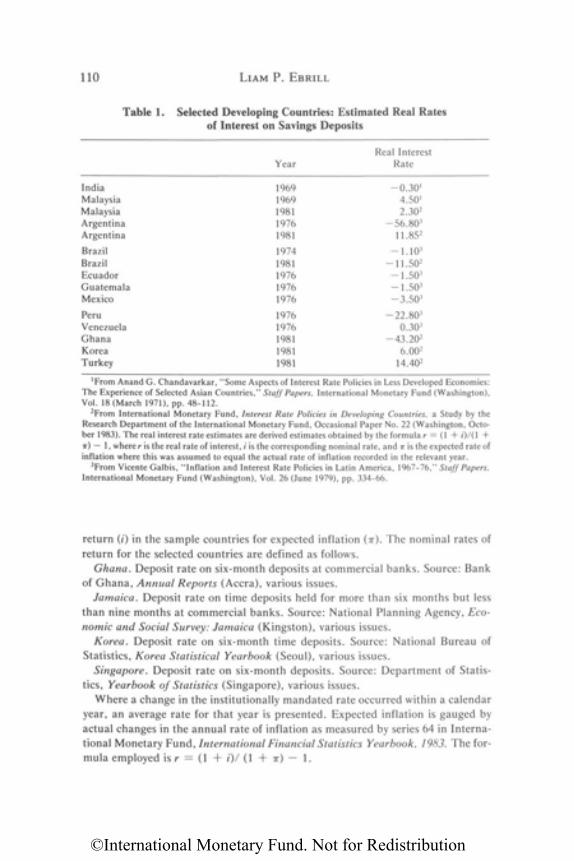
110 LIAM P. EBRILL
Table 1. Selected Developing Countries: Estimated Real Ratesof Interest on Savings Deposits
1From Anand G . Chandavarkar, " S o m e Aspects of Interest Rate Policies in Less Developed Economies:The Experience of Selected Asian Countries," Staff Papers, International Monetary Fund (Washington),Vol. 18 (March 1971), pp. 48-112.
2 From International Monetary Fund, Interest Rate Policies in Developing Countries, a Study by theResearch Department of the International Monetary Fund, Occasional Paper N o . 22 (Washington, Octo-ber 1983). The real interest rate estimates are derived estimates obtained by the formula r = (1 + i)/(1 +n) — 1, where r is the real rate of interest, i is the corresponding nominal rate, and n is the expected rate ofinflation where this was assumed to equal the actual rate of inflation recorded in the relevant year.
3 From Vicente Galbis, "Inflation and Interest Rate Policies in Latin America, 1967-76," Staff Papers,International Monetary Fund (Washington), Vol. 26 (June 1979), pp. 334-66.
return (i) in the sample countries for expected inflation (TT). The nominal rates ofreturn for the selected countries are defined as follows.
Ghana. Deposit rate on six-month deposits at commercial banks. Source: Bankof G h a n a , Annual Reports (Accra), various issues.
Jamaica. Deposit rate on time deposits held for more than six months but lessthan nine months at commercial banks. Source: National Planning Agency, Eco-nomic and Social Survey: Jamaica (Kingston), various issues.
Korea. Deposit rate on six-month time deposits. Source: National Bureau ofStatistics, Korea Statistical Yearbook (Seoul), various issues.
Singapore. Deposit rate on six-month deposits. Source: Department of Statis-tics, Yearbook of Statistics (Singapore), various issues.
Where a change in the institutionally mandated rate occurred within a calendaryear, an average rate for that year is presented. Expected inflation is gauged byactual changes in the annual rate of inflation as measured by series 64 in Interna-tional Monetary Fund, International Financial Statistics Yearbook, 1983. The for-mula employed is r — (1 + i)/ (1 + r) — 1.
IndiaMalaysiaMalaysiaArgentinaArgentina
BrazilBrazilEcuadorGuatemalaMexico
PeruVenezuelaGhanaKoreaTurkey
Year
196919691981197619811974198119761976197619761976198119811981
Real InterestRate
- 0 . 3 0 1
4.501
2.302
-56 .80 3
11.852
- 1 . 1 0 3
-11 .50 2
- 1 . 5 0 3
- 1 . 5 0 3
- 3 . 5 0 3
-22 .80 3
0.303
-43 .20 2
6.002
14.402
©International Monetary Fund. Not for Redistribution
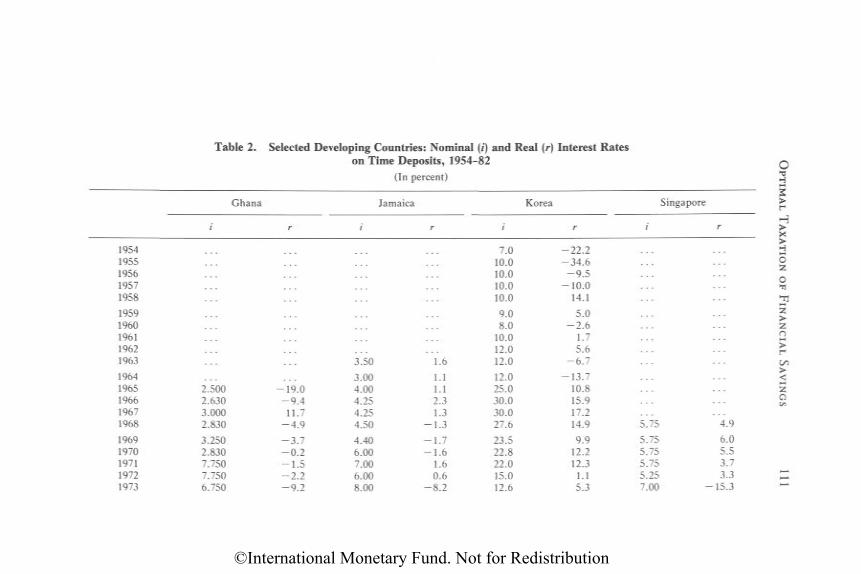
Table 2. Selected Developing Countries: Nominal (i) and Real (r) Interest Rateson Time Deposits, 1954-82
(In percent)
19541955195619571958
19591960196119621963
1964196519661967196819691970197119721973
Ghana
i
2.5002.6303.0002.830
3.2502.8307.7507.7506.750
r
- 1 9 . 0- 9 . 4
11.7- 4 . 9
- 3 . 7- 0 . 2- 1 . 5- 2 . 2- 9 . 2
Jamaica
i
3.50
3.004.004.254.254.50
4.406.007.006.008.00
r
1.6
1.11.12.31.3
- 1 . 3
- 1 . 7- 1 . 6
1.60.6
- 8 . 2
i
7.010.010.010.010.0
9.08.0
10.012.012.0
12.025.030.030.027.623.522.822.015.012.6
Korea
r
- 2 2 . 2- 3 4 . 6
- 9 . 5- 1 0 . 0
14.1
5.0- 2 . 6
1.75.6
- 6 . 7
- 1 3 . 710.815.917.214.9
9.912.212.3
1.15.3
i
5.75
5.755.755.755.257.00
Singapore
r
4.9
6.05.53.73.3
-15 .3
©International Monetary Fund. Not for Redistribution
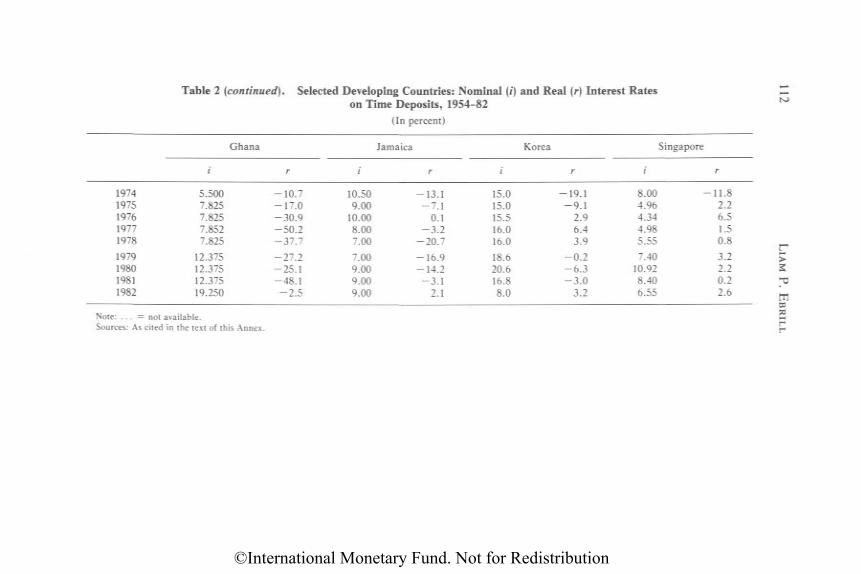
Table 2 (continued). Selected Developing Countries: Nominal (i) and Real (r) Interest Rateson Time Deposits, 1954-82
(In percent)
Note: . . . = not available.Sources: As cited in the text of this A n n e x .
19741975197619771978
1979198019811982
i
5.5007.8257.8257.8527.825
12.37512.37512.37519.250
Ghana
r
- 1 0 . 7- 1 7 . 0- 3 0 . 9- 5 0 . 2- 3 7 . 7
- 2 7 . 2-25 .1-48 .1
- 2 . 5
i
10.509.00
10.008.007.00
7.009.009.009.00
Jamaica
r
-13 .1- 7 . 1
0.1- 3 . 2
- 2 0 . 7
- 1 6 . 9- 1 4 . 2
- 3 . 12.1
i
15.015.015.516.016.0
18.620.616.88.0
Korea
r
-19 .1- 9 . 1
2.96.43.9
- 0 . 2- 6 . 3- 3 . 0
3.2
i
8.004.964.344.985.55
7.4010.928.406.55
Singapore
r
-11.82.26.51.50.8
3.22.20.22.6
©International Monetary Fund. Not for Redistribution
OPTIMAL TAXATION OF FINANCIAL SAVINGS 113
REFERENCES
Atkinson, A . B . , and A . Sandmo, "Welfare Implications of the Taxation of Sav-ings," Economic Journal (London), Vol. 90 (September 1980), pp. 529-49.
Atkinson, A . B . , and Joseph E . Stiglitz, Lectures on Public Economics (New York:McGraw-Hill, 1980).
Auerbach, Alan J., and Laurence J. Kotlikoff, "National Savings, Economic Wel-fare, and the Structure of Taxation," in Behavioral Simulation Methods inTax Policy Analysis, ed. by Martin Feldstein (Chicago: University of ChicagoPress, 1983).
Buffie, Edward F. , "Financial Repression, the N e w Structuralists, and Stabiliza-tion Policy in Semi-Industrialized Economies," Journal of Development Eco-nomics (Amsterdam), Vol. 14 (April 1984), pp. 305-22.
Chandavarkar, Anand G . , "Some Aspects of Interest Rate Policies in Less Devel-oped Economies: The Experience of Selected Asian Countries," Staff Papers,International Monetary Fund (Washington), Vol. 18 (March 1971), pp.48-112.
Datta, Gautam, and Parthasarathi Shome, "Social Security and Household Sav-ings: Asian Experience," Developing Economies (Tokyo), Vol. 19 (June1981), pp. 143-60.
Drazen, Allan, "The Optimal Rate of Inflation Revisited," Journal of MonetaryEconomics (Amsterdam), Vol. 5 (April 1979), pp. 231-48.
Ebrill, Liam P . , and S . M . Slutsky, "The Ramsey Rule, Production Efficiency, andIntermediate Goods" (New Orleans, Louisiana: Murphy Institute of PoliticalEconomy, Tulane University, 1983, mimeographed).
Feldstein, Martin, "The Welfare Cost of Capital Income Taxation," Journal ofPolitical Economy (Chicago), Vol. 86, N o . 2, Part 2 (April 1978), pp. S29-S51.
Fullerton, D o n , John B . Shoven, and John Whalley, "Replacing the U . S . IncomeTax with a Progressive Consumption Tax: A Sequenced General EquilibriumApproach," Journal of Public Economics (Amsterdam), Vol. 20 (February1983), pp. 3-23.
Galbis, Vicente, "Inflation and Interest Rate Policies in Latin America, 1967-76,"Staff Papers, International Monetary Fund (Washington), Vol. 26 (June1979), pp. 334-66.
Kaldor, Nicholas, An Expenditure Tax (London: Allen & Unwin, 1955).Leff, Nathaniel H . , and Kazuo Sato, "Macroeconomic Adjustment in Developing
Countries: Instability, Short-Run Growth, and External Dependency," Re-view of Economics and Statistics (Cambridge, Massachusetts), Vol. 62 (May1980), pp. 170-79.
McKinnon, Ronald I., Money and Capital in Economic Development (Washing-ton: Brookings Institution, 1973).
Mill, John Stuart, Principles of Political Economy, ed. by W . J . Ashley (London:Longmans, 1921).
Miracle, Marvin P. , Diane S. Miracle, and Laurie Cohen, "Informal Savings Mo-bilization in Africa," Economic Development and Cultural Change (Chi-cago), Vol. 28 (July 1980), pp. 701-24.
©International Monetary Fund. Not for Redistribution
114 LIAM P. EBRILL
M u n k , Knud Jorgen, "Optimal Taxation and Pure Profit," Scandinavian Journalof Economics (Stockholm), Vol. 80, N o . 1 (1978), pp. 1-19.
Neary, J.P., and K . W . S . Roberts, "The Theory of Household Behaviour UnderRationing," European Economic Review (Amsterdam), Vol. 13 (January1980), pp. 25-42.
Nellor, D . C . L . , "Tax Policy, Regulated Interest Rates, and Saving" (unpublished,International Monetary Fund, August 8, 1983).
Phelps, E d m u n d S., "Inflation in the Theory of Public Finance," Swedish Journalof Economics (Stockholm), Vol. 75 (March 1973), pp. 67-82.
Prest, A . R . , "Compulsory Lending Schemes," Staff Papers, International Mone-tary Fund (Washington), Vol. 16 (March 1969), pp. 27-52.
Sandmo, Agnar, "Optimal Taxation—An Introduction to the Literature," Journalof Public Economics (Amsterdam), Vol. 6 (July-August 1976), pp. 37-54.
Seidman, Laurence S., "Conversion to a Consumption Tax: The Transition in aLife-Cycle Growth Model," Journal of Political Economy (Chicago), Vol. 92(April 1984), pp. 247-67.
Shaw, Edward S., Financial Deepening in Economic Development (New York:Oxford University Press, 1973).
Shome, Parthasarathi, and Lyn Squire, "Alternative Mechanisms for FinancingSocial Security," World Bank Staff Working Paper No . 625 (Washington,1983).
Siegel, Jeremy J., "Notes on Optimal Taxation and the Optimal Rate of Inflation,"Journal of Monetary Economics (Amsterdam), Vol. 4 (April 1978), pp.297-305.
Summers, Lawrence H . , "Optimal Inflation Policy," Journal of Monetary Eco-nomics (Amsterdam), Vol. 7 (March 1981), pp. 175-94.
Tun Wai , U , " A Revisit to Interest Rates Outside the Organized Money Marketsof Underdeveloped Countries," Quarterly Review, Banca Nazionale delLavoro (Rome), Vol. 30 (September 1977), pp. 291-312.
van Wijnbergen, Sweder, "Stagflationary Effects of Monetary Stabilization Poli-cies: A Quantitative Analysis of South Korea," Journal of Development Eco-nomics (Amsterdam), Vol. 10 (April 1982), pp. 133-69.
-(1983a), "Credit Policy, Inflation and Growth in a Financially RepressedEconomy," Journal of Development Economics (Amsterdam), Vol. 13 (Au-gust-October 1983), pp. 45-65.
-(1983b), "Interest Rate Management in L D C ' s , " Journal of Monetary Eco-nomics (Amsterdam), Vol. 12 (September 1983), pp. 433-52.
Wanniski, Jude, The Way the World Works (New York: Simon and Schuster, rev.and updated ed., 1983).
Williamson, Jeffrey G . , " W h y D o Koreans Save 'So Little'?" Journal of Develop-ment Economics (Amsterdam), Vol. 6 (September 1979), pp. 343-62.
©International Monetary Fund. Not for Redistribution
Income Taxes and InvestmentS o m e Empirical Relationships for
Developing Countries
Liam P. Ebrill
There has been growing interest in the issue of h o w supply-side policiesmight be used to affect the growth rates of developing countries. In partic-ular, it has been suggested that taxes m a y well be powerful instruments ofdevelopment policy. Central to this position is the presumption that taxpolicy can influence the level of investment. In a neoclassical framework,this presumption is sustained by the argument that taxes can be employedto reduce the cost of capital where the latter is viewed as the principal de-terminant of the level of fixed business investment. This chapter is writtenin the tradition of that neoclassical analysis. As a preliminary to answeringthe question of h o w best to direct tax policy so as to stimulate investment,one objective of this chapter is to quantify the impact of existing tax sys-tems on the cost of capital in a selection of developing countries.
O f course, other (nonneoclassical) factors such as liquidity and accelera-tion effects and the availability of foreign exchange m a y be important de-terminants of investment behavior. Indeed, the available empirical evi-dence for developing countries indicates that these latter factors are ofgreat importance (for example, Billsborrow (1977), Sundararajan andThakur (1980), and T u n W a i and W o n g (1982)). Accordingly, in the em-pirical work presented below, some of these nonneoclassical elements areaccommodated. This permits an evaluation of the relative importance of avariety of factors in the determination of capital formation in developingcountries. Since there are a number of potential influences on investment,care is taken to ensure that the countries studied below are chosen with aview to covering a broad range of developing country experience.
This chapter first presents the theory behind the cost-of-capital ap-proach. Subsequent sections consider the relevance of this approach for
115
5
©International Monetary Fund. Not for Redistribution
116 LIAM P. EBRILL
developing countries, show h o w the cost of capital in these countries m a ybe sensitive to changes in anticipated inflation, discuss the estimates of thecost of capital for the selected sample of countries, and present cross-section regression results on the determination of investment levels in de-veloping countries.
I. The Theoretical Framework
Background to Cost-of-Capital Calculations
W e begin with some comments that concentrate on the salient featuresof all cost-of-capital calculations.
The most obvious tax influencing the cost of capital facing corporationsis the corporate income tax. The manner in which this tax exercises itsinfluence is complicated. Corporate taxes are levied on corporate incomeafter the allowable costs incurred in the process of generating revenue havebeen deducted. These costs are relatively easy to calculate as far as outlayson labor and raw materials are concerned. They are m u c h more difficult tocalculate, however, for capital inputs, because capital is a durable goodwhose rate of depreciation is difficult to gauge.
In m u c h of the earlier theoretical work it was assumed that corporatetaxes were, by and large, borne by capital.1 This assumption is accurate ifthe deduction accorded capital is inadequate. Proceeding from the as-sumption that capital bears corporate taxes, authors then analyzed thegeneral equilibrium implications of such taxes. This work, exemplified byHarberger (1962), was very important not only because of its specific con-clusions concerning the impact of the corporate income tax but also be-cause of its demonstration that general equilibrium effects of taxes couldand should be documented. (For a review of the original Harberger modeland more recent extensions, see M c L u r e (1975) and Ballentine andMcLure (1980).)
Recent literature, which concentrates less on the general equilibrium ef-fects of corporate taxes and more on the issue of how the corporate incometax actually affects the cost of capital, is more relevant for our purposes.2
Stiglitz (1973) points out that the effects of a statutory corporate incometax rate on the cost of capital cannot be viewed in isolation from otherelements of the tax system such as specific provisions of the corporate taxcode and the coexistence of the corporate tax with a personal income tax
1For an exception to this, consider Krzyzaniak and Musgrave (1963).2 Some important examples are Stiglitz (1973) and (1976), King (1975), and Flemming
(1976).
©International Monetary Fund. Not for Redistribution
INCOME TAXES AND INVESTMENT 117
structure. In general, a tax system which, between its interest deductibilityprovisions and its depreciation allowances permits a deduction whosepresent value is equal to the cost of a capital investment, is equivalent to atax system with an immediate write-off provision. This, in turn, impliesthat such a tax system would be equivalent to a pure profits tax in the sensethat, within the context of the model, no marginal conditions are affected.The ability to accommodate the full range of possible tax structures sug-gested by this literature is what makes the cost-of-capital formula specifiedbelow a useful device.
For institutional reasons, the effects of corporate income taxes are fre-quently complicated by inflation. There is a tendency in m a n y tax systemsto tax the nominal rather than the real income of capital. As a result, thetax system interacts with changes in the expected rate of inflation. For cor-porate taxes, this interaction is frequently the product of some combina-tion of the following factors: the taxation of nominal capital gains andnominal interest income, the use of depreciation allowances based on his-toric cost, the full deductibility of nominal interest expense, and the re-quirement that inventory valuations be determined on a first in, first out(FIFO) basis. In a general equilibrium context, this problem is c o m -pounded by the fact that tax systems rarely treat all capital assets in thesame manner . For example, owner-occupied and rental housing fre-quently receive a favorable tax treatment. In the case of the former, notonly is there no taxation of the implicit rental income that accrues to theowner-occupier but also some amount of mortgage interest payments andproperty tax payments can sometimes be deducted against other incometax liabilities. This implies that one of the effects of an increase in the rateof inflation is for investors to shift their d e m a n d from corporate equity toowner-occupied housing. Thus , while changes in the expected rate of infla-tion might not be expected to result in large changes in total investment,there could be significant changes in the composition of that aggregate.
A n y country's corporate tax system could be modified to accommodatethe effects of inflation. A c o m m o n solution is to allow some form of accel-erated depreciation allowances. Although such allowances will counter theeffect of a given expected rate of inflation, the system nonetheless remainssensitive to changes in inflation. These and other aspects of this generalproblem are discussed in Feldstein (1980a, 1980b, and 1980c), and Ebrilland Possen (1982a and 1982b). Again, the cost-of-capital formula derivedbelow is general enough to permit a consideration of these issues.
W h e n empirically estimating the incentive effects of taxation on busi-ness investment, deriving a cost-of-capital estimate is by no means the onlypossible route to take. A more traditional approach takes as its startingpoint the actual taxes paid as a proportion of income. The presumption is
©International Monetary Fund. Not for Redistribution
118 LIAM P. EBRILL
that marginal tax rates in a given industry are not far from the ratio ofactual taxes to capital income in that industry. This m a y not be too likelygiven that actual tax revenues m a y be the product of inframarginal super-normal profits due to the existence of noncompetitive market structures.Examples of well-known articles that rely on this approach are Harberger(1966), Shoven (1976), Fullerton and others (1981), and Fullerton andGordon (1983).
The use of cost-of-capital calculations is actually quite new (King andFullerton (1984)). Based on the neoclassical framework developed by Halland Jorgenson (1971), they have come to be used with increased regularity(e.g., Hall (1981), Jorgenson and Sullivan (1981)). The underlying meth-odology of the approach used below is to consider a "hypothetical project"of a dollar invested in a particular asset to be used by a representative firm.The firm is assumed to be maximizing its value to the shareholders. Giventhe specifics of the tax code, the cost-of-capital formula is then derivedpermitting an evaluation of the impact of various tax provisions at both thecorporate and the shareholder level on the actual cost of capital and,hence, on the incentive to invest.
Relevance of the Cost-of-CapitalA p p r o a c h to Developing Countries
The cost-of-capital calculation is concerned with the investment climatefacing corporations. That its usefulness is limited by the fact that the cor-porate sectors in developing countries are often small is not necessarilytrue. First, the corporate sector, although small, could well be importantat the margin (Bhagwati (1978)). Second, and more important, the cost ofcapital facing the corporate sector m a y serve as an excellent proxy for thecost of capital facing unincorporated businesses. It is sufficient for bothsectors to determine their tax bases in a similar fashion. For example, incountries where historic cost depreciation is the convention, that conven-tion will usually apply to both corporations and unincorporated busi-nesses, and, further, will be reflected in the cost-of-capital calculation.3
A related issue is that the cost-of-capital calculation presumes the exis-tence of competitive capital markets. The reality in m a n y developing coun-tries is m u c h different. Capital markets are commonly either nonexistent
3Note that the cost-of-capital calculation can similarly be viewed as a proxy for the cost ofcapital facing foreign investors. Although no account is taken of the h o m e (developed) coun-tries' costs of capital, the relative attractiveness of any developing country as a location forforeign investment can be derived from its relative cost-of-capital ranking. A caveat to this is,of course, the fact that there m a y be variations in the magnitude of nonfinancial restrictionsto foreign investment flows across developing countries.
©International Monetary Fund. Not for Redistribution
INCOME TAXES AND INVESTMENT 119
or fragmented. This does not, in and of itself, negate the relevance of thecost-of-capital calculation. Even in the absence of well-developed markets,the distinction between debt and equity continues to be maintained both inthe practice of financing marginal investments and in the specifics of m a n ydeveloping countries' tax codes. Interest payments, whether on a bankloan or a bond, are often deductible against corporate tax liabilities whileretained earnings are not. Further, capital gains, dividends, and interestpayments frequently receive separate treatments at the personal incometax level. However, this reservation does suggest that liquidity variablesm a y have an important role to play in determining investment flows.
Difficulties in the U s e of Cost-of-Capital Calculations
T h e cost-of-capital approach is not without its problems. First, aspointed out by Bradford and Fullerton (1981), since the method is con-cerned with expected future tax liabilities (statutory corporate and per-sonal income tax rates are normally assumed to remain constant), thechoice of a discount rate is critical. Second, effective tax rate estimates area function of the assumptions m a d e concerning h o w anticipated inflationaffects nominal interest rates. W e assume below that all gross nominal re-turns rise with the rate of anticipated inflation.4
T o these caveats raised by Bradford and Fullerton (1981), the most seri-ous of which is the second, might be added a few further considerations.The value of depreciation allowances to the representative firm is gaugedby the discrepancy, positive and/or negative, that exists over time betweenthe depreciation allowances and economic depreciation, all expressed inpresent value terms. It is traditional to assume that economic depreciationis exponential, though there is evidence to suggest that this is not so(Feldstein and Rothschild (1974)). T o the extent that economic deprecia-tion is not exponential, one is valuing depreciation allowances against thewrong benchmark. Nonetheless, w e will continue to assume that economicdepreciation follows a path of exponential decay since alternative assump-tions have their o w n difficulties.
Finally, a number of assumptions are needed to ensure that the cost-of-capital approach can be viewed as providing a general equilibrium frame-work in which a country's tax system can be evaluated. Implicitly, authors
4Although this m a y appear to be a partial equilibrium assumption, it is consistent with theempirical results reported for the United States by Feldstein and S u m m e r s (1978). The as-sumption is suspect when it is applied to those developing countries where interest rates areregulated. Indeed, as shall be seen below, the empirical results appear to be influenced bythis effect.
©International Monetary Fund. Not for Redistribution
120 L I A M P. E B R I L L
seem to assume a closed economy framework with fixed aggregate stocks ofcapital and labor. This allows one to take m a n y variables, such as the un-derlying marginal productivity of capital, as constant. O n e can also ignorethe effects of m a n y other taxes. For example, general taxes on gross outputm a y then be consistently presumed to be borne by capital and labor in theaggregate in line with their factor shares in gross domestic product ( G D P )and, accordingly, such taxes do not affect the allocation of investmentfunds between the corporate sector and other sectors of any given econ-o m y . This permits one to concentrate on the implications of the interac-tions between the personal and corporate tax systems of developing coun-tries. However, the assumptions necessary for this general equilibriuminterpretation to hold m a y not be realistic. The economies of m a n y devel-oping countries are quite open. W h e n this is combined with the c o m m o nadoption of overvalued exchange rates and a relatively heavy reliance ontrade taxes, the concomitant disequilibrium in the traded goods marketcan influence investment flows. Thus, as pointed out in the introduction,additional factors such as foreign exchange availability should be accom-modated.
It is clear, then, that cost-of-capital calculations should be interpretedwith great care. However, they continue to have the great advantage overalternative techniques of being based on a theoretical rather than on an adhoc foundation. Even if the absolute values of the calculations are subjectto error, they will still be useful if the rankings of tax effects across coun-tries are accurate, thereby affording some insight into the sensitivity of in-vestment to changes in the level of the cost of capital. Further, the tech-nique has the advantage of allowing calculation to be m a d e on the basis ofstatutory tax rates, where these are generally accessible. Given data avail-ability in developing countries, this advantage is particularly valuable.
Derivation of the Cost-of-Capital F o r m u l a
Before discussing the derivation of the cost-of-capital formula (equation(4), below), w e introduce the following s u m m a r y of the notation that willbe used throughout.
n = the anticipated rate of inflation;i — nominal rate of interest;b = rate of economic depreciation;s = real interest rate, net of tax;n = share of marginal investment financed by new issues;h = share of marginal investment financed by borrowing;T = corporate tax rate;
T* = corporate tax rate corrected for tax holidays;
©International Monetary Fund. Not for Redistribution
INCOME TAXES AND INVESTMENT 121
MG = effective tax rate on capital gains;MD = tax rate on distributions;
M = personal income tax rate;a = exponential rate, historic cost, depreciation allowances;
G = share of investment qualifying for initial investment allow-ance;
p ' = gross real cost of capital;p = net real cost of capital;
p* = net real cost of capital of "pioneer" firms;D(t) = nominal income stream in period t from an additional $1 of
investment; andV(t) = stock market value of a share of the "representative" firm in
period t.
As the procedure for deriving the actual formula for the cost of capital iswell k n o w n , it will only be summarized here. See Agell (1983) for a moredetailed discussion of the mechanics since his basic formula, with somemodifications, will be used below.
The cost-of-capital calculation is derived from a model of the marginalinvestment decision facing a corporate firm. The marginal investment, fi-nanced in period 0 at least in part by retained earnings, yields a dividendstream D(t) where
(1)
Thus, dividends net of corporate taxes are calculated by deducting pay-ments associated with debt and the issue of new shares from the gross yieldof a marginal investment and adding the tax value of depreciation allow-ances. T o elaborate, the term in (b — n)h reflects the fact that that portionof the investment which is debt-financed is amortized at a rate which re-flects the rate of economic depreciation, 6, adjusted for the anticipatedrate of inflation, n. Following Agell (1983), new share issues can be treatedwithout loss of generality as a special debt instrument. These new sharesmust yield for their shareholders a competitive net of personal income taxreturn, where this is gauged by (s + n)n/(1 — M D ) , and, as with regulardebt, their share in the marginal investment is amortized at a rate m e a -sured by (b — n)n.
©International Monetary Fund. Not for Redistribution
122 L I A M P. EBRILL
This dividend stream is reflected in the value of shares, V(0), as follows:
(2)
where this expression is a solution to the differential equation resultingfrom the equilibrium condition that the rate of return required by equityholders equals the s u m of net of tax dividend payments and capital gains.
T h e firm is assumed to be maximizing its value to its existing equityholders. Given that assumption, the capital market will be in equilibriumif, at the margin, the equity holders are indifferent as to whether or not themarginal investment is undertaken; that is, equity holders will be indiffer-ent between having the firm pay out dividends and having it m a k e the m a r -ginal investment. This equilibrium condition can be expressed as follows:
(3)
that is, the forgone dividend payment, net of personal income tax, musiequal the capital gain, net of capital gains tax, associated with the invest-ment. Substituting equations (1) and (2) into (3) yields
(4)
where the major differences between this expression and Agell's corre-sponding equation (5) are (1) the fact that interest deductibility of debtagainst corporate tax liabilities is permitted by all the countries selectedbelow is already incorporated in the formula and (2) it is assumed from theoutset that no relative price changes take place. This last assumption im-plies that the anticipated rate of general inflation is equal to the expectedrate of change in the price level of capital goods.
Having introduced the cost-of-capital calculation and having discussedthe caveats relevant to its use, w e n o w proceed to its estimation and evalua-tion for a sample of developing countries.
©International Monetary Fund. Not for Redistribution
I N C O M E T A X E S A N D I N V E S T M E N T 123
II. Empirical Results
The sample used in this chapter consists of 31 countries chosen with aview to covering a broad range of developing country experience.
Derivation of Cost-of-Capital Estimates
The parameters in the cost-of-capital formula given above are of threedifferent types, namely,
(1) macrovariables (n, i, s , ) , which are exogenous to the representativefirm;
(2) microvariables (b, n, h), which are specific to the firm; and(3) tax variables (T, T*, MG, MD, M , a, G).
Consider the specific parameter values for each of these categories inturn, noting that the values for the first two categories are chosen not onlybecause they are reasonable in their o w n right but also because they areconsistent with Agell's (1983) results.
The nominal rate of interest is presumed to rise pari passu with the rateof inflation (the Fisher assumption) so that
i = ir + n, (5)
where ir is the real rate of interest.5 The real rate of interest is set at2 percent a year. Further, the shareholder's required real rate of return, s,is also equal to the real rate of interest, implying s = 2 percent.
Turning to a consideration of the microvariables, it is assumed that therate of economic depreciation m a y be set equal to 0.1225. This estimate isthe same as that derived by Hulten and Wykoff (1981) for "general indus-trial equipment" using U . S . data. Data availability precludes obtainingaccurate estimates of n, the share of new financing in the marginal invest-ment, and h, the analogous share for debt. Accordingly, in line withAgell's (1983) benchmark case, n = 0.10 and h = 0.30 are the chosenvalues.
Finally, a few comments on the most important tax parameters are inorder. The corporate tax rate corrected for tax holidays, T*, is based on the
5 Taken at face value, this assumption would appear to be violated in those countries whereinterest rates are institutionally fixed at an artificially low rate. However, to the extent thatthe resultant financial disintermediation results in the creation of secondary financial m a r -kets, such as the curb markets of Korea, this problem is ameliorated—the interest rates insuch markets are likely to be responsive to changes in inflation. Further, as shall be seenbelow, the regression results will be altered in an attempt to accommodate those cases wherethe assumption is most likely to be seriously in error.
©International Monetary Fund. Not for Redistribution
124 L I A M P. E B R I L L
most generous tax holiday available. There is no guarantee that theseterms are available to all start-up firms. The method for correcting thestatutory tax rate for tax holidays is presented in Agell (1983). Some of thecases provide for partial tax holidays. The determination of the correctedcorporate tax rates for two of these cases is presented in Annex I of thischapter.
The capital gains tax rates are effective tax rates—the statutory tax rateshave been corrected for the fact that capital gains are levied on a realiza-tion rather than an accrual basis. Account is also taken of the fact thatsome countries have separate deductions against capital gains liabilities.
As in Agell (1983), the personal income tax rate on dividends is based onthe marginal tax rate of the typical investor where the investor is assumedto have a taxable income equal to ten times the per capita 1981 G D P of thecountry under consideration. Finally, where necessary, the straight-linedepreciation allowance formulas have been converted to an equivalent de-clining-balance formula characterized by the value of the parameter a.6
Consideration of Estimates for Sample
In his study, Agell (1983) concluded that the tax structures of the Asso-ciation of South East Asian Nations ( A S E A N ) countries were not a majorsource of investment disincentives. Does this conclusion hold true for themore extended sample employed here? A n answer to this question can befound in Table 1 in which are presented, for the complete sample of 31countries, estimates of the cost of capital, p, at a zero rate of inflation; theanticipated rate of inflation, n; and the cost of capital both for ongoingfirms, p, and pioneer firms, p*, at these anticipated rates of inflation. Thecost-of-capital estimates are derived along the lines laid out in the previoussection.7 The expected rate of inflation is estimated by taking an annualaverage of the actual rate of inflation experienced by the countries over theperiod 1970-80. This is an admittedly crude measure, particularly so given
6Since some countries index their depreciation allowances, the cost-of-capital formula issomewhat altered. The manner of the alteration is described in Annex I of this chapter.
7 A n important reservation to these estimates should be noted, namely, that they do notincorporate m a n y specific tax incentives such as regional and industry-specific grants. Forthese and other reasons mentioned above, too m u c h stock should not be placed in the abso-lute values of the estimates. Rather, it is hoped that the ranking implied by the calculations isaccurate. The data sources for the tax variables were the relevant country issues of PriceWaterhouse and Company ' s Doing Business series and the relevant supplements of the Inter-national Bureau of Fiscal Documentation. The relevant tax parameters were those in force inthe early 1980s.
©International Monetary Fund. Not for Redistribution
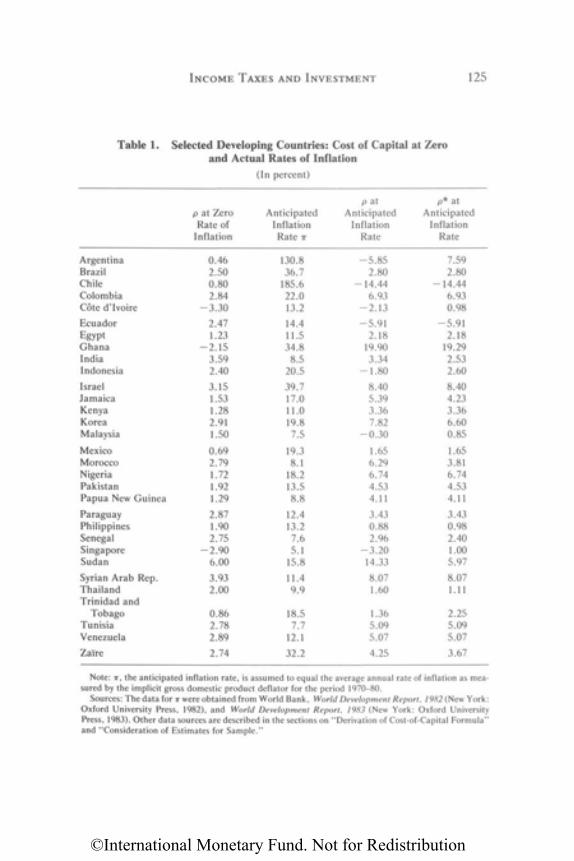
INCOME TAXES AND INVESTMENT 125
Table 1. Selected Developing Countries: Cost of Capital at Zeroand Actual Rates of Inflation
(In percent)
Note: n, the anticipated inflation rate, is assumed to equal the average annual rate of inflation as m e a -sured by the implicit gross domestic product deflator for the period 1970-80.
Sources: The data for n were obtained from World Bank, World Development Report, 1982 (New York:Oxford University Press, 1982), and World Development Report, 1983 (New York: Oxford UniversityPress, 1983). Other data sources are described in the sections on "Derivation of Cost-of-Capital Formula"and "Consideration of Estimates for Sample."
ArgentinaBrazilChileColombiaCote d'IvoireEcuadorEgyptGhanaIndiaIndonesia
IsraelJamaicaKenyaKoreaMalaysia
MexicoMoroccoNigeriaPakistanPapua N e w Guinea
ParaguayPhilippinesSenegalSingaporeSudan
Syrian Arab Rep.ThailandTrinidad and
TobagoTunisiaVenezuela
Zaire
p at ZeroRate of
Inflation
0.462.500.802.84
- 3 . 3 0
2.471.23
- 2 . 1 53.592.40
3.151.531.282.911.50
0.692.791.721.921.29
2.871.902.75
- 2 . 9 06.00
3.932.00
0.862.782.89
2.74
AnticipatedInflationRate r
130.836.7
185.622.013.2
14.411.534.88.5
20.5
39.717.011.019.87.5
19.38.1
18.213.58.8
12.413.27.65.1
15.8
11.49.9
18.57.7
12.1
32.2
p atAnticipated
InflationRate
- 5 . 8 52.80
- 1 4 . 4 46.93
- 2 . 1 3
- 5 . 9 12.18
19.903.34
- 1 . 8 0
8.405.393.367.82
- 0 . 3 0
1.656.296.744.534.11
3.430.882.96
- 3 . 2 014.33
8.071.60
1.365.095.07
4.25
p* atAnticipated
InflationRate
7.592.80
- 1 4 . 4 46.930.98
- 5 . 9 12.18
19.292.532.60
8.404.233.366.600.85
1.653.816.744.534.11
3.430.982.401.005.97
8.071.11
2.255.095.07
3.67
©International Monetary Fund. Not for Redistribution
126 L I A M P. E B R I L L
the possibility that price controls m a y have been in force in some of thecountries.
The conclusion must be that, contrary to Agell, the actual cost of capitalfacing some countries in this sample is such that the interaction betweentheir respective tax systems and the rate of inflation is the source of invest-ment disincentives—any value greater than 2 percent implies a positive taxwedge. For several countries, the disincentive effects are pronounced.
A comparison of the cost of capital calculated at the anticipated rates ofinflation with the corresponding cost of capital at a zero rate of inflationshows that the estimates are sensitive to changes in inflation. The latter setof estimates also demonstrate that, while many countries m a y have a highnominal rate of corporate income tax, the deductions are such as to leavethe cost of capital relatively unaffected at low rates of inflation. Indeed, thelarge number of values less than two imply that the tax system in manycountries subsidizes the cost of investment at low inflation rates. The gen-erous deductions implied by this outcome m a y have been a response to thehigher actual rates of inflation experienced by these countries.
Consider the final column of Table 1, which presents estimates of thecost of capital for start-up or "pioneer" investments. A n interesting fea-ture is that for some countries, tax holidays appear to increase the cost ofcapital. This is not as strange as it first appears. First, if the tax system issuch that, in the absence of tax holidays, the tax wedge is negative, then atax holiday tends to remove this implicit subsidy. This effect can also beobserved in Agell's work. Second, the effective tax rate on corporate capi-tal is the product of an interaction between the corporate and personalincome taxes. In some cases, one observes that taxes at the corporate leveltend to be very low, even negative, due to accelerated depreciation allow-ances, while the treatment of capital income at the personal level involveshigh tax rates. As a result, a tax holiday at the corporate level implies anincrease in the tax burden on corporate capital.
However, while the calculations imply that there are circumstances un-der which a tax holiday can increase the tax burden, a couple of reserva-tions should be noted. First, as mentioned in an earlier section, the cost-of-capital calculation is set in a world where the representative firm ispresumed to know its future tax liabilities with certainty. In the real world,notwithstanding the fact that in present value terms it implies an increasein taxes, a firm might well opt for the certainty of a tax benefit now. Sec-ond, and more important, the cost-of-capital formula is symmetric—if theincentives are sufficiently great, it requires the government to pay the firm.In reality, most tax systems do not m a k e such payments. This reduces thepotential mentioned above for a tax holiday to result in an increase in thecost of capital.
©International Monetary Fund. Not for Redistribution
I N C O M E TAXES A N D INVESTMENT 127
Even with these reservations, the results in Table 1 are still of interest.They imply that tax holidays do not have a major impact on the cost ofcapital. This surprising result appears to be due to the fact that most cor-porate taxes have generous allowances built into them. Another way of ex-pressing this is that the cost of capital is not very responsive to changes inthe corporate tax rate. A similar lack of sensitivity occurs when other taxparameters are altered. W h e r e sensitivity does exist it is in the specificationof the special provisions. In particular, the interaction between inflationand the historic cost depreciation and investment allowances is of criticalimportance. Indeed, the only possibility for a negative cost of capital ariseswhen depreciation and investment allowances are so generous as to providea subsidy. In contrast, reduction of the tax parameters merely reduces thedegree to which corporate capital is taxed. It is fortunate that the source ofthe sensitivity lies in these allowances since their value can be determinedwith a fair degree of accuracy for any given class of capital equipment.
Regression Results
In this section, regression results based on the cross-section of countriesin the sample are presented so as to cast some light on the quantitativeimpact of the cost of capital on investment flows in the sample of develop-ing countries. Given obvious data inadequacies and difficulties in quanti-fying nontax determinants of investment, too m u c h weight should not beassigned to these results. Since the results are based on cross-section datadrawn from a range of countries rather than on time-series data for indi-vidual countries, care must be taken in interpreting the coefficients. It isassumed here that the observations can be interpreted as reflecting the be-havior of a representative country; that is, were they all to face the sameeconomic circumstances (e.g., the same cost of capital), every countrywould exhibit exactly the same response (e.g., the same level of invest-ment). Accordingly, all differences in investment behavior across the sam-ple of countries m a y be ascribed to differences in their economic circum-stances, and the coefficients are, therefore, properly interpreted asgauging long-term effects.
T h e share of gross domestic investment (GDI) in GDP for 1980, desig-nated as GDI/GDP, was selected as a dependent variable, a choice dic-tated by data availability. Unfortunately, the variable includes a numberof extraneous components. For example, it includes government invest-ment. This component is unlikely to be responsive to market-determinedrates of return. It m a y be possible to assume that it does not vary systemati-cally across the sample. O n the basis of the available empirical evidence,this m a y not be an overly strong assumption. For example, Sundararajan
©International Monetary Fund. Not for Redistribution
128 L I A M P. E B R I L L
and Thakur (1980) find evidence of some short-term crowding out betweenpublic and private investment for the case of India, while for Korea theyfind these two components to be strong complements. T u n W a i and W o n g(1982), testing data drawn from a number of countries, find evidence offinancial crowding out for some (e.g., Malaysia and Mexico) but not to thesame degree for others.
In an attempt to circumvent this potential problem, estimates of centralgovernment fixed capital formation8 were chosen as a proxy for govern-ment investment and were netted out of GDI. The resultant alternativedependent variable is referred to as GDIP/GDP.9
The dependent variable also includes noncorporate private investmentand residential housing. It was argued above that the former poses no seri-ous problems as long as the tax bases for the corporate and noncorporatesectors are similarly defined in the sample countries. The latter, however,could weaken the link between the dependent variable and the cost of capi-tal. Thus, to the extent that the increase in the cost of capital is induced byincreases in the expected rate of inflation, investors will have an incentiveto substitute assets such as owner-occupied housing for corporate assets.Accordingly, if the cost of capital is an insignificant variable in the regres-sions below, it m a y be due to this effect. As a final comment on the specifi-cation of this variable, it should be noted that the conventional theoreticaljustification for employing it—rather than a measure of the private capitalstock—comes from the presumed existence of adjustment costs in attain-ing a desired level of the capital stock (Lucas (1967), Gould (1968),Treadway (1969)).
Turning to a consideration of the independent variables, two alternativeestimates of the cost of capital can be used. The first of these, designated p,gives estimates of the cost of capital faced by ongoing firms and is pre-sented in Table 1, above. The second, for which no explicit estimates arepresented below, substitutes the cost of capital faced by "pioneer" firmswhere such provisions exist.
A s mentioned at the beginning of this chapter, other variables could in-fluence the level of investment activity in developing countries. A few prox-ies for these variables are also included as additional regressors. The an-nual average real growth rate of exports over the period 1970-80,designated as A X , is included as a proxy for foreign exchange availabil-ity—the more rapid the growth rate, the more likely will funds be availablefor investment. Note that, to the extent that this is the correct interpreta-
8Note that this does not include capital formation by public enterprises which m a y respondto changes in the cost of capital and should, therefore, be part of the dependent variable.
9 The data used in the regressions are presented in Annex II of this chapter.
©International Monetary Fund. Not for Redistribution
I N C O M E T A X E S A N D I N V E S T M E N T 129
tion of the role of this variable, it is measuring a supply rather than a de-m a n d effect. Accordingly, it must be argued that the single equation re-gression results presented below represent a reduced form. Note furtherthat this variable can also be interpreted as an accelerator variable. A moreaccurate proxy for accelerator effects is provided by the annual averagegrowth rate in GDP (AGDP).
As mentioned above, the cost-of-capital estimates presume that nominalinterest rates rise in line with inflation. As pointed out earlier, this is notalways so. T h e rigidity of nominal interest rates in reality, which can beignored if inflation rates are not too high, m a y well be a problem for someof the countries in the sample, notably, Argentina and Chile, both of whichexperienced annual inflation rates well in excess of 100 percent. The largeand negative cost-of-capital estimates recorded for both of these coun-tries—suggesting a positive correlation between inflation and invest-ment—could be very misleading. Indeed, there m a y be an independentnegative correlation between inflation and investment. As M c K i n n o n(1973) observes, the capital market in these countries m a y be in disequilib-rium. As a result of pursuing low interest rate policies, investment fundsare rationed with realized investment being less than desired. As a practi-cal matter, this financial repression tends to be more severe the higher therate of inflation (Galbis (1979)). Accordingly, this suggests that the antici-pated rate of inflation, n, m a y act as a useful proxy for the presence orabsence of financial disintermediation and, thus, for the availability of in-vestable funds.
O n the matter of the available supply of investable funds, there is a fre-quently expressed concern that the government sector might "crowd out"private investors. T o accommodate this possibility, an additional regressoris defined, namely, the current account balance (without grants), desig-nated hereafter as CAB. This specification of a crowding out variable waschosen rather than some measure of an overall surplus or deficit on thepresumption that borrowing on the capital account is productively in-vested, where this investment, as suggested above, is assumed to be neithera substitute nor a complement for private investment.
Since the share of gross domestic investment in GDP can be expected tobe influenced by the level of economic development, the 1980 per capitagross national product, Y, of the sample of countries is included as anindependent variable. The final independent variable is the share of fuels,minerals, and metals in merchandise exports ( M m ) . This variable is aproxy for the natural resource endowments of the countries under consid-eration where the relative abundance of these endowments might be ex-pected to influence the investment climate, particularly from the point ofview of foreign investors.
©International Monetary Fund. Not for Redistribution
130 L I A M P. E B R I L L
W e turn now to consider a selection of the more important regressionresults.
GDI/ GDP = 14.66 - 0.32p + 1.48AGDP + 0.002y - 0.02Min.(6.6) (-2.3) (5.2) (2.8) (-0.8) (6)
R 2 = 0.619 F = 13.6 N = 31
The regression is run in linear form. The t-ratios are presented in paren-theses below the relevant coefficient. R 2 refers to the adjusted R squared,F to the F ratio, and N to the n u m b e r of observations.
In this regression, the signs of most of the variables are as expected. Theaccelerator variable, AGDP, is positive and significant. Further, Y, percapita gross national product has a positive and significant coefficient im-plying that one cannot reject the plausible hypothesis that the more devel-oped the country, the greater the share of GDP devoted to GDI. The signof the coefficient of the share of natural resources in exports is not signifi-cant given the value of the t-ratio for that variable.
The coefficient of the cost-of-capital variable is negative as predicted,and significant. It is not possible to reject the hypothesis that the interac-tion between the tax systems of these countries and their anticipated ratesof inflation can influence the level of investment. The elasticity value, cal-culated at the means of the variables, is —0.044. Such a value implies, forexample, that if the cost of capital were increased from 3.0 to 4.0, a33 percent increase, the share of GDI in GDP would fall by 1.5 percent—asubstantial effect.10
In view of the potential for the existence of financial repression in someof the countries in the sample, consider the outcome if n, the anticipatedrate of inflation, is introduced as a regressor. Specifically, consider:
GDI/GDP = 18.14 - 0.53p + 1 . 0 9 A G D P + 0.002Y - 0 . 0 6 8 N .(7.29)(-3.49) (3.65) (3.35) (-2.54) (7)
R 2 = 0.686 F = 17.4 N = 31
It appears from this equation that inflation has a significant and strongnegative impact on the level of investment (the value of the elasticity is— 0.039, which is large given the potential for large changes in inflation).
10Unfortunately, there is no obvious way of expressing this elasticity in terms of changes inthe underlying parameters such as a change in the corporate tax rate, T. This is because theimpact is country-specific, depending on other specifics such as depreciation allowances. T osee this, consider equation (4). T h e derivative of this equation with respect to T is ambigu-ous—if the tax system of a given country subsidizes investment through its special provisions,a reduction in the corporate tax rate could increase the cost of capital.
©International Monetary Fund. Not for Redistribution
INCOME TAXES AND INVESTMENT 131
Note, further, that the cost-of-capital variable is still significant but that itscoefficient has increased significantly in magnitude, suggesting that anyelasticity estimates should be treated with caution.11
Consider the outcome if GDIP/GDP, the share of gross investment netof gross governmental fixed capital formation in GDP, is the dependentvariable.12 The analogous regression equation to equation (7) above is
GDIP/GDP = 13.24 - 0.60p + 1.20AGDP + 0.002Y - 0 . 0 6 1 N .(4.60)(-3.37) (3.46) (3.10) ( -1 .96) (8)
R2 = 0.654 F = 15.2 N = 31
It is clear that, at least for this set of regressors, the change in the depen-dent variable makes little difference.
Both of the above regression equations are potentially affected by simul-taneous equation bias. Thus, it could be argued that the greater the shareof GDI in GDP, the more rapid the growth rate of GDP. T o alleviate thestatistical problems posed by this chain, AGDP can be replaced with AXwhere the latter variable, as was pointed out above, is a proxy for bothaccelerator effects and foreign exchange constraints. Also, to test for thepossibility that governments m a y be crowding out private investors, CAB,the governmental current account balance of the countries in the sample,is also introduced into the regression equation. The results correspondingto equations (7) and (8) are, respectively:
GDI/GDP = 22.85 - 0.48p + 0 . 4 3 A X + 0.002Y(12.99)(-2.75) (3.30) (3.21)
- O . 1 1 N + 0.13 CAB( -4 .47) (0.94) (9)
R 2 = 0.657 F = 12.50 N = 31
1 1The volatility of the regression coefficients indicates that the independent variables m a ybe multicollinear. Indeed, as can be seen from the correlation matrix presented in Table 3 inAnnex II, the simple correlation between p and n is —0.51, which is consistent with thechange in the coefficient value of p w h e n n is included in the regression (Rao and Miller(1971)). A s an aside, note that the negative correlation between p and n, a cross-sectionresult, is not inconsistent with the fact that, within any given country, the cost of capital tendsto increase with increases in anticipated inflation. A s can be seen from Table 3, the positivecorrelation is due to the inclusion of Argentina and Chile whose cases, as pointed out on page129, are extreme.
12Depending on the criteria used by public enterprises in their investment decisions, itmight have been preferable to net out the gross investment by public companies. Lack of dataprecluded this possibility.
©International Monetary Fund. Not for Redistribution
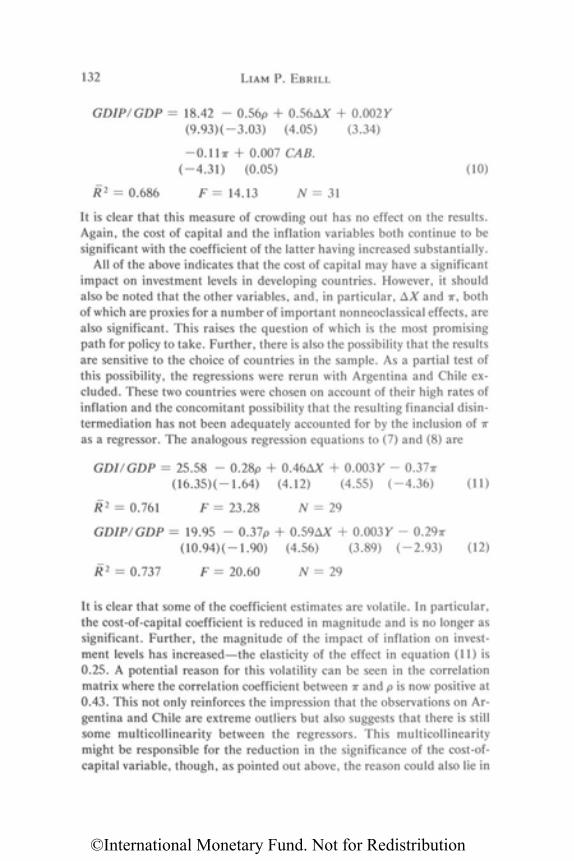
132 L I A M P. EBRILL
GDIP/GDP = 18.42 - 0.56p + 0.56AX + 0.002Y(9.93)(-3.03) (4.05) (3.34)
- O . 1 1 N + 0.007 CAB.(-4.31) (0.05) (10)
R 2 = 0.686 F = 14.13 N = 31
It is clear that this measure of crowding out has no effect on the results.Again, the cost of capital and the inflation variables both continue to besignificant with the coefficient of the latter having increased substantially.
All of the above indicates that the cost of capital m a y have a significantimpact on investment levels in developing countries. However, it shouldalso be noted that the other variables, and, in particular, AX and n, bothof which are proxies for a number of important nonneoclassical effects, arealso significant. This raises the question of which is the most promisingpath for policy to take. Further, there is also the possibility that the resultsare sensitive to the choice of countries in the sample. As a partial test ofthis possibility, the regressions were rerun with Argentina and Chile ex-cluded. These two countries were chosen on account of their high rates ofinflation and the concomitant possibility that the resulting financial disin-termediation has not been adequately accounted for by the inclusion of nas a regressor. The analogous regression equations to (7) and (8) are
GDI/GDP = 25.58 - 0.28p + 0 . 4 6 A X + 0.003Y - 0 . 3 7 N
(16.35)(-1.64) (4.12) (4.55) ( -4 .36) (11)
R 2 = 0.761 F = 23.28 N = 29
GDIP/GDP = 19.95 - 0.37p + 0 . 5 9 A X + 0.003Y - 0 . 2 9 N(10.94)(-1.90) (4.56) (3.89) ( -2 .93) (12)
R2 = 0.737 F = 20.60 N = 29
It is clear that some of the coefficient estimates are volatile. In particular,the cost-of-capital coefficient is reduced in magnitude and is no longer assignificant. Further, the magnitude of the impact of inflation on invest-ment levels has increased—the elasticity of the effect in equation (11) is0.25. A potential reason for this volatility can be seen in the correlationmatrix where the correlation coefficient between n and p is n o w positive at0.43. This not only reinforces the impression that the observations on Ar-gentina and Chile are extreme outliers but also suggests that there is stillsome multicollinearity between the regressors. This multicollinearitymight be responsible for the reduction in the significance of the cost-of-capital variable, though, as pointed out above, the reason could also lie in
©International Monetary Fund. Not for Redistribution
I N C O M E T A X E S A N D I N V E S T M E N T 133
the fact that the dependent variable includes investments m a d e in noncor-porate assets such as owner-occupied housing. Be that as it m a y , theseresults should temper any strong policy conclusions concerning the effec-tiveness of tax reform proposals. Indeed, they suggest, if anything, thatmore attention should be paid to the role of inflation since increases inanticipated inflation appear to affect adversely the level of investment via anumber of channels; that is, not only do increases in anticipated inflationinteract with the tax system to increase the cost of capital but they m a y alsodirectly affect the level of investment by inducing financial disintermedia-tion. In addition, given the significance of AX, the growth rate of exports,the results also suggest that policymakers should concentrate on alleviat-ing distortions which might result in foreign exchange shortages.
Finally, it should be noted that the regressions were rerun, replacing pwith p*. The results, not presented here, suggested a weaker link betweenthe cost of capital and investment levels. This is not surprising given someof the assumptions underlying the specification of p* (see p. 126, above).
III. Conclusions
The tentative nature of the results must be emphasized. The regressionsare based on cross-sectional data, whereas tax reform proposals for anygiven country should more properly be based on empirical work (time se-ries) drawn from that country. However, even given these reservations, theresults are suggestive. Thus , it could well be the case that to concentrate ontaxes as the primary source of economic inefficiency in a developing coun-try's economic system is too narrow. The regression results indicate thatinvestment levels are influenced by a number of other factors and, in par-ticular, by the rate of inflation and the availability of foreign exchange asgauged by AX. This lends support to the approach adopted in WorldBank's World Development Report, 1983, where it is argued that if onetakes a broad definition of price distortions, then one observes a strongnegative correlation between this index and the economic performance ofdeveloping countries. Further, if concern should properly be directed atthis broader measure, then, as pointed out by Tanzi (1982), given the na-ture of the political process in m a n y developing countries, radical reformm a y not be easy to implement; that is, not only are the simplistic tax re-form proposals of the pure supply-side approach inadequate but the ap-propriate reform proposals m a y not be politically feasible. For example,given the underdeveloped institutional framework in place in m a n y devel-oping countries, the admonition that they reduce their rates of inflationsharply m a y be extremely difficult to implement.
Even though this all suggests that supply-side based tax reform pro-
©International Monetary Fund. Not for Redistribution
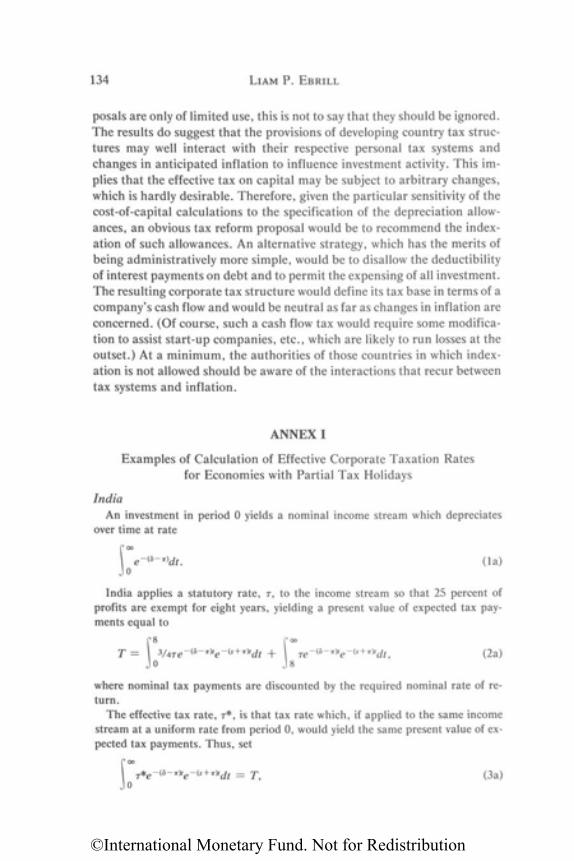
134 L I A M P. EBRILL
posals are only of limited use, this is not to say that they should be ignored.T h e results do suggest that the provisions of developing country tax struc-tures m a y well interact with their respective personal tax systems andchanges in anticipated inflation to influence investment activity. This im-plies that the effective tax on capital m a y be subject to arbitrary changes,which is hardly desirable. Therefore, given the particular sensitivity of thecost-of-capital calculations to the specification of the depreciation allow-ances, an obvious tax reform proposal would be to r e c o m m e n d the index-ation of such allowances. A n alternative strategy, which has the merits ofbeing administratively m o r e simple, would be to disallow the deductibilityof interest payments on debt and to permit the expensing of all investment.T h e resulting corporate tax structure would define its tax base in terms of acompany's cash flow and would be neutral as far as changes in inflation areconcerned. (Of course, such a cash flow tax would require some modifica-tion to assist start-up companies, etc., which are likely to run losses at theoutset.) At a m i n i m u m , the authorities of those countries in which index-ation is not allowed should be aware of the interactions that recur betweentax systems and inflation.
ANNEX I
Examples of Calculation of Effective Corporate Taxation Ratesfor Economies with Partial Tax Holidays
IndiaA n investment in period 0 yields a nominal income stream which depreciates
over time at rate
(la)
India applies a statutory rate, T, to the income stream so that 25 percent ofprofits are exempt for eight years, yielding a present value of expected tax pay-ments equal to
(2a)
where nominal tax payments are discounted by the required nominal rate of re-turn.
The effective tax rate, T*, is that tax rate which, if applied to the same incomestream at a uniform rate from period 0, would yield the same present value of ex-pected tax payments. Thus, set
(3a)
©International Monetary Fund. Not for Redistribution
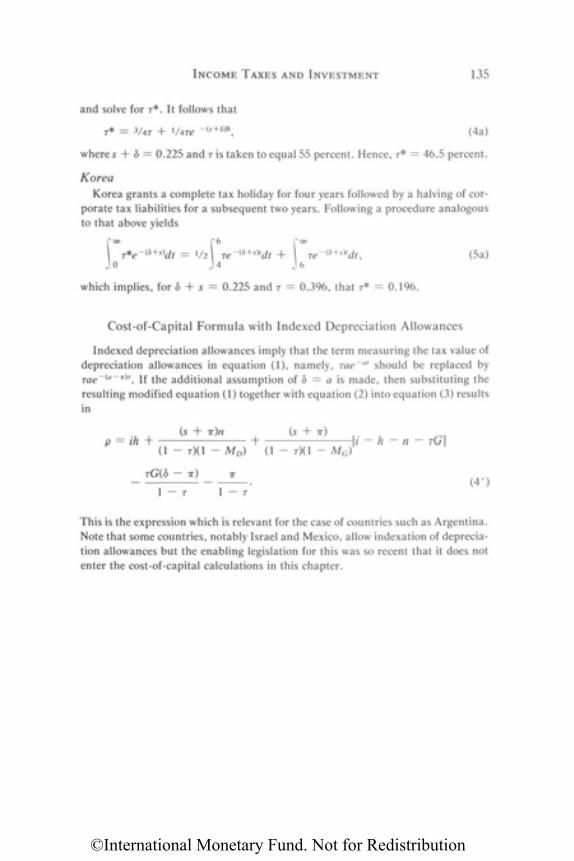
INCOME TAXES AND INVESTMENT 135
and solve for r*. It follows that
(4a)
where s + b = 0.225 and T is taken to equal 55 percent. Hence, T* = 46.5 percent.
KoreaKorea grants a complete tax holiday for four years followed by a halving of cor-
porate tax liabilities for a subsequent two years. Following a procedure analogousto that above yields
(5a)
which implies, for b + s = 0.225 and T = 0.396, that T* = 0.196.
Cost-of-Capital Formula with Indexed Depreciation Allowances
Indexed depreciation allowances imply that the term measuring the tax value ofdepreciation allowances in equation (1), namely, T a e - a t should be replaced byT a e - ( a - n ) T . If the additional assumption of b = a is m a d e , then substituting theresulting modified equation (1) together with equation (2) into equation (3) resultsin
(4')
This is the expression which is relevant for the case of countries such as Argentina.Note that some countries, notably Israel and Mexico, allow indexation of deprecia-tion allowances but the enabling legislation for this was so recent that it does notenter the cost-of-capital calculations in this chapter.
©International Monetary Fund. Not for Redistribution
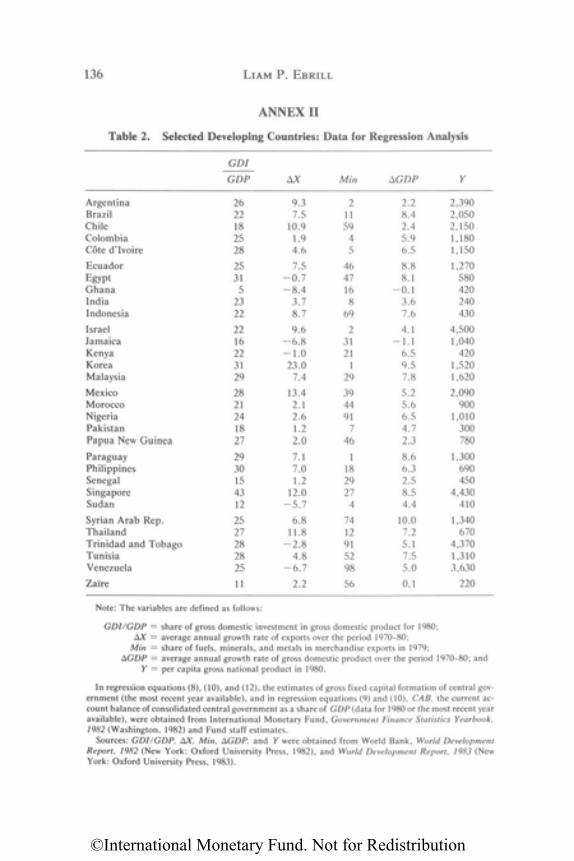
136 L I A M P. EBRILL
A N N E X I I
Table 2. Selected Developing Countries: Data for Regression Analysis
Note: The variables are defined as follows:
GDI/GDP = share of gross domestic investment in gross domestic product for 1980;AX = average annual growth rate of exports over the period 1970-80;
Min = share of fuels, minerals, and metals in merchandise exports in 1979;AGDP = average annual growth rate of gross domestic product over the period 1970-80; and
Y = per capita gross national product in 1980.
In regression equations (8), (10), and (12), the estimates of gross fixed capital formation of central gov-ernment (the most recent year available), and in regression equations (9) and (10), CAB, the current ac-count balance of consolidated central government as a share of GDP (data for 1980 or the most recent yearavailable), were obtained from International Monetary Fund, Government Finance Statistics Yearbook,1982 (Washington, 1982) and Fund staff estimates.
Sources: GDI/GDP, AX, Min, AGDP, and Y were obtained from World Bank, World DevelopmentReport, 1982 (New York: Oxford University Press, 1982), and World Development Report, 1983 (NewYork: Oxford University Press, 1983).
ArgentinaBrazilChileColombiaCote d'Ivoire
EcuadorEgyptGhanaIndiaIndonesia
IsraelJamaicaKenyaKoreaMalaysia
MexicoMoroccoNigeriaPakistanPapua N e w Guinea
ParaguayPhilippinesSenegalSingaporeSudan
Syrian Arab Rep .ThailandTrinidad and TobagoTunisiaVenezuela
Zaire
GDI
GDP
2622182528
2531
52322
2216223129
2821241827
2930154312
2527282825
11
AX
9.37.5
10.91.94.6
7.5- 0 . 7- 8 . 4
3.78.7
9.6- 6 . 8- 1 . 0
23.07.4
13.42.12.61.22.0
7.17.01.2
12.0- 5 . 7
6.811.8
- 2 . 84.8
- 6 . 7
2.2
Min
21159
45
4647168
69
23121
129
394491
746
1182927
4
7412915298
56
AGDP
2.28.42.45.96.5
8.88.1
- 0 . 13.67.6
4.1- 1 . 1
6.59.57.8
5.25.66.54.72.3
8.66.32.58.54.4
10.07.25.17.55.0
0.1
Y
2,3902,0502,1501,1801,150
1,270580420240430
4,5001,040
4201,5201,620
2,090900
1,010300780
1,300690450
4,430410
1,340670
4,3701,3103,630
220
©International Monetary Fund. Not for Redistribution
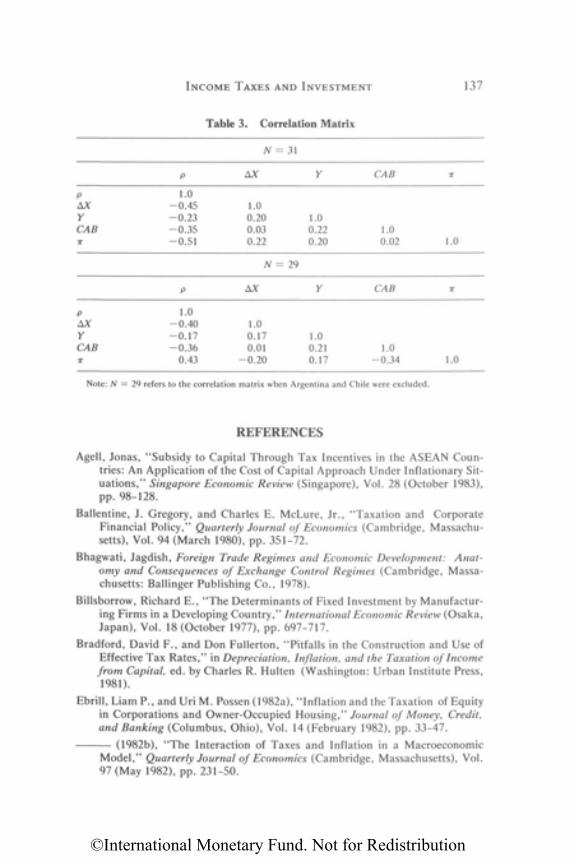
INCOME TAXES AND INVESTMENT 137
Table 3. Correlation Matrix
REFERENCES
Agell, Jonas, "Subsidy to Capital Through Tax Incentives in the A S E A N Coun-tries: A n Application of the Cost of Capital Approach Under Inflationary Sit-uations," Singapore Economic Review (Singapore), Vol. 28 (October 1983),pp. 98-128.
Ballentine, J. Gregory, and Charles E . McLure , Jr., "Taxation and CorporateFinancial Policy," Quarterly Journal of Economics (Cambridge, Massachu-setts), Vol. 94 (March 1980), pp. 351-72.
Bhagwati, Jagdish, Foreign Trade Regimes and Economic Development: Anat-omy and Consequences of Exchange Control Regimes (Cambridge, Massa-chusetts: Ballinger Publishing C o . , 1978).
Billsborrow, Richard E . , "The Determinants of Fixed Investment by Manufactur-ing Firms in a Developing Country," International Economic Review (Osaka,Japan), Vol. 18 (October 1977), pp. 697-717.
Bradford, David F . , and D o n Fullerton, "Pitfalls in the Construction and Use ofEffective Tax Rates," in Depreciation, Inflation, and the Taxation of Incomefrom Capital, ed. by Charles R . Hulten (Washington: Urban Institute Press,1981).
Ebrill, Liam P . , and Uri M . Possen (1982a), "Inflation and the Taxation of Equityin Corporations and Owner-Occupied Housing," Journal of Money, Credit,and Banking (Columbus, Ohio), Vol. 14 (February 1982), pp. 33-47.
-(1982b), "The Interaction of Taxes and Inflation in a MacroeconomicModel , " Quarterly Journal of Economics (Cambridge, Massachusetts), Vol.97 (May 1982), pp. 231-50.
Note: N = 29 refers to the correlation matrix when Argentina and Chile were excluded.
pAXYCABr
N = 29
P
1.0- 0 . 4 0- 0 . 1 7- 0 . 3 6
0.43
AX
1.00.170.01
- 0 . 2 0
Y
1.00.210.17
CAB
1.0- 0 . 3 4 1.0
pAXYCABr
N = 31
P
1.0-0 .45-0 .23-0 .35-0.51
AX
1.00.200.030.22
Y
1.00.220.20
CAB
1.00.02 1.0
©International Monetary Fund. Not for Redistribution
138 L I A M P. EBRILL
Feldstein, Martin (1980a), "Inflation, Tax Rules and the Stock Market," Journalof Monetary Economics (Amsterdam), Vol. 6 (July 1980), pp. 309-32.
-(1980b), "Inflation, Tax Rules, and the Prices of Land and Gold," Journalof Public Economics (Amsterdam), Vol. 14 (December 1980), pp. 309-17.
-(1980c), "Inflation and the Stock Market," American Economic Review(Nashville, Tennessee), Vol. 70 (December 1980), pp. 839-47.
-, and Michael Rothschild, "Towards an Economic Theory of ReplacementInvestment," Econometrica (Evanston, Illinois), Vol. 42 (May 1974), pp.393-424.
Feldstein, Martin, and Lawrence Summers, "Inflation, Tax Rules and the Long-Term Interest Rate," Brookings Papers on Economic Activity: 1 (1978),Brookings Institution (Washington), pp. 61-110.
Flemming, J.S., " A Reappraisal of the Corporation Income Tax," Journal of Pub-lic Economics (Amsterdam), Vol. 6 (July-August 1976), pp. 163-69.
Fullerton, D o n , and Roger H . Gordon, " A Reexamination of Tax Distortions inGeneral Equilibrium Models," in Behavioral Simulation Methods in Tax Pol-icy Analysis, ed. by Martin Feldstein (Chicago: University of Chicago Press,1983).
Fullerton, D o n , A . Thomas King, John B . Shoven, and John Whalley, "CorporateTax Integration in the United States: A General Equilibrium Approach,"American Economic Review (Nashville, Tennessee), Vol. 71 (September1981), pp. 677-91.
Galbis, Vicente, "Money, Investment, and Growth in Latin America, 1961-1973,"Economic Development and Cultural Change (Chicago), Vol. 27 (April 1979),pp. 423-43.
Gould, J.P., "Adjustment Costs in the Theory of Investment of the Firm," Reviewof Economic Studies (Edinburgh), Vol. 35 (January 1968), pp. 47-55.
Hall, Robert E . , "Tax Treatment of Depreciation, Capital Gains, and Interest inan Inflationary Economy," in Depreciation, Inflation, and the Taxation ofIncome from Capital, ed. by Charles R . Hulten (Washington: Urban InstitutePress, 1981).
-, and D . W . Jorgenson, "Application of the Theory of Opt imum CapitalAccumulation," in Tax Incentives and Capital Spending, ed. by Gary F r o m m(Washington: Brookings Institution, 1971).
Harberger, Arnold C . , "The Incidence of the Corporation Income Tax," Journalof Political Economy (Chicago), Vol. 70 (June 1962), pp. 215-40.
-, "Efficiency Effects of Taxes on Income from Capital," in Effects of Corpo-ration Income Tax, ed. by Marian Krzyzaniak (Detroit: Wayne State Univer-sity Press, 1966).
Hulten, Charles R . , and Frank C . Wykoff, "The Measurement of Economic De-preciation," in Depreciation, Inflation, and the Taxation of Income fromCapital, ed. by Charles R . Hulten (Washington: Urban Institute Press, 1981).
Jorgenson, Dale W . , and Martin A . Sullivan, "Inflation and Corporate CapitalRecovery," in Depreciation, Inflation, and the Taxation of Income from Capi-tal, ed. by Charles R . Hulten (Washington: Urban Institute Press, 1981).
©International Monetary Fund. Not for Redistribution
INCOME TAXES AND INVESTMENT 139
King, Mervyn A . , "Taxation, Corporate Financial Policy, and the Cost of Capital:A C o m m e n t , " Journal of Public Economics (Amsterdam), Vol. 4 (August1975), pp. 271-79.
-, and D o n Fullerton, eds., The Taxation of Income from Capital: A C o m -parative Study in the United States, the United Kingdom, Sweden, and WestGermany (Chicago: University of Chicago Press, 1984).
Krzyzaniak, Marian, and R . A . Musgrave, The Shifting of the Corporation IncomeTax: An Empirical Study of Its Short-Run Effect upon the Rate of Return(Baltimore: Johns Hopkins University Press, 1963).
Lucas, Robert E . , Jr., "Adjustment Costs and the Theory of Supply," Journal ofPolitical Economy (Chicago), Vol. 75 (August 1967), Part 1, pp. 321-34.
McKinnon, Ronald I., Money and Capital in Economic Development (Washing-ton: Brookings Institution, 1973).
McLure, C . E . , Jr., "General Equilibrium Incidence Analysis: The HarbergerModel After Ten Years," Journal of Public Economics (Amsterdam), Vol. 4(February 1975), pp. 125-61.
Rao, Potluri, and Roger LeRoy Miller, Applied Econometrics (Belmont, Califor-nia: Wadsworth Publishing Co. , 1971).
Shoven, John B . , "The Incidence and Efficiency Effects of Taxes on Income fromCapital," Journal of Political Economy (Chicago), Vol. 84 (December 1976),pp. 1261-83.
Stiglitz, Joseph E . , "Taxation, Corporate Financial Policy, and the Cost of Capi-tal," Journal of Public Economics (Amsterdam), Vol. 2 (February 1973), pp.1-34.
-, "The Corporation Tax," Journal of Public Economics (Amsterdam), Vol.5 (April-May 1976), pp. 303-11.
Sundararajan, V . , and Subhash Thakur, "Public Investment, Crowding Out, andGrowth: A Dynamic Model Applied to India and Korea," Staff Papers, Inter-national Monetary Fund (Washington), Vol. 27 (December 1980), pp.814-55.
Tanzi, Vito, "Is There a Quest for Public Sector Efficiency in Developing Coun-tries?" paper presented at the Thirty-Eighth Congress of the International In-stitute of Public Finance (Copenhagen, 1982, mimeographed).
Treadway, A . B . , " O n Rational Entrepreneurial Behaviour and the Demand forInvestment," Review of Economic Studies (Edinburgh), Vol. 36 (April 1969),pp. 227-39.
Tun Wai , U , and Chorng-huey W o n g , "Determinants of Private Investment inDeveloping Countries," Journal of Development Studies (London), Vol. 19(October 1982), pp. 19-36.
World Bank, World Development Report, 1982 (New York: Oxford UniversityPress, 1982).
-, World Development Report, 1983 (New York: Oxford UniversityPress, 1983).
©International Monetary Fund. Not for Redistribution
Determinants of Income Tax EvasionRole of Tax Rates, Shape of Tax Schedules,
and Other Factors
Somchai Richupan
Supply-side tax policy is based on the presumption that high rates ofincome tax and more progressive income tax rate schedules encourage in-come tax evasion and therefore the lowering of tax rates and the progres-sivity of tax schedules will reduce tax evasion. This chapter reviews1 thetheoretical literature on factors affecting tax evasion, in particular the roleof the level of tax rates and the shape of the tax schedule. It also reviewsempirical studies that have focused on the determinants of tax evasion.The chapter will reveal that there is a lack of consensus on these issues. Inaddition, it will show h o w the literature has ignored the macro-nontax fac-tors that affect tax evasion. Finally, the chapter hypothesizes the reasonsfor the higher level of tax evasion in developing countries than in developedcountries.
A related activity to tax evasion is tax avoidance. F r o m the legal point ofview, the two activities are distinct in that the former is illegal whereas thelatter is not. However, from the economist's point of view, tax evasion andtax avoidance have similar effects on government revenue, taxpayer'safter-tax income, and fiscal equity. Tax evasion and tax avoidance are notindependent of each other, and have the potential for substitute and/orcomplementary relationships. For example, given a progressive tax struc-ture, a taxpayer w h o successfully engages in tax avoidance will find thatthe marginal tax savings to be obtained from further tax evasion is n o wreduced. Costs incurred in obtaining information on avoidance opportuni-ties m a y provide insights into possible evasion practices. For a full under-
1Since this chapter is based on a study prepared in June 1984, literature published after thedate is not incorporated in the review.
140
6
©International Monetary Fund. Not for Redistribution
DETERMINANTS OF INCOME TAX EVASION 141
standing of an individual's or a society's tax resistance behavior, both taxevasion and tax avoidance should be analyzed simultaneously. This chap-ter, however, does not attempt to undertake such an analysis, since thefocus of the chapter is on the tax resistance behavior of taxpayers in devel-oping countries where, because of low tax administrative capability, taxevasion is more prevalent than tax avoidance.2
Section I of the chapter discusses the standard models of tax evasion.Section II reviews other theoretical studies pertaining to tax evasion. Sec-tion III analyzes empirical studies on the factors affecting tax evasion. Sec-tion IV discusses the limitations of the literature. Section V reviews thepolicy measures for deterrence of tax evasion. Section VI explores the roleof nontax factors and evaluates the relative extent of tax evasion in devel-oping country circumstances. Finally Section VII presents some conclud-ing remarks.
I. Standard Models of Tax Evasion
Mathematical models for analyzing tax evasion follow two approaches:the expected utility maximization approach developed by Allingham andS a n d m o (1972) and the expected income maximization approach devel-oped by Srinivasan (1973). This section discusses the standard models ofthese two approaches.
Expected Utility Maximization Approach
Allingham and S a n d m o (1972) assume that tax declaration is a decisionunder uncertainty. The taxpayer has a choice between two main strategies:(1) to declare his actual income, or (2) to declare less than his actual in-come. If he chooses the first option, he will have to pay the full amount ofthe tax. However, if he chooses the second option, he can pay less than thefull amount, but he will have to face the probability of being detected andpenalized. His problem is to maximize the expected utility derived from hisincome after tax and penalty (if any). Allingham and S a n d m o assume thatthe taxpayer's behavior conforms to the von Neumann-Morgenstern axiomfor behavior under uncertainty. The cardinal utility function of the tax-payer has income as its only argument and the marginal utility is assumed
2For further discussion on the choices between tax evasion and tax avoidance, see Crossand Shaw (1981).
©International Monetary Fund. Not for Redistribution
142 SOMCHAI RlCHUPAN
to be everywhere positive and strictly decreasing so that the individual isrisk averse.3 The taxpayer's objective function is
E(U) = (1 - p)[U(W - 0X)] + P[U(W - OX - II(W - X))], (1)where W is the taxpayer's actual income which is exogenously given and isknown to the taxpayer but not to the tax authority; 0 is a constant tax rate,0 > 0; X, the income reported to the tax authorities, is the taxpayer's deci-sion variable, X > 0; p is the probability that the evasion will be detected;II is the penalty rate on unreported income, II > 0; U is the utility fromdisposable income; and E(U) is the expected utility. The taxpayer chooseshis declared income (X) so as to maximize his expected utility [E(U)].
Under the assumption of decreasing absolute risk aversion,4 Allinghamand S a n d m o show that the sign of aX/a0 is indeterminate, which meansthat the effect of the tax rate on the reported income is indeterminate.Allingham and S a n d m o explain that this indeterminate effect is the resultof the interaction between the substitution and the income effects. Thesubstitution effect is negative because an increase in the tax rate makes itmore profitable to evade taxes on the margin. The income effect is positivebecause an increased tax rate makes the taxpayer less wealthy, and, underdecreasing absolute risk aversion, this tends to reduce evasion.
The effect of a penalty rate on the reported income, aX/aII is shown tobe unambiguously positive, which implies that an increase in the penaltyrate will always increase the reported income. The effect of the probabilityof detection is also shown to be unambiguously positive, which implies thatan increase in the probability of detection will always lead to a largerincome being declared.
Expected I n c o m e Maximization A p p r o a c h
The expected income maximization approach of Srinivasan (1973)assumes that the objective of the taxpayer is to maximize his expected
3 A risk averter is defined as one w h o , starting from a position of certainty, is unwilling totake a bet even when the bet is actuarially fair. Thus, he is more unwilling to take a bet if thebet is unfair to him. The utility function of a risk averter is strictly decreasing. For proof, seeArrow (1971).
4 T h e absolute risk aversion is a measure of the insistence of an individual for more-than-fair odds as a prior condition to engaging in betting, at least when the bets are small. Themeasure of absolute risk aversion is developed by Arrow (1971) and by Pratt (1964).
The assumption of decreasing absolute risk aversion means that the willingness of an indi-vidual to engage in a bet increases as his wealth increases. This is reflected in the decreasingodds demanded for engaging in the bet. This assumption is supported by everyday observa-tion. For example, it is observed that an individual increases the holding of risky assets as hisincome or wealth increases. For further discussion on this assumption, see Arrow (1971).
©International Monetary Fund. Not for Redistribution
DETERMINANTS OF INCOME TAX EVASION 143
income after taxes and penalties. Thus, the taxpayer's problem is to maxi-mize the following expected income function:
where y is an individual's true income; T(y) is the tax based on trueincome; X is the proportion by which income is understated; P(A) is thepenalty multiplier—thus, P(A)Ay is the penalty on the understated incomeXy; II is the probability of detection; and A(y) is the expected income aftertaxes and penalty.
Srinivasan assumes that T(y) > 0, 0 < T'(y) < 1, and T"(y) > 0for all y > 0, which means that the tax is a positive, increasing, and convexfunction of income. H e also assumes that P(A) > 0, P' (A) > 0, andP"(A) > 0, which means that the penalty multiplier is a positive, increas-ing, and convex function of the proportion by which income is under-stated, X .
Srinivasan denotes the optimum proportion of understated income byX * and shows that aA*/aII < 0, which means that the optimum proportionof understated income, (A*), decreases as the probability of detection (II)increases. The higher the probability of detection, the lower the proportionof income being evaded. H e also shows that aA*/ay is > 0 if T" is positive.This means that given a progressive tax function, and a probability of de-tection, II, independent of income, y, the richer the person, the larger theoptimal proportion by which he will understate his income. Under a pro-gressive tax structure, as income increases, the proportion of underre-ported income also increases. This result is true only when the probabilityof detection is independent of income. If the probability of detection is anincreasing function of income and the tax rate is proportional, then theproportion of understated income will decrease as income increases.
Compar i son of the T w o Mode l s
The two models are different in the assumptions concerning the objec-tive function (including the utility specification), the tax rate, and the pen-alty rate (Table 1). The objective function of Allingham and Sandmo'smodel is an expected utility function, whereas in Srinivasan's model it is anexpected income function. Allingham and Sandmo's utility function im-plies that the taxpayer is risk averse, while the expected income function ofSrinivasan implies that the taxpayer is risk neutral. Allingham andS a n d m o assume a proportional tax rate, but Srinivasan allows the tax rateto be either proportional or progressive. Allingham and Sandmo's penaltyrate is proportional, but Srinivasan's penalty rate is a positive, increasing,and convex function of the proportion of unreported income (X).
(2)
©International Monetary Fund. Not for Redistribution
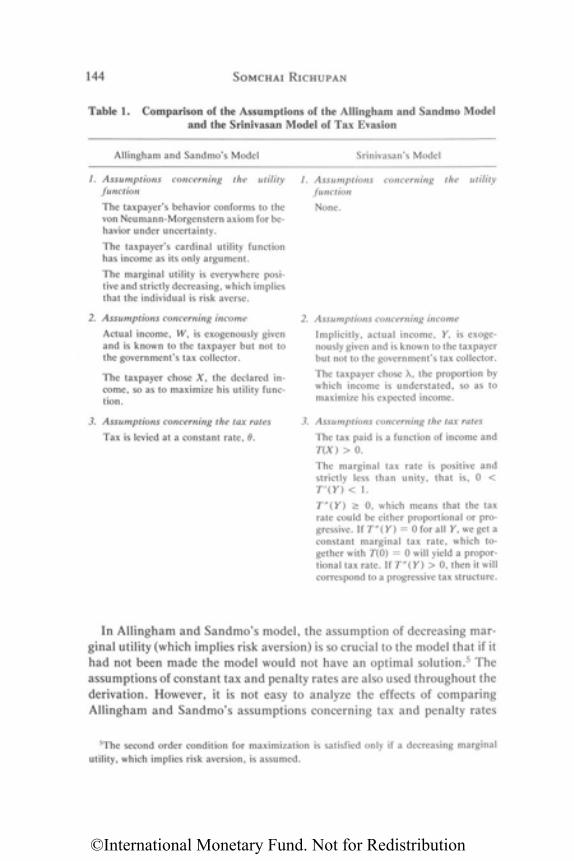
144 SOMCHAI RlCHUPAN
Table 1. Comparison of the Assumptions of the Allingham and Sandmo Modeland the Srinivasan Model of Tax Evasion
Allingham and Sandmo's Model Srinivasan's Model
1. Assumptions concerning the utilityfunction
The taxpayer's behavior conforms to thevon Neumann-Morgenstern axiom for be-havior under uncertainty.
The taxpayer's cardinal utility functionhas income as its only argument.
The marginal utility is everywhere posi-tive and strictly decreasing, which impliesthat the individual is risk averse.
2. Assumptions concerning income
Actual income, W, is exogenously givenand is known to the taxpayer but not tothe government's tax collector.
The taxpayer chose X, the declared in-come, so as to maximize his utility func-tion.
3. Assumptions concerning the tax rates
Tax is levied at a constant rate, 0.
1. Assumptionsfunction
None.
concerning the utility
2. Assumptions concerning income
Implicitly, actual income, Y, is exoge-nously given and is known to the taxpayerbut not to the government's tax collector.
The taxpayer chose X , the proportion bywhich income is understated, so as tomaximize his expected income.
3. Assumptions concerning the tax rates
The tax paid is a function of income andT(X) > 0.
The marginal tax rate is positive andstrictly less than unity, that is, 0 <T'(Y) < 1.
T"(Y) > 0, which means that the taxrate could be either proportional or pro-gressive. If T"(Y) = 0 for all Y, we get aconstant marginal tax rate, which to-gether with T(0) = 0 will yield a propor-tional tax rate. If T"(Y) > 0, then it willcorrespond to a progressive tax structure.
In Allingham and Sandmo's model, the assumption of decreasing mar-ginal utility (which implies risk aversion) is so crucial to the model that if ithad not been m a d e the model would not have an optimal solution.5 Theassumptions of constant tax and penalty rates are also used throughout thederivation. However, it is not easy to analyze the effects of comparingAllingham and Sandmo's assumptions concerning tax and penalty rates
5The second order condition for maximization is satisfied only if a decreasing marginalutility, which implies risk aversion, is assumed.
©International Monetary Fund. Not for Redistribution
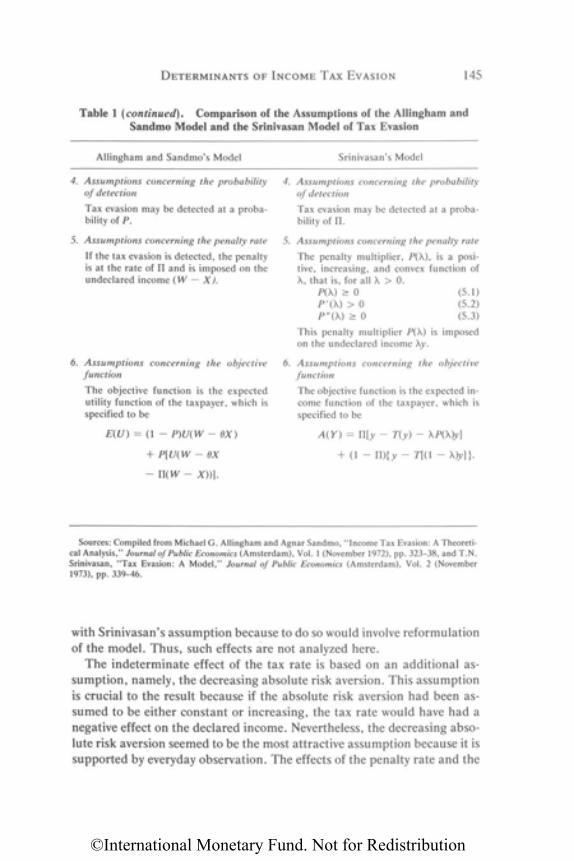
DETERMINANTS OF INCOME TAX EVASION 145
Table 1 (continued). Comparison of the Assumptions of the Allingham andSandmo Model and the Srinivasan Model of Tax Evasion
Allingham and Sandmo's Model Srinivasan's Model
4. Assumptions concerning the probabilityof detection
Tax evasion m a y be detected at a proba-bility of P.
5. Assumptions concerning the penalty rate
If the tax evasion is detected, the penaltyis at the rate of II and is imposed on theundeclared income (W — X).
6. Assumptions concerning the objectivefunction
The objective function is the expectedutility function of the taxpayer, which isspecified to be
Sources: Compiled from Michael G . Allingham and Agnar Sandmo, "Income Tax Evasion: A Theoreti-cal Analysis," Journal of Public Economics (Amsterdam), Vol. 1 (November 1972), pp. 323-38, and T . N .Srinivasan, "Tax Evasion: A Model," Journal of Public Economics (Amsterdam), Vol. 2 (November1973), pp. 339-46.
with Srinivasan's assumption because to do so would involve reformulationof the model. Thus , such effects are not analyzed here.
The indeterminate effect of the tax rate is based on an additional as-sumption, namely, the decreasing absolute risk aversion. This assumptionis crucial to the result because if the absolute risk aversion had been as-sumed to be either constant or increasing, the tax rate would have had anegative effect on the declared income. Nevertheless, the decreasing abso-lute risk aversion seemed to be the most attractive assumption because it issupported by everyday observation. The effects of the penalty rate and the
4. Assumptions concerning the probabilityof detection
Tax evasion m a y be detected at a proba-bility of II.
5. Assumptions concerning the penalty rate
The penalty multiplier, P(x), is a posi-tive, increasing, and convex function ofX , that is, for all X > 0.
(5.1)(5.2)(5.3)
This penalty multiplier P(x) is imposedon the undeclared income Xy.
Assumptions concerning the objectivefunction
The objective function is the expected in-come function of the taxpayer, which isspecified to be
©International Monetary Fund. Not for Redistribution
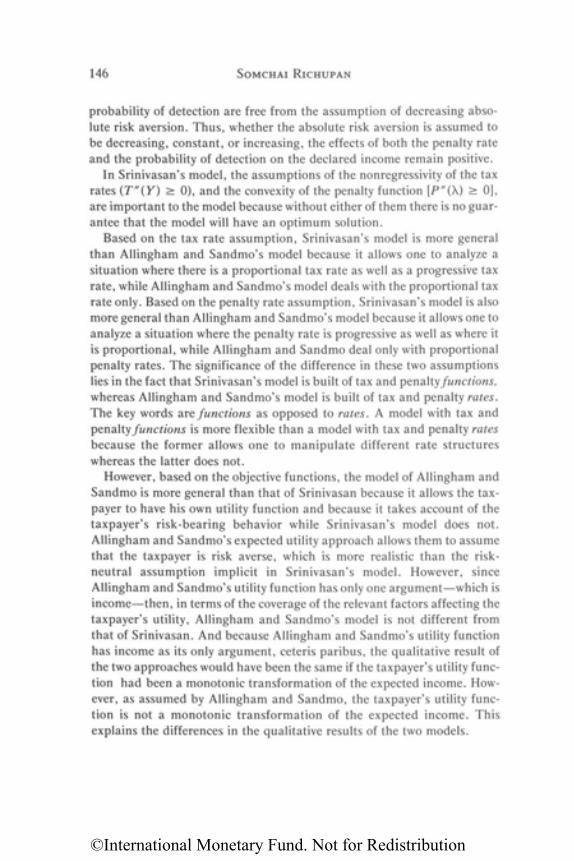
146 SOMCHAI RICHUPAN
probability of detection are free from the assumption of decreasing abso-lute risk aversion. Thus, whether the absolute risk aversion is assumed tobe decreasing, constant, or increasing, the effects of both the penalty rateand the probability of detection on the declared income remain positive.
In Srinivasan's model, the assumptions of the nonregressivity of the taxrates (T"(Y) > 0), and the convexity of the penalty function [P"(A) > 0],are important to the model because without either of them there is no guar-antee that the model will have an optimum solution.
Based on the tax rate assumption, Srinivasan's model is more generalthan Allingham and Sandmo's model because it allows one to analyze asituation where there is a proportional tax rate as well as a progressive taxrate, while Allingham and Sandmo's model deals with the proportional taxrate only. Based on the penalty rate assumption, Srinivasan's model is alsomore general than Allingham and Sandmo's model because it allows one toanalyze a situation where the penalty rate is progressive as well as where itis proportional, while Allingham and S a n d m o deal only with proportionalpenalty rates. The significance of the difference in these two assumptionslies in the fact that Srinivasan's model is built of tax and penalty functions,whereas Allingham and Sandmo's model is built of tax and penalty rates.The key words are functions as opposed to rates. A model with tax andpenalty functions is more flexible than a model with tax and penalty ratesbecause the former allows one to manipulate different rate structureswhereas the latter does not.
However, based on the objective functions, the model of Allingham andS a n d m o is more general than that of Srinivasan because it allows the tax-payer to have his own utility function and because it takes account of thetaxpayer's risk-bearing behavior while Srinivasan's model does not.Allingham and Sandmo's expected utility approach allows them to assumethat the taxpayer is risk averse, which is more realistic than the risk-neutral assumption implicit in Srinivasan's model. However, sinceAllingham and Sandmo's utility function has only one argument—which isincome—then, in terms of the coverage of the relevant factors affecting thetaxpayer's utility, Allingham and Sandmo's model is not different fromthat of Srinivasan. A n d because Allingham and Sandmo's utility functionhas income as its only argument, ceteris paribus, the qualitative result ofthe two approaches would have been the same if the taxpayer's utility func-tion had been a monotonic transformation of the expected income. H o w -ever, as assumed by Allingham and S a n d m o , the taxpayer's utility func-tion is not a monotonic transformation of the expected income. Thisexplains the differences in the qualitative results of the two models.
©International Monetary Fund. Not for Redistribution
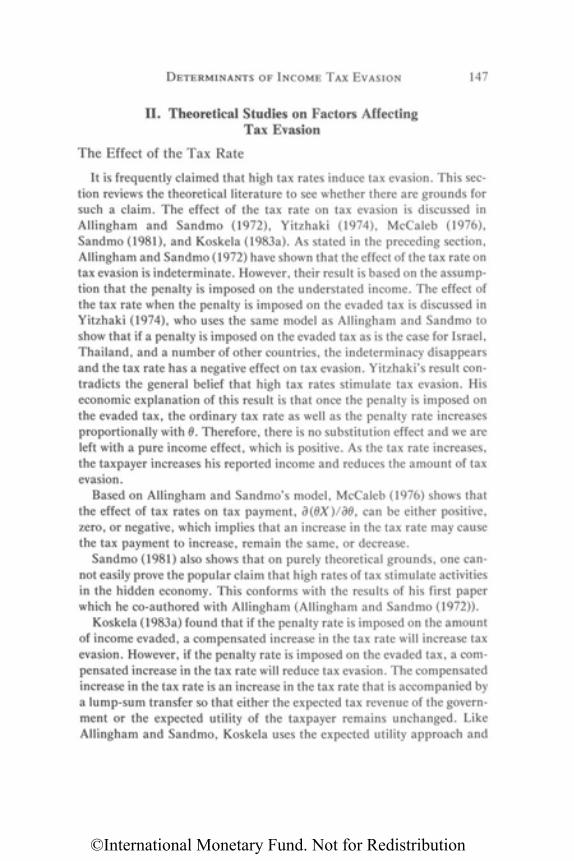
DETERMINANTS OF INCOME TAX EVASION 147
II. Theoretical Studies on Factors AffectingTax Evasion
The Effect of the Tax Rate
It is frequently claimed that high tax rates induce tax evasion. This sec-tion reviews the theoretical literature to see whether there are grounds forsuch a claim. The effect of the tax rate on tax evasion is discussed inAllingham and S a n d m o (1972), Yitzhaki (1974), McCaleb (1976),S a n d m o (1981), and Koskela (1983a). As stated in the preceding section,Allingham and S a n d m o (1972) have shown that the effect of the tax rate ontax evasion is indeterminate. However, their result is based on the assump-tion that the penalty is imposed on the understated income. The effect ofthe tax rate when the penalty is imposed on the evaded tax is discussed inYitzhaki (1974), w h o uses the same model as Allingham and S a n d m o toshow that if a penalty is imposed on the evaded tax as is the case for Israel,Thailand, and a number of other countries, the indeterminacy disappearsand the tax rate has a negative effect on tax evasion. Yitzhaki's result con-tradicts the general belief that high tax rates stimulate tax evasion. Hiseconomic explanation of this result is that once the penalty is imposed onthe evaded tax, the ordinary tax rate as well as the penalty rate increasesproportionally with 0. Therefore, there is no substitution effect and we areleft with a pure income effect, which is positive. As the tax rate increases,the taxpayer increases his reported income and reduces the amount of taxevasion.
Based on Allingham and Sandmo's model, McCaleb (1976) shows thatthe effect of tax rates on tax payment, a(0X)/a0, can be either positive,zero, or negative, which implies that an increase in the tax rate m a y causethe tax payment to increase, remain the same, or decrease.
S a n d m o (1981) also shows that on purely theoretical grounds, one can-not easily prove the popular claim that high rates of tax stimulate activitiesin the hidden economy. This conforms with the results of his first paperwhich he co-authored with Allingham (Allingham and S a n d m o (1972)).
Koskela (1983a) found that if the penalty rate is imposed on the amountof income evaded, a compensated increase in the tax rate will increase taxevasion. However, if the penalty rate is imposed on the evaded tax, a com-pensated increase in the tax rate will reduce tax evasion. The compensatedincrease in the tax rate is an increase in the tax rate that is accompanied bya lump-sum transfer so that either the expected tax revenue of the govern-ment or the expected utility of the taxpayer remains unchanged. LikeAllingham and S a n d m o , Koskela uses the expected utility approach and
©International Monetary Fund. Not for Redistribution
148 SOMCHAI RICHUPAN
assumes a decreasing absolute risk aversion. However, he explains thatwhen the penalty rate is imposed on the undeclared income, the increase inthe lump-sum transfer neutralizes the negative income effect on tax eva-sion and we are left with the positive substitution effect, which increasestax evasion as tax rate increases. O n the other hand, if the penalty rate isimposed on the evaded tax, then the amount of penalty will increase pro-portionally with the tax; thus, there is no substitution effect and the in-crease in the tax rate has only a negative income effect on tax evasion. Thisincome effect is n o w stronger than in the case where the penalty is imposedon the undeclared income because the evaded tax also increases as a resultof the increase in the tax rate. Koskela's result does not provide groundsfor the popular claim that an increase in the tax rate stimulates tax eva-sion. In the first place, Koskela, like Yitzhaki (1974), produced just theopposite result, that is, if the penalty is imposed on the evaded tax, anincrease in the tax rate reduces tax evasion. In the second place, whereKoskela provides grounds for stating that an increase in the tax rate in-creases tax evasion, it is under the condition that the tax rate increase isaccompanied by an increase in the lump-sum transfer (in the form of taxexemptions) from the government to the taxpayer in an amount such thateither the government's expected tax revenue or the taxpayer's expectedutility remains unchanged. However, such a condition is not part of theclaim.
T o summarize, the theoretical literature does not support the claim thatan increase in the tax rate will lead to an increase in tax evasion. Theoreti-cal investigation shows that if the penalty rate is imposed on the evadedtax, an increase in the tax rate will lead to a reduction in tax evasion ratherthan to an increase as claimed. If the penalty rate is imposed on the under-stated income, the tax rate has an indeterminate effect on tax evasion.Only under the conditions that the penalty rate is imposed on the under-stated income and that such an increase in the tax rate is accompanied by acompensatory increase in the lump-sum transfer so that the expected taxrevenue of the government remains unchanged will the increase in the taxrate lead to an increase in tax evasion. However, the second condition isnot a part of the claim because the purpose of increasing the tax rate is toraise more revenue and not to keep the tax revenue unchanged.
The Effect of the Shape of the Tax Rate Schedule
Given the ability of an individual to pay tax, it is believed that a progres-sive tax rate schedule will generate more tax revenue than a proportionaltax rate schedule. However, such a belief is based on the assumption thattax evasion does not exist. If tax evasion exists, it is uncertain whether a
©International Monetary Fund. Not for Redistribution
DETERMINANTS OF INCOME TAX EVASION 149
progressive tax rate schedule will generate more tax revenue. However, inrecent years it has been popularly claimed that a progressive tax rateschedule stimulates tax evasion and consequently will yield less tax revenueto the government than a proportional tax rate schedule. Therefore, it isuseful to investigate whether such a claim has theoretical grounds.
The effect of the shape of the tax rate schedule on tax evasion is consid-ered in Srinivasan (1973), Nayak (1978), and Koskela (1983b). Srinivasan,assuming a progressively increasing penalty multiplier and a probability ofdetection, II, independent of the level of income, y, shows that a progres-sive tax function that yields the same revenue as the proportional tax func-tion in the absence of understatement of income will yield less expectedrevenue and penalties in the presence of understatement of income.Nayak, using a model along the lines of Srinivasan and assuming that thepenalty is a progressive function of the fraction of income understated, X,finds that a regressive tax function, which yields the same total tax revenueas a proportional tax function in the absence of understatement of income,will yield a larger expected revenue in the presence of the opt imum under-statement of income.
The results of the analyses of Srinivasan and Nayak imply that if theprogressive, proportional, and regressive tax rate structures, which are de-signed to generate the same amount of revenue in a situation where taxevasion does not exist, are enforced in a situation where tax evasion doesexist, a regressive tax rate structure will yield the highest tax revenue. Theanalyses also show that a proportional tax rate structure will yield higherrevenue than a progressive tax rate structure.
Koskela (1983b), using the expected utility maximization approach andassuming a general tax function, shows that given the decreasing absoluterisk aversion, the direction of the change in the fraction of income reportedwhen the actual income increases is ambiguous for progressive and regres-sive taxation. However, when the taxation is linear progressive,6 the non-decreasing relative risk aversion is a sufficient, but not a necessary, condi-tion for the negative relationship between the fraction of income not beingdeclared and the actual income. W h e n the taxation is linear regressive,7
the nonincreasing relative risk aversion is a sufficient, but not a necessary,
6 A linear progressive tax is a linear tax function with a negative lump-sum tax, for example,t(x) = —r + tx. Note that here, progressivity is measured in terms of the average tax raterather than the marginal tax rate.
7 A linear regressive tax is a linear tax function with a positive lump-sum tax, for example,t(x) = r + tx. As in the case of the linear progressive tax, here too the regressivity is measuredin terms of the average tax rate rather than the marginal tax rate.
©International Monetary Fund. Not for Redistribution
150 SOMCHAI RICHUPAN
condition for the positive relationship between the fraction of income notbeing declared and the actual income.
The intuitive explanation of the ambiguity is that under the progressiveand regressive tax rates, the substitution effect and the income effect workin opposite directions. In the case of progressive taxation, on the one hand,the fraction of income reported tends to decrease as the actual income in-creases due to the substitution effect because it is more profitable to evadetaxes. O n the other hand, a rise in the income reported induced by anincrease in the actual income raises the average taxes and thus makes thetaxpayer worse off. This income effect tends to increase the fraction of in-come reported as the actual income increases. Thus, the effect is ambigu-ous. In the case of regressive taxation, on the one hand, the fraction ofincome reported tends to increase as the actual income increases due to thesubstitution effect because, at a lower marginal tax rate, it is less profitableto evade tax. O n the other hand, a rise in the fraction of income reported,induced by an increase in the actual income, lowers the average taxes andthus makes the taxpayer better off. This income effect tends to decreasethe fraction of income reported as the actual income increases. The endresults depend on the size of the parameters which are u n k n o w n on a priorigrounds. If the marginal tax rates are constant, then there is no substitu-tion effect because there is no change in the relative prices, and the frac-tion of income not being declared depends on the behavior of the averagetaxes and the relative risk aversion. Thus , Koskela concluded that, givenany hypothesis on the relative risk aversion, the linear regressive tax rateschedule, and not the linear progressive tax rate schedule, tends to inducea rise in the fraction of income not being declared when the actual incomeincreases.
At first glance, it seems that Koskela's conclusion contradicts the con-clusions of Srinivasan, as well as those of Nayak. However, a closer exami-nation indicates that the two sets of conclusions are not contradictory.Srinivasan and Nayak deal with the aggregate revenue under progressive,proportional, and regressive tax rate structures, while Koskela deals withthe effect of the change in the actual income of a single taxpayer on thefraction of income that he reported. In Srinivasan and Nayak's analyses,there is a restriction that the three tax rate structures will yield the sameamount of revenue to the government, whereas there is no such restrictionin Koskela's analysis. Koskela shows that under the linear progressive taxrate structure, an increase in the actual income would lead to a reductionin the fraction of income not being declared, whereas under the linear re-gressive tax structure, an increase in the actual income will lead to an in-crease in the fraction of income not being declared. This is where the seem-ing contradiction arises because it implies that under the linear regressive
©International Monetary Fund. Not for Redistribution
DETERMINANTS OF INCOME TAX EVASION 151
tax rate structure, as the income of an individual increases, the fraction ofincome reported decreases, which tempts one to think that the amount ofrevenue will be reduced. This is not necessarily the case because it dependson the relative change in the fraction of income reported with respect to therelative change in the actual income. Only if the percentage reduction ofthe income reported is greater than the percentage increase of the actualincome will there be a decrease in the total tax revenue to the government.The tax rate does not have any effect here because, first, the marginal taxrate is imposed on the marginal income and, second, under the linear re-gressive tax rate structure, the marginal tax rate is constant. Thus, as longas there is an increase in the absolute amount of reported income, therewill always be an increase in the revenue no matter h o w m u c h the fractionof income reported changes.
The regressive, the linear progressive, and the linear regressive tax rateschedules will not be discussed further because they exist only in theoryand are not likely to be implemented. W e will n o w consider the progressiveand the proportional tax rate schedules because the former exists in mostcountries and the latter appears frequently in the tax policy literature andm a y replace the former.
Based on the two types of tax rate schedules, although Srinivasan'sresults are not exactly comparable with those of Koskela, they do suggestthe same area of policy concerns, although they suggest them differently.According to Srinivasan, a progressive tax should not be implementedbecause it yields less revenue in the presence of tax evasion. However,Koskela's result suggests that whether a progressive tax will yield more orless revenue is uncertain because it is not certain whether the fraction ofincome reported will increase or decrease when the actual income in-creases. T h e source of the differences lies in the assumption concerning therisk-bearing behavior of the taxpayer. Srinivasan's assumptions imply thatthe taxpayer is risk neutral, while Koskela assumes that the taxpayer has adecreasing absolute risk aversion. If the assumption of a risk-neutral tax-payer were incorporated in Koskela's analysis, there would be no incomeeffect, leaving only a positive substitution effect of an increase in incomeon tax evasion; thus, as income increases tax evasion will increase becauseit is more profitable to evade tax at a higher rate of tax. Consequently,under the progressive tax rate structure, an increase in income will lead toa decline in the fraction of income reported. In that case, there will be nodifferences in the policies suggested by Srinivasan and Koskela.
Thus , it can be concluded that the popular claim that a progressive taxrate schedule stimulates tax evasion and consequently will yield less taxrevenue to the government than the proportional tax rate schedule has the-oretical support. However, such support is based on the assumption that
©International Monetary Fund. Not for Redistribution
152 SOMCHAI RICHUPAN
the taxpayer is risk neutral. If the taxpayer is assumed to have a decreasingabsolute risk-aversion behavior, then the claim has no theoretical support.
T h e Effect of the Penalty Rate
The penalty is incorporated in the tax system to discourage tax evasion.It is generally believed that the effect of a penalty is to deter tax evasion.This section will survey the literature to see whether such a belief has theo-retical grounds.
The effect of the penalty rate on tax evasion is discussed in Allinghamand S a n d m o (1972), Singh (1973), McCaleb (1976), S a n d m o (1981), andKoskela (1983b). In Section I we have shown that Allingham and S a n d m o(1972) demonstrated that an increase in the penalty rate will always in-crease the fraction of actual income declared. Singh (1973), using the m a x -imization of expected income approach, shows that the higher the penaltyrate, the lower the magnitude of tax evasion.
McCaleb (1976) finds that an increase in the penalty rate will lead to anincrease in the tax payment. This result is based on the assumption that allpolicy parameters, namely, the tax rate (0), the penalty rate (II), and theprobability of detection and conviction (P) are independent. However, ifthe probability of detection and conviction (P) depends negatively on thepenalty rate (II), then the effect of an increase in the penalty rate on theamount of unreported income and on the amount of tax is indeterminable.McCaleb states that the reason for assuming that the probability of detec-tion and conviction depends on the penalty rate is because it is likely thatthe probability of conviction by a judge or jury m a y vary inversely with theseverity of the punishment.
S a n d m o (1981)8 also shows that an increase in the penalty rate will leadto a decrease in the supply of hours worked in the informal market, whichimplies that the proportion of unreported income will decrease and theproportion of reported income will increase.
Koskela (1983b), using the expected utility maximization approach andassuming a general tax function (i.e., the structure of the tax rate could beeither progressive,9 proportional, or regressive10), as well as the endoge-nous probability of detection, found that a penalty is a deterrent to taxevasion.
8Care should be taken in comparing Sandmo's results with those of the others becauseSandmo's labor supply specification deals with compensated changes.
9A progressive tax rate is defined to be a function in which t" > 0, and t — t'(x) < 0 (i.e.,the average tax is less than the marginal tax).
1 0 A regressive tax is one in which t" < 0, t — t'(x) > 0 (i.e., the average tax is greater thanthe marginal tax).
©International Monetary Fund. Not for Redistribution
DETERMINANTS OF INCOME TAX EVASION 153
T o summarize, theoretical results indicate that the penalty has a nega-tive effect on tax evasion except in cases where the probability of detectionis a negative function of the penalty. In such cases, the effect of the penaltyon tax evasion is indeterminate. Thus, it can be concluded that, generally,the belief that the penalty is a deterrent to tax evasion has theoreticalsupport.
T h e Effect of the Probability of Detection
The effect of the probability of detection on tax evasion is discussed inAllingham and S a n d m o (1972), Srinivasan (1973), Singh (1973), McCaleb(1976), Christiansen (1980), S a n d m o (1981), and Koskela (1983b).
Allingham and S a n d m o (1972) have shown that the effect of an in-crease in the probability of detection is to increase the reported income.Srinivasan (1973) also shows that an increase in the probability of detec-tion will lead to a decrease in the optimal proportion of understated in-come. O n the basis of the tax structure of India, Singh (1973) shows that ata constant penalty rate, the higher the value of probability of detection (II),the lower the proportion of income understated (X). This means that anincrease in the probability of detection is a deterrent to tax evasion.
McCaleb (1976) shows that an increase in the combined probability ofdetection and conviction would lead to an increase in the tax payment.Christiansen (1980) discussed the relative effectiveness of the penalty rateand the probability of detection as deterrents of tax evasion, which impliesthat an increase in the probability of detection reduces tax evasion.Koskela (1983b), assuming an endogenously determined probability of de-tection, shows that an increase in the probability is a deterrent to tax eva-sion. H e assumes that the probability of detection depends positively, butlinearly, on the ratio of the undeclared income to the actual income, thatis, P = P(W - X ) / W ; P' > 0, P" = 0. The reasons for assuming that Pis endogenously determined and is a function of X and W is because the taxauthorities might base their audit and investigation policy on a statisticalhypothesis that in the absence of any knowledge about the actual income, aperson with a low reported income is more likely to be an evader than aperson with a higher reported income; thus, the former is more likely to besubject to audit and investigation than the latter. Moreover, the authori-ties m a y have some crude indication from the general observation that theactual income of some specific taxpayers in certain sectors has increasedbut the reported income is unchanged. This will lead to an audit of thetaxpayer's account, which suggests that P is related to W.
T o summarize, all theoretical analyses indicate that an increase in theprobability of detection will lead to a decrease in tax evasion.
©International Monetary Fund. Not for Redistribution
154 SOMCHAI RICHUPAN
The Effect of Fiscal Inequity
So far, we have focused our attention on four factors, namely, the taxrate, the progressivity of the tax system, the penalty rate, and the probabil-ity of detection. All these four factors were analyzed within the frameworkof the conventional tax evasion models. However, these models have beencriticized for being overly simplified because they view tax evasion as only aspecial form of gambling, namely, the gambling for extra income in lightof the likelihood of detection and penalties imposed on detected tax evad-ers. This view takes account of only one element in the relationshipbetween the government and the taxpayer. According to Spicer andLundstedt (1976), the relationship between a taxpayer and his governmentcontains at least three elements—the element of coercion, the element ofinternalized norm or role expectation, and the element of exchange. Theconventional tax evasion model takes account of only the coercive elementof the relationship. The element of exchange is discussed below. The ele-ment of internalized norm is not considered in this paper since it belongs tothe realms of h u m a n psychology and sociology rather than economics.
In the element of exchange, a taxpayer is seen as exchanging purchasingpower in the market in return for government services. Thus, the taxpay-er's behavior is affected by his satisfaction or lack of satisfaction with histerms of trade with the government. Tax evasion is seen partly as an at-tempt by the taxpayer to adjust his terms of trade with the government inresponse to dissatisfaction stemming from a perceived inequity in his termsof trade when compared with other taxpayers. Thus, another factor affect-ing tax evasion is the perceived relative inequity in the taxpayer's terms oftrade with the government. This idea has been developed further by Spicerand Becker (1980) as the link between (horizontal) fiscal inequity and taxevasion. In this context, the taxpayers' utility functions are assumed to beinterdependent so that the utility derived from extra income accruedthrough tax evasion depends on the taxpayer's sense of equity regardinghis relationship with the government. If the taxpayer perceives himself tobe a victim of inequity, his anger increases the marginal utility that hederives from an extra dollar of tax evasion income and hence increases taxevasion. O n the other hand, if he perceives himself to be the beneficiary offiscal inequity, his guilt feelings reduce his marginal utility of income fromtax evasion and hence decrease evasion. Proponents of this hypothesis ac-knowledge that it is not possible for the taxpayer to assess the exact valueof what he pays and what he receives from the government in return. H o w -ever, they argue that it seems reasonable to assume that the taxpayer hasgeneral impressions and attitudes concerning his o w n and others' terms oftrade with the government. As far as evidence is concerned, a number of
©International Monetary Fund. Not for Redistribution
DETERMINANTS OF INCOME TAX EVASION 155
survey research and simulation studies have reported positive correlationsbetween the perception of fiscal inequity and tax evasion.11
III. Empirical Studies on Factors AffectingTax Evasion
Empirical studies on tax evasion take two approaches: the simulationapproach and the survey approach. These two approaches are discussedbelow.
Simulation or Experimental Approach
Arguing that theoretical models of optimal evasion, though yielding in-teresting insights, are often beset by key, ambiguously signed derivatives,Friedland and others (1978) conduct a tax evasion study using the game-simulation approach. They simulate taxpaying situations and conduct ex-periments on 15 subjects. Their objectives are to find out (1) how sensitiveincome tax evasion is to changes in tax rates; (2) which socioeconomic vari-ables are related to tax evasion; (3) whether the decisions to evade tax andthe extent of tax evasion are separate and distinct decisions; and (4)whether large fines are a more effective deterrent than frequent audits.Their subjects are seven male and eight female Israeli undergraduate psy-chology students whose average age is 25. Regression and correlation anal-yses based on data from the experiments indicate that the relation betweenunderreporting and the tax rate can be experimentally determined (at t =25 percent, the incidence of underreporting occurred 50 percent of thetime, and at t = 50 percent, the incidence occurred 80 percent of thetime). The decision to evade tax (P) and the extent to which taxes are un-derreported (X) are distinct and separate decisions. Large fines with asmall probability of detection are a more effective deterrent than smallfines with a large probability of detection. W o m e n are more likely toevade, but understate a m u c h smaller fraction of their income than m e n ,and those w h o habitually buy lottery tickets are not more likely to evadethan those w h o do not. However, lottery ticket buyers conceal m u c h moreincome when they do evade.
Spicer and Becker (1980) use a simulation approach to test the relation-ship between tax evasion and perceived fiscal inequity. Their hypothesis isthat tax evasion increases for victims of fiscal inequity but decreases forbeneficiaries of fiscal inequity. Their experiment is conducted on 57 sub-
11See, for example, Strumpel (1969), Spicer and Lundstedt (1976), and Spicer and Becker(1980).
©International Monetary Fund. Not for Redistribution
156 SOMCHAI RICHUPAN
jects, 21 of w h o m are male and 36 female. Inequity is simulated by provid-ing some participants with false information regarding relative tax rates.The result is that the perceived high-tax group has an evasion rate of33 percent, the perceived medium-tax group a rate of 25 percent, and theperceived low-tax group a rate of 12 percent. A regression analysis basedon data from the experiments indicates that the perceived relative taxrates, sex, and age are significant in explaining the variation in the per-centage of tax evaded, but the income is not significant. This regressionresult supports the hypothesis that perceived inequity is another factor thataffects tax evasion and that the amount of taxes evaded increases for vic-tims of fiscal inequity but decreases for beneficiaries of fiscal inequity.
Survey Approach
T h e survey approach is less restrictive than the theoretical model and thesimulation approach in that it allows the investigator to consider a widerrange of factors. However, the survey approach is subject to samplingbiases and sampling errors as well as to the problem of the reliability of theresponses. Factors affecting the tax evasion examined in the survey studiescan be classified into four types, namely, factors related to the degree ofsanctions, administrative capabilities, fiscal inequity, and social norms.Spicer and Lundstedt (1976) investigate these four types of factors. In par-ticular, their hypotheses are (1) tax evasion is less likely when sanctionsagainst it are perceived to be severe; (2) tax evasion is less likely when theprobability of detection is perceived to be high; (3) tax evasion is morelikely w h e n a taxpayer perceives his terms of trade with the government tobe inequitable compared with other taxpayers; and (4) the more tax evad-ers a taxpayer knows, the more likely he is to evade taxes himself. Spicerand Lundstedt conduct a survey on 130 households selected from two sub-urbs in a large metropolitan area in central Ohio. F r o m the survey data, a"tax resistance scale," a tax evasion index, and an inequity index are con-structed. T h e scale measures a relative propensity to evade taxes ratherthan tax evasion itself. T h e tax evasion index provides a way to assess theextent to which a taxpayer evades taxes. The inequity index measures theperceived fiscal inequity. Regression analyses indicate that the inequityindex and the n u m b e r of tax evaders k n o w n personally (a proxy of factorsrelated to social norms) are significantly and positively related to tax eva-sion. T h e perceived probability of detection is significant in the equationusing tax resistance as a dependent variable but not in the one usingtax evasion. T h e perceived severity of sanctions is not significant in anyequation.
Spicer and Lundstedt find that the level of family income is negatively
©International Monetary Fund. Not for Redistribution
DETERMINANTS OF INCOME TAX EVASION 157
related to tax resistance and that the proportion received in wages, sala-ries, and pensions is positively related. The first finding is in conflict withSrinivasan's theoretical result12 and with Mork's (1975) finding, which isreviewed below. The second finding contradicts the general belief that taxevasion opportunities decrease as the proportion of income received inwages, salaries, and pensions increases. Spicer and Lundstedt explain thatthese discrepancies m a y have arisen because those with higher incomes orsmaller proportions of wage income have greater opportunities to resort totax avoidance—which is legal—and, therefore, the motivation to under-take risky acts of tax evasion is reduced. They also find that age is signifi-cant and negatively related to tax resistance, whereas the experience withtax audits is significant but positively related to tax resistance.
M o r k (1975) uses interview data from the Norwegian Occupational LifeHistory Study, which are compiled by the Institute of Applied Social Re-search in Oslo. This data source, which is composed of 3,479 observations,is extraordinarily extensive and includes data on the 1970 income of theinterview respondents. The income data from the survey are then c o m -pared with the assessed income13 and pension-giving income14 from the in-come tax return of each respondent. These income data are tabulated byincome classes, and the average reported assessed income (X1) and the av-erage reported pension-giving income (X2) for each class are then dividedby the interview income (W) obtaining X1/W and X2/W. If we consider theinterview income (W) as actual income, then X1/W and X2/W are the pro-portion of income reported in the context of the standard tax evasionmodels. M o r k found that as income moves to the higher brackets, the pro-portion of income reported is smaller. Thus, M o r k concludes that empiri-cal evidence indicates that as income increases the proportion of incomereported decreases. This, in the framework of Allingham and S a n d m o(1972), implies that the relative risk aversion is a decreasing function ofincome. This result is consistent with Srinivasan's theory but inconsistentwith Spicer and Lundstedt's survey result.
Enrick (1963), using the survey approach, investigates U . S . taxpayers'income tax consciousness or awareness. In particular, his purposes are to
1 2Which indicates that aA*/ay > 0; A* being the optimal proportion by which income isunderstated.
13Assessed income is full income (including capital income) minus legal deductions, such asinterest payments and cost incurred in connection with one's occupation, but it does not ex-clude "special deductions," which are a part of income m a d e tax free because of illness,infirmity, etc.
14Pension-giving income is roughly the income from active work, whether the worker isemployed by someone else or is his own employer.
©International Monetary Fund. Not for Redistribution
158 SOMCHAI RICHUPAN
examine (1) h o w accurately individuals estimate their o w n tax liabilities,apart from the particular day near April 15 when a final return must befiled; (2) if they tend to m a k e errors in estimation, in what direction arethese likely to fall; and (3) whether the withholding has a demonstrableeffect on the accuracy or inaccuracy of estimation. Enrick argues that thestudy of tax consciousness or awareness is important because if we do notknow peoples' tax consciousness it does not m a k e m u c h sense to claim thatw e know the extent to which changes in their tax burden will affect theirbehavior. In Enrick's survey, first, without referring to his income tax re-turn, each participant is asked to guess and write down the total amount offederal income tax he thought he had paid in the previous year and thenafter looking it up, write down the actual amount he paid. Enrick's surveyresult indicates that the respondents do not accurately know the amount offederal income taxes they paid. In addition, a slight tendency to underesti-mate rather than overestimate the amount of tax paid is noted. A n d fi-nally, there is no demonstrable effect of withholding on the degree of in-come tax awareness. Schmolders15 conducts a similar study for the FederalRepublic of Germany but reports a moderate degree of tax overestimation.According to Enrick, the difference between his result and that ofSchmolders is possibly due to the difference in questionnaire technique.The G e r m a n taxpayer is asked to estimate his tax burden as a percent ofgross income. The taxpayer's error is then evaluated based on statisticaldata on average income taxes paid by various craft, business, and profes-sional groups of taxpayers. Enrick argues that by being asked only onefigure, the respondent m a y possibly have felt inclined to exaggerate his taxburden. In Enrick's study, the taxpayers are asked both the estimated andthe actual tax paid in juxtaposition.
IV. Limitations of the Literature
In order to put the literature in perspective, this section further clarifiesthe nature of tax evasion and highlights the scope and limitations of theliterature.
F o r m s of T a x Evasion
There are four possible cases of tax evasion: (1) providing false values ofthe socioeconomic variables that enter into the determination of the taxbase such as underreporting income or claiming nonexistent dependents;(2) intentionally misinterpreting the law so that the tax liability is mini-
15As reported in Enrick.
©International Monetary Fund. Not for Redistribution
DETERMINANTS OF INCOME TAX EVASION 159
mized; (3) doing both (1) and (2); and (4) failing to file a tax return. T h efirst case includes actions such as underreporting or unreporting of in-come , claiming nonexistent dependents, claiming fictitious expenditures,and engaging in any other illegal activities that have the effect of reducingthe tax base (net income). T h e second case includes actions such as inten-tionally applying wrong tax rates, intentionally claiming unentitled taxcredits, and engaging in any other illegal activities that would lead to thereduction of the legal tax liability.16 The theoretical literature covers onlythe first case and part of the third case, which involve underreporting ofnet income. It does not cover tax evasion under the second case, the re-maining part of the third case, and the fourth case. Thus , the scope of theliterature is rather limited.
Types of Income Evaded
In general, taxation is evaded on two types of income: income derivedfrom illegal activities and income derived from legal activities. For theformer, the decision to evade taxes arises because the activities are illegaland need to be kept a secret; therefore, the income derived therefrom is notreportable. This decision m a y seem to be independent of tax policy and taxadministrative parameters but is actually not.17 For the latter, the decisionto evade the taxes stems from the expected utility maximization or the ex-pected income maximization behavior of the taxpayer. In this case, thedecision to evade taxes is affected by tax policy and tax administrative pa-rameters. T h e literature reviewed deals with tax evasion of income appar-ently derived from legal activities without reference to that derived fromillegal activities.
Individual Versus Aggregate Tax Evasion Behavior
Tax evasion behavior is similar to consumption behavior in the sensethat it can be analyzed either at the individual or micro-level, or at theaggregate or macro-level. Literature on the theoretical and empirical anal-
16Without reporting net income differently from the true income.1 7 The tax laws of most countries m a k e no distinction between legal and illegal or even
criminal activities. In m a n y countries, there are ways to pay tax on illegal income (essentially,by reporting "laundered" income) that in practice makes the decision whether or not to evadeas dependent on "administration parameters," that is, the quality of enforcement and penal-ties, as it is in the case of legal income.
©International Monetary Fund. Not for Redistribution
160 SOMCHAI RICHUPAN
ysis of tax evasion reviewed in the previous sections is at the micro-level,18
because it deals with the decision making of individual taxpayers ratherthan the aggregate pattern of tax evasion in the economy as a whole. Thus ,it cannot directly provide an answer to the question why tax evasion in onecountry differs from that in another. It can only provide some indirect sug-gestions explaining the differences.
Types of Factors Affecting T a x Evasion
T w o types of factors affect tax evasion: tax and nontax. The former arefactors within the tax system, such as the tax rate, the tax base, the taxstructure, the penalty system, the probability of detection, and the proba-bility that the penalty will be applied once evasion is detected. Nontax fac-tors arise outside the tax system and influence the decision of an individualto evade tax. Nontax factors are of two types: micro-nontax factors andmacro-nontax factors. Micro-nontax factors pertain to the individual tax-payer, such as sex or educational background, which influence his decisionto evade tax. Macro-nontax factors relate to the characteristics of the econ-o m y as a whole, such as the price policy and the incomes policy of theeconomy. Whereas tax factors are more relevant to tax evasion on incomederived from legal activities and nontax factors are more relevant to eva-sion on income derived from illegal activities, both factors have certaininfluences on evasion of both types of income. O n the one hand, tax fac-tors, such as excessively high tax rates and overly progressive tax rateschedules, m a y constitute a cause for illegal activities from which the in-come derived is not reportable. O n the other hand, nontax factors m a yconstitute a cause for tax evasion on income derived from legal activities.For example, an excessive government expenditure leakage through cor-ruption m a y influence the taxpayer's decision to evade tax by underreport-ing income from legal activities.
Theoretical literature reviewed in this paper deals only with tax factors,but not with nontax factors, while empirical literature deals with tax andmicro-nontax factors. Macro-nontax factors are not covered in the litera-ture. Thus , the literature is limited in the sense that it takes account of onlya part of the whole range of factors that affect tax evasion.
T o summarize, the literature reviewed in Sections I, II, and III is limited
18Although, in analyzing the effects of tax rate schedules on tax evasion Srinivasan (1973)and Nayak (1978) deal with the total government tax revenue from income taxes, their pri-mary concern is not the aggregate tax evasion. Their approaches are still micro-approachesbecause they derived the total tax revenue by integrating overall individual taxpayers ratherthan relating one aggregate variable to other aggregate variables within the system of theaggregate economy.
©International Monetary Fund. Not for Redistribution
DETERMINANTS OF INCOME TAX EVASION 161
insofar as (1) it deals only with tax evasion through underreporting of in-come; (2) it covers evasion of legal income only; (3) it is a micro analysis;and (4) it takes account of only some of the factors that affect tax evasion.
V . The Role of Tax Factors
The Tax Rate
The effectiveness of the tax rate as a policy instrument for the deterrenceof tax evasion depends on the relationship between the tax rate and taxevasion, that is, whether the high tax rate is a cause of tax evasion. Unfor-tunately, such a relationship has not been definitely established one way orthe other. O n the one hand, it is generally believed that a high tax rate isthe main cause of tax evasion. Such a belief is supported by observations,reports, and studies of experts and committees on taxation as well as bystatements of tax policymakers. For example, Kaldor (1956), in his well-k n o w n report on Indian tax reform, states that the incentive to evade taxesdepends on the marginal rates of taxation, because these govern the gainsfrom evasion as a percent of the s u m evaded. Kaldor's statement is rein-forced by the Direct Taxes Administration Enquiry Committee (1960) ofIndia, which finds that high personal income tax rates are one of the majorreasons for tax evasion. The Committee observes in its report that m a n ywitnesses state that the prevailing high rates of taxation are one of themain causes for tax evasion and that the high rates of tax in the high-in-come brackets are said to be tolerated only because of the considerableevasion that takes place. Moreover, the then Finance Minister of India, inhis budget speech, stated that he had come to the conclusion that in India,the tax rate of direct tax at top levels encouraged large-scale evasion. Tanzi(1983a, p. 5), in discussing the erosion of tax bases in developing coun-tries, states that,"High tax rates, of course, m a k e the problem of evasionworse." Herschel (1978), in commenting on the relationship between taxevasion and tax avoidance, states that both of them can be considered asalternative means of facing extremely high tax rates. This implies that hightax rates are one source of tax evasion. In addition, a simulation study byFriedland and others suggests that beyond some rate of tax, the fraction ofreported income becomes very elastic with respect to the tax rate and thatthe positive relationship between the decision to underreport is increasedas the tax rate increases. Moreover, survey data used by M o r k (1975) indi-cate that taxpayers in higher-income brackets w h o pay tax at higher ratestend to have a higher proportion of underreported income. Furthermore,in an analysis of individual tax returns, Clotfelter (1983) finds that highertax rates tend to stimulate tax evasion.
©International Monetary Fund. Not for Redistribution
162 SOMCHAI RICHUPAN
O n the other hand, as reviewed in Section II, the results of theoreticalanalyses do not directly confirm the belief that a high tax rate is the causeof tax evasion. Such theoretical results are supported by the experience oftax administrators, tax committees, and some empirical observations. Forexample, tax administrators in m a n y developing countries believe that, asfar as farmers, traders, and professionals are concerned, tax evasion existsat all income levels and not only in the high-income brackets where themarginal tax rate is high. Moreover, the Working Group on Central DirectTaxes Administration of the Administrative Reforms Commission of India(1969), which investigated the causes of tax evasion by studying theamounts of detected concealed incomes, reported that an increase in therate of taxation was not followed by an increase in tax evasion, nor did adecrease in the rates bring about a higher tax responsiveness. Further-more, the experience of tax administration in India suggests that lower taxrates do not secure better tax compliance; for example, during 1970/71 to1978/79 when the marginal tax rates were steeply reduced, income tax col-lection as a proportion of national income in the nonagricultural sector wasalso reduced. All these are evidence that there is no relation between hightax rates and tax evasion.
T h e empirical results for both sides of the argument are sketchy andindirect, which indicate that further such studies are needed before m a k -ing a definitive conclusion regarding the effect of the tax rate on tax eva-sion. Thus , one m a y conclude that the effectiveness of the tax rate as apolicy measure for the deterrence of tax evasion is unclear.
The Penalty Rate and the Probability of Detection
Unlike the tax rate, the theoretical result of the effect of the penalty rateon tax evasion is m u c h clearer. According to the tax evasion model, a pen-alty has a negative effect on tax evasion19 except when the probability ofdetection is a function of the penalty; in such a case, the effect of a penaltyon tax evasion is indeterminate. For the probability of detection, the mes-sage from the theoretical result is even clearer because all theoretical anal-yses, without any exception, indicate that an increase in the probability ofdetection is a deterrent to tax evasion. The next legitimate question is, ifboth the probability of detection and the penalty rate are deterrents to taxevasion, what is their relative effectiveness? A number of theoretical analy-ses have addressed this issue, which are reviewed below chronologically.
Singh (1973) finds that, at a given proportion of underreported income,
1 9 T h e literature has focused only on penalties that are in the form of a percentage of eitherthe tax bill or the tax evaded. N o account is taken of nonmonetary sanctions.
©International Monetary Fund. Not for Redistribution
DETERMINANTS OF INCOME TAX EVASION 163
there is a negative relationship between the penalty rate and the probabil-ity of detection. H e also finds that, for India, if the penalty rate is at 200percent of the evaded income, then the probability of detection must beone third for the proportion of underreported income to be zero, that is, noevasion at all. McCaleb (1976) argues on theoretical grounds alone that thepenalty rate and the probability of detection are superior instruments totax rates in generating increased tax payments through the reduction oftax evasion because the tax rate gives indeterminate results, whereas boththe penalty rate and the probability of detection give a definite result. Fur-ther, he argues that if the implementation cost is also taken into account,then the penalty rate is superior to the probability of detection. Thus , hedraws a general conclusion that only the penalty rate on unreported in-come is a preferred instrument on the grounds of both certainty of the ef-fect and the cost of implementation. Christiansen (1980) finds that, given aconstant expected gain from tax evasion, if the penalty is increased and theprobability of detection is adjusted downward accordingly, risk averterswill always reduce their tax evasion. This implies that a high penalty rate isa more effective deterrent to tax evasion than the high probability of detec-tion. Further, if the penalty rate is "small enough," then an increase in thepenalty rate will increase tax evasion. However, if the initial penalty rate is"large enough," an increase in the penalty rate will reduce tax evasion.This indicates that w h e n the penalty rate is initially low, then an increasein the probability of detection is more effective than an increase in the pen-alty rate. W h e n the penalty rate is high enough, then an increase inthe penalty rate is more effective than an increase in the probability ofdetection.
Koskela (1983b), introducing cost of detection into his model, finds thatprovided the ratio of the marginal cost of detecting tax evasion is "small,"large penalties seem to be more effective deterrents to tax evasion thanhigh probability of detection. H e explains that an intuitive interpretationof this result is that an increase in the penalty rate and a decline in theprobability of detection that results in a constant expected gain from agiven tax evasion induces a greater loss for the taxpayer in the case of de-tection. Greater risk will thereby be involved and tax evasion will declineassuming that the taxpayers are risk averse. Further, he demonstrates thata high penalty rate is a more effective deterrent to tax evasion than largel u m p - s u m fines. This is because the l u m p - s u m fine does not vary with theamount of undeclared income and thus leaves more incentive to risk-tak-ing than the penalty rate, which varies with the declared income. Friedlandand others (1978) report that their simulation study indicates that a highpenalty rate with a low probability of detection is a more effective deterrentthan a low penalty rate with a high probability of detection.
©International Monetary Fund. Not for Redistribution
164 SOMCHAI RICHUPAN
T o summarize, at least in theory, both the probability of detection andthe penalty rate are effective deterrents of tax evasion and the penalty rateis relatively more effective than the probability of detection.20
Factors Relating to T a x Administration
The Withholding Scheme
Evidence from the Tax Compliance Measurement Program ( T C M P ) 2 1
indicates that the wage and salary income which is under a withholdingscheme has a high rate of compliance or a low rate of evasion.22 Moreover,statistics in m a n y developing countries indicate that a sizable amount ofincome tax is collected from wages and salaries and is deducted at thesource. (For example, in Thailand 78 percent of individual income taxesis collected from wages and salaries; the corresponding figures are73 percent for Cyprus, 70 percent for Indonesia, and 67 percent forTurkey.) This indicates that a tax withholding scheme is an effectivemeans of preventing tax evasion. However, the problem with the withhold-ing scheme is that it cannot be applied to m a n y types of income because,for the withholding scheme to be effective, there must be a relatively smallnumber of easily identifiable payers of the income. M a n y types of income,for example, rental income, income of professionals, and income fromsmall businesses, do not lend themselves to withholding schemes becausethere are more payers than receivers of such income. However, capital in-come, such as dividend and interest paid by banks, does lend itself to with-holding schemes because there are a lot fewer payers of such income thanreceivers. Agricultural income of farmers, whose products are mainly forexport or for further processing by domestic factories (for example, sugar-cane in Thailand and rubber in Indonesia) also lends itself to withholdingschemes. However, care should be taken in introducing withholdingschemes on these types of income because if the schemes are not correctlyinstituted and administered, the withholding tax becomes the final tax andacts more like an export tax or a sales tax on agricultural products ratherthan as an income tax on farmers. This is because the tax is based on turn-over rather than on income and the tax does not vary with the income of thetaxpayer. Farmers w h o experience losses still have to pay this tax.
20Note that this is a theoretical result. In m a n y countries, high penalties contained in legalcodes are never applied in practice and have little or no deterrent effect.
21For further discussion on the T C M P , see Henry (1983).2 2The 1976 T C M P result reported a 99 percent "Voluntary Compliance Level" ( V C L ) for
income from wages and salaries. The V C L is defined as the ratio of the reported tax to thesum of the reported and the unreported taxes.
©International Monetary Fund. Not for Redistribution
DETERMINANTS OF INCOME TAX EVASION 165
The Self-Enforcement Tax System
Economists have attempted to design an interlocking tax system in sucha way that it will rely on the self-interest of taxpayers to encourage them toprovide information to the tax department. Kaldor (1956), in his well-known report on India, suggests that the five taxes, namely, the incometax, the capital gains tax, the wealth tax, the personal expenditure tax,and the gift tax be filed in a single comprehensive return and should beassessed simultaneously. Kaldor explains that the advantage of filing acomprehensive single return and simultaneous assessment is that the taxesare self-checking in character for two reasons: first, concealment or under-statement of items in order to reduce liability in some taxes m a y increaseliability in other taxes, and, second, the information furnished by a tax-payer in order to prevent overassessment of his o w n liabilities automati-cally reveals the receipts and gains m a d e by other taxpayers. Higgins(1959) carries Kaldor's idea further by introducing a self-enforcing incen-tive tax system for developing countries. Higgins's system includes (1) apersonal income tax (including capital gains), (2) a corporation incometax, (3) a general sales or turnover tax, (4) a wealth tax, (5) a tax on excessinventory, and (6) a personal expenditure tax. Theoretically, the Kaldor-Higgins system is self-checking because personal expenditure is defined asthe excess of income over savings, and savings are equal to the increase innet wealth. Thus , taxpayers w h o underreport their expenditure by over-stating their savings increase their wealth tax liability. A seller of a prop-erty w h o understates his capital gains hurts the buyer because the buyercannot claim the full amount of the investment, thereby forcing him todeclare higher expenditures and increasing his expenditure tax liability.The excess inventory tax is designed to discourage underreporting of sales,thus helping to enforce sales and income tax. However, the system is notpractical and cannot be implemented. Goode (1981, p. 266), commentingon some economic aspects of tax administration states:
These proposals appear so unrealistic that a detailed critique is not worth-while. In m y opinion, their authors exaggerated the proclivity of taxpayers torefined calculations, the capacity of tax departments to use the great mass ofdata that would be generated, and the receptivity of governments to fiscal inno-vations. I suspect that most tax administrators will regard the idea of a self-enforcing tax system as fantastical. Even if put into operation, the proposedsystems would not prevent evasion in cases in which both parties to a transactionomit it from their records or understate its amount . Both parties could evade therelated taxes, and as no conflict of interest would arise between them, neitherwould have an economic incentive to report correctly.
©International Monetary Fund. Not for Redistribution
166 SOMCHAI RICHUPAN
Other Administrative Factors
Other tax administrative measures that can possibly prevent tax evasioninclude the simplification of tax laws and procedures, taxpayer education,the publicizing of names of tax law offenders, and the honesty of the taxenforcing department. These measures are practiced in a number of coun-tries with varying degrees of success.
V I . T h e Role of Nontax Factors in Developing Countries
Nontax Factors23
As pointed out in Section IV, the theoretical models of tax evasion dealonly with micro-analysis of tax evasion and account only for tax factorsaffecting tax evasion, while some empirical studies under review accountfor tax and micro-nontax factors but not macro-nontax factors. Suchmodels and studies do not directly or fully explain why tax evasion variesfrom one country to another. W e now consider several macro-nontax fac-tors that can affect tax evasion in developing country circumstances. N oattempt is m a d e here to establish the relative importance of the variousmacro-nontax factors.
Micro-nontax factors are relevant only to the micro-analysis of tax eva-sion behavior but are not relevant when macro-tax evasion behavior (suchas intercountry comparison of tax evasion behavior) is considered becausetheir effects tend to be canceled when the variables are aggregated. Macro-nontax factors are relevant to both micro-analysis and macro-analysis oftax evasion behavior. Since the focus here is on the intercountry compari-son of tax evasion, only macro-nontax factors will be explored.
Price Control Policies
Price control tends to generate black markets and tax evasion, irrespec-tive of whether the control is in the goods and services market, the factormarket, the money market, or the foreign exchange market. In the goodsand services market, price control imposed on any good or service usuallyleads either to the understatement of sale receipts in the accounts that areprepared for the inspection of the tax authorities, or to the disappearanceof such goods or services from the regular market; they can be purchasedonly in the black market at higher prices. In the factor markets, price con-trol usually leads to the declaration of false prices of the factor being con-
23Tanzi (1983b) lists four causes of underground economy, namely, taxes, regulations, pro-hibition, and bureaucratic corruption.
©International Monetary Fund. Not for Redistribution
D E T E R M I N A N T S O F I N C O M E T A X E V A S I O N 167
trolled. For example, rent control usually leads to tax evasion eitherthrough the understatement of rental income in the tax return of the land-lord, or through an unreported amount of premium 2 4 (which is usuallysubstantial) that the landlord receives in cash before renting the propertyat the controlled rent. In an economy where the m i n i m u m wage is artifi-cially set higher than the equilibrium wage, one is likely to find overstate-ments of wages paid in the tax returns of employers, unreported employ-ment on the part of employees, and even illegal manufacturing plantsbecause the plant owners could not register their plants since all or almostall employees receive salaries lower than the m i n i m u m wage. In the moneymarket, the ceiling imposed on the interest rates often drives funds fromthe officially organized market to the unorganized market because interestrates in the organized market are closely controlled, while it is not possibleto enforce such interest ceilings on loans in the unorganized market. Theresult is that a sizable amount of interest income from loans in the unor-ganized market is not taxed because it has not been reported to the taxauthorities. In the foreign exchange market, if exchange rates are fixedartificially and differently from equilibrium rates, then a black market forforeign exchange is likely to develop. Such a market is not only illegal initself but it also facilitates the operation of other illegal activities such asdrug trafficking, smuggling, and illegal trade in arms and ammunition bymaking available foreign currencies needed for such activities, which oth-erwise would be available only through official channels.
Government Rules and Regulations
The preponderance of rules and regulations imposed by the governmenttends to increase tax evasion. This is because in an economy where thereare too m a n y and too complicated rules and regulations governing busi-ness practices, it is generally difficult, often not profitable, and sometimesimpossible to do business legally. Thus , businesses have to find some waysto get around such rules and regulations and often have to do businessillegally. For example, rules laid d o w n to restrict trade—such as importquotas, import licensing, and import prohibitions—often lead to the prob-lem of smuggling, which in itself is an evasion of customs duties and whichgenerates other black markets. Once the black markets are started, tax
24For example, in India, rent controls have given rise to a system called "pugree," in whicha substantial amount of money is received by the landlord, in cash, before the property isrented at the controlled rent. Pugree is a premium paid illegally to the landlord, outside thebooks of account at the time of change of tenancy of the property. The payment is usuallym a d e out of unaccounted money.
©International Monetary Fund. Not for Redistribution
168 SOMCHAI RICHUPAN
evasion follows automatically. Other examples of rules and regulationsgoverning business practices are prohibitions, rationing, forced sales ofcommodities to the government or to the marketing board, town and cityplanning regulations, factory acts, permits to produce certain goods, andlicenses required to start a shop.
Public Sector Salaries
Public officials have certain responsibility and authority which caneither be used for providing public services or be abused for private bene-fit. If the salaries of such officials are not commensurate with their respon-sibility and authority, the temptation for them to abuse such authority andresponsibility is high. Moreover, if their salaries are so low that they cannotmaintain a reasonable standard of living, it is likely that they will find waysto supplement their income via legal or illegal means . If illegal means areused by officials other than tax officials, these are likely to have an indirecteffect on increasing tax evasion. If such means are used by tax officials,these are likely to have both indirect and direct effects in increasing taxevasion.
Government's Expenditure Policy
Taxes finance government expenditures, which in turn are expended forthe well-being of taxpayers. This is the justification for taxes and govern-ment expenditures. However, when taxpayers start to question the justifi-cation for either the size or the pattern of expenditures, or both, then theyare unwilling to pay taxes, at least in the amount for which they are liable.For example, taxpayers m a y see no justification for the large size of thebudget because they do not see w h y the government has to be so luxurious,or why they have to pay tax to support public servants w h o live m u c h morelavishly than they do. O r , taxpayers m a y disagree with the government'sspending policies such as defense spending or spending on welfare. In sucha case, they will be unwilling to pay tax and such an unwillingness leadsthem to find ways of reducing their tax liability through legal or illegalmeans . This leads to either tax avoidance or tax evasion. Such evasion isbased purely on political considerations.
Other Factors
Other nontax factors affecting tax evasion are, for example, the level ofeducation of the population and the stage of development of the economy.The level of education of the population influences tax evasion in two ways.First, a better educated population is more likely to have a better under-
©International Monetary Fund. Not for Redistribution
DETERMINANTS OF INCOME TAX EVASION 169
standing of the tax system and its purposes; thus, the chance that they willviolate tax laws because of ignorance or because not enough attention ispaid to the tax system, is reduced. Second, a well-educated population ismore likely to k n o w h o w the tax system works and thus can reduce its taxliabilities through utilization of various relief provisions available in thetax laws, thereby reducing the necessity to evade tax.
The stage of development of the economy can indirectly affect tax eva-sion. In developing countries, economic activities are conducted in a m a n -ner that does not lend itself to easy tax enforcement. In such countries, theagricultural sector is relatively large, the share of the self-sufficient econ-o m y in the total economy is high, the share of the nonmonetized economyto total gross domestic product is high, and small and scattered productionunits are more prevalent. Such circumstances hinder the effectiveness ofthe tax enforcement mechanism and create greater temptation and oppor-tunity for tax evasion.
It would seem that not only the validity of the above argument concern-ing tax and nontax factors affecting tax evasion but also the extent towhich such factors influence tax evasion can be tested empirically by usingthe regression technique. Such tests would enable us to explain why andh o w tax evasion differs between developing and developed countries. H o w -ever, the absence of a well-defined and generally accepted measurement oftax evasion25 prevents us from making such a test. Thus, we have to rely onqualitative evaluation of such factors and we will do so for the developingcountries in the next subsection.
T a x Evasion U n d e r Developing Country Circumstances:S o m e Explanations
W e have investigated both tax and nontax factors that affect tax eva-sion. W e can n o w evaluate them with a view to shedding some light on theextent of tax evasion in developing country circumstances.
Until recently, the rate structures of the income tax in most developingcountries have been highly progressive with respect to the absolute amountof income. Such high progressivity is likely to lead to high tax evasion,since, as has been shown, a progressive tax rate structure encourages taxevasion. The high progressivity of the income tax in developing countries isa result of historical developments in the tax systems of these countries.
The income tax laws of most developing countries are adapted from thetax laws of well-developed societies. As a result, on the one hand, one can
25For a review of the techniques for measurement of tax evasion, see Richupan (1984a and1984b).
©International Monetary Fund. Not for Redistribution
170 SOMCHAI RICHUPAN
find a very sophisticated income redistribution scheme as well as built-instabilizing measures in most of the tax laws—regardless of the stage ofdevelopment of the countries. O n the other hand, one also finds generousexemptions and relief for the promotion of development. The combinationof generous exemptions and relief while there is pressing need for revenueto finance development and income redistribution concerns have led mostdeveloping countries to enforce highly progressive income tax systems.
Penalty rates in developing countries are quite varied. S o m e countrieshave rather high rates, while others have low rates. In m a n y developingcountries, only fixed fines are imposed, which are often out of date. Withhigh rates of inflation, unless fixed fines are changed frequently, they be-come obsolete very rapidly. M a n y developing countries do not distinguishbetween penalties and interest, and charge only penalties without charginginterest on the evaded tax. The penalties are charged as a percentage ofeither the evaded income or the evaded tax without any time dimension.Thus , the absence of interest charged on the evaded tax further weakensthe effect of penalties. Since high penalty rates are rarely enforced, thedeterrent effects of penalty rates in developing countries are likely to be lowand therefore tax evasion is likely to be high.
The probability of detection depends on the efficiency of tax administra-tion. Since tax administration in the developing countries is relatively inef-ficient, the probability of detection is likely to be low. Thus , tax evasion islikely to be high.
Price control is normally implemented because of equity considerationsand is generally designed either to m a k e goods or services that are subjectto such control available to the public at the controlled low prices or toguarantee a certain m i n i m u m income level (in the case of the price oflabor—the m i n i m u m wage). Price control is practiced more frequently indeveloping countries than in developed countries because of the greaterneed in developing countries to take into account equity considerations inconducting public policy. This is because, in general, personal income ismore unevenly distributed in developing countries.26 In the goods and ser-vices market, one generally finds that prices of essential goods are con-trolled either because of shortage of supply due to low productive capacity(in the case of goods domestically produced and consumed), or because ofhigher prices in foreign markets (in the case of domestically producedgoods for domestic consumption as well as for export), or because of thelack of foreign exchange (in the case of imported goods). These occur-
26See, for example, Sen (1980).
©International Monetary Fund. Not for Redistribution
DETERMINANTS OF INCOME TAX EVASION 171
rences are more frequent in developing countries than in developed coun-tries. Thus , price controls are more prevalent in developing than in devel-oped countries. In the factor market, rent control and the m i n i m u m wageare widely practiced in developing countries. In the money market, interestrates in the organized market are relatively inflexible, but the unorganizedor parallel money market is very popular, whereas such a market is insig-nificant in developed countries. In the foreign exchange market, most de-veloping countries use some form of fixed exchange rates, while the ex-change rates in the major industrial countries are floating. Furthermore,most developing countries often experience balance of payments deficitsand foreign exchange shortages because their foreign exchange earningsdepend mainly on exports of primary products that fluctuate greatly eitherbecause of weather conditions or because of the fluctuation in the worldmarket prices, over which they have no control. Fixed exchange rates,coupled with a high frequency of balance of payments deficits, lead to ablack market for foreign exchange, which in turn leads to tax evasion.
O n the extent to which the government regulates the economy throughrules and regulations, there are no a priori reasons for stating whether it ismore or less widely practiced in the developed or the developing countries.However, in some specific areas, for example, in import control, one canfind a higher frequency of controls in developing countries than in devel-oped countries, because foreign currency shortages occur more often in thedeveloping countries.
In developing countries, there is often a large gap between the salaries ofpublic employees and the income level needed for a reasonable standard ofliving, while such a gap is rarely observed in developed countries. This gapusually leads to either legal or illegal supplementary income. The unex-plainable supplementary income of public officials contributes directly orindirectly to higher tax evasion.
Concerning the level of education and the stage of economic develop-ment, it is obvious that these are lower in developing countries than indeveloped countries. Thus , tax evasion due to these factors is likely to behigher in the former than in the latter.
T o summarize, the developing country circumstances are characterizedby a highly progressive nominal tax structure, ineffective penalty deter-rents, low probability of detection, impaired horizontal fiscal equity, pre-vailing price controls in all markets, a moderate degree of governmentrules and regulations, a large gap between public sector salaries and a rea-sonable standard of living, low level of taxpayer education, and low stageof development. Since such circumstances stimulate tax evasion, it is likelyto be higher in developing countries than in developed countries.
©International Monetary Fund. Not for Redistribution
172 SOMCHAI RICHUPAN
VII. Conclusions
This chapter has reviewed the theoretical and empirical literature con-cerning factors affecting tax evasion behavior and the policy measures forthe deterrence of such behavior. Since only tax factors are analyzed in theliterature, for the sake of completeness, the chapter has also explored non-tax factors in a separate section and has evaluated developing country cir-cumstances concerning such tax and nontax factors.
Theoretical and empirical studies dealing with the effect of tax rates ontax evasion give contradictory and inconclusive results. Theoretical studiesindicate that such effects are indeterminate if the penalty is a function ofthe evaded income, negative if the penalty is a function of the evaded tax,and positive only if the penalty is imposed on the evaded income and theincrease in the tax rate is accompanied by a reduction in the lump-sumtransfer in such a way that the government's revenue remains unchanged.O n the other hand, empirical studies suggest that such an effect is positivewithout any condition on the revenue of the government. However, boththe theoretical and the empirical studies indicate that the effects of thepenalty and the probability of detection on tax evasion are negative. Inaddition, theoretical studies indicate that in a situation where tax evasionexists, a regressive tax structure tends to generate the highest governmentrevenue and a proportional tax structure tends to generate higher revenuethan a progressive structure. O n the effect of fiscal inequity, empiricalstudies confirm the belief that tax evasion is high a m o n g victims of fiscalinequity and low a m o n g beneficiaries of fiscal inequity.
O n policy measures for the deterrence of tax evasion, both the theoreti-cal and the empirical studies suggest that the penalty rate is more effectivethan the probability of detection. A m o n g administrative measures for theprevention of tax evasion, withholding schemes seem to hold the greatestpromise.
T h e nontax factors explored are price distortion, the extent of govern-ment rules and regulations governing business practices, the extent towhich the public sector salaries are lower than the level required for a rea-sonable standard of living, the faith in the government's expenditure pol-icy, as well as the level of education of the population and the stage ofdevelopment of the economy. Evaluations of both tax and nontax factors indeveloping countries suggest that such factors appear to exist in develop-ing countries to such a degree that they create circumstances that arehighly conducive to tax evasion. Thus , the particular circumstances of de-veloping countries leads one to question whether supply-side tax policy byitself will be able to discourage income tax evasion in these countries.
©International Monetary Fund. Not for Redistribution
DETERMINANTS OF INCOME TAX EVASION 173
REFERENCES
Allingham, Michael G . , and Agnar Sandmo, "Income Tax Evasion: A TheoreticalAnalysis," Journal of Public Economics (Amsterdam), Vol. 1 (November1972), pp. 323-38.
Arrow, K.J . , Essays in the Theory of Risk-Bearing (Chicago: Markham PublishingCompany, 1971).
Christiansen, Vidar, " T w o Comments on Tax Evasion," Journal of Public Eco-nomics (Amsterdam), Vol. 13 (June 1980), pp. 389-93.
Clotfelter, Charles T . , "Tax Evasion and Tax Rates: A n Analysis of IndividualReturns," Review of Economics and Statistics (Cambridge, Massachusetts),Vol. 65 (August 1983), pp. 363-73.
Cross R . B . , and G . K . Shaw, "The Evasion-Avoidance Choice: A Suggested Ap-proach," National Tax Journal (Columbus, Ohio), Vol. 34 (December 1981),pp. 489-91.
Enrick, Norbert Lloyd, " A Pilot Study of Income Tax Consciousness," NationalTax Journal (Columbus, Ohio), Vol. 16 (June 1963), pp. 169-73.
Friedland, Nehemiah, Shlomo Maital, and Aryeh Rutenberg, " A SimulationStudy of Income Tax Evasion," Journal of Public Economics (Amsterdam),Vol. 10 (August 1978), pp. 107-16.
Goode, Richard, "Some Economic Aspects of Tax Administration," Staff Papers,International Monetary Fund (Washington), Vol. 28 (June 1981), pp. 249-74.
Henry, James S., "Noncompliance with U . S . Tax Law—Evidence on Size,Growth, and Composition," in Income Tax Compliance: A Report of theABA Section of Taxation, Invitational Conference on Income Tax Compli-ance (Reston, Virginia, March 1983), pp. 15-112.
Herschel, Federico J., "Tax Evasion and Its Measurement in Developing Coun-tries," Public Finance (The Hague), Vol. 33, No . 3 (1978), pp. 232-68.
Higgins, Benjamin, Economic Development: Principles, Problems, and Policies(New York: Norton, 1959).
India, Report of the Direct Taxes Administration Enquiry Committee, 1958-59(New Delhi: Government of India Press, 1960).
India, Administrative Reforms Commission, Report of the Working Group onCentral Direct Taxes Administration, January 1968 (New Delhi: Governmentof India Press, 1969).
Kaldor, Nicholas, Indian Tax Reform: Report of a Survey (New Delhi: Depart-ment of Economic Affairs, Ministry of Finance, 1956).
Koskela, Erkki (1983a), " A Note on Progression, Penalty Schemes and Tax Eva-sion," Journal of Public Economics (Amsterdam), Vol. 22 (October 1983),pp. 127-33.
- (1983b), " O n the Shape of Tax Schedule, the Probability of Detection, andthe Penalty Schemes as Deterrents to Tax Evasion," Public Finance (TheHague), Vol. 38, No . 1 (1983), pp. 70-80.
McCaleb, Thomas S., "Tax Evasion and the Differential Taxation of Labor and
©International Monetary Fund. Not for Redistribution
174 S O M C H A I R I C H U P A N
Capital Income," Public Finance (The Hague), Vol. 31, No . 2 (1976), pp.287-94.
Mork, Knut Anton, "Income Tax Evasion: Some Empirical Evidence," PublicFinance (The Hague), Vol. 30, No . 1 (1975), pp. 70-76.
Nayak, P . B . , "Optimal Income Tax Evasion and Regressive Taxes," PublicFinance (The Hague), Vol. 33, No . 3 (1978), pp. 358-66.
Pratt, John W . , "Risk Aversion in the Small and in the Large," Econometrica(Evanston, Illinois), Vol. 32 (January-April 1964), pp. 122-36.
Ratti, Ronald A . , and Parthasarathi Shome, "The General Equilibrium Theory ofTax Incidence Under Uncertainty," Journal of Economic Theory (New York),Vol. 14 (February 1977), pp. 68-83.
Richupan, Somchai (1984a), "Income Tax Evasion: A Review of the MeasurementTechniques and Some Estimates for the Developing Countries" (unpublished,International Monetary Fund, July 23, 1984).
- (1984b), "Measuring Tax Evasion," Finance & Development (Washing-ton), Vol. 21 (December 1984), pp. 38-40.
Sandmo, Agnar, "Income Tax Evasion, Labour Supply, and the Equity-EfficiencyTradeoff," Journal of Public Economics (Amsterdam), Vol. 16 (December1981), pp. 265-88.
Schmolders, G . , Das Irrationale in der Offentlichen Finanzwirtschaft (Hamburg:Verlag Rowohlt, 1960).
Sen, Amartya, "Levels of Poverty: Policy and Change," World Bank Staff Work-ing Paper No . 401 (Washington, 1980).
Singh, Balbir, "Making Honesty the Best Policy," Journal of Public Economics(Amsterdam), Vol. 2 (July 1973), pp. 257-63.
Spicer, Michael W . , and Lee A . Becker, "Fiscal Inequity and Tax Evasion: A nExperimental Approach," National Tax Journal (Columbus, Ohio), Vol. 33(June 1980), pp. 171-75.
Spicer, Michael W . , and S.B. Lundstedt, "Understanding Tax Evasion," PublicFinance (The Hague), Vol. 31, No . 2 (1976), pp. 295-305.
Srinivasan, T . N . , "Tax Evasion: A Model," Journal of Public Finance (Amster-dam), Vol. 2 (November 1973), pp. 339-46.
Strumpel, B . , "The Contribution of Survey Research to Public Finance," in Quan-titative Analysis of Public Finance, ed. by Alan T . Peacock (New York:Praeger, 1969).
Tanzi, Vito (1983a), "Tax Systems and Policy Objectives in Developing Countries:General Principles and Diagnostic Tests" (unpublished, International Mone-tary Fund, November 28, 1983).
- (1983b), "The Underground Economy: The Causes and Consequences ofthis Worldwide Phenomenon," Finance & Development (Washington), Vol.20 (December 1983), pp. 10-13.
United States, Internal Revenue Service, Office of the Assistant Commissioner(Planning and Research), Taxpayer Compliance Measurement Handbook(September 1977).
Yitzhaki, Shlomo, " A Note on Income Tax Evasion: A Theoretical Analysis,"Journal of Public Economics (Amsterdam), Vol. 3 (May 1974), pp. 201-202.
©International Monetary Fund. Not for Redistribution
7Evidence on the Laffer Curve
The Cases of Jamaica and India
Liam P. Ebrill
This chapter evaluates the appropriateness of the tax reform proposalsadvocated by the so-called popular supply-side approach to economic pol-icy in developing countries. T h e particular focus here is on the Laffer curveitself; that is, on the highly publicized proposition that it is possible fornominal tax revenue to increase when tax rates are reduced. The analysisattempts to determine whether examples of the Laffer curve exist in devel-oping countries.
Section I of the chapter begins with a s u m m a r y of the more importanttenets of the popular supply-side approach as they apply to tax reform,followed by a discussion of those instances in which supply-side policies areheld to have been successfully applied in developing countries. It is arguedthat some of the claims of the supply-side approach have yet to be d e m o n -strated. Section II discusses in greater detail the cases of Jamaica andIndia, two developing countries in which, for whatever reason, tax changes(including some reforms) of relevance to the Laffer curve proposition hadbeen implemented even before 1985 when this study was completed. A nattempt is m a d e to evaluate these (pre-1985) tax changes. Finally, in Sec-tion III, it is argued that, given the limited nature of the data available, theempirical tests lack sufficient discriminatory power to permit a definitiveresolution of whether any given set of observations is consistent with theLaffer curve. If, as is likely, the quality of the data available for the twocases examined is typical of that for developing countries, the most impor-tant conclusion must be that assertions to the effect that developing coun-tries are operating in regions of the Laffer curve, where tax rate reductionswould lead to revenue increases, should be treated with caution.
175
©International Monetary Fund. Not for Redistribution
176 LIAM P. EBRILL
I. The Supply-Side Approach
The literature on the popular supply-side approach to economic policy isby n o w voluminous. It is not the intent to summarize here the content ofthat literature and its relationship to the traditional public finance litera-ture, since that has already been done elsewhere.1 Rather, this chapter fo-cuses on those elements of the popular supply-side approach that bearmost directly on the issue of the Laffer curve.
S u m m a r y of Theoretical Discussion
Briefly, the proposition of the Laffer curve takes as its starting point thesimple notion that tax revenue is zero if the tax rate is either zero or 100percent, with a smooth relationship between tax rates and tax revenuesconnecting these two polar points.2 The existence of such a relationshipsuggests that if tax rates are sufficiently high—that is, if tax rates are inwhat the supply-siders refer to as the "prohibitive range"—then a reduc-tion in tax rates could lead to an increase in tax revenues.
O n what does the existence of the Laffer curve depend? Borrowing fromBlinder (1981), consider the specific example of a proportional tax on la-bor income. If w is the gross wage rate and w(1 — t) the net tax wage rate,if S(w(1 — t)) is the supply of labor function, with S(0) = 0 by assumption,and if D(w) is the demand function for labor, it can be shown that, for G(t)continuous and differentiate, revenue responds to variation in the mar -ginal tax rate as
1See Gandhi (Chapter 1). Readers interested in examining some of the original sources arereferred to Meyer (1981); Bartlett (1982); Federal Reserve Bank of Atlanta (1982); Fink(1982); Hailstones (1982a, 1982b); Raboy (1982); Canto, Joines, and Laffer (1983); Wanniski(1983); and Roberts (1984); and also to the other publications listed in the Selected Bibliogra-phy in Appendix II.
2 W e leave aside here the issue of whether this concept should be credited to Laffer. Currentconventional wisdom maintains that the basic concept has m a n y antecedents. Bartlett (1982)accords the honor of first discovery of the Laffer curve to Ibn Khaldun, a fourteenth centuryArabic philosopher.
(1)
(2)
where G is revenue and ni, i = S, D , refers to the relevant elasticities oflabor supply and d e m a n d . Given the assumptions, equation (1) yields theLaffer curve. It follows that the revenue-maximizing tax rate t* can befound by setting equation (1) equal to zero, yielding
©International Monetary Fund. Not for Redistribution
E V I D E N C E O N T H E LAFFER C U R V E 177
where nD < 0. A s pointed out by Blinder, even if both elasticities are ashigh as 2, t* is still as high as two thirds.
Proponents of the supply-side approach believe that the relevant elastic-ity values are very high. There is considerable variation a m o n g the supply-siders, however, when it comes to defining the economic environment, andhence the relevant elasticities, in which the tax reduction is set.
S o m e establish a traditional neoclassical framework of a closed generalequilibrium framework with flexible prices and full employment. They im-plicitly conduct a balanced-budget incidence exercise—whatever tax reve-nue is raised is reinjected back into the economic system via governmentexpenditures. In such an environment, aggregate income effects can onlyoccur if the pattern of government expenditures differs substantially fromthe pattern of expenditures that would have resulted in the absence of gov-ernment intervention. Even then, the income effects are not likely to belarge. The appropriate focus of tax policy analysis then becomes the exam-ination of the magnitude of the substitution effects that are the inevitableoutcome of the relative price movements induced by tax changes. ForLaffer-style propositions to be correct, compensated elasticities of substi-tution would have to be sufficiently high. The argument of supply-siderspresumably is that such is the case because m a n y of the tax rates currentlyin force in m a n y countries are very high. Even though a reduction in taxrates leads to a reduction in revenue per unit, the concomitant reduction inprice (increase in net wages) leads to such an increase in the d e m a n d forthe commodity (supply of labor) as to imply an increase in tax yield in theaggregate. A n excellent example of work founded on such neoclassical mi-croeconomic grounds is Canto, Joines, and Laffer (1983).
S o m e supply-siders have argued for higher elasticity values by implicitlychanging the base for the tax. This change is to counter the criticism ofthose w h o argue that the large elasticities required to generate Laffer-typeeffects are most unlikely to exist for broadly based taxes. For example,Blinder (1981), in his critique of the Laffer curve, argues that it would bem u c h better to apply supply-side analysis to narrowly based taxes.3 In re-sponse, some supply-siders have emphasized the role of tax evasion. Thus
3 A n example of a Laffer-type effect is the case of N e w Hampshire liquor taxes. It is arguedthat a reduction in that state's liquor tax rate could well lead to an increase in tax revenuebecause an incentive would then be provided to consumers to come in from out of state,notably from Massachusetts, to purchase alcohol. The essence of this argument is that N e wHampshire alcohol and out-of-state alcohol are close substitutes, implying highly elastic be-havior on the part of purchasers. M o r e generally, this example suggests that, the smallergeographically is the taxing jurisdiction, the greater are the possibilities for Laffer curve ef-fects associated with changes in the level of taxation of a mobile factor. This could be impor-tant in a developing country context.
©International Monetary Fund. Not for Redistribution
178 L I A M P. EBRILL
it m a y be the case that, although labor supply in the aggregate is not veryelastic, the supply of labor to the official market economy (as opposed tothe underground economy) is m u c h larger. This is precisely one of the ef-fects advanced by Bartlett (1982) in support of tax rate reductions: m a r -ginal tax rate reductions provide an incentive for labor to exit from theunderground economy, thereby increasing tax revenue.
This last argument is perfectly consistent with a neoclassical framework.S o m e , though by no means all, supply-side economists rely in addition onshort-run macroeconomic considerations. Specifically, if an economy isexperiencing excess unemployment, tax cuts stimulate the economy—pre-sumably by the way they influence consumer expectations and liquidity—so m u c h that revenues increase. This appears to be the characterization ofthe Laffer curve contained, for example, in Roberts (1984, p. 27). Notethat income effects again play a role, though here they are due to changesin aggregate d e m a n d , changes that are precluded in a neoclassical frame-work.4 The nature of the elasticities implied by this analysis is markedlydifferent from that envisaged by other authors.5 Representative empiricalwork on the possibilities for revenue-increasing tax reductions in devel-oped countries is discussed in the Annex to this chapter.
Irrespective of the precise mechanism underlying the Laffer curve, thereis a consensus a m o n g the supply-side economists as to the appropriate di-rection of tax reform. Since reductions in marginal tax rates lead to reve-nue increases only if tax rates are very high, the preferred reform involvesreductions in the highest marginal tax rates on income (see, for example,Canto, Joines, and Laffer (1981) and Wanniski (1983)).
Although it is clearly a supply-side concept, there is no sense in which
4 A similar, though more neoclassical, characterization of the Laffer curve can be found inBartlett (1982). With reference to the economy of H o n g K o n g , he argues that a reduction intax rates led to an acceleration in growth rates and, thus, to revenue increases (an incomeeffect).
5 A further potential short-run macroeconomic effect has been pointed out to m e . T o theextent that a tax cut stimulates economic activity, the resultant increase in the transactionsd e m a n d for money could allow the government to finance some of its expenditures throughmoney creation. As an aside, one might also note a particular supply-side perspective thatapplies to those at lower income levels. It is argued that the various unemployment and socialsecurity compensation schemes in m a n y developed countries have tended to m a k e it unprofit-able for the unemployed to seek work. At the microeconomic level, accordingly, this line ofreasoning says that the discrete decision to work or not to work is influenced by tax-inducedor unemployment-compensation-induced income effects. Given the low level, both relativeand absolute, of social welfare payments in most developing countries, however, it is unlikelythat these effects would be important in the context of this chapter. They are therefore nottreated in what follows.
©International Monetary Fund. Not for Redistribution
EVIDENCE O N THE LAFFER CURVE 179
the Laffer curve encompasses the entirety of the supply-side approach. If itdid, it would imply that increasing government revenue was an importantobjective of supply-side economists. That objective would obviously runcounter to other goals of the supply-side program, most notably a reduc-tion in the size of the government sector. In more general perspective, con-cern is focused on improving the production efficiency of economic sys-tems.6
In essence, then, the primary concern of supply-siders is to ensure that,whatever the degree of government intervention in the workings of privatemarkets, government intervention should occur in the most efficient m a n -ner possible. The Laffer curve is important since, if Laffer effects do existin any given economy, they are extreme examples of inefficient interven-tion.
S u m m a r y of Empirical Evidence
The bulk of the empirical evidence advanced by supply-siders to supporttheir position is concerned with economic policy in the United States (for asummary of this and related material, see the Annex to this chapter). Em-pirical analysis considering developing countries is scarcer and such resultsas exist are superficial, frequently based on a simple correlation betweensome change in a country's tax structure and the subsequent economic per-formance of that country. A supply-side writer w h o has devoted consider-able attention to circumstances in developing countries is Wanniski(1983). H e argues that m a n y developing countries have adopted extremelyprogressive income tax structures where this is presumably a source of ma-jor disincentives. Leaving aside the question of h o w one can interpret theeffective progressivity of a nominal tax structure given the plethora of de-ductions and exemptions as well as the low monetary income levels in m a n ydeveloping countries, consider h o w Wanniski utilizes the income tax infor-mation. In particular, consider his discussion of the effects of tax policychanges in India (Wanniski (1983, p. 258, et seq.)). H e ascribes the "ex-traordinary quiescence" that descended on India, after a period of politi-cal turmoil, to the tax changes introduced by Finance Minister Subrama-
6 T o quote Wanniski from evidence he presented before the U . S . Congress Task Force onTax Policy (U .S . Congress (1981, p. 41)):
" T o the supply-sider, the producer is the active participant. . . . The government . . .regulates the marketplace in the interests of all producers. . . . The supply-sider is not perse a tax cutter. If the supply-sider believes the efficiency of production will be enhancedover time by more public roads . . . he will urge that they be financed by borrowing ortaxing away a greater share of the producer's production."
©International Monetary Fund. Not for Redistribution
180 L I A M P. EBRILL
nian in 1975. These tax changes were very m u c h in the supply-side m o d e inthat they involved reductions in the highest marginal income tax rates (cutto 77 percent from 85 percent), corporate tax rates, and wealth tax rates.Further rate reductions and bracket changes were m a d e in April 1976 as aresult of unexpected revenue buoyancy. These in turn, it is argued, stimu-lated even more dramatic economic growth. As implied above, the troublewith this type of reasoning is that it is suggestive but perhaps overly sim-plistic.
K w o n (1984) has examined the case of Korea. Working at an aggregatelevel, he concluded that the behavior of tax revenues over time as tax rateswere increased is not inconsistent with the existence of a Laffer curve.However, he also concluded that Korean income tax rates do not appear tobe such as to have placed Korea over the Laffer "hill."
In the remainder of this chapter a few examples of tax changes in devel-oping countries—changes of the supply-side type—are examined. Specifi-cally, the next section considers the effects of reductions in top marginalincome tax rates on income tax revenues in Jamaica and India.
II. Supply-Side Effects and the Personal Income Tax
A n obvious problem with any empirical test of the existence of Laffercurve effects in developing countries is the paucity of the data available.W h a t are the minimal requirements that such data should satisfy, giventhat the approach being used here is to consider countries on a case-by-case basis?
Empirical Methodology
First, and trivially, the examples selected should be of cases in which topmarginal tax rates have been changed. The tax rate reductions undertakenby Jamaica and India satisfy this criterion. Second, because attention isfocused on the behavior of those facing the highest marginal tax rates, abreakdown of taxable income and taxes paid by income level both beforeand after the tax change is required. Data of this type are available forIndia, but for Jamaica all that is available is a breakdown of the number ofpay-as-you-earn ( P A Y E ) taxpayers by income level for the relevant years.Third, it is essential that any exercise of this type control for other factorsthat might influence the outcome. This requirement exposes the greatestweakness of the study. With the exception of the influence of inflation andgrowth, it proved impossible to control for these other factors. For the caseof inflation, over time, as nominal incomes increase, there is a tendency fortax revenues to increase more than proportionately because of the progres-
©International Monetary Fund. Not for Redistribution
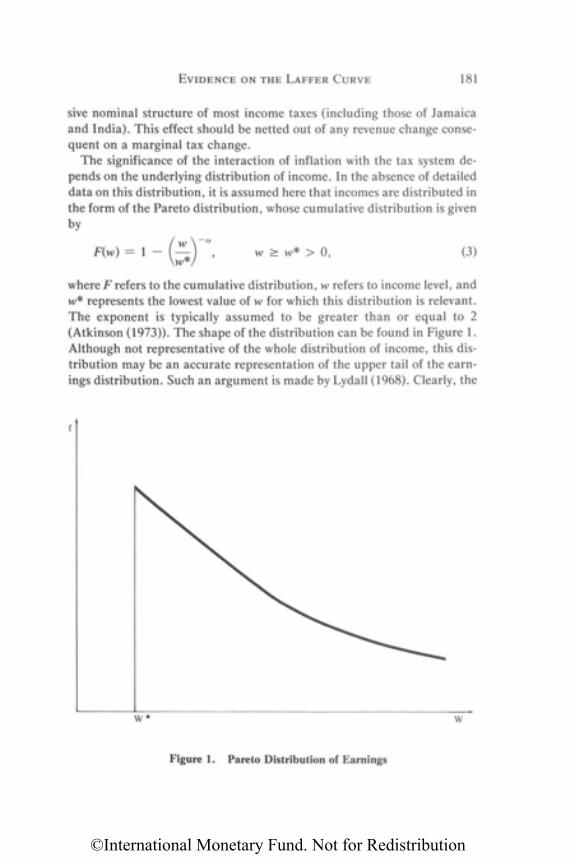
EVIDENCE ON THE LAFFER CURVE 181
sive nominal structure of most income taxes (including those of Jamaicaand India). This effect should be netted out of any revenue change conse-quent on a marginal tax change.
The significance of the interaction of inflation with the tax system de-pends on the underlying distribution of income. In the absence of detaileddata on this distribution, it is assumed here that incomes are distributed inthe form of the Pareto distribution, whose cumulative distribution is givenby
(3)
where F refers to the cumulative distribution, w refers to income level, andw * represents the lowest value of w for which this distribution is relevant.The exponent is typically assumed to be greater than or equal to 2(Atkinson (1973)). The shape of the distribution can be found in Figure 1.Although not representative of the whole distribution of income, this dis-tribution m a y be an accurate representation of the upper tail of the earn-ings distribution. Such an argument is m a d e by Lydall (1968). Clearly, the
Figure 1. Pareto Distribution of Earnings
©International Monetary Fund. Not for Redistribution
182 L I A M P. EBRILL
upper tail of the income distribution is of great concern to this study. Apositive rate of inflation implies, other things being equal, that the wholedistribution shifts to the right.7 W h a t does this imply about the number oftaxpayers in each given nominal income tranche? Given that the distribu-tion is not uniform, there will be a tendency for the number of taxpayersin each income tranche to increase at a more rapid rate than the rate ofinflation.
T o refine this statement somewhat, note that an alternative way to m e a -sure the effect of inflation is to hold the distribution constant and to reducethe nominal income values. Thus , the elasticity of the number of taxpayersin any given income slice to the rate of inflation is the same as the elasticityof the area to the left of any given income level, w , to a reduction in thatincome level. Given the specification of the cumulative distribution, thatarea, A(w), is
7 The analysis could as easily consider the case of real growth. Note that the implicit as-sumption is being m a d e at this stage that, whatever the source of nominal income growth, it isaffecting all income levels uniformly. This assumption is dictated by data inadequacies.
(4)
(5)
from which it follows
Equation (5) is the elasticity of the relevant area for increases in w . Hence,if a = 2.5 say, a 10 percent increase in the rate of inflation will, otherthings being equal, cause a 25 percent increase in the number of taxpayersin each income slice in the upper tail. (The choice of a cannot be confirmedempirically here, though Lydall (1968) reports estimated values can oftenexceed 2.) A similar line of reasoning can be used to describe the changesin the number of taxpayers as a result of economic growth.
The importance of this result is that, for a given tax system, a is also theelasticity of tax revenues; that is, the elasticity of both the number of tax-payers and of tax revenue in response to uniform increases in nominal in-come is, for a given tax structure, equal. The analysis draws on Hutton andLambert (1979).
T o see this relationship, define Y to be total income and R(Y) to be totaltax revenue. T h e definition of the tax elasticity is then given byn = Y - R'(Y)/R(Y). Let t(w) be the tax payable on income level w , with(0 < w < oo), and let f(w) be the frequency density of that income for apopulation level. Then the elasticity can be re-expressed as
©International Monetary Fund. Not for Redistribution
EVIDENCE O N THE LAFFER CURVE 183
Substituting for the Pareto distribution, it follows by differentiating equa-tion (3) that
F r o m integrating the numerator by parts, it follows that
n = a, (8)
which is also the elasticity of the n u m b e r of taxpayers. Hence, for a = 2.5,a 10 percent increase in the rate of inflation will, other things being equal,yield a 25 percent increase in tax revenue in each income slice in the uppertail of the distribution. Discrepancies are, of course, possible. In particu-lar, contrary to assumption, nominal incomes for the relevant incomegroups might not rise in line with inflation. Finally, note that the resultthat n = a greatly alleviates any problems that might arise because thedistribution data available for Jamaica are in numbers of taxpayers.
T h e value of a is determined by the distribution of income based oncross-section data. Presumably, this value, therefore, already reflects thedecisions of income earners in response to the given tax structure. O n theassumption that all individuals have the same preferences concerning thework-leisure trade-off, the value of a then incorporates the disincentive
(7)
(6)
from which it follows
©International Monetary Fund. Not for Redistribution
184 LIAM P. E B R I L L
effects that individual taxpayers face as they move into higher tax bracketsin response to nominal increases in income.
The analysis has to be modified to account for the fact that the tax struc-ture has changed. In particular, top marginal tax rates have been reduced.O n e way of accommodating this reduction is to interpret a as the elasticityof the tax base. The product of the change in the tax base and the averagechange in tax rates can then be used to calculate the approximate changein tax revenue and, hence, to evaluate the Laffer curve hypothesis.
With the preceding subsection as background, we now consider the spe-cifics of the two cases selected.
Jamaica
The structure of the progressive Jamaican personal income tax is pre-sented in Table 1. This structure has been subject to a number of changes,which can be classified into two types. First, the Jamaican authoritiesm a d e some attempt to adjust the income tranches for inflation—this wasthe primary motivation for the changes that became effective January 1,1975. It is clear, however, that the effects of inflation were not fully accom-modated by these changes. Thus, nominal per capita gross domestic prod-uct ( G D P ) increased from J$626 in 1970 to J$2,195 in 1980, a period ofnegligible real growth which indicates a high rate of nominal incomegrowth. Second, the highest marginal tax on incomes was increased from60 percent to 80 percent. This presumably represents a deliberate attemptto increase tax revenues by raising the tax rates faced by wealthier individ-uals in Jamaica.
The above is purely descriptive. Before examining the disincentive ef-fects implied by this tax structure, or indeed whether this tax system mightimply that Jamaica is operating in the prohibitive region of its Laffer curve,it is important to determine the effective tax rates implied by Table 1. T odo so, one first might ask what is the economic incidence of an income taxon earned income. This paper adopts the traditional assumption that thetax is borne by labor, a view consistent with the incidence analysis of ageneral factor tax in a closed economy framework with fixed aggregatesupplies. Use of this assumption, however, m a y not be entirely appropri-ate. It is not correct if aggregate factor supplies are endogenous, as theywould be in the long run (Feldstein (1974a, 1974b)) or if the economy isopen. The latter consideration could be important for Jamaica and should,therefore, be kept in mind. For example, if the net impact of a progressiveincome tax is for skilled labor to emigrate, some of the burden of the taxm a y well be shifted to other factors. (This might be particularly true iflabor is heterogeneous with specific skills and if some of the commodities
©International Monetary Fund. Not for Redistribution
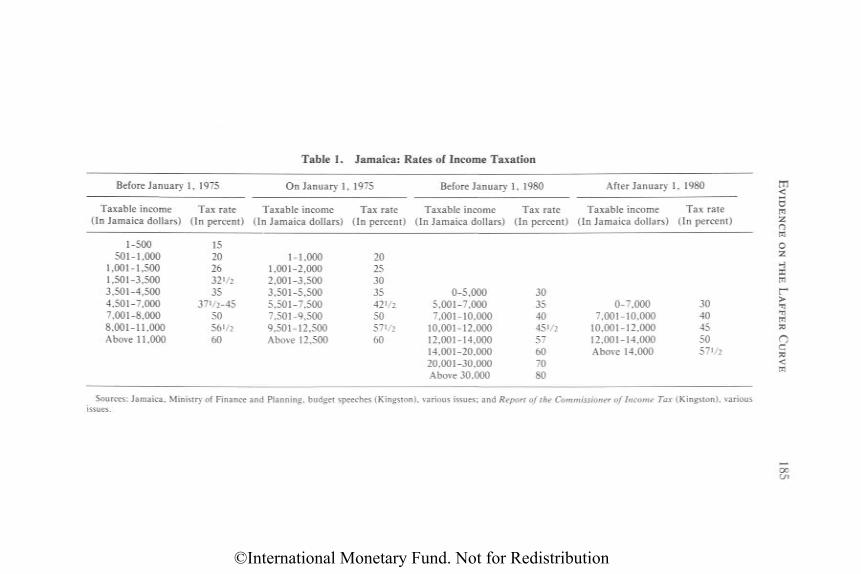
Table 1. Jamaica: Rates of Income Taxation
Sources: Jamaica, Ministry of Finance and Planning, budget speeches (Kingston), various issues; and Report of the Commissioner of Income Tax (Kingston), variousissues.
185
Before January 1, 1975
Taxable income(In Jamaica dollars)
1-500501-1,000
1,001-1,5001,501-3,5003,501-4,5004,501-7,0007,001-8,0008,001-11,000Above 11,000
Tax rate(In percent)
15202632 1/235
371/2-455056 1/260
O n January 1, 1975
Taxable income(In Jamaica dollars)
1-1,0001,001-2,0002,001-3,5003,501-5,5005,501-7,5007,501-9,5009,501-12,500Above 12,500
Tax rate(In percent)
2025303542 1/25057 1/2
60
Before January 1, 1980
Taxable income(In Jamaica dollars)
0-5,0005,001-7,0007,001-10,000
10,001-12,00012,001-14,00014,001-20,00020,001-30,000Above 30,000
Tax rate(In percent)
303540451/2
57607080
After January 1, 1980
Taxable income(In Jamaica dollars)
0-7,0007,001-10,000
10,001-12,00012,001-14,000Above 14,000
Tax rate(In percent)
30404550571/2
©International Monetary Fund. Not for Redistribution
186 L I A M P. E B R I L L
consumed in the country are nontraded commodities. For example, con-sider the impact of the emigration of doctors on the quality of the healthcare of those w h o remain.)
The issue of the effective burden of an income tax raises some practicalquestions as well. For example, how burdensome is a tax system such asthat delineated above, given that per capita G D P in 1980 was only J$2,195(at an official exchange rate of JS1.7814 per U . S . dollar this equalsUS$1,232) . Further, the tax schedule applies only to reported income afterdeductions, exemptions, and allowances. Given that it is generally con-ceded that tax evasion is widespread and that, further, tax administrationhas been weak in Jamaica, the disincentive effects are by that token sub-stantially altered.8 This topic will be discussed further below.
The Jamaican personal income tax system is of particular interest to thisstudy because of the tax reforms that became effective January 1, 1980. Ascan be seen from Table 1, the highest marginal tax rates were significantlyreduced, from 80 percent to 57½ percent. This reduction is precisely thetype of rate realignment recommended by supply-siders. Did it have thepredicted supply-side effect, namely, an increase in tax revenues? Con-sider Table 2, which presents the data for the partial test outlined in theprevious section. The table documents the recent trend in the number ofP A Y E taxpayers by income class.9 While this does not provide direct evi-dence on income tax revenue, the analytical results presented above sug-gest that the trends in the number of taxpayers in each income class can beilluminating.
T o draw on the earlier analysis, any evaluation of the relevance of theLaffer curve to Jamaican circumstances, which are characterized on thebasis of trends in the numbers of taxpayers, depends on the interaction of anumber of factors; the underlying rates of inflation and real growth, theunderlying distribution of incomes, and the changes in tax rates. Inflation,in Jamaica, as measured by changes in the consumer price index, was27 percent in 1980 and 12.5 percent in 1981 (calendar years). The corre-
8As evidence of the extent of the tax administration problem, the Report of the Commis-sioner of Income Tax for Years Ended 31st March, 1981 and 31st March, 1982 notes that theprospects for remedying the tax evasion situation were unlikely to improve as long as re-sources for the task continued to be inadequate and sanctions against evasion remained weak(Jamaica (1982)).
9 P A Y E data are easy to use because tax collections and tax liabilities tend to be contempo-raneous. Further, for Jamaica, they are a pre-eminent source of individual income tax reve-nue. The Report of the Commissioner of Income Tax for 1981 and 1982 notes that in 1982P A Y E was responsible for 92 percent of gross individual income tax receipts (Jamaica(1982)).
©International Monetary Fund. Not for Redistribution
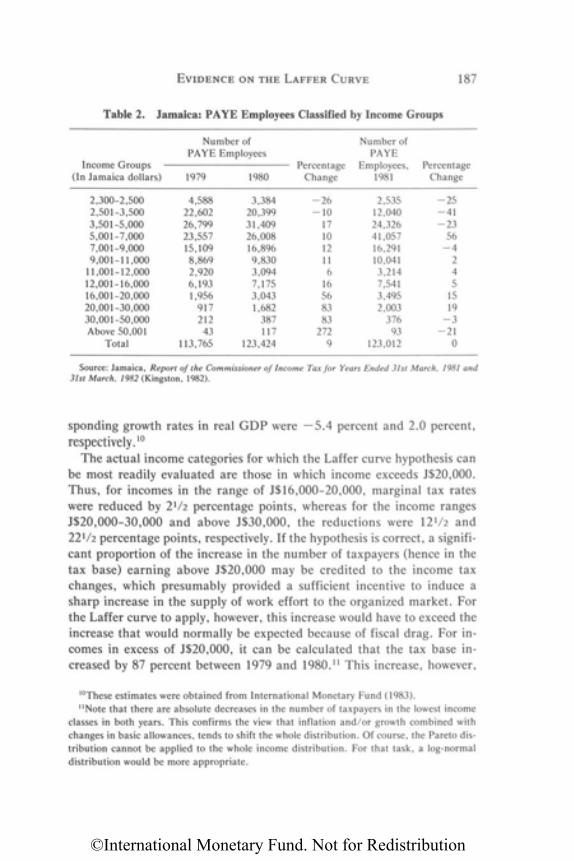
EVIDENCE ON THE LAFFER CURVE 187
Table 2. Jamaica: P A Y E Employees Classified by Income Groups
Source: Jamaica, Report of the Commissioner of Income Tax for Years Ended 31st March, 1981 and31st March, 1982 (Kingston, 1982).
sponding growth rates in real G D P were —5.4 percent and 2.0 percent,respectively.10
The actual income categories for which the Laffer curve hypothesis canbe most readily evaluated are those in which income exceeds J$20,000.Thus, for incomes in the range of J$16,000-20,000, marginal tax rateswere reduced by 2½ percentage points, whereas for the income rangesJ$20,000-30,000 and above J$30,000, the reductions were 12½ and22½ percentage points, respectively. If the hypothesis is correct, a signifi-cant proportion of the increase in the number of taxpayers (hence in thetax base) earning above J$20,000 m a y be credited to the income taxchanges, which presumably provided a sufficient incentive to induce asharp increase in the supply of work effort to the organized market. Forthe Laffer curve to apply, however, this increase would have to exceed theincrease that would normally be expected because of fiscal drag. For in-comes in excess of J$20,000, it can be calculated that the tax base in-creased by 87 percent between 1979 and 1980.11 This increase, however,
10These estimates were obtained from International Monetary Fund (1983).11Note that there are absolute decreases in the number of taxpayers in the lowest income
classes in both years. This confirms the view that inflation and/or growth combined withchanges in basic allowances, tends to shift the whole distribution. Of course, the Pareto dis-tribution cannot be applied to the whole income distribution. For that task, a log-normaldistribution would be more appropriate.
Income Groups(In Jamaica dollars)
2,300-2,5002,501-3,5003,501-5,0005,001-7,0007,001-9,0009,001-11,000
11,001-12,00012,001-16,00016,001-20,00020,001-30,00030,001-50,000Above 50,001
Total
Number ofP A Y E Employees
1979
4,58822,60226,79923,55715,1098,8692,9206,1931,956
91721243
113,765
1980
3,38420,39931,40926,00816,8969,8303,0947,1753,0431,682
387117
123,424
PercentageChange
-26-10
171012116
16568383
2729
Number ofP A Y E
Employees,1981
2,53512,04024,32641,05716,29110,041
3,2147,5413,4952,003
37693
123,012
PercentageChange
-25-41-23
56-4
245
1519
-3-21
0
©International Monetary Fund. Not for Redistribution
188 LIAM P. EBRILL
has to be seen in light of an inflation rate of 27 percent in that year. Ifnominal incomes in those income categories increased by a like amount,and if the Pareto distribution is a correct characterization of the underly-ing income distribution, then a value of a = 2.5 would result in an increasein the tax base of 67.5 percent owing solely to the effects of fiscal drag.12
The evidence to this point suggests that the Jamaican tax base re-sponded buoyantly to the tax rate reductions. Assuming a = 2.5, the basegrew by approximately 29 percent more than would have been anticipated.Further, this occurred in a year of negative GDP growth. What happenedto tax revenue, the primary concern of the Laffer curve? Using 1979weights, the average reduction in marginal tax rates for the relevant in-come groups was approximately 20 percent, indicating that tax revenuedid increase relative to what collections would have been had the tax sys-tem remained unchanged and tax revenues had increased only as a resultof the effects of fiscal drag.
Although these data are consistent with the existence of a Laffer curve inJamaica, the reservations about such an interpretation should be kept inmind. It is based on little evidence and on just one year's observation. In-deed, referring back to Table 2, it is clear that the buoyancy of the tax basein the following year, a year of 12 1/2 percent inflation, fell below whatwould have been predicted by the framework developed here. More impor-tant, the exercise above is cast as if the tax reductions occurred in a vac-uum, which, of course, was not the case. The increase in the number oftaxpayers in the target year may have been due to other factors, such as asimultaneous drive to enhance tax administration and a coincidentalgrowth in government employment. The 1980 Economic and Social Surveynotes that a significant part of the larger-than-expected tax collectionsfrom individuals on the PAYE system represented payments of arrears inincome tax (Jamaica, National Planning Agency (1980)).
A further reason for caution in interpreting these results as evidence ofthe Laffer curve is that PAYE taxpayers are not the most suitable group toconsider when looking for Laffer curve effects. Thus, as pointed out ear-lier, the significant factor may not be the aggregate elasticity of labor sup-ply but rather the elasticity of labor supply to organized markets. Elabo-rating, reductions in marginal tax rates might not result in increased work
12Ideally, one would test the validity of assuming that the upper tail of the income distribu-tion conforms to the Pareto distribution by using a X2 test. Unfortunately, there are insuffi-cient observations for such a test. Note also that lack of data precludes an independent verifi-cation of the magnitude of a for Jamaica, or, indeed, for India below, though in both casesthe true value of a would have to differ significantly from that assumed here to alter theinterpretation of the data.
©International Monetary Fund. Not for Redistribution
EVIDENCE ON THE LAFFER CURVE 189
effort. Instead, they might yield increased tax revenue because of reducedtax evasion.13 This effect, which enhances the observed elasticity of laborsupply to organized markets, is less likely to be relevant in the case ofPAYE taxpayers. Those paying income taxes under PAYE schemes typi-cally have little control either over the income they report or over the hoursthey work. If Laffer-type effects exist in Jamaica, these effects are morelikely to be observed when other taxpayers are included. As noted in theReport of the Commissioner of Income Tax for 1981 and 1982, delin-quency and tax evasion are so extensive that in excess of 80 percent of theself-employed are assumed to be "dodging their responsibilities" (Jamaica(1982, p. 18)).
India
Because the case of India was cited by Wanniski (1983), it is appropriateto consider the example of the marginal income tax reductions introducedin that country in 1975.14 As rationalized in the budget speech for 1974/75,the reductions in marginal income tax rates were a response to recommen-dations made by the Direct Taxes Enquiry Committee. The existing highrates were held to be a major cause of tax evasion. The magnitude of thereductions can be gauged from Table 3. As for the revenue loss implied bythese reductions, the Minister for Finance argued
The reduction in the rates of income-tax on personal income would ordinarilyhave resulted in a loss of about Rs. 60 crores in a full year and Rs. 36 crores inthe financial year 1974-75. I am, however, not taking any loss into account forbudgetary purposes as I expect that the reduction in the rates of taxes will lead tobetter tax compliance, and full disclosures of incomes by all taxpayers.15
At face value, the Minister's optimism appears to have been justified—the yield of the income and corporation taxes was later revised fromRs 1,370 crores to Rs 1,460 crores (India (1976, p. 5)). This upward revi-
13In this context, the tax cuts might also have enhanced revenue by reducing the incentivesfor tax avoidance techniques in the form of awarding nontaxable perquisites.
14Major income tax reforms, including a substantial reduction of top marginal income taxrates, were introduced in the 1985/86 budget, and the early indications are of substantialincrease in income tax collections. However, an analysis of the reasons underlying these reve-nue trends remains to be carried out. It has not been undertaken in this chapter either.
15See India (1975, pp. 187-88). A crore is a unit of ten million. There are some discrepan-cies between Wanniski's account and the measures proposed by the budget speech. Specifi-cally, Wanniski refers to reductions in annual taxes on large holdings, whereas the Ministerproposed wealth tax increases in general.
©International Monetary Fund. Not for Redistribution
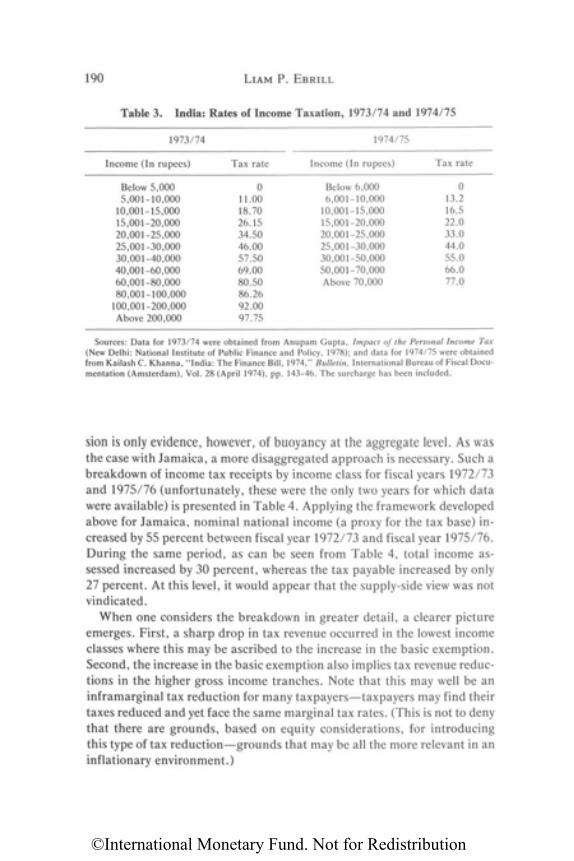
190 LIAM P. EBRILL
Table 3. India: Rates of Income Taxation, 1973/74 and 1974/75
Sources: Data for 1973/74 were obtained from Anupam Gupta, Impact of the Personal Income Tax(New Delhi: National Institute of Public Finance and Policy, 1978); and data for 1974/75 were obtainedfrom Kailash C. Khanna, "India: The Finance Bill, 1974," Bulletin, International Bureau of Fiscal Docu-mentation (Amsterdam), Vol. 28 (April 1974), pp. 143-46. The surcharge has been included.
sion is only evidence, however, of buoyancy at the aggregate level. As wasthe case with Jamaica, a more disaggregated approach is necessary. Such abreakdown of income tax receipts by income class for fiscal years 1972/73and 1975/76 (unfortunately, these were the only two years for which datawere available) is presented in Table 4. Applying the framework developedabove for Jamaica, nominal national income (a proxy for the tax base) in-creased by 55 percent between fiscal year 1972/73 and fiscal year 1975/76.During the same period, as can be seen from Table 4, total income as-sessed increased by 30 percent, whereas the tax payable increased by only27 percent. At this level, it would appear that the supply-side view was notvindicated.
When one considers the breakdown in greater detail, a clearer pictureemerges. First, a sharp drop in tax revenue occurred in the lowest incomeclasses where this may be ascribed to the increase in the basic exemption.Second, the increase in the basic exemption also implies tax revenue reduc-tions in the higher gross income tranches. Note that this may well be aninframarginal tax reduction for many taxpayers—taxpayers may find theirtaxes reduced and yet face the same marginal tax rates. (This is not to denythat there are grounds, based on equity considerations, for introducingthis type of tax reduction—grounds that may be all the more relevant in aninflationary environment.)
1973/74
Income (In rupees)
Below 5,0005,001-10,000
10,001-15,00015,001-20,00020,001-25,00025,001-30,00030,001-40,00040,001-60,00060,001-80,00080,001-100,000
100,001-200,000Above 200,000
Tax rate
011.0018.7026.1534.5046.0057.5069.0080.5086.2692.0097.75
1974/75
Income (In rupees)
Below 6,0006,001-10,000
10,001-15,00015,001-20,00020,001-25,00025,001-30,00030,001-50,00050,001-70,000Above 70,000
Tax rate
013.216.522.033.044.055.066.077.0
©International Monetary Fund. Not for Redistribution
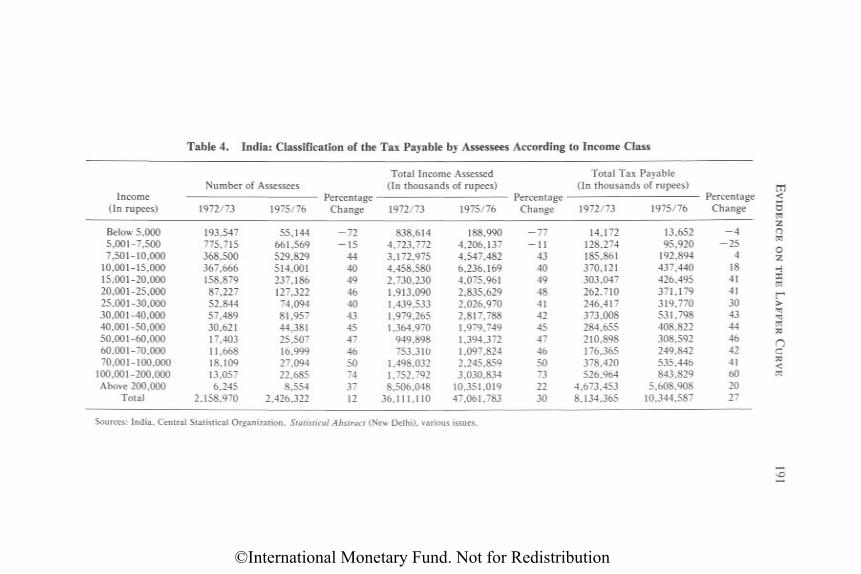
Table 4. India: Classification of the Tax Payable by Assessees According to Income Class
Income(In rupees)
Below 5,0005,001-7,5007,501-10,000
10,001-15,00015,001-20,00020,001-25,00025,001-30,00030,001-40,00040,001-50,00050,001-60,00060,001-70,00070,001-100,000
100,001-200,000Above 200,000
Total
Number of Assessees
1972/73
193,547775,715368,500367,666158,87987,22752,84457,48930,62117,40311,66818,10913,0576,245
2,158,970
1975/76
55,144661,569529,829514,001237,186127,32274,09481,95744,38125,50716,99927,09422,6858,554
2,426,322
PercentageChange
- 7 2- 1 5
44404946404345474650743712
Total Income Assessed(In thousands of rupees)
1972/73
838,6144,723,7723,172,9754,458,5802,730,2301,913,0901,439,5331,979,2651,364,970
949,898753,310
1,498,0321,752,7928,506,048
36,111,110
1975/76
188,9904,206,1374,547,4826,236,1694,075,9612,835,6292,026,9702,817,7881,979,7491,394,3721,097,8242,245,8593,030,834
10,351,01947,061,783
PercentageChange
- 7 7- 1 1
43404948414245474650732230
Total Tax Payable(In thousands of rupees)
1972/73
14,172128,274185,861370,121303,047262.710246,417373,008284,655210,898176,365378,420526,964
4,673,4538,134,365
1975/76
13,65295,920
192,894437,440426,495371,179319,770531,798408,822308,592249,842535,446843,829
5,608,90810,344,587
PercentageChange
- 4- 2 5
4184141304344464241602027
Sources: India, Central Statistical Organization, Statistical Abstract (New Delhi), various issues.
©International Monetary Fund. Not for Redistribution
192 LIAM P. EBRILL
Third, as can be seen from Table 5, which presents summary data basedon Table 4, the increase in total tax payable tends to decline as incomelevels increase. More important, average assessed income per assessee andaverage tax payable per assessee both decline in absolute terms for incomesin excess of Rs 50,000. These declines were even more pronounced for in-comes in excess of Rs 100,000. A comparison of Tables 4 and 5 reveals thesource of this behavior: income and revenue growth rates of the highestincome group (those with incomes above Rs 200,000) were sluggish, bothin comparison with the corresponding growth rates registered in mostother income classes and with the underlying growth in national income. Ifin addition it is assumed that income is Pareto distributed, with a = 2.5,one would expect above-average increases in these categories.
The data on India, at least for the years selected, therefore, do not sup-port the Laffer curve hypothesis.16 The "revenue performance" of thehighest income group was quite poor. This is, of course, the income groupthat might be expected to exhibit the most pronounced Laffer-type effectsbecause taxpayers in this bracket experienced the greatest reduction inmarginal tax rates (20.75 percentage points).
Just as caution was required in interpreting the data for Jamaica, so it isrequired in this case. For example, the low income growth registered by thehighest income group might be due to income and price (e.g., rent control)policies. This possibility raises the obvious point that, for the Laffer curveto exist, individuals must be able to earn more income. Nonetheless, theconclusion of this section must be that strong supply-side effects are notreadily observable in India. Again, one should remember that such a con-clusion concentrates on the revenue implications of cuts in marginal taxrates to the exclusion of any consideration of efficiency or equity effects.
III. Overview and Conclusions
This chapter represents an attempt to evaluate empirically whetherLaffer curve effects are to be found in developing countries. Jamaica andIndia, which have reduced their top marginal tax rates, were selected forthe exercise. Empirical tests rarely afford definitive resolutions of intellec-tual disputes, but the prospects of their doing so in this instance appear
16This assessment receives support in Acharya and others (1985). Their report cites work byBagchi and Rao (Economic and Political Weekly, Bombay, September 4, 1982) in which theyconcluded that the tax compliance effects of rate reductions were much lower than had beenpresumed in the budgets (see above). Bagchi and Rao's methodology relies on obtaining inde-pendent estimates of assessable income in years after tax reduction and their results furtherbelie the optimism generated by the aggregate data discussed earlier.
©International Monetary Fund. Not for Redistribution
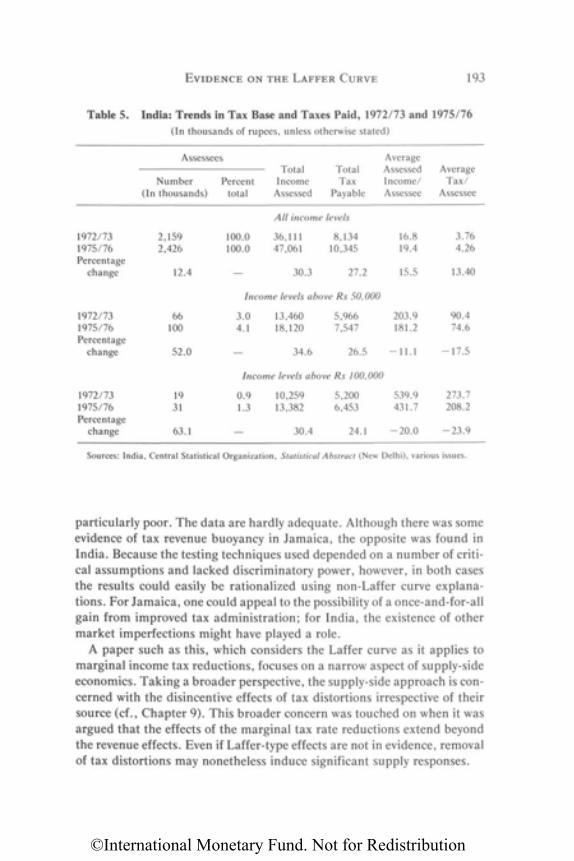
EVIDENCE ON THE LAFFER CURVE 193
Table 5. India: Trends in Tax Base and Taxes Paid, 1972/73 and 1975/76(In thousands of rupees, unless otherwise stated)
Sources: India, Central Statistical Organization, Statistical Abstract (New Delhi), various issues.
particularly poor. The data are hardly adequate. Although there was someevidence of tax revenue buoyancy in Jamaica, the opposite was found inIndia. Because the testing techniques used depended on a number of criti-cal assumptions and lacked discriminatory power, however, in both casesthe results could easily be rationalized using non-Laffer curve explana-tions. For Jamaica, one could appeal to the possibility of a once-and-for-allgain from improved tax administration; for India, the existence of othermarket imperfections might have played a role.
A paper such as this, which considers the Laffer curve as it applies tomarginal income tax reductions, focuses on a narrow aspect of supply-sideeconomics. Taking a broader perspective, the supply-side approach is con-cerned with the disincentive effects of tax distortions irrespective of theirsource (cf., Chapter 9). This broader concern was touched on when it wasargued that the effects of the marginal tax rate reductions extend beyondthe revenue effects. Even if Laffer-type effects are not in evidence, removalof tax distortions may nonetheless induce significant supply responses.
Assessees
Number(In thousands)
Percenttotal
TotalIncome
Assessed
TotalTax
Payable
AverageAssessedIncome/Assessee
AverageTax/
Assessee
All income levels
1972/731975/76Percentage
change
2,1592,426
12.4
100.0100.0
_
36,11147,061
30.3
8,13410,345
27.2
16.819.4
15.5
3.764.26
13.40
Income levels above Rs 50,000
1972/731975/76Percentage
change
66100
52.0
3.04.1
_
13,46018,120
34.6
5,9667,547
26.5
203.9181.2
-11 .1
90.474.6
-17 .5
Income levels above Rs 100,000
1972/731975/76Percentage
change
1931
63.1
0.91.3
10,25913,382
30.4
5,2006,453
24.1
539.9431.7
-20 .0
273.7208.2
-23 .9
©International Monetary Fund. Not for Redistribution
194 LIAM P. EBRILL
Moreover, although the reduction of top marginal tax rates may yieldsome revenue increase or, at least, a negligible revenue decline, the realsignificance of the result most likely lies in its implications for economicefficiency and equity. Thus, for Jamaica, the 387 taxpayers in the incomegroup of J$30,001-50,000 (Table 2) might have been expected to pay ap-proximately J$7 million in taxes in fiscal year 1980/81. This amount mustbe seen in the context of total individual income tax payments in the year ofJ$924 million (Jamaica, Ministry of Finance and Planning (1981)). The J$7million refers to total revenue, which implies that any change in revenueassociated with marginal tax changes will be correspondingly smaller. (Acaveat is that the revenue implications for the highest income group cannotbe derived because of the open-ended nature of the income levels in thatgroup; although this group is certain to have "outliers," particularly if theanalysis is extended to non-PAYE taxpayers, the force of the point in thisparagraph is unlikely to be altered.)
ANNEX
Summary of Empirical Evidence: Developed Countries
The bulk of the empirical evidence advanced by supply-side economists to sup-port their position is concerned with economic policy in the United States. Much ofthis work concerns the revenue effects associated with the Kennedy tax cuts imple-mented in 1962 and 1964. These tax cuts are felt to be particularly suitable as a testof the supply-side approach, since they involved reductions in the highest marginaltax rates on earned income as well as reductions in the corporate profits tax. Muchof the evidence cited in support of the supply-side position is anecdotal. Most arguethat the tax cut was stimulative and that the resultant surge in economic activityresulted in significant revenue buoyancy.17 However, to the extent that the revenueincrease was due to a surge in macroeconomic activity it does not necessarily sus-tain the argument that the Kennedy tax cuts led to the large gains in microeco-nomic efficiency sought by some supply-side economists.18
There have been more rigorous attempts to evaluate the Kennedy tax cuts. Con-sider, for example, the research by Canto, Joines, and Laffer (1981). On the as-sumption that the exogenous policy variables bear a constant relationship to theendogenous variables and that the structure of the complete model is stable, theyused univariate time-series analysis to identify the stochastic process generating,
17For a summary of the opinions of various authorities on the impact of the Kennedy taxcuts, see Bartlett (1982).
18An important related point is that the nature of the income tax change was such that itresulted in an increase in the elasticity of that tax. This point is discussed further in Tanzi andHart (1972).
©International Monetary Fund. Not for Redistribution
E V I D E N C E ON THE LAFFER CURVE 195
for example, the income tax revenue series. The forecast errors that result whenthese univariate models are applied to the post-sample period (i.e., the period afterthe Kennedy tax cuts became effective) may then be regarded as estimates of therevenue changes resulting from those tax cuts. There are a number of conclusions.In particular, the authors found that their time-series estimates showed smallerrevenue losses than those predicted at the time by the U.S. Treasury. This result isof interest since, given that the Treasury utilized a Keynesian framework for itsrevenue loss projections, the time-series discrepancy may be due to relative priceeffects. However, this interpretation is predicated on the Treasury model havingexhaustively captured all effects associated with the tax cuts other than the relativeprice changes.19
Taking an alternative approach to the evaluation of actual tax changes such asthe Kennedy tax cuts, Fullerton (1982) used an empirical U.S. general equilibriummodel to plot the Laffer curve for various elasticity values of factor supply in theUnited States. He concluded that, although Laffer effects were conceivable in thecontext of the U.S. income tax system, they were unlikely given the conventionalwisdom concerning the relevant elasticities of labor supply. Mackenzie (Chapter 2)has modeled the effects of a tax reduction on aggregate supply within the context ofa simple macroeconomic model and found the aggregate demand effects to bemore pronounced than the aggregate supply effects. Grieson and others (1977) re-ported a more positive result. They found the possibility of an inverse relationshipbetween tax rates and tax revenue for local government in New York. This findinglends support to the hypothesis that Laffer effects are likely to be most pronouncedwhere the tax base is narrowly defined, and substitution possibilities are thus in-creased. As a final example of research on the extent of Laffer effects in developedcountries, consider Stuart's (1981) study of Sweden. Using a two-sector model withparameter values to fit Sweden, he found that the peak of the Laffer curve occurs ata marginal tax rate of approximately 70 percent. This result can be contrasted withactual marginal tax rates in force in Sweden—rates as high as 80 percent—and heconcluded that tax rate reductions were in order. (A weakness of this latter study isthat the parameterization was done within a Cobb-Douglas framework. This notonly imposes the strong restriction that labor-supply elasticities be constant but itmay also imply larger labor-supply elasticities than actually occur.)
REFERENCES
Acharya, Shankar N., and others, Aspects of the Black Economy in India, Reportof a Study by the National Institute of Public Finance and Policy (New Delhi:Ministry of Finance, 1985).
Atkinson, A.B., "How Progressive Should Income Tax Be?" in Essays in ModernEconomics: The Proceedings of the Association of University Teachers of Eco-
19 The interpretation is also predicated on the accuracy of the assumptions required for theapplication of the univariate time-series analysis.
©International Monetary Fund. Not for Redistribution
196 LIAM P. EBRILL
nomics, Aberystwyth, 1972, ed. by Michael Parkin and A.R. Nobay (London:Longman, 1973).
Bartlett, Bruce R., Reaganomics: Supply Side Economics in Action (New York:Quill, updated ed., 1982).
Blinder, Alan S., "Thoughts on the Laffer Curve," in The Supply-Side Effects ofEconomic Policy, ed. by Laurence H. Meyer (Boston, Massachusetts: Kluwer-Nijhoff, 1981).
Canto, Victor A., Douglas H. Joines, and Arthur B. Laffer, "Tax Rates, FactorEmployment, and Market Production," in The Supply-Side Effects of Eco-nomic Policy, ed. by Laurence H. Meyer (Boston, Massachusetts: Kluwer-Nijhoff, 1981).
, Foundations of Supply-Side Economics: Theory and Evidence (New York:Academic Press, 1983).
Federal Reserve Bank of Atlanta and Emory University Law and Economics Cen-ter, Supply-Side Economics in the 1980s: Conference Proceedings (Westport,Connecticut: Quorum Books, 1982).
Feldstein, Martin S. (1974a), "Incidence of a Capital Income Tax in a GrowingEconomy with Variable Savings Rates," Review of Economic Studies (Edin-burgh), Vol. 41 (October 1974), pp. 505-13.
(1974b), "Tax Incidence in a Growing Economy with Variable Factor Sup-ply/' Quarterly Journal of Economics (Cambridge, Massachusetts), Vol. 88(November 1974), pp. 551-73.
Fink, Richard H., ed., Supply-Side Economics: A Critical Appraisal (Frederick,Maryland: University Publications of America, 1982).
Fullerton, Don, "On the Possibility of an Inverse Relationship Between Tax Ratesand Government Revenues," Journal of Public Economics (Amsterdam), Vol.19 (October 1982), pp. 3-22.
Grieson, Ronald E., William Hamovitch, Albert M. Levenson, and Richard D.Morgenstern, "The Effect of Business Taxation on the Location of Industry,"Journal of Urban Economics (New York), Vol. 4 (April 1977), pp. 170-85.
Gupta, Anupam, Impact of the Personal Income Tax (New Delhi: National Insti-tute of Public Finance and Policy, 1978).
Hailstones, Thomas J. (1982a), A Guide to Supply-Side Economics (Richmond,Virginia: Robert F. Dame, Inc., 1982).
(1982b), ed., Viewpoints on Supply-Side Economics (Richmond, Virginia:Robert F. Dame, Inc., 1982).
Hutton, John P., and Peter J. Lambert, "Income Tax Progressivity and RevenueGrowth," Economics Letters (Amsterdam), Vol. 3, No. 4 (1979), pp. 377-80.
India, Ministry of Finance, Budget for 1974/75 (New Delhi, 1975).
, Budget for 1975/76 (New Delhi, 1976).
International Monetary Fund, International Financial Statistics Yearbook, 1983(Washington, 1983).
Jamaica, Report of the Commissioner of Income Tax for Years Ended 31st March,1981 and 31st March, 1982 (Kingston: Government Publications, 1982).
©International Monetary Fund. Not for Redistribution
EVIDENCE ON THE LAFFER CURVE 197
, Ministry of Finance and Planning, Financial Statements and Revenue Es-timates for 1981/82 (Kingston, 1981).
, National Planning Agency, Economic and Social Survey: Jamaica, 1980(Kingston: Government Publications, 1980).
Khanna, Kailash C. "India: The Finance Bill, 1974," Bulletin, International Bu-reau of Fiscal Documentation (Amsterdam), Vol. 28 (April 1974), pp.143-46.
Kwon, Ohchul, "Taxes, Tax Revenues, and the Laffer Curve for a DevelopingCountry Like Korea," International Tax Journal (New York), Vol. 10, No. 4(May 1984), pp. 269-72.
Lydall, H.F., The Structure of Earnings (Oxford: Clarendon Press, 1968).
Meyer, Laurence H., ed., The Supply-Side Effects of Economic Policy (Boston,Massachusetts: Kluwer-Nijhoff, 1981).
Raboy, David G., ed., Essays in Supply Side Economics (Washington: Institute forResearch on the Economics of Taxation, 1982).
Roberts, Paul C., The Supply-Side Revolution: An Insider 's Account of Policy-making in Washington (Cambridge, Massachusetts: Harvard UniversityPress, 1984).
Stuart, Charles E., "Swedish Tax Rates, Labor Supply, and Tax Revenues," Jour-nal of Political Economy (Chicago), Vol. 89 (October 1981), pp. 1020-38.
Tanzi, Vito, and Thomas P. Hart, "The Effect of the 1964 Revenue Act on theSensitivity of the Federal Income Tax," Review of Economics and Statistics(Cambridge, Massachusetts), Vol. 54 (August 1972), pp. 326-28.
U.S. Congress, House, Committee on the Budget, Supply-Side Economics: Hear-ing Before the Task Force on Tax Policy of the Committee on the Budget,House of Representatives, 97th Congress, 1st Session, March 10, 1981 (Wash-ington: Government Printing Office, 1981).
Wanniski, Jude, The Way the World Works (New York: Simon and Schuster, rev.and updated ed., 1983).
©International Monetary Fund. Not for Redistribution
8Relationship Between Income Tax
Ratios and Growth Rates in DevelopingCountries
A Cross-Country Analysis
Luis A. Manas-Anton
This chapter presents some empirical evidence on the interrelationshipbetween output growth and the reliance of the tax system on income taxesin developing countries, using cross-country and pooled cross-countrytime-series samples.
Output growth is influenced by many factors, in addition to the struc-ture of the tax system, and these need to be controlled to isolate the neteffect of income taxes. The main sources of output growth will first beidentified according to the Dennison growth accounting tradition. Then,drawing on the development economics literature, the main determinantsof these sources will be analyzed and used as explanatory variables in thefinal reduced-form equation for growth rates.
The proposition that income taxes have a negative effect on outputgrowth is one of the central arguments in the old controversy in the theoryof public finance about the choice between a consumption or an income-based tax system (Hall (1968), Tanzi (1969), Goode (1976), Meade (1978),Pechman (1980)). In recent years, this controversy has been rekindled bythe emergence of the supply-side approach, which emphasizes the signifi-cant negative effects of high income taxes on savings, productive invest-ment, labor supply, and, consequently, growth (Boskin (1978), Canto,Joines, and Laffer (1983)).1
1This is one of the major propositions associated with the supply-side school. See Gandhi(Chapter 1).
198
©International Monetary Fund. Not for Redistribution
INCOME TAX RATIOS AND GROWTH RATES 199
The theoretical arguments used by the supply-siders are similar in sub-stance to those of the neoclassical economists writing on taxation and,among others, include the following:
• Taxation of capital incomes (through personal and corporate incometaxes, capital gains taxes, and so on) distorts the marginal conditionsfor intertemporal consumption, providing an incentive to substitutecurrent consumption for future consumption, or savings (Atkinsonand Stiglitz (1980), Feldstein (1983)).
• Taxation of labor incomes (through personal income tax) distorts themarginal conditions for static labor-leisure decisions, providing an in-centive to substitute leisure for labor. This effect is particularly signif-icant for a highly skilled labor force whose incentives to work are eas-ily eroded by high and progressive income tax rates.
• Taxation of labor incomes (through personal income tax—especiallyat highly progressive rates) seriously distorts the marginal conditionsfor human capital formation decisions (such as investment in educa-tion or training). However, when taxes on labor incomes are propor-tional and the only costs of human capital formation are forgone earn-ings, that is, all other costs are fully expensed (or tax deductible),taxes on labor incomes tend to be neutral (see Boskin (1975)). In otherwords, proportional labor taxes lead to the same investment in humancapital as do lump-sum taxes.
These arguments suggest that if two countries were compared that wereidentical in all respects except that the share of capital income taxes intotal taxes was higher for one than for the other, the latter would growfaster, as its savings rate would be higher. Alternatively, if they were iden-tical except that the share of labor income taxes in total taxes was higherfor one than for the other, the growth rate for the former would be smaller,provided its higher share of labor income taxes was the result of a progres-sive rate structure. Combining these arguments for capital and labor in-come taxes suggests that the higher the share of direct tax revenue, thelower the growth rate, all else being equal.2
2The skeptic can raise some doubts about the validity of this proposition in the context ofthe neoclassical growth theory according to which income tax may influence the aggregatelevel of real variables in the steady-state but not of their growth rates which are dependentonly on exogenous variables such as the labor supply growth rate. Even in neoclassicalmodels, however, growth rates can still differ in the transition path to the steady-state. If weassume that developing countries are in such a situation, these models will imply, under awide range of specifications, that countries that provide disincentives to capital accumulationand/or technological progress, say, through high and progressive income taxes, could wellgrow slower.
©International Monetary Fund. Not for Redistribution
3In recent years, there has been some effort in this direction using different techniques ordata sets. For instance, using time-series data, see Boskin (1978), Howrey and Hymans(1980), Giovannini (1985); using simulations of general equilibrium models, see Auerbachand Kotlikoff (1983), Kotlikoff (1984), and the references therein; and pairing similar coun-tries with different levels of taxation, see Marsden (1983).
4This approach has been interestingly applied to other macroeconomic and fiscal hypothe-ses in relation to developing countries in recent papers by Kormendi and Meguire (1985). Fordeveloped countries, Tanzi (1969) provides case studies and cross-country comparisons ofgrowth rates and the structure of the individual income tax.
200 LUIS A. MANAS-ANTON
In the end, however, the existence and size of the negative effect of in-come taxes on capital accumulation and growth must be substantiated byempirical evidence.3 This chapter attempts to shed some light on the issueby focusing on the empirical analysis of cross-section data from developingcountries.4
The remainder of this chapter is divided into three sections and an an-nex. Section I examines the strategy for empirical testing and derives ageneral regression equation for the growth rate. Section II analyzes theempirical results from the final model. Section III summarizes the findingsof the paper. The Annex describes the sources of data and includes someadditional regression equations.
I. Strategy of the Empirical Analysis
The empirical analysis in this paper is based on a final regression equa-tion in which output growth, as the dependent variable, is explained by arelatively short list of exogenous determinants for which data are readilyavailable in developing countries. The approach taken for deriving such aregression equation is the growth accounting approach in the Dennison(1962) tradition.
As a first step, the aggregate production possibilities of a country wereassumed to be characterized by the inequality:
(1)
where real output (Y) in period t is limited by the state of the technology(A), physical capital (K), and human capital (H). The aggregate produc-tion function, F ( ), has constant returns to scale and the usual neoclassi-cal properties.
Rewriting expression (1), we derive:
(2)
©International Monetary Fund. Not for Redistribution
INCOME TAX RATIOS AND GROWTH RATES 201
where 1 — 7 measures the difference between the current output level andthe level attainable on the production possibilities frontier. Expression (2)is tautologically true unless 7 or A have restrictions.
The growth accounting identity is, then, obtained from the logarithmicderivative of (2) (suppressing all time arguments):
(3)
where growth rates are indicated by circumflex accents and a is the elastic-ity of output with respect to capital and is equal to the share of capital intotal output when factors are paid the value of their marginal product.
In identity (3), following the Dennison tradition, output growth is de-composed into four different sources: (1) physical capital growth, K; (2)human capital growth, H; (3) technical change, A; and (4) change in theefficiency in the use of resources, 7. This expression can be seen as a clos-ing identity of a general model in which each of the growth sources is deter-mined endogenously.
The next step was to derive the basic determinants of each of thesesources of growth as a function of a short list of observable exogenous vari-ables. Because reasonably consistent and reliable data had to be readilyavailable for these variables for the period of analysis, the number of thesepotential exogenous variables was rather limited.
The final step in the process was to obtain the reduced-form equation foroutput growth, Y, ready to be used in empirical estimation.
We will start now by examining various determinants of the sources ofoutput growth identified in identity (3) above.
Physical Capital (K)
The change in the capital stock during a given period is equal to invest-ment (I), net of depreciation (dK):
(4)
Denoting the ratio of investment to output as i and the capital-outputratio as w, equation (4) can be rewritten as:
(5)
©International Monetary Fund. Not for Redistribution
202 Luis A. MANAS-ANTON
From a national accounting perspective, the investment-output ratio isidentically equal to domestic savings plus net foreign investment dividedby gross domestic product (GDP).5
A review of the available literature suggests that the following factorspotentially influence capital accumulation.6
Reliance on Income Taxes (TI)
The theoretical justification for the inclusion of reliance on income taxeshas already been provided in the introductory section.7 The empirical anal-ysis in this paper makes use of two measures of a country's reliance onincome taxes: TI/ T—the share of income tax revenue in total tax revenue(the focus of the analysis) and TI/ Y— the share of income tax revenue inGDP. According to supply-side advocates, these two variables should benegatively related to output growth. Part of this effect is likely to comethrough lower physical capital accumulation from the taxation of capitalincome.8
Capital income is taxed under both individual and corporate incometaxes. It is difficult to disentangle their different potential effects on outputgrowth empirically, since the systems of integrating these taxes are varied(in our sample of countries they range between complete nonintegration,in, for example, India, to virtual full integration, as in Greece).9 Nonethe-less, the study will derive some regression results using separate ratios ofindividual and corporate income taxes to total tax revenue (TII/ T andTCI / T, respectively), in spite of the difficulties in the interpretation oftheir coefficients.
5In the absence of interventions, the quantities observed ex post for these variables reflectthe interaction of demand and supply of investable funds in the market. However, for ourpurpose, we are interested in understanding the exogenous factors ("shift parameters") thatdetermine the position of these demand and supply schedules. Unfortunately, the empiricalimportance of capital market interventions in developing countries cannot be ignored, espe-cially the widespread existence of nominal interest rate ceilings. (These are documented inGalbis (1979) and International Monetary Fund (1983).)
6For a thorough survey of the literature on these issues, both theoretical and empirical, seeEbrill (Chapter 3).
7 In that section we abstracted from open economy considerations. These considerations donot change the essence of our testable proposition. Investment decisions of foreign economicagents (usually firms) depend on the relative tax treatment of the generated income (amongseveral other factors). Relatively high corporate income tax rates could be expected to de-crease foreign investment and, thus, accumulation of capital in a country.
8This argument ignores the positive effect that government expenditures may have on phys-ical capital accumulation.
9For some considerations on the choice of integration systems, see Prest (1985).
©International Monetary Fund. Not for Redistribution
INCOME TAX RATIOS AND GROWTH RATES 203
Inflation (INF)
Inflation can have a negative effect on capital accumulation in two mainways. First, it is usually associated with greater uncertainty about the re-turns on current savings as well as those future relative prices that are im-portant for returns on investment. This increased and, generally, uninsur-able uncertainty discourages the accumulation of productive capital (seeMirman (1971)).10 The second negative impact of inflation arises becausenominal interest rates in developing countries are often set by the govern-ment at artificially low rates (Galbis (1979)). The adverse effect of such apolicy on savings and investment is exacerbated by high rates of inflation,since they lead to highly negative real interest rates for savers which, byreducing the flow of savings, constrain investment.
On the other hand, in some models (see, e.g., Fischer (1979)) inflation isassumed to have positive effect on capital accumulation by virtue of theTobin-Mundell effect: high anticipated inflation leads to shifts in portfo-lios away from real money balances and toward real capital.
The relative strength of positive and negative effects of inflation on capi-tal accumulation will need to be determined empirically.
Demographic Variables (AGE)
For explaining savings behavior, life-cycle models stress the importanceof the humped shape of earnings profiles and the desire of individuals for asmooth consumption pattern over their lifetimes. These two factors to-gether imply that individuals will accumulate assets in their most produc-tive years to pay for debts incurred when young and for retirement. Thus,we would expect that the percentage of the population that is within theworking age, say, 15-65 years of age (AGE), might increase savings.11
Level of Government Activity (PEX, KPEX)
It is important to separate the effects of the structure of taxation on cap-ital accumulation from the effects of the level of government activity.There are sharp differences of view on these latter effects; according tosupply-siders they are substantial and negative, while according to somedevelopment economists they may be substantial and positive in develop-ing countries.
10 High mean inflation (or money growth) is very closely correlated with a high standarddeviation of monetary shocks, as calculated by Kormendi and Meguire (1985).
11For example, countries with a large percentage of the population below working age (as inmany African countries) will be expected to have, ceteris paribus, lower savings ratios.
©International Monetary Fund. Not for Redistribution
204 LUIS A. MANAS-ANTON
The level of government activity can best be measured in expenditureterms rather than revenue terms (Kotlikoff (1984)). The ratio of govern-ment expenditure to the value of output (PEX) is included as another ex-planatory variable in the regression for investment. The possible effect oninvestment of the composition of government expenditure is captured byincluding the ratio of government capital expenditure to output (KPEX).As Blejer and Khan (1984) point out, the sign of the overall effect on capi-tal accumulation will depend on the strength of real and financial "crowd-ing out" effects and on the substitutability or complementarity of govern-ment capital expenditure with private investment.
Per Capita Income (YPC)
Finally, standard neoclassical models predict that, in the transition tothe steady-state, the lower is the level of income per capita, the faster willbe the approach to the steady-state path and, hence, the faster will beoutput growth. Per capita income is, therefore, also added to the list ofvariables.
Human Capital (H)
Human capital (H) can be viewed as the product of the number of work-ers and an index of the average human capital per worker (h). The numberof workers in an economy depends on the total population (N) and thelabor participation rate (PR):
(6)
(7)
Taking percentage changes:
Data on the first two components (N and PR) are readily available andtheir sum, denoted as labor change (LC), is taken in this paper as an ex-planatory variable in the final equation. The coefficient on labor change isexpected to be positive.
The average human capital component (h) depends on the educationand training of individuals. Since the expected rates of labor taxes are rele-vant exogenous parameters for human investment decisions, especiallywhen the tax rate structure is progressive and education costs cannot befully expensed (as is usually the case with individual income taxes), TI/ Tand TI/ Y can affect growth negatively through their effect on human cap-ital accumulation as well. This negative effect of tax variables is particu-larly reinforced by such factors as the possibility of international mobility
©International Monetary Fund. Not for Redistribution
INCOME TAX RATIOS AND GROWTH RATES 205
of human capital (especially in the case of highly skilled labor) or of laborshifting to nontaxed sectors of the economy (either underground or non-market—household or subsistence—activities). Another potentially im-portant determinant of human capital formation is the degree of publicsubsidization of marginal human capital investment. A good proxy for itwould be the ratio of public expenditure on education to GDP (EDU), butthere are many problems of availability and homogeneity of cross-countrydata on this variable; hence, this variable will not be used in the empiricalanalysis below.
Based on the discussions on physical and human capital, above, the cap-ital accumulation component of equation (3) can now be written as equa-tion (8), which makes it a function of the explanatory variables analyzed inthe preceding paragraphs:
(8)
where
TI/T = the share of income taxes in total tax revenues;TI/Y = the share of income taxes in GDP;INF = inflation;
AGE = the share of the population at working age;PEX = the ratio of government expenditure to the value of output;
KPEX = the ratio of government capital expenditure to value ofoutput;
YPC = per capita income; andLC = the change in labor (change in total population plus the
change in participation rate).
Technological Progress (A)
The economics of technological progress is an area of economic theorythat is not well developed yet, perhaps because of its intrinsic theoreticaldifficulties (see Kamien and Schwartz (1982) for an introduction to theseproblems). Nevertheless, there are some tentative conclusions that may bedrawn upon.
Technological advances in developing countries do not usually comefrom major breakthroughs in original research, but from adopting and us-ing effectively already established technologies. Thus, it seems likely thatcountries with lower levels of development (measured by per capita GDP)may have a faster introduction of new technology. Growing contact withmore developed countries should also be positively correlated with in-
©International Monetary Fund. Not for Redistribution
206 Luis A. MANAS-ANTON
creased technological progress and, hence, with higher growth. This grow-ing contact might be measured by the outward orientation of a country'sdevelopment, specifically by a variable such as growth in the ratio of ex-ports to GDP (XGW). This variable is also important for measuring thecountry's capacity to increase foreign capital goods imports—another cru-cial factor for technological advance by a developing country.
Finally, a variable such as lagged growth rate (growth rate in the 1960sor G60) is included, to represent the increase in know-how, learning bydoing, and so on associated with a faster path of development in previousperiods.12
Changes in the Gap Between Actual and Potential Output (7)
Economies do not usually function on their production possibilities fron-tier for several reasons. On the one hand, rigidities and inefficiencies maylead to a lower-than-potential level of output, while on the other hand,cyclical oscillations may lead to short-run unemployment of resources.
In the first situation, growth can be related to the rate of removal of theinefficiencies. For many developing countries, obstacles to free trade (suchas tariffs, quotas, or exchange and trade controls) are a very importantreason for this gap between attainable and actual output. Again, growth inthe ratio of exports to GDP (XGW) can be used as a proxy for these open-ing policies.13
The second consideration, the existence of cyclical oscillations, impliesthat a large component of short-run changes in output would not be ex-plainable with the set of variables determining long-run growth. Hence,for our empirical work, we would like to clean our data of these cyclicaloscillations. There are different ways to accomplish this. We have chosento take long-period averages (for five and ten years), and hope that theinfluences of cyclical fluctuations will cancel out over that period of time,which will allow our set of regressors to explain a major portion of the vari-ance of the growth variable, the primary focus of our study.
Summing up, we can now put all the parts together by expanding equa-
12 The relation between export performance and economic growth has been a subject ofintense debate in the development literature (see Feder (1983), Balassa (1985) among manyothers). These studies have usually shown a positive contribution to growth arising from in-creased integration in world markets.
13Since trade liberalization is usually closely associated with removal of other policy distor-tions as well, the variable XGW will also pick up some of the influence on output of thereforms in other policies.
©International Monetary Fund. Not for Redistribution
Since the analysis is cross-country, growth in all the countries includedin the sample is assumed to be well described by equations (1) to (9b).16
Thus, countries whose growth had other country-specific and directly iden-tifiable determinants over the period studied were excluded (such asmembers of the Organization of Petroleum Exporting Countries or coun-tries involved in prolonged strife, for example, Angola, Nicaragua, andZimbabwe).
14The econometric exogeneity of the variables is based on two considerations: (1) some vari-ables are predetermined before the sample period (G60, YPC, AGE, or LC) and (2) othervariables are taken to be choice variables for economic policymakers (tax structure, TI/.;inflationary financing, INF; and public sector participation in the economy, PEX andKPEX).
15TI/ T is used initially as the tax structure variable.16Cross-sectional data pooled with time series is also used.
where
(9a)
INCOME TAX RATIOS AND GROWTH RATES 207
tion (3) to obtain a final equation that links growth with a list of explana-tory variables described above.
(9b)
II. Empirical Analysis
Econometric Methodology
The empirical analysis below is based on equation (9a), which linkslong-term output growth of a country, Y, to a partial list of general explan-atory variables.14 Additional general variables (unobservable or unavail-able for the period studied) and idiosyncratic factors are combined in arandom error term, ei, that is expected to have the usual properties. Lin-earizing equation (9a) (i.e., taking a first order approximation to the func-tion f (.)), we obtain a readily estimable equation:15
©International Monetary Fund. Not for Redistribution
208 LUIS A. MANAS-ANTON
The data for the study have been taken from the Fund's InternationalFinancial Statistics Yearbook (IFS), Government Finance Statistics Year-book (GFS), and World Tables published by the World Bank (for a com-plete description and comments, see the Annex). The final sample in-cludes observations for 39 developing countries for the 1973-82 period.The relevant data are given in Tables 1 and 2.
The main cross-section regressions use ten-year (1973-82) averages asregressors. Five-year averages were also used, with two observations foreach country. By pooling these time-series and cross-section data, the sam-ple size was doubled at the expense of increased standard deviation of therandom error (because of additional short-run noise in output growth).
In estimating empirical regression equations, some variables given inequation (9b) may turn out to be irrelevant and, thus, could be deletedfrom the regression with consequent lower variance in the estimation of theremaining coefficients. This increased precision has to be weighed againstthe possibility of biased estimation from imposing inexact linear restric-tions.17 For solving this trade-off problem, the choice of the benchmarkspecification is done by using the Akaike information criterion (AIC),that is, by minimizing among all the possible linear specifications theexpression:
where
L(.) = likelihood function evaluated at the restricted maximum like-lihood estimates;
Ki = number of regressors; andN = number of observations.
The AIC (Akaike (1974)) is based on the Kulback-Leibler measure ofinformation. This criterion has been shown to have high relative accuracyin applied work (see Geweke and Meese (1981)).
Regression Results and Checks for Robustness
In order to select a benchmark specification, regressions are estimatedfor all possible subsets of the list of explanatory variables (subset regres-sions). The specification that minimized the AIC (henceforth called
17This is a very general econometric problem, the choice of a specific model nested on ageneral model, for which there is no easy solution. As Judge and others (1980), remark: "theappropriate parameterization of a linear statistical model is a hard and important problem,and [that] despite the productive efforts of many, it remains just that" (p. 442).
AIC = -(2/N) 1n (L(.)) + (2/N) Ki,
©International Monetary Fund. Not for Redistribution
INCOME TAX RATIOS AND GROWTH RATES 209
benchmark specification) is given in equation (10) in Table 318 and in-cludes five explanatory variables (TI/ T, LC, AGE, XGW, and INF), allof them with expected (or plausible) signs. These five variables are able toexplain almost 50 percent of the growth variance; variance that, as we sawfrom Tables 1 and 2, is very high in our sample. All variables are signifi-cantly different from zero at the usual 5 percent level. The F-statistic, F =6.49, rejects the null hypothesis of no explanatory power for the regressionas a whole at better than the 1 percent level.
The estimated equation for the most general model (all nine indepen-dent variables contained in equation (9b)) is reported as equation (11) inTable 3. The results are very similar with those of equation (10): all vari-ables common to both equations have the same signs and the coefficientsare stable. As expected, the inclusion of four additional variables de-creases the precision in the estimation of the other ones although the R2 ofthe second equation (equation (11)) is slightly lower than that of the first(equation (10)): all the r-ratios decrease and it cannot be rejected at the 5percent significance level that the coefficients of TI/ T and AGE are equalto zero, but neither can it be rejected that they are equal to their previousvalues.
Before focusing on the income tax variables, we shall briefly commenton the results of some of the other regressors.
None of the government expenditure variables appears in the bench-mark specification (equation (10)). In the most general regression (equa-tion (11)), total public expenditure over GDP has a negative sign that isnonsignificant (as does total tax revenue over GDP—see equation (Al) inthe Annex). Government capital expenditure (KPEX) has a positive signin equation (11) but it is not significantly different from zero either.19
Labor force change (LC), inflation (INF), and export growth (XGW)have highly significant coefficients in all specifications given in Table 3.The coefficient of labor force change (LC) is higher than one, probablybecause of the absence of some nonquantifiable and excluded variablesthat pick up the human capital accumulation effort.20 In the case of infla-tion (INF), the negative effects on resource allocation seem to outweigh
18The same model would have been chosen using several other criteria such as Mallow's Cp
or R2.19 For this variable it would be interesting to try to distinguish between infrastructure ex-
penditure and other types of public investment (as suggested by Blejer and Khan (1984)).Unfortunately, data are not readily available to test for this.
20EDU, total government expenditure on education over GDP, was included but it was notsignificant. In any case, this variable is not very reliable since local governments are often incharge of education and their data are patchy and incomplete.
©International Monetary Fund. Not for Redistribution
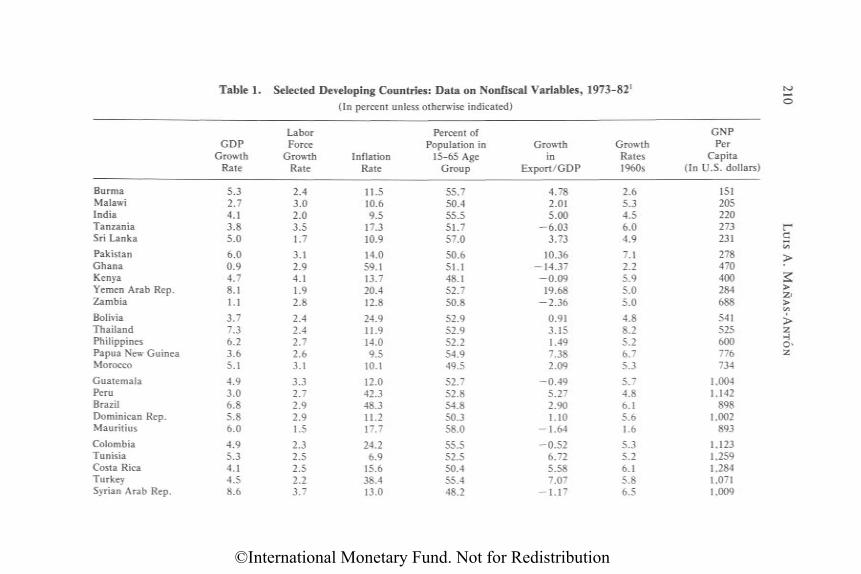
Table 1. Selected Developing Countries: Data on Nonfiscal Variables, 1973-821
(In percent unless otherwise indicated)
BurmaMalawiIndiaTanzaniaSri Lanka
PakistanGhanaKenyaYemen Arab Rep.Zambia
BoliviaThailandPhilippinesPapua New GuineaMorocco
GuatemalaPeruBrazilDominican Rep.Mauritius
ColombiaTunisiaCosta RicaTurkeySyrian Arab Rep.
GDPGrowth
Rate
5.32.74.13.85.0
6.00.94.78.11.1
3.77.36.23.65.1
4.93.06.85.86.0
4.95.34.14.58.6
LaborForce
GrowthRate
2.43.02.03.51.7
3.12.94.11.92.8
2.42.42.72.63.1
3.32.72.92.91.5
2.32.52.52.23.7
InflationRate
11.510.69.5
17.310.9
14.059.113.720.412.8
24.911.914.09.5
10.1
12.042.348.311.217.7
24.26.9
15.638.413.0
Percent ofPopulation in
15-65 AgeGroup
55.750.455.551.757.0
50.651.148.152.750.8
52.952.952.254.949.5
52.752.854.850.358.0
55.552.550.455.448.2
Growthin
Export/GDP
4.782.015.00
- 6 . 0 33.73
10.36-14.37- 0 . 0 919.68
-2 .36
0.913.151.497.382.09
- 0 . 4 95.272.901.10
-1 .64
-0 .526.725.587.07
- 1 . 1 7
GrowthRates1960s
2.65.34.56.04.9
7.12.25.95.05.0
4.88.25.26.75.3
5.74.86.15.61.6
5.35.26.15.86.5
GNPPer
Capita(In U.S. dollars)
151205220273231
278470400284688
541525600776734
1,0041,142
8981,002
893
1,1231,2591,2841,0711,009
210
©International Monetary Fund. Not for Redistribution
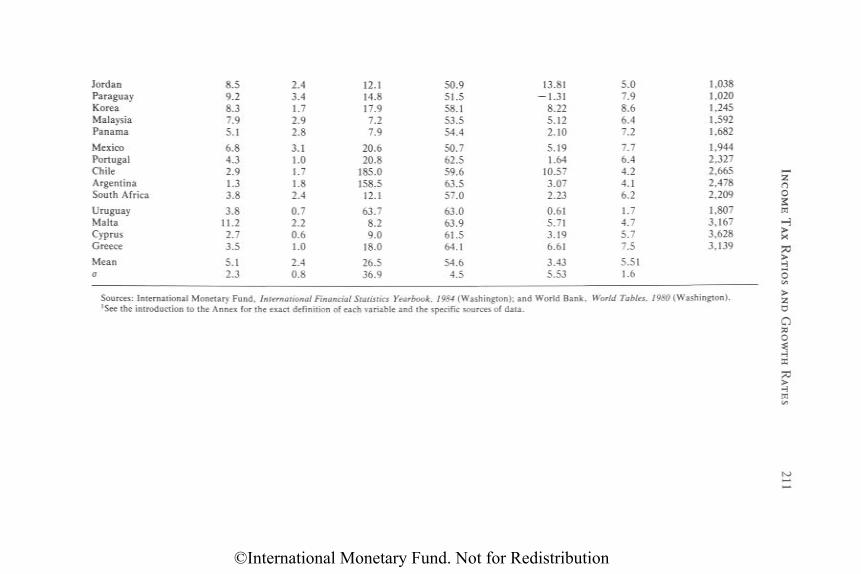
Sources: International Monetary Fund, International Financial Statistics Yearbook, 1984 (Washington); and World Bank, World Tables, 1980 (Washington).1See the introduction to the Annex for the exact definition of each variable and the specific sources of data.
JordanParaguayKoreaMalaysiaPanama
MexicoPortugalChileArgentinaSouth Africa
UruguayMaltaCyprusGreece
Meano
8.59.28.37.95.1
6.84.32.91.33.8
3.811.22.73.5
5.12.3
2.43.41.72.92.8
3.11.01.71.82.4
0.72.20.61.0
2.40.8
12.114.817.97.27.9
20.620.8
185.0158.5
12.1
63.78.29.0
18.0
26.536.9
50.951.558.153.554.4
50.762.559.663.557.0
63.063.961.564.1
54.64.5
13.81-1 .31
8.225.122.10
5.191.64
10.573.072.23
0.615.713.196.61
3.435.53
5.07.98.66.47.2
7.76.44.24.16.2
1.74.75.77.5
5.511.6
1,0381,0201,2451,592
1,682
1,9442,3272,6652,4782,209
1,8073,1673,6283,139
211
©International Monetary Fund. Not for Redistribution
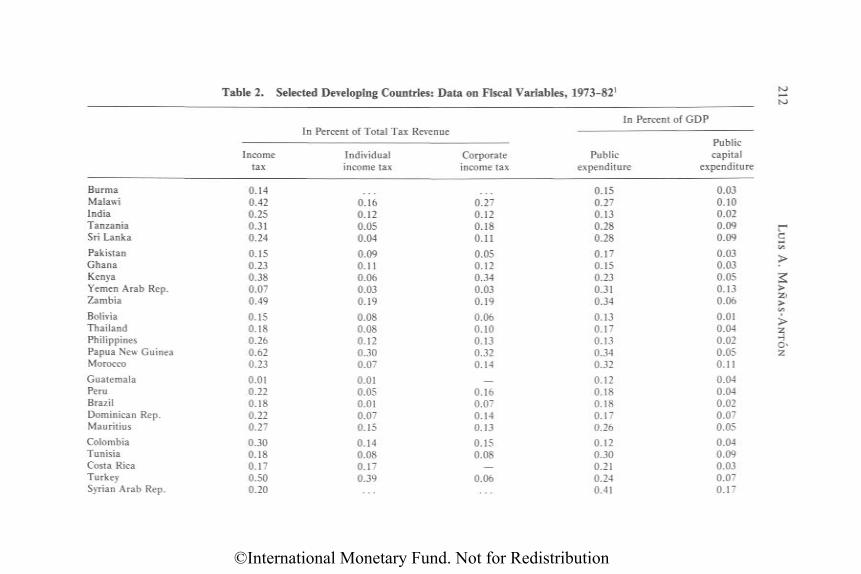
Table 2. Selected Developing Countries: Data on Fiscal Variables, 1973-821
BurmaMalawiIndiaTanzaniaSri Lanka
PakistanGhanaKenyaYemen Arab Rep.Zambia
BoliviaThailandPhilippinesPapua New GuineaMorocco
GuatemalaPeruBrazilDominican Rep.Mauritius
ColombiaTunisiaCosta RicaTurkeySyrian Arab Rep.
Incometax
0.140.420.250.310.24
0.150.230.380.070.49
0.150.180.260.620.23
0.010.220.180.220.27
0.300.180.170.500.20
In Percent of Total Tax Revenue
Individualincome tax
0.160.120.050.04
0.090.110.060.030.19
0.080.080.120.300.07
0.010.050.010.070.15
0.140.080.170.39
Corporateincome tax
0.270.120.180.11
0.050.120.340.030.19
0.060.100.130.320.14
_
0.160.070.140.13
0.150.08
0.06
In Percent of GDP
PublicPublic capital
expenditure expenditure
0.150.270.130.280.28
0.170.150.230.310.34
0.130.170.130.340.32
0.120.180.180.170.26
0.120.300.210.240.41
0.030.100.020.090.09
0.030.030.050.130.06
0.010.040.020.050.11
0.040.040.020.070.05
0.040.090.030.070.17
212
©International Monetary Fund. Not for Redistribution
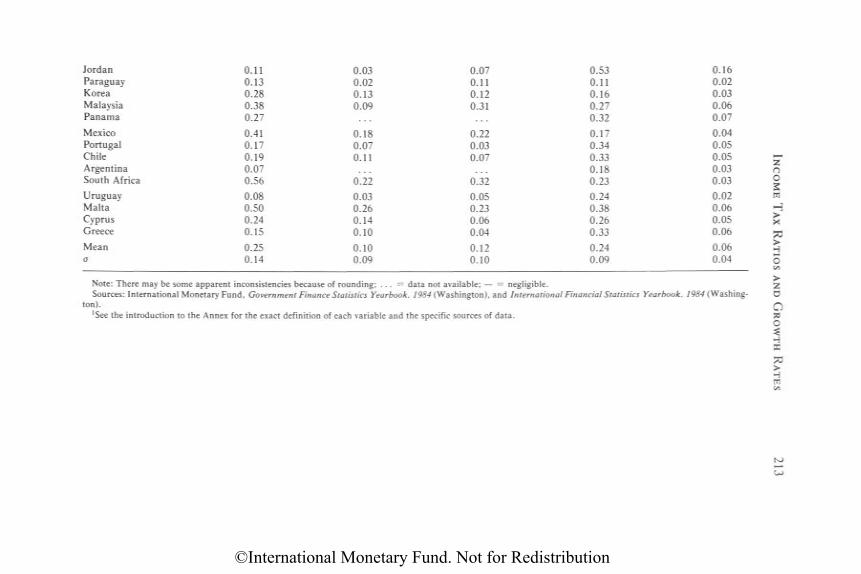
Note: There may be some apparent inconsistencies because of rounding; . . . = data not available; — = negligible.Sources: International Monetary Fund, Government Finance Statistics Yearbook, 1984 (Washington), and International Financial Statistics Yearbook, 1984 (Washing-
ton).1See the introduction to the Annex for the exact definition of each variable and the specific sources of data.
JordanParaguayKoreaMalaysiaPanama
MexicoPortugalChileArgentinaSouth Africa
UruguayMaltaCyprusGreece
Meano
0.110.130.280.380.27
0.410.170.190.070.56
0.080.500.240.15
0.250.14
0.030.020.130.09
0.180.070.11
0.22
0.030.260.140.10
0.100.09
0.070.110.120.31
0.220.030.07
0.32
0.050.230.060.04
0.120.10
0.530.110.160.270.32
0.170.340.330.180.23
0.240.380.260.33
0.240.09
0.160.020.030.060.07
0.040.050.050.030.03
0.020.060.050.06
0.060.04
213
©International Monetary Fund. Not for Redistribution
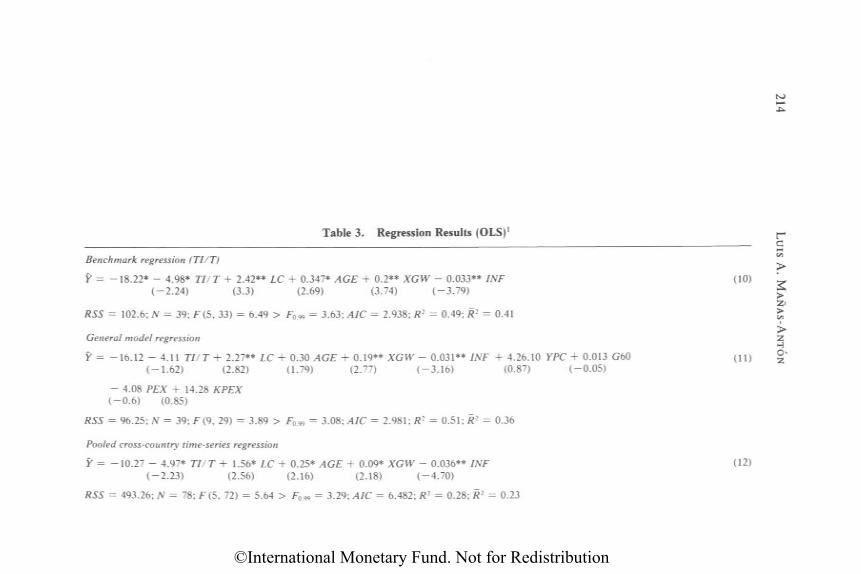
Table 3. Regression Results (OLS)1
Benchmark regression (TI/T)
Y = -18.22* - 4.98* TI/T + 2.42** LC + 0.347* AGE + 0.2** XGW - 0.033** INF (10)
(-2.24) (3.3) (2.69) (3.74) (-3.79)
RSS = 102.6; N = 39; F (5, 33) = 6.49 > F0.99 = 3.63; AIC = 2.938; R2 = 0.49; R2 = 0.41
General model regressionY = -16.12 - 4.11 TI/T + 2.27** LC + 0.30 AGE + 0.19** XGW - 0.031** INF + 4.26.10 YPC + 0.013 G60 (11)
(-1.62) (2.82) (1.79) (2.77) (-3.16) (0.87) (-0.05)
- 4.08 PEX + 14.28 KPEX(-0.6) (0.85)
RSS = 96.25; N = 39; F (9, 29) = 3.89 > F0.99 = 3.08; AIC = 2.981; R2 = 0.51; .R2 = 0.36
Pooled cross-country time-series regression
Y = -10.27 - 4.97* TI/T + 1.56* LC + 0.25* AGE + 0.09* XGW - 0.036** INF (12)(-2.23) (2.56) (2.16) (2.18) (-4.70)
RSS = 493.26; N = 78; F(5, 72) = 5.64 > F0.99 = 3.29; AIC = 6.482; R2 = 0.28; R2 = 0.23
214
©International Monetary Fund. Not for Redistribution
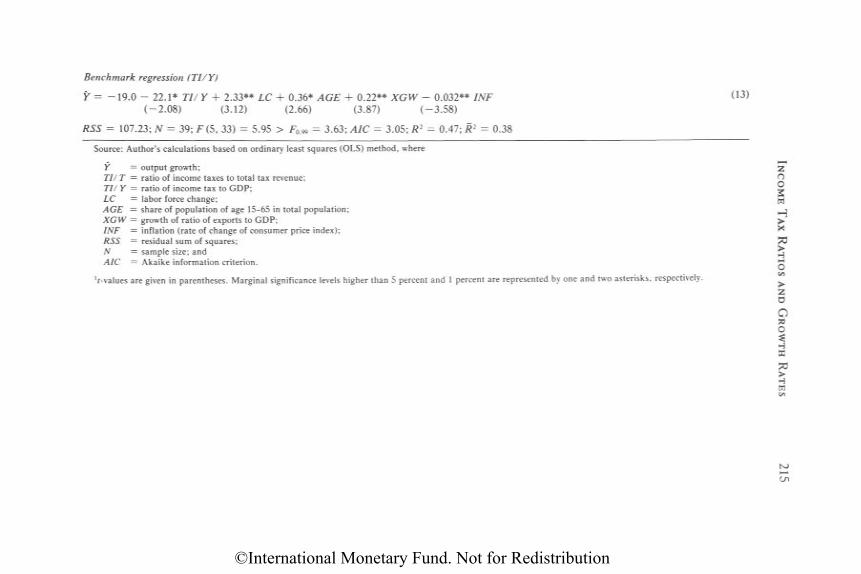
Benchmark regression (TI/Y)
Y = -19.0 - 22.1* TI/ Y + 2.33** LC + 0.36* AGE + 0.22** XGW - 0.032** INF(-2.08) (3.12) (2.66) (3.87) (-3.58)
RSS = 107.23; N = 39; F (5, 33) = 5.95 > F0.99 = 3.63; AIC = 3.05; R2 = 0.47; R2 = 0.38
Source: Author's calculations based on ordinary least squares (OLS) method, where
Y = output growth;TI/ T = ratio of income taxes to total tax revenue;TI/ Y = ratio of income tax to GDP;LC = labor force change;AGE = share of population of age 15-65 in total population;XGW = growth of ratio of exports to GDP;INF = inflation (rate of change of consumer price index);RSS = residual sum of squares;N = sample size; andAIC = Akaike information criterion.
1t-values are given in parentheses. Marginal significance levels higher than 5 percent and 1 percent are represented by one and two asterisks, respectively.
(13)215
©International Monetary Fund. Not for Redistribution
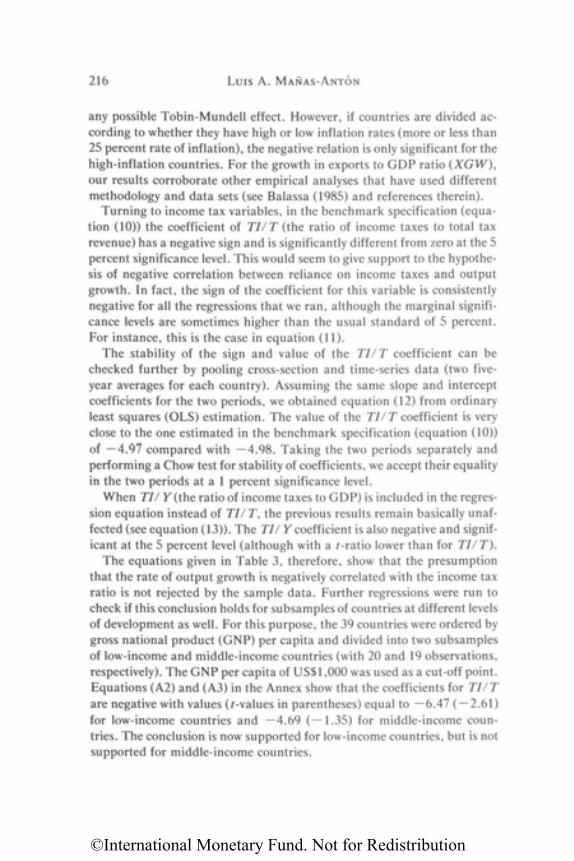
216 Luis A. MANAS-ANTON
any possible Tobin-Mundell effect. However, if countries are divided ac-cording to whether they have high or low inflation rates (more or less than25 percent rate of inflation), the negative relation is only significant for thehigh-inflation countries. For the growth in exports to GDP ratio (XGW),our results corroborate other empirical analyses that have used differentmethodology and data sets (see Balassa (1985) and references therein).
Turning to income tax variables, in the benchmark specification (equa-tion (10)) the coefficient of TI/ T (the ratio of income taxes to total taxrevenue) has a negative sign and is significantly different from zero at the 5percent significance level. This would seem to give support to the hypothe-sis of negative correlation between reliance on income taxes and outputgrowth. In fact, the sign of the coefficient for this variable is consistentlynegative for all the regressions that we ran, although the marginal signifi-cance levels are sometimes higher than the usual standard of 5 percent.For instance, this is the case in equation (11).
The stability of the sign and value of the TI/ T coefficient can bechecked further by pooling cross-section and time-series data (two five-year averages for each country). Assuming the same slope and interceptcoefficients for the two periods, we obtained equation (12) from ordinaryleast squares (OLS) estimation. The value of the TI/ T coefficient is veryclose to the one estimated in the benchmark specification (equation (10))of —4.97 compared with —4.98. Taking the two periods separately andperforming a Chow test for stability of coefficients, we accept their equalityin the two periods at a 1 percent significance level.
When TI/ Y F(the ratio of income taxes to GDP) is included in the regres-sion equation instead of TI/ T, the previous results remain basically unaf-fected (see equation (13)). The TI/ Y coefficient is also negative and signif-icant at the 5 percent level (although with a t-ratio lower than for TI/ T).
The equations given in Table 3, therefore, show that the presumptionthat the rate of output growth is negatively correlated with the income taxratio is not rejected by the sample data. Further regressions were run tocheck if this conclusion holds for subsamples of countries at different levelsof development as well. For this purpose, the 39 countries were ordered bygross national product (GNP) per capita and divided into two subsamplesof low-income and middle-income countries (with 20 and 19 observations,respectively). The GNP per capita of US$1,000 was used as a cut-off point.Equations (A2) and (A3) in the Annex show that the coefficients for TI/ Tare negative with values (t-values in parentheses) equal to —6.47 ( — 2.61)for low-income countries and —4.69 ( — 1.35) for middle-income coun-tries. The conclusion is now supported for low-income countries, but is notsupported for middle-income countries.
©International Monetary Fund. Not for Redistribution
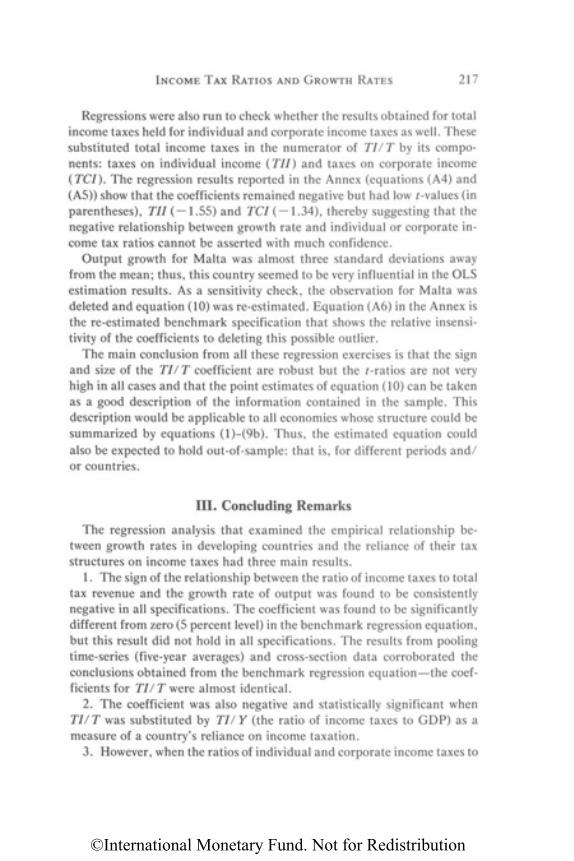
INCOME TAX RATIOS AND GROWTH RATES 217
Regressions were also run to check whether the results obtained for totalincome taxes held for individual and corporate income taxes as well. Thesesubstituted total income taxes in the numerator of TI/ T by its compo-nents: taxes on individual income (TII) and taxes on corporate income(TCI). The regression results reported in the Annex (equations (A4) and(A5)) show that the coefficients remained negative but had low t-values (inparentheses), TII ( —1.55) and TCI (-1.34), thereby suggesting that thenegative relationship between growth rate and individual or corporate in-come tax ratios cannot be asserted with much confidence.
Output growth for Malta was almost three standard deviations awayfrom the mean; thus, this country seemed to be very influential in the OLSestimation results. As a sensitivity check, the observation for Malta wasdeleted and equation (10) was re-estimated. Equation (A6) in the Annex isthe re-estimated benchmark specification that shows the relative insensi-tivity of the coefficients to deleting this possible outlier.
The main conclusion from all these regression exercises is that the signand size of the TI/ T coefficient are robust but the t-ratios are not veryhigh in all cases and that the point estimates of equation (10) can be takenas a good description of the information contained in the sample. Thisdescription would be applicable to all economies whose structure could besummarized by equations (l)-(9b). Thus, the estimated equation couldalso be expected to hold out-of-sample: that is, for different periods and/or countries.
III. Concluding Remarks
The regression analysis that examined the empirical relationship be-tween growth rates in developing countries and the reliance of their taxstructures on income taxes had three main results.
1. The sign of the relationship between the ratio of income taxes to totaltax revenue and the growth rate of output was found to be consistentlynegative in all specifications. The coefficient was found to be significantlydifferent from zero (5 percent level) in the benchmark regression equation,but this result did not hold in all specifications. The results from poolingtime-series (five-year averages) and cross-section data corroborated theconclusions obtained from the benchmark regression equation—the coef-ficients for TI/ T were almost identical.
2. The coefficient was also negative and statistically significant whenTI/ T was substituted by TI/ Y (the ratio of income taxes to GDP) as ameasure of a country's reliance on income taxation.
3. However, when the ratios of individual and corporate income taxes to
©International Monetary Fund. Not for Redistribution
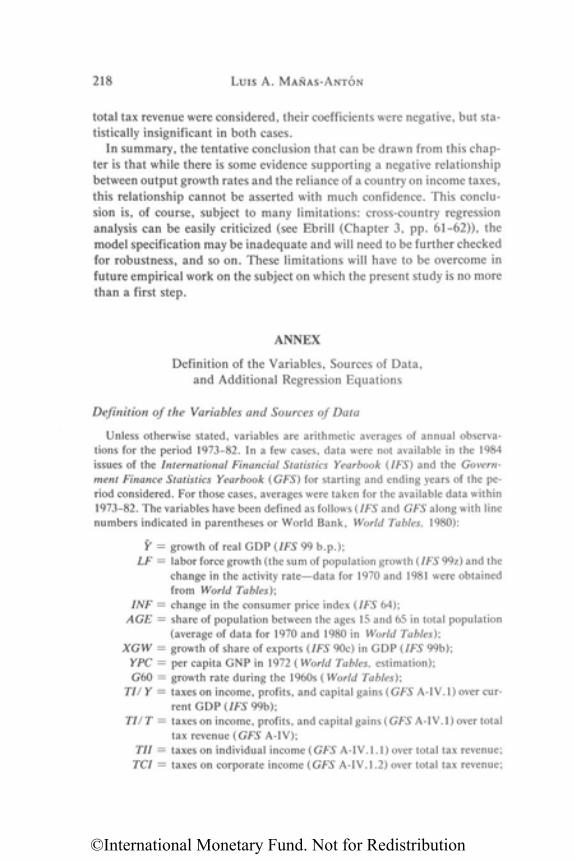
218 Luis A. MANAS-ANTON
total tax revenue were considered, their coefficients were negative, but sta-tistically insignificant in both cases.
In summary, the tentative conclusion that can be drawn from this chap-ter is that while there is some evidence supporting a negative relationshipbetween output growth rates and the reliance of a country on income taxes,this relationship cannot be asserted with much confidence. This conclu-sion is, of course, subject to many limitations: cross-country regressionanalysis can be easily criticized (see Ebrill (Chapter 3, pp. 61-62)), themodel specification may be inadequate and will need to be further checkedfor robustness, and so on. These limitations will have to be overcome infuture empirical work on the subject on which the present study is no morethan a first step.
ANNEX
Definition of the Variables, Sources of Data,and Additional Regression Equations
Definition of the Variables and Sources of Data
Unless otherwise stated, variables are arithmetic averages of annual observa-tions for the period 1973-82. In a few cases, data were not available in the 1984issues of the International Financial Statistics Yearbook (IFS) and the Govern-ment Finance Statistics Yearbook (GFS) for starting and ending years of the pe-riod considered. For those cases, averages were taken for the available data within1973-82. The variables have been defined as follows (IFS and GFS along with linenumbers indicated in parentheses or World Bank, World Tables, 1980):
Y = growth of real GDP (IFS 99 b.p.);LF = labor force growth (the sum of population growth (IFS 99z) and the
change in the activity rate—data for 1970 and 1981 were obtainedfrom World Tables);
INF = change in the consumer price index (IFS 64);AGE = share of population between the ages 15 and 65 in total population
(average of data for 1970 and 1980 in World Tables);XGW = growth of share of exports (IFS 90c) in GDP (IFS 99b);
YPC = per capita GNP in 1972 (World Tables, estimation);G60 = growth rate during the 1960s (World Tables);
TI/ Y = taxes on income, profits, and capital gains (GFS A-IV.l) over cur-rent GDP (IFS 99b);
TI/ T = taxes on income, profits, and capital gains (GFS A-IV.l) over totaltax revenue (GFS A-IV);
TII = taxes on individual income (GFS A-IV. 1.1) over total tax revenue;TCI — taxes on corporate income (GFS A-IV. 1.2) over total tax revenue;
©International Monetary Fund. Not for Redistribution
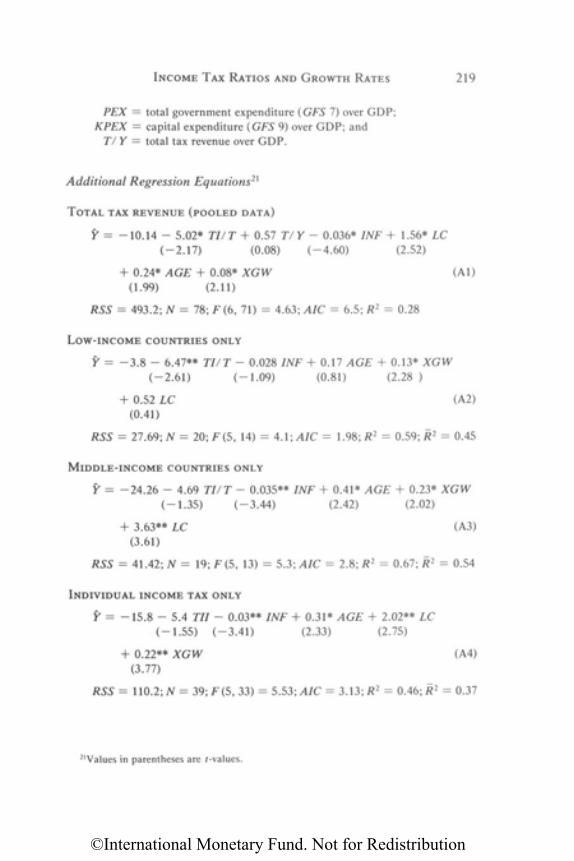
INCOME TAX RATIOS AND GROWTH RATES 219
PEX = total government expenditure (GFS 7) over GDP;KPEX = capital expenditure (GFS 9) over GDP; and
T/Y = total tax revenue over GDP.
Additional Regression Equations21
TOTAL TAX REVENUE (POOLED DATA)
Y = -10.14 - 5.02* TI/T + 0.57 T/Y - 0.036* INF + 1.56* LC(-2.17) (0.08) (-4.60) (2.52)
+ 0.24* AGE + 0.08* XGW (Al)(1.99) (2.11)
RSS = 493.2; N = 78; F (6, 71) = 4.63; AIC = 6.5; R2 = 0.28
LOW-INCOME COUNTRIES ONLY
Y = -3 .8 - 6.47** TI/T - 0.028 INF + 0.17 AGE + 0.13* XGW(-2.61) (-1.09) (0.81) (2.28 )
+ 0.52 LC (A2)(0.41)
RSS = 27.69; N = 20; F (5, 14) = 4.1; AIC = 1.98; R2 = 0.59; R2 = 0.45
MIDDLE-INCOME COUNTRIES ONLY
Y = -24.26 - 4.69 TI/T - 0.035** INF + 0.41* AGE + 0.23* XGW(-1.35) (-3.44) (2.42) (2.02)
+ 3.63** LC (A3)(3.61)
RSS = 41.42; AT = 19; F (5, 13) = 5.3; AIC = 2.8; R2 = 0.67; R2 = 0.54
INDIVIDUAL INCOME TAX ONLY
Y = -15.8 - 5.4 TII - 0.03** INF + 0.31* AGE + 2.02** LC(-1.55) (-3.41) (2.33) (2.75)
+ 0.22** XGW (A4)(3.77)
RSS = 110.2;N = 39;F(5, 33) = 5.53; A/C = 3.13; R2 = 0.46; R2 = 0.37
2lValues in parentheses are t-values.
©International Monetary Fund. Not for Redistribution
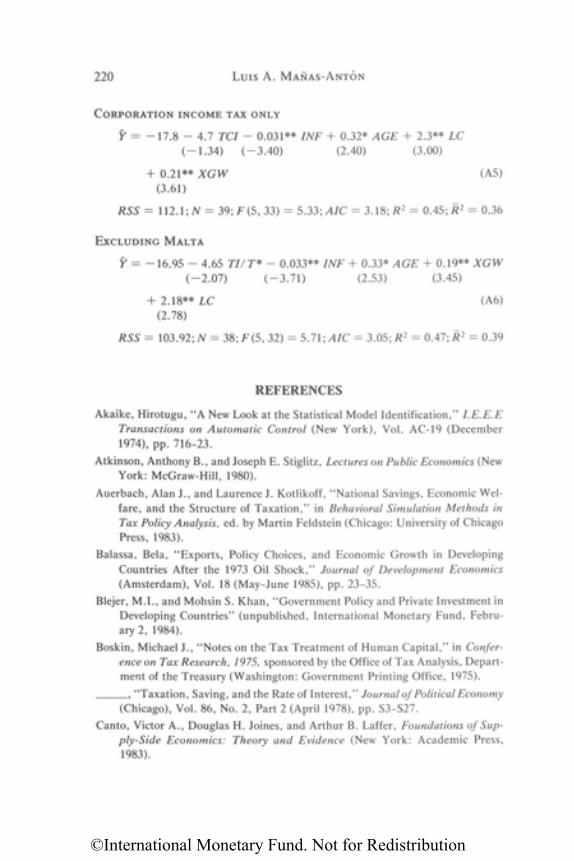
220 Luis A. MANAS-ANTON
CORPORATION INCOME TAX ONLY
Y = -17.8 - 4.7 TCI - 0.031** INF + 0.32* AGE + 2.3** LC(-1.34) (-3.40) (2.40) (3.00)
+ 0.21** XGW (A5)(3.61)
RSS = 112.1; N = 39;F(5, 33) = 5.33; AIC = 3.18; R2 = 0.45; R2 = 0.36
EXCLUDING MALTA
Y = -16.95 - 4.65 TI/T* - 0.033** INF + 0.33* AGE + 0.19** XGW(-2.07) (-3.71) (2.53) (3.45)
+ 2.18** LC (A6)(2.78)
RSS = 103.92; N = 38;F(5,32) = 5.71; AIC = 3.05; R2 = 0A7;R2 = 0.39
REFERENCES
Akaike, Hirotugu, "A New Look at the Statistical Model Identification," I.E.E.ETransactions on Automatic Control (New York), Vol. AC-19 (December1974), pp. 716-23.
Atkinson, Anthony B., and Joseph E. Stiglitz, Lectures on Public Economics (NewYork: McGraw-Hill, 1980).
Auerbach, Alan J., and Laurence J. Kotlikoff, "National Savings, Economic Wel-fare, and the Structure of Taxation," in Behavioral Simulation Methods inTax Policy Analysis, ed. by Martin Feldstein (Chicago: University of ChicagoPress, 1983).
Balassa, Bela, "Exports, Policy Choices, and Economic Growth in DevelopingCountries After the 1973 Oil Shock," Journal of Development Economics(Amsterdam), Vol. 18 (May-June 1985), pp. 23-35.
Blejer, M.I., and Mohsin S. Khan, "Government Policy and Private Investment inDeveloping Countries" (unpublished, International Monetary Fund, Febru-ary 2, 1984).
Boskin, Michael J., "Notes on the Tax Treatment of Human Capital," in Confer-ence on Tax Research, 1975, sponsored by the Office of Tax Analysis, Depart-ment of the Treasury (Washington: Government Printing Office, 1975).
, "Taxation, Saving, and the Rate of Interest," Journal of Political Economy(Chicago), Vol. 86, No. 2, Part 2 (April 1978), pp. S3-S27.
Canto, Victor A., Douglas H. Joines, and Arthur B. Laffer, Foundations of Sup-ply-Side Economics: Theory and Evidence (New York: Academic Press,1983).
©International Monetary Fund. Not for Redistribution
INCOME TAX RATIOS AND GROWTH RATES 221
Dennison, E., The Sources of Economic Growth in the United States and the Al-ternatives Before Us (New York Committee for Economic Development,1962).
Feder, Gershon, "On Exports and Economic Growth," Journal of DevelopmentEconomics (Amsterdam), Vol. 12 (February-April 1983), pp. 59-73.
Feldstein, Martin S., "Incidence of a Capital Income Tax in a Growing Economywith Variable Savings Rates," Review of Economic Studies (Edinburgh), Vol.41 (October 1974), pp. 505-13.
, Capital Taxation (Cambridge, Massachusetts: Harvard University Press,1983).
Fischer, Stanley, "Anticipations and the Nonneutrality of Money," Journal of Po-litical Economy (Chicago), Vol. 87 (April 1979), pp. 225-52.
Fullerton, Don, and Jonathan Skinner, "Cost Price Effects and Capital Taxation,"National Tax Association—Tax Institute of America, Proceedings of the Sev-enty-Seventh Annual Conference on Taxation (Columbus, Ohio, 1985).
Galbis, Vicente, "Inflation and Interest Rate Policies in Latin America, 1967-76,"Staff Papers, International Monetary Fund (Washington), Vol. 26 (June1979), pp. 334-66.
Geweke, John, and Richard Meese, "Estimating Regression Models of Finite butUnknown Order," International Economic Review (Osaka, Japan), Vol. 22(February 1981), pp. 55-70.
Giovannini, A., "Saving and the Real Interest Rate in LDCs," Journal of Develop-ment Economics (Amsterdam), Vol. 18 (August 1985), pp. 197-218.
Goode, Richard B., The Individual Income Tax (Washington: Brookings Institu-tion, rev. ed., 1976).
Hall, Robert E., "Consumption Taxes Versus Income Taxes: Implications for Eco-nomic Growth," National Tax Association, Proceedings of the Sixty-First An-nual Conference on Taxation (Columbus, Ohio, 1968).
Howrey, E. Philip, and Saul H. Hymans, "The Measurement and Determinationof Loanable-Funds Saving," in What Should Be Taxed: Income or Expendi-ture? ed. by Joseph A. Pechman (Washington: Brookings Institution, 1980).
International Monetary Fund, Interest Rate Policies in Developing Countries: AStudy by the Research Department of the International Monetary Fund, Oc-casional Paper No. 22 (Washington, October 1983).
Judge, George G., W.E. Griffiths, R. Carter Hill, and Tsoung-Chao Lee, TheTheory and Practice of Econometrics (New York: John Wiley, 1980).
Kamien, Morton I., and Nancy L. Schwartz, Market Structure and Innovation(Cambridge, Massachusetts: Cambridge University Press, 1982).
Kormendi, Roger C., and Philip G. Meguire, "Macroeconomic Determinants ofGrowth: Cross-Country Evidence," Journal of Monetary Economics (Amster-dam), Vol. 16 (September 1985), pp. 141-63.
Kotlikoff, Laurence J., "Taxation and Savings: A Neoclassical Perspective," Jour-
©International Monetary Fund. Not for Redistribution
222 Luis A. M A N A S - A N T O N
nal of Economic Literature (Nashville, Tennessee), Vol. 22 (December 1984),pp. 1576-1629.
Marsden, Keith, "Links between Taxes and Economic Growth: Some EmpiricalEvidence," World Bank Staff Working Paper No. 605 (Washington, 1983).
Meade, J.E., The Structure and Reform of Direct Taxation (London: Allen &Unwin, 1978).
Mirman, Leonard J., "Uncertainty and Optimal Consumption Decisions," Econo-metrica (Evanston, Illinois), Vol. 37 (January 1971), pp. 179-85.
Modi, Jitendra R., "Major Features of Corporate Profit Taxes in Selected Devel-oping Countries," Bulletin, International Bureau of Fiscal Documentation(Amsterdam), Vol. 41 (February 1987), pp. 65-74.
Pechman, Joseph A., ed., What Should Be Taxed: Income or Expenditure?(Washington: Brookings Institution, 1980).
Prest, A.R., Public Finance in Developing Countries (New York: St. Martin'sPress, 3rd ed., 1985).
Sandmo, A., "The Effect of Uncertainty on Saving Decisions," Review of Eco-nomic Studies (Edinburgh), Vol. 37 (July 1970), pp. 353-60.
Tanzi, Vito, The Individual Income Tax and Economic Growth: An InternationalComparison (Baltimore: Johns Hopkins University Press, 1969).
, "Quantitative Characteristics of the Tax Systems of Developing Coun-tries," in The Theory of Taxation for Developing Countries, ed. by DavidNewbery and Nicholas Stern (New York: Oxford University Press, 1987).
Theil, Henri, Principles of Econometrics (New York: John Wiley, 1971).
Yusuf, Shahid, and R. Kyle Peters, "Capital Accumulation and EconomicGrowth: The Korean Paradigm," World Bank Staff Working Paper No. 712(Washington, 1985).
©International Monetary Fund. Not for Redistribution
PART III
Tax Policy for Efficiency and Growth:Aspects of Basic Supply-Side
Tax Policy
©International Monetary Fund. Not for Redistribution

This page intentionally left blank
©International Monetary Fund. Not for Redistribution
Tax Structure for Efficiency andSupply-Side Economics in Developing
Countries
Ved P. Gandhi
Supply-side economists stress minimizing the distortions that taxes, ingeneral, and high and progressive taxes, in particular, inject into marketdecisions and believe that reforming the tax structures, in general, andlowering the rates of taxes, in particular, would encourage savings andproduction by allowing the economic incentives of a free market to work.1
As the problems of developing countries frequently are the result of insuffi-cient savings and production, it would appear, prima facie, that the taxpolicy prescriptions of supply-siders, viz., low and less progressive taxes,could be highly relevant to them. This argument provides the backgroundfor the present paper.
The purpose of this paper is not to discuss the validity of factor andoutput elasticity (growth) optimism of the popular supply-side economists;this has been examined in the preceding chapters and by other authors.2
Instead, this paper attempts to identify the relationships that the tax policyprescriptions of supply-side economics bear with those of the traditionaland modern literature on taxation. In addition, it seeks to establish what
1As described in Chapter 1, basic supply-side economists focus on all aspects of the taxsystem, while the popular supply-side economists primarily focus on the levels and progressiv-ity of marginal income tax rates. An empirical study frequently quoted in support of thevalidity of the proposition that lower taxes will encourage economic growth in developingcountries is that of Marsden (1983a and 1983b). The Annex to this chapter describes andreviews the methodology underlying this study.
2In particular, see Boskin (1973, 1978, 1982); Howrey and Hymans (1980); King (1980);Rosen (1980); Hausman (1981a, 1981b); Keleher (1982); Keleher and Orzechowski (1982);and Evans(1982, 1983).
225
9
©International Monetary Fund. Not for Redistribution
226 VED P. GANDHI
the tax system of developing countries would look like if supply-side (disin-centive) effects of taxation and efficiency in the allocation of resources werethe major concerns of tax policymakers. The discussion in the chapter cov-ers both tax design (establishing a new tax system) and tax reform (revisingthe existing tax system).
This chapter therefore has five objectives. First, it defines the efficiencyobjective of a tax system, reviews the importance of this objective amongmultiple objectives of taxation in the literature, and describes the broadtheoretical characteristics of a tax system based on efficiency consider-ations (Section I). Second, after reviewing selected literature on taxation,it attempts to throw light on those elements of a tax structure, or the struc-ture of tax bases, that would minimize distortions and thus would be con-sistent with the efficiency objective (Section II). Third, it seeks to define arate design, or the structure of tax rates (including its progressivity), thatwould be least distortionary and thus would be consistent with the effi-ciency objective (Section III). Fourth, it examines the differences betweena popular supply-side economist and a modern optimal tax economist(Section IV). Finally, the chapter concludes with some thoughts on theimplications of the popular supply-side approach to tax reform in develop-ing countries.
I. Supply-Side Objectives of the Tax System—in Theory
Supply-side economists stress that "neutrality" in taxation is the mostdesirable of all objectives of taxation, but, if for some practical reason thisobjective is unattainable, a second-best aim should be to minimize the dis-tortionary substitution and excise effects of taxation. In fact, as was men-tioned in Chapter 1, few tax economists would disagree with the impor-tance attached to the neutrality objective or the reduction of distortionaryeffects of taxation.3 In theoretical literature, this objective is labeled as the
3"Neutrality" in the strictest sense will require that neither relative prices of goods andservices nor relative factor rewards should be affected by tax rates or other provisions of thetax system. A less stringent definition of neutrality will involve effective tax rates to be suchthat they will avoid diversions of labor, savings, investments, etc., to uses that are subopti-mal. For a fuller discussion of this subject, see section on "A Neutral Tax System," below.Even some popular supply-siders have emphasized the objective of neutrality. See Kemp(1981, p. 68), Raboy (1982, p. 58), and Ture (1982, p. 17).
©International Monetary Fund. Not for Redistribution
TAX STRUCTURE FOR EFFICIENCY 227
"efficiency" objective of taxation.4 In this paper, therefore, the two terms,neutrality and efficiency, will be used interchangeably.
Conflicts Among Multiple Objectives of Taxation
Traditional tax theory, taking a cue from political reality, consideredtaxation as an instrument with multiple objectives: to raise adequate reve-nue with administrative ease, to correct externalities and play a sumptuaryrole, to redistribute income and wealth and, since Keynes, to stabilize ag-gregate demand and support other macroeconomic objectives. As the his-tory of economic thought reveals, it is not that the traditional tax literatureignored the supply-side effects (distortionary economic effects) of taxationthat so concern supply-side economists, but that it frequently treated effi-ciency and equity as two separate criteria. The traditional tax literaturediscussed them sequentially offering little or no guidance on how theycould or should be combined.5 When the two conflicted, the traditionaltheory tended to allow the objective of equity and fairness in taxation takeprecedence over neutrality and efficiency.
For example, while Adam Smith's famous canons of taxation (equity,certainty, convenience, and collection cost) did not include a supply-sideobjective and he ultimately argued in favor of the ability-to-pay principle("The subjects of every state . . . ought to contribute . . . as nearly as pos-sible, in proportion to their respective abilities"), he was, nevertheless,well aware of the effects of high taxes on output and government revenuesvia the behavior of taxpayers. As he wrote, "high taxes, sometimes by di-minishing the consumption of the taxed commodities and sometimes byencouraging smuggling, afford a smaller revenue to government than whatmight be drawn from more moderate taxes."6
4That productive efficiency or ensuring the efficient allocation of resources is desirable fre-quently goes unquestioned. However, there may be exceptional situations where productiveinefficiency rather than efficiency may be "optimal" on certain distributive and allocativegrounds. Such situations are described in Dasgupta and Stiglitz (1972) and Mirrlees (1972).They, of course, involve high administrative and informational costs. See Sandmo (1976,p. 48).
5See, for example, Musgrave (1959) and Samuelson (1969). The conflict between equityand efficiency in taxation has been well known in literature and has been frequently repeatedby economists since the time of Adam Smith. Much of the recent optimal taxation literature,in fact, is devoted to developing a framework for dealing with both simultaneously ratherthan separately.
6Smith (1950, Volume II, pp. 310 and 367). The Laffer curve of supply-side economicsseems to draw its inspiration from this quotation from Smith.
©International Monetary Fund. Not for Redistribution
228 VED P. GANDHI
Alfred Marshall did not have much to say on the objectives of a good taxsystem, yet he argued that high excise taxes on necessities were better thanmany other taxes because, given their low elasticity of demand, they havethe least effect on consumer welfare: "If therefore a given aggregate taxa-tion has to be levied ruthlessly from any class it will cause less loss of con-sumers' surplus if levied on necessaries than if levied on comforts."7
Arthur Pigou considered a tax system based on the principle of leastaggregate sacrifice (i.e., on distributional considerations) to be ideal, buthe, too, was very conscious of the "announcement effects" of high tax rateson the supply of work effort, savings, and risk-undertaking. He was partic-ularly concerned about the significance of these effects on savings.8
Henry Simons had all the attributes of becoming the first supply-side taxeconomist. A strong advocate of reducing the role of government, he dis-liked selective consumption taxes because they interfered with the free pri-vate allocation of resources. He also disliked general consumption taxesbecause they were easy to collect and were likely to lead to irresponsiblegovernment expenditure. Nonetheless, he, too, ended up favoring progres-sive taxation, essentially on the "moral" ground of reducing inequality. Hewas, of course, quite concerned about the economic effects of progressionon the supply of capital, but accepted the trade-off between equity andgrowth, finally asserting that the dangers of infringement of taxes on in-centives were much exaggerated.9
It must, therefore, be recognized that tax policy has been and will re-main an instrument of achieving multiple objectives. Many leading tradi-tional theorists on public finance have struggled with the multiplicity ofobjectives of taxation but, while recognizing the likely economic (relativeprice) effects of taxation, concluded that equity was the more importantobjective in designing a tax system.10 Once that was accepted, the tradi-tional literature on taxation concentrated on the search for a proper taxbase (i.e., the measures of ability to pay—income, expenditure, wealth)and a proper rate structure (i.e., the measures of equality of sacrifice—progressivity, proportionality, regressivity).11
7 Marshall (1948, p. 467) quoted in D. Walker (1970, p. 365).8Pigou (1962, p. x). The optimal taxation literature, in fact, traces its origin to Pigou's
"announcement effects" in estimating the deadweight losses of various taxes. Indeed, Pigouis said to have posed the "Ramsey problem" to Ramsey and helped to develop the efficiencyrules relating to taxation.
9Simons (1938, pp. 18-19) and (1950).10Some theoreticians, such as Rawls (1971), believed only in the equity objective.11See Goode (1976, especially Chapters 2 and 4).
©International Monetary Fund. Not for Redistribution
TAX STRUCTURE FOR EFFICIENCY 229
A Neutral Tax System
The relevant question that this chapter must address is the following. Ifthe multiple objectives of taxation are to be foresaken and if neutrality orefficiency is to be the paramount objective of taxation (i.e., if the primaryaim is to cause minimal distortions to the choices of economic agents),what is an ideal tax system? A clue to the answer to this question is pro-vided by the theory of the first-best and the second-best taxation, suc-cinctly developed primarily in the recent literature on optimal taxation.
General Theory of the First-Best Taxation
The theory of first best claims that, in the absence of market failures,12
all taxes, except lump-sum taxes and those levied on inelastic bases that anindividual cannot alter by any of his actions, should be considered distor-tionary.13 All taxes, other than those mentioned above, increase ratherthan reduce distortions in one or more of the following: (1) the relativeprices of commodities; (2) the relative rewards of factors of production; (3)the relative values of present versus future consumption; and (4) the rela-tive rewards of work versus leisure.
Government activities should, therefore, as a first-best solution, be pri-marily financed not through taxes (except via a poll tax or a tax on inelasticbases which alone are consistent with Pareto optimum), but through userprices.14
This view of taxation depends on five main assumptions. (1) Choicesmade by individuals are better than other choice mechanisms, since all
12 Market failures, defined as the inability of markets to achieve an efficient allocation ofresources, generally arise in cases of goods where (1) private costs and benefits are differentfrom social costs and benefits; (2) prices are higher than marginal costs due to the failure ofcompetition or the existence of monopolies; or (3) benefits of outputs are shared by all indi-viduals, irrespective of whether or not they pay.
13Any system of taxation will have an income effect, but a tax is said to be distortionary (orto cause "excess" burden) if it creates distortions in compensated demands. For details of thisargument see Atkinson and Stiglitz (1980) and Tresch (1981).
l4These prices, sometimes called benefit taxes, can be based on the voluntary exchangeprinciple, enunciated by Wicksell and Lindahl. This is particularly valid for "impure" publicgoods, which do not suffer from the "free rider" problem, that is, where consumers can beidentified and preferences can be determined. "Pure" public goods should, on the otherhand, be financed through nondiscriminatory and nondistortionary poll taxes. All pure pub-lic or nonmarket goods, of course, have a revelation problem requiring the use of demand-revealing mechanisms that are nondistortionary. For some of these mechanisms, see Vickrey(1961, pp. 8-37) and Mueller (1979, pp. 72-84). For any redistribution beyond that implicitin Pareto-optimal taxation, the theory of first best recommends lump-sum transfers only.
©International Monetary Fund. Not for Redistribution
230 VED P. GANDHI
individuals are rational economic beings and have the relevant informationneeded for making rational decisions. (2) Product and factor markets areperfectly competitive, factors are perfectly mobile, and pretax marketprices reflect true social opportunity costs. Implicit in this assumption isthe belief that the cost of and benefits from consumption or production arewholly internalized—there are no externalities or spillovers. (3) Individualbehavior is affected by prices (taxes being, of course, elements of prices);that is, there are neither social and institutional constraints nor any uncer-tainty influencing individual economic behavior. (4) Government expendi-tures have no desirable effect on relative prices; they certainly cannot com-pensate for the distortionary effects of taxation on relative prices and at thesame time provide "merit goods" that may be desirable on social welfaregrounds. (5) Redistribution is not a major objective of taxation; the initialdistribution of income and wealth as well as the redistribution generatedby market forces (and lump-sum transfers, if any) are correct and sociallyacceptable or else that redistribution should be achieved by policy instru-ments other than taxation.
The theory of first best does tolerate some taxation (and subsidies) be-sides poll taxes, even though it affects market-determined relative prices,but only under two conditions. The first condition is that it correct somemajor market failure (such as positive and negative externalities), that is,raise the level of private costs to the level of social costs or absorb the excessof private benefits over social benefits.15 This, of course, requires thatthere is an agreement among one and all as to the existence and magni-tudes of externalities in the economic system and that the differences be-tween private and social costs (and benefits) can be measured to design anoptimal tax (or subsidy). The second condition is that the negative tax orthe subsidy bring the prices charged by decreasing-cost (i.e., increasing-return) industries to the level of long-run marginal costs and optimizeoutput.
General Theory of the Second-Best Taxation
The theory of second best starts with the premise that (1) reality is un-likely to conform to the assumptions needed for first-best solutions; (2)
15An externality exists whenever the action of a given consumer (or a producer) affects,negatively or positively, the utility (or production possibilities) of some other consumer (orproducer), so that the marginal social cost of his action differs from the marginal private costof his action. The appropriate first-best policy in such a case would be to make the formerindividuals directly compensate the latter financially for the latter's gains and losses. How-ever, this may not be possible if more than a few individuals are involved.
©International Monetary Fund. Not for Redistribution
TAX STRUCTURE FOR EFFICIENCY 231
lump-sum taxes are generally infeasible, forbidden, or simply insufficientto meet revenue needs; and (3) all other taxes distort individual choicesand create deadweight (welfare) losses to the consumer and/or to the pro-ducer, by placing a "wedge" between prices paid and prices received.
The basic premise of the theory of the second best, then, is that when agovernment must raise a given amount of revenue by imposing a distor-tionary tax (i.e., a tax with "excess" burden), it is generally optimal to taxall goods and factors at differentiated rates to bring about equipropor-tional changes in compensated demand and supplies so as to minimize ex-cess burden (Ramsey rule).16 That is, tax rates should not be uniform:goods and factors with relatively inelastic demand and supply should besubjected to relatively higher rates of taxation. This is the well-known in-verse elasticity rule, according to which an efficient tax is one whose rate isproportional to the inverse of the price elasticity of the tax base.
The recent optimal taxation literature, which deals with direct versusindirect taxes, as well as the mix between direct and indirect taxes, is es-sentially an application of this theory of the second best and attempts tominimize the deadweight loss of any and all packages of distortionary butfeasible taxes.17 The design of a tax system in the second-best situationrequires that, for each individual, the own- and cross-price elasticities ofdemand (of commodities consumed) and supply (of factor inputs) areknown and that, despite the wide range of elasticities that exist betweenindividuals, it is possible to "personalize" the tax base and the tax rates foreach individual separately.
Conclusion
In sum, a tax system would seem to meet the efficiency or supply-sideobjective fully if it either did not affect relative prices at all (theory of firstbest), or if it only affected them in a unique manner, as described above(theory of second best). The tax-mix and the rate-design characterizingsuch a tax system, which emerge from the foregoing discussion, is summa-rized in Table 1.
As is apparent from Table 1, a neutral and efficiency-dictated tax sys-tem would require reforms in the tax bases as well as in the tax rates. As a
16 The presence or absence of pure profits can complicate the optimal tax rules and raiseissues concerning the number of degrees of freedom available to the government. Cf., Munk(1978).
17In fact, optimal taxation theory is an advance over second-best theory since it allows fornonlinear taxes, which were ruled out by Ramsey. For a brief review of optimal taxationliterature, see Sandmo (1976) and Stern (1984).
©International Monetary Fund. Not for Redistribution
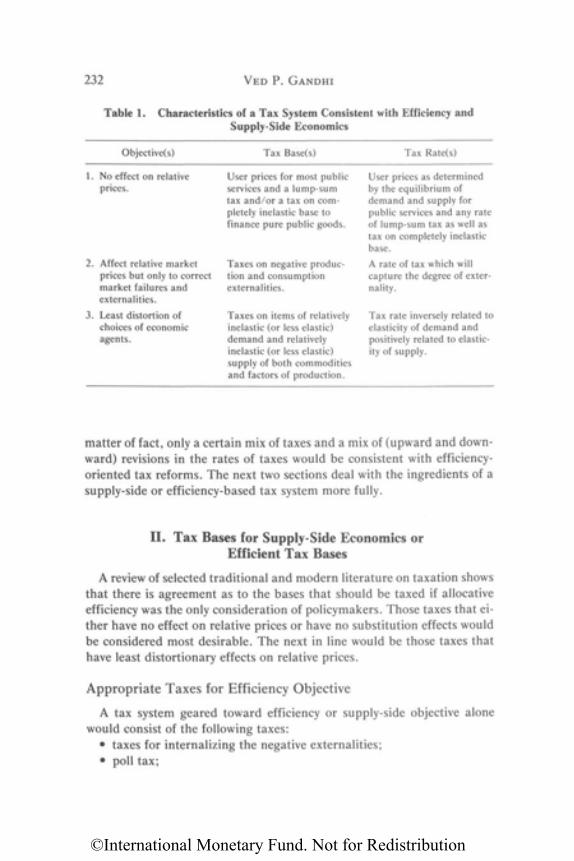
232 V E D P. GANDHI
Table 1. Characteristics of a Tax System Consistent with Efficiency andSupply-Side Economics
Objective(s) Tax Base(s) Tax Rate(s)
1. No effect on relativeprices.
2. Affect relative marketprices but only to correctmarket failures andexternalities.
3. Least distortion ofchoices of economicagents.
User prices for most publicservices and a lump-sumtax and/or a tax on com-pletely inelastic base tofinance pure public goods.
Taxes on negative produc-tion and consumptionexternalities.
Taxes on items of relativelyinelastic (or less elastic)demand and relativelyinelastic (or less elastic)supply of both commoditiesand factors of production.
User prices as determinedby the equilibrium ofdemand and supply forpublic services and any rateof lump-sum tax as well astax on completely inelasticbase.
A rate of tax which willcapture the degree of exter-nality.
Tax rate inversely related toelasticity of demand andpositively related to elastic-ity of supply.
matter of fact, only a certain mix of taxes and a mix of (upward and down-ward) revisions in the rates of taxes would be consistent with efficiency-oriented tax reforms. The next two sections deal with the ingredients of asupply-side or efficiency-based tax system more fully.
II. Tax Bases for Supply-Side Economics orEfficient Tax Bases
A review of selected traditional and modern literature on taxation showsthat there is agreement as to the bases that should be taxed if allocativeefficiency was the only consideration of policymakers. Those taxes that ei-ther have no effect on relative prices or have no substitution effects wouldbe considered most desirable. The next in line would be those taxes thathave least distortionary effects on relative prices.
Appropriate Taxes for Efficiency Objective
A tax system geared toward efficiency or supply-side objective alonewould consist of the following taxes:
• taxes for internalizing the negative externalities;• poll tax;
©International Monetary Fund. Not for Redistribution
TAX STRUCTURE FOR EFFICIENCY 233
• taxes on land area;• taxes on windfall or monopoly profits;• taxes on items with inelastic demand (such as basic necessities); and• taxes on the ability of individuals to earn income, or on potential in-
come. (The second-best alternatives to this proposal would be either atax on accrued income of an individual coupled with taxes on the con-sumption of complements to leisure, or a tax on life-time personalexpenditures.)
The rationale for taxes for internalizing the externalities and the poll taxis clear from the arguments given in Section I.18 Taxes on land area aredefensible on the assumption that land is in inelastic supply, so that theground rent of land is a sort of economic rent. Taxes on windfall or monop-oly profits are justified on the ground that they will not affect price andproduction decisions made by producers before the imposition of suchtaxes. Taxes on basic necessities are defended on the ground that thesecommodities tend to have inelastic demand.
A tax on ability to earn income or on potential income is also acceptablebut this requires further explanation. Whereas a tax on actual earningsallows a person to favor leisure over work, a tax on potential income asdetermined by ability (which is inelastic in supply) is said to be nondistor-tionary.19 However, ability is difficult to measure, so that a tax on potentialincome will be difficult to administer. Hence a tax on accrued income (in-cluding own consumption, transfers by gifts and bequests, and unrealizedcapital gains), though a poor second best, is considered a vast improve-ment over existing income tax systems, which are based on realized moneyincomes and which contain many tax shelters and loopholes. But a tax onaccrued income, besides entailing the well-known problem of how to mea-sure the unrealized gains, would still suffer from intratemporal and inter-temporal inefficiencies: the leisure component of welfare or economic ca-pacity would still remain tax free, resulting in intratemporal welfare lossfrom distortions in work-leisure choices, and savings would continue to bepenalized by double taxation causing intertemporal inefficiency. (The lat-ter would be exacerbated by inflation.)
To avoid the distorting effect of income taxes on intratemporal choices,and recognizing the difficulties of taxing leisure, taxes on consumptiongoods that are complements to leisure are generally recommended. Toavoid the distorting effect of income taxes on intertemporal choices, the
18Poll tax is justified only when the assumption of no migration is made.19For a detailed discussion of this point, see Kay and King (1980, Chapter 6, especially
pp. 75-76), Tanzi (1980), and Millward (1983, especially Chapter 2).
©International Monetary Fund. Not for Redistribution
234 VED P. GANDHI
exemption of savings from the tax base is favored and the levy of a flat-ratetax on the lifetime consumption of an individual (with a personal exemp-tion or an exemption that recognizes differences in family circumstances)is considered theoretically attractive. Leisure will, nonetheless, remain un-taxed even under a personal consumption or expenditure tax, producing adisincentive to work; consequently, even the proposal to replace an incometax by a personal consumption tax will not be completely satisfactory onefficiency grounds. However, the efficiency losses of an expenditure tax arestated to be much smaller than those of the present income tax, which isfrequently based on realized incomes and a nonindexed tax base, andwhich arbitrarily discriminates among various forms of savings (e.g., infavor of owner-occupied housing and against equity investment).20
Efficiency or supply-side considerations would thus demand that manytaxes existing in the tax systems of developing and developed countriesshould be eliminated.21 There is no place, for example, in such a system forthe following:
• A separate corporation income tax—for without imputation (ade-quate credit to the shareholder), it is an additional tax on the form ofbusiness organization, and all incomes and taxes must, in the finalanalysis, be imputed to individuals. In addition, a corporation incometax also tends to be nonneutral whenever (1) tax depreciation differsfrom economic depreciation; (2) inventory valuation in inflationarytimes is different from that on replacement basis (last in, first outrather than first in, first out); and (3) dividends are treated differentlyfrom interest payments. The tax can become neutral provided thesedifferences are eliminated or the tax allows "free depreciation" and isbased on cash flow rather than on profits.
• Tax loopholes, special tax preferences, or tax incentives—for they af-fect relative taxes and prices. (Although some of these may be de-fended on the grounds that they accommodate market failures, anexpenditure subsidy rather than a tax expenditure is the proper vehi-cle for meeting this objective.)
• A wealth tax—for in the final analysis this is only an additional tax onsavings and capital accumulation.
20Savings will be taxed over the lifetime of a consumer and, if transferred to the next gener-ation, by taxes on inheritances. The case in favor of consumption tax is presented in Fisherand Fisher (1942), Kaldor (1955), Meade (1978), United States, Department of the Treasury(1977), Lodin (1978), and Sumner (1983). For the case against consumption tax, see Pech-man (1980) and Musgrave (1983, pp. 23-24).
21Cf., Musgrave (1978).
©International Monetary Fund. Not for Redistribution
TAX STRUCTURE FOR EFFICIENCY 235
• Gifts and transfer taxes—for a tax on accrued incomes would theoret-ically cover all receipts from gifts and transfers.
• A general sales tax—for this tends to affect consumer choices, espe-cially as all goods and services with very different elasticities of de-mand and supply tend to be taxed relatively uniformly.
• A payroll tax—for it is an arbitrary additional tax on wage incomes.• A separate capital gains tax—for capital gains are theoretically in-
cluded in accrued income.In the specific circumstances of developing countries, an efficiency-
based tax system would require, in addition, the elimination of both exportduties (unless they are seen as taxes on windfalls only, not affecting incen-tives, as shown in Chapter 11) and import duties (unless they are seen asprotecting domestic industry only temporarily during which the external-ities resulting therefrom can be internalized).
There will also be no case for other narrowly based taxes, such as anurban property tax or a rural land tax, which affect relative sectoral prices.
How Realistic Is Such a Tax System?
How realistic is it to institute in developing countries a tax system solelyfor efficiency objective, as described above?
First, the normative theorizing implicit in the strictly efficiency-orientedtax structure is based on certain assumptions that may not be valid in thespecial circumstances of developing countries. As mentioned earlier, it as-sumes that government is not, and in fact should not, be a major producerin its own right, beyond being a supplier of a few essential public goods.22
Moreover, it assumes that all private individuals are rational and optimiz-ing agents responding to price signals alone (where the market prices re-flect true social costs) and that there are no social and institutional deter-minants of, and constraints on, either market prices or their behavior(which can be removed by government actions).23 Other assumptions arethat there is perfect mobility of factors of production and that income dis-tribution is reasonably appropriate without redistributive taxation and ex-penditure policies of the government.
Second, an efficiency-oriented tax system (especially one that consists oftaxes on basic necessities while luxuries could be exempt) will be politicallyunacceptable.
22See Shome (Chapter 12) for the potential role of governments in the process of develop-ment.
23See Ebrill (Chapter 3) for nonprice determinants of the behavior of economic agents.
©International Monetary Fund. Not for Redistribution
236 VED P. GANDHI
Third, there is little resemblance between the efficient tax bases consis-tent with supply-side considerations and the existing tax systems of devel-oping countries, which would suggest the introduction of a completely newtax system. But experience shows that the barriers to changing existing taxsystems even modestly tend to be fundamental because of the view that oldtaxes are good taxes. Moreover, major tax changes profoundly affect capi-tal values and imply sizable income and wealth redistribution (capital-based taxes may already have been capitalized and reflected in assetprices). Therefore, in a real sense, fundamental tax reform to institute acompletely new tax system, however desirable that may be from the effi-ciency point of view, may well be just about impossible in reality.24
Finally, the efficiency-dictated tax system, described above, may notprovide enough revenue to run a modern government, especially if a tax onpotential income is found to be administratively infeasible.
To conclude: the ingredients of a tax system for efficiency or supply-sideobjectives are well known, as are the limitations of adopting such a systemin the real world. Therefore, in making their recommendations, tax re-formers of developing countries not only must take all these factors intoaccount, they must also be aware that attempts at moving existing tax sys-tems in the direction of meeting efficiency and supply-side objectives arelikely to be gradual at best.
III. Rate Design for Supply-Side Economicsor Optimal Tax Rates
If efficiency in resource allocation is the only aim of taxation, then, asTable 1 shows, there will be a variety of tax rates for the taxed commoditiesand for individuals. The tax system will not be progressive with respect toindividual economic capacities, however measured, and even the tax onaccrued incomes would tend to be proportional (flat rate) or perhaps re-gressive.25 In addition, few judgments, if any, can be made on the optimallevels of tax rates that will prevail in an efficiency-oriented tax system, forthey will require complete knowledge of empirical estimates of own- andcross-price elasticities of demand and supply for individual commoditiesand factors of production, measures of externalities associated with rele-vant commodities, and so on. As there is little reason to believe that such
24Cf.,Feldstein(1976).25As Pigou (1962, p. x) has concluded, "[If announcement effects are important] the order
of merit among tax formulae [will be] first, poll-taxes; second, regressive income taxes; third,proportionate income taxes; fourth, progressive income taxes."
©International Monetary Fund. Not for Redistribution
TAX STRUCTURE FOR EFFICIENCY 237
crucial parameters can be correctly estimated, there is little hope that opti-mal tax rates can be derived, against which existing tax rates can then bejudged.26
A popular supply-sider will argue, and with some validity, that loweringthe tax rates, in general, and income tax rates, in particular, from theirexisting high levels in itself is desirable.27 According to this view, high andprogressive income tax rates can simply discourage savings and invest-ment, often without achieving their intended effects on income distribu-tion. Lowering income tax rates and reducing their progressivity can, onthe other hand, encourage savings and investment and promote productiveeffort to such an extent as to generate employment and incomes for the lesswell-off and, thereby, actually improve equity in the longer run. It can alsoreduce tax evasion.
The desirability of lowering income tax rates and reducing their progres-sivity deserves, of course, closer examination by tax reformers in all devel-oping countries where marginal tax rates are considered high.28 However,certain special circumstances of developing countries will have to be bornein mind.
First, given the relatively low standards of living of even the middle-income groups, a reduction of income tax rates might well encourage over-all consumption in developing countries more than savings. It might en-courage savings by the rich (even in the short run as anticipated by thepopular supply-siders), but if economic signals implicit in other economicpolicies are not correct, such savings can easily flow into unproductive in-vestments, viz., speculation in and hoarding of commodities, foreign ex-change, land, housing, and other existing capital assets. The efficiencygains from income tax reforms would, thus, very much depend upon theassumptions made about other economic policy instruments.
Second, lowering income tax rates and reducing their progressivity alonemay not be enough to reduce income tax evasion, since in developing coun-tries tax evasion is determined by many factors, the nominal progressivityof tax rates, although important, being only one such factor.29 It remains
26Even econometric estimates of own-price elasticities from past data are only going to bepoint estimates and with standard errors attached to them.
27The theory underlying this view is that, under certain assumptions regarding the shapesof demand and supply curves, the "excess burden" of a tax, which is not a lump-sum tax, isdirectly a function of the rate of tax.
28See Table A9 in the Statistical Appendix on the extent to which high top marginal incometax rates prevail in developing countries.
29A multiplicity of factors, including many nontax factors and factors relating to incometax administration, are said to be responsible for the high levels of income tax evasion foundin developing countries. See Richupan (Chapter 6).
©International Monetary Fund. Not for Redistribution
238 VED P. GANDHI
to be empirically established that an across-the-board reduction in the pro-gressivity and levels of income tax rates would reduce tax evasion and im-prove tax compliance in developing countries to any great degree, at leastin the short run.
Third, in developing countries income inequality is frequently a result ofhighly skewed land and property ownership. Furthermore, in most ofthem, education—which accounts for most of the inequality of humancapital and which is heavily subsidized by the government—yields ex-tremely high private returns. Higher taxation on the earnings from skewedland and property ownership and on human capital can at once reduce theprivate windfalls and economic rents from the ownership of such assets,and this can be politically very appealing.
Finally, the degree of progressivity of the income tax system is frequentlythe result of a political and social consensus, but its interaction with highlevels of inflation can raise the progressivity far beyond its intended level.If inflation rates are excessive, as they often are in many developing coun-tries, it may be desirable to adjust the tax system for inflation before tack-ling the degree of progressivity.
To sum up, there is no theoretical case for progressive income tax ratesin a tax system dictated solely by efficiency considerations, but then thereis very little of practical value that can be said from theory about the ratestructure of a strictly efficient income tax. As modern taxation literaturehas shown, there is no optimal degree of progression. The optimal degreedepends very much upon the form and shape of the social welfare function(comprising equity and efficiency objectives) as well as the form and shapeof individual utility functions (as determined by factors such as ability,taste, relative income position, and so on). Consequently, little can be saideven theoretically about the degree of progressivity which is of immediatepolicy relevance. Empirically, the degree of progressivity in taxation fre-quently reflects the political and social consensus on income redistributionin a given country, and the only circumstance in which it can be justified onefficiency grounds is if it captures scarcity rents or windfall gains.
The inherent conflict between equity and efficiency objectives of taxa-tion has always been well known. Policymakers in developing countries arealso aware of this conflict. To resolve it, they frequently tend to have highnominal tax rates but give liberal tax exemptions and concessions toselected taxpayers and sectors. This is obviously inadvisable as such a pol-icy simply compounds the distortionary effects of taxation. A strategy oftaxation consistent with the spirit of basic supply-side economics (i.e., re-moval of tax-induced distortions) would call for broadening the tax base(to reduce the scope of exemptions, tax concessions, and other deductions)
©International Monetary Fund. Not for Redistribution
TAX STRUCTURE FOR EFFICIENCY 239
while simultaneously lowering income tax rates and applying them uni-formly across income categories.30 Most tax economists would agree withsuch a tax policy prescription of basic supply-side economists. It wouldsimplify the tax system, ensure horizontal equity, and curtail the powers oftax policymakers to erode the tax base in the name of supporting one ormore social and noneconomic objectives. Besides, it would also strengthentax policy as an instrument for stabilization purposes because, with fewertax preferences and concessions, the effectiveness of tax rate cuts (and in-creases) as a component of macroeconomic policy would be enhanced.
IV. A Popular Supply-Side Economist Versusan Optimal Tax Economist
"Thus the policy suggestions of the supply side school are fully compati-ble with the spirit of the huge body of optimal taxation literature," claimsa recent supply-sider.31
This paper may have implied that because supply-side economicsattaches a great deal of importance to the objective of efficiency, there islittle difference between a popular supply-side economist and a modernoptimal tax economist. This is not true. There are at least five majordifferences.
• A popular supply-side economist is inherently an elasticity optimistand favors large reductions in tax rates; in contrast, an optimal taxeconomist assumes little about elasticities in relation to marginalchanges in tax rates and considers them to be entirely empiricalmatters.
• A popular supply-side economist concerns himself little with the eq-uity objective, horizontal or vertical; in contrast, an optimal tax econ-omist fully concerns himself with equity (vertical, if not horizontal)and, in fact, attempts to optimize between the efficiency and equityobjectives of taxation—maximizing a social welfare function by mini-mizing excess burdens of taxation while achieving a socially desirableredistribution of income through taxation.
• A popular supply-side economist accepts some progressivity in nomi-nal tax rates on pragmatic grounds, though, in the extreme, he wouldprefer a flat-rate (or proportional) income tax; in contrast, an optimaltax economist refuses to provide a definitive conclusion on the optimal
30Recent reforms of income taxation in India, Indonesia, and Jamaica reflect this strategy.A report of the Treasury Department has stressed this strategy for the reform of the U.S. taxsystem as well. See United States, Department of the Treasury (1984).
31Raboy(1982, p. 59).
©International Monetary Fund. Not for Redistribution
240 VED P. GANDHI
degree of progressivity, since, according to him, the optimal outcomeis highly sensitive to the specification of the social welfare function(incorporating equity objective) and the individual utility functions(incorporating individual tastes). The most robust findings of optimaltaxation on this subject have been that marginal tax rates should firstincrease and then decrease, with those on the highest income becom-ing zero—in other words, income tax rates should be regressive in theupper-income ranges.32
• A popular supply-side economist takes the existing tax system asgiven, including the dominance of income taxation; in contrast, anoptimal tax economist is fully concerned with the composition of taxstructure and the balance between direct and indirect taxes as well asthe structures of both income and commodity taxes.33
• A popular supply-side economist is perhaps pragmatic enough abouttax reform not to want to design the tax structure de novo or to changethe status quo; in contrast, an optimal tax economist is not pragmaticat all. The design of optimal tax structures requires a great deal moreinformation than has been, or can ever be, collected. In addition, theimplementation of such structures is not even on the horizon, as anoptimal tax economist frequently does not concern himself with ad-ministrative feasibility (i.e., with the potential for tax avoidance andtax evasion) nor with taxpayers' preferences or the compliance costs ofhis proposals about tax designs. For these reasons, the large literatureon optimal taxation, though enriching, has yielded few practical pol-icy conclusions and results commensurate with the intellectual re-sources devoted to it.34
32Some progressivity of income tax might, however, be acceptable to them—provided thatthe rate structure can be made a function of distribution of skills and abilities and there is anegative income tax at the bottom of the income scale—but the degree of progressivity will benowhere near what will be indicated solely by the application of minimum sacrifice principle.
33Cf., Atkinson (1977) and Atkinson and Stiglitz (1980). On the whole, an income tax onall incomes that is approximately linear (a constant marginal tax rate with an exemptionbelow which negative supplements are payable) is considered optimal. A linear income tax onlabor incomes only and without an exemption is simply equivalent to a linear commodity tax(a proportional rate on all goods) and is very much distortionary. On the other hand, nonlin-ear income taxes (proportional rate income tax with an exemption) are considered preferable,given equity and efficiency considerations, over differentiated taxes on goods and services,except where there is an interaction between the supply of labor and the marginal rates ofsubstitution between goods. This conclusion, however, ignores the problems of administra-tion, evasion, horizontal equity, and taxpayer's preferences between taxes.
34One of the major policy-oriented conclusions of optimal taxation literature is that taxeson elastic tax bases should best be avoided or, at best, kept low. It is in this spirit that the caseis made for lower taxation of capital incomes vis-a-vis labor incomes and of married womenvis-a-vis married men.
©International Monetary Fund. Not for Redistribution
TAX STRUCTURE FOR EFFICIENCY 241
The popular supply-side economist has, therefore, little resemblance tothose who belong to the stream of recent theoretical literature on taxation.One common denominator between the two perhaps is that both view theexpenditure side of the budget in an unusual manner. The optimal taxeconomist discusses the problem of optimal taxation on the assumptionthat the government has a fixed revenue requirement for an unspecifiedpurpose that has no bearing on the utility of individuals. The popularsupply-side economist also seems to discuss the problem of taxation on theimplicit, if not explicit, assumption that government should provide fewgoods and services beyond pure public goods. That public expenditurescan positively influence the utility of individuals is not an issue in eitherapproach. This may, however, be an unrealistic assumption in the contextof developing countries where certain public expenditures on social andeconomic infrastructure and its maintenance may be positively productiveand social welfare enhancing.
V. A Tax System Dictated by Popular Supply-Side Economics:Some Implications
Taxation is in practice an instrument with multiple objectives and willcontinue to be so despite what economists profess. The conflict betweenthe objectives of equity and efficiency is fundamental. A tax system basedsolely on efficiency grounds is unrealistic, while that designed solely forequity purposes cannot be justified on allocative grounds. The degree ofprogressivity will, in practice, continue to be dictated by political and so-cial consensus rather than by the optimizing formulas of tax economists.One solid contribution of supply-side economics has been to remind usthat the way out of the conflict between the equity and efficiency objectivesof taxation is not to have high and progressive nominal tax rates and gener-ous tax incentives and preferences, as most developing countries do (theyachieve neither income redistribution nor desired resource reallocation),but to have as wide a tax base as possible, as well as lower nominal taxrates. Tax reforms along these lines will be consistent with supply-sideeconomics as well as with the same or even a greater degree of incomeredistribution.
Whether or not rates of taxes on incomes and profits in developing coun-tries should be lowered significantly all at once or simply be restructured toreduce the degree of progression would depend very much upon the heightof the present tax rates, government revenue from the existing high taxrates, the validity of the elasticity optimism of the popular supply-side ap-proach in the context of developing countries (i.e., whether lowering taxrates will have much effect on production), and the relevance in the partic-ular circumstances of a developing country of the assumptions on which
©International Monetary Fund. Not for Redistribution
242 VED P. GANDHI
supply-side theory is based. Various chapters in this volume (especially inPart II) deal with many of these issues in depth, and this chapter hastouched upon others. However, should a developing country be seriousabout adopting the popular supply-side tax policy and lowering its incometax rates significantly, it must take into account the following fiveconsiderations.
First, the lowering of income tax rates must be accompanied by reformsin the income tax base, viz., the removal of tax preferences and tax conces-sions. The removal of narrowly based foreign trade taxes (e.g., export du-ties) and certain other taxes important to their tax systems (e.g., payrolland other selective taxes) may also be equally, if not more, important onefficiency grounds. High tax rates and narrow and selective tax bases cancreate distortions, encourage unproductive activities, erode the revenuebase, and lower the effective tax rates below the intended nominal taxrates. Tax cuts without reforms in the tax base can introduce more distor-tions of efficiency and equity than they correct, especially if they result ininflationary finance.
Second, tax rate reductions must be permanent or, at least, be perceivedby taxpayers to be so if they are to have significant effect on savings andinvestment behavior. The theory of rational expectations suggests that in-vestors change their behavior according to their expectations of the costs ofcapital, including their expectations of future tax rates over the lifetime ofan investment. The same holds true for the behavior of savers. Besides, taxrate reductions would have to be substantial if they are to have a marked"net" effect on behavior, especially because selective tax exemptions andconcessions, which may have been enjoyed by savers and investors andwhich may have had some positive economic effect on their behavior, maynow be withdrawn from the tax structure.
Third, short-run elasticities frequently tend to be lower than long-runelasticities for a given change in prices; consequently, it would be advisableto expect the full supply-side effects of a reduction of tax rates to becomeevident only in the longer run.
Fourth, reducing tax rates for supply-side effects (including improvingtax compliance and to further other objectives) must go hand-in-hand withgovernment expenditure cuts and reforms of public enterprise pricing, atleast in the short run, or until elasticity optimism materializes. Otherwisethere will be a growing budget deficit and a likely rise in inflation (depend-ing upon the sources of financing) with its own distortions and unintendedeconomic consequences. For example, if people expect inflation to con-tinue, and interest rates do not adjust with inflation, they will spend ratherthan save in the current period, thereby negating the effect of tax cuts onsavings and investment.
©International Monetary Fund. Not for Redistribution
TAX STRUCTURE FOR EFFICIENCY 243
Fifth, the use to which tax revenues are put in developing countries isalso relevant. If a large proportion of government expenditure is directedat financing desirable human capital and social and economic infrastruc-ture in an efficient manner, it removes supply bottlenecks, aids the devel-opment process, and provides the justification for higher tax rates. On theother hand, if government revenues go toward financing a large and un-productive civil service or nonpriority capital expenditure, they supportwasteful consumption rather than capital formation.
In the final analysis, a tax structure for efficiency and supply-side eco-nomics calls for fundamental reforms in the existing tax systems of devel-oping countries. The reforms will have to be directed at reducing the dis-tortionary effects of their existing taxes, which would require removingmost exclusions and exemptions and widening the tax base, while reducingrates of taxation. In the context of the tax structures prevalent in develop-ing countries, this strategy would apply not only to personal income tax(which is often an unimportant source of revenue in low-income countries)but to all other direct and indirect taxes as well.
ANNEX
Relationship Between Tax Ratio and Growth Rate
A study by Keith Marsden is sometimes quoted by popular supply-siders in theUnited States as "evidence" in support of the relevance of supply-side tax policy todeveloping countries.35 This Annex describes and critically appraises the nature ofthis evidence.
Marsden reviewed the experience of growth and taxation in 20 selected countriesduring the 1970s and concluded that those with lower taxes experienced more rapidexpansion of investment, productivity, employment, and government services, andhad better growth rates. The selected countries were grouped into 10 pairs withsimilar per capita incomes but contrasting tax levels, and their growth rates overthe past decade were then compared (see Table 2). Marsden concluded from thisevidence that "In all cases, the countries that imposed a lower effective average taxburden on their populations achieved substantially higher real rates of growth ofgross domestic product (GDP) than did their more highly taxed counterparts."36
He analyzed his data further with the help of regression analyses and obtainedthe following two equations:
35Marsden (1983a). The conclusions of this paper are available in Marsden (1983b and1984).
36Marsden (1983a, p. 2).
©International Monetary Fund. Not for Redistribution
244 V E D P. G A N D H I
g = 11.281 - 0.361t (1)
(6.011) (3.830)
N = 20; R2 = 0.449
g = 5.267 - 0.136t + 0.316/ + 0.221n (2)
(2.183) (1.581) (4.892) (0.438)
N = 20; R2 = 0.779'
where
g = GDP growth rate;t = tax to GDP ratio;i = investment growth rate; and
n = labor force growth rate.His multivariable equation (2) had a higher R2 but revealed a relative insignifi-
cance of the tax variable. He, therefore, tended to rely on his bivariate equation (1)and concluded that "an increase of one percentage point in the tax/GDP ratiodecreases the rate of economic growth by 0.36 percent points."37
There are, at least, four problems with this evidence. First, some of his tax reve-nue data are partial and are susceptible to misleading comparisons. The tax reve-nue data for Japan, for example, have been understated by excluding social secu-rity taxes, while the data for Brazil have been understated by excluding all taxescollected by state and local governments.38 As a result, both Japan and Brazilwould seem to become "low-tax" countries in his sample by design, while for someother "low-tax" countries, for example, Malawi, Korea, Singapore, and Spain, thedata are valid only for late 1960s and early 1970s but not necessarily for the late1970s or for more recent years.39 Second, his data are on total tax to GDP ratio("effective average tax burden" on populations, as he puts it) and not on marginalincome tax rates, which is the primary focus of popular supply-siders, or even theburden of direct taxes. Third, his sample of 20 countries is not randomly chosen,which is an essential requirement for drawing general and unbiased conclusions.Furthermore, the pairing of the low-tax and high-tax countries is obviously quitearbitrary and bears no relationship whatsoever to the structures of their economiesor the other variables that could possibly influence their growth rates. To show howthe arbitrary pairing of countries might have influenced his conclusions, Table 3
37Marsden (1983a, p. 8).38During the 1970s, tax revenues of state and local governments in Brazil accounted for
about 8 percent of GDP. See International Monetary Fund (1985, p. 81).39The tax to GDP ratio in these countries for more recent years are as follows (see Interna-
tional Monetary Fund (1985, pp. 80-81)):Malawi (1980) 18.14Korea (1978) 17.27Singapore (1983) 19.81Spain (1983) 27.33
©International Monetary Fund. Not for Redistribution
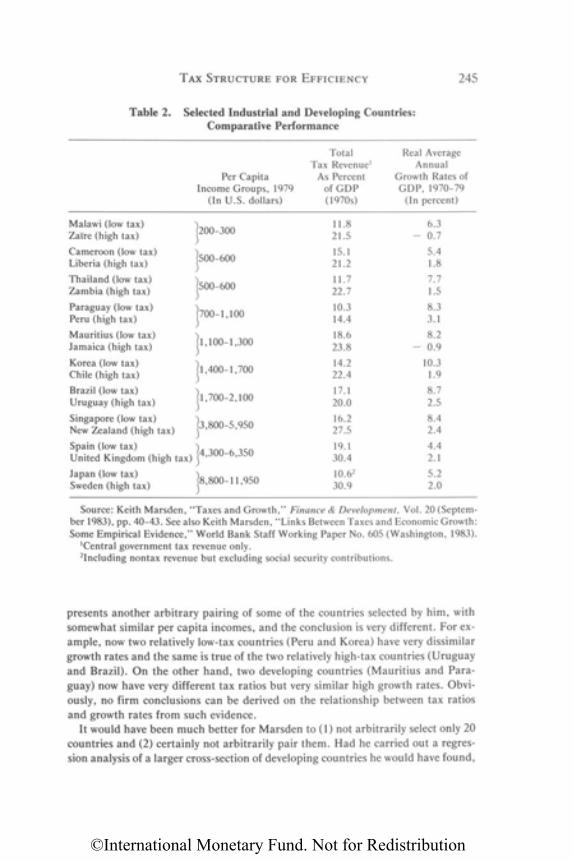
TAX STRUCTURE FOR EFFICIENCY 245
Table 2. Selected Industrial and Developing Countries:Comparative Performance
Source: Keith Marsden, "Taxes and Growth," Finance & Development, Vol. 20 (Septem-ber 1983), pp. 40-43. See also Keith Marsden, "Links Between Taxes and Economic Growth:Some Empirical Evidence," World Bank Staff Working Paper No. 605 (Washington, 1983).
1Central government tax revenue only.2Including nontax revenue but excluding social security contributions.
presents another arbitrary pairing of some of the countries selected by him, withsomewhat similar per capita incomes, and the conclusion is very different. For ex-ample, now two relatively low-tax countries (Peru and Korea) have very dissimilargrowth rates and the same is true of the two relatively high-tax countries (Uruguayand Brazil). On the other hand, two developing countries (Mauritius and Para-guay) now have very different tax ratios but very similar high growth rates. Obvi-ously, no firm conclusions can be derived on the relationship between tax ratiosand growth rates from such evidence.
It would have been much better for Marsden to (1) not arbitrarily select only 20countries and (2) certainly not arbitrarily pair them. Had he carried out a regres-sion analysis of a larger cross-section of developing countries he would have found,
Malawi (low tax)Zaire (high tax)
Cameroon (low tax)Liberia (high tax)
Thailand (low tax)Zambia (high tax)
Paraguay (low tax)Peru (high tax)
Mauritius (low tax)Jamaica (high tax)
Korea (low tax)Chile (high tax)
Brazil (low tax)Uruguay (high tax)
Singapore (low tax)New Zealand (high tax)
Spain (low tax)United Kingdom (high tax
Japan (low tax)Sweden (high tax)
Per CapitaIncome Groups, 1979
(In U.S. dollars)
1200-300
1500-600
1500-600
700-1,100
l,100-1,300
l,400-l,700
l,700-2,100
3,800-5,950
4,300-6,350
18,800-11,950
TotalTax Revenue1
As Percentof GDP(1970s)
11.821.5
15.121.2
11.722.7
10.314.4
18.623.8
14.222.4
17.120.0
16.227.5
19.130.4
10.62
30.9
Real AverageAnnual
Growth Rates ofGDP, 1970-79
(In percent)
6.3- 0.7
5.41.8
7.71.5
8.33.1
8.2- 0.9
10.31.9
8.72.5
8.42.4
4.42.1
5.22.0
©International Monetary Fund. Not for Redistribution
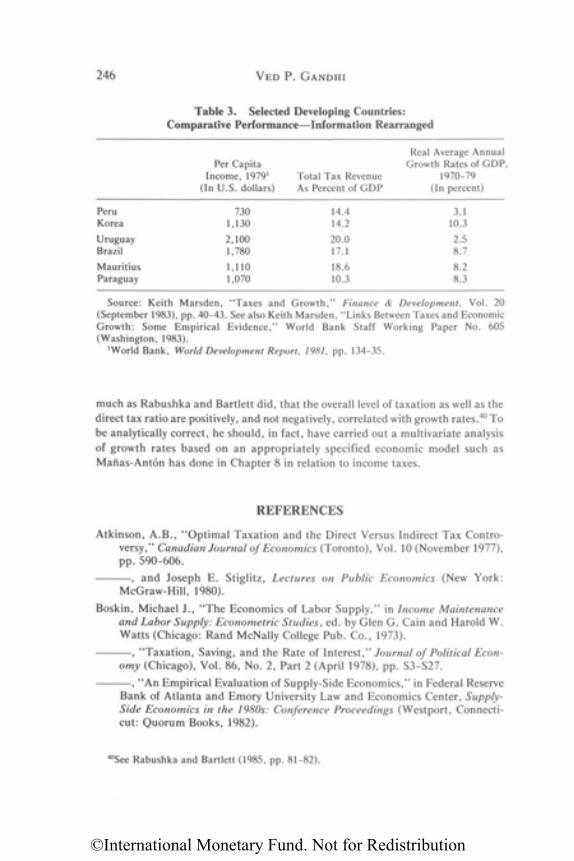
PeruKorea
UruguayBrazil
MauritiusParaguay
Per CapitaIncome, 19791
(In U.S. dollars)
7301,130
2,1001,780
1,1101,070
Total Tax RevenueAs Percent of GDP
14.414.2
20.017.1
18.610.3
Real Average AnnualGrowth Rates of GDP,
1970-79(In percent)
3.110.3
2.58.7
8.28.3
much as Rabushka and Bartlett did, that the overall level of taxation as well as thedirect tax ratio are positively, and not negatively, correlated with growth rates.40 Tobe analytically correct, he should, in fact, have carried out a multivariate analysisof growth rates based on an appropriately specified economic model such asManas-Anton has done in Chapter 8 in relation to income taxes.
REFERENCES
Atkinson, A.B., "Optimal Taxation and the Direct Versus Indirect Tax Contro-versy," Canadian Journal of Economics (Toronto), Vol. 10 (November 1977),pp. 590-606.
, and Joseph E. Stiglitz, Lectures on Public Economics (New York:McGraw-Hill, 1980).
Boskin, Michael J., "The Economics of Labor Supply," in Income Maintenanceand Labor Supply: Econometric Studies, ed. by Glen G. Cain and Harold W.Watts (Chicago: Rand McNally College Pub. Co., 1973).
, "Taxation, Saving, and the Rate of Interest," Journal of Political Econ-omy (Chicago), Vol. 86, No. 2, Part 2 (April 1978), pp. S3-S27.
, "An Empirical Evaluation of Supply-Side Economics," in Federal ReserveBank of Atlanta and Emory University Law and Economics Center, Supply-Side Economics in the 1980s: Conference Proceedings (Westport, Connecti-cut: Quorum Books, 1982).
40See Rabushka and Bartlett (1985, pp. 81-82).
Source: Keith Marsden, "Taxes and Growth," Finance & Development, Vol. 20(September 1983), pp. 40-43. See also Keith Marsden, "Links Between Taxes and EconomicGrowth: Some Empirical Evidence," World Bank Staff Working Paper No. 605(Washington, 1983).
1World Bank, World Development Report, 1981, pp. 134-35.
246 VED P. GANDHI
Table 3. Selected Developing Countries:Comparative Performance—Information Rearranged
©International Monetary Fund. Not for Redistribution
TAX STRUCTURE FOR EFFICIENCY 247
Canto, Victor A., Douglas H. Joines, and Arthur B. Laffer, Foundations ofSupply-Side Economics: Theory and Evidence (New York: Academic Press,1983).
Dasgupta, Partha, and Joseph E. Stiglitz, "On Optimal Taxation and Public Pro-duction," Review of Economic Studies (Edinburgh), Vol. 39 (January 1972),pp. 87-103.
Evans, Michael K., "An Econometric Model Incorporating the Supply-SideEffects of Economic Policy," in The Supply-Side Effects of Economic Policy,ed. by Laurence H. Meyer (Boston, Massachusetts: Kluwer-Nijhoff, 1981).
, "New Developments in Econometric Modeling: Supply-Side Economics,"in Supply-Side Economics: A Critical Appraisal, ed. by Richard H. Fink(Frederick, Maryland: University Publications of America, 1982).
Evans, Paul, "What Does a Tax Cut Do?" in Foundations of Supply-Side Eco-nomics: Theory and Evidence, by Victor A. Canto, Douglas H. Joines, andArthur B. Laffer (New York: Academic Press, 1983).
Federal Reserve Bank of Atlanta and Emory University Law and Economics Cen-ter, Supply-Side Economics in the 1980s: Conference Proceedings (Westport,Connecticut: Quorum Books, 1982).
Feldstein, Martin, "On the Theory of Tax Reform," Journal of Public Economics(Amsterdam), Vol. 6 (July-August 1976), pp. 77-104.
Fink, Richard H., ed., Supply-Side Economics: A Critical Appraisal (Frederick,Maryland: University Publications of America, 1982).
Fisher, Irving, and Herbert W. Fisher, Constructive Income Taxation: A Proposalfor Reform (New York: Harper, 1942).
Goode, Richard B., The Individual Income Tax (Washington: Brookings Institu-tion, rev. ed., 1976).
Hausman, Jerry A. (1981a), "The Effects of Taxes on Labor Supply," in HowTaxes Affect Economic Behavior, ed. by Henry J. Aaron and Joseph A.Pechman (Washington: Brookings Institution, 1981).
(1981b), "Income and Payroll Tax Policy and Labor Supply," in The Sup-ply-Side Effects of Economic Policy, ed. by Laurence H. Meyer (Boston, Mas-sachusetts: Kluwer-Nijhoff, 1981).
Houghton, R.W., ed., Public Finance: Selected Readings (Baltimore: PenguinBooks, 1970).
Howrey, E. Philip, and Saul H. Hymans, "The Measurement and Determinationof Loanable-Funds Saving," in What Should Be Taxed: Income or Expendi-ture? ed. by Joseph A. Pechman (Washington: Brookings Institution, 1980).
International Monetary Fund, Government Finance Statistics Yearbook, 1985,Vol. 9 (Washington, 1985).
Kaldor, Nicholas, An Expenditure Tax (London: Allen & Unwin, 1955).Kay, J.A., and M.A. King, The British Tax System (Oxford: Oxford University
Press, 1980).
Keleher, Robert E., "Evidence Relating to Supply-Side Tax Policy," in Supply-Side Economics: A Critical Appraisal, ed. by Richard H. Fink (Frederick,Maryland: University Publications of America, 1982).
©International Monetary Fund. Not for Redistribution
248 V E D P. G A N D H I
, and William P. Orzechowski, "Supply-Side Fiscal Policy: An HistoricalAnalysis of a Rejuvenated Idea," in Supply-Side Economics: A Critical Ap-praisal ed. by Richard H. Fink (Frederick, Maryland: University Publica-tions of America, 1982).
Kemp, Jack, "The Classical Economic Case for Cutting Marginal Income TaxRates," in Supply-Side Economics, Hearing Before the Task Force on TaxPolicy of the Committee on the Budget, House of Representatives, 97th Con-gress, 1st Session, March 10, 1981 (Washington: Government Printing Office,1981).
King, M.A., "Savings and Taxation," in Public Policy and the Tax System, ed. byGordon A. Hughes and Geoffrey M. Heal (London: Allen & Unwin, 1980).
Lodin, Sven-Olof, Progressive Expenditure Tax—An Alternative?, A Report of the1972 Government Commission on Taxation (Stockholm: LiberForlag, 1978).
Marsden, Keith (1983a), "Links Between Taxes and Economic Growth: Some Em-pirical Evidence," World Bank Staff Working Paper No. 605 (Washington,1983).
(1983b), "Taxes and Growth," Finance & Development (Washington),Vol. 20 (September 1983), pp. 40-43.
(1984), "Low Taxes Signal a Healthy Economy," Wall Street Journal (De-cember 18, 1984), p. 34.
Marshall, Alfred, Principles of Economics: An Introductory Volume (London:Macmillan, 9th ed., 1948).
Meade, J.E., The Structure and Reform of Direct Taxation (London: Allen & Un-win, 1978).
Meyer, Laurence H., ed., The Supply-Side Effects of Economic Policy (Boston,Massachusetts: Kluwer-Nijhoff, 1981).
Millward, Robert, and others, Public Sector Economics (New York: Longman,1983).
Mirrlees, J.A., "On Producer Taxation," Review of Economic Studies (Edin-burgh), Vol. 39 (January 1972), pp. 105-11.
Mueller, Dennis C., Public Choice (New York: Cambridge University Press, 1979).
Munk, Knud Jorgen, "Optimal Taxation and Pure Profit," Scandinavian Journalof Economics (Stockholm), Vol. 80, No. 1 (1978), pp. 1-19.
Musgrave, Richard A., The Theory of Public Finance: A Study in Public Economy(New York: McGraw-Hill, 1959).
, The Future of Fiscal Policy: A Reassessment (Leuven, Belgium: LeuvenUniversity Press, 1978).
, "The Nature of Horizontal Equity and the Principle of Broad-Based Taxa-tion: A Friendly Critique," in Taxation Issues of the 1980s, ed. by John G.Head (Sydney: Australian Tax Research Foundation, 1983).
Pechman, Joseph A., ed., What Should Be Taxed: Income or Expenditure?(Washington: Brookings Institution, 1980).
Pigou, A.C., A Study in Public Finance (London: Macmillan, 1947, 3rd rev. ed.,1962).
Raboy, David G., ed., Essays in Supply Side Economics (Washington: Institute forResearch on the Economics of Taxation, 1982).
©International Monetary Fund. Not for Redistribution
TAX STRUCTURE FOR EFFICIENCY 249
Rabushka, Alvin, and Bruce Bartlett, Tax Policy and Economic Growth in Devel-oping Nations (Washington: PPC/EA, U.S. Agency for International Devel-opment, 1985, mimeographed).
Rawls, John, A Theory of Justice (Cambridge, Massachusetts: Harvard UniversityPress, 1971).
Rosen, Harvey S., "What Is Labor Supply and Do Taxes Affect It?" AmericanEconomic Review, Papers and Proceedings of the Ninety-Second AnnualMeeting of the American Economic Association (Nashville, Tennessee),Vol. 70 (May 1980), pp. 171-76.
Samuelson, P.A., "Pure Theory of Public Expenditure and Taxation," in PublicEconomics: An Analysis of Public Production and Consumption and TheirRelation to the Private Sectors, ed. by J. Margolis and H. Guitton (New York:St. Martin's Press, 1969).
Sandmo, Agnar, "Optimal Taxation—An Introduction to the Literature, "Journalof Public Economics (Amsterdam), Vol. 6 (July-August 1976), pp. 37-54.
Simons, Henry C., Personal Income Taxation: The Definition of Income as a Prob-lem of Fiscal Policy (Chicago: University of Chicago Press, 1938).
, Federal Tax Reform (Chicago: University of Chicago Press, 1950).
Smith, Adam, An Inquiry into the Nature and Causes of the Wealth of Nations,ed. by Edwin Cannan (London: Methuen and Co., 6th ed., 1950).
Stern, Nicholas H., "Optimum Taxation and Tax Policy," Staff Papers, Interna-tional Monetary Fund (Washington), Vol. 31 (June 1984), pp. 339-78.
Summers, Lawrence H., "Capital Taxation and Accumulation in a Life CycleGrowth Model," American Economic Review (Nashville, Tennessee), Vol. 71(September 1981), pp. 533-44.
Sumner, Michael T., "The Incentive Effects of Taxation," in Robert Millward andothers, Public Sector Economics (New York: Longman, 1983).
Tanzi, Vito, "Potential Income as a Tax Base in Theory and in Practice" (unpub-lished, International Monetary Fund, December 31, 1980).
Tresch, Richard W., Public Finance: A Normative Theory (Piano, Texas: BusinessPublications, 1981).
Ture, Norman B., "Supply Side Analysis and Public Policy," in Essays in SupplySide Economics, ed. by David G. Raboy (Washington: Institute for Researchon the Economics of Taxation, 1982).
United States, Department of the Treasury, Blueprints for Basic Tax Reform(Washington: Government Printing Office, 1977).
, Tax Reform for Fairness, Simplicity, and Economic Growth: The Trea-sury Department Report to the President, Vols. I-III (Washington: Office ofthe Secretary, Department of the Treasury, November 1984).
Vickrey, William, "Counterspeculation, Auctions, and Competitive Sealed Ten-ders," Journal of Finance (New York), Vol. 16 (March 1961), pp. 8-37.
Walker, D., "Direct v. Indirect Taxes," in Public Finance: Selected Readings, ed.by R.W. Houghton (Baltimore: Penguin Books, 1970).
World Bank, World Development Report, 1981 (New York: Oxford UniversityPress, 1981).
©International Monetary Fund. Not for Redistribution
10Rationality of Income Tax Incentives in
Developing Countries
A Supply-Side Look
Fernando Sánchez- Ugarte
This chapter examines tax incentives from the supply-side point of viewand analyzes whether selective tax incentives can be used by developingcountries to achieve the supply-side objectives of economic efficiency andgrowth while maintaining equity.1 The chapter shows that the role of taxincentives in reconciling equity and efficiency is very limited. Even thoughtax incentives can be designed to produce economic efficiency gains, theyshould not be used as substitutes for an efficient tax system to satisfy sup-ply-side objectives. Tax incentives have a limited role to play in tax policy.First, they entail loss of government revenue. Second, efficient tax incen-tives are cumbersome to design—they are by nature selective and can ofteninduce other economic distortions. Third, their effectiveness can seldombe guaranteed. In principle, they should be given to those economic agentswho need them to perform the desired action. However, this is a difficulttask that often leads to unwarranted economic rents to the lucky beneficia-ries. Finally, tax incentives can readily fall prey to special interest groupsso that the original economic motivation of the policy is easily supersededby other less objective motives.
In this paper, a tax incentive is defined as a reduction in either the taxrate, the tax base, or the tax liability, which is granted if a specified actionis taken by the selected beneficiary. The beneficiary of the tax incentive is ataxpayer who is selected on the basis of certain qualifications. Typicalqualifications are the type of organization (incorporated or unincorpo-
1See Gandhi (Chapter 1) for a detailed discussion of supply-side tax policy.
250
©International Monetary Fund. Not for Redistribution
RATIONALITY OF INCOME TAX INCENTIVES 251
rated, business or individual); the origin of the taxpayer (national or for-eign); the activity performed; and the age of the beneficiary (newcomer orestablished). The change in behavior sought through tax incentives maybe, for instance, real (as distinct from financial) investment, production ofgoods for export, employment of labor, increase in the level of output, andso on.
The tax incentive reduces the base, the rate, or the overall tax liability ofa given tax. For instance, a tax incentive to investment can be grantedthrough the corporate income tax in the form of a tax holiday, which is areduction in the tax rate; in the form of accelerated depreciation or imme-diate write-off of investment expenditure, which is a reduction in the taxbase; or in the form of an investment tax credit, which is a reduction of thetax bill. Each form of tax incentive is different in the way it affects eco-nomic efficiency and in the extent to which it induces the desired behavior.Efficiency will be understood throughout the paper in the Pareto sense—that is, an increase in economic efficiency is attained when an individual'swell-being can be increased without having to reduce that of any otherindividual.
This paper deals with tax incentives as they are applied in developingcountries. It does not attempt to describe all tax incentives used by thesecountries. Rather, it singles out tax incentives for the promotion of invest-ment, regional development, export promotion, and employment to illus-trate the problems that most commonly plague tax incentives.
Section I discusses the economic efficiency criteria for tax incentives.The paper distinguishes between the "pure" and the "impure" case for taxincentives. The pure case arises from the need to counteract externalitiesthat break the equality between marginal social benefits and costs. Theimpure case arises either from the practical impossibility of reaching anoptimal tax structure or from the existence of one or more resource-distort-ing economic intervention schemes. In both cases, the use of tax incentivescan be economically efficient. However, it is argued that it would be farsuperior to resort to tax reform or the removal of an economic interventionscheme in order to eliminate the source of the distortions than to providetax incentives to compensate for such distortions.
Section II broadly examines the design of tax incentives in an attempt toidentify the limitations of tax incentive policy as a means of pursuing vari-ous and often competing objectives with access to scarce tax revenue.
Section III analyzes the economic distortions induced by specific tax in-centives and concludes that even though it is possible to design relativelymore neutral tax incentives, this is a complicated task that limits consider-ably the applicability of tax incentive policy.
©International Monetary Fund. Not for Redistribution
252 FERNANDO SANCHEZ-UGARTE
Section IV considers the effectiveness of tax incentives. An effective taxincentive is defined as one that maximizes the probability that the desiredbehavior is attained. This section suggests that most tax incentive schemesare ineffective. Very often they are cluttered with design flaws that convertthem into mere rent-generating transactions.
Finally, Section V presents conclusions and policy recommendationsand comments on the "appropriateness" of adopting a policy of selectivetax rate reductions via tax incentives—a widely prevalent policy in develop-ing countries—as opposed to effecting general tax rate reductions whilebroadening the tax base, as recommended by supply-siders.
I. The Economic Rationality for Tax Incentives
A pure case or "first best" for tax incentives (or subsidies) exists when-ever external economies are present, that is, when, under a free marketarrangement, the marginal social benefit of an activity exceeds the mar-ginal social cost of undertaking that activity. The failure of the "invisiblehand" to reach the maximization of social welfare calls for the Pigovianprescription of subsidizing such activities so that the marginal private costequals the marginal social benefit.2 A Pigovian tax incentive removes adistortion from the economy and is therefore by nature welfare-improving.As to how to finance the first-best subsidies, the solution lies in a nondis-torting tax system for which the financing could come from either polltaxes, which do not distort, or Pigovian taxes, which remove negativeexternalities.
An impure case for tax incentives arises when economic policy in generalor tax policy in particular is distortionary.3 For political, social, or admin-istrative considerations, economic policymakers often implement a tax sys-tem that is nonneutral and adopt other economic policies that lead to dis-tortions. Ideally, the distortions should be removed by way of tax reform orreform in other economic policies, but this may not always be feasible.
However, through economic policy (e.g., tax incentives), it is possible toinduce behavior that can be at the margin welfare-improving. The litera-ture on social cost-benefit analysis, aware of this possibility, has developedcriteria and methods that assess whether the undertaking of an activity or aproject leads to improvement in social welfare by reducing unwanted dis-
2See Bator (1958) for the cases where free market failure is likely to arise.3An optimal tax system would be devoid of tax incentives; by design the tax rates that apply
are optimal in the sense that no other tax structure can increase economic welfare, given thegovernment's budget constraint and the set of taxes that are considered feasible.
©International Monetary Fund. Not for Redistribution
RATIONALITY OF INCOME TAX INCENTIVES 253
tortions and negative externalities and/or by inducing positive external-ities.4 In this author's opinion, this methodology can also be put to use inthe design of tax incentive (or subsidy) policy.
The Pure Case for Tax Incentives
In a free market situation, economic agents do not always behave in amanner that leads to equality between private and social costs and bene-fits. Intervention is called for when the externalities cannot be internalizedby private agents.5 In the case of a positive externality, the interventionwould consist of a subsidy (or tax incentive) to the activity. Examples of taxincentives based on such an argument follow.
Regional Distribution of Economic Activity
It can be argued that the promotion of regional development is justifiedon economic grounds, given that there are external economies of relocationto less developed regions and external diseconomies of concentration inalready developed ones. Private agents acting on market signals will nottake advantage of the external economies, resulting in an overconcentra-tion of activities in certain areas. Tax incentives that reduce the cost ofrelocating to undeveloped regions, where positive externalities are gener-ated, could increase welfare. (See also section on "Tax Incentives toRegional Development," below.)
The role of tax incentives in reaching this goal is complementary to therole of other instruments of regional economic policy, such as public in-vestment, credit, and financial policy, which are often partly responsiblefor the overconcentration in major metropolitan areas of developingcountries.
Risk-Taking and Savings
Arrow and Lind (1970) have shown that, owing to imperfections in thecapital market, private agents do not often encounter the institutionalsetup that will encourage them to diversify risk to a "socially optimal"level. Under such conditions, a positive externality can be derived frominducing risk-taking by private agents. Thus, tax incentives to promoteprivate investment in risky projects with substantial social benefits could
4The literature is vast. See, for example, Layard (1972), Harberger (1974), Little andMirrlees (1974), and Boadway (1979).
5See, however, Coase (1960) who shows that under certain conditions external effects canbe internalized by contractual arrangements reached among the affected parties.
©International Monetary Fund. Not for Redistribution
254 FERNANDO SANCHEZ-UGARTE
lead to an improvement in economic well-being. However, it would be bet-ter to attain optimal diversification of risk by reducing imperfections in thecapital markets.
Another argument, advanced by Sen (1967), is that the economies fre-quently tend to save below the level that is "socially optimal." Lack of con-sideration for the welfare of future generations leads to an overconsump-tion in the present and, in turn, to the formation of a lower-than-optimalstock of capital for the future. This external effect calls for tax incentives toprivate savings.
Short-Run Output Disturbances
Along the business cycle troughs, output and the level of employmentare below the steady-state values. It can be argued that it is socially desir-able to move the economy back to its steady-state equilibrium path. Eco-nomic policy, in general, can be used to attain such a goal. The new litera-ture on the business cycle (Lucas (1981)) has stressed the relevance toeconomic behavior of economic agents' expectations about policy changes.Accordingly, an unexpected policy change will not affect economic behav-ior, and a policy change that is expected to be transitory will have verydifferent effects from one that is seen to be permanent.6 The policy pre-scription emerging from this literature is that rules are better than discre-tion, first, because a rule will be incorporated into the behavior of eco-nomic agents, and, second, because the effect of a rule can be objectivelypredicted.
Research and Development
Externalities are also present in basic research, which is pursued for theaccumulation and advancement of general knowledge. It can be arguedthat since the benefits of basic research cannot be appropriated by the re-searcher, such research will be conducted at a suboptimal level.7
Applied research, on the other hand, is generally more easily market-able since the patent system allows the inventor to receive most of the di-
6Lucas (1981) compares the effects of alternative rules for granting tax incentives to invest-ment; one is a tax incentive given permanently, the other a tax incentive given for a period offive years, disappearing afterward. He shows that, under certain assumptions about the inter-est rate and the rate of depreciation, the effect of the transitory tax incentive is 4.5 times aslarge as that of the permanent incentive.
7See Johnson (1975) for a review of the issues regarding optimal allocation of resources inresearch and development.
©International Monetary Fund. Not for Redistribution
RATIONALITY OF INCOME TAX INCENTIVES 255
rect rewards of the invention. It is difficult, in practice, to make a clear-cutdistinction between applied and basic research, and as a result the patentsystem does not cover all situations. A case could therefore be made for thepromotion of basic research by the private sector through the use of taxincentives.
To sum up, the pure case for tax incentives exists whenever there areexternalities in the economy and the decisions of the economic agents areless than socially optimal. However, as the above examples show, tax in-centives can play only a complementary role to the many other conditionsnecessary for the activity to thrive, for example, infrastructure, a condu-cive environment, know-how, and entrepreneurial capacity.
The Impure Case for Tax Incentives
Governments often pursue economic policies that introduce distortionsinto the economic system, for example, in the areas of trade policy, taxpolicy, and wage policy.
The theory of the "second best" attempts to minimize the welfare costimplied by government intervention.8 However, government policy veryrarely follows second-best prescriptions. Therefore, it can be argued that atax incentive, if properly designed, can increase economic well-being.
As will be shown below, tax incentives should not be the first choice ofthe policymaker; it will always be better to move to the second best throughappropriate reforms in economic policy. Examples of how tax incentivescan reduce distortions in the areas of trade policy, tax policy, and wagepolicy follow.
Economic Distortions Related to International Trade
Most countries protect domestic activities by restricting imports of se-lected commodities for a variety of reasons, including protection of infantindustry, encouragement of self-sufficiency, and diversity in production.Johnson (1960) developed the "scientific tariff approach, which allowstrade policy to reach any desired "noneconomic" objective with the mini-mum of economic distortions. Most countries, however, do not follow thescientific tariff approach to determine the level and structure of trade re-strictions. Hence, it is possible to reduce some of these distortions and in-crease economic well-being through the appropriate use of tax incentives,as the examples below illustrate.
Restrictions on international trade through tariffs, quotas, and overval-
8See Stern (1984) for a discussion of optimum taxation policy.
©International Monetary Fund. Not for Redistribution
256 FERNANDO SANCHEZ-UGARTE
ued exchange rates reduce the supply of exports by reducing the relativeprice of exports charged by exporters. This, in turn, means that the socialvalue of foreign exchange generated by any activity is higher than the mar-ket value. The literature on social accounting prices provides differentmethods by which the social opportunity cost of foreign exchange may beestimated.9 Once this value has been calculated, economic efficiency rec-ommends that private agents follow social rather than private prices,which result from the appropriate combination of taxes and subsidies. If,for instance, exports were promoted through tax incentives, there could bean improvement in social welfare. It is important to take into account thereaction of trading partners to the export subsidy. The rules established bythe General Agreement on Tariffs and Trade (GATT) allow developingcountries to give subsidies temporarily to exports when such subsidies donot cause serious injury to other signatory countries and allow for thedrawback of domestic indirect taxes incorporated on the value of exports(Goode (1984)).
Protection in developing countries usually results in very different ratesof effective protection across industries (Balassa and associates (1971)).Typically, import tariffs are highest for luxury consumption items andlower for intermediate goods and basic commodities, thereby resulting inhigher effective protection for luxury consumption goods and lower protec-tion for necessities, intermediate goods, and capital equipment. The use oftax incentives for the promotion of, for example, the capital goods industrycould under certain circumstances be welfare-improving. It can be shownthat if the promoted activity brings a reallocation of resources that in-creases income measured at international prices, economic welfare will in-crease 10—for example, where the promoted activity allows the substitutionof imports at a social cost below the world price of imports. However,adopting a tariff structure that minimizes the efficiency cost of a givenlevel of protection (scientific tariff) would be preferable to granting taxincentives.
9The two approaches most widely advocated are the weighted average approach (Harberger(1972) and Boadway (1979)) and the international price approach (Little and Mirrlees(1974)). Under the first approach, all exports and imports are valued at the social accountingprice of foreign exchange, which is derived using a weighted average of import tariffs andexport taxes. Under the second approach, all tradables are valued at the international price.The two approaches are not contradictory, and the choice should be made on practicalgrounds.
10See Sanchez-Ugarte (1983, Chapter IV), where this argument is developed further.
©International Monetary Fund. Not for Redistribution
RATIONALITY OF INCOME TAX INCENTIVES 257
Economic Distortions on the Savings-Investment DecisionIntroduced by the Tax System
Savings-investment decisions caused by nonoptimal tax systems presentinherent distortions. Three distortions in particular frequently occur.
A first distortion arises from the corporation and personal income taxes,which create a difference between the social opportunity cost of capital andthe social rate of time preference, both of which would be equal in a perfectcapital market and under conditions of no taxation (Marglin (1963), Feld-stein (1964), Sen (1967), and Harberger (1976)). Since the return on sav-ings is taxed by the personal income tax, usually at a progressive rate, tax-ation creates a wedge between the rate of time preference and the rate ofreturn on savings. On the other hand, the classical corporate income taxcreates a difference between the marginal product of capital (opportunitycost of capital) and the net rate of return on savings.11 This double distor-tion leads to less capital accumulation and less savings than would result inthe absence of taxation.
A second distortion arises from the classical corporate income tax,which favors debt financing over equity financing and reinvestment ofprofits over distribution of earnings.12 This leads to a nonoptimal financ-ing structure. Because equity financing is taxed more heavily, the debt-equity ratio of firms is probably too large. This distortion could also lead tothe underdevelopment of certain financial markets such as the stock mar-ket. The inducement to reinvest, implicit in the corporate income tax,probably favors large over small firms and old over new ones. Tax incen-tives can be used to reduce these distortions.
A third distortion arises from the persistence of inflation and its interac-tion with the income tax. This tax usually permits the deduction of nomi-nal interest and the depreciation of assets at original cost, creating a disin-centive for investment in shorter-lived assets and an incentive for theexcessive use of debt financing (Auerbach (1979)). Here again, a case canbe made in favor of using tax incentives to counteract, at least partially,some of these effects.
In all these instances, however, tax reform or correcting the cause of thedistortions would be superior to tax incentives for offsetting the effects ofthe distortions. For example, transforming the income tax into a consump-
11 According to the new view of the corporate income tax, there is no such distortion in thecost of funds (see Stiglitz (1976) and Auerbach (1983)). The first distortion still persists, how-ever.
12See Auerbach (1983) for a survey of the issues regarding the corporate income tax.
©International Monetary Fund. Not for Redistribution
258 FERNANDO SANCHEZ-UGARTE
tion tax, integrating the personal and corporate income taxes, or correct-ing income tax for inflation would result in the removal of the distortionsreferred to above.
Distortions in the Labor Market
The market wage rate does not always fully reflect the social opportunitycost of employing labor. Two such cases are the rural-urban disequilib-rium analyzed by Lewis (1954) and the distortions identified in theHarberger-Harris-Todaro two-sector model (Todaro (1969) and Harberger(1972)). In the first case, the wage rate is determined by the average prod-uct of labor in the rural sector, while the marginal product of labor in thissector, which equals the social opportunity cost of labor, approaches zero.In the second case, the urban minimum wage is above the rural wage, lead-ing to unemployment in the urban sector and to a social opportunity cost oflabor that is intermediate between the two wage rates. In both cases, thedifference between the private and social cost of labor indicates that aslong as wage policy is not corrected, a subsidy or tax incentive to encouragethe use of labor in the urban sector can be welfare-improving.
The basic conclusion to be derived from these examples is that eventhough tax incentives can be justified in terms of economic efficiency, theyare never the most appropriate policy to follow in order to achieve the de-sired objective. Basic policy reform or the use of some other policy prefera-ble to a tax incentive is usually possible. Furthermore, the creation of toomany tax incentives can in itself be distortionary in often unpredictableways. For example, a subsidy to investment, even though it could reducesome distortions in the investment decision-making process, would in itselfdistort the labor-capital choice.13
II. General Considerations in the Design ofTax Incentives
The social cost-benefit approach to tax incentives, developed in the pre-vious section, suggests that a tax incentive can improve welfare when givento an activity whose private cost exceeds its social cost or when the privatebenefit derived from the activity falls short of the social benefit. The appli-cation of the above criteria poses few problems if the country has alreadycalculated the social accounting prices that could be used to determine the
13See discussion in the section on "Tax Incentives to Investment," below, where it is arguedthat the relative strength of distortions calls for favoring one or the other factor of production.
©International Monetary Fund. Not for Redistribution
RATIONALITY OF INCOME TAX INCENTIVES 259
level of tax incentives. A major problem arises when many activities call fortax incentives, as might be the case in many developing countries. If allneeded tax incentives were to be granted according to the efficiency crite-ria, the fiscal requirements could be very demanding. Since public policyin developing countries must meet the needs of so many other objectiveswith very limited fiscal resources, objectives and instruments must be care-fully selected. In this way, tax incentive policy advances social welfare tothe maximum, with only a limited amount of tax revenue forgone.
Selection of Objectives
Before the policymaker selects his objectives, he must decide how muchtax revenue should be allocated to tax incentives. Tax incentive policy com-petes with expenditure policy for the use of available tax revenue, makingessential a proper evaluation of the relative social returns of using re-sources in support of either one of the alternative policies.14
The main issue at stake is whether the public or the private sector canmake better use of tax revenue. If all taxes are optimal, the issue has noeconomic relevance because by definition the change in a marginal tax rateor the reduction of public expenditure would move the economy away fromthe optimum. If taxes are distortionary, however, the issue becomes rele-vant. It is important to compare the social return of using revenue to fi-nance public projects against that derived from returning the revenue tofinance private projects.15
It can be argued that when the selection process is perfect—that is, onlyinframarginal projects are selected—a tax incentive to investment involvesno tax revenue forgone (Muten (1982) and Goode (1984)). The additionalinvestment generated by the tax incentive would not have taken place in itsabsence; similarly, the taxes left unpaid would not have been paid in theabsence of the tax incentive. This argument assumes a perfection in theselection process that cannot be achieved in practice—most selection pro-cesses will pick up supramarginal projects, leading to a loss of net tax reve-nue. Nor is the argument valid in a dynamic context. If the tax incentiveremains operative for any length of time, it will eventually cover all invest-ment projects. Since it is impossible to make an accurate assessment of thetax revenue forgone as a result of investment incentives, a practical solu-
14See Muten (1982) for a discussion of the problems of measuring the costs involved in taxincentives.
15Without distributional considerations, $1 of tax revenue transferred to the private domes-tic investor is worth $1. The relevant question therefore is whether or not the social return ofthe project exceeds the cost of the funds (both private and public) invested.
©International Monetary Fund. Not for Redistribution
260 FERNANDO SANCHEZ-UGARTE
tion is to treat all projects as exactly marginal and presume that all taxrevenue forgone is a cost.16
It is hard to state precisely how much tax revenue a country should allo-cate to tax incentives, but obviously it cannot be much. As stressed earlier,tax incentives are not substitutes for an adequate and efficient tax system.If the tax system is so distorting as to require that a large fraction of the taxrevenue be rebated in order to reduce these distortions, the question is,would it not be better to reform the tax system so that it produces the de-sired revenue with fewer distortions? Similarly, if other distortions inducedby misguided economic policy are so large as to require corrective tax in-centives that give rise to substantial loss in tax revenue, then the question isagain, would it not be better to reform the economic policy to minimizedistortions? Furthermore, as Section IV below illustrates, tax incentivescan achieve only limited results and, therefore, only a small amount of taxrevenue should be allocated to them.
Once it has been decided how much revenue should be allocated to taxincentive policy, objectives should be selected so as to obtain the maximumincrease in economic welfare for a given amount of revenue.
Tax incentives are not equally effective in the pursuit of all objectives.For instance, evidence indicates that tax incentives are relatively ineffec-tive in promoting employment.17 One reason for this is that the tax systemsof developing countries usually encompass only the modern sector, whichis not the major employer in the economy. Furthermore, the pursuit of acomprehensive tax incentive policy for the promotion of employment, as-suming that it were effective, would imply the use of a large amount of taxrevenue. For example, if a 10 percent subsidy for the use of labor by anysector were given when the share of labor income in gross domestic product(GDP) was 40 percent, the program would end up using 4 percent of GDP.Some might argue that because tax incentives should be granted only onadditional employment, not as much tax revenue would be forgone. Unfor-tunately, there are few practical ways of granting tax incentives to incre-mental employment. But even if a practical way could be found, theamount of tax revenue involved in an effective program could still be verylarge. If unemployment were to be reduced from 10 percent to 5 percentthrough a 30 percent tax incentive on incremental employment, this wouldimply a loss of tax revenue of about 0.6 percent of GDP (assuming as abovethat the share of labor was 40 percent). Furthermore, the benefit of tax
16This criterion is based on a project that is exactly marginal without any tax incentive.17See Gandhi (1981) for a detailed evaluation of the effectiveness of tax incentives in the
promotion of employment in developing countries.
©International Monetary Fund. Not for Redistribution
RATIONALITY OF INCOME TAX INCENTIVES 261
incentives to incremental employment may be offset partially, if not fully,by the existence of a social security or payroll tax on employers.
There are other policies that are more effective in promoting employ-ment that do not involve forgoing such a large amount of tax revenue. Forinstance, a more flexible wage policy, more favorable terms of trade for theagricultural sector, and elimination of institutional barriers to employ-ment are among the many ways of promoting employment more effec-tively.
In general, when the objective involved is very broad, tax incentive policywill not be as effective—the loss of revenue will be large relative to a givenincentive effect. Accordingly, less benefit will accrue from applying a taxincentive scheme to promote a broad objective than from reshaping thedistorting economic policies or reforming the tax system, thereby achievingthe desired objective without the revenue loss. For instance, the more di-rect way to use the tax system to promote savings seems to be through anexpenditure tax in lieu of the income tax.18 Such a tax change can be madewithout losing tax revenue by choosing the rate of taxation accordingly.
To sum up, tax incentive policy can be more effective in the pursuit ofnarrowly based objectives such as the promotion of regional development,the promotion of selective exports, or the promotion of a specific sector.The reason is clear. A narrowly based tax incentive will have a larger in-ducement effect for a given amount of tax revenue forgone. Caution shouldbe exercised, however, when narrowing down an objective so as not to cre-ate severe distortions. For instance, the selection of regions for promotioncannot be so narrow as to leave other adjacent regions out of competition.Alternatively, the selection of promoted sectors cannot be so narrow as toleave very close substitutes out of the incentive scheme.
Selection of Instruments
The selection of specific tax incentives can be judged according to twomain criteria: effectiveness and efficiency. A tax incentive is effective whenit induces the desired behavior. Given that an ineffective tax incentive doesnot change economic behavior, it leads to windfall profits or economicrents. An efficient tax incentive is one that increases economic well-being.An inefficient tax incentive is one that changes economic behavior without
18There are ways in which the income tax or the corporate income tax can be converted intoan expenditure-type tax (see, for example, Meade (1978)). Even a general sales tax coveringintermediate and capital goods can be converted into a consumption tax, the one more widelyapplied practical way being through the value-added tax on consumption.
©International Monetary Fund. Not for Redistribution
262 FERNANDO SANCHEZ-UGARTE
actually increasing economic welfare, or worse, one that introduces distor-tions that lead to a decrease in welfare.
A third and very important consideration in the choice of tax incentivesis ease of administration. This paper will not directly discuss this criterionunless it has some bearing on the other two. However, the proper choice oftax incentives should give adequate weight to their administration.
III. The Efficiency of Specific Tax Incentives
This section discusses some of the distortions that specific tax incentivescan induce. Even though, as will be shown, tax incentives can be designedso as to avoid such distortions, most tax incentives used in developingcountries do not generally meet efficiency criteria.
Tax Incentives to Investment
Tax incentives to investment are the most prevalent form of tax incen-tive. They are relatively easy to apply in relation to different objectives suchas regional development, economic stabilization, and development of aspecific sector. The efficiency of various tax incentives to investment linkedto specific taxes and in connection with various objectives discussed below.
Most tax incentives to investment are given through the corporate in-come tax (CIT). Among the many ways of granting tax incentives throughthe CIT are tax holidays, accelerated depreciation, immediate write-off ofinvestment expenditure (expensing), and the investment tax credit. Theissue of tax incentive neutrality, discussed in the public finance literature,has arisen basically in connection with tax incentives affecting the CIT.19
There are three important ways in which tax incentives related to theCIT can be nonneutral, or distortionary, in their effects: (1) with respect tothe life of the asset; (2) with respect to the type of financing; and (3) withrespect to the time path of the investment project. It has been shown else-
19A useful criterion in the selection of efficient tax incentives is that of neutrality. Accordingto Harberger (1980), a tax incentive to investment is neutral if it induces neither new coveredinvestment with low rates of social yield nor other covered investments with higher rates ofsocial yield. Neutrality is desirable for two reasons: first, it is useful to be able to predict atwhat level an activity is being subsidized. A nonneutral tax incentive does not permit us toknow this because the level of the incentive depends on factors outside the control of eco-nomic policy. Second, by maintaining neutrality one can avoid unpredictable distortionaryeffects. The purpose of tax incentives is to favor certain activities relative to others, but it isimportant to know to what extent one activity is being favored. This cannot be left to unpre-dictable factors (see Sandmo (1974), Swan (1976), Boadway (1978), Auerbach (1982), andRuane (1982)).
©International Monetary Fund. Not for Redistribution
RATIONALITY OF INCOME TAX INCENTIVES 263
where (Sanchez-Ugarte (1983)) that given a classical CIT, all tax incentivesto investment are nonneutral with respect to the type of financing if theyare given on total investment expenditure. The CIT is avoided when theinvestment is entirely debt financed. More generally, the CIT is avoided onthat part of the investment that is debt financed. It follows that a tax incen-tive given on the total investment outlay will favor debt financing over eq-uity financing even beyond the built-in bias of the classical CIT. The solu-tion is to grant the incentive only for the self-financed part of theinvestment.
Immediate write-off (expensing) of part of the asset is a neutral tax in-centive with respect to the life of the asset. The investment tax credit favorsshort-lived projects, and accelerated depreciation will have a bias depend-ing on how the acceleration procedure works.20 The investment tax creditis a distortionary tax incentive; it can be shown that it reduces the cost ofgross investment (whereas expensing acts on net investment) and maytherefore lead to the selection of very short-lived projects with negative so-cial returns (Sanchez-Ugarte (1983)).
A third type of tax incentive nonneutrality involves the time path of reve-nues along the life of the investment. The so-called tax holidays tend tofavor short-run projects producing revenues at the beginning of the life ofthe project over long-run, slow-maturing projects. In this sense, tax holi-days are nonneutral.
Neutrality, as was mentioned earlier, is an important criterion for thedesign of tax incentives. Nonneutral tax incentives can lead to unwantedresults of unpredictable magnitude. For instance, the investment taxcredit can lead to the selection of projects with negative social returns,while the tax holiday can favor very short-lived investments. Even if the taxincentive does not produce such undesirable effects, a nonneutral tax in-centive implies a higher loss of revenue for a given incentive effect. Forexample, the difference between the cost of expensing and that of the in-vestment tax credit for a given effect on net investment is the tax incentivegiven to replacement investment because the former is a subsidy on netinvestment, while the latter is a subsidy on gross investment.21 Most tax
20In Sanchez-Ugarte (1983), a procedure is devised for making accelerated depreciationneutral with respect to the life of the asset.
21This point is developed in Sanchez-Ugarte (1983, Chapter I). To give an idea of what isinvolved in the argument, assume that the net present value of an investment project (NPV) isgiven by
NPV = Y - T - I, ( 1 )
©International Monetary Fund. Not for Redistribution
264 FERNANDO SANCHEZ-UGARTE
incentives discriminate against working capital, inventories, and humancapital because they are usually given to fixed capital formation. This biascan be eliminated by granting the tax incentive over the whole investmentoutlay, but it is difficult to measure forms of investment different fromfixed capital formation.
In addition, tax incentives to investment reduce the cost of using physi-cal capital relative to other factors of production, labor in particular. Thisdistortion has been noted by several public finance experts and has beenpointed out as one of the many distortions that exist in developing coun-tries in the labor employment decision. Two things should be mentioned inthis respect. First, even though, as was mentioned before, the labor marketdistortions prevalent in developing countries call for subsidies for the useof labor, other distortions call for subsidies for the use of capital. Hence,the factor of production that should be favored by public policy will de-pend on the relative strength of the various distortions present in the econ-omy.22 It cannot be asserted prima facie that a subsidy for the use of laboris preferable to a subsidy for investment; furthermore, the adequate selec-tion of tax incentives will vary by industry and by region so that tax incen-tives are best designed on a case-by-case basis.
Second, even though from the static point of view a tax incentive to in-vestment tends to reduce the use of labor, the same result does not neces-sarily apply in a dynamic context. Capital deepening in the economy will
where Y is the present value of gross revenue, T is the present value of taxes, and I grossinvestment.
Under the investment tax credit (ITC) at rate c, the present value of taxes is T — (Y —dI)t — cI, where d is the present value of depreciation allowance and t the corporate tax rate.Subtracting depreciation to obtain net income and net investment in equation (1),
NPV = (Y - dI)(1 - t) + cI - 7(1 - d). (2)
With expensing at rate a, the present value of taxes becomes T — (Y — al — (1 — a)dI)t.In order to obtain net income, we subtract depreciation from the present value of gross reve-
NPV =(Y- dI)(1 - t) - a(I - dI)t - I(1 - d). (3)
Net investment is equal to I — dI. If at — c, it is clear that the cost of the ITC is larger thanthat of expensing at equivalent rates. The ITC costs cI, and expensing of part of the invest-ment costs only a (I — dI)t. It is also clear that the ITC is given on gross investment (I),whereas expensing acts on net investment [7(1 — d)].
22For instance, it has been shown (see Sanchez-Ugarte (1983)) that under certain assump-tions when the structure of industrial output is distorted by international trade restrictions,tax incentives favoring the use of capital should be granted to new industries. This can still bea valid conclusion even when labor markets are distorted.
©International Monetary Fund. Not for Redistribution
RATIONALITY OF INCOME TAX INCENTIVES 265
tend to increase the productivity of labor in the steady state, and couldincrease the relative share of labor in total output, depending on the elas-ticity of substitution in production.23
Tax incentives have been proposed and used as an alternative to adjust-ing the tax system for inflation. It has been argued that an investment taxcredit or accelerated depreciation can give approximately the same resultas correction of the income tax for inflation, with fewer complications(Keith (1966), Aaron (1976), and Feldstein (1981)). This argument is validfor low rates of inflation (say, below 15 percent). However, when inflationrates exceed this range, the distortionary effects of inflation become larger,and the counteracting effects of tax incentives are then less effective(Sanchez-Ugarte (1983)). For instance, if accelerated depreciation is usedto avoid the distortionary effects of tax depreciation at historic costs, at ahigh enough inflation rate and on a relatively short-lived asset, there is norate of depreciation fast enough to avoid the effects of inflation. Instantdepreciation is more than fast enough, whereas depreciation in two years isnot fast enough. On the other hand, with high rates of inflation, the ex-pected rate of depreciation becomes less predictable. Tax incentives haveto be announced in advance, which gives a large margin of error favoringeither investors or the government. Correcting the income tax for inflation,rather than using tax incentives, results in less distortion and is less costly.
Tax Incentives to Regional Development
Consider a tax incentive scheme for the promotion of industry in a less-developed region. The tax incentive scheme should remove the negativeexternalities and induce positive ones (see section on "Regional Distribu-tion of Economic Activity," above). One positive externality might resultfrom an increasing urban concentration in the developing region, whichreduces the cost of public services and provides for certain economies ofscale. If concentration in a particular region is a desired objective, this canbe achieved through a tax incentive to investment on plant and equipment.
Another positive externality can be derived from the employment of la-bor that accompanies the new investment. However, prospective investorsin the region take into consideration not only the direct cost of using labor,which in nominal terms can be cheaper in the backward areas, but also itsproductivity. The lack of skill of the local labor force is likely to pose amajor obstacle for the new investment project. This problem can be re-
23This argument rests on the dynamic incidence of taxation, which is different from thestatic case. See Boskin (1978) for an application.
©International Monetary Fund. Not for Redistribution
266 FERNANDO SANCHEZ-UGARTE
duced by simultaneously granting tax incentives for the training of the la-bor force in that region in the form of, for example, additional income taxdeductions. Similarly, where transportation costs can also be a majorproblem in such areas, a tax incentive for the purchase of transportationequipment can be granted simultaneously.
Notice, however, that many developing countries promote regional de-velopment through tax incentives to investment in physical capital (Modi(1982)). As shown above, this is not always the best way to induce the de-sired externality.
Tax Incentives and International Trade
Tax Incentives to Imports
Reductions of and exemptions from import tariffs are a common form oftax incentive in developing countries. Tax incentives are frequently givento encourage the importation of both raw material and capital equipment,and in both cases they appear to be distortionary. The reduction of importtaxes on inputs increases the effective rate of protection granted to domes-tic production by the import tariff structure.24 This distortionary effect isfurther enhanced by the effect of import tariff reductions on capital equip-ment. It can be shown that import tariff reductions on capital goods leadto effective rates of protection higher than the nominal protection andhigher than the traditional measure of protection, which only incorporatesthe effect of tariffs on intermediate goods.25
This form of incentive, which is widely used in developing countries,should be a matter of concern. First of all, selective import tariff reduc-tions are often granted to individual firms, and not to all the firms in the
24See Sanchez-Ugarte (1983, Chapter II). This effect results from the fact that domesticvalue added has a higher cost than would result under a uniform tariff. For instance, if atariff of 30 percent is imposed on a product, and 50 percent of the product produced domesti-cally is imported without tariffs, the effective protection on that product is 60 percent.
The domestic producers can sell the product in question at 30 percent above the interna-tional price and they can import 50 percent of the components free of tariffs. This means thatthe 30 percent tariff is really protecting 50 percent of the product (the rest is imported), so theeffective protection on this 50 percent is as high as 60 percent. See Corden (1971) where theconcept of effective protection is thoroughly analyzed.
25The formula for effective protection that incorporates the effect of imported capitalequipment isE = tx — tm + v(tm — y]tk)/v(1 —n), where tx is the tariff on final output, tm thetariff on intermediate inputs, tk the tariff on capital equipment, v the ratio of domestic valueadded to gross output, and rj the ratio of investment to value added. See Sanchez-Ugarte(1983) for the derivation.
©International Monetary Fund. Not for Redistribution
RATIONALITY OF INCOME TAX INCENTIVES 267
industry. This distorts the structure of effective protection in unpredicta-ble ways. Second, a high level of effective protection gives rise to great inef-ficiency in the use of domestic resources. Third, the reductions in, or ex-emptions from, tariffs on the importation of capital equipment and rawmaterials leave the domestic industries that produce these commoditiesunprotected and increase the level of protection of industries that produceconsumption goods. Exports using imported raw materials, which aretaxed, frequently receive duty drawbacks to reduce the cost disadvantageimposed on them by the levy of the tariff. Such duty drawbacks, however,do not extend to taxed imports of capital goods, whose cost disadvantageto exports can only be relieved by allowing duty-free importation of capitalgoods by export industries.
Throughout developing countries, the production of capital equipmenttends to have rates of protection well below those granted to other indus-tries. Hence, a case can be made, on efficiency grounds, for tax incentivesto favor the use of domestic capital goods vis-a-vis imported ones. Thisimplies that if tax incentives are given to investment, a higher rate shouldbe granted to investment in domestically produced capital goods.
Tax Incentives to Exports
In discussing tax incentives for the promotion of exports, one needs toseparate two issues. One is the problem of border tax adjustments, whichimplies that under the destination principle of taxation, indirect taxesapply where the good is consumed. This means that imports are taxed andexports are exempt. In order to avoid double taxation, an individual coun-try should adhere to the destination principle as long as everybody elsefollows the same principle. This kind of tax rebate is not in any sense asubsidy to exports, but rather is a way of harmonizing indirect tax systemsacross international borders.26
On the other hand, tax incentives are frequently given to exports in de-veloping countries to compensate for other distortions in the foreign tradesector such as protection and overvalued exchange rates. Protectionchanges the domestic terms of trade in favor of the production of goodsthat substitute for imports. This reduces the attractiveness of producingexport and nontradable goods. However, protection increases the domesticprice of importables relative to exportables and of nontradables. This re-duces the demand for imports. Since, in the long run, the external balance
26The GATT rules allow such rebates, and the European Community requires that theindirect taxes of its member countries be applied according to the destination principle.
©International Monetary Fund. Not for Redistribution
268 FERNANDO SANCHEZ-UGARTE
of the country has to be in equilibrium, a policy that reduces imports willalso reduce exports. Moreover, the protected sector is rarely able to be-come an exporter because it is being isolated from foreign competition.Tax incentives are frequently used to reduce the size of these two effects. Itis worth noting, however, that if all exports are subsidized to eliminate thenegative effects of protection, the relative price advantage of producingimport substitutes will be eliminated. This is one reason why export pro-motion policy is very often selective by sector. Contriving to have a pro-tected industry that also has the capacity to export is a difficult exercise.Few countries have been successful in promoting exports, while still pro-tecting the industrial sector.27 An additional element is that many import-ing countries abide by the GATT rules for international trade and oftenestablish countervailing duties and/or quantitative restrictions on thoseexports subsidized in the home country. In this case, the subsidy to exportsbecomes a transfer to the foreign country's treasury.
Export subsidies are often used by developing countries to compensatefor the trade effects of an overvalued exchange rate. Such a policy is sel-dom effective as it is difficult to compensate through the governmentbudget for the distortions resulting from inadequate exchange rate policythat tend to grow over time. Moreover, export subsidies can often lead tofurther efficiency losses by delaying an exchange rate adjustment.
Other Tax Incentives
Tax incentives are also given through domestic indirect taxes and areoften distortionary. The incentive given to new firms in any industry willdistort competition within the industry and can have a high cost in terms oftax revenue forgone. Furthermore, given that the design of indirect taxesvery often takes into account distributional considerations, lower tax ratesapply to goods considered to be necessities or are consumed by low-incomegroups, whereas higher rates apply to goods that are considered to be lux-uries or are consumed by higher-income groups. Tax incentives in relationto indirect taxes have the effect of reversing the distributional bias inherentin the tax structure. On the other hand, a tax incentive given through anindirect tax will, if effective, lead to an increase in production. Hence, itdoes not favor a specific factor of production such as a tax incentive toinvestment or a tax incentive to the use of labor.
27An exception is Korea which has been able to increase nontraditional exports by a judi-cious use of fiscal and financial incentives. The key to success in the tax incentive policy hasbeen efficiency and expediency in granting the incentives. See Rhee and others (1984).
©International Monetary Fund. Not for Redistribution
RATIONALITY OF INCOME TAX INCENTIVES 269
Another form of tax incentive that has become popular in some coun-tries (e.g., Colombia and Mexico) is the so-called tax savings certificate(TSC). This is a document issued by the government, in connection with atax incentive scheme, which can be used for payment of various taxes. Themain advantage of this document is that the amount of tax revenue trans-ferred to the private agent is known with certainty in nominal terms. Thisis not generally the case with most tax incentives, the value of which de-pends on the future tax liability.
The TSC also has an advantage over other tax incentives linked to aspecific tax in that it is more liquid and can be applied to the payment ofany tax. Tax incentive recipients often have other taxes to which the certifi-cate can be applied. The liquidity of the certificate can be increased byallowing it to be traded.
The basic advantage of the TSC is also its main disadvantage—it allowsthe government to grant tax incentives in amounts that can be highly dis-proportionate to the taxes generated by the activity in question. Moreover,it may not provide immediate liquidity to the taxpayer if the taxpayer canneither fully use it himself nor trade it for its full value.
Conclusions
Two general conclusions can be derived from the above examples as tothe efficiency of tax incentives. First, tax incentives tend to induce diverseand often unpredictable distortions in the economy, a factor often over-looked in their design. Second, the best way of achieving a net positiveexternality (or reducing a negative one) through tax incentives is by select-ing instruments that act as directly on the externality as possible. Thus, ifthe positive externality derives from net investment, the tax incentiveshould be granted on net investment; if the positive externality arises fromuse of labor, the incentive should act to encourage the use of this factor ofproduction. A tax incentive is, in general, linked to a specific tax base. Thepolicymaker should select the tax base that is most closely related to thepositive external effect that he wishes to induce.
IV. The Effectiveness of Tax Incentives
Most economists and lay persons alike have doubts about the overalleffectiveness of tax incentives policy in developing countries. The empiricalliterature has been inconclusive on the effectiveness of tax incentive pol-
©International Monetary Fund. Not for Redistribution
270 FERNANDO SANCHEZ-UGARTE
icy.28 Among the reasons why tax incentives tend to be ineffective, some ofwhich were alluded to earlier, the following need to be stressed: too broad aspectrum of objectives pursued with limited resources; excessive selectivityin the granting process; unpredictability in the granting of the incentives;too much political influence of vested interests in the design of policy; aninadequate relationship between the objective and the instrument; andcountereffective general equilibrium (or indirect) effects. For tax incen-tives to be effective, therefore, certain criteria must be fulfilled, and theseare highlighted below.
Limiting the Objectives
The first problem stems from the authorities' wanting to pursue toomany objectives with limited resources. Most developing countries tend touse tax incentives for a variety of objectives, resulting in a very diffuseimpact on any one of the objectives.
The typical tax incentive scheme in a developing country contains, as thebackbone of the policy, an industrial promotion program that is aimed atthe development of the manufacturing industry (Sanchez-Ugarte (1983)and Modi (1987)). Such a scheme typically involves benefits for certainsectors and regions of the country, which are granted through several spe-cific tax incentives relating to the corporate income tax, import tariffs, andother taxes. It is also common to find tax incentives for the promotion ofexports, which are usually granted to nontraditional exports. Many coun-tries also grant incentives to mineral and oil exploration and development;the tourist sector also receives tax incentives, and it is not uncommon tofind additional tax incentives given to agriculture, livestock raising, for-estry, and fishing.
In addition to tax incentives by sector, the specific tax legislation fre-quently contains reductions and exemptions directed toward promotingeconomic development in general. For instance, income taxes may containaccelerated depreciation or investment tax credits to promote investment;there might be incentives to induce private savings in the financial sector orthe stock exchange. Other taxes may also contain built-in tax incentives.Finally, many countries also grant tax incentives or tax rate reductions inspecial cases, at the discretion of the tax administration authorities. Taxincentives in developing countries would be more effective and less costly iftwo or three narrow objectives were chosen.
28See, for instance, Taylor (1957), Heller and Kauffman (1963), Porter (1969), Hirschman(1967), Tanzi (1969), Joel (1971), Goodman (1972), Mahar (1976), Moore and Rhodes(1976), and Sanchez-Ugarte (1983).
©International Monetary Fund. Not for Redistribution
RATIONALITY OF INCOME TAX INCENTIVES 271
Reducing the Discretionary Element
Tax incentives are effective if they induce the desired economic behav-ior. Developing countries typically use a long and complicated process ofapplication and selection in order to ensure that the recipient of the taxincentive really needs it. The excessive red tape tends to nullify the desiredresult, because in order to apply for the incentive the firm has to have boththe resources for covering the costs involved in the application process andthe interest in doing so. A firm that is exactly on the margin between un-dertaking the activity and doing something else will not apply because ithas very little to gain from doing so and much to lose.29 On the other hand,a firm that will obtain rents in pursuing the activity will be willing to gothrough the selection process. Such a firm runs no risk and may in factincrease its profits on an activity that it would have undertaken even with-out the tax incentive. Excessive selectivity and administrative discretiondefeat their own purpose, as they decrease the probability of selectingthose candidates who are in greatest need of the incentive.
The arguments above suggest that the granting of tax incentives shouldbe an automatic process and that selectivity should be exercised with greatcare.
Ensuring Predictability
A third reason for the ineffectiveness of tax incentives is their unpredict-ability. Most countries fine-tune their tax incentive policy to respond to theever-changing economic conditions. However, these changes tend to makethe policy ineffective because as long as tax incentives are not incorporatedinto individuals' economic calculations, they do not lead to changes in eco-nomic behavior but rather to windfall gains to the lucky recipients.
It follows that, while tax incentives do not have to be permanent, theymust be predictable, so that they can be incorporated into the decision-making process of the economic agents.
Minimizing Political Influences
Tax incentives are commonly sought by vested interest groups. Govern-ments are likely to yield to such political pressures, first, because the costof tax incentives is borne by all taxpayers—and is therefore more easilyabsorbed—whereas the benefits are specific. Second, tax incentives are
29See Sanchez-Ugarte (1983) where this argument is developed and tested in relation toMexico.
©International Monetary Fund. Not for Redistribution
272 FERNANDO SANCHEZ-UGARTE
commonly granted at the discretion of the administrative branch of thegovernment, so that they are not subject to the political decision-makingprocess involved in other tax legislation. Quite often they are given by min-istries other than the ministry of finance and against the will of the latter.Furthermore, it can be argued that tax incentives are an expeditious andsimple instrument of effecting transfers to specific groups and have appar-ent redeeming social value as vehicles of economic development. They easethe transfer of resources since an actual disbursement is not involved norare they controlled by the normal budgetary process. The result is that taxincentives are often aimed at the pursuit of political rather than economicobjectives.
Economists have become increasingly aware that some fiscal measuresgive rise to economic rents and induce rent-seeking behavior on the part ofeconomic agents, thereby leading to economic inefficiency. The literaturetouching upon this issue has concentrated on the rent-seeking behaviorwith respect to import tariffs and other trade restrictions (Krueger (1974)and Brock and Magee (1978)). Much of the analysis dealing with the rent-inducing effects of tariffs can be extended to tax incentives, which consti-tute one of the prime examples of rent-inducing fiscal measures. Eventhough there will always be political pressure to use tax incentives to effecttransfers, the recommendations given above to limit the scope of tax incen-tive policy, to reduce discretionary criteria for granting incentives, and toensure predictability will help reduce rent-seeking behavior.
Ensuring Direct Relationship Betweenthe Instrument and the Objective
Tax incentives are not always chosen so that they act specifically on theobjective they pursue. Most tax incentives are granted for investment sincethese types of incentives are less difficult to apply. It is hoped that at thesame time as they increase investment, they will also meet other comple-mentary objectives, such as regional development, exports, employment oflabor, and import substitution. As pointed out earlier, this lack of focuscan create other distortions with often unpredictable results.
The choice of instruments should therefore closely match the objectivepursued.
General Equilibrium Effects
The design of tax incentives should take into account the general equi-librium effects that can easily nullify the desired incentive effect. Undercertain assumptions, tax incentives for regional development tend to becapitalized on the value of land. This capitalization effect, aside from its
©International Monetary Fund. Not for Redistribution
RATIONALITY OF INCOME TAX INCENTIVES 273
effect on income distribution might lessen the inducement to invest in theregion. Tanzi (1969), citing the case of Ecuador, shows that tax incentivesto investment had a successful allocative role, redirecting investments tothe manufacturing sector without actually increasing the rate of invest-ment for the economy as a whole.
A similar phenomenon can affect tax incentives to selective exports-certain types of exports may be substituted in production for other exportsthereby increasing the level of one export while reducing that of another.This phenomenon lessens the overall impact of tax incentives on totalexports.
General equilibrium effects can reduce the effectiveness of tax incentivesto the use of labor. In most developing countries, the tax system basicallycovers the modern, urban, relatively capital-intensive sector of the econ-omy. Granting a subsidy to the use of labor by the capital-intensive indus-try has two effects. On the one hand, it reduces the cost of labor by themodern sector, thereby increasing the demand for labor. On the otherhand, it expands the sector that is relatively capital-intensive, leading tothe contraction of the sector that is labor-intensive and thus reducing thedemand for labor. It is not certain which of the two effects will dominate.
The proper design of tax incentives should therefore attempt to take intoaccount the general equilibrium effects of the specific measures taken inorder to guarantee the effectiveness of tax incentive policy.
V. Concluding Remarks
It has been argued throughout this chapter, that even though the grant-ing of tax incentives under certain circumstances might be economicallyrational, this policy presents severe limitations and drawbacks.
Tax incentives, even when designed to promote economic efficiency, arenot necessarily the most appropriate method. Quite often, there is a moredirect and effective alternative policy. The attempt by some developingcountries to use a vast array of liberal tax incentives to counteract the nega-tive effects of high marginal tax rates of narrowly based taxes and/orwrong economic policies with regard to wage rates, interest rates,exchange rates, and so on is likely to be ineffective and even counterpro-ductive.
This chapter has shown that tax incentives often have more deleteriousside effects than the distortions caused by tax and other economic policiesthey attempt to eliminate. Furthermore, as has been shown, it is no simpletask to design effective tax incentives to produce the desired result. If thetax system is so distorting as to require more than just "fine-tuning," thesuggested course of action would be to reform the tax system itself so that a
©International Monetary Fund. Not for Redistribution
274 FERNANDO SANCHEZ-UGARTE
second-best situation is attained. The recent optimal taxation literaturehas shown that it is theoretically possible to design a tax system, takinginto account both economic efficiency and income distribution, eventhough such a system would consist of only a few feasible taxes. Tax incen-tives are no substitute for an efficient tax system. All tax reform effortsshould, therefore, be directed at achieving the latter. Reducing the mar-ginal tax rates while expanding the tax base, as recommended by supply-siders, would be an important component of such a strategy.
However, tax incentives exist worldwide and, even though many of themhave little justification in a first- or second-best world, they are here tostay. It is, therefore, necessary to consider how to design tax incentives thatare both economically efficient and effective. Efficiency can be ensured bygranting tax incentives in accordance with the net social benefit generatedby the promoted activity. The methodology developed for social cost-benefit analysis can be applied to the design of tax incentives in order toobtain this result.
The selection of specific tax incentives is a very important matter. Someincentives severely erode the neutrality of the tax upon which they act, inways that are not only economically undesirable but also unpredictable.
The choice of objectives to which incentives can be applied is also impor-tant as not all objectives are attainable through tax incentive policy. Careshould be taken not to select too many or too broad objectives—goals cannever be reached if too little tax revenue is allocated to any one of theseobjectives. Tax incentive policy will be more effective if it is restricted to afew, well-defined, and very specific objectives. The first three that come tomind, though not the only ones, are regional development, selective indus-tries (or sectors), and export promotion. More broadly based objectives—for example, the promotion of employment, the increase in the overall levelof capital accumulation, or the promotion of savings—are less effectivetargets for tax incentives. This is not to imply that such objectives shouldnot be pursued, but rather that there are other more effective ways of at-taining them. For instance, tax reform can be a way of eliminating some ofthe distortions inherent in some tax systems with respect to capital accu-mulation, savings, or the financial structure of the economy. Similarly,other economic policy instruments, such as wage policy, are more effectivein the promotion of employment than are tax incentives.
The point that needs to be stressed is that tax incentives are only margin-ally effective, while these economy-wide objectives need more than mar-ginal changes. The fact that the amount of revenue allocated to tax incen-tives has to be small (if it is not to damage the tax system intrinsically)validates this conclusion.
©International Monetary Fund. Not for Redistribution
RATIONALITY OF INCOME TAX INCENTIVES 275
Tax incentives should not be granted on a discretionary basis. It is onething to design tax incentives with very specific objectives in mind andanother to be so selective in granting them that they cannot be incorpo-rated in the decision-making process. Automaticity and objectivity in thegranting of tax incentives are essential to the success of tax incentive pol-icy. This, in turn, means that tax incentives must be meticulously designedto match the instrument with the objective as closely as possible. It followsthat tax incentive policy should, as far as possible, be independent of polit-ical considerations. One way to attain this is to shift the function of select-ing tax incentives away from the administrative branch of the governmentand into the regular tax legislation process.
REFERENCES
Aaron, Henry J., ed., Inflation and the Income Tax (Washington: Brookings Insti-tution, 1976).
Arrow, Kenneth J., and Robert C. Lind, "Uncertainty and the Evaluation of Pub-lic Investment Decisions," American Economic Review (Nashville, Tennes-see), Vol. 60 (June 1970), pp. 364-78.
Auerbach, Alan J., "Inflation and the Choice of Asset Life," Journal of PoliticalEconomy (Chicago), Vol. 87 (June 1979), pp. 621-38.
, "Tax Neutrality and the Social Discount Rate: A Suggested Framework,"Journal of Public Economics (Amsterdam), Vol. 17 (April 1982), pp. 355-72.
, "Taxation, Corporate Financial Policy and the Cost of Capital," Journalof Economic Literature (Nashville, Tennessee), Vol. 21 (September 1983), pp.905-40.
Balassa, Bela, and associates, The Structure of Protection in Developing Countries(Baltimore: Johns Hopkins University Press, 1971).
Bator, Francis M., "The Anatomy of Market Failure," Quarterly Journal of Eco-nomics (Cambridge, Massachusetts), Vol. 72 (August 1958), pp. 351-79.
Bird, R., "Tax Incentives for Investment: The State of the Art," Canadian TaxPaper No. 64 (Toronto: Canadian Tax Foundation, 1980).
Boadway, Robin, "Investment Incentives, Corporate Taxation, and Efficiency inthe Allocation of Capital," Economic Journal (London), Vol. 88 (September1978), pp. 470-81.
, Public Sector Economics (Cambridge, Massachusetts: Winthrop Pub-lishers, 1979).
Boskin, Michael J., "Taxation, Saving, and the Rate of Interest," Journal of Politi-cal Economy (Chicago), Vol. 86, No. 2, Part 2 (April 1978), pp. S3-S27.
Brock, William A., and Stephen P. Magee, "The Economics of Special InterestPolitics: The Case of the Tariff," American Economic Review, Papers andProceedings of the Ninetieth Annual Meeting of the American EconomicAssociation (Nashville, Tennesee), Vol. 68 (May 1978), pp. 246-50.
©International Monetary Fund. Not for Redistribution
276 FERNANDO SANCHEZ-UGARTE
Coase, R.H., "The Problem of Social Cost," Journal of Law and Economics (Chi-cago), Vol. 3 (October 1960), pp. 1-44.
Corden, W.M., The Theory of Protection (Oxford: Clarendon Press, 1971).
Feldstein, M.S., "The Social Time Preference Discount Rate in Cost Benefit Anal-ysis," Economic Journal (London), Vol. 74 (June 1964), pp. 360-79.
, "Adjusting Depreciation in an Inflationary Economy: Indexing VersusAcceleration," National Tax Journal (Columbus, Ohio), Vol. 34 (March1981), pp. 29-43.
Gandhi, Ved P., "Unemployment in Developing Countries: Can Tax IncentivesHelp?" (unpublished, International Monetary Fund, February 3, 1981).
Goode, Richard, Government Finance in Developing Countries (Washington:Brookings Institution, 1984).
Goodman, David E., "Industrial Development in the Brazilian Northeast: An In-terim Assessment of the Tax Credit Scheme of Article 34/18," in Brazil in theSixties, ed. by Riordan Roett (Nashville, Tennessee: Vanderbilt UniversityPress, 1972).
Harberger, Arnold C., "On Measuring the Social Opportunity Cost of Labour," inFiscal Measures for Employment Promotion in Developing Countries(Geneva: International Labor Office, 1972).
, Taxation and Welfare (Boston: Little, Brown, 1974).
, Project Evaluation: Collected Papers (Chicago: University of ChicagoPress, Midway reprint, 1976).
, "Tax Neutrality in Investment Incentives," in The Economics of Taxa-tion, ed. by Henry J. Aaron and Michael J. Boskin (Washington: BrookingsInstitution, 1980).
Heller, Jack, and Kenneth M. Kauffman, Tax Incentives for Industry in Less De-veloped Countries (Cambridge, Massachusetts: Harvard Law School Interna-tional Program in Taxation, 1963).
Hirschman, Albert O., "Desenvolvimento Industrial no Nordeste Brasileiro e oMecanismo de Credito Fiscal do Artigo 34/18," Revista Brasileira de Econo-mia (Rio de Janeiro), Vol. 21 (December 1967), pp. 5-34.
Hirschleifer, J., "Investment Decision Under Uncertainty: Applications of theState-Preference Approach," Quarterly Journal of Economics (Cambridge,Massachusetts), Vol. 80 (May 1966), pp. 252-77.
Joel, Clark, "Tax Incentives in Central American Development," Economic Devel-opment and Cultural Change (Chicago), Vol. 19 (January 1971), pp. 229-52.
Johnson, Harry G., "The Cost of Protection and the Scientific Tariff," Journal ofPolitical Economy (Chicago), Vol. 68 (August 1960), pp. 327-45.
, Technology and Economic Interdependence (London: Macmillan, 1975).
Keith, E. Gordon, "Introduction and Summary," in Foreign Tax Policies andEconomic Growth: A Conference Report of the National Bureau of EconomicResearch and the Brookings Institution (New York: Columbia UniversityPress, 1966).
Krueger, Anne O., "The Political Economy of the Rent-Seeking Society,"
©International Monetary Fund. Not for Redistribution
RATIONALITY OF INCOME TAX INCENTIVES 277
American Economic Review (Nashville, Tennessee), Vol. 64 (June 1974), pp.291-303.
Layard, Richard, ed., Cost-Benefit Analysis: Selected Readings (Harmondsworth,England: Penguin Books, 1972).
Lewis, W. Arthur, "Economic Development with Unlimited Supplies of Labour,"Manchester School of Economic and Social Studies, Vol. 22 (May 1954), pp.139-91.
Little, I.M.D., and J.A. Mirrlees, Project Appraisal and Planning for DevelopingCountries (London: Heinemann Educational Books, 1974).
Lucas, Robert E., Jr., Studies in Business-Cycle Theory (Cambridge, Massachu-setts: MIT Press, 1981).
Mahar, Dennis J., "Fiscal Incentives for Regional Development: A Case Study ofthe Western Amazon Basin," Journal of Interamerican Studies and WorldAffairs (Coral Gables, Florida), Vol. 18 (August 1976), pp. 357-78.
Marglin, Stephen, A., "The Opportunity Costs of Public Investment," QuarterlyJournal of Economics (Cambridge, Massachusetts), Vol. 77 (May 1963), pp.274-89.
Meade, J.E., The Structure and Reform of Direct Taxation (London: Allen & Un-win, 1978).
Modi, Jitendra R., "Narrowing Regional Disparities by Fiscal Incentives," Fi-nance & Development (Washington), Vol. 19 (March 1982), pp. 34-37.
, "Major Features of Corporate Profit Taxes in Selected Developing Coun-tries," Bulletin, International Bureau of Fiscal Documentation (Amsterdam),Vol. 41 (February 1987), pp. 65-74.
Moore, Barry, and John Rhodes, "Regional Economic Policy and the Movement ofManufacturing Firms to Development Areas," Economica (London), Vol. 43(February 1976), pp. 17-32.
Muten, Leif, "Forms of Tax Incentives; Their Economic Costs and Benefits," inFiscal Incentives: Tax Policy as an Instrument of Economic Development(German Foundation for International Development, Berlin, 1982).
Porter, Richard C , "The Effectiveness of Tax Exemption in Colombia," Discus-sion Paper No. 8 (Ann Arbor, Michigan: University of Michigan, Center forResearch on Economic Development, 1969).
Rhee, Yung Whee, Bruce Ross-Larson, and Garry Pursell, Korea's CompetitiveEdge: Managing the Entry into World Markets (Baltimore: Johns HopkinsUniversity Press, 1984).
Ruane, Frances P., "Corporate Income Tax, Investment Grants, and the Cost ofCapital," Journal of Public Economics (Amsterdam), Vol. 17 (February1982), pp. 103-110.
Sanchez-Ugarte, Fernando, "Tax Incentives to Investment for the Promotion ofIndustry: The Mexican Experience" (doctoral dissertation, Chicago: Univer-sity of Chicago, December 1983).
Sandmo, Agnar, "Investment Incentives and the Corporate Income Tax," Journalof Political Economy (Chicago), Vol. 82 (March-April 1974), pp. 287-302.
©International Monetary Fund. Not for Redistribution
278 FERNANDO SANCHEZ-UGARTE
Sen, Amartya K., "Isolation, Assurance and the Social Rate of Discount," Quar-terly Journal of Economics (Cambridge, Massachusetts), Vol. 81 (February1967), pp. 112-24.
Stern, Nicholas H., "Optimum Taxation and Tax Policy," Staff Papers, Interna-tional Monetary Fund (Washington), Vol. 31 (June 1984), pp. 339-78.
Stiglitz, Joseph E., "The Corporation Tax," Journal of Public Economics (Amster-dam), Vol. 5 (April-May 1976), pp. 303-11.
Swan, Peter L., "Income Taxes, Profit Taxes and Neutrality of Optimizing Deci-sions," Economic Record (Melbourne), Vol. 52 (June 1976), pp. 166-81.
Tanzi, Vito, "Tax Incentives and Economic Development: The Ecuadorian Expe-rience," Finanzarchiv (Tubingen), Vol. 28 (March 1969), pp. 226-35.
Taylor, M.C., Industrial Tax-Exemptions in Puerto Rico: A Case Study in the Useof Tax Subsidies for Industrializing Underdeveloped Areas (Madison, Wis-consin: University of Wisconsin Press, 1957).
Todaro, M.P., "A Model of Labor Migration and Urban Unemployment in LessDeveloped Countries," American Economic Review (Nashville, Tennessee),Vol. 59 (March 1969), pp. 138-48.
©International Monetary Fund. Not for Redistribution
11Are Export Duties Optimal in
Developing Countries?
Some Supply-Side Considerations
Fernando Sanchez-Ugarte and Jitendra R. Modi
Export duties play an important role in the revenue structures of devel-oping countries. For these countries, export duties are a useful tool forraising revenue, since compared with their enormous financing needs forsocial and economic development they generally have few tax bases attheir disposal and also are hampered by their limited capacity for tax ad-ministration. Government budgets in a number of developing countriesrely rather heavily on export duties, accounting for more than 1 percent ofgross domestic product (GDP) and, with some minor exceptions, exceed-ing 10 percent of total tax revenue.1 In most cases, export tax receipts arederived from high rates of taxes on one or two commodities that featureprominently in the exports of these countries. Frequently, export duties indeveloping countries are levied in lieu of income taxes on exporters and arejustified on grounds of the ease of tax administration. They are also gener-ally made progressive with respect to export prices, and thereby incomesearned by exporters; this is justified on grounds of equity and needs formacroeconomic stabilization. Furthermore, exports from developingcountries are frequently subject to implicit export duties in the form ofovervalued or multiple exchange rates, producer price ceilings, and quan-titative restrictions on exports. These implicit export duties probably leadto a reduction in the level of exports even though they often do not yieldfiscal revenue.
1The Annex to this chapter contains summary information on the levels and structure ofexport duties prevalent in many developing countries. For a review of the quantitative charac-teristics of the tax systems of developing countries, including export taxes, see Tanzi (1987).
279
©International Monetary Fund. Not for Redistribution
280 FERNANDO SANCHEZ-UGARTE • JITENDRA R. MODI
Supply-side economists stress the negative effects of high and progres-sive taxes on the incentives to work, save, and invest.2 Their argument,however, specifically relates to income taxes and not export duties, whichare frequently levied in developing countries in lieu of income tax on ex-porters. Because export duties can have important effects on producer in-centives, significant supply-side effects can occur.3 A straightforward ap-plication of supply-side economics to export taxation would call for thereduction of high export duties existing in many developing countries tocreate incentives to produce and export and to generate private incomesand increase employment. In fact, from the point of view of world eco-nomic efficiency, the first-best policy would be to remove all restrictions onworld trade and even remove rather than reduce export duties. Hence, thesupply-side prescription of lowering or even eliminating export dutieswould go hand-in-hand with the economic efficiency criterion for the use ofworld resources.
A country might argue that there is some justification for the levy ofexport duties under certain circumstances. First, it might possess marketpower in a certain commodity market and be tempted to increase its eco-nomic well-being at the expense of the welfare of the importing countriesby imposing an export duty. Second, a tax on exports can be levied to ab-sorb windfall profits, if any, and as long as it does not affect economicbehavior it could be nondistortionary. However, as this paper shows, tomeet this objective, the tax has to be "unexpected" by the economicagents. Finally, export taxes can also be levied to stabilize producer in-comes over time and, under certain conditions, this type of taxation can be"efficient."
Following the argumentation underlying the first justification, the paperestimates country optimal export duties for a number of developing coun-tries by commodity and compares them with the actual effective level ofexport taxes that incorporates, wherever possible, the effect of both ex-plicit and implicit export duties. The comparison shows that for most casesthe actual level of export taxation is higher than the level that can be con-
2See Gandhi (Chapter 9) for a review of the main issues regarding the application of supply-side economics to the tax levels and structures of developing countries.
3There is little reference to export taxes in the public finance literature; however, there is animplicit belief by some public finance specialists that such taxes are more closely related toincome (or direct) taxes than to excise (or indirect) taxes. See, for instance, Prest (1972), whoargues that insofar as such taxes do not cover output assigned to the home market, they areonly a partial substitute for income taxation of agricultural producers. In the internationaltrade literature, they are treated as equivalent to import tariffs because from a general equi-librium point of view export duties and import tariffs reduce the size of the internationaltrade sector. See Corden (1974).
©International Monetary Fund. Not for Redistribution
OPTIMALITY OF EXPORT DUTIES 281
sidered even country optimal, let alone world optimal. Furthermore, giventhe small but significant values of the supply elasticities, the paper alsoshows that export taxation substantially lowers exports. Finally, the paperpresents information for selected developing countries that suggests thatthe use of export duties to stabilize producer incomes does not necessarilyreduce risk and can have a detrimental effect on the incentives to produce.
Section I of the chapter describes the rationality for export duties in de-veloping countries. Section II develops a methodology for estimating coun-try optimal export duties and for measuring the supply-side effects of ex-port taxation.
In Section III, an attempt is made to illustrate (it must be stressed that itis only an illustration) the application of the methodology developed inSection II to the measurement of the supply-side effects of export taxationprevalent in many developing countries. The section also notes importantqualifications that must be borne in mind when interpreting the results ofthis exercise. The section concludes with an analysis of the impact of coun-try-specific commodity stabilization schemes.
Section IV sums up the major findings of the study and discusses theways in which existing export taxes could be modified from the standpointof supply-side objectives. The chapter concludes with an annex, whichpresents the levels and structure of export duties in selected developingcountries.
I. The Rationale for Export Taxes
Developing countries apply export taxes for many reasons,4 amongwhich the most important are (1) to limit exports to take advantage of themonopoly power in a certain market or to benefit from other market im-perfections; (2) to raise revenue from export commodities; and (3) to stabi-lize producer incomes.5 This section describes these arguments and showsthat export duties used in connection with (1) may increase the welfare ofthe country while reducing that of the rest of the world; export duties usedin connection with (2) may distort economic efficiency in general; and ex-port duties used in connection with (3) may improve a country's economicwelfare without lowering the welfare of the rest of the world.
4See Aguirre, Griffith, and Yucelik (1981), Goode, Lent, and Ojha (1966), Goode (1984),and Tanzi (1976), who discuss extensively the role of export duties in developing countries.
5Export duties are also used to promote the growth of the untaxed activities by changing theproducer terms of trade against traditional exports. This rationale for export duties is notpursued here since import tariffs are more commonly employed for this purpose. See Corden(1974).
©International Monetary Fund. Not for Redistribution
282 FERNANDO SANCHEZ-UGARTE • JITENDRA R. MODI
Export Duties and Market Imperfections
The literature focuses on two kinds of market imperfections: those relat-ing to the existence of some form of monopoly power in the commoditymarket (the optimal tariff argument) and those arising from protectionismon the part of consuming or importing countries and from other restric-tions in commodity markets.
Monopoly Power of the Exporter
The optimal export duty argument is that a given country, or a group ofcountries, with monopoly power in the world market of a commodityshould levy an export duty to extract monopoly profits6 and thus to obtaina net welfare gain. The export duty, however, will improve the welfare ofthe individual country that exerts monopoly power but not of the world as awhole. Partial equilibrium analysis shows that the level of taxation that canbe considered country optimal (i.e., that will maximize the gain to an ex-porting country) equalizes the marginal revenue and the marginal cost ofexporting the commodity as given by the inverse elasticity rule7 (Figure 1):
where tik is the country optimal ad valorem export duty on the f.o.b. price
of the export commodity k and nik is the country-specific long-run elasticity
of demand for exports of the taxed commodity. The country in questiondoes not have to be a "pure" monopolist in the export market for the opti-mal tariff argument to apply.
Protection by Importing Countries and Other Restrictions onTrade in Commodity Markets
Importing countries often protect domestic producers of particular com-modities by restricting the volume of imports through import quotas orother means.8 Furthermore, producing countries have signed agreements,sometimes with the participation of major consumers, to stabilize and reg-ulate commodity markets by means of restrictions on the level of exports byassigning export quotas to producing countries or by relying on interna-
6Quotas can also be used instead but in that event monopoly profits accrue to individualproducers rather than to the government.
7See Corden (1974) and Johnson (1968).8For instance, domestic sugar production is protected in the European Community (EC)
countries and the United States; tobacco is protected in the United States; and rice is pro-tected in Japan.
©International Monetary Fund. Not for Redistribution
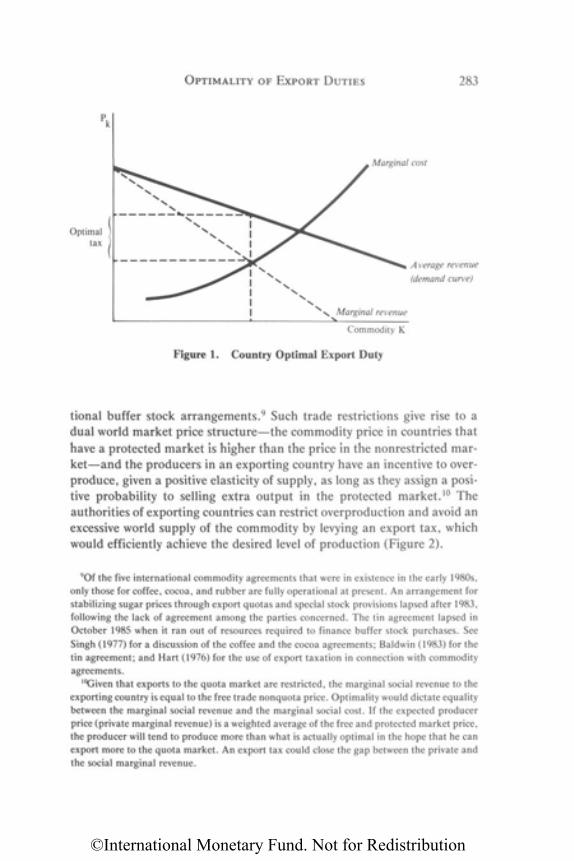
OPTIMALITY OF EXPORT DUTIES 283
Figure 1. Country Optimal Export Duty
tional buffer stock arrangements.9 Such trade restrictions give rise to adual world market price structure—the commodity price in countries thathave a protected market is higher than the price in the nonrestricted mar-ket—and the producers in an exporting country have an incentive to over-produce, given a positive elasticity of supply, as long as they assign a posi-tive probability to selling extra output in the protected market.10 Theauthorities of exporting countries can restrict overproduction and avoid anexcessive world supply of the commodity by levying an export tax, whichwould efficiently achieve the desired level of production (Figure 2).
9Of the five international commodity agreements that were in existence in the early 1980s,only those for coffee, cocoa, and rubber are fully operational at present. An arrangement forstabilizing sugar prices through export quotas and special stock provisions lapsed after 1983,following the lack of agreement among the parties concerned. The tin agreement lapsed inOctober 1985 when it ran out of resources required to finance buffer stock purchases. SeeSingh (1977) for a discussion of the coffee and the cocoa agreements; Baldwin (1983) for thetin agreement; and Hart (1976) for the use of export taxation in connection with commodityagreements.
10Given that exports to the quota market are restricted, the marginal social revenue to theexporting country is equal to the free trade nonquota price. Optimality would dictate equalitybetween the marginal social revenue and the marginal social cost. If the expected producerprice (private marginal revenue) is a weighted average of the free and protected market price,the producer will tend to produce more than what is actually optimal in the hope that he canexport more to the quota market. An export tax could close the gap between the private andthe social marginal revenue.
©International Monetary Fund. Not for Redistribution
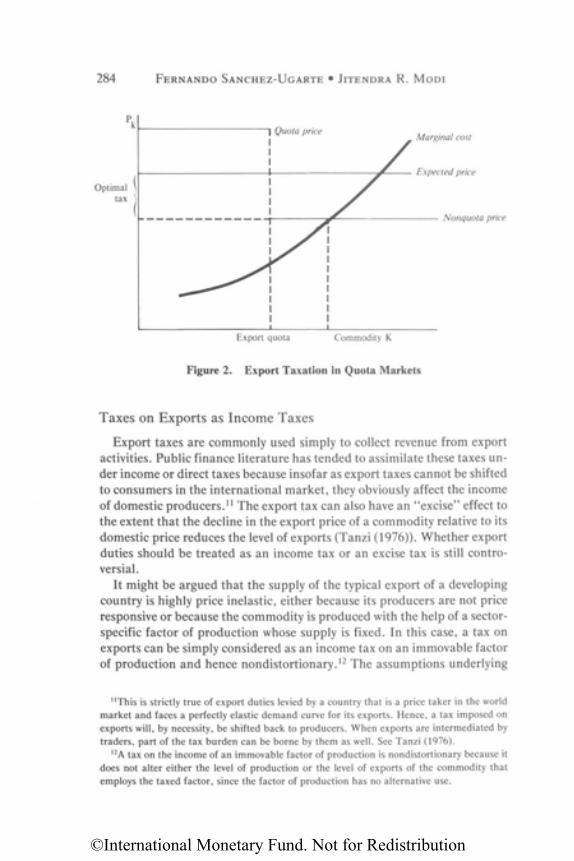
284 FERNANDO SANCHEZ-UGARTE • JITENDRA R. MODI
Figure 2. Export Taxation in Quota Markets
Taxes on Exports as Income Taxes
Export taxes are commonly used simply to collect revenue from exportactivities. Public finance literature has tended to assimilate these taxes un-der income or direct taxes because insofar as export taxes cannot be shiftedto consumers in the international market, they obviously affect the incomeof domestic producers.11 The export tax can also have an "excise" effect tothe extent that the decline in the export price of a commodity relative to itsdomestic price reduces the level of exports (Tanzi (1976)). Whether exportduties should be treated as an income tax or an excise tax is still contro-versial.
It might be argued that the supply of the typical export of a developingcountry is highly price inelastic, either because its producers are not priceresponsive or because the commodity is produced with the help of a sector-specific factor of production whose supply is fixed. In this case, a tax onexports can be simply considered as an income tax on an immovable factorof production and hence nondistortionary.12 The assumptions underlying
11This is strictly true of export duties levied by a country that is a price taker in the worldmarket and faces a perfectly elastic demand curve for its exports. Hence, a tax imposed onexports will, by necessity, be shifted back to producers. When exports are intermediated bytraders, part of the tax burden can be borne by them as well. See Tanzi (1976).
12A tax on the income of an immovable factor of production is nondistortionary because itdoes not alter either the level of production or the level of exports of the commodity thatemploys the taxed factor, since the factor of production has no alternative use.
©International Monetary Fund. Not for Redistribution
OPTIMALITY OF EXPORT DUTIES 285
this conclusion can be questioned. With respect to the first point, there isample empirical evidence that the supply of export commodities is affectedby the producer price.13 With respect to the second point, it can be arguedthat even when an export duty is fully capitalized in the price of an immov-able factor of production (say, land), it still can have undesirable "excise"or supply-side effects.14
In the long run, an export duty imposed on an activity that employs animmovable factor of production will tend to be fully capitalized in the priceof this factor of production—a result which may seem to indicate that thetax is nondistortionary.15 The output of the taxed commodity, however,will tend to decrease because the export duty reduces the producer price ofexport goods compared with other goods and thus creates a distortion. It isthe contraction in the level of output of the export good that reduces theprice of the immovable factor of production. Furthermore, the export taxwill create a "wedge" between the international price and the price paid bydomestic consumers, creating an additional distortion. Hence, notwith-standing the fact that the export tax is fully shifted back to the immovablefactor of production, the tax still can have excise effects; that is, it distortsthe production and the consumption decision. To this extent, the exporttax in the long run is not necessarily equivalent to a tax on the income ofthe immovable factor of production. In the more general case, when theexport sector employs factors of production that are movable across sec-tors, the distortionary effects of the export tax are straightforward.
It might also be argued that over the short run, unexpected increases inthe international price of an export commodity can sometimes lead to tem-porary "windfall" gains to exporters that can be taxed through an exportduty.16,17 This tax is presumed to be nondistortionary and, some might ar-gue, the windfall gains are "unnecessary" to induce the given level of ex-ports. For the analysis here, the distinction should be made between sys-tematic (expected) and unsystematic (unexpected) tax policy changes. Asystematic export duty that applies when prices are above a certain "nor-mal" level will discourage production and exports because if the market is,
l3The section on "Estimation of Country Optimal Export Taxes," below, presents the elas-ticities of supply of export commodities that have been estimated in the literature for develop-ing countries; they are all positive, though small.
14The land used in the production of certain cash crops is not necessarily suitable for theproduction of other crops.
15Owing to space considerations, the proof of this proposition is not included here. SeeMussa (1974) who derives the above result for an import duty.
16See Davis (1980) who analyzes the resurgence of export taxation in developing countriesafter the second oil crisis and the increase in commodity prices in the late 1970s.
17For the sake of symmetry, this argument would require that producers are subsidizedwhen a windfall loss occurs.
©International Monetary Fund. Not for Redistribution
286 FERNANDO SANCHEZ-UGARTE • JITENDRA R. MODI
by and large, competitive, there will be no "excess" profits in the long run,as good years will balance out the bad ones.18 In addition, any systematic,though temporary, export tax policy with respect to windfall gains willsooner or later be incorporated by producers in their expectations, distort-ing their economic behavior. Only the taxation of profits, resulting fromunsystematic changes, will have no effect on producers' behavior concern-ing exports, although it might make smuggling more profitable.
Devaluation of the exchange rate can generate windfall profits for ex-porters, similar to the unexpected increase in the international price of acommodity described above; however, it will also raise the cost of importsand other costs to the exporter. Therefore, it should not be assumed auto-matically that after a devaluation exports must always be taxed addition-ally. In fact, the levy of an export tax after devaluation can hamper theachievement of an increase in exports needed to restore the balance oftrade equilibrium, which was the primary reason for the devaluation.
Export Duties in Connection withStabilization Schemes
Developing countries can also rationally use export taxes in connectionwith three kinds of stabilization schemes: (1) the stabilization of the inter-national price of a commodity or group of commodities, especially in sup-port of international commodity agreements; (2) the stabilization of for-eign exchange export earnings derived from the exports of one commodityor group of commodities; and (3) the stabilization of the domestic con-sumer price of a traded or exportable commodity.19
The economic efficiency arguments in favor of commodity stabilizationefforts are well known. It has been stated that the free market solutiondoes not necessarily allocate resources efficiently because there are no per-fect and complete futures and risk markets and there is no perfect infor-mation. Hence, market intervention is called for. The first-best solutionwould be to encourage the development of efficient futures and insurance
18The international price of a commodity is a random variable. Even though one mightattempt to forecast future values, nobody can predict with certainty the price of a commodityat every moment of time. For some commodities there are futures or forward markets whichallow producers to reduce the risk involved in the production process, but these markets donot work as efficiently for all types of commodities.
19Stabilization efforts in these areas have been attempted by a number of developing coun-tries mostly through marketing boards, but export taxes have also been used as one of severalcomplementary policy instruments to attain the desired goal. The effect of country-specificcommodity stabilization schemes on the level and the variability of producer prices is ana-lyzed in the section on "Impact of Stabilization Schemes," below.
©International Monetary Fund. Not for Redistribution
OPTIMALITY OF EXPORT DUTIES 287
markets. If this is not feasible, as a second-best solution, a commoditystabilization scheme can, under certain conditions, improve domestic eco-nomic welfare.20 Since it is reasonable to assume that economic agents gen-erally, and exporters in particular, are risk averse, a commodity stabiliza-tion program that reduces the variability of the permanent income ofexporters without reducing the mean21 will improve welfare.22 Even whenthe administrative costs of the stabilization scheme are taken into account,exporters could be better off as long as the cost of administration does notexceed the welfare gain from reduced riskiness. Risk averse consumers canalso benefit from domestic price stabilization. Finally, from a macroeco-nomic point of view, the stabilization of foreign exchange earnings can alsolead to welfare gains for both producers and domestic consumers. Notice,however, that an efficient export tax used to attain commodity stabiliza-tion will not yield tax revenue in net present value terms.
The commodity stabilization schemes can also conceivably have an ad-verse effect on the economy in two main respects, namely, the size of thelevy on producers and the uses to which the proceeds of the levy are putrelative to what the producer would have done with it if he had not beensubject to such an impost.23 With respect to the size of the levy, the point isthat a high level of export duty implicit in the stabilization levy may ad-versely affect the producer's incentive to produce the commodity con-cerned—the actual impact being dependent on the supply elasticity. Sec-ond, with respect to the use of the levy, the adverse impact may stem fromthe fact that the outlays undertaken by the stabilization scheme are muchless productive (in terms of additional output generated) than those whichthe producer would most probably have undertaken in the absence of thelevy.
II. Methodology for Estimating Country OptimalExport Duties and Their Effects
This section develops a methodology derived from the optimal exportduty argument for estimating the country optimal level of export taxation
20See Newbery and Stiglitz (1981) for the economic rationale for stabilization.21Helleiner (1964) and (1966a) examined the role of commodity marketing boards in
Nigeria in stabilizing prices paid to producers and their incomes.22See Newbery and Stiglitz (1981) for cases where the stabilization of prices is likely to lead
to the stabilization of incomes. Johnson (1977) makes a case where price stabilization aroundthe trend will decrease revenue, since the supply curve of exports is upward sloping. SeeBehrman (1977) for the generalization of the Johnson result.
23See Helleiner (1966b, Chapter 6) for this line of approach.
©International Monetary Fund. Not for Redistribution
288 FERNANDO SANCHEZ-UGARTE • JITENDRA R. MODI
by commodity. Thus, optimality in this section, and throughout the re-mainder of the paper, is understood in this limited sense incorporatingonly the optimal export duty argument (see section on ''Monopoly Power ofthe Exporter," above). It should be recalled at this stage that the optimalexport duty is only optimal from the point of view of the country that im-poses it; it is not optimal from the point of view of the world as a whole. Bycomparing the actual level with the optimal level of export taxation esti-mated with the help of the methodology developed below (data on theformer are given in the Annex), it is possible to indicate the distortionaryeffect of export taxation of a given country on the level of its exports and tomeasure the supply effect of export duties.
Country Optimal Export Duties
As mentioned in Section I, the country optimal export duty (t*ik) on com-
modity k by country i, which faces a less than perfectly elastic demandcurve, is given by the inverse elasticity rule:
In equation (1), nik is the absolute value of the country-specific long-run
elasticity of demand of commodity k. Most of the demand elasticities havebeen estimated in the literature for commodity markets and not for indi-vidual countries. The following formula, based on partial equilibrium con-siderations, therefore, transforms the market elasticity of demand of acommodity into the country-specific elasticity of demand for the samecommodity.24 As can be seen, the country-specific elasticity of demand ishigher in absolute terms than the market demand elasticity:
(1)
(2)
(3)
where ejk is the long-run elasticity of supply of exports of commodity k bycountry j . By substituting the estimated value of equations (2) and (3) into
24Equations (2) and (3) result from the logarithmic changes of exports of commodity k byeach exporting country resulting from a given change in the export price.
©International Monetary Fund. Not for Redistribution
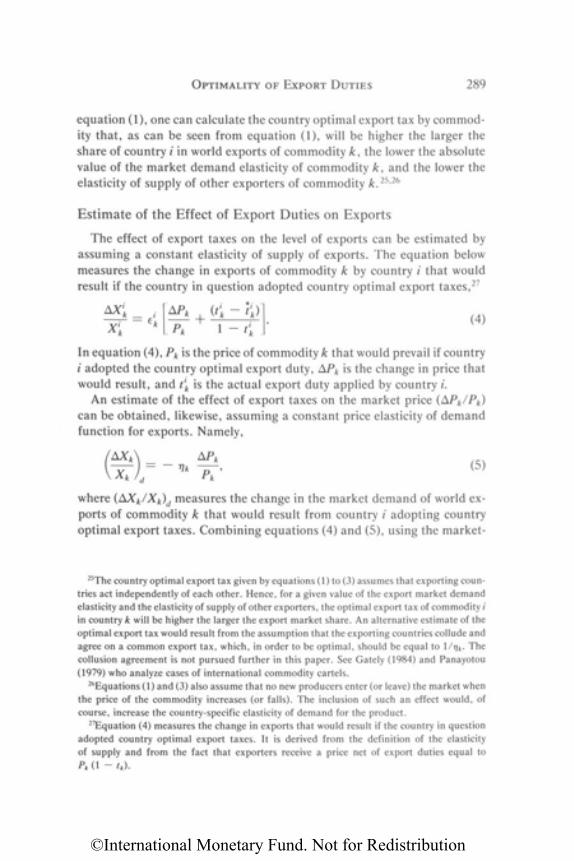
OPTIMALITY OF EXPORT DUTIES 289
equation (1), one can calculate the country optimal export tax by commod-ity that, as can be seen from equation (1), will be higher the larger theshare of country i in world exports of commodity k, the lower the absolutevalue of the market demand elasticity of commodity k, and the lower theelasticity of supply of other exporters of commodity k.25,26
Estimate of the Effect of Export Duties on Exports
The effect of export taxes on the level of exports can be estimated byassuming a constant elasticity of supply of exports. The equation belowmeasures the change in exports of commodity k by country i that wouldresult if the country in question adopted country optimal export taxes,27
(4)
In equation (4), Pk is the price of commodity k that would prevail if countryi adopted the country optimal export duty, APk is the change in price thatwould result, and t'k is the actual export duty applied by country i.
An estimate of the effect of export taxes on the market price (APk/Pk)can be obtained, likewise, assuming a constant price elasticity of demandfunction for exports. Namely,
(5)
where (AXk/Xk)d measures the change in the market demand of world ex-ports of commodity k that would result from country i adopting countryoptimal export taxes. Combining equations (4) and (5), using the market-
25The country optimal export tax given by equations (1) to (3) assumes that exporting coun-tries act independently of each other. Hence, for a given value of the export market demandelasticity and the elasticity of supply of other exporters, the optimal export tax of commodity iin country k will be higher the larger the export market share. An alternative estimate of theoptimal export tax would result from the assumption that the exporting countries collude andagree on a common export tax, which, in order to be optimal, should be equal to 1/nk. Thecollusion agreement is not pursued further in this paper. See Gately (1984) and Panayotou(1979) who analyze cases of international commodity cartels.
26Equations (1) and (3) also assume that no new producers enter (or leave) the market whenthe price of the commodity increases (or falls). The inclusion of such an effect would, ofcourse, increase the country-specific elasticity of demand for the product.
27Equation (4) measures the change in exports that would result if the country in questionadopted country optimal export taxes. It is derived from the definition of the elasticityof supply and from the fact that exporters receive a price net of export duties equal toPk (1 - tk).
©International Monetary Fund. Not for Redistribution
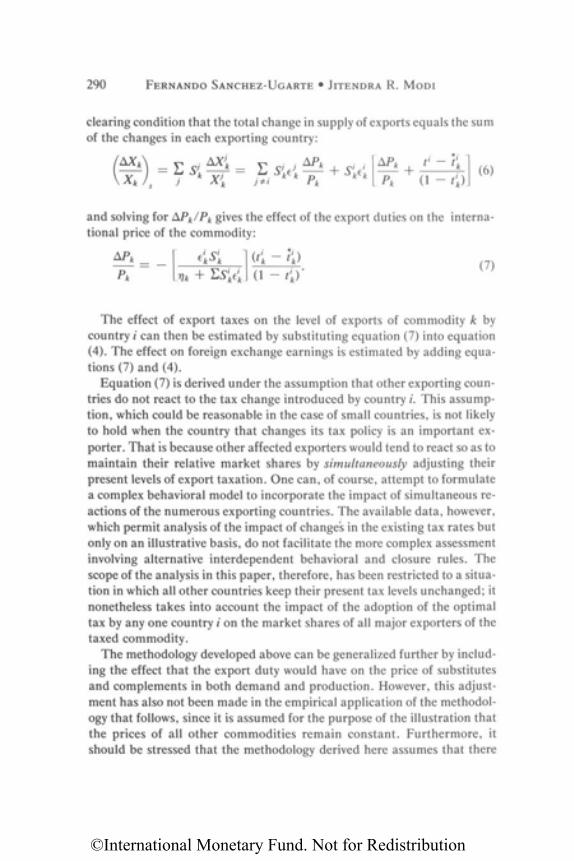
290 FERNANDO SANCHEZ-UGARTE • JITENDRA R. MODI
clearing condition that the total change in supply of exports equals the sumof the changes in each exporting country:
and solving for APk/Pk gives the effect of the export duties on the interna-tional price of the commodity:
The effect of export taxes on the level of exports of commodity k bycountry i can then be estimated by substituting equation (7) into equation(4). The effect on foreign exchange earnings is estimated by adding equa-tions (7) and (4).
Equation (7) is derived under the assumption that other exporting coun-tries do not react to the tax change introduced by country i. This assump-tion, which could be reasonable in the case of small countries, is not likelyto hold when the country that changes its tax policy is an important ex-porter. That is because other affected exporters would tend to react so as tomaintain their relative market shares by simultaneously adjusting theirpresent levels of export taxation. One can, of course, attempt to formulatea complex behavioral model to incorporate the impact of simultaneous re-actions of the numerous exporting countries. The available data, however,which permit analysis of the impact of changes in the existing tax rates butonly on an illustrative basis, do not facilitate the more complex assessmentinvolving alternative interdependent behavioral and closure rules. Thescope of the analysis in this paper, therefore, has been restricted to a situa-tion in which all other countries keep their present tax levels unchanged; itnonetheless takes into account the impact of the adoption of the optimaltax by any one country i on the market shares of all major exporters of thetaxed commodity.
The methodology developed above can be generalized further by includ-ing the effect that the export duty would have on the price of substitutesand complements in both demand and production. However, this adjust-ment has also not been made in the empirical application of the methodol-ogy that follows, since it is assumed for the purpose of the illustration thatthe prices of all other commodities remain constant. Furthermore, itshould be stressed that the methodology derived here assumes that there
(6)
(7)
©International Monetary Fund. Not for Redistribution
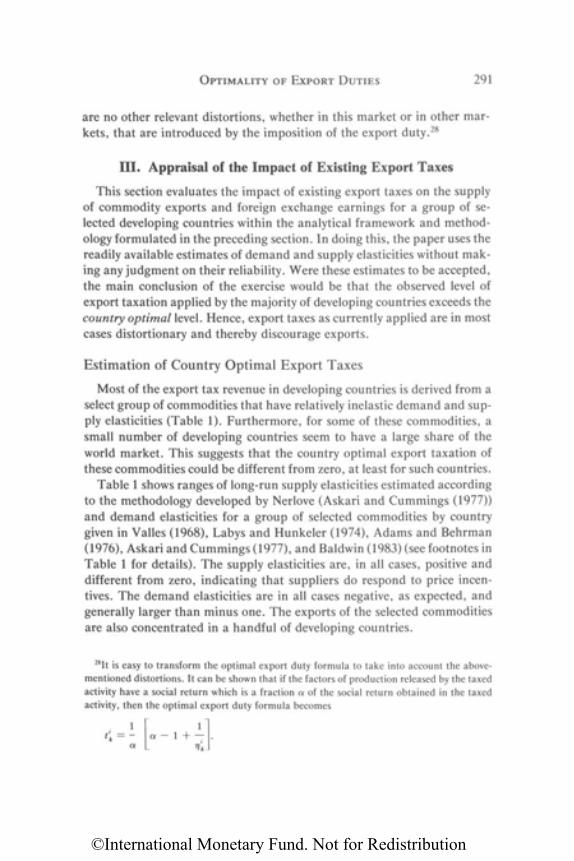
OPTIMALITY OF EXPORT DUTIES 291
are no other relevant distortions, whether in this market or in other mar-kets, that are introduced by the imposition of the export duty.28
III. Appraisal of the Impact of Existing Export Taxes
This section evaluates the impact of existing export taxes on the supplyof commodity exports and foreign exchange earnings for a group of se-lected developing countries within the analytical framework and method-ology formulated in the preceding section. In doing this, the paper uses thereadily available estimates of demand and supply elasticities without mak-ing any judgment on their reliability. Were these estimates to be accepted,the main conclusion of the exercise would be that the observed level ofexport taxation applied by the majority of developing countries exceeds thecountry optimal level. Hence, export taxes as currently applied are in mostcases distortionary and thereby discourage exports.
Estimation of Country Optimal Export Taxes
Most of the export tax revenue in developing countries is derived from aselect group of commodities that have relatively inelastic demand and sup-ply elasticities (Table 1). Furthermore, for some of these commodities, asmall number of developing countries seem to have a large share of theworld market. This suggests that the country optimal export taxation ofthese commodities could be different from zero, at least for such countries.
Table 1 shows ranges of long-run supply elasticities estimated accordingto the methodology developed by Nerlove (Askari and Cummings (1977))and demand elasticities for a group of selected commodities by countrygiven in Valles (1968), Labys and Hunkeler (1974), Adams and Behrman(1976), Askari and Cummings (1977), and Baldwin (1983) (see footnotes inTable 1 for details). The supply elasticities are, in all cases, positive anddifferent from zero, indicating that suppliers do respond to price incen-tives. The demand elasticities are in all cases negative, as expected, andgenerally larger than minus one. The exports of the selected commoditiesare also concentrated in a handful of developing countries.
28It is easy to transform the optimal export duty formula to take into account the above-mentioned distortions. It can be shown that if the factors of production released by the taxedactivity have a social return which is a fraction a of the social return obtained in the taxedactivity, then the optimal export duty formula becomes
©International Monetary Fund. Not for Redistribution
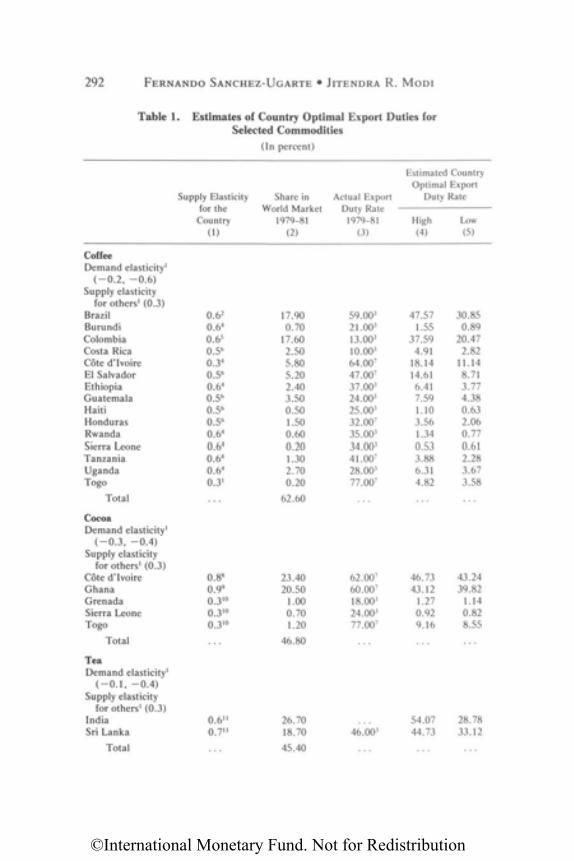
292 FERNANDO SANCHEZ-UGARTE • JITENDRA R. M O D I
Table 1. Estimates of Country Optimal Export Duties forSelected Commodities
(In percent)
CoffeeDemand elasticity1
(-0.2, -0.6)Supply elasticity
for others1 (0.3)BrazilBurundiColombiaCosta RicaCote d'IvoireEl SalvadorEthiopiaGuatemalaHaitiHondurasRwandaSierra LeoneTanzaniaUgandaTogo
Total
CocoaDemand elasticity1
( -0 .3 , -0.4)Supply elasticity
for others1 (0.3)Cote d'IvoireGhanaGrenadaSierra LeoneTogo
Total
TeaDemand elasticity1
( - 0 . 1 , -0 .4 )Supply elasticity
for others1 (0.3)IndiaSri Lanka
Total
Supply Elasticityfor theCountry
(1)
0.62
0.64
0.6s
0.56
0.34
0.56
0.64
0.56
0.56
0.56
0.64
0.64
0.64
0.64
0.31
0.88
0.99
0.310
0.310
0.310
0.611
0.711
Share inWorld Market
1979-81(2)
17.900.70
17.602.505.805.202.403.500.501.500.600.201.302.700.20
62.60
23.4020.50
1.000.701.20
46.80
26.7018.70
45.40
Actual ExportDuty Rate
1979-81(3)
59.003
21.003
13.003
10.003
64.007
47.007
37.003
24.003
25.003
32.007
35.003
34.003
41.007
28.003
77.007
62.007
60.007
18.003
24.003
77.007
46.003
Estimated CountryOptimal Export
Duty Rate
High Low(4) (5)
47.571.55
37.594.91
18.1414.616.417.591.103.561.340.533.886.314.82
46.7343.12
1.270.929.16
54.0744.73
30.850.89
20.472.82
11.148.713.774.380.632.060.770.612.283.673.58
43.2439.82
1.140.828.55
28.7833.12
©International Monetary Fund. Not for Redistribution
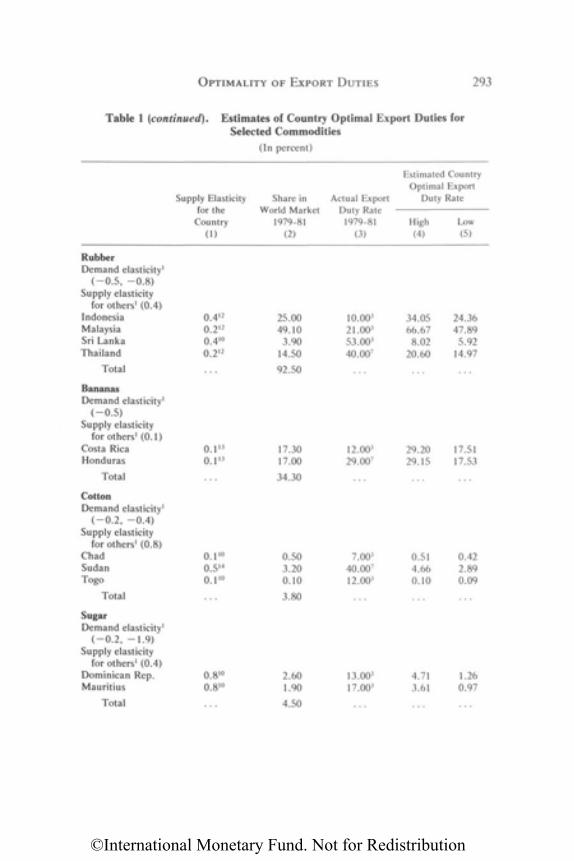
OPTIMALITY OF EXPORT DUTIES 293
Table 1 (continued). Estimates of Country Optimal Export Duties forSelected Commodities
(In percent)
RubberDemand elasticity1
( -0 .5 , -0 .8)Supply elasticity
for others1 (0.4)IndonesiaMalaysiaSri LankaThailand
Total
BananasDemand elasticity1
(-0.5)Supply elasticity
for others1 (0.1)Costa RicaHonduras
Total
CottonDemand elasticity1
( -0 .2 , -0 .4)Supply elasticity
for others1 (0.8)ChadSudanTogo
Total
SugarDemand elasticity1
( -0 .2 , -1 .9)Supply elasticity
for others1 (0.4)Dominican Rep.Mauritius
Total
Supply Elasticityfor theCountry
(1)
0.412
0.212
0.410
0.212
0.113
0.113
0.110
0.514
0.110
0.810
0.810
Share inWorld Market
1979-81(2)
25.0049.103.90
14.50
92.50
17.3017.00
34.30
0.503.200.10
3.80
2.601.90
4.50
Actual ExportDuty Rate
1979-81(3)
10.003
21.003
53.003
40.007
12.003
29.007
7.003
40.007
12.003
13.003
17.003
Estimated CountryOptimal Export
Duty Rate
High Low(4) (5)
34.0566.678.02
20.60
29.2029.15
0.514.660.10
4.713.61
24.3647.895.92
14.97
17.5117.53
0.422.890.09
1.260.97
©International Monetary Fund. Not for Redistribution
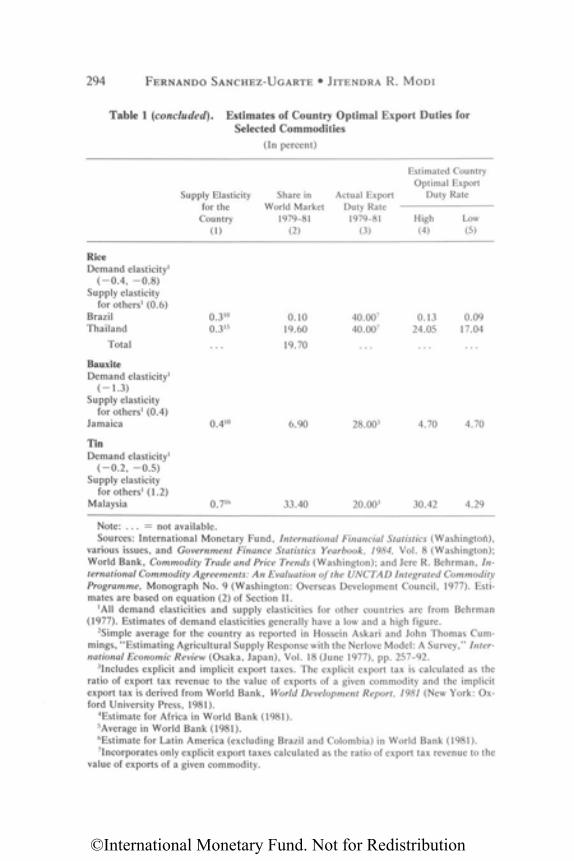
294 FERNANDO SANCHEZ-UGARTE • JITENDRA R. M O D I
Table 1 (concluded). Estimates of Country Optimal Export Duties forSelected Commodities
(In percent)
Note: . . . = not available.Sources: International Monetary Fund, International Financial Statistics (Washington),
various issues, and Government Finance Statistics Yearbook, 1984, Vol. 8 (Washington);World Bank, Commodity Trade and Price Trends (Washington); and Jere R. Behrman, In-ternational Commodity Agreements: An Evaluation of the UNCTAD Integrated CommodityProgramme, Monograph No. 9 (Washington: Overseas Development Council, 1977). Esti-mates are based on equation (2) of Section II.
1All demand elasticities and supply elasticities for other countries are from Behrman(1977). Estimates of demand elasticities generally have a low and a high figure.
2Simple average for the country as reported in Hossein Askari and John Thomas Cum-mings, "Estimating Agricultural Supply Response with the Nerlove Model: A Survey," Inter-national Economic Review (Osaka, Japan), Vol. 18 (June 1977), pp. 257-92.
3Includes explicit and implicit export taxes. The explicit export tax is calculated as theratio of export tax revenue to the value of exports of a given commodity and the implicitexport tax is derived from World Bank, World Development Report, 1981 (New York: Ox-ford University Press, 1981).
4Estimate for Africa in World Bank (1981).5Average in World Bank (1981).6Estimate for Latin America (excluding Brazil and Colombia) in World Bank (1981).7Incorporates only explicit export taxes calculated as the ratio of export tax revenue to the
value of exports of a given commodity.
RiceDemand elasticity1
(-0.4, -0.8)Supply elasticity
for others1 (0.6)BrazilThailand
Total
BauxiteDemand elasticity1
(-1.3)Supply elasticity
for others1 (0.4)Jamaica
TinDemand elasticity1
( -0 .2 , -0.5)Supply elasticity
for others1 (1.2)Malaysia
Supply Elasticityfor theCountry
(1)
0.310
0.315
0.410
0.716
Share inWorld Market
1979-81(2)
0.1019.60
19.70
6.90
33.40
Actual ExportDuty Rate1979-81
(3)
40.007
40.007
28.003
20.003
Estimated CountryOptimal Export
Duty Rate
High Low(4) (5)
0.1324.05
4.70
30.42
0.0917.04
4.70
4.29
©International Monetary Fund. Not for Redistribution
OPTIMALITY OF EXPORT DUTIES 295
Table 1 also shows estimates of actual average export duty rates by com-modity and by country. In the cases where information was available, theactual export duty rates incorporate both explicit and implicit export du-ties (see Table 8 for details on implicit export duties); in other cases onlyexplicit export duties were considered. Hence, tax rates shown in column 4are not fully comparable across commodities and countries.
The last column of Table 1 shows the authors' estimates of country opti-mal export taxes, by country, for commonly taxed export commodities,based on the methodology derived in Section II.29
The values of supply and demand elasticities and market shares arecombined through equations (1), (2), and (3) to estimate the country opti-mal export duty for each commodity. Since the changes in tax rates simu-lated in this section give rise to changes in market shares, an iterative pro-cedure is used to reflect these changes. Hence, country optimal exportduties are first calculated for each country using historical data on the ob-served market shares. The export tax is adjusted to the level that is countryoptimal, giving rise to a change in price and exports that is reflected in themarket shares. The new shares are then used to recalculate the countryoptimal export taxes again; this procedure is repeated over and over. Theresults are shown as high and low estimates, using the high and low valuesfor the elasticity of demand that appear in the first column of Table 1. Itgoes without saying that the estimated optimal tax rates given in Table 1should be interpreted with extreme caution, as the reliability of the elastic-ity estimates compiled in that table has not been checked. The estimatedoptimal tax rates should at best be considered illustrative of the way themethodology developed in this paper can be used; this point cannot be
29For a similar approach to estimating optimal export taxes see Tolley, Thomas, and Wong(1982) who estimate optimal export taxes for Thailand's rice and Repetto (1972) who studiesthe taxation of jute in Bangladesh.
8Estimate for Cote d'lvoire reported in Askari and Cummings (1977).9Average for Ghana in Askari and Cummings (1977).10See Behrman (1977).11Reported in W. Labys and J. Hunkeler, "Survey of Commodity Demand and Supply
Elasticities," United Nations Conference on Trade and Development, Research Memoran-dum No. 48 (unpublished, March 19, 1974).
12As reported for individual countries in Askari and Cummings (1977).13See Jean Paul Valles, The World Market for Bananas, 1964-72: Outlook for Demand,
Supply, and Prices (New York: Praeger, 1968).14Reported for Sudan in Askari and Cummings (1977).15Average reported in Askari and Cummings (1977).16Reported in William L. Baldwin, The World Tin Market: Political Pricing and Economic
Competition (Durham, North Carolina: Duke University Press, 1983).
©International Monetary Fund. Not for Redistribution
296 FERNANDO SANCHEZ-UGARTE • JITENDRA R. MODI
overemphasized. Determining the specific optimal tax rates for any exportcommodity, by country, requires that accurate and country specific elastic-ity estimates be made and more detailed study conducted, neither of whichthe authors have done in this paper.
Subject to this qualification, the main results derived from analyzing theestimated optimal tax rates given in Table 1 are as follows.
First, as far as the levels of export taxation in developing countries areconcerned, the country optimal export tax rates for selected export com-modities, which include coffee, cocoa, rubber, tea, bananas, and tin, aregreater than zero for several countries. These commodities frequently haverelatively inelastic demand and supply schedules. As is apparent from Ta-ble 1, the production of a few export commodities is concentrated heavilyin a handful of developing countries; consequently, the estimated countryoptimal tax rates are high for a few countries, which are the main pro-ducers. If the illustrative estimates given in Table 1 are to be relied upon,Colombia and Brazil could tax coffee at a marginal rate between 20 per-cent and 48 percent; Ghana and Cote dTvoire could tax cocoa at a ratebetween 40 percent and 45 percent; and Malaysia could tax rubber exportsand India could tax tea exports at a rate of about 50 percent. The rates forthe smaller producers, however, are considerably lower than those calcu-lated for the main producers. For instance, for 22 of the 37 cases analyzedin Table 1, the country optimal export duty rates estimated under the highassumption are below 10 percent, and for 17 of the cases, the country opti-mal export duty rates estimated under the high assumption are below 5percent.
Second, the information given in the third column of Table 1 and theAnnex shows that developing countries generally tax the exports of thosecommodities that can be taxed according to the country optimal criteria.However, the levels of taxation adopted by individual countries do notseem to correspond to the estimated country optimal tax levels. Most de-veloping countries seem to overtax exports as a result of high "explicit"and "implicit" export taxes (see Table I).30 There are 31 cases, out of atotal of 37 in Table 1, in which export taxes exceed the estimated countryoptimal level of taxation.
The empirical evidence, therefore, shows that the majority of developingcountries in the sample are overtaxing exports and further that, in general,the observed level of export taxation cannot be justified on the basis of the
30Note that, strictly speaking, the country optimal export duty should be compared againstthe marginal tax rates on exports. No information is available on the latter. However, it isgenerally safe to assume that the marginal export tax rate is higher than the average, so thatthe comparison in Table 1 underestimates the extent of the overtaxation of exports.
©International Monetary Fund. Not for Redistribution
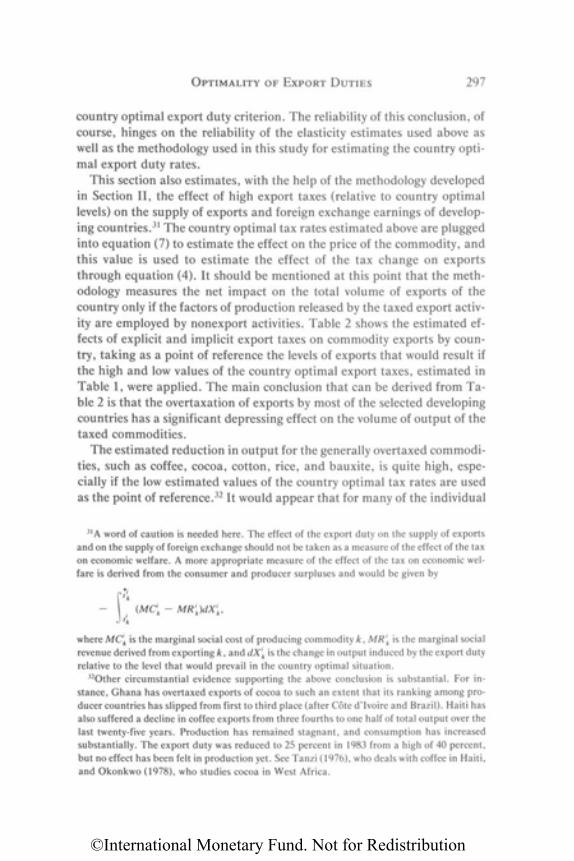
OPTIMALITY OF EXPORT DUTIES 297
country optimal export duty criterion. The reliability of this conclusion, ofcourse, hinges on the reliability of the elasticity estimates used above aswell as the methodology used in this study for estimating the country opti-mal export duty rates.
This section also estimates, with the help of the methodology developedin Section II, the effect of high export taxes (relative to country optimallevels) on the supply of exports and foreign exchange earnings of develop-ing countries.31 The country optimal tax rates estimated above are pluggedinto equation (7) to estimate the effect on the price of the commodity, andthis value is used to estimate the effect of the tax change on exportsthrough equation (4). It should be mentioned at this point that the meth-odology measures the net impact on the total volume of exports of thecountry only if the factors of production released by the taxed export activ-ity are employed by nonexport activities. Table 2 shows the estimated ef-fects of explicit and implicit export taxes on commodity exports by coun-try, taking as a point of reference the levels of exports that would result ifthe high and low values of the country optimal export taxes, estimated inTable 1, were applied. The main conclusion that can be derived from Ta-ble 2 is that the overtaxation of exports by most of the selected developingcountries has a significant depressing effect on the volume of output of thetaxed commodities.
The estimated reduction in output for the generally overtaxed commodi-ties, such as coffee, cocoa, cotton, rice, and bauxite, is quite high, espe-cially if the low estimated values of the country optimal tax rates are usedas the point of reference.32 It would appear that for many of the individual
31A word of caution is needed here. The effect of the export duty on the supply of exportsand on the supply of foreign exchange should not be taken as a measure of the effect of the taxon economic welfare. A more appropriate measure of the effect of the tax on economic wel-fare is derived from the consumer and producer surpluses and would be given by
where MCik is the marginal social cost of producing commodity k, MRik is the marginal socialrevenue derived from exporting k, and dXik is the change in output induced by the export dutyrelative to the level that would prevail in the country optimal situation.
32Other circumstantial evidence supporting the above conclusion is substantial. For in-stance, Ghana has overtaxed exports of cocoa to such an extent that its ranking among pro-ducer countries has slipped from first to third place (after Cote d'lvoire and Brazil). Haiti hasalso suffered a decline in coffee exports from three fourths to one half of total output over thelast twenty-five years. Production has remained stagnant, and consumption has increasedsubstantially. The export duty was reduced to 25 percent in 1983 from a high of 40 percent,but no effect has been felt in production yet. See Tanzi (1976), who deals with coffee in Haiti,and Okonkwo (1978), who studies cocoa in West Africa.
©International Monetary Fund. Not for Redistribution
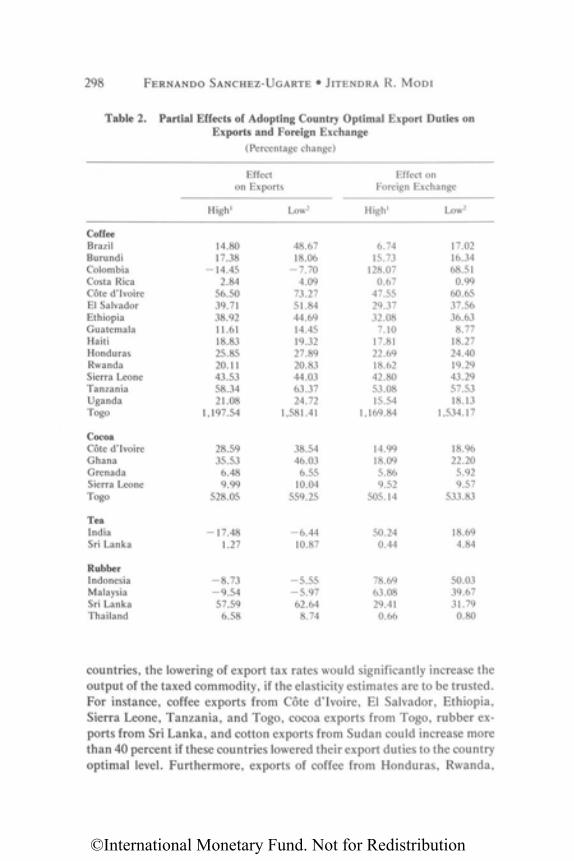
298 FERNANDO SANCHEZ-UGARTE • JITENDRA R. M O D I
Table 2. Partial Effects of Adopting Country Optimal Export Duties onExports and Foreign Exchange
(Percentage change)
countries, the lowering of export tax rates would significantly increase theoutput of the taxed commodity, if the elasticity estimates are to be trusted.For instance, coffee exports from Cote d'Ivoire, El Salvador, Ethiopia,Sierra Leone, Tanzania, and Togo, cocoa exports from Togo, rubber ex-ports from Sri Lanka, and cotton exports from Sudan could increase morethan 40 percent if these countries lowered their export duties to the countryoptimal level. Furthermore, exports of coffee from Honduras, Rwanda,
Effecton Exports
Effect onForeign Exchange
High1 Low2 High1 Low2
CoffeeBrazilBurundiColombiaCosta RicaCote d'lvoireEl SalvadorEthiopiaGuatemalaHaitiHondurasRwandaSierra LeoneTanzaniaUgandaTogo
CocoaCote d'IvoireGhanaGrenadaSierra LeoneTogo
TeaIndiaSri Lanka
RubberIndonesiaMalaysiaSri LankaThailand
14.8017.38
-14.452.84
56.5039.7138.9211.6118.8325.8520.1143.5358.3421.08
1,197.54
28.5935.53
6.489.99
528.05
-17.481.27
-8 .73-9 .5457.59
6.58
48.6718.06
-7 .704.09
73.2751.8444.6914.4519.3227.8920.8344.0363.3724.72
1,581.41
38.5446.03
6.5510.04
559.25
-6 .4410.87
-5 .55-5 .9762.648.74
6.7415.73
128.070.67
47.5529.3732.08
7.1017.8122.6918.6242.8053.0815.54
1,169.84
14.9918.095.869.52
505.14
50.240.44
78.6963.0829.410.66
17.0216.3468.510.99
60.6537.5636.638.77
18.2724.4019.2943.2957.5318.13
1,534.17
18.9622.205.929.57
533.83
18.694.84
50.0339.6731.790.80
©International Monetary Fund. Not for Redistribution
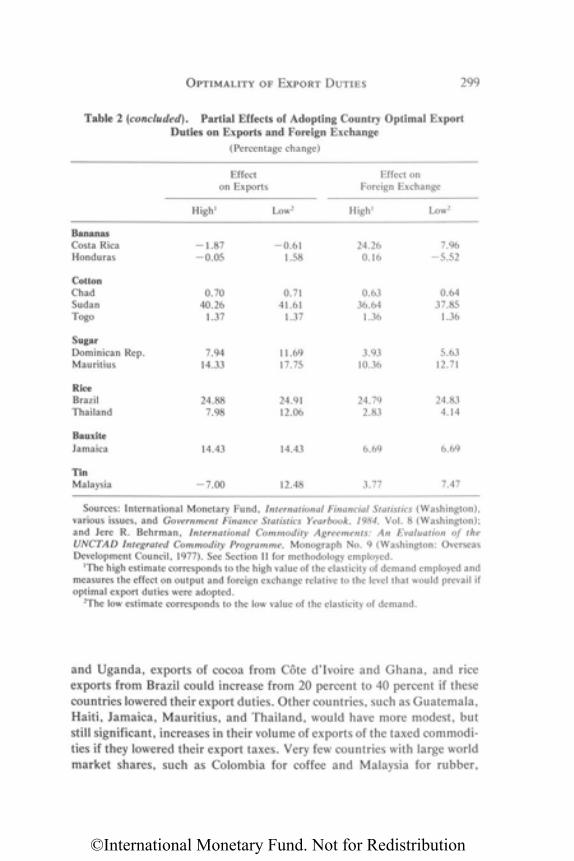
OPTIMALITY OF EXPORT DUTIES 299
Table 2 (concluded). Partial Effects of Adopting Country Optimal ExportDuties on Exports and Foreign Exchange
(Percentage change)
Sources: International Monetary Fund, International Financial Statistics (Washington),various issues, and Government Finance Statistics Yearbook, 1984, Vol. 8 (Washington);and Jere R. Behrman, International Commodity Agreements: An Evaluation of theUNCTAD Integrated Commodity Programme, Monograph No. 9 (Washington: OverseasDevelopment Council, 1977). See Section II for methodology employed.
1The high estimate corresponds to the high value of the elasticity of demand employed andmeasures the effect on output and foreign exchange relative to the level that would prevail ifoptimal export duties were adopted.
2The low estimate corresponds to the low value of the elasticity of demand.
and Uganda, exports of cocoa from Cote d'Ivoire and Ghana, and riceexports from Brazil could increase from 20 percent to 40 percent if thesecountries lowered their export duties. Other countries, such as Guatemala,Haiti, Jamaica, Mauritius, and Thailand, would have more modest, butstill significant, increases in their volume of exports of the taxed commodi-ties if they lowered their export taxes. Very few countries with large worldmarket shares, such as Colombia for coffee and Malaysia for rubber,
Effecton Exports
High1 Low2
Effect onForeign Exchange
High1 Low2
BananasCosta RicaHonduras
CottonChadSudanTogo
SugarDominican Rep.Mauritius
RiceBrazilThailand
BauxiteJamaica
TinMalaysia
-1 .87-0 .05
0.7040.26
1.37
7.9414.33
24.887.98
14.43
-7 .00
-0 .611.58
0.7141.61
1.37
11.6917.75
24.9112.06
14.43
12.48
24.260.16
0.6336.64
1.36
3.9310.36
24.792.83
6.69
3.77
7.96-5.52
0.6437.85
1.36
5.6312.71
24.834.14
6.69
7.47
©International Monetary Fund. Not for Redistribution
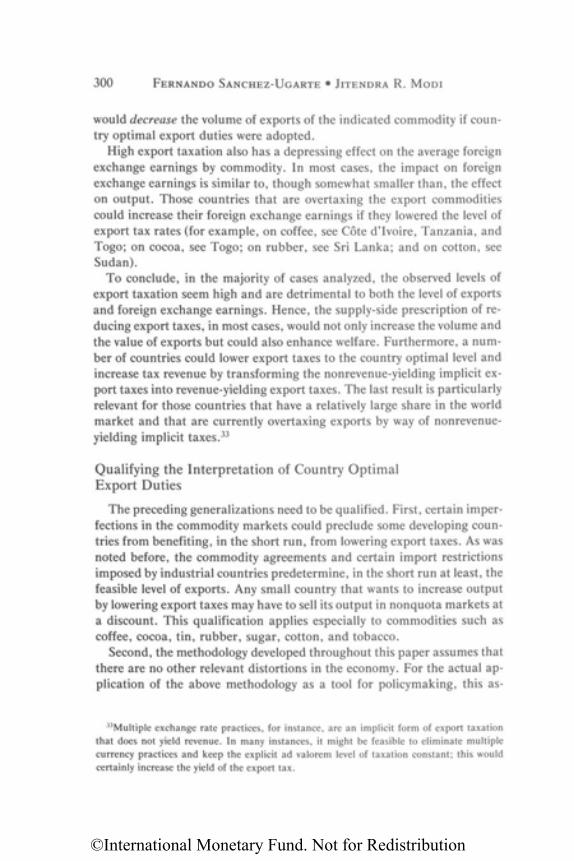
300 FERNANDO SANCHEZ-UGARTE • JITENDRA R. MODI
would decrease the volume of exports of the indicated commodity if coun-try optimal export duties were adopted.
High export taxation also has a depressing effect on the average foreignexchange earnings by commodity. In most cases, the impact on foreignexchange earnings is similar to, though somewhat smaller than, the effecton output. Those countries that are overtaxing the export commoditiescould increase their foreign exchange earnings if they lowered the level ofexport tax rates (for example, on coffee, see Cote d'Ivoire, Tanzania, andTogo; on cocoa, see Togo; on rubber, see Sri Lanka; and on cotton, seeSudan).
To conclude, in the majority of cases analyzed, the observed levels ofexport taxation seem high and are detrimental to both the level of exportsand foreign exchange earnings. Hence, the supply-side prescription of re-ducing export taxes, in most cases, would not only increase the volume andthe value of exports but could also enhance welfare. Furthermore, a num-ber of countries could lower export taxes to the country optimal level andincrease tax revenue by transforming the nonrevenue-yielding implicit ex-port taxes into revenue-yielding export taxes. The last result is particularlyrelevant for those countries that have a relatively large share in the worldmarket and that are currently overtaxing exports by way of nonrevenue-yielding implicit taxes.33
Qualifying the Interpretation of Country OptimalExport Duties
The preceding generalizations need to be qualified. First, certain imper-fections in the commodity markets could preclude some developing coun-tries from benefiting, in the short run, from lowering export taxes. As wasnoted before, the commodity agreements and certain import restrictionsimposed by industrial countries predetermine, in the short run at least, thefeasible level of exports. Any small country that wants to increase outputby lowering export taxes may have to sell its output in nonquota markets ata discount. This qualification applies especially to commodities such ascoffee, cocoa, tin, rubber, sugar, cotton, and tobacco.
Second, the methodology developed throughout this paper assumes thatthere are no other relevant distortions in the economy. For the actual ap-plication of the above methodology as a tool for policymaking, this as-
33Multiple exchange rate practices, for instance, are an implicit form of export taxationthat does not yield revenue. In many instances, it might be feasible to eliminate multiplecurrency practices and keep the explicit ad valorem level of taxation constant; this wouldcertainly increase the yield of the export tax.
©International Monetary Fund. Not for Redistribution
OPTIMALITY OF EXPORT DUTIES 301
sumption should be checked. In most developing countries, it is likely thatother agricultural producer prices are also distorted. The increase (or de-crease) in production of the taxed commodity would lead to a reduction (orincrease) in the production of other agricultural products and could gener-ate positive or negative external effects that should be taken into con-sideration.
Third, the country optimal export duty should, in general, be estimatedtaking into account the effect of the export duty on the price of close substi-tutes and complements in demand and in production. The adjustment isparticularly relevant for such commodities as coffee, tea, and cocoa thatare close substitutes in demand, but it should also be made in other perti-nent cases. The adjustment, however, is expected to increase the value ofthe optimal export duty relative to the estimates derived above.34
Fourth, the approach used here, static partial equilibrium, has its limi-tations. In a dynamic context it could be expected that a high price of ex-port commodities would lead to technical innovation, either in the form ofmore efficient use of inputs or creation of substitutes; either of the twowould reduce further the demand for the commodity. The dynamic de-mand function is thus expected to be more elastic than the static one.When general equilibrium considerations are taken into account, the in-crease in exports in one sector could be compensated by the decline of ex-ports in other activities. The only way of solving this problem is by estimat-ing optimal export duties in a general equilibrium model that takes intoaccount all the interaction that one policy measure generates in theeconomy.
Fifth, the assumption of constant elasticities for demand and supply hasits limitations that can lead to error, because the correct functional specifi-cation could be a variable supply function.
Sixth, it is assumed in the analysis that all countries act independently,so that there is no strategic reaction from either producers or consumerswhen the export duty is changed. In the real world, countries might reactstrategically to tax changes in forms that could invalidate the optimalityof a given export duty derived under the assumption of nonstrategicbehavior.
Seventh, the approach followed to estimate country optimal export du-ties in this paper does not incorporate any distributional considerations.Since export commodities are often produced by low-income farmers in
34For instance, the increase in the price of the taxed commodity induced by an increase inthe export duty will tend to increase the price of the close substitutes. These higher prices ofsubstitutes counteract the own-price effect. As can be seen, the effect on the price of comple-ments will also tend to counteract the own-price effect.
©International Monetary Fund. Not for Redistribution
302 FERNANDO SANCHEZ-UGARTE • JITENDRA R. MODI
developing countries, it is very likely that export taxes are quite regressive(Tanzi (1976) and Booth (1980)). It should be noted, however, that govern-ments could reduce and even eliminate the regressivity of export taxes byway of income redistribution through expenditure policy. This is unlikelyto happen in practice, however, because government expenditure tends tohave an urban bias.
Finally, should production of the export commodity be mainly under-taken by a government enterprise, the effect of the reduction in export dutyon production could be blurred:35 For example, the taxation of oil inMexico, where it is produced under government monopoly, and the taxa-tion of minerals in Zaire, where production is dominated by a public enter-prise, La Generate des Carrieres et des Mines (GECAMINES).36 In Togo,a public enterprise, Office Togolais des Phosphates (OTP), is responsiblefor the production and marketing of phosphates, the principal export com-modity. In all such cases, the tax payment is determined in accordancewith the budgetary needs of the government, the financial situation of thepublic enterprise, and international market conditions. A reduction in theprevailing level of export taxes, however, might have an effect in terms ofattracting new private investment into these sectors, provided market entrywere permitted.
Impact of Stabilization Schemes
Whether or not the commodity agreements have attained the purportedobjectives and improved economic well-being is an empirical question thatlies beyond the scope of this paper.37 Nonetheless, one can still form somenotion of their impact on the efficiency of production given the theoreticalproposition that a stabilization scheme that reduces the variability of theproducers' income without reducing the mean would improve welfare (seesection on "Export Duties in Connection with Stabilization Schemes,"above).
Table 3 shows the coefficient of variation in domestic producer and ex-port prices. Wherever the coefficient of variation of the former is less than
35In the case of commodities handled by state-controlled marketing boards, the reductionin the tax burden implicit in their operations may hamper their role, albeit limited (see sec-tion on "Impact of Stabilization Schemes "), in stabilizing prices paid to producers and theirincomes.
36GECAMINES exports 95 percent of the copper and 85 percent of the cobalt—the two mostimportant mineral exports from Zaire.
37See Behrman (1977) who estimates the benefits and the distribution of the stabilizationprogram proposed by the Fourth United Nations Conference on Trade and Development,and Baldwin (1983) who estimates the stabilization effect of the tin agreement.
©International Monetary Fund. Not for Redistribution
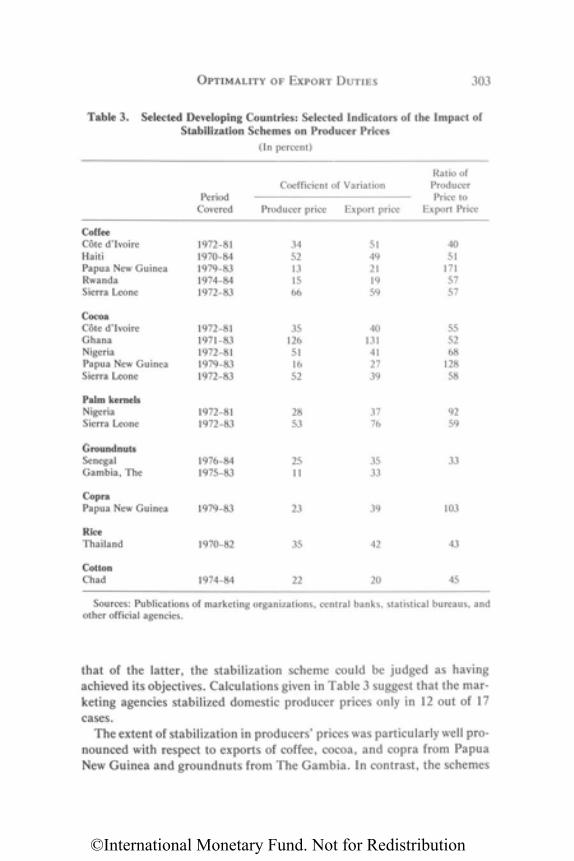
OPTIMALITY OF EXPORT DUTIES 303
Table 3. Selected Developing Countries: Selected Indicators of the Impact ofStabilization Schemes on Producer Prices
(In percent)
that of the latter, the stabilization scheme could be judged as havingachieved its objectives. Calculations given in Table 3 suggest that the mar-keting agencies stabilized domestic producer prices only in 12 out of 17cases.
The extent of stabilization in producers' prices was particularly well pro-nounced with respect to exports of coffee, cocoa, and copra from PapuaNew Guinea and groundnuts from The Gambia. In contrast, the schemes
PeriodCovered
Coefficient of Variation
Producer price Export price
Ratio ofProducerPrice to
Export Price
CoffeeCote d'IvoireHaitiPapua New GuineaRwandaSierra Leone
CocoaCote d'IvoireGhanaNigeriaPapua New GuineaSierra Leone
Palm kernelsNigeriaSierra Leone
GroundnutsSenegalGambia, The
CopraPapua New Guinea
RiceThailand
CottonChad
1972-811970-841979-831974-841972-83
1972-811971-831972-811979-831972-83
1972-811972-83
1976-841975-83
1979-83
1970-82
1974-84
3452131566
35126511652
2853
2511
23
35
22
5149211959
40131412739
3776
3533
39
42
20
4051
1715757
555268
12858
9259
33
103
43
45
Sources: Publications of marketing organizations, central banks, statistical bureaus, andother official agencies.
©International Monetary Fund. Not for Redistribution
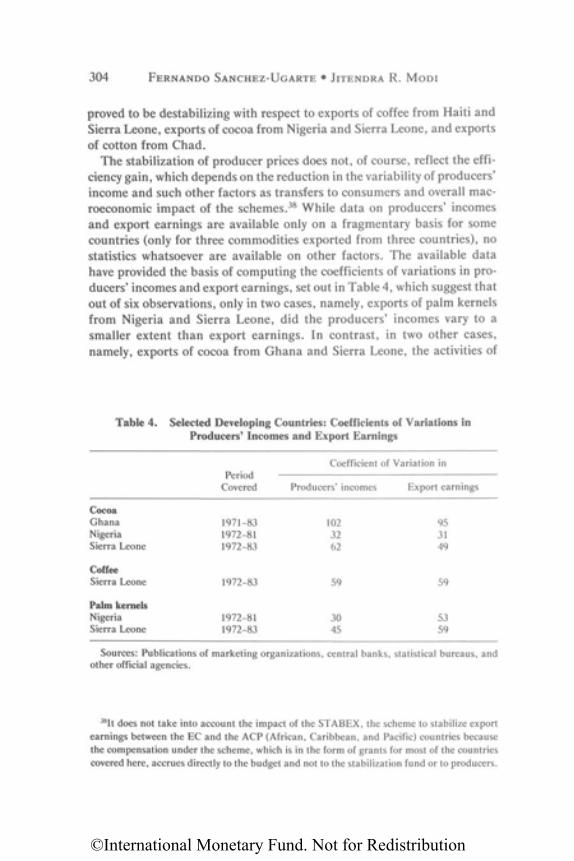
304 FERNANDO SANCHEZ-UGARTE • JITENDRA R. MODI
proved to be destabilizing with respect to exports of coffee from Haiti andSierra Leone, exports of cocoa from Nigeria and Sierra Leone, and exportsof cotton from Chad.
The stabilization of producer prices does not, of course, reflect the effi-ciency gain, which depends on the reduction in the variability of producers'income and such other factors as transfers to consumers and overall mac-roeconomic impact of the schemes.38 While data on producers' incomesand export earnings are available only on a fragmentary basis for somecountries (only for three commodities exported from three countries), nostatistics whatsoever are available on other factors. The available datahave provided the basis of computing the coefficients of variations in pro-ducers' incomes and export earnings, set out in Table 4, which suggest thatout of six observations, only in two cases, namely, exports of palm kernelsfrom Nigeria and Sierra Leone, did the producers' incomes vary to asmaller extent than export earnings. In contrast, in two other cases,namely, exports of cocoa from Ghana and Sierra Leone, the activities of
38It does not take into account the impact of the STABEX, the scheme to stabilize exportearnings between the EC and the ACP (African, Caribbean, and Pacific) countries becausethe compensation under the scheme, which is in the form of grants for most of the countriescovered here, accrues directly to the budget and not to the stabilization fund or to producers.
Table 4. Selected Developing Countries: Coefficients of Variations inProducers' Incomes and Export Earnings
Sources: Publications of marketing organizations, central banks, statistical bureaus, andother official agencies.
PeriodCovered
Coefficient of Variation in
Producers' incomes Export earnings
CocoaGhanaNigeriaSierra Leone
CoffeeSierra Leone
Palm kernelsNigeriaSierra Leone
1971-831972-811972-83
1972-83
1972-811972-83
1023262
59
3045
953149
59
5359
©International Monetary Fund. Not for Redistribution
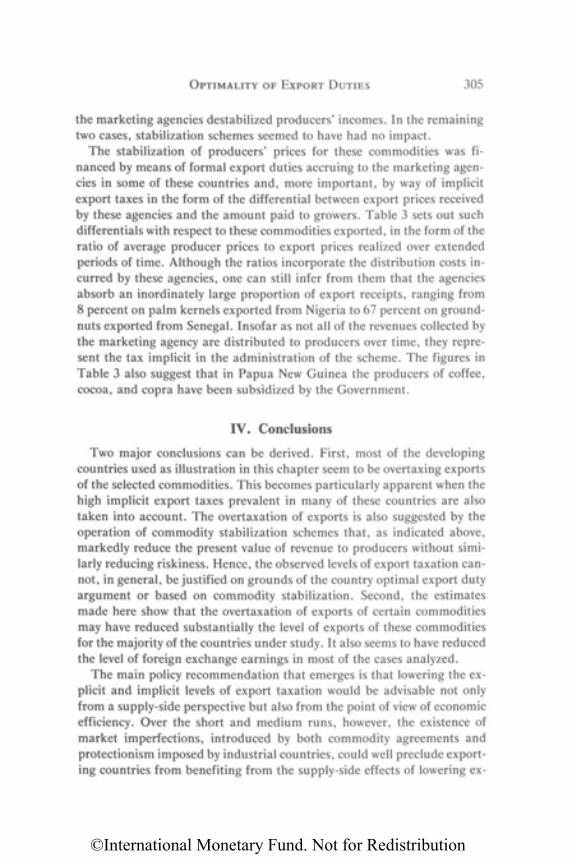
OPTIMALITY OF EXPORT DUTIES 305
the marketing agencies destabilized producers' incomes. In the remainingtwo cases, stabilization schemes seemed to have had no impact.
The stabilization of producers' prices for these commodities was fi-nanced by means of formal export duties accruing to the marketing agen-cies in some of these countries and, more important, by way of implicitexport taxes in the form of the differential between export prices receivedby these agencies and the amount paid to growers. Table 3 sets out suchdifferentials with respect to these commodities exported, in the form of theratio of average producer prices to export prices realized over extendedperiods of time. Although the ratios incorporate the distribution costs in-curred by these agencies, one can still infer from them that the agenciesabsorb an inordinately large proportion of export receipts, ranging from8 percent on palm kernels exported from Nigeria to 67 percent on ground-nuts exported from Senegal. Insofar as not all of the revenues collected bythe marketing agency are distributed to producers over time, they repre-sent the tax implicit in the administration of the scheme. The figures inTable 3 also suggest that in Papua New Guinea the producers of coffee,cocoa, and copra have been subsidized by the Government.
IV. Conclusions
Two major conclusions can be derived. First, most of the developingcountries used as illustration in this chapter seem to be overtaxing exportsof the selected commodities. This becomes particularly apparent when thehigh implicit export taxes prevalent in many of these countries are alsotaken into account. The overtaxation of exports is also suggested by theoperation of commodity stabilization schemes that, as indicated above,markedly reduce the present value of revenue to producers without simi-larly reducing riskiness. Hence, the observed levels of export taxation can-not, in general, be justified on grounds of the country optimal export dutyargument or based on commodity stabilization. Second, the estimatesmade here show that the overtaxation of exports of certain commoditiesmay have reduced substantially the level of exports of these commoditiesfor the majority of the countries under study. It also seems to have reducedthe level of foreign exchange earnings in most of the cases analyzed.
The main policy recommendation that emerges is that lowering the ex-plicit and implicit levels of export taxation would be advisable not onlyfrom a supply-side perspective but also from the point of view of economicefficiency. Over the short and medium runs, however, the existence ofmarket imperfections, introduced by both commodity agreements andprotectionism imposed by industrial countries, could well preclude export-ing countries from benefiting from the supply-side effects of lowering ex-
©International Monetary Fund. Not for Redistribution
306 FERNANDO SANCHEZ-UGARTE • JITENDRA R. MODI
port taxes and expanding their exports;39 at the same time governmentrevenues would be lowered.
The ensuing loss of government revenue, in most cases, may turn out tobe a major obstacle in lowering export taxes. Many of the developing coun-tries have few alternative sources of revenue, given the difficulties thatcould be encountered in the administration of more sophisticated, but lessdistortive, tax systems. It should be mentioned that many of the countriesunder review could reduce effective levels of taxation and promote exportswithout losing revenue (and in a few cases even gaining revenue), if theimplicit (nonrevenue-yielding) export duties were transformed into formal(revenue-yielding) export taxes. Furthermore, in many instances the re-duction of export duties could be undertaken along with the devaluation ofthe exchange rate, in which case the impact of lowering the tax rates on taxrevenue would be reduced and could even lead to an increase in govern-ment revenue.
ANNEX
Levels and Structure of Export Dutiesin Developing Countries
Export taxes exist in 71 developing countries, as shown in Table 5, and are leviedon a wide range of primary commodities. In 29 developing countries, export taxrevenue constitutes more than 1 percent of GDP and, with some minor exceptions,over 10 percent of the total tax revenue (Table 6). This Annex will, therefore, focuson the levels and structure of export taxes in these 29 developing countries only. Inmost cases, the export tax revenue is derived from one or two commodities thatfeature prominently in the exports of these countries. Coffee is the most widelytaxed commodity and is the most important source of export tax revenue in 13 ofthe 29 countries listed in Table 6. Furthermore, beverage crops, which comprisecoffee, tea, and cocoa, are the most important source of tax revenue in 17 of the 29countries under review. Other export commodities commonly taxed are rice, sugar,copra, bananas, groundnuts, palm kernels, cotton, rubber, wood, bauxite, tin,phosphates, copper, and petroleum.
Levels and Structure of Export Taxation
To analyze the level of export taxes and to make comparisons across countries,the section examines three different indicators.
39See Golub and Finger (1979) who discuss the impact of protectionism and taxation on theworld commodity market.
©International Monetary Fund. Not for Redistribution
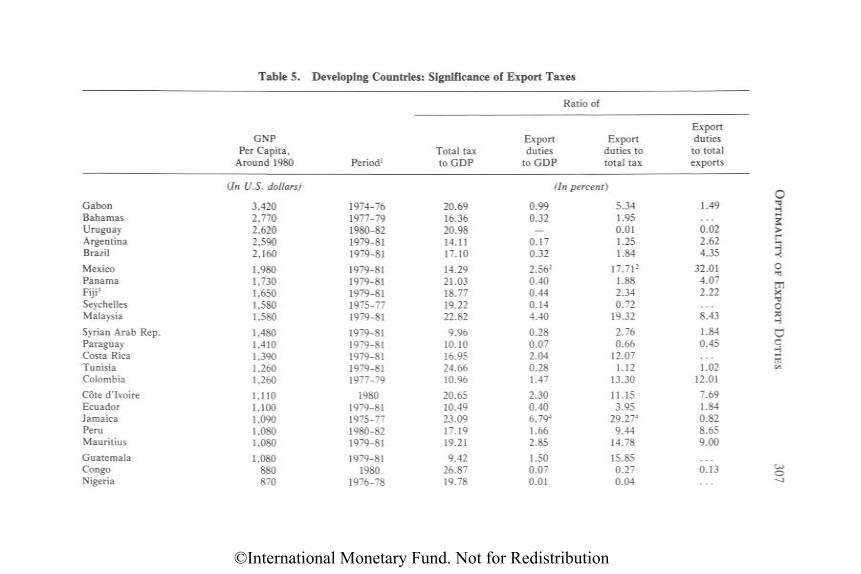
Table 5. Developing Countries: Significance of Export Taxes
Ratio of
GNPPer Capita,
Around 1980 Period1Total taxto GDP
Exportduties
to GDP
Exportduties tototal tax
Exportduties
to totalexports
GabonBahamasUruguayArgentinaBrazil
MexicoPanamaFiji3
SeychellesMalaysia
Syrian Arab Rep.ParaguayCosta RicaTunisiaColombia
Cote d'IvoireEcuadorJamaicaPeruMauritius
GuatemalaCongoNigeria
(In U.S. dollars)
3,4202,7702,6202,5902,160
1,9801,7301,6501,5801,580
1,4801,4101,3901,2601,260
1,1101,1001,0901,0801,080
1,080880870
1974-761977-791980-821979-811979-81
1979-811979-811979-811975-771979-81
1979-811979-811979-811979-811977-79
19801979-811975-771980-821979-81
1979-811980
1976-78
20.6916.3620.9814.1117.10
14.2921.0318.7719.2222.82
9.9610.1016.9524.6610.96
20.6510.4923.0917.1919.21
9.4226.8719.78
(In percent)
0.990.32—
0.170.32
2.562
0.400.440.144.40
0.280.072.040.281.47
2.300.406.794
1.662.85
1.500.070.01
5.341.950.011.251.84
17.712
1.882.340.72
19.32
2.760.66
12.071.12
13.30
11.153.95
29.274
9.4414.78
15.850.270.04
1.49
0.022.624.35
32.014.072.22
8.43
1.840.45
1.0212.01
7.691.840.828.659.00
0.13
©International Monetary Fund. Not for Redistribution
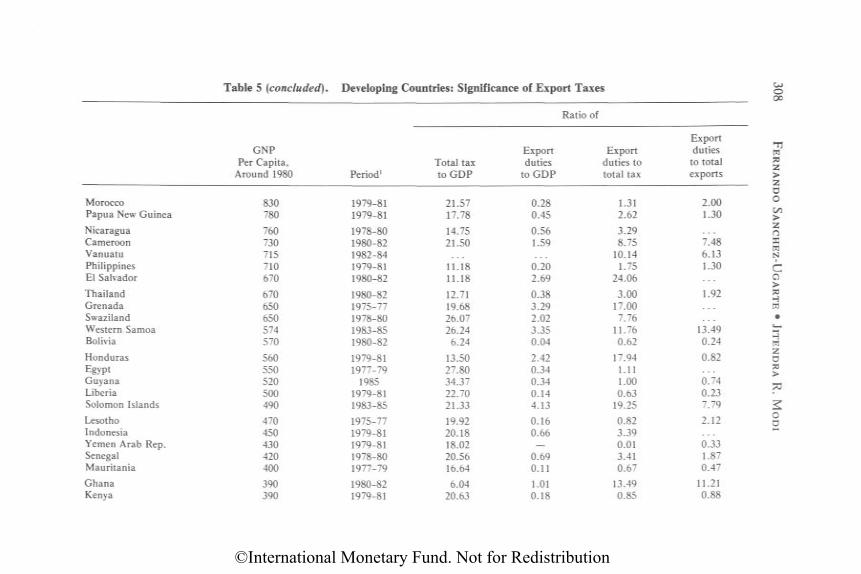
Table 5 (concluded). Developing Countries: Significance of Export Taxes
Ratio of
GNPPer Capita,
Around 1980 Period1Total taxto G D P
Exportduties
to G D P
Exportduties tototal tax
Exportduties
to totalexports
MoroccoPapua New GuineaNicaraguaCameroonVanuatuPhilippinesEl SalvadorThailandGrenadaSwazilandWestern SamoaBoliviaHondurasEgyptGuyanaLiberiaSolomon IslandsLesothoIndonesiaYemen Arab Rep.SenegalMauritaniaGhanaKenya
830780760730715710670670650650574570560550520500490470450430420400390390
1979-811979-811978-801980-821982-841979-811980-821980-821975-771978-801983-851980-821979-811977-79
19851979-811983-851975-771979-811979-811978-801977-791980-821979-81
21.5717.7814.7521.50
11.1811.1812.7119.6826.0726.24
6.2413.5027.8034.3722.7021.3319.9220.1818.0220.5616.646.04
20.63
0.280.450.561.59
0.202.690.383.292.023.350.042.420.340.340.144.130.160.66
0.690.111.010.18
1.312.623.298.75
10.141.75
24.063.00
17.007.76
11.760.62
17.941.111.000.63
19.250.823.390.013.410.67
13.490.85
2.001.30
7.486.131.30
1.92
13.490.240.82
0.740.237.792.12
0.331.870.47
11.210.88
©International Monetary Fund. Not for Redistribution
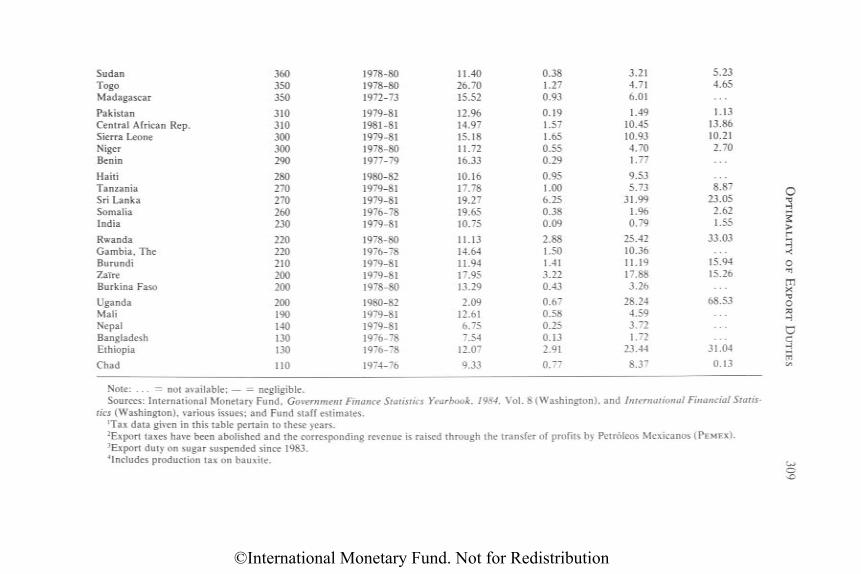
Note: . . . = not available; — = negligible.Sources: International Monetary Fund, Government Finance Statistics Yearbook, 1984, Vol. 8 (Washington), and International Financial Statis-
tics (Washington), various issues; and Fund staff estimates.1Tax data given in this table pertain to these years.2Export taxes have been abolished and the corresponding revenue is raised through the transfer of profits by Petroleos Mexicanos ( P E M E X ) .3Export duty on sugar suspended since 1983.includes production tax on bauxite.
SudanTogoMadagascar
PakistanCentral African Rep.Sierra LeoneNigerBenin
HaitiTanzaniaSri LankaSomaliaIndia
RwandaGambia, TheBurundiZaireBurkina Faso
UgandaMaliNepalBangladeshEthiopia
Chad
360350350
310310300300290
280270270260230
220220210200200
200190140130130
110
1978-801978-801972-73
1979-811981-811979-811978-801977-79
1980-821979-811979-811976-781979-81
1978-801976-781979-811979-811978-80
1980-821979-811979-811976-781976-78
1974-76
11.4026.7015.52
12.9614.9715.1811.7216.33
10.1617.7819.2719.6510.75
11.1314.6411.9417.9513.29
2.0912.616.757.54
12.07
9.33
0.381.270.93
0.191.571.650.550.29
0.951.006.250.380.09
2.881.501.413.220.43
0.670.580.250.132.91
0.77
3.214.716.01
1.4910.4510.934.701.77
9.535.73
31.991.960.79
25.4210.3611.1917.883.26
28.244.593.721.72
23.44
8.37
5.234.65
1.1313.8610.212.70
8.8723.05
2.621.55
33.03
15.9415.26
68.53
31.04
0.13
©International Monetary Fund. Not for Redistribution
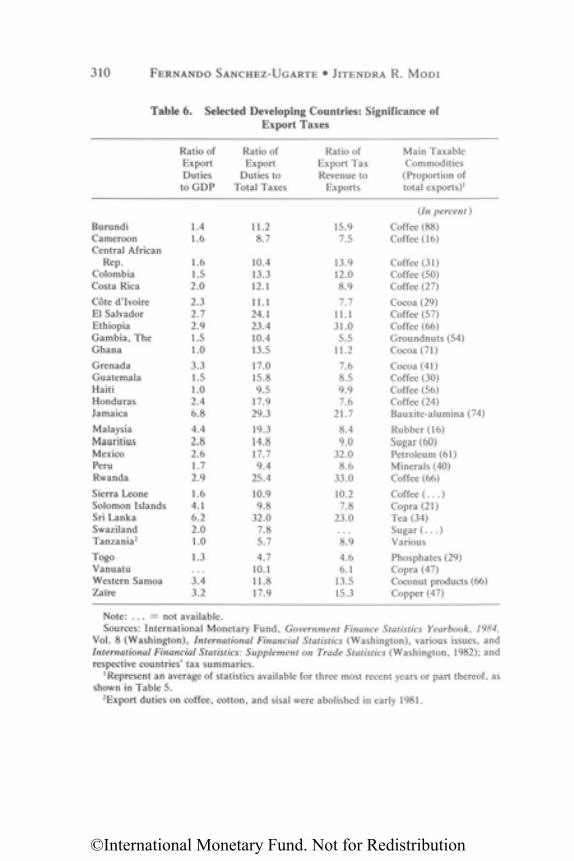
310 FERNANDO SANCHEZ-UGARTE • JITENDRA R. M O D I
Table 6. Selected Developing Countries: Significance ofExport Taxes
BurundiCameroonCentral African
Rep.ColombiaCosta Rica
Cote d'IvoireEl SalvadorEthiopiaGambia, TheGhana
GrenadaGuatemalaHaitiHondurasJamaica
MalaysiaMauritiusMexicoPeruRwanda
Sierra LeoneSolomon IslandsSri LankaSwazilandTanzania2
TogoVanuatuWestern SamoaZaire
Ratio ofExportDutiesto G D P
1.41.6
1.61.52.0
2.32.72.91.51.0
3.31.51.02.46.8
4.42.82.61.72.9
1.64.16.22.01.01.3
...3.43.2
Ratio ofExport
Duties toTotal Taxes
11.28.7
10.413.312.1
11.124.123.410.413.5
17.015.89.5
17.929.3
19.314.817.79.4
25.4
10.99.8
32.07.85.7
4.710.111.817.9
Ratio ofExport TaxRevenue to
Exports
15.97.5
13.912.08.9
7.711.131.05.5
11.2
7.68.59.97.6
21.7
8.49.0
32.08.6
33.0
10.27.8
23.0...
8.9
4.66.1
13.515.3
Main TaxableCommodities(Proportion oftotal exports)1
(In percent)
Coffee (88)Coffee (16)
Coffee (31)Coffee (50)Coffee (27)
Cocoa(29)Coffee (57)Coffee (66)Groundnuts (54)Cocoa(71)
Cocoa (41)Coffee (30)Coffee (56)Coffee (24)Bauxite-alumina (74)
Rubber (16)Sugar(60)Petroleum (61)Minerals (40)Coffee (66)
Coffee (...)Copra (21)Tea (34)Sugar (...)Various
Phosphates (29)Copra (47)Coconut products (66)Copper (47)
Note: . . . = not available.Sources: International Monetary Fund, Government Finance Statistics Yearbook, 1984,
Vol. 8 (Washington), International Financial Statistics (Washington), various issues, andInternational Financial Statistics: Supplement on Trade Statistics (Washington, 1982); andrespective countries' tax summaries.
1Represent an average of statistics available for three most recent years or part thereof, asshown in Table 5.
2Export duties on coffee, cotton, and sisal were abolished in early 1981.
©International Monetary Fund. Not for Redistribution
OPTIMALITY OF EXPORT DUTIES 311
First, Table 6 shows the ratio of export tax revenue to total exports for the 29countries under analysis. The ratio varies from a high of 33 percent for R w a n d a toa low of 4.6 percent for Togo and has an average level of 12.9 percent for the wholesample. Seventeen countries are below the average level and only five countrieshave a ratio exceeding 20 percent.
Second, export taxes are not necessarily payable on all exports, or at a uniformrate on all commodities. Even though the statutory rates can take the form of an advalorem rate, a specific rate, or a composite rate, the composite (or sliding scale)rates are by far the most prominent form of duty, as can be seen from Table 7.Such composite tax rates take the form of a fixed amount of tax (i.e., basic tax) onup to a specified export price (i.e., floor price) and a progressively rising (sliding)rate of tax on successive increments in export price. With some minor exceptions,the sliding rate applies to the incremental value of export.40 A specific rate is theleast c o m m o n form of export duties as it applies in only 6 of the 29 countries underreview (Burundi, Cameroon, the Central African Republic, Honduras, Pakistan,and Western Samoa) . T o maintain their comparability with ad valorem and slidingscale tax rates, such specific rates are expressed in Table 7 in terms of an ad va-lorem equivalent derived on the basis of prevailing price levels of export commodi -ties to which they apply. The table indicates that the statutory rates vary from a lowof 1 percent on bananas in Costa Rica to a high marginal rate of 100 percent oncoffee in R w a n d a and Uganda .
Third, Table 8 (column 1) shows the effective rate of export tax for each com-modity. This is measured as a ratio of tax revenue to total export value (f.o.b.) ofthat commodity. There is substantial variability by country and by type of com-modity. Coffee, for instance, is taxed, on the average, at 17 percent; however, ac-tual rates m a y range between a high of 25 percent in Tanzania to a low of 1 percentin Brazil. Cocoa is taxed at an average rate higher than that of coffee (20 percent);the actual rate, however, reaches 23 percent in Cote d'Ivoire. The average exporttax rate for all commodities and all countries included in the first column of Table8 is about 17 percent—somewhat higher than the ratio of export tax revenue tototal exports shown in Table 6, since most countries tend to tax only the export ofselected commodities.
Implicit Taxes on Exports
The second column in Table 8 shows the estimated implicit tax for some of thecommodities. It is based on the estimation of the nominal protection coefficients(NPCs) of selected export commodities m a d e by the World B a n k (1981) and(1982), which takes into account "tariffs, quotas, and nontariff barriers that pro-tect farmers as well as the impact of export taxes on restrictions that penalize
4 0 A major exception is Ethiopia, where the sliding rate applies to the volume of export.Mauritius and Senegal apply a dual rate (a variant of sliding rate) under which the lower rateapplies to small-scale producers in the former and to small shipments in the latter.
©International Monetary Fund. Not for Redistribution
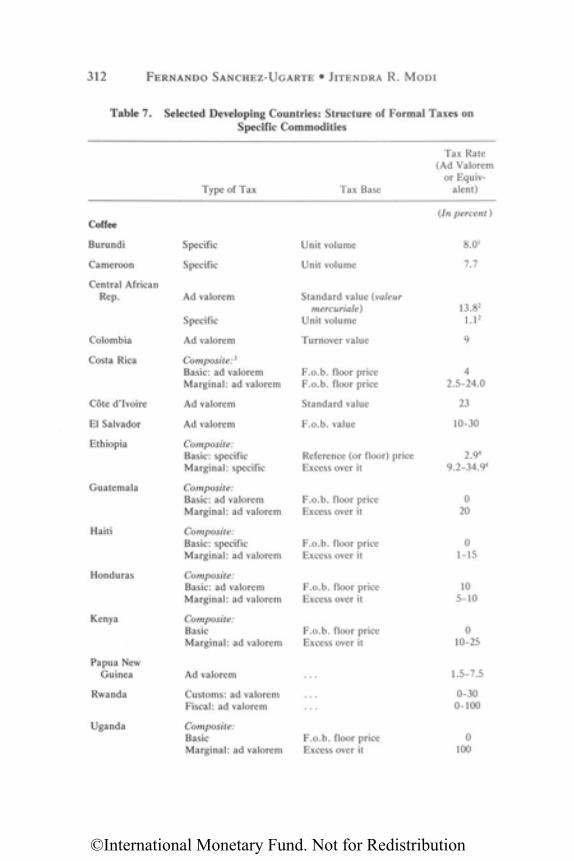
312 FERNANDO SANCHEZ-UGARTE • JITENDRA R. M O D I
Table 7. Selected Developing Countries: Structure of Formal Taxes onSpecific Commodities
Coffee
Burundi
Cameroon
Central AfricanRep.
Colombia
Costa Rica
Cote d'Ivoire
El Salvador
Ethiopia
Guatemala
Haiti
Honduras
Kenya
Papua N e wGuinea
Rwanda
Uganda
Type of Tax
Specific
Specific
A d valorem
Specific
A d valorem
Composite:3
Basic: ad valoremMarginal: ad valorem
A d valorem
A d valorem
Composite-Basic: specificMarginal: specific
Composite:Basic: ad valoremMarginal: ad valorem
Composite:Basic: specificMarginal: ad valorem
Composite:Basic: ad valoremMarginal: ad valorem
Composite:BasicMarginal: ad valorem
A d valorem
Customs: ad valoremFiscal: ad valorem
Composite:BasicMarginal: ad valorem
Tax Base
Unit volume
Unit volume
Standard value (valeurmercuriale)
Unit volume
Turnover value
F.o .b . floor priceF.o .b . floor price
Standard value
F.o .b . value
Reference (or floor) priceExcess over it
F .o .b . floor priceExcess over it
F .o .b . floor priceExcess over it
F .o .b . floor priceExcess over it
F .o .b . floor priceExcess over it
...
...
F.o .b . floor priceExcess over it
Tax Rate(Ad Valorem
or Equiv-alent)
(In percent)
8.01
7.7
13.82
1.12
9
42.5-24.0
23
10-30
2.94
9.2-34.94
020
01-15
105-10
010-25
1.5-7.5
0-300-100
0100
©International Monetary Fund. Not for Redistribution
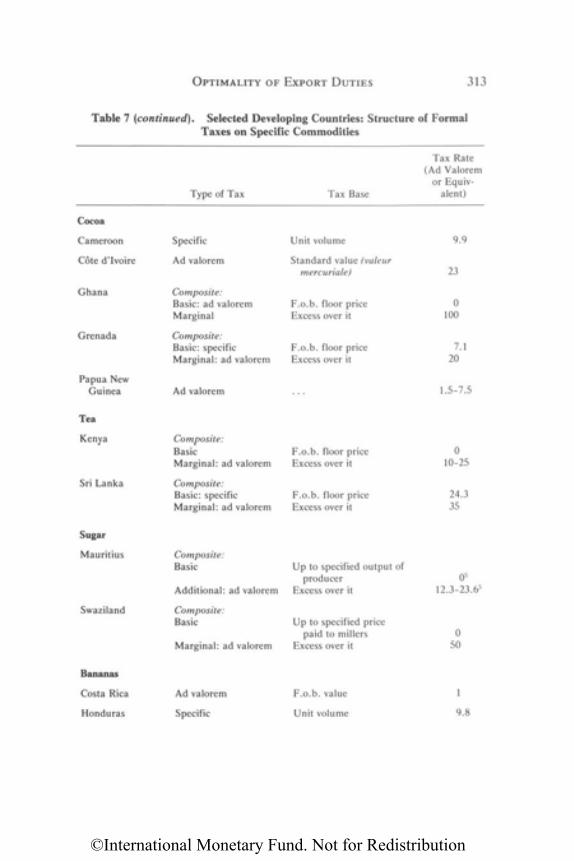
OPTIMALITY OF EXPORT DUTIES 313
Table 7 (continued). Selected Developing Countries: Structure of FormalTaxes on Specific Commodities
Cocoa
Cameroon
Cote d'Ivoire
Ghana
Grenada
Papua N e wGuinea
Tea
Kenya
Sri Lanka
Sugar
Mauritius
Swaziland
Bananas
Costa Rica
Honduras
Type of Tax
Specific
A d valorem
Composite:Basic: ad valoremMarginal
Composite:Basic: specificMarginal: ad valorem
A d valorem
Composite:BasicMarginal: ad valorem
Composite:Basic: specificMarginal: ad valorem
Composite:Basic
Additional: ad valorem
Composite:Basic
Marginal: ad valorem
A d valorem
Specific
Tax Base
Unit volume
Standard value (valeurmercuriale)
F.o.b. floor priceExcess over it
F.o.b. floor priceExcess over it
...
F.o.b. floor priceExcess over it
F.o.b. floor priceExcess over it
U p to specified output ofproducer
Excess over it
U p to specified pricepaid to millers
Excess over it
F.o.b. value
Unit volume
Tax Rate(Ad Valorem
or Equiv-alent)
9.9
23
0100
7.120
1.5-7.5
010-25
24.335
05
12.3-23.65
050
1
9.8
©International Monetary Fund. Not for Redistribution
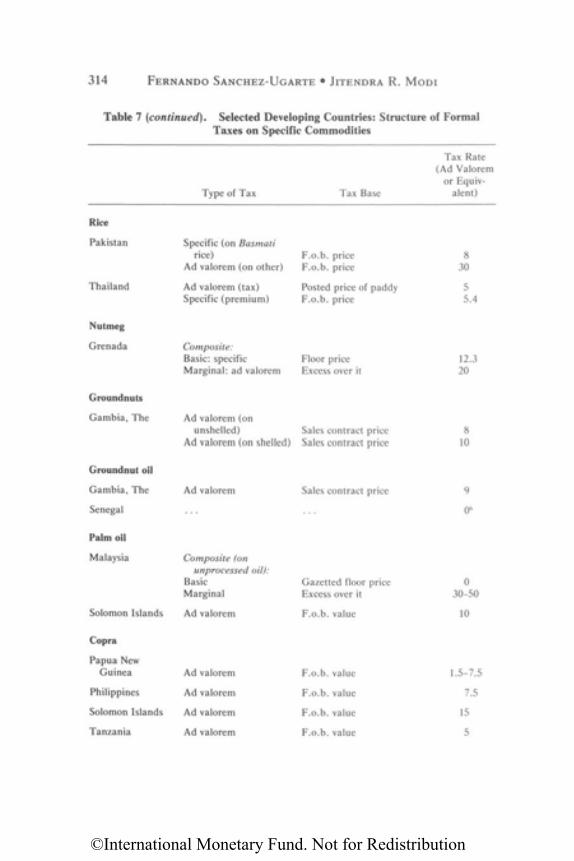
314 FERNANDO SANCHEZ-UGARTE • JITENDRA R. M O D I
Table 7 (continued). Selected Developing Countries: Structure of FormalTaxes on Specific Commodities
Rice
Pakistan
Thailand
Nutmeg
Grenada
Groundnuts
Gambia, The
Groundnut oil
Gambia, The
Senegal
Palm oil
Malaysia
Solomon Islands
Copra
Papua N e wGuinea
Philippines
Solomon Islands
Tanzania
Type of Tax
Specific (on Basmatirice)
A d valorem (on other)
A d valorem (tax)Specific (premium)
Composite:Basic: specificMarginal: ad valorem
A d valorem (onunshelled)
A d valorem (on shelled)
A d valorem
...
Composite (onunprocessed oil):
BasicMarginal
A d valorem
A d valorem
A d valorem
A d valorem
A d valorem
Tax Base
F.o.b. priceF.o.b. price
Posted price of paddyF.o.b. price
Floor priceExcess over it
Sales contract priceSales contract price
Sales contract price
...
Gazetted floor priceExcess over it
F.o.b. value
F.o.b. value
F.o.b. value
F.o.b. value
F.o.b. value
Tax Rate(Ad Valorem
or Equiv-alent)
830
55.4
12.320
810
9
06
030-50
10
1.5-7.5
7.5
15
5
©International Monetary Fund. Not for Redistribution
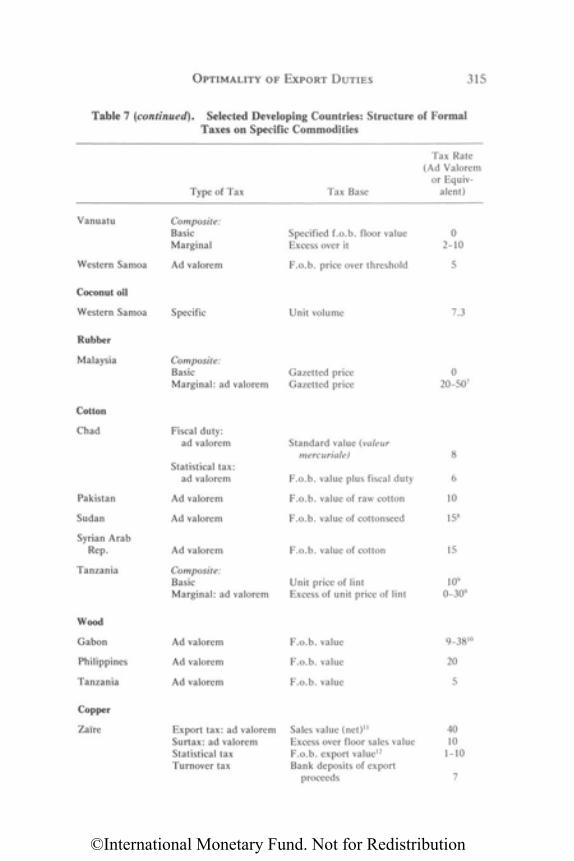
OPTIMALITY OF EXPORT DUTIES 315
Table 7 (continued). Selected Developing Countries: Structure of FormalTaxes on Specific Commodities
Vanuatu
Western S a m o a
Coconut oil
Western S a m o a
Rubber
Malaysia
Cotton
Chad
Pakistan
Sudan
Syrian ArabRep .
Tanzania
Wood
Gabon
Philippines
Tanzania
Copper
Zaire
Type of Tax
Composite:BasicMarginal
A d valorem
Specific
Composite:BasicMarginal: ad valorem
Fiscal duty:ad valorem
Statistical tax:ad valorem
A d valorem
A d valorem
A d valorem
Composite:BasicMarginal: ad valorem
A d valorem
A d valorem
A d valorem
Export tax: ad valoremSurtax: ad valoremStatistical taxTurnover tax
Tax Base
Specified f.o.b. floor valueExcess over it
F.o .b . price over threshold
Unit volume
Gazetted priceGazetted price
Standard value (valeurmercuriale)
F.o .b . value plus fiscal duty
F.o .b . value of raw cotton
F.o .b . value of cottonseed
F.o .b . value of cotton
Unit price of lintExcess of unit price of lint
F.o .b . value
F.o .b . value
F.o .b . value
Sales value (net)11
Excess over floor sales valueF.o .b . export value12
Bank deposits of exportproceeds
Tax Rate(Ad Valorem
or Equiv-alent)
02-10
5
7.3
020-507
8
6
10
158
15
109
0-309
9-3810
20
5
4010
1-10
7
©International Monetary Fund. Not for Redistribution
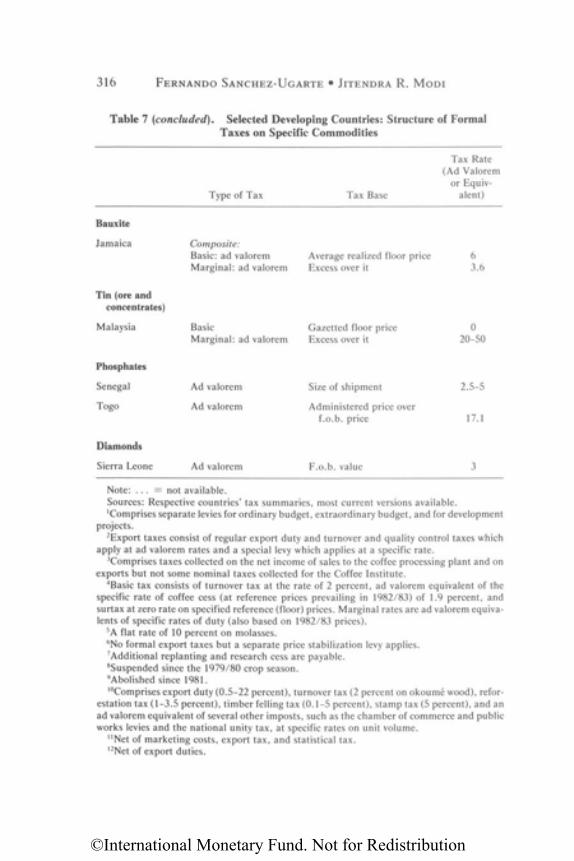
316 FERNANDO SANCHEZ-UGARTE • JITENDRA R. M O D I
Table 7 (concluded). Selected Developing Countries: Structure of FormalTaxes on Specific Commodities
Bauxite
Jamaica
Tin (ore andconcentrates)
Malaysia
Phosphates
Senegal
Togo
Diamonds
Sierra Leone
Type of Tax
Composite:Basic: ad valoremMarginal: ad valorem
BasicMarginal: ad valorem
A d valorem
A d valorem
A d valorem
Tax Base
Average realized floor priceExcess over it
Gazetted floor priceExcess over it
Size of shipment
Administered price overf.o.b. price
F.o.b. value
Tax Rate(Ad Valorem
or Equiv-alent)
63.6
020-50
2.5-5
17.1
3
Note: . . . = not available.Sources: Respective countries' tax summaries, most current versions available.1Comprises separate levies for ordinary budget, extraordinary budget, and for development
projects.2Export taxes consist of regular export duty and turnover and quality control taxes which
apply at ad valorem rates and a special levy which applies at a specific rate.3Comprises taxes collected on the net income of sales to the coffee processing plant and on
exports but not some nominal taxes collected for the Coffee Institute.4Basic tax consists of turnover tax at the rate of 2 percent, ad valorem equivalent of the
specific rate of coffee cess (at reference prices prevailing in 1982/83) of 1.9 percent, andsurtax at zero rate on specified reference (floor) prices. Marginal rates are ad valorem equiva-lents of specific rates of duty (also based on 1982/83 prices).
5 A flat rate of 10 percent on molasses.6 N o formal export taxes but a separate price stabilization levy applies.7Additional replanting and research cess are payable.8Suspended since the 1979/80 crop season.9Abolished since 1981.10Comprises export duty (0.5-22 percent), turnover tax (2 percent on okoume wood), refor-
estation tax (1-3.5 percent), timber felling tax (0.1-5 percent), stamp tax (5 percent), and anad valorem equivalent of several other imposts, such as the chamber of commerce and publicworks levies and the national unity tax, at specific rates on unit volume.
11Net of marketing costs, export tax, and statistical tax.12Net of export duties.
©International Monetary Fund. Not for Redistribution
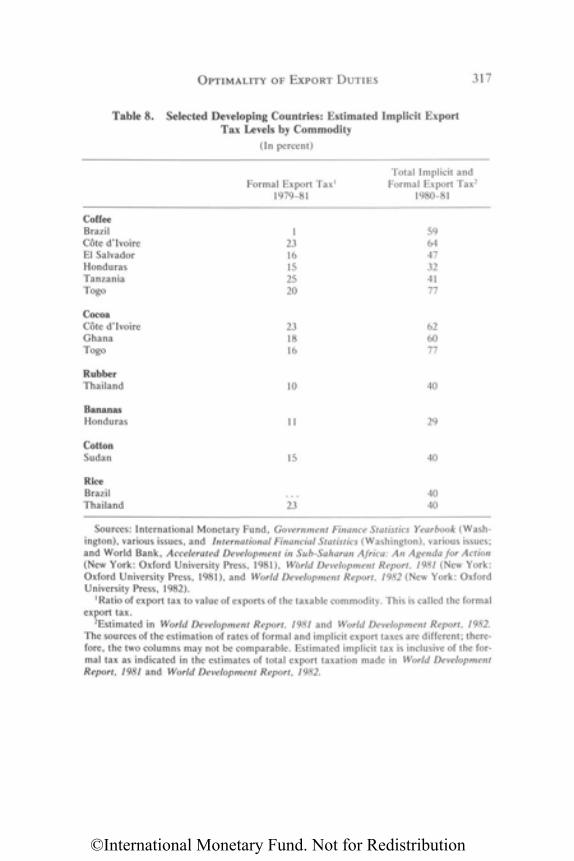
O P T I M A L I T Y O F E X P O R T D U T I E S 317
Table 8. Selected Developing Countries: Estimated Implicit ExportTax Levels by Commodity
(In percent)
Formal Export Tax1
1979-81
Total Implicit andFormal Export Tax2
1980-81
Sources: International Monetary Fund, Government Finance Statistics Yearbook (Wash-ington), various issues, and International Financial Statistics (Washington), various issues;and World Bank, Accelerated Development in Sub-Saharan Africa: An Agenda for Action(New York: Oxford University Press, 1981), World Development Report, 1981 (New York:Oxford University Press, 1981), and World Development Report, 1982 (New York: OxfordUniversity Press, 1982).
1Ratio of export tax to value of exports of the taxable commodity. This is called the formalexport tax.
2Estimated in World Development Report, 1981 and World Development Report, 1982.The sources of the estimation of rates of formal and implicit export taxes are different; there-fore, the two columns may not be comparable. Estimated implicit tax is inclusive of the for-mal tax as indicated in the estimates of total export taxation made in World DevelopmentReport, 1981 and World Development Report, 1982.
CoffeeBrazilCote d'IvoireEl SalvadorHondurasTanzaniaTogo
CocoaCote d'IvoireGhanaTogo
RubberThailand
BananasHonduras
CottonSudan
RiceBrazilThailand
12316152520
231816
10
11
15
23
596447324177
626077
40
29
40
4040
©International Monetary Fund. Not for Redistribution
318 FERNANDO SANCHEZ-UGARTE • JITENDRA R. M O D I
farmers."41 To the extent that protection is also a function of the country's ex-change rate, it is also included in the computation of NPCs.42 Implicit tax dataincorporate the effect of both formal export taxes and implicit export taxes. Eventhough information is incomplete, it is clear that implicit export taxes can substan-tially raise the total effective burden of export taxation, such that the average im-plicit rate on export is more than doubled when implicit export taxes are incorpo-rated.
REFERENCES
Adams, F. Gerard, and Jere R. Behrman, Econometric Models of World Agricul-tural Commodity Markets: Cocoa, Coffee, Tea, Wool, Cotton, Sugar, Wheat,Rice (Cambridge, Massachusetts: Ballinger Publishing Co., 1976).
Aguirre, Carlos A., Peter S. Griffith, and M. Zuhtu Yucelik, Taxation in Sub-Saharan Africa, Part I: Tax Policy and Administration in Sub-SaharanAfrica, Occasional Paper No. 8 (Washington: International Monetary Fund,1981).
Askari, Hossein, and John Thomas Cummings, "Estimating Agricultural SupplyResponse with the Nerlove Model: A Survey," International Economic Review(Osaka, Japan), Vol. 18 (June 1977), pp. 257-92.
Baldwin, William L., The World Tin Market: Political Pricing and EconomicCompetition (Durham, North Carolina: Duke University Press, 1983).
Behrman, Jere R., International Commodity Agreements: An Evaluation of theUNCTAD Integrated Commodity Programme, Monograph No. 9 (Washing-ton: Overseas Development Council, 1977).
Booth, Anne, "The Economic Impact of Export Taxes in ASEAN," MalayanEconomic Review (Singapore), Vol. 25 (April 1980), pp. 36-61.
Corden, W.M., Trade Policy and Economic Welfare (Oxford: Clarendon Press,1974).
Davis, Jeffrey M., "The Economic Effects of Windfall Gains in Export Earnings,1975-78" (unpublished, International Monetary Fund, February 29, 1980).
Gately, Dermot, "A Ten-Year Retrospective: OPEC and the World Oil Market,"Journal of Economic Literature (Nashville, Tennessee), Vol. 22 (September1984), pp. 1100-14.
Golub, Stephen S., and J.M. Finger, "The Processing of Primary Commodities:Effects of Developed-Country Tariff Escalation and Developing-CountryExport Taxes," Journal of Political Economy (Chicago), Vol. 87 (June 1979),pp. 559-77.
41World Bank (1982, p. 48).42NPCs do not, however, incorporate the impact of subsidies on inputs, such as fertilizers,
seeds, insecticides, water, fuel, transport, storage, and farm machinery, which are extendedto producers in various forms, including the exemption from relevant taxes (import and ex-cise duties, sales tax, etc.), fixed prices which do not fully reflect the cost, and preferentialinterest rates on loans to producers.
©International Monetary Fund. Not for Redistribution
OPTIMALITY OF EXPORT DUTIES 319
Goode, Richard, Government Finance in Developing Countries (Washington:Brookings Institution, 1984).
, George E. Lent, and P.D. Ojha, "Role of Export Taxes in DevelopingCountries," Staff Papers, International Monetary Fund (Washington), Vol.13 (November 1966), pp. 453-501.
Hart, Albert G., "Taxation in the Management of Primary Commodity Markets,"in Taxation and Development, ed. by Nian-Tzu Wang (New York: Praeger,1976).
Helleiner, Gerald K., "The Fiscal Role of the Marketing Boards in Nigerian Eco-nomic Development, 1947-61," Economic Journal (London), Vol. 74 (Sep-tember 1964), pp. 582-610.
(1966a), "Marketing Boards and Domestic Stabilization in Nigeria,"Review of Economics and Statistics (Cambridge, Massachusetts), Vol. 48(February 1966), pp. 69-78.
(1966b), Peasant Agriculture, Government, and Economic Growth inNigeria (Homewood, Illinois: Richard D. Irwin, Inc., 1966).
International Monetary Fund, Government Finance Statistics Yearbook, 1984,Vol. 8 (Washington, 1984).
, International Financial Statistics Yearbook, 1984 (Washington, 1984).
, International Financial Statistics: Supplement on Trade Statistics (Wash-ington, 1982).
Johnson, Harry G., "The Gain from Exploiting Monopoly or Monopsony Power inInternational Trade," Economica (London), Vol. 35 (May 1968), pp.151-56.
, "Commodities: Less Developed Countries' Demands and DevelopedCountries' Response," in The New International Economic Order: TheNorth-South Debate, ed. by Jagdish N. Bhagwati (Cambridge: Massachu-setts: MIT Press, 1977).
Labys, W., and J. Hunkeler, "Survey of Commodity Demand and Supply Elastici-ties," United Nations Conference on Trade and Development, ResearchMemorandum No. 48 (unpublished, March 19, 1974).
Mussa, Michael, "Tariffs and the Distribution of Income: The Importance of Fac-tor Specificity, Substitutability, and Intensity in the Short and Long Run,"Journal of Political Economy (Chicago), Vol. 82 (November/December 1974),pp. 1191-1203.
Newbery, David M.G., and Joseph E. Stiglitz, The Theory of Commodity PriceStabilization: A Study in the Economics of Risk (Oxford: Clarendon Press,1981).
Okonkwo, Ubadigbo, "Export Taxes on Primary Products in Developing Coun-tries: The Taxation of Cocoa Exports in West Africa" (unpublished, Interna-tional Monetary Fund, November 29, 1978).
Panayotou, Theodore, "OPEC as a Model for Copper Exporters: Potential Gainsand Cartel Behavior," Developing Economies (Tokyo), Vol. 17 (June 1979),pp. 203-19.
Prest, Alan R., Public Finance in Underdeveloped Countries (London: Weiden-feld and Nicholson, 2nd ed., 1972).
©International Monetary Fund. Not for Redistribution
320 FERNANDO SANCHEZ-UGARTE • JITENDRA R. M O D I
Repetto, Robert, "Optimal Export Taxes in the Short and Long Run, and an Ap-plication to Pakistan's Jute Export Policy," Quarterly Journal of Economics(Cambridge, Massachusetts), Vol. 86 (August 1972), pp. 396-406.
Singh, Shamser, and others, Coffee, Tea and Cocoa: Market Prospects and Devel-opment/Lending (Baltimore: Johns Hopkins University Press, 1977).
Tanzi, Vito, "Export Taxation in Developing Countries: Taxation of Coffee inHaiti," Social and Economic Studies (Kingston, Jamaica), Vol. 25 (March1976), pp. 66-76.
, "Quantitative Characteristics of the Tax Systems of Developing Coun-tries," in The Theory of Taxation for Developing Countries, ed. by DavidNewbery and Nicholas Stern (New York: Oxford University Press, 1987).
Tolley, George S., Vinod Thomas, and Chung Ming Wong, Agricultural Price Pol-icies and the Developing Countries (Baltimore: Johns Hopkins UniversityPress, 1982).
Valles, Jean Paul, The World Market for Bananas, 1964-72: Outlook for De-mand, Supply, and Prices (New York: Praeger, 1968).
World Bank, Accelerated Development in Sub-Saharan Africa: An Agenda forAction (New York: Oxford University Press, 1981).
, Commodity Trade and Price Trends (Washington, 1983).
, Commodity Trade and Price Trends (Washington, 1986).
, World Development Report, 1981 (New York: Oxford University Press,1981).
, World Development Report, 1982 (New York: Oxford University Press,1982).
©International Monetary Fund. Not for Redistribution
12Limitations of the Role of Tax Policy in
Economic Development
Parthasarathi Shome
The role of taxation and associated incentives in development is onepiece of a large puzzle. Tax incentives may assume importance if tax policyis seen to play an instrumental role in development. Tax policy, in turn,may have perceptible ramifications on the savings rate and, therefore, oninvestment in the economy which, in the traditional literature, is the king-pin in an economy's development. There have, however, been other "struc-tural positions" regarding the force behind or limiting development wherenatural resources are not a constraint. These are (1) the inadequacy of ex-port markets due to protectionism abroad in the case of countries with ahigh degree of dependence on trade; (2) "investment" (even though this istreated as current expenditure by economists) in health, education, andother social infrastructure; (3) population control in countries such as In-dia and China, or the lack of a large population (i.e., the smallness ofmarket size) in others; (4) the role of appropriate technology, that is, thechoice of techniques; and (5) the role of agriculture (e.g., land reform,extension services, innovation) independent of the effects of savings andinvestment. Therefore, in our attempt to study the effects of taxation onoutput—growth and development—we need to go back to the drawingboard to see where taxation fits into the development picture and how im-portant it is to the development process. Since the role of taxation is inher-ently linked with that of savings, this chapter begins by reviewing thetreatment of savings in the development literature and then contrasts andcompares it with the role of other measures of development. This is not tobelittle the role of fiscal policy in economic development but to gauge itmore comprehensively and to better understand its possibilities andlimitations.
A perusal of the postwar literature reveals that, while the proponents ofsavings as a vehicle of growth were in the forefront of the discussions on
321
©International Monetary Fund. Not for Redistribution
322 PARTHASARATHI SHOME
growth, issues such as the role of economic infrastructure and social dy-namics in the development process were being raised at the same time,even though the latter became more fashionable in the 1970s. At times thetraditionalist view—savings and investment—of the development litera-ture is perceived as an alternative to the structuralist view—financial inter-mediation, social infrastructure, population pressure, agricultural reformand adoption of modern technology, and factor-substitution problems. Atother times, their roles are cast as complementary, for example, a betterfinancial structure or a more educated public aiding in the savings perfor-mance of the economy. Whether treated as substitutes or complements,tax policy emerges as a modus operandi for the various tenets of develop-ment. Section I discusses the different factors that have been cast as instru-mental in the development process and Section II assesses the role of taxpolicy in affecting these factors. Section III offers some concludingremarks.
I. The Determinants of Development
The savings literature is inherently connected with issues of externaleconomies and of surplus labor and labor productivity, problems whichare related to those of sectoral factor proportions. The issue of surplus la-bor—removal of a laborer from a peasant economy does not diminish pro-ductivity—is usually set against the backdrop of a lack of sufficient capitalfor growth. The right technique of production, that is, the right combina-tion of labor and capital, therefore, assumes importance in the debate onthe determinants of development. Among the seminal works in this areaare those of Lewis (1954), Eckaus (1955), and Sen (1960) for the factor-proportions problem1 and for the implication of a labor surplus on aneconomy's development, and those of Rosenstein-Rodan (1943), Scitovsky(1954), and Bator (1958) for the effects of external economies and for theneed for additional investment to internalize them.
Immediately, savings—and, consequently, investment—rise in signifi-cance in that savings form the scarce factor of production. Improved sav-ings performance thus becomes the vehicle of growth since investment fol-lows savings. Much of the related literature derives from Harrod (1939)and Domar's (1946) early formulations of the relationship between savingsand growth. The Harrod-Domar framework emphasizes the relationship
1These issues are inextricably linked with the "structural" feasibility or infeasibility of cap-ital-labor substitutability—as posed by more recent literature—and are, therefore, addressedin this context, below.
©International Monetary Fund. Not for Redistribution
LIMITS OF TAX POLICY 323
between the savings rate and the growth rate of an economy by stipulatingthat, in an economy with v as the capital-output ratio and s as the savingsrate, a unit of capital, K, produces 1/v units of output Y, of which s/v issaved, that is, the rate of growth of capital stock. This is also the rate ofgrowth of output g, since the capital-output ratio is kept constant.2
While investment determines the rate of growth in the early literature,later literature sees the conversion of savings to investment as a possiblebottleneck for development in the forms of external as well as domesticstructural rigidities. For example, investment goods may have, necessar-ily, a foreign exchange component. In the event of foreign exchange diffi-culties arising from export and import inelasticities, a country may befaced with a "foreign exchange gap" even when its "savings-investmentgap" is closed. External constraints in the form of foreign exchange totransform domestic savings into investment, of which imported capitalgoods are an integral part, are considered by Chenery and Strout (1966),Joshi (1967), Atkinson (1969), and Nelson (1970) among others. The for-eign exchange constraint is also caused by the nature of the primary com-modities exported—tea, coffee, cocoa, jute—usually represented by in-elastic supplies so that their price responsiveness is limited and by variousforms of protectionism against imports of light manufactured goods.
Domestic constraints on growth have several sources. First, as Nurkse(1953) points out, the problem in many developing countries is not a short-age of savings, but the limited size of the market leading to low investment:"Many articles that are in common use in the United States can be sold ina low-income country in quantities so limited that a machine working onlya few days or weeks can produce enough for a whole year's consumption"(p. 7). This problem of limitation is linked not only with the low standardof living in many a populous developing country but also with the low ab-sorptive capacity of those developing countries that are sparsely populated.
Second, investment in machinery that produces consumer goods is seenas a leakage from the long-run rate of growth by Mahalanobis (1953) andother "planner" economists. In other words, varying the composition ofcapital stock—in its respective uses as producing consumption or invest-ment goods—provides an extra handle to attain higher growth rates. In-vestment in the production of consumption goods that cannot be de-creased, therefore, limits growth.
Third, the difficulties in the transfer of technology from developed todeveloping countries are seen to reveal the insufficiencies of savings fordevelopment. Bruton (1955), in a review of the Harrod-Domar models in
2See Sen (1970, pp. 9-14).
©International Monetary Fund. Not for Redistribution
324 PARTHASARATHI SHOME
the context of developing countries, writes, "In the literature on economicdevelopment. . . emphasis is always placed on the need for more and morecapital. This is surely correct and was never a secret. It would appear, how-ever, that, though more capital is a necessary condition for speeding up therate of development, it is not a sufficient condition. . . . There is no reasonat all to assume that [modern] technology . . . can be bodily transferred toother countries" (pp. 335-36).
Fourth, the conversion of domestic savings or potential savings to invest-ment is seen to be arrested due to the lack of adequate financial institu-tions by Patrick (1966), Gurley and Shaw (1967), Goldsmith (1969),McKinnon (1973), and others. Gurley and Shaw (1967) emphasize four"technologies" for savings mobilization and allocation: self-finance, taxa-tion, debt-asset ratio, and foreign aid. Each technology has a yield and acost component, the net yield being its ability to raise savings and invest-ment, the economy's capital stock and, thus, the flow of consumption.While they treat all of the technologies as substitutes, they assert that, ineach phase of development, an economy has an optimal combination ofsavings-investment technologies, there being no optimal combinationacross space and over time. Patrick (1966) emphasizes the role of financialpolicy in encouraging savers to shift from tangible to financial assets andalso in increasing savings, investment, and production. He calls this anapproach of "supply-lending finance" where financial institutions are es-tablished and instruments created even before the emergence of a percepti-ble demand for them in an effort to stimulate growth. Growth is thus castas a direct result of an efficient financial system, whose success requiresgovernment participation and innovation as well as public confidence.
The literature since the 1970s focuses more on the role of government inthe development of the financial sector, for example, in Tanzi (1976),Bhatt and Meerman (1978), and Von Pischke and others (1983). Tanzi(1976), for example, states, "It would certainly be desirable for the devel-oping countries to have financial institutions that worked smoothly andefficiently to promote economic development. Unfortunately, many devel-oping countries . . . do not have the benefits of such institutions. . . .There is then a particular and rather obvious role that the government ofthese countries can perform" (p. 911). Bhatt and Meerman (1978) con-tinue in the same vein by bringing attention to the role of the central bankin the development of the financial sector. Emphasizing that the functionof a sound financial structure is to improve the mobility of financial re-sources and that innovations in financial structure are at least as importantfor development as those relating to the production structure, they identifythe central bank as the agency that should carry the responsibility for pro-moting a sound financial structure. Von Pischke and others (1983) havebrought together a number of essays testifying to the importance of the role
©International Monetary Fund. Not for Redistribution
LIMITS OF TAX POLICY 325
of "financial markets in rural areas, to their performance, structure, insti-tutions, operations, costs, and the nature of their services to rural people"(p. 5). To conclude, the ramifications of having a sound financial structureas an economy progresses along its path of development have been seen tobe significant since at least the 1960s.
Other scholars such as Myint (1954), Myrdal (1968), Haq (1971), andMeier (1976) differentiate between concepts of growth and development,and expenditures in areas traditionally perceived as consumption, such ashealth and education, are perceived as causal factors in the developmentprocess, most notably by Streeten (1967). Thus, development is perceivedby them as a conglomeration of policy objectives comprising an increase inreal per capita income sustained over a long time, pari passu with a mini-mally acceptable structure of distribution (such that no one is below aclearly defined poverty line), attained through a process that generally in-creases social welfare. Associated with these concerns, infrastructure ineducation, social services, health, and other issues under comprehensivephrases such as "minimum needs strategy" and "human resource develop-ment" are emphasized.
In this broader context of development, additional "structural" factorsin the development process may be listed. First, population has been per-ceived as a leading determinant of development. In the postwar literaturethis is addressed by Clark (1953), Ohlin (1967), Walsh (1970), andChandrasekhar (1972) and later by Hauser (1979) and Birdsall (1980).Among demographers, the accelerating rate of world population growth—especially in developing countries—is seen as the one basic impedimentto a nation's progress since population strains an economy's resources tothe hilt. Countering this proposition is the argument that populationgrowth makes market expansions possible. Thus, population growth dur-ing the modern era has both positive and negative influences on economicdevelopment: China, the country with the largest population in the world,has modified its population policy significantly over the years, stressing,relaxing, and once again stressing population control in recent years, asreported by Coale (1981) and others. In conclusion, the pressure of popula-tion on a country's economic performance cannot be denied. In countrieswith high population densities, the economic game may be reduced to oneof perennially catching up with population growth.
Second, the impact of the agricultural sector on development is a muchdiscussed topic. It cannot be adequately covered here except by noting cer-tain benchmark trends.3 While in the 1950s some, like Viner (1953) and
3The authors cited here certainly do not comprise an exhaustive list of those who haveaddressed these issues.
©International Monetary Fund. Not for Redistribution
326 PARTHASARATHI SHOME
Lewis (1954), envisage the agricultural sector as important, most econo-mists, including these two, also perceive it as a means for industrialization.In the 1960s, however, agriculture is assigned a direct role in development(Eicher and Witt (1964)). It begins to be realized that the squeeze on agri-culture in the 1950s has had negative ramifications for domestic demandas well as for exports during the 1960s. By the late 1960s, agricultural de-velopment becomes congruous with the concept of "development from be-low," and the literature of the 1970s, for example, Yudelman and others(1971), Lele (1975), Benor and Harrison (1977), Singh (1979), and Berryand Cline (1979), focuses on land reform, extension work, technologicalchange and innovation and the like. The relevance of agricultural incomesis reflected in the concern for the agricultural and nonagricultural-industrial terms of trade, predictably resulting in inconclusive debatesthrough the 1970s and 1980s. As in the case of rural-urban terms of trade,the debate over land reform has not yielded clear conclusions either.
In spite of the above-mentioned uncertainties, today the development ofagriculture per se is understood to be a vital component in the improve-ment of the quality of rural life and, given that significant proportions ofthe population of developing countries remain rural, an independent de-terminant of development. Raising the rate of financial savings may oftenhave little effect on an impermeable nonmonetized agrarian sector, andthe latter's welfare may need to be addressed directly if the goal is the de-velopment of the country as a whole.
Third, a considerable portion of the development literature, for exam-ple, Acharya (1975) and Rhee and Westphal (1977), considers the questionof relative factor-substitutability in production functions—its responsive-ness to price signals—as a structural problem, employing linear program-ming techniques in the analysis of the modern sector of developing econo-mies. If labor and capital were easily substitutable, population would notbe such a limiting factor, but empirical evidence on the factor-substitutionquestion is certainly not conclusive. The econometric approach, usuallymeasuring the factor-substitution elasticity between labor and capital, isoften termed as casual empiricism (Bhalla (1975), White (1978)). Little(1982), in a survey of the evidence on various country experiences, pointsout that low-income countries use more labor-intensive techniques com-pared with middle-income countries and very often use machinery that isobsolete in the latter. Therefore, he concludes that, where production is forexport markets where both compete, production factors are substitutablefor the same commodity. But this argument seems to be valid only whenconfined to goods that fit the argument.
In conclusion, one might say that the extent of factor-substitution possi-bilities in a developing economy depends on the pattern of its production.
©International Monetary Fund. Not for Redistribution
LIMITS OF TAX POLICY 327
During the 1950s and 1960s, when many of these countries achieved inde-pendence, a significant number of them opted for prestigious, capital-intensive projects in both the manufacturing and agricultural sectors. As aresult, and in the absence of domestic technology, the difficulty with factorsubstitution was seen by many of them as structural, leading, in turn, tothe belief that foreign exchange was the dominant gap in development, aconsideration that we have addressed above. By the 1970s, however, theoften minuscule returns from these unsuccessful programs re-educatedthese countries regarding shifting techniques and production structures,even if through the endurement of stresses and strains.
II. Tax Policy and the Determinants of Development
If a comprehensive concept of development includes raising the rates ofsaving and investment in order to increase output, raising social invest-ment in health, education and welfare, streamlining the rate of populationgrowth with the rate of accumulation of capital stock, and safeguarding areasonable terms of trade for the agricultural sector such that the latter'sgrowth is assured, the role of tax policy is automatically extended from oneof aiding the first criterion to all the others as well. Indeed, under appro-priate assumptions, tax policy can theoretically be a powerful instrumentin targeting all of the above factors of development. Whether such assump-tions hold in many developing countries then becomes the question to pon-der. Below we summarize the possibilities for and limitations of tax policyas a means of affecting the above-mentioned components of development.
Among the various means by which a developing economy may increaseits investment rate is taxation. By taxation, the government reserves a por-tion of the national resources for itself, often for capital construction proj-ects, or offers it to the private sector for similar purposes. The Union ofSoviet Socialist Republics has used a sizable turnover tax to finance capitalformation. Japan, in its early development, has used a land tax for thesame reason. Several low-income and middle-income countries—espe-cially in South Asia and Latin America—have attempted to raise domesticsavings through payroll taxes or compulsory social security schemes. Whilethese endeavors have mostly been mired by inflation in the case of LatinAmerica, they have been significantly successful in Asia—Malaysia, thePhilippines, Singapore, and Sri Lanka—where provident and pensionfunds seem not only to not have affected voluntary savings (Datta andShome (1981)) but have also made available to their governments long-term investment funds for development purposes, as the accumulatedfunds of these institutions have become the primary source of financing ofpublic debt (Shome (1986)). Theoretically, they can also be used to maxi-
©International Monetary Fund. Not for Redistribution
328 PARTHASARATHI SHOME
mize an economy's utility from consumption at an equilibrium factor pro-portion, that is, take an economy to its "golden path," with appropriatefinancing methods (Shome and Squire (1983)).
Apart from direct quantitative controls, tax policy has been used in at-tempts by developing countries to close their foreign exchange gapsthrough import tariffs, free trade zones, income tax incentives for exportdiversification, such as in the case of light manufacturing goods, or con-trarily, export duties in the case of traditional primary exports with lowelasticities of supply. Indeed, theoretically, export subsidies and importtaxes can have the same effects as those of exchange rate policies since a 10percent ad valorem subsidy on all exports matched by a 10 percent ad va-lorem duty on all imports has similar economic implications as a 10 per-cent devaluation, with one difference: the devaluation affects all items ofthe balance of payments, while the tax-subsidy mix affects only the mer-cantile items. Arguments that have been put forward in favor of a tax-subsidy mix are its selective nature and the lower inflationary pressure itgenerates.
Tax policy is utilized to encourage financial intermediation through spe-cial tax treatment of both dividends, to encourage the development of thestock market, and interest, including interest from banks, governments,housing authorities, and insurance institutions, as well as from unit trustsand the like. The role of fiscal policy, in general, as a complement to thedevelopment of the financial sector has already been discussed above. Taxpolicy, to change factor proportions, is also used widely through incentivepackages including accelerated depreciation, income tax holidays, labor-utilization relief, deductions for research and development, and so on. Al-most all developing countries boast a complex system of tax incentives, theramifications of which are often difficult to trace through the economicsystem. Corporate tax incentives that tend to reduce the cost of capital andsubsidize capital use exist side by side with labor-utilization relief thatshould encourage labor intensity, the net effect of the two often being in-tractable. However, tax policy usually remains the main tool in a country'scache of instruments in handling the factor-proportions problem.
Tax policy can similarly be used to affect the other factors of develop-ment. China now uses a heavy tax on married couples who have more thanone child. India and several other developing countries also experimentedwith the same type of tax in the early 1970s by offering higher personalincome tax breaks for smaller families, or by reducing the number of chil-dren for which tax credits and allowances are given. Thus, tax rates can bemanipulated to make the choice between having and not having childrenmore dependent on an opportunity cost that reflects an economic ratherthan a social cost.
©International Monetary Fund. Not for Redistribution
LIMITS OF TAX POLICY 329
The issue of a favorable treatment for agriculture in the literature onagricultural taxation has been much debated. Indeed, in the early litera-ture, several economists have argued that agricultural taxation is necessaryin developing countries to extract the agricultural surplus or for reasons ofinter-sectoral equity. Gandhi (1966), for example, quantifies the "under-taxation" of Indian agriculture relative to other sectors. According toWorld Bank (1982), in the last two decades not only has the proportion ofgross domestic product (GDP) accruing from the agricultural sector fallensharply in developing countries but so have the output per worker and thedifferentials in outputs per worker between agricultural and nonagricul-tural sectors. This type of reasoning has again brought about argumentsfor rehabilitating the agricultural sector with the aid of tax-subsidy poli-cies, for example, export duty removal and import duty exemptions fortractors, seeds, and fertilizers. It must be noted in this context that eventhe United States has long utilized direct subsidies to the farm sector forleaving land fallow or reducing the production of milk in order to assure adomestically acceptable terms of trade for this sector.
Tax and expenditure policy is, of course, the primary vehicle throughwhich human resource development—social security, social welfare, edu-cation, nutrition—has been attempted. Many developed countries, espe-cially those in Europe, have very high social expenditures in relation toGDP and the ratio has grown rapidly in recent years (Tanzi (1986)). In-deed, it has been argued that the huge deficits of European nations arenow being caused primarily by social welfare coverage and that furthertaxation on this account is almost impossible (Mach (1979)). For develop-ing countries, the use of tax policy to achieve the human welfare compo-nent of development is not yet exhausted. Countries such as Sri Lankahave demonstrated what can be achieved in terms of literacy and longevitywhen government fiscal policy takes these up as focal points of develop-ment, while others such as India have yet a long way to go.
Taxation has its limitations and difficulties, however. In general, thesuccess of tax policy depends on four tenets: that everyone is covered by thetax regime, that the incidence of taxation is known, that the rate of the taxis adequate, and that behavior is affected solely by price. If the first crite-rion is not met, for example as is the case in most developing countrieswhere the rural sector hardly pays any income tax, experimentation withhigher marginal tax rates on families with large numbers of children couldbe expected to have rather limited results for the country as a whole since ahigh proportion of the population may be rural. If the second condition isnot satisfied—tax incidence is difficult to determine with certainty—thenthe tax policy may yield results far removed from its objective. For exam-ple, if the corporate tax is passed on to labor, then an increase in the corpo-
©International Monetary Fund. Not for Redistribution
330 PARTHASARATHI SHOME
rate tax rate may not reduce capital-intensity (Shome (1978)). So the ques-tion of incidence is quite important in issues of factor-substitution. Third,if the rate of tax is not high enough, its potency is reduced. For example,legislating an array of taxes with low rates may have a smaller overall im-pact than a single tax with a high rate where the objective is the same.Fourth, if behavior is price responsive but is also affected by other lessobservable and noneconomic determinants, then the use of tax policy—byaffecting price—to modify behavior may be vitiated. Sending children—especially female—to school to receive primary education may not dependon whether it is free but on whether it is permitted by society.
Actual experience bears witness to all these concerns with respect to theexercise of tax policy. Taxes on the poor are limited by existing poverty.Taxes on the rich may affect savings adversely and are often difficult toinstitute politically. In primarily agricultural countries, tax collection is amajor hurdle as farmers are difficult to tax and often, marketed surplusesmay be small as a proportion of production. Similarly, the incidence ofdirect taxation is an issue that has remained unresolved through the dec-ades. Finally, not much space needs to be devoted here to the issue of non-price determinants of economic behavior since these are of greater concernto sociologists and anthropologists than to economists.
The limitations of tax policy may emerge from another direction. It isargued that if marginal tax rates are prohibitive, they may have detrimen-tal effects on the rate of growth by truncating the rates of saving, invest-ment, and labor supply. These concerns regarding the excessive use of taxpolicy have recently been revived under the banner of supply-side eco-nomics, which advocates the reduction of high marginal tax rates in orderto release the forces of supply of savings, investment, and labor. As thesupply of factors of production is purported to increase, output increasesand so does the rate of growth. However, as Tanzi (1983) points out byciting the example of the United States, even if supply did respond to taxchanges in the long run, tax policy by itself may not be able to yield supply-side effects in the face of noncomplementary changes in other policies,such as those relating to the monetary and financial sector. Also, whetheror not tax policy affects marginal tax rates may be crucial to the success oftax policy from the supply-side point of view. Thus, while economists haveto, and indeed, do assign a major role to tax policy in tackling develop-ment and growth, and sometimes successfully, it must be done withperspicacity.
III. Concluding Remarks
The above review, albeit selective, has attempted to put into perspectivethe role of the orthodox savings-investment strategy in the development
©International Monetary Fund. Not for Redistribution
LIMITS OF TAX POLICY 331
process as a prior step to a study of the importance of fiscal policy since,traditionally, fiscal policy has been treated as an integral part of a compos-ite orthodox strategy for development. In that endeavor, the chapter hasreviewed some of the seminal works in the growth literature based on theeffects of savings on growth, and forming the major building blocks intheir application to the early development literature on surplus-labor econ-omies. It then touched on the ensuing literature on the limitations of thisstrategy, such as the foreign exchange gap, the lack of an optimal financialstructure as well as of economic and social infrastructure, the populationexplosion, the role of the agricultural as opposed to the industrial sector,and the difficulties with neoclassical assumptions of factor-substitution.Indeed, it is found that the literature has often treated financial develop-ment, infrastructure, and agricultural development as alternative "tech-nologies" to development. Some economists have also emphasized thecomplementary roles that these elements can and need to play during thedevelopment process.
What emerges from this review for our ultimate purpose of the study ofthe effectiveness of tax policy is the following. Tax policy and, generally,fiscal policy form one component of the savings-investment strategy of de-velopment. There are ample views, however, in the literature on whichroute to take for development, the savings-investment strategy being onlyone among several or, at most forming a complement with other factors.The role of tax and fiscal policy, therefore, should be seen in this perspec-tive as an atomistic part of a much larger whole. Before placing excessivereliance on tax and fiscal policy, therefore, it is important to bear in mindthe relative position of tax and fiscal policy as a determinant of develop-ment. This is not to belittle the role of fiscal policy, however. Once we havea clearer impression of its limitations, we may be better able to form objec-tives and pursue goals to be addressed by tax and fiscal policy.
REFERENCES
Acharya, Shankar N., "Fiscal Financial Intervention, Factor Prices and FactorProportions: A Review of Issues," Bangladesh Development Studies (Dhaka),Vol. 3 (October 1975), pp. 429-64.
Atkinson, A.B., "Import Strategy and Growth Under Conditions of StagnantExport Earnings," Oxford Economic Papers, Vol. 21 (November 1969), pp.325-38.
Bator, Francis M., "The Anatomy of Market Failure," Quarterly Journal of Eco-nomics (Cambridge, Massachusetts), Vol. 72 (August 1958), pp. 351-79.
Benor, Daniel, and James Q. Harrison, Agricultural Extension: The Training andVisit System (Washington: World Bank, 1977).
©International Monetary Fund. Not for Redistribution
332 PARTHASARATHI SHOME
Berry, R. Albert, and William R. Cline, Agrarian Structure and Productivity inDeveloping Countries (Baltimore: Johns Hopkins University Press, 1979).
Bhalla, A.S., ed., Technology and Employment in Industry: A Case Study Ap-proach (Geneva: International Labor Organization, 1975).
Bhatt, V.V., and Jacob Meerman, "Resource Mobilization in Developing Coun-tries: Financial Institutions and Policies," World Development (Oxford), Vol.6 (January 1978), pp. 45-64.
Birdsall, Nancy, "Population and Poverty in the Developing World," World BankStaff Working Paper No. 404 (Washington, 1980).
Bruton, Henry J., "Growth Models and Underdeveloped Economies," Journal ofPolitical Economy (Chicago), Vol. 63 (August 1955), pp. 322-36.
Chandrasekhar, S., Infant Mortality, Population Growth, and Family Planning inIndia (Chapel Hill: University of North Carolina Press, 1972).
Chenery, Hollis B., and Alan M. Strout, "Foreign Assistance and Economic De-velopment," American Economic Review (Nashville, Tennessee), Vol. 56(September 1966), pp. 679-733.
Clark, Colin, "Population Growth and Living Standards," International LabourReview (Geneva), Vol. 68 (August 1953), pp. 99-117.
Clower, Robert W., George Dalton, Mitchell Harwitz, and A.A. Walters, GrowthWithout Development: An Economic Survey of Liberia (Evanston: North-western University Press, 1966).
Coale, Ansley J., "Population Trends, Population Policy, and Population Studiesin China," Population and Development Review (New York), Vol. 7 (March1981), pp. 85-97.
Datta, Gautam, and Parthasarathi Shome, "Social Security and Household Sav-ings: Asian Experience," Developing Economies (Tokyo), Vol. 19 (June1981), pp. 143-60.
Domar, Evsey D., "Capital Expansion, Rate of Growth, and Employment,"Econometrica (Evanston, Illinois), Vol. 14 (April 1946), pp. 137-47.
Eckaus, R.S., "The Factor Proportions Problem in Underdeveloped Areas,"American Economic Review (Nashville, Tennessee), Vol. 45 (September1955), pp. 539-65.
Eicher, Carl, and Lawrence Witt, eds., Agriculture in Economic Development(New York: McGraw-Hill, 1964).
Gandhi, V.P., Tax Burden on Indian Agriculture (Cambridge, Massachusetts:Harvard University Law School, 1966, mimeographed).
Goldsmith, R.W., Financial Structure and Development (New Haven: Yale Uni-versity Press, 1969).
Gurley, John G., and E.S. Shaw, "Financial Structure and Economic Develop-ment," Economic Development and Cultural Change (Chicago), Vol. 15(April 1967), pp. 257-68.
Haq, Mahbub ul, "Employment and Income Distribution in the 1970's: A NewPerspective," Pakistan Economic and Social Review (Lahore), Vol. 9 (June-December 1971), pp. 1-9.
Harrod, R.F., "An Essay in Dynamic Theory," Economic Journal (London), Vol.49 (March 1939), pp. 14-33.
©International Monetary Fund. Not for Redistribution
LIMITS OF TAX POLICY 333
Hauser, Philip M., ed., World Population and Development: Challenges and Pros-pects (New York: Syracuse University Press, 1979).
International Labor Office, "Investment Practice of Social Security Institutions inDeveloping Countries," Working Paper of the Social Security Department(Geneva, November 1983).
Joshi, Vijay, "Foreign Exchange Bottlenecks or Unwillingness to Save?" Economicand Political Weekly (Bombay), Vol. 2 (March 4, 1967), pp. 485-86.
Lele, Uma J., The Design of Rural Development: Lessons from Africa (Baltimore:Johns Hopkins University Press, 1975).
Lewis, W. Arthur, "Economic Development with Unlimited Supplies of Labour,"Manchester School of Economic and Social Studies, Vol. 22 (May 1954), pp.139-91.
Little, Ian M.D., Economic Development: Theory, Policy and International Rela-tions (New York: Basic Books, 1982).
Mach, E.P., "Selected Issues on Health and Employment," International LabourReview (Geneva), Vol. 118 (March-April 1979), pp. 133-45.
Mahalanobis, P.C., "Some Observations on the Process of Growth of National In-come," Sankhya (Calcutta), Vol. 12 (September 1953), pp. 307-12.
McKinnon, Ronald I., Money and Capital in Economic Development (Washing-ton: Brookings Institution, 1973).
Meier, Gerald M., Leading Issues in Economic Development (New York: OxfordUniversity Press, 3rd ed., 1976).
Myint, H., "An Interpretation of Economic Backwardness," Oxford EconomicPapers, Vol. 6 (June 1954), pp. 132-63.
Myrdal, Gunnar, Asian Drama: An Inquiry into the Poverty of Nations (NewYork: Twentieth Century Fund, 1968).
Nelson, Richard R., "The Effective Exchange Rate: Employment and Growth in aForeign Exchange-Constrained Economy," Journal of Political Economy(Chicago), Vol. 78 (May-June 1970), pp. 546-64.
Nurkse, Ragnar, "Some International Aspects of the Problem of Economic Devel-opment," American Economic Review, Papers and Proceedings of the Sixty-Fourth Meeting of the American Economic Association (Nashville, Tennes-see), Vol. 42 (May 1952), pp. 571-83.
, Problems of Capital Formation in Underdeveloped Countries (Oxford: B.Blackwell, 1953).
Ohlin, Goran, Population Control and Economic Development (Paris: Organiza-tion for Economic Cooperation and Development, 1967).
Patrick, Hugh T., "Financial Development and Economic Growth in Underdevel-oped Countries," Economic Development and Cultural Change (Chicago),Vol. 14 (January 1966), pp. 174-89.
Rhee, Yung W., and Larry E. Westphal, "A Micro, Econometric Investigation ofChoice of Technology," Journal of Development Economics (Amsterdam),Vol. 4 (September 1977), pp. 205-37.
Rosenstein-Rodan, P.N., "Problems of Industrialization of Eastern and South-Eastern Europe," Economic Journal (London), Vol. 53 (June-September1943), pp. 202-11.
©International Monetary Fund. Not for Redistribution
334 PARTHASARATHI SHOME
Scitovsky, Tibor, "Two Concepts of External Economies," Journal of PoliticalEconomy (Chicago), Vol. 62 (April 1954), pp. 143-51.
Sen, Amartya, Choice of Techniques: An Aspect of the Theory of Planned Eco-nomic Development (Oxford: B. Blackwell, 1960).
, ed., Growth Economics: Selected Readings (Harmondsworth, England:Penguin, 1970).
Shaw, Edward S., Financial Deepening in Economic Development (New York:Oxford University Press, 1973).
Shome, Parthasarathi, "The Incidence of the Corporation Tax in India: A GeneralEquilibrium Analysis," Oxford Economic Papers, Vol. 30 (March 1978), pp.64-73.
, ed., Fiscal Issues in South-East Asia: Comparative Studies of SelectedEconomies (Singapore: Oxford University Press, 1986).
, and Lyn Squire, "Alternative Mechanisms for Financing Social Security,"World Bank Staff Working Paper No. 625 (Washington, 1983).
Singh, Inderjit, "Small Farmers and the Landless in South Asia," World BankStaff Working Paper No. 320 (Washington, 1979).
Streeten, Paul, "The Use and Abuse of Models in Development Planning," in TheTeaching of Development Economics: Its Position in the Present State ofKnowledge, ed. by Kurt Martin and John Knapp (London: Frank Cass,1967).
Tanzi, Vito, "Fiscal Policy, Keynesian Economics and the Mobilization of Savingsin Developing Countries," World Development (Oxford), Vol. 4 (October-November 1976), pp. 907-17.
, "The Policy Lessons of Supply-Side Economics: A Very Personal Interpre-tation," paper presented at the Fifty-Third Annual Conference of the South-ern Economic Association (Washington, November 1983, mimeographed).
, "The Growth of Public Expenditure in Industrial Countries: An Interna-tional and Historical Perspective" (unpublished, International MonetaryFund, February 11, 1986).
Viner, Jacob, International Trade and Economic Development, lectures deliveredat the National University of Brazil (Oxford: Clarendon Press, 1953).
Von Pischke, J.D., Dale W. Adams, and Gordon Donald, eds., Rural FinancialMarkets in Developing Countries: Their Use and Abuse (Baltimore: JohnsHopkins University Press, 1983).
Walsh, B. Thomas, Economic Development and Population Control: A Fifty-YearProjection for Jamaica (New York: Praeger, 1970).
White, Lawrence J., "The Evidence on Appropriate Factor Proportions for Manu-facturing in Less Developed Countries: A Survey," Economic Developmentand Cultural Change (Chicago), Vol. 27 (October 1978), pp. 27-59.
World Bank, World Development Report, 1982 (New York: Oxford UniversityPress, 1982).
Yudelman, Montague, Gavan Butler, and Ranadev Banerji, TechnologicalChange in Agriculture and Employment in Developing Countries (Paris: Or-ganization for Economic Cooperation and Development, 1971).
©International Monetary Fund. Not for Redistribution
APPENDICES
©International Monetary Fund. Not for Redistribution

This page intentionally left blank
©International Monetary Fund. Not for Redistribution
APPENDIX I
Statistical Tables
Jitendra R. Modi, Somchai Richupan, and Chris Wu
Many of the statistical tables included in this Appendix were prepared in1984 as background material for the research project and, therefore, coverpublished data readily available at that time. As the focus of the projectwas on direct taxes, most tables in the Appendix cover information relatingto these taxes only.
List of Tables
Table A1. Selected Industrial and Developing Coun-tries: Total Tax Revenue as Percentage of Gross Do-mestic Product, 1980-82 339
Table A2. Selected Developing Countries: Total TaxRevenue by Type of Tax as Percentage of Gross Do-mestic Product, Three-Year Averages 344
Table A3. Selected Developing Countries: PercentageShares of Type of Tax in Total Tax Revenue, Three-Year Averages 350
Table A4. Selected Industrial and Developing Coun-tries: Revenue Significance of Individual IncomeTax, Five-Year Averages 356
Table A5. Selected Industrial and Developing Coun-tries: Proportion of Individual Income Taxpayers inTotal Population 360
Table A6. Selected Industrial and Developing Coun-tries: Proportion of Income Assessed to IndividualIncome Tax in Gross Domestic Product 361
337
©International Monetary Fund. Not for Redistribution
338 MODI • RICHUPAN • Wu
Table A7. Selected Industrial and Developing Coun-tries: Proportion of Individual Income Tax Collectedfrom Wage and Salary Incomes 362
Table A8. Selected Industrial and Developing Coun-tries: Proportion of Individual Income Tax CollectedThrough Tax-Withholding Schemes 363
Table A9. Selected Developing Countries: Characteris-tics of the Existing Nominal Income Tax RateSchedule, Around 1985 364
Table A10. Selected Developing Countries: Tax Deduc-tions and Exemptions Provided for Promotion ofPersonal Savings Under Individual Income Tax 366
Table Al l . Selected Developing Countries: Final With-holding Tax Rates Payable on Certain InvestmentIncomes 368
Table A12. Selected Developing Countries: MinimumIncome at Which Individual Income Tax Applies toa "Representative Taxpayer" in 1985 369
Table A13. Selected Developing Countries: NominalTax Rates Applicable to Corporate Profits 370
Table A14. Selected Industrial and Developing Coun-tries: Effective Corporate Tax Rates 373
Table A15. Selected Developing Countries: IncentivesAvailable to Corporate Entities Subject to ProfitsTax 374
Table A16. Selected Industrial and Developing Coun-tries: Export Duties as Percentage of F.o.b. Value ofExports, 1980-82 377
Table A17. Selected Industrial and Developing Coun-tries: Import Duties as Percentage of C.i.f. Value ofImports, 1980-82 381
©International Monetary Fund. Not for Redistribution
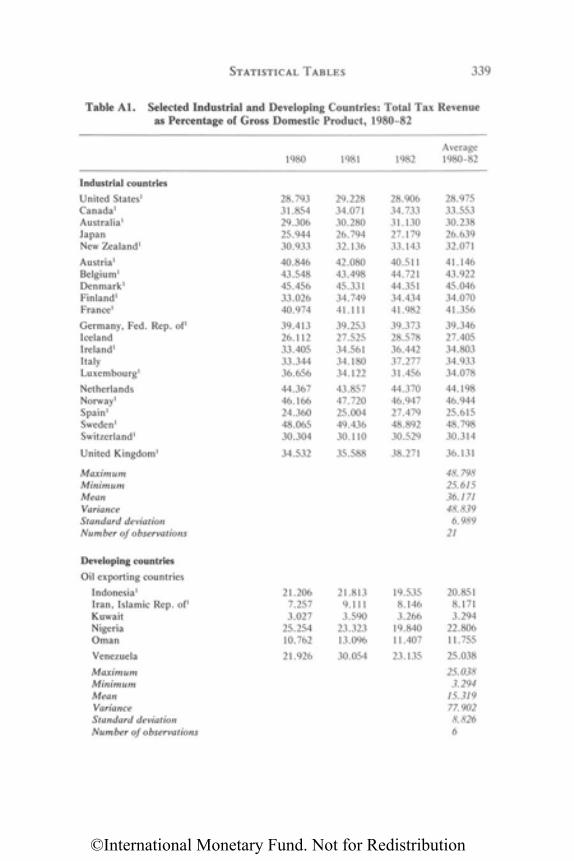
STATISTICAL TABLES 339
Table Al. Selected Industrial and Developing Countries: Total Tax Revenueas Percentage of Gross Domestic Product, 1980-82
Average1980 1981 1982 1980-82
Industrial countriesUnited States1
Canada1
Australia1
JapanNew Zealand1
Austria1
Belgium1
Denmark1
Finland1
France1
Germany, Fed. Rep. of1
IcelandIreland1
ItalyLuxembourg1
NetherlandsNorway1
Spain1
Sweden1
Switzerland1
United Kingdom1
MaximumMinimumMeanVarianceStandard deviationNumber of observations
Developing countriesOil exporting countries
Indonesia1
Iran, Islamic Rep. of1
KuwaitNigeriaOman
Venezuela
MaximumMinimumMeanVarianceStandard deviationNumber of observations
28.79331.85429.30625.94430.933
40.84643.54845.45633.02640.974
39.41326.11233.40533.34436.656
44.36746.16624.36048.06530.304
34.532
21.2067.2573.027
25.25410.762
21.926
29.22834.07130.28026.79432.136
42.08043.49845.33134.74941.111
39.25327.52534.56134.18034.122
43.85747.72025.00449.43630.110
35.588
21.8139.1113.590
23.32313.096
30.054
28.90634.73331.13027.17933.143
40.51144.72144.35134.43441.982
39.37328.57836.44237.27731.456
44.37046.94727.47948.89230.529
38.271
19.5358.1463.266
19.84011.407
23.135
28.97533.55330.23826.63932.071
41.14643.92245.04634.07041.356
39.34627.40534.80334.93334.078
44.19846.94425.61548.79830.314
36.131
48.79825.61536.17148.8396.989
21
20.8518.1713.294
22.80611.755
25.038
25.0383.294
15.31977.9028.8266
©International Monetary Fund. Not for Redistribution
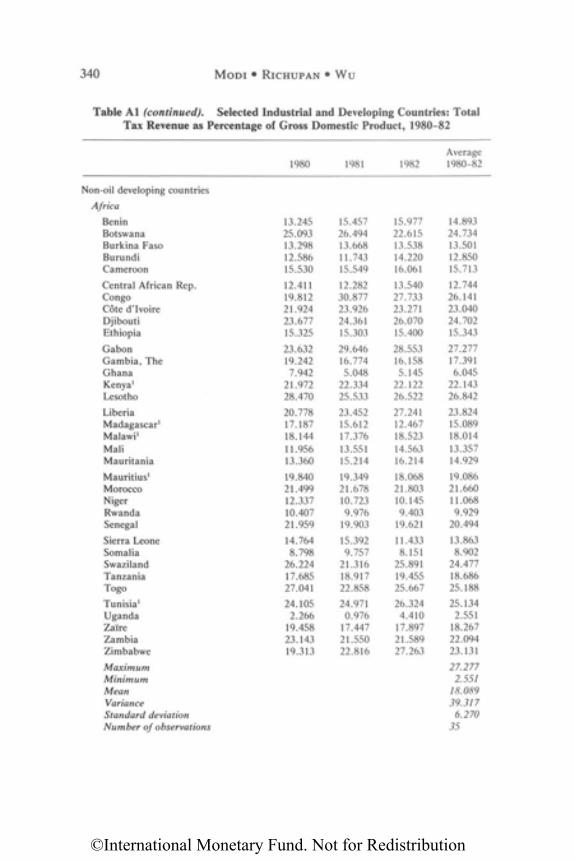
340 M O D I • RICHUPAN • Wu
Table Al (continued). Selected Industrial and Developing Countries: TotalTax Revenue as Percentage of Gross Domestic Product, 1980-82
Average1980 1981 1982 1980-82
Non-oil developing countries
Africa
BeninBotswanaBurkina FasoBurundiCameroon
Central African Rep.CongoCote d'IvoireDjiboutiEthiopia
GabonGambia, TheGhanaKenya1
Lesotho
LiberiaMadagascar1
Malawi1
MaliMauritania
Mauritius1
MoroccoNigerRwandaSenegal
Sierra LeoneSomaliaSwazilandTanzaniaTogo
Tunisia1
UgandaZaireZambiaZimbabwe
MaximumMinimumMeanVarianceStandard deviationNumber of observations
13.24525.09313.29812.58615.530
12.41119.81221.92423.67715.325
23.63219.2427.942
21.97228.470
20.77817.18718.14411.95613.360
19.84021.49912.33710.40721.959
14.7648.798
26.22417.68527.041
24.1052.266
19.45823.14319.313
15.45726.49413.66811.74315.549
12.28230.87723.92624.36115.303
29.64616.7745.048
22.33425.533
23.45215.61217.37613.55115.214
19.34921.67810.7239.976
19.903
15.3929.757
21.31618.91722.858
24.9710.976
17.44721.55022.816
15.97722.61513.53814.22016.061
13.54027.73323.27126.07015.400
28.55316.1585.145
22.12226.522
27.24112.46718.52314.56316.214
18.06821.80310.1459.403
19.621
11.4338.151
25.89119.45525.667
26.3244.410
17.89721.58927.263
14.89324.73413.50112.85015.713
12.74426.14123.04024.70215.343
27.27717.3916.045
22.14326.842
23.82415.08918.01413.35714.929
19.08621.66011.0689.929
20.494
13.8638.902
24.47718.68625.188
25.1342.551
18.26722.09423.131
27.2772.551
18.08939.317
6.27035
©International Monetary Fund. Not for Redistribution
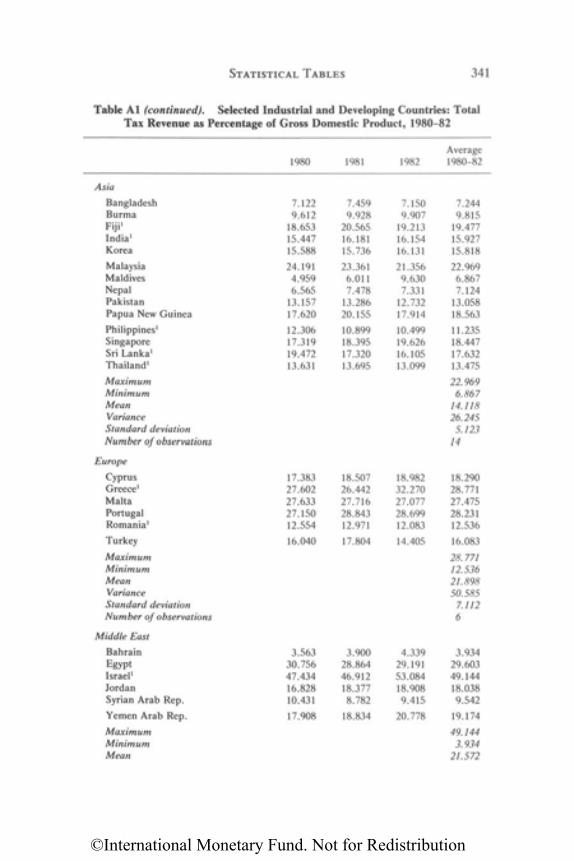
STATISTICAL TABLES 341
Table Al (continued). Selected Industrial and Developing Countries: TotalTax Revenue as Percentage of Gross Domestic Product, 1980-82
Average1980 1981 1982 1980-82
Asia
BangladeshBurmaFiji1
India1
Korea
MalaysiaMaldivesNepalPakistanPapua New Guinea
Philippines1
SingaporeSri Lanka1
Thailand1
MaximumMinimumMeanVarianceStandard deviationNumber of observations
Europe
CyprusGreece1
MaltaPortugalRomania1
Turkey
MaximumMinimumMeanVarianceStandard deviationNumber of observations
Middle East
BahrainEgyptIsrael1
JordanSyrian Arab Rep.
Yemen Arab Rep.
MaximumMinimumMean
7.1229.612
18.65315.44715.588
24.1914.9596.565
13.15717.620
12.30617.31919.47213.631
17.38327.60227.63327.15012.554
16.040
3.56330.75647.43416.82810.431
17.908
7.4599.928
20.56516.18115.736
23.3616.0117.478
13.28620.155
10.89918.39517.32013.695
18.50726.44227.71628.84312.971
17.804
3.90028.86446.91218.3778.782
18.834
7.1509.907
19.21316.15416.131
21.3569.6307.331
12.73217.914
10.49919.62616.10513.099
18.98232.27027.07728.69912.083
14.405
4.33929.19153.08418.9089.415
20.778
7.2449.815
19.47715.92715.818
22.9696.8677.124
13.05818.563
11.23518.44717.63213.475
22.9696.867
14.11826.245
5.12314
18.29028.77127.47528.23112.536
16.083
28.77112.53621.89850.585
7.1126
3.93429.60349.14418.0389.542
19.174
49.1443.934
21.572
©International Monetary Fund. Not for Redistribution
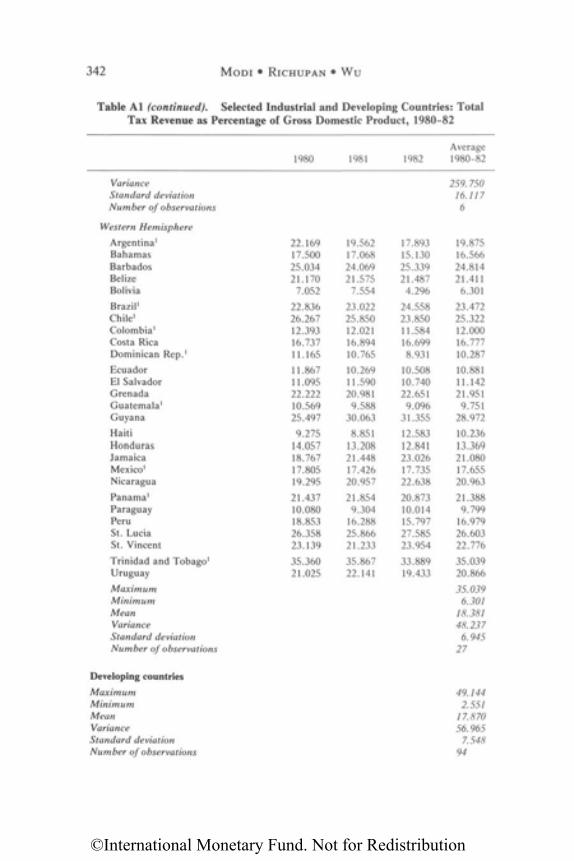
342 M O D I • RICHUPAN • Wu
Table Al (continued). Selected Industrial and Developing Countries: TotalTax Revenue as Percentage of Gross Domestic Product, 1980-82
Average1980 1981 1982 1980-82
VarianceStandard deviationNumber of observations
Western Hemisphere
Argentina1
BahamasBarbadosBelizeBolivia
Brazil1
Chile1
Colombia1
Costa RicaDominican Rep.1
EcuadorEl SalvadorGrenadaGuatemala1
Guyana
HaitiHondurasJamaicaMexico1
Nicaragua
Panama1
ParaguayPeruSt. LuciaSt. Vincent
Trinidad and Tobago1
Uruguay
MaximumMinimumMeanVarianceStandard deviationNumber of observations
Developing countries
MaximumMinimumMeanVarianceStandard deviationNumber of observations
22.16917.50025.03421.170
7.052
22.83626.26712.39316.73711.165
11.86711.09522.22210.56925.497
9.27514.05718.76717.80519.295
21.43710.08018.85326.35823.139
35.36021.025
19.56217.06824.06921.575
7.554
23.02225.85012.02116.89410.765
10.26911.59020.9819.588
30.063
8.85113.20821.44817.42620.957
21.8549.304
16.28825.86621.233
35.86722.141
17.89315.13025.33921.4874.296
24.55823.85011.58416.6998.931
10.50810.74022.6519.096
31.355
12.58312.84123.02617.73522.638
20.87310.01415.79727.58523.954
33.88919.433
259. 75016.1176
19.87516.56624.81421.411
6.301
23.47225.32212.00016.77710.287
10.88111.14221.9519.751
28.972
10.23613.36921.08017.65520.963
21.3889.799
16.97926.60322.776
35.03920.866
35.0396.301
18.38148.2376.945
27
49.1442.551
17.87056.965
7.54894
©International Monetary Fund. Not for Redistribution
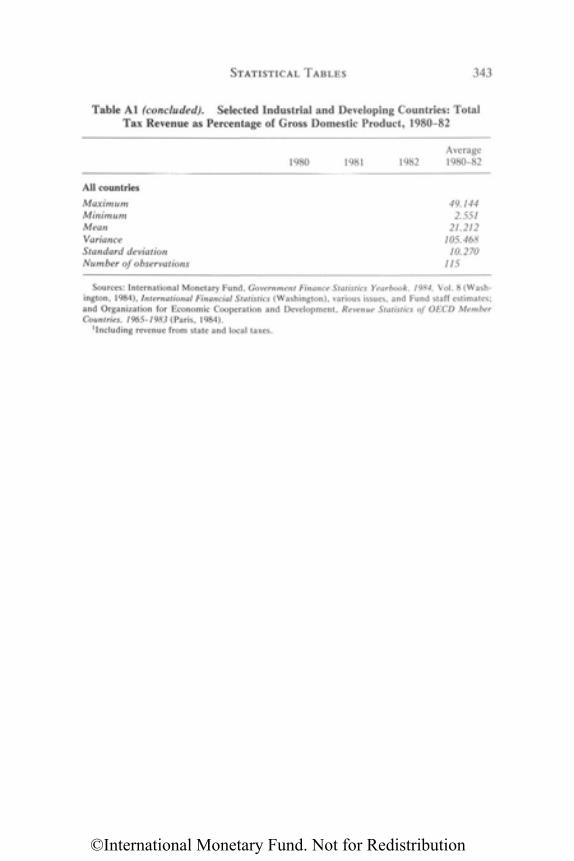
STATISTICAL TABLES 343
Table A1 (concluded). Selected Industrial and Developing Countries: TotalTax Revenue as Percentage of Gross Domestic Product, 1980-82
Average1980 1981 1982 1980-82
Sources: International Monetary Fund, Government Finance Statistics Yearbook, 1984, Vol. 8 (Wash-ington, 1984), International Financial Statistics (Washington), various issues, and Fund staff estimates;and Organization for Economic Cooperation and Development, Revenue Statistics of OECD MemberCountries, 1965-1983 (Paris, 1984).
1Including revenue from state and local taxes.
All countries
MaximumMinimumMeanVarianceStandard deviationNumber of observations
49.1442.551
21.212105.468
10.270115
©International Monetary Fund. Not for Redistribution
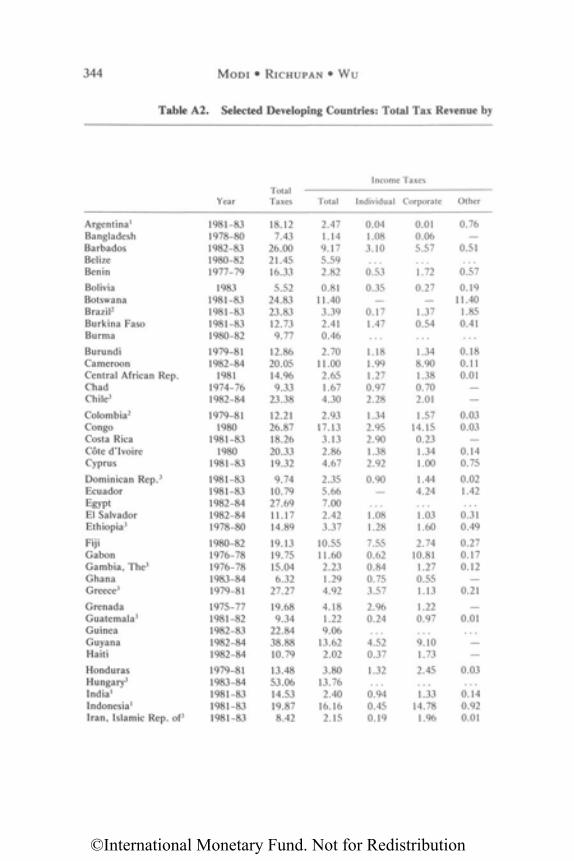
344 MODI • RICHUPAN • Wu
Table A2. Selected Developing Countries: Total Tax Revenue by
Argentina1
BangladeshBarbadosBelizeBeninBoliviaBotswanaBrazil2
Burkina FasoBurmaBurundiCameroonCentral African Rep.ChadChile3
Colombia2
CongoCosta RicaCote d'IvoireCyprus
Dominican Rep.3
EcuadorEgyptEl SalvadorEthiopia3
FijiGabonGambia, The3
GhanaGreece3
GrenadaGuatemala3
GuineaGuyanaHaitiHondurasHungary3
India1
Indonesia1
Iran, Islamic Rep. of3
1981-831978-801982-831980-821977-79
19831981-831981-831981-831980-821979-811982-84
19811974-761982-84
1979-811980
1981-831980
1981-83
1981-831981-831982-841982-841978-80
1980-821976-781976-781983-841979-811975-771981-821982-831982-841982-841979-811983-841981-831981-831981-83
18.127.43
26.0021.4516.335.52
24.8323.8312.739.77
12.8620.0514.969.33
23.3812.2126.8718.2620.3319.329.74
10.7927.6911.1714.89
19.1319.7515.046.32
27.27
19.689.34
22.8438.8810.7913.4853.0614.5319.878.42
2.471.149.175.592.820.81
11.403.392.410.462.70
11.002.651.674.30
2.9317.133.132.864.67
2.355.667.002.423.37
10.5511.602.231.294.92
4.181.229.06
13.622.023.80
13.762.40
16.162.15
0.041.083.10
0.530.35
0.171.47
1.181.991.270.972.281.342.952.901.382.920.90
1.081.28
7.550.620.840.753.57
2.960.24
4.520.371.32
0.940.450.19
0.010.065.57
1.720.27
1.370.54
1.348.901.380.702.011.57
14.150.231.341.001.444.24
1.031.602.74
10.811.270.551.131.220.97
9.101.732.45
1.3314.781.96
0.76—
0.51
0.570.19
11.401.850.41
0.180.110.01
0.030.03
0.140.750.021.42
0.310.490.270.170.12
0.21
0.01
——
0.03
0.140.920.01
Income TaxesTotal
Year Taxes Total Individual Corporate Other
©International Monetary Fund. Not for Redistribution
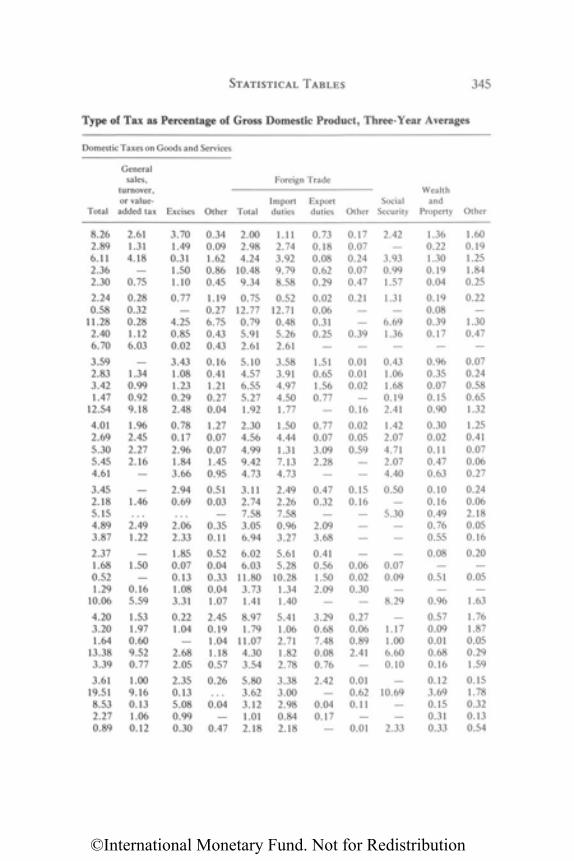
STATISTICAL TABLES 345
Type of Tax as Percentage of Gross Domestic Product, Three-Year Averages
Domestic Taxes on Goods and Services
Generalsales, Foreign Trade
turnover, Wealthor value- Import Export Social and
Total added tax Excises Other Total duties duties Other Security Property Other
8.262.896.112.362.30
2.240.58
11.282.406.70
3.592.833.421.47
12.54
4.012.695.305.454.61
3.452.185.154.893.87
2.371.680.521.29
10.06
4.203.201.64
13.383.39
3.6119.518.532.270.89
2.611.314.18
0.75
0.280.320.281.126.03
_
1.340.990.929.18
1.962.452.272.16
—
1.46
2.491.22
—1.50
—0.165.59
1.531.970.609.520.77
1.009.160.131.060.12
3.701.490.311.501.10
0.77—
4.250.850.02
3.431.081.230.292.48
0.780.172.961.843.66
2.940.69
2.062.33
1.850.070.131.083.31
0.221.04
2.682.05
2.350.135.080.990.30
0.340.091.620.860.45
1.190.276.750.430.43
0.160.411.210.270.04
1.270.070.071.450.95
0.510.03
—0.350.11
0.520.040.330.041.07
2.450.191.041.180.57
0.26
0.04—
0.47
2.002.984.24
10.489.34
0.7512.770.795.912.61
5.104.576.555.271.92
2.304.564.999.424.73
3.112.747.583.056.94
6.026.03
11.803.731.41
8.971.79
11.074.303.54
5.803.623.121.012.18
1.112.743.929.798.58
0.5212.710.485.262.61
3.583.914.974.501.77
1.504.441.317.134.73
2.492.267.580.963.27
5.615.28
10.281.341.40
5.411.062.711.822.78
3.383.002.980.842.18
0.730.180.080.620.29
0.020.060.310.25
1.510.651.560.77
—
0.770.073.092.28
—
0.470.32
2.093.68
0.410.561.502.09
3.290.687.480.080.76
2.42—
0.040.17
—
0.170.070.240.070.47
0.21—
0.39
0.010.010.02
0.16
0.020.050.59
—
0.150.16
——
0.060.020.30
0.270.060.892.41
—
0.010.620.11
—0.01
2.42
3.930.991.57
1.31—
6.691.36
0.431.061.680.192.41
1.422.074.712.074.40
0.50
5.30——
0.070.09
8.29
1.171.006.600.10
10.69——
2.33
1.360.221.300.190.04
0.190.080.390.17
0.960.350.070.150.90
0.300.020.110.470.63
0.100.160.490.760.55
0.08—
0.51
0.96
0.570.090.010.680.16
0.123.690.150.310.33
1.600.191.251.840.25
0.22—
1.300.47
0.070.240.580.651.32
1.250.410.070.060.27
0.240.062.180.050.16
0.20—
0.05—
1.63
1.761.870.050.291.59
0.151.780.320.130.54
©International Monetary Fund. Not for Redistribution
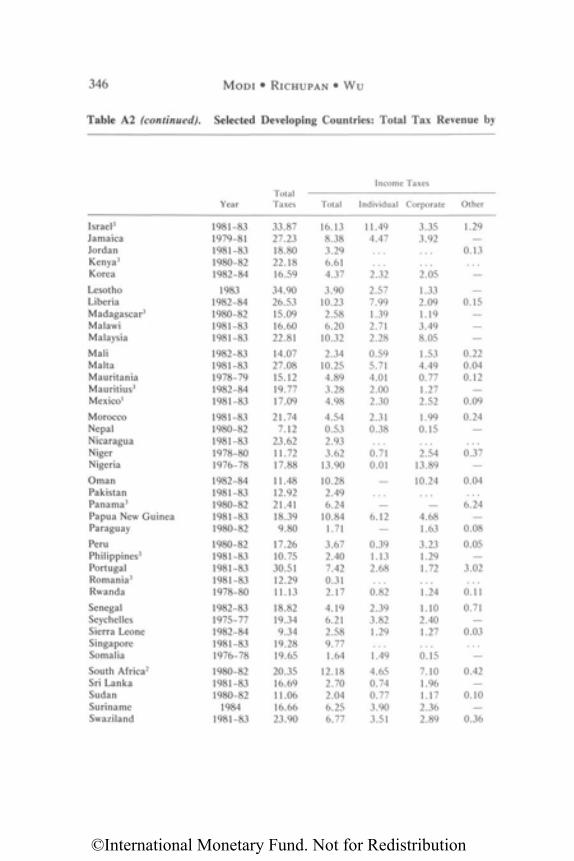
346 M O D I • RICHUPAN • Wu
Table A2 (continued). Selected Developing Countries: Total Tax Revenue by
Income TaxesTotal
Year Taxes Total Individual Corporate Other
Israel3
JamaicaJordanKenya3
Korea
LesothoLiberiaMadagascar3
MalawiMalaysia
MaliMaltaMauritaniaMauritius3
Mexico1
MoroccoNepalNicaraguaNigerNigeria
OmanPakistanPanama3
Papua New GuineaParaguay
PeruPhilippines3
PortugalRomania3
Rwanda
SenegalSeychellesSierra LeoneSingaporeSomalia
South Africa2
Sri LankaSudanSurinameSwaziland
1981-831979-811981-831980-821982-84
19831982-841980-821981-831981-83
1982-831981-831978-791982-841981-83
1981-831980-821981-831978-801976-78
1982-841981-831980-821981-831980-82
1980-821981-831981-831981-831978-80
1982-831975-771982-841981-831976-78
1980-821981-831980-82
19841981-83
33.8727.2318.8022.1816.59
34.9026.5315.0916.6022.81
14.0727.0815.1219.7717.09
21.747.12
23.6211.7217.88
11.4812.9221.4118.399.80
17.2610.7530.5112.2911.13
18.8219.349.34
19.2819.65
20.3516.6911.0616.6623.90
16.138.383.296.614.37
3.9010.232.586.20
10.32
2.3410.254.893.284.98
4.540.532.933.62
13.90
10.282.496.24
10.841.71
3.672.407.420.312.17
4.196.212.589.771.64
12.182.702.046.256.77
11.494.47
2.32
2.577.991.392.712.28
0.595.714.012.002.30
2.310.38
0.710.01
6.12
0.391.132.68
0.82
2.393.821.29
1.49
4.650.740.773.903.51
3.353.92
2.05
1.332.091.193.498.05
1.534.490.771.272.52
1.990.15
2.5413.89
10.24
4.681.63
3.231.291.72
1.24
1.102.401.27
0.15
7.101.961.172.362.89
1.29
0.13
0.15—
0.220.040.12
0.09
0.24—
0.37—
0.04
6.24—
0.08
0.05—
3.02
0.11
0.71—
0.03
—
0.42—
0.10—
0.36
©International Monetary Fund. Not for Redistribution
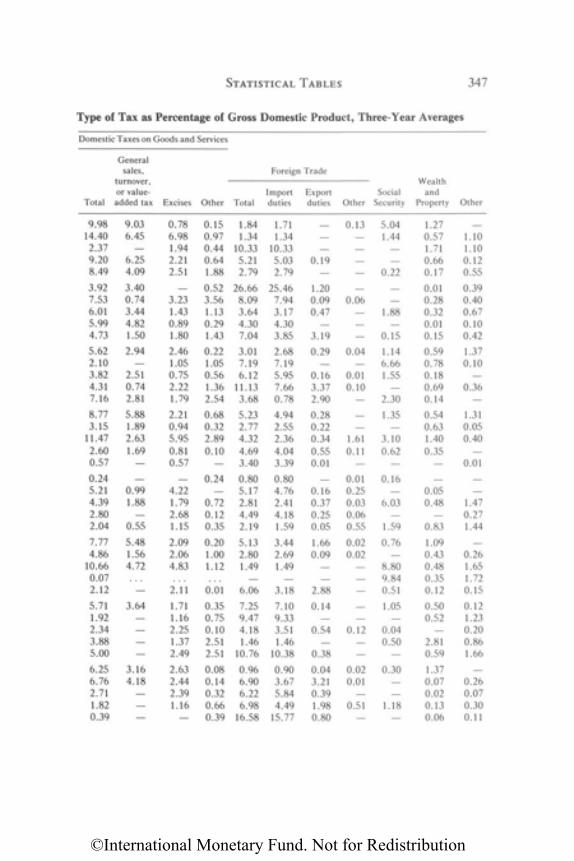
STATISTICAL TABLES 347
Type of Tax as Percentage of Gross Domestic Product, Three-Year Averages
Domestic Taxes on Goods and Services
Generalsales, Foreign Trade
turnover, Wealthor value- Import Export Social and
Total added tax Excises Other Total duties duties Other Security Property Other
9.9814.402.379.208.49
3.927.536.015.994.73
5.622.103.824.317.16
8.773.15
11.472.600.57
0.245.214.392.802.04
7.774.86
10.660.072.12
5.711.922.343.885.00
6.256.762.711.820.39
9.036.45
—6.254.09
3.400.743.444.821.50
2.94—
2.510.742.81
5.881.892.631.69
—
0.991.88
—0.55
5.481.564.72
—
3.64
———
3.164.18
—
0.786.981.942.212.51
3.231.430.891.80
2.461.050.752.221.79
2.210.945.950.810.57
4.221.792.681.15
2.092.064.83
2.11
1.711.162.251.372.49
2.632.442.391.16
—
0.150.970.440.641.88
0.523.561.130.291.43
0.221.050.561.362.54
0.680.322.890.10
—
0.24
0.720.120.35
0.201.001.12
0.01
0.350.750.102.512.51
0.080.140.320.660.39
1.841.34
10.335.212.79
26.668.093.644.307.04
3.017.196.12
11.133.68
5.232.774.324.693.40
0.805.172.814.492.19
5.132.801.49
—6.06
7.259.474.181.46
10.76
0.966.906.226.98
16.58
1.711.34
10.335.032.79
25.467.943.174.303.85
2.687.195.957.660.78
4.942.552.364.043.39
0.804.762.414.181.59
3.442.691.49
—3.18
7.109.333.511.46
10.38
0.903.675.844.49
15.77
—0.19
—
1.200.090.47
3.19
0.29
0.163.372.90
0.280.220.340.550.01
0.160.370.250.05
1.660.09
—2.88
0.14
0.54—
0.38
0.043.210.391.980.80
0.13
—
—
0.06
—
0.04
0.010.10
_
1.610.11
—
0.010.250.030.060.55
0.020.02
——
__0.12
——
0.020.01
0.51—
5.041.44
—
0.22
1.88
0.15
1.146.661.55
2.30
1.35
3.100.62
—
0.16
6.03—
1.59
0.76
8.809.840.51
1.05
0.040.50
—
0.30
1.18—
1.270.571.710.660.17
0.010.280.320.010.15
0.590.780.180.690.14
0.540.631.400.35
—
0.050.48
—0.83
1.090.430.480.350.12
0.500.52
2.810.59
1.370.070.020.130.06
1.101.100.120.55
0.390.400.670.100.42
1.370.10
0.36
1.310.050.40
0.01
1.470.271.44
0.261.651.720.15
0.121.230.200.861.66
0.260.070.300.11
©International Monetary Fund. Not for Redistribution
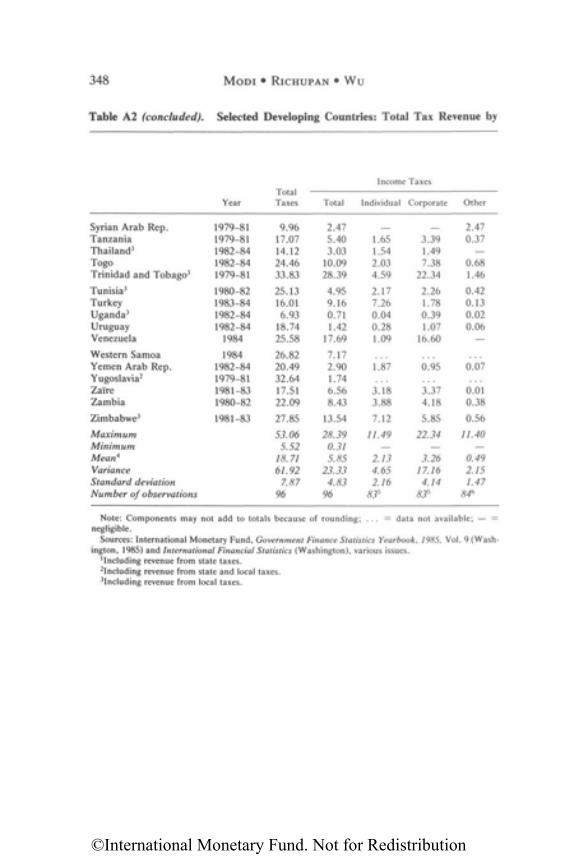
348 M O D I • RICHUPAN • Wu
Table A2 (concluded). Selected Developing Countries: Total Tax Revenue by
Note: Components may not add to totals because of rounding; . . . = data not available; — =negligible.
Sources: International Monetary Fund, Government Finance Statistics Yearbook, 1985, Vol. 9 (Wash-ington, 1985) and International Financial Statistics (Washington), various issues.
1Including revenue from state taxes.2including revenue from state and local taxes.3Including revenue from local taxes.
Income TaxesTotal
Year Taxes Total Individual Corporate Other
Syrian Arab Rep.TanzaniaThailand3
TogoTrinidad and Tobago3
Tunisia3
TurkeyUganda3
UruguayVenezuela
Western SamoaYemen Arab Rep.Yugoslavia2
ZaireZambia
Zimbabwe3
MaximumMinimumMean4
VarianceStandard deviationNumber of observations
1979-811979-811982-841982-841979-81
1980-821983-841982-841982-84
1984
19841982-841979-811981-831980-82
1981-83
9.9617.0714.1224.4633.83
25.1316.016.93
18.7425.58
26.8220.4932.6417.5122.09
27.85
53.065.52
18.7161.92
7.8796
2.475.403.03
10.0928.39
4.959.160.711.42
17.69
7.172.901.746.568.43
13.54
28.390.315.85
23.334.83
96
1.651.542.034.59
2.177.260.040.281.09
1.87
3.183.88
7.12
11.49—
2.134.652.16
835
3.391.497.38
22.34
2.261.780.391.07
16.60
0.95
3.374.18
5.85
22.34—
3.2617.164.14
835
2.470.37
—0.681.46
0.420.130.020.06
0.07
0.010.38
0.56
11.40—
0.492.151.47
846
©International Monetary Fund. Not for Redistribution
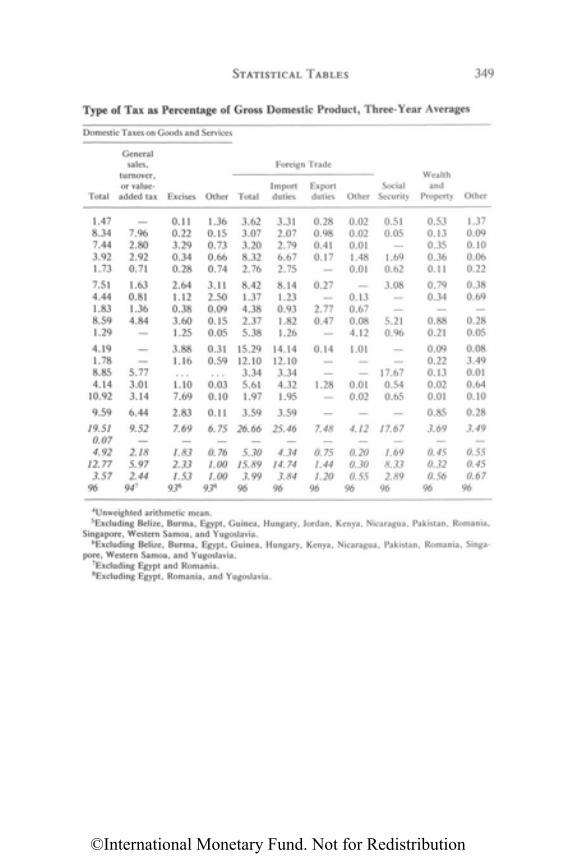
STATISTICAL TABLES 349
Type of Tax as Percentage of Gross Domestic Product, Three-Year Averages
4Unweighted arithmetic mean.5Excluding Belize, Burma, Egypt, Guinea, Hungary, Jordan, Kenya, Nicaragua, Pakistan, Romania,
Singapore, Western Samoa, and Yugoslavia.6Excluding Belize, Burma, Egypt, Guinea, Hungary, Kenya, Nicaragua, Pakistan, Romania, Singa-
pore, Western Samoa, and Yugoslavia.7Excluding Egypt and Romania.8Excluding Egypt, Romania, and Yugoslavia.
Domestic Taxes on Goods and Services
Generalsales, Foreign Trade
turnover, Wealthor value- Import Export Social and
Total added tax Excises Other Total duties duties Other Security Property Other
1.478.347.443.921.73
7.514.441.838.591.29
4.191.788.854.14
10.92
9.59
19.510.074.92
12.773.57
96
_
7.962.802.920.71
1.630.811.364.84
—
—5.773.013.14
6.44
9.52—
2.185.972.44
947
0.110.223.290.340.28
2.641.120.383.601.25
3.881.16
1.107.69
2.83
7.69—
1.832.331.53
938
1.360.150.730.660.74
3.112.500.090.150.05
0.310.59
0.030.10
0.11
6.75
0.761.001.00
938
3.623.073.208.322.76
8.421.374.382.375.38
15.2912.103.345.611.97
3.59
26.66
5.3015.893.99
96
3.312.072.796.672.75
8.141.230.931.821.26
14.1412.103.344.321.95
3.59
25.46
4.3414.743.84
96
0.280.980.410.17
0.27
2.770.47
—
0.14——
1.28—
7.48
0.751.441.20
96
0.020.020.011.480.01
_
0.130.670.084.12
1.01——
0.010.02
4.12—
0.200.300.55
96
0.510.05
—1.690.62
3.08
5.210.96
—17.670.540.65
17.67—
1.698.332.89
96
0.530.130.350.360.11
0.790.34
0.880.21
0.090.220.130.020.01
0.85
3.69—
0.450.320.56
96
1.370.090.100.060.22
0.380.69
0.280.05
0.083.490.010.640.10
0.28
3.49—
0.550.450.67
96
©International Monetary Fund. Not for Redistribution
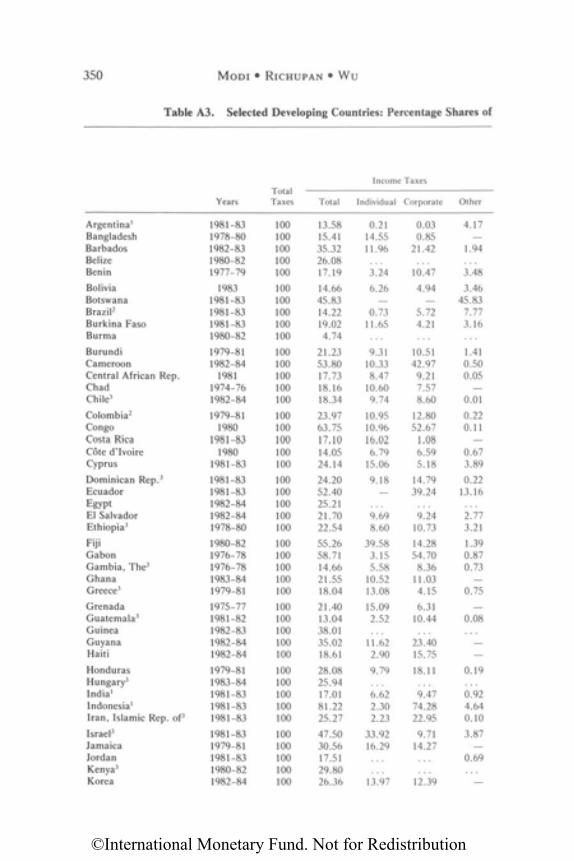
350 M O D I • RICHUPAN • WU
Table A3. Selected Developing Countries: Percentage Shares of
Argentina1
BangladeshBarbadosBelizeBenin
BoliviaBotswanaBrazil2
Burkina FasoBurma
BurundiCameroonCentral African Rep.ChadChile3
Colombia2
CongoCosta RicaCote d'IvoireCyprus
Dominican Rep.3
EcuadorEgyptEl SalvadorEthiopia3
FijiGabonGambia, The3
GhanaGreece3
GrenadaGuatemala3
GuineaGuyanaHaiti
HondurasHungary3
India1
Indonesia1
Iran, Islamic Rep. of3
Israel3
JamaicaJordanKenya3
Korea
1981-831978-801982-831980-821977-79
19831981-831981-831981-831980-82
1979-811982-84
19811974-761982-84
1979-811980
1981-831980
1981-83
1981-831981-831982-841982-841978-80
1980-821976-781976-781983-841979-81
1975-771981-821982-831982-841982-84
1979-811983-841981-831981-831981-83
1981-831979-811981-831980-821982-84
100100100100100
100100100100100
100100100100100
100100100100100
100100100100100
100100100100100
100100100100100
100100100100100
100100100100100
13.5815.4135.3226.0817.19
14.6645.8314.2219.024.74
21.2353.8017.7318.1618.34
23.9763.7517.1014.0524.14
24.2052.4025.2121.7022.54
55.2658.7114.6621.5518.04
21.4013.0438.0135.0218.61
28.0825.9417.0181.2225.27
47.5030.5617.5129.8026.36
0.2114.5511.96
3.24
6.26
0.7311.65
9.3110.338.47
10.609.74
10.9510.9616.026.79
15.06
9.18
9.698.60
39.583.155.58
10.5213.08
15.092.52
11.622.90
9.79
6.622.302.23
33.9216.29
13.97
0.030.85
21.42
10.47
4.94
5.724.21
10.5142.979.217.578.60
12.8052.67
1.086.595.18
14.7939.24
9.2410.73
14.2854.70
8.3611.034.15
6.3110.44
23.4015.75
18.11
9.4774.2822.95
9.7114.27
12.39
4.17
1.94
3.48
3.4645.83
7.773.16
1.410.500.05
0.01
0.220.11
0.673.89
0.2213.16
2.773.21
1.390.870.73
0.75_
0.08
—
0.19
0.924.640.10
3.87
0.69
—
Income TaxesTotal
Years Taxes Total Individual Corporate Other
©International Monetary Fund. Not for Redistribution
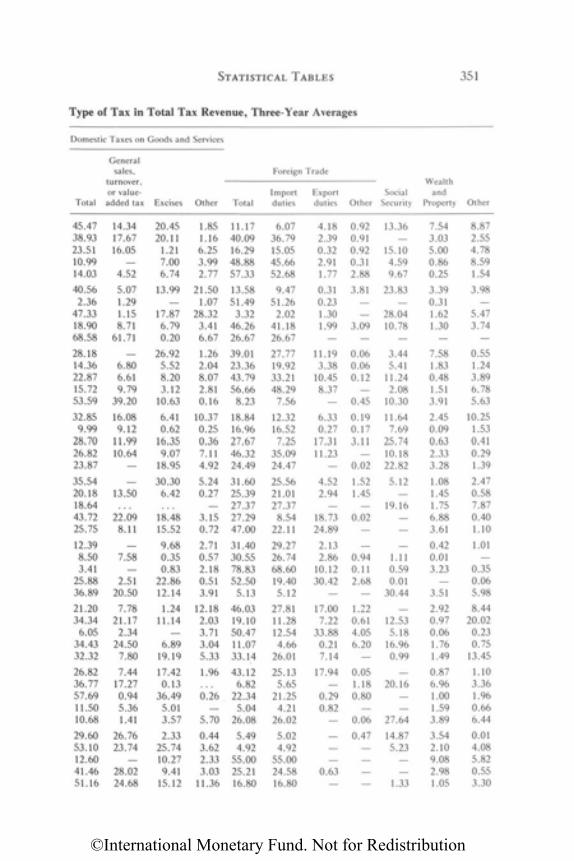
STATISTICAL TABLES 351
Type of Tax in Total Tax Revenue, Three-Year Averages
Domestic Taxes on Goods and Services
Generalsales, Foreign Trade
turnover, Wealthor value- Import Export Social and
Total added tax Excises Other Total duties duties Other Security Property Other
45.4738.9323.5110.9914.03
40.562.36
47.3318.9068.58
28.1814.3622.8715.7253.59
32.859.99
28.7026.8223.87
35.5420.1818.6443.7225.75
12.398.503.41
25.8836.89
21.2034.34
6.0534.4332.32
26.8236.7757.6911.5010.68
29.6053.1012.6041.4651.16
14.3417.6716.05
—4.52
5.071.291.158.71
61.71_
6.806.619.79
39.20
16.089.12
11.9910.64
—
13.50
22.098.11
_
7.58
2.5120.50
7.7821.17
2.3424.50
7.80
7.4417.270.945.361.41
26.7623.74
28.0224.68
20.4520.11
1.217.006.74
13.99
17.876.790.20
26.925.528.203.12
10.63
6.410.62
16.359.07
18.95
30.306.42
18.4815.52
9.680.350.83
22.8612.14
1.2411.14
6.8919.19
17.420.13
36.495.013.57
2.3325.7410.279.41
15.12
1.851.166.253.992.77
21.501.07
28.323.416.67
1.262.048.072.810.16
10.370.250.367.114.92
5.240.27
—3.150.72
2.710.572.180.513.91
12.182.033.713.045.33
1.96
0.26
5.70
0.443.622.333.03
11.36
11.1740.0916.2948.8857.33
13.5851.49
3.3246.2626.67
39.0123.3643.7956.66
8.23
18.8416.9627.6746.3224.49
31.6025.3927.3727.2947.00
31.4030.5578.8352.50
5.13
46.0319.1050.4711.0733.14
43.126.82
22.345.04
26.08
5.494.92
55.0025.2116.80
6.0736.7915.0545.6652.68
9.4751.26
2.0241.1826.67
27.7719.9233.2148.29
7.56
12.3216.527.25
35.0924.47
25.5621.0127.378.54
22.11
29.2726.7468.6019.405.12
27.8111.2812.544.66
26.01
25.135.65
21.254.21
26.02
5.024.92
55.0024.5816.80
4.182.390.322.911.77
0.310.231.301.99
11.193.38
10.458.37
6.330.27
17.3111.23
—
4.522.94
—18.7324.89
2.132.86
10.1230.42
—
17.007.22
33.880.217.14
17.94
0.290.82
—_
0.63—
0.920.910.920.312.88
3.81
3.09
0.060.060.12
0.45
0.190.173.11
—0.02
1.521.45
—0.02
_
0.940.112.68
—
1.220.614.056.20
—
0.051.180.80
0.06
0.47—
—
13.36
15.104.599.67
23.83
28.0410.78
3.445.41
11.242.08
10.30
11.647.69
25.7410.1822.82
5.12
19.16
_
1.110.590.01
30.44_
12.535.18
16.960.99
_
20.16
27.64
14.875.23
1.33
7.543.035.000.860.25
3.390.311.621.30
7.581.830.481.513.91
2.450.090.632.333.28
1.081.451.756.883.61
0.420.013.23
3.51
2.920.970.061.761.49
0.876.961.001.593.89
3.542.109.082.981.05
8.872.554.788.591.54
3.98—
5.473.74
0.551.243.896.785.63
10.251.530.410.291.39
2.470.587.870.401.10
1.01
0.350.065.98
8.4420.020.230.75
13.45
1.103.361.960.666.44
0.014.085.820.553.30
©International Monetary Fund. Not for Redistribution
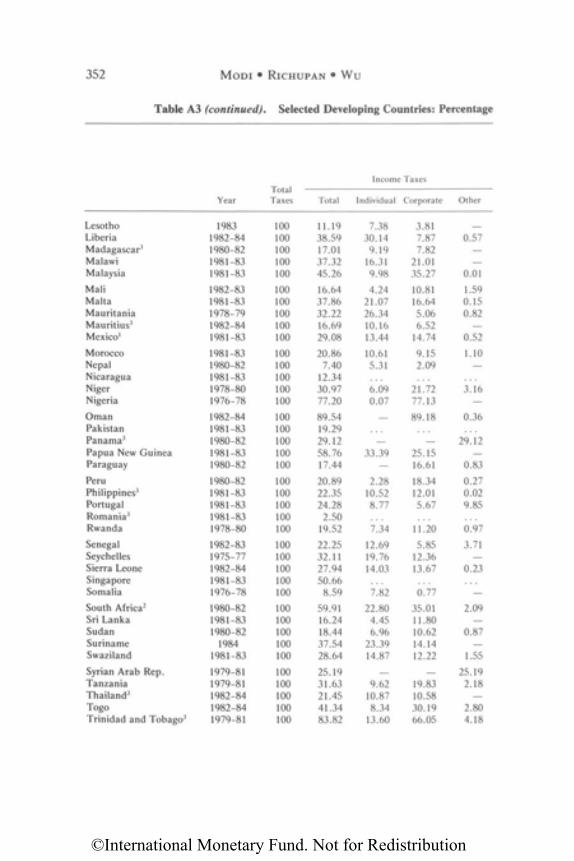
352 MODI • RICHUPAN • WU
Table A3 (continued). Selected Developing Countries: Percentage
Income TaxesTotal
Year Taxes Total Individual Corporate Other
LesothoLiberiaMadagascar3
MalawiMalaysia
MaliMaltaMauritaniaMauritius3
Mexico1
MoroccoNepalNicaraguaNigerNigeria
OmanPakistanPanama3
Papua New GuineaParaguay
PeruPhilippines3
PortugalRomania3
Rwanda
SenegalSeychellesSierra LeoneSingaporeSomalia
South Africa2
Sri LankaSudanSurinameSwaziland
Syrian Arab Rep.TanzaniaThailand3
TogoTrinidad and Tobago3
19831982-841980-821981-831981-83
1982-831981-831978-791982-841981-83
1981-831980-821981-831978-801976-78
1982-841981-831980-821981-831980-82
1980-821981-831981-831981-831978-80
1982-831975-771982-841981-831976-78
1980-821981-831980-82
19841981-83
1979-811979-811982-841982-841979-81
100100100100100
100100100100100
100100100100100
100100100100100
100100100100100
100100100100100
100100100100100
100100100100100
11.1938.5917.0137.3245.26
16.6437.8632.2216.6929.08
20.867.40
12.3430.9777.20
89.5419.2929.1258.7617.44
20.8922.3524.28
2.5019.52
22.2532.1127.9450.66
8.59
59.9116.2418.4437.5428.64
25.1931.6321.4541.3483.82
7.3830.149.19
16.319.98
4.2421.0726.3410.1613.44
10.615.31
6.090.07
_
33.39—
2.2810.528.77
7.34
12.6919.7614.03
7.82
22.804.456.96
23.3914.87
9.6210.878.34
13.60
3.817.877.82
21.0135.27
10.8116.645.066.52
14.74
9.152.09
21.7277.13
89.18
25.1516.61
18.3412.015.67
11.20
5.8512.3613.67
0.77
35.0111.8010.6214.1412.22
_
19.8310.5830.1966.05
_0.57
——
0.01
1.590.150.82
0.52
1.10—
3.16—
0.36
29.12
0.83
0.270.029.85
0.97
3.71
0.23
2.09
0.87
1.55
25.192.18
2.804.18
©International Monetary Fund. Not for Redistribution
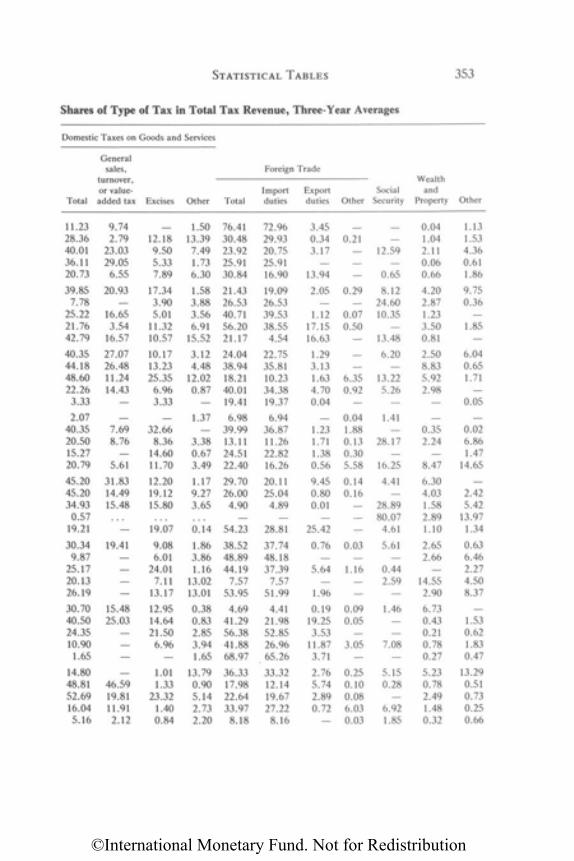
STATISTICAL TABLES 353
Shares of Type of Tax in Total Tax Revenue, Three-Year Averages
Domestic Taxes on Goods and Services
Generalsales, Foreign Trade
turnover, Wealthor value- Import Export Social and
Total added tax Excises Other Total duties duties Other Security Property Other
11.2328.3640.0136.1120.73
39.857.78
25.2221.7642.79
40.3544.1848.6022.263.33
2.0740.3520.5015.2720.79
45.2045.2034.93
0.5719.21
30.349.87
25.1720.1326.19
30.7040.5024.3510.90
1.65
14.8048.8152.6916.045.16
9.742.79
23.0329.056.55
20.93
16.653.54
16.57
27.0726.4811.2414.43
—
7.698.76
—5.61
31.8314.4915.48
_
19.41
—
15.4825.03
—
—
46.5919.8111.912.12
12.189.505.337.89
17.343.905.01
11.3210.57
10.1713.2325.35
6.963.33
32.668.36
14.6011.70
12.2019.1215.80
19.07
9.086.01
24.017.11
13.17
12.9514.6421.50
6.96—
1.011.33
23.321.400.84
1.5013.397.491.736.30
1.583.883.566.91
15.52
3.124.48
12.020.87
—
1.37
3.380.673.49
1.179.273.65
0.14
1.863.861.16
13.0213.01
0.380.832.853.941.65
13.790.905.142.732.20
76.4130.4823.9225.9130.84
21.4326.5340.7156.2021.17
24.0438.9418.2140.0119.41
6.9839.9913.1124.5122.40
29.7026.004.90
54.23
38.5248.8944.19
7.5753.95
4.6941.2956.3841.8868.97
36.3317.9822.6433.97
8.18
72.9629.9320.7525.9116.90
19.0926.5339.5338.55
4.54
22.7535.8110.2334.3819.37
6.9436.8711.2622.8216.26
20.1125.044.89
28.81
37.7448.1837.39
7.5751.99
4.4121.9852.8526.9665.26
33.3212.1419.6727.228.16
3.450.343.17
_13.94
2.05
1.1217.1516.63
1.293.131.634.700.04
1.231.711.380.56
9.450.800.01
25.42
0.76
5.64
1.96
0.1919.253.53
11.873.71
2.765.742.890.72
—
0.21
_—
0.29
0.070.50
—
6.350.92
—
0.041.880.130.305.58
0.140.16
—
0.03
1.16
0.090.05
3.05—
0.250.100.086.030.03
12.59
0.65
8.1224.6010.35
13.48
6.20
13.225.26
_
1.41
28.17—
16.25
4.41
28.8980.07
4.61
5.61
0.442.59
1.46
—7.08
—
5.150.28
—6.921.85
0.041.042.110.060.66
4.202.871.233.500.81
2.508.835.922.98
—
0.352.24
—8.47
6.304.031.582.891.10
2.652.66
14.552.90
6.730.430.210.780.27
5.230.782.491.480.32
1.131.534.360.611.86
9.750.36
1.85—
6.040.651.71
—0.05
0.026.861.47
14.65
2.425.42
13.971.34
0.636.462.274.508.37
1.530.621.830.47
13.290.510.730.250.66
©International Monetary Fund. Not for Redistribution
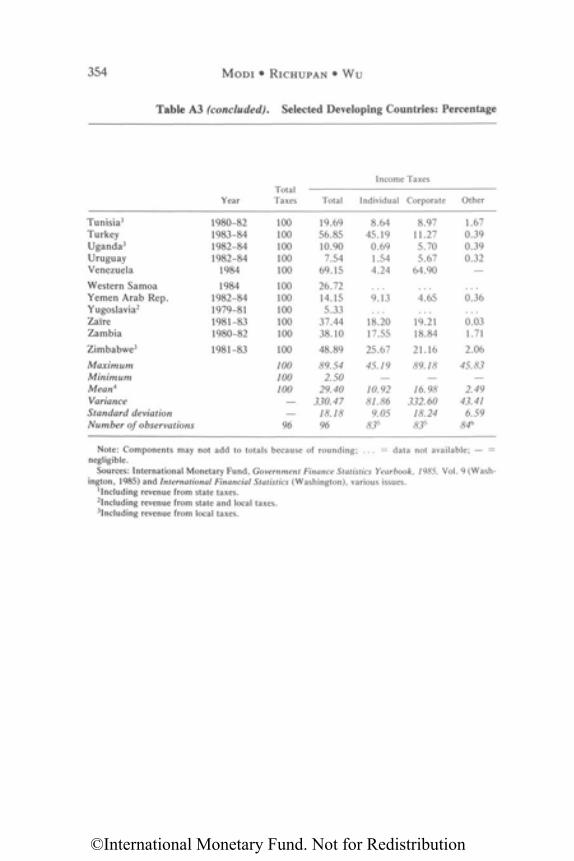
354 MODI • RICHUPAN • WU
Table A3 (concluded). Selected Developing Countries: Percentage
Tunisia3
TurkeyUganda3
UruguayVenezuela
Western SamoaYemen Arab Rep.Yugoslavia2
ZaireZambia
Zimbabwe3
MaximumMinimumMean4
VarianceStandard deviationNumber of observations
1980-821983-841982-841982-84
1984
19841982-841979-811981-831980-82
1981-83
100100100100100
100100100100100
100
100100100
96
19.6956.8510.907.54
69.15
26.7214.155.33
37.4438.10
48.89
89.542.50
29.40330.47
18.1896
8.6445.190.691.544.24
9.13
18.2017.55
25.67
45.19
10.9281.86
9.05835
8.9711.275.705.67
64.90
4.65
19.2118.84
21.16
89.18
16.98332.60
18.24835
1.670.390.390.32
—
0.36
0.031.71
2.06
45.83
2.4943.41
6.59846
Income TaxesTotal
Year Taxes Total Individual Corporate Other
Note: Components may not add to totals because of rounding; . . . = data not available; — =negligible.
Sources: International Monetary Fund, Government Finance Statistics Yearbook, 1985, Vol. 9 (Wash-ington, 1985) and International Financial Statistics (Washington), various issues.
1Including revenue from state taxes.2Including revenue from state and local taxes.3Including revenue from local taxes.
©International Monetary Fund. Not for Redistribution
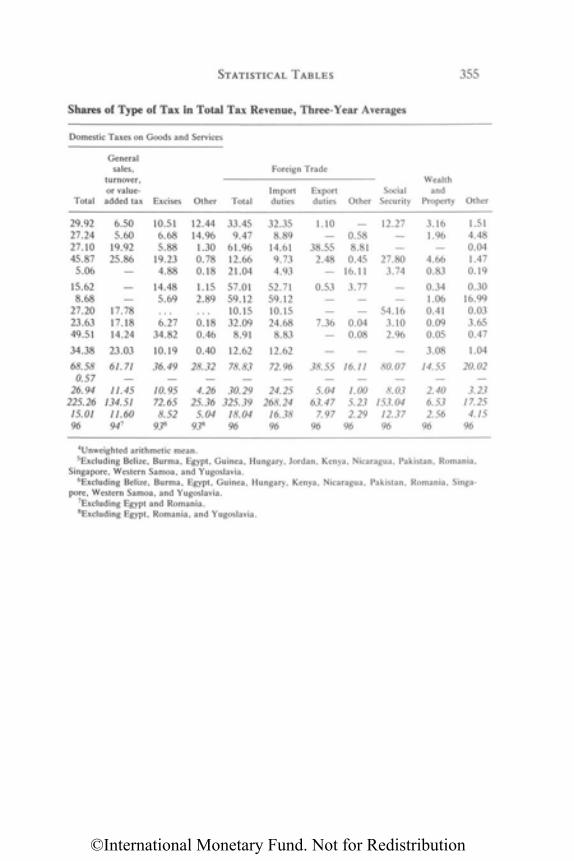
STATISTICAL TABLES 355
Shares of Type of Tax in Total Tax Revenue, Three-Year Averages
4Unweighted arithmetic mean.5Excluding Belize, Burma, Egypt, Guinea, Hungary, Jordan, Kenya, Nicaragua, Pakistan, Romania,
Singapore, Western Samoa, and Yugoslavia.6Excluding Belize, Burma, Egypt, Guinea, Hungary, Kenya, Nicaragua, Pakistan, Romania, Singa-
pore, Western Samoa, and Yugoslavia.7Excluding Egypt and Romania.8Excluding Egypt, Romania, and Yugoslavia.
Domestic Taxes on Goods and Services
Generalsales, Foreign Trade
turnover, Wealthor value- Import Export Social and
Total added tax Excises Other Total duties duties Other Security Property Other
29.9227.2427.1045.875.06
15.628.68
27.2023.6349.51
34.38
68.580.57
26.94225.2615.0196
6.505.60
19.9225.86
—
—17.7817.1814.24
23.03
61.71—
11.45134.51
11.60947
10.516.685.88
19.234.88
14.485.69
6.2734.82
10.19
36.49—
10.9572.658.52
938
12.4414.96
1.300.780.18
1.152.89
0.180.46
0.40
28.32—
4.2625.36
5.04938
33.459.47
61.9612.6621.04
57.0159.1210.1532.09
8.91
12.62
78.83—
30.29325.39
18.0496
32.358.89
14.619.734.93
52.7159.1210.1524.688.83
12.62
72.96—
24.25268.24
16.3896
1.10
38.552.48
0.53—
7.36
—
38.55—
5.0463.47
7.9796
0.588.81
0.4516.11
3.77—
0.040.08
—
16.11—
1.005.232.29
96
12.27
27.803.74
—54.16
3.102.96
—
80.07—
8.03153.0412.3796
3.161.96
4.660.83
0.341.060.410.090.05
3.08
14.55—
2.406.532.56
96
1.514.480.041.470.19
0.3016.990.033.650.47
1.04
20.02—
3.2317.254.15
96
©International Monetary Fund. Not for Redistribution
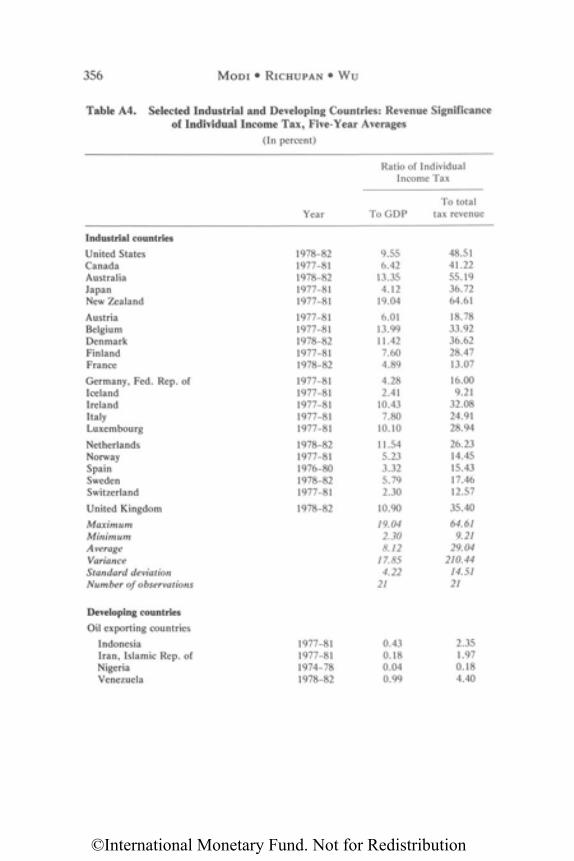
356 M O D I • RICHUPAN • Wu
Table A4. Selected Industrial and Developing Countries: Revenue Significanceof Individual Income Tax, Five-Year Averages
(In percent)
Industrial countries
United StatesCanadaAustraliaJapanNew Zealand
AustriaBelgiumDenmarkFinlandFrance
Germany, Fed. Rep. ofIcelandIrelandItalyLuxembourg
NetherlandsNorwaySpainSwedenSwitzerland
United Kingdom
MaximumMinimumAverageVarianceStandard deviationNumber of observations
Developing countries
Oil exporting countries
IndonesiaIran, Islamic Rep. ofNigeriaVenezuela
1978-821977-811978-821977-811977-81
1977-811977-811978-821977-811978-82
1977-811977-811977-811977-811977-81
1978-821977-811976-801978-821977-81
1978-82
1977-811977-811974-781978-82
9.556.42
13.354.12
19.04
6.0113.9911.427.604.89
4.282.41
10.437.80
10.10
11.545.233.325.792.30
10.90
19.042.308.12
17.854.22
21
0.430.180.040.99
48.5141.2255.1936.7264.61
18.7833.9236.6228.4713.07
16.009.21
32.0824.9128.94
26.2314.4515.4317.4612.57
35.40
64.619.21
29.04210.44
14.5121
2.351.970.184.40
Ratio of IndividualIncome Tax
To totalYear To GDP tax revenue
©International Monetary Fund. Not for Redistribution
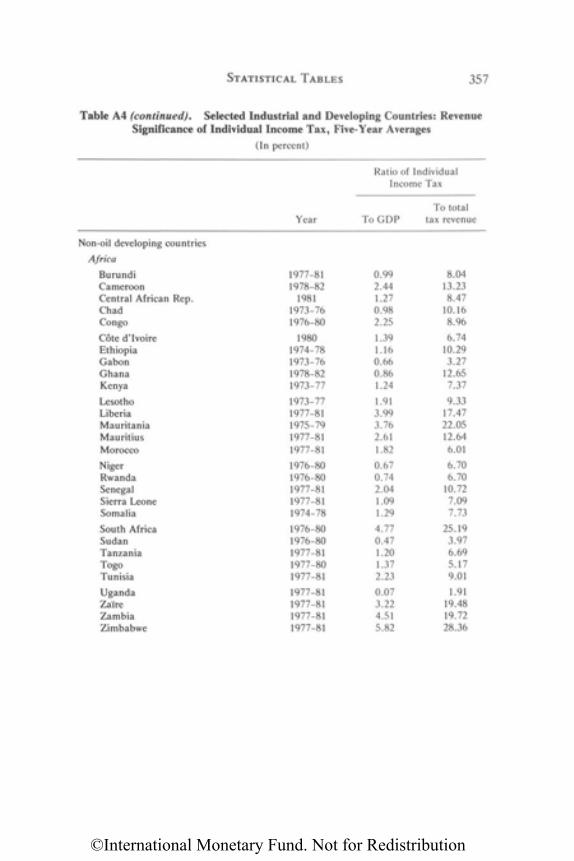
Non-oil developing countries
Africa
BurundiCameroonCentral African Rep.ChadCongo
Cote d'IvoireEthiopiaGabonGhanaKenya
LesothoLiberiaMauritaniaMauritiusMoroccoNigerRwandaSenegalSierra LeoneSomalia
South AfricaSudanTanzaniaTogoTunisia
UgandaZaireZambiaZimbabwe
1977-811978-82
19811973-761976-80
19801974-781973-761978-821973-77
1973-771977-811975-791977-811977-811976-801976-801977-811977-811974-781976-801976-801977-811977-801977-81
1977-811977-811977-811977-81
0.992.441.270.982.25
1.391.160.660.861.24
1.913.993.762.611.820.670.742.041.091.294.770.471.201.372.230.073.224.515.82
8.0413.238.47
10.168.966.74
10.293.27
12.657.37
9.3317.4722.0512.646.016.706.70
10.727.097.73
25.193.976.695.179.011.91
19.4819.7228.36
Ratio of IndividualIncome Tax
To totalYear To GDP tax revenue
STATISTICAL TABLES 357
Table A4 (continued). Selected Industrial and Developing Countries: RevenueSignificance of Individual Income Tax, Five-Year Averages
(In percent)
©International Monetary Fund. Not for Redistribution
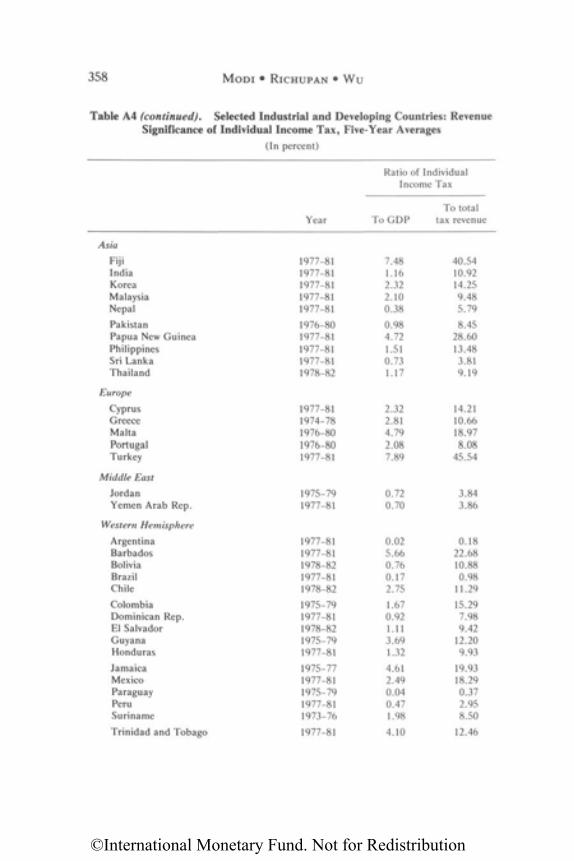
358 M O D I • RICHUPAN • Wu
Table A4 (continued). Selected Industrial and Developing Countries: RevenueSignificance of Individual Income Tax, Five-Year Averages
(In percent)
Asia
FijiIndiaKoreaMalaysiaNepal
PakistanPapua New GuineaPhilippinesSri LankaThailand
Europe
CyprusGreeceMaltaPortugalTurkey
Middle East
JordanYemen Arab Rep.
Western Hemisphere
ArgentinaBarbadosBoliviaBrazilChile
ColombiaDominican Rep.El SalvadorGuyanaHonduras
JamaicaMexicoParaguayPeruSuriname
Trinidad and Tobago
1977-811977-811977-811977-811977-81
1976-801977-811977-811977-811978-82
1977-811974-781976-801976-801977-81
1975-791977-81
1977-811977-811978-821977-811978-82
1975-791977-811978-821975-791977-81
1975-771977-811975-791977-811973-76
1977-81
7.481.162.322.100.38
0.984.721.510.731.17
2.322.814.792.087.89
0.720.70
0.025.660.760.172.75
1.670.921.113.691.32
4.612.490.040.471.98
4.10
40.5410.9214.259.485.79
8.4528.6013.483.819.19
14.2110.6618.978.08
45.54
3.843.86
0.1822.6810.880.98
11.29
15.297.989.42
12.209.93
19.9318.290.372.958.50
12.46
Ratio of IndividualIncome Tax
To totalYear To GDP tax revenue
©International Monetary Fund. Not for Redistribution
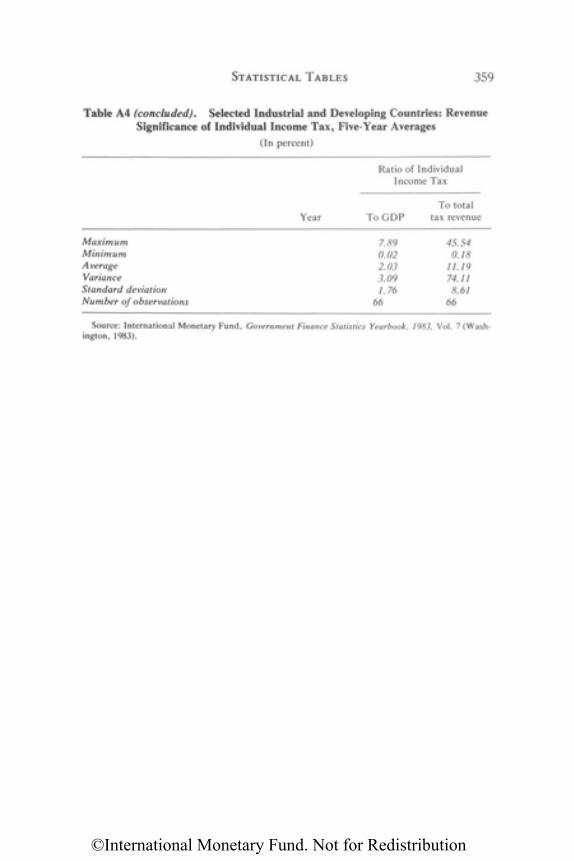
STATISTICAL TABLES 359
Table A4 (concluded). Selected Industrial and Developing Countries: RevenueSignificance of Individual Income Tax, Five-Year Averages
(In percent)
Ratio of IndividualIncome Tax
To totalYear To GDP tax revenue
Source: International Monetary Fund, Government Finance Statistics Yearbook, 1983, Vol. 7 (Wash-ington, 1983).
MaximumMinimumAverageVarianceStandard deviationNumber of observations
7.890.022.033.091.76
66
45.540.18
11.1974.118.61
66
©International Monetary Fund. Not for Redistribution
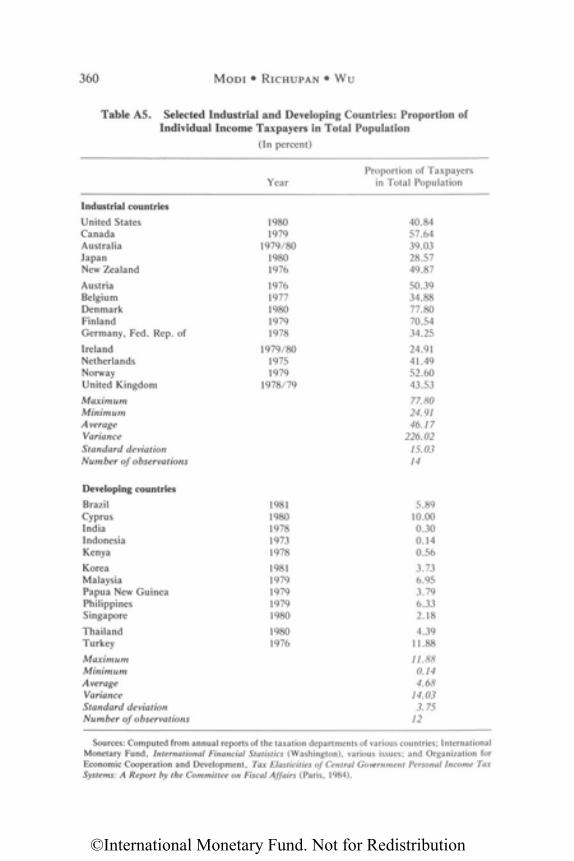
360 M O D I • RICHUPAN • Wu
Table A5. Selected Industrial and Developing Countries: Proportion ofIndividual Income Taxpayers in Total Population
(In percent)
Industrial countries
United StatesCanadaAustraliaJapanNew Zealand
AustriaBelgiumDenmarkFinlandGermany, Fed. Rep. of
IrelandNetherlandsNorwayUnited Kingdom
MaximumMinimumAverageVarianceStandard deviationNumber of observations
Developing countriesBrazilCyprusIndiaIndonesiaKenya
KoreaMalaysiaPapua New GuineaPhilippinesSingapore
ThailandTurkey
MaximumMinimumAverageVarianceStandard deviationNumber of observations
Year
19801979
1979/8019801976
19761977198019791978
1979/8019751979
1978/79
19811980197819731978
19811979197919791980
19801976
Proportion of Taxpayersin Total Population
40.8457.6439.0328.5749.87
50.3934.8877.8070.5434.25
24.9141.4952.6043.53
77.8024.9146.17
226.0215.0314
5.8910.000.300.140.56
3.736.953.796.332.18
4.3911.88
11.880.144.68
14.033.75
12
Sources: Computed from annual reports of the taxation departments of various countries; InternationalMonetary Fund, International Financial Statistics (Washington), various issues; and Organization forEconomic Cooperation and Development, Tax Elasticities of Central Government Personal Income TaxSystems: A Report by the Committee on Fiscal Affairs (Paris, 1984).
©International Monetary Fund. Not for Redistribution
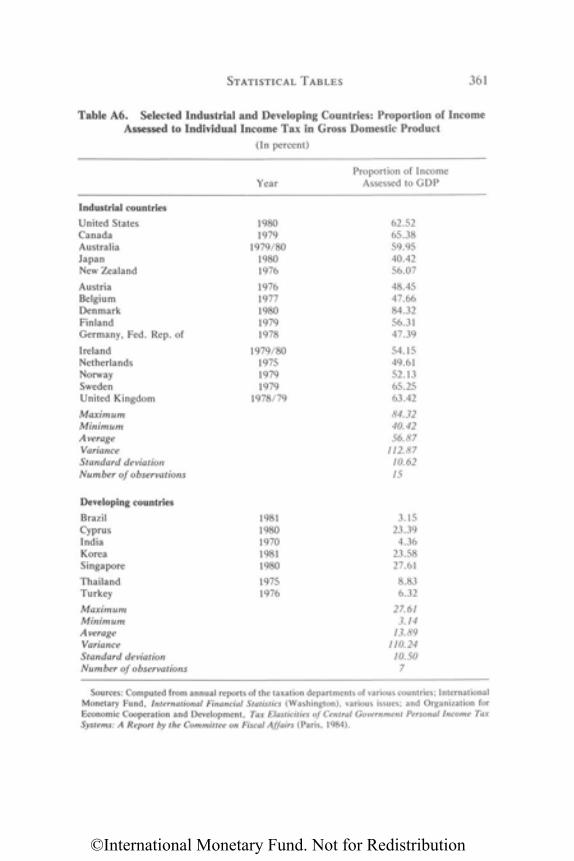
STATISTICAL TABLES 361
Table A6. Selected Industrial and Developing Countries: Proportion of IncomeAssessed to Individual Income Tax in Gross Domestic Product
(In percent)
Proportion of IncomeYear Assessed to GDP
Sources: Computed from annual reports of the taxation departments of various countries; InternationalMonetary Fund, International Financial Statistics (Washington), various issues; and Organization forEconomic Cooperation and Development, Tax Elasticities of Central Government Personal Income TaxSystems: A Report by the Committee on Fiscal Affairs (Paris, 1984).
Industrial countries
United StatesCanadaAustraliaJapanNew Zealand
AustriaBelgiumDenmarkFinlandGermany, Fed. Rep. of
IrelandNetherlandsNorwaySwedenUnited Kingdom
MaximumMinimumAverageVarianceStandard deviationNumber of observations
Developing countries
BrazilCyprusIndiaKoreaSingapore
ThailandTurkey
MaximumMinimumAverageVarianceStandard deviationNumber of observations
19801979
1979/8019801976
19761977198019791978
1979/80197519791979
1978/79
19811980197019811980
19751976
62.5265.3859.9540.4256.07
48.4547.6684.3256.3147.39
54.1549.6152.1365.2563.42
84.3240.4256.87
112.8710.6215
3.1523.394.36
23.5827.61
8.836.32
27.613.14
13.89110.2410.50
7
©International Monetary Fund. Not for Redistribution
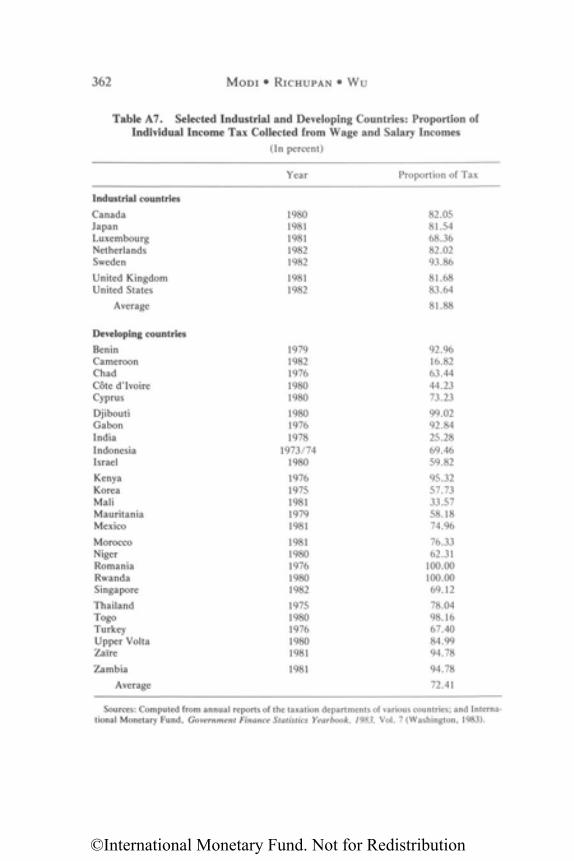
Industrial countries
CanadaJapanLuxembourgNetherlandsSweden
United KingdomUnited States
Average
Developing countries
BeninCameroonChadCote d'IvoireCyprus
DjiboutiGabonIndiaIndonesiaIsrael
KenyaKoreaMaliMauritaniaMexico
MoroccoNigerRomaniaRwandaSingapore
ThailandTogoTurkeyUpper VoltaZaire
Zambia
Average
Year
19801981198119821982
19811982
19791982197619801980
198019761978
1973/741980
19761975198119791981
19811980197619801982
19751980197619801981
1981
Proportion of Tax
82.0581.5468.3682.0293.86
81.6883.64
81.88
92.9616.8263.4444.2373.23
99.0292.8425.2869.4659.82
95.3257.7333.5758.1874.96
76.3362.31
100.00100.0069.12
78.0498.1667.4084.9994.78
94.78
72.41
Sources: Computed from annual reports of the taxation departments of various countries; and Interna-tional Monetary Fund, Government Finance Statistics Yearbook, 1983, Vol. 7 (Washington, 1983).
362 M O D I • RICHUPAN • WU
Table A7. Selected Industrial and Developing Countries: Proportion ofIndividual Income Tax Collected from Wage and Salary Incomes
(In percent)
©International Monetary Fund. Not for Redistribution
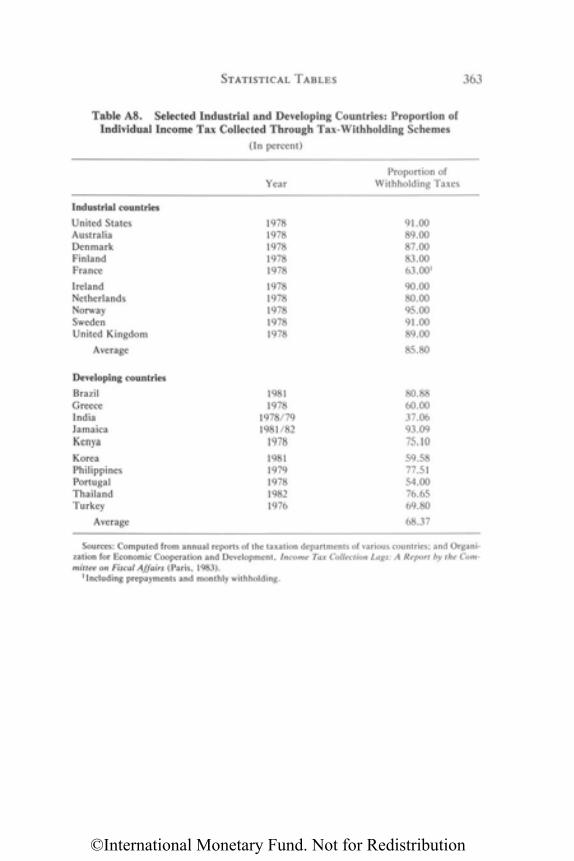
Industrial countries
United StatesAustraliaDenmarkFinlandFrance
IrelandNetherlandsNorwaySwedenUnited Kingdom
Average
Developing countriesBrazilGreeceIndiaJamaicaKenya
KoreaPhilippinesPortugalThailandTurkey
Average
Year
19781978197819781978
19781978197819781978
19811978
1978/791981/82
1978
19811979197819821976
Proportion ofWithholding Taxes
91.0089.0087.0083.0063.001
90.0080.0095.0091.0089.00
85.80
80.8860.0037.0693.0975.10
59.5877.5154.0076.6569.80
68.37
Sources: Computed from annual reports of the taxation departments of various countries; and Organi-zation for Economic Cooperation and Development, Income Tax Collection Lags: A Report by the Com-mittee on Fiscal Affairs (Paris, 1983).
1Including prepayments and monthly withholding.
STATISTICAL TABLES 363
Table A8. Selected Industrial and Developing Countries: Proportion ofIndividual Income Tax Collected Through Tax-Withholding Schemes
(In percent)
©International Monetary Fund. Not for Redistribution
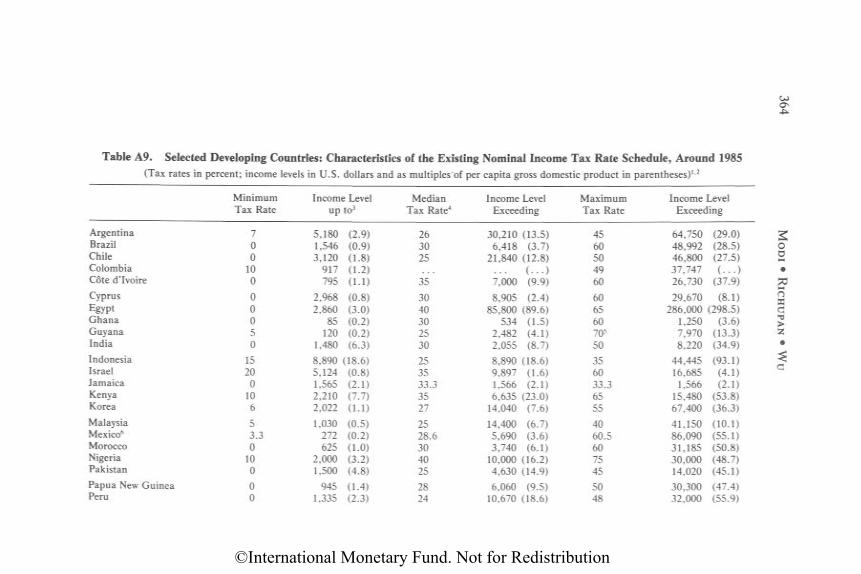
Table A9. Selected Developing Countries: Characteristics of the Existing Nominal Income Tax Rate Schedule, Around 1985(Tax rates in percent; income levels in U.S. dollars and as multiples of per capita gross domestic product in parentheses)1.2
ArgentinaBrazilChileColombiaCote d'Ivoire
CyprusEgyptGhanaGuyanaIndia
IndonesiaIsraelJamaicaKenyaKorea
MalaysiaMexico6
MoroccoNigeriaPakistan
Papua New GuineaPeru
MinimumTax Rate
700
100
00050
1520
0106
53.30
100
00
Income Levelup to3
5,180 (2.9)1,546 (0.9)3,120 (1.8)
917 (1.2)795 (1.1)
2,968 (0.8)2,860 (3.0)
85 (0.2)120 (0.2)
1,480 (6.3)
8,890 (18.6)5,124 (0.8)1,565 (2.1)2,210 (7.7)2,022 (1.1)
1,030 (0.5)272 (0.2)625 (1.0)
2,000 (3.2)1,500 (4.8)
945 (1.4)1,335 (2.3)
MedianTax Rate4
263025
35
3040302530
253533.33527
2528.6304025
2824
Income LevelExceeding
30,210 (13.5)6,418 (3.7)
21,840 (12.8)( . . . )
7,000 (9.9)
8,905 (2.4)85,800 (89.6)
534 (1.5)2,482 (4.1)2,055 (8.7)
8,890 (18.6)9,897 (1.6)1,566 (2.1)6,635 (23.0)
14,040 (7.6)
14,400 (6.7)5,690 (3.6)3,740 (6.1)
10,000 (16.2)4,630 (14.9)
6,060 (9.5)10,670 (18.6)
MaximumTax Rate
4560504960
606560705
50
356033.36555
4060.5607545
5048
Income LevelExceeding
64,750 (29.0)48,992 (28.5)46,800 (27.5)37,747 ( . . . )26,730 (37.9)
29,670 (8.1)286,000 (298.5)
1,250 (3.6)7,970 (13.3)8,220 (34.9)
44,445 (93.1)16,685 (4.1)
1,566 (2.1)15,480 (53.8)67,400 (36.3)
41,150 (10.1)86,090 (55.1)31,185 (50.8)30,000 (48.7)14,020 (45.1)
30,300 (47.4)32,000 (55.9)
364
©International Monetary Fund. Not for Redistribution
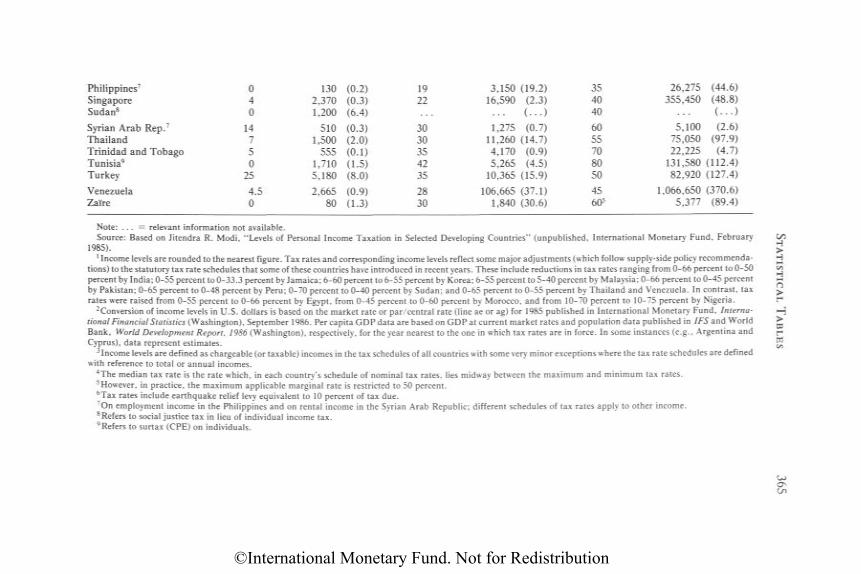
Note: . . . = relevant information not available.Source: Based on Jitendra R. Modi, "Levels of Personal Income Taxation in Selected Developing Countries" (unpublished, International Monetary Fund, February
1985).1Income levels are rounded to the nearest figure. Tax rates and corresponding income levels reflect some major adjustments (which follow supply-side policy recommenda-
tions) to the statutory tax rate schedules that some of these countries have introduced in recent years. These include reductions in tax rates ranging from 0-66 percent to 0-50percent by India; 0-55 percent to 0-33.3 percent by Jamaica; 6-60 percent to 6-55 percent by Korea; 6-55 percent to 5-40 percent by Malaysia; 0-66 percent to 0-45 percentby Pakistan; 0-65 percent to 0-48 percent by Peru; 0-70 percent to 0-40 percent by Sudan; and 0-65 percent to 0-55 percent by Thailand and Venezuela. In contrast, taxrates were raised from 0-55 percent to 0-66 percent by Egypt, from 0-45 percent to 0-60 percent by Morocco, and from 10-70 percent to 10-75 percent by Nigeria.
2Conversion of income levels in U.S. dollars is based on the market rate or par/central rate (line ae or ag) for 1985 published in International Monetary Fund, Interna-tional Financial Statistics (Washington), September 1986. Per capita GDP data are based on GDP at current market rates and population data published in IFS and WorldBank, World Development Report, 1986 (Washington), respectively, for the year nearest to the one in which tax rates are in force. In some instances (e.g., Argentina andCyprus), data represent estimates.
3Income levels are defined as chargeable (or taxable) incomes in the tax schedules of all countries with some very minor exceptions where the tax rate schedules are definedwith reference to total or annual incomes.
4The median tax rate is the rate which, in each country's schedule of nominal tax rates, lies midway between the maximum and minimum tax rates.5However, in practice, the maximum applicable marginal rate is restricted to 50 percent.6Tax rates include earthquake relief levy equivalent to 10 percent of tax due.7On employment income in the Philippines and on rental income in the Syrian Arab Republic; different schedules of tax rates apply to other income.8Refers to social justice tax in lieu of individual income tax.9Refers to surtax (CPE) on individuals.
Philippines7
SingaporeSudan8
Syrian Arab Rep.7
ThailandTrinidad and TobagoTunisia9
Turkey
VenezuelaZaire
040
14750
25
4.50
130 (0.2)2,370 (0.3)1,200 (6.4)
510 (0.3)1,500 (2.0)
555 (0.1)1,710 (1.5)5,180 (8.0)
2,665 (0.9)80 (1.3)
1922
3030354235
2830
3,150 (19.2)16,590 (2.3)
. . . ( . . . )
1,275 (0.7)11,260 (14.7)4,170 (0.9)5,265 (4.5)
10,365 (15.9)
106,665 (37.1)1,840 (30.6)
3540406055708050
45605
26,275 (44.6)355,450 (48.8)
( . . . )5,100 (2.6)
75,050 (97.9)22,225 (4.7)
131,580 (112.4)82,920 (127.4)
1,066,650 (370.6)5,377 (89.4)
365
©International Monetary Fund. Not for Redistribution
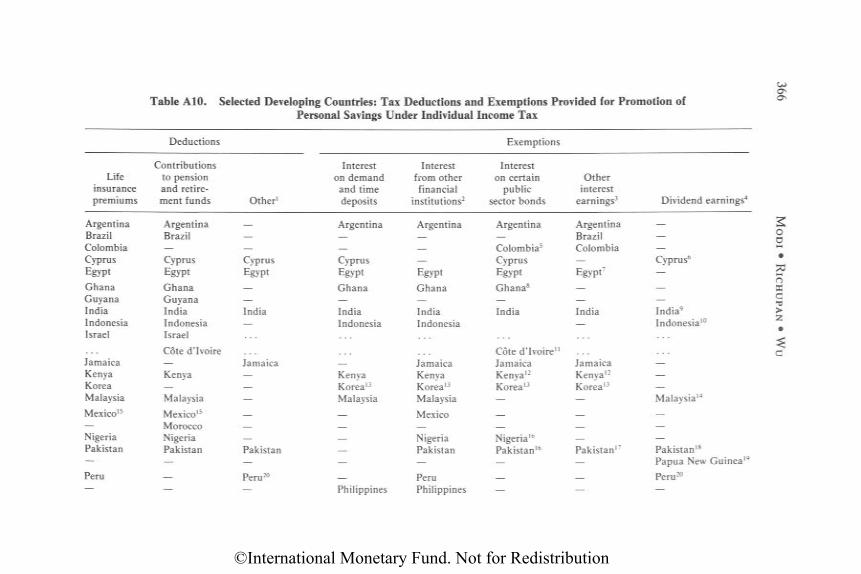
Deductions
Lifeinsurancepremiums
ArgentinaBrazilColombiaCyprusEgypt
GhanaGuyanaIndiaIndonesiaIsrael
JamaicaKenyaKoreaMalaysia
Mexico15
—NigeriaPakistan—Peru—
Contributionsto pensionand retire-ment funds
ArgentinaBrazil
CyprusEgypt
GhanaGuyanaIndiaIndonesiaIsrael
Cote d'Ivoire
Kenya—Malaysia
Mexico15
MoroccoNigeriaPakistan———
Other1
CyprusEgypt
—India
Jamaica
———
Pakistan—
Peru20
—
Exemptions
Intereston demandand timedeposits
Argentina
CyprusEgypt
Ghana—IndiaIndonesia
KenyaKorea13
Malaysia——
———Philippines
Interestfrom otherfinancial
institutions2
Argentina
—Egypt
Ghana—IndiaIndonesia
JamaicaKenyaKorea13
Malaysia
Mexico—NigeriaPakistan—
PeruPhilippines
Intereston certain
publicsector bonds
Argentina
Colombia5
CyprusEgypt
Ghana8
—India
Cote d'Ivoire11
JamaicaKenya12
Korea13
———Nigeria16
Pakistan16
———
Otherinterest
earnings3
ArgentinaBrazilColombia—Egypt7
—India
JamaicaKenya12
Korea13
———
Pakistan17
———
Dividend earnings4
—
Cyprus6
—
—India9
Indonesia10
—Malaysia14
——
Pakistan18
Papua New Guinea19
Peru20
—
Table A10. Selected Developing Countries: Tax Deductions and Exemptions Provided for Promotion ofPersonal Savings Under Individual Income Tax
366
©International Monetary Fund. Not for Redistribution
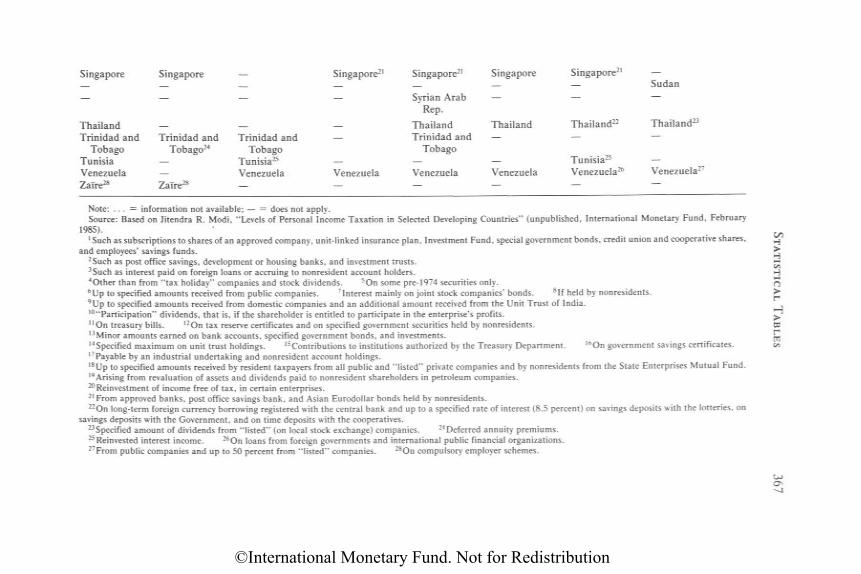
Note: . . . = information not available; — = does not apply.Source: Based on Jitendra R. Modi, "Levels of Personal Income Taxation in Selected Developing Countries" (unpublished, International Monetary Fund, February
1985).1Such as subscriptions to shares of an approved company, unit-linked insurance plan, Investment Fund, special government bonds, credit union and cooperative shares,
and employees' savings funds.2Such as post office savings, development or housing banks, and investment trusts.3Such as interest paid on foreign loans or accruing to nonresident account holders.4Other than from "tax holiday" companies and stock dividends. 5On some pre-1974 securities only.6Up to specified amounts received from public companies. 7Interest mainly on joint stock companies' bonds. 8If held by nonresidents.9Up to specified amounts received from domestic companies and an additional amount received from the Unit Trust of India.10"Participation" dividends, that is, if the shareholder is entitled to participate in the enterprise's profits.11On treasury bills. 12On tax reserve certificates and on specified government securities held by nonresidents.13Minor amounts earned on bank accounts, specified government bonds, and investments.l4Specified maximum on unit trust holdings. 15Contributions to institutions authorized by the Treasury Department. 16On government savings certificates.17 Payable by an industrial undertaking and nonresident account holdings.18Up to specified amounts received by resident taxpayers from all public and "listed" private companies and by nonresidents from the State Enterprises Mutual Fund.19 Arising from revaluation of assets and dividends paid to nonresident shareholders in petroleum companies.20Reinvestment of income free of tax, in certain enterprises.21From approved banks, post office savings bank, and Asian Eurodollar bonds held by nonresidents.22On long-term foreign currency borrowing registered with the central bank and up to a specified rate of interest (8.5 percent) on savings deposits with the lotteries, on
savings deposits with the Government, and on time deposits with the cooperatives.23Specified amount of dividends from "listed" (on local stock exchange) companies. 24Deferred annuity premiums.25Reinvested interest income. 26On loans from foreign governments and international public financial organizations.27From public companies and up to 50 percent from "listed" companies. 28On compulsory employer schemes.
Singapore
—
ThailandTrinidad and
TobagoTunisiaVenezuelaZaire28
Singapore——
Trinidad andTobago24
—Zaire28
—
—
Trinidad andTobago
Tunisia25
Venezuela—
Singapore21
——
—
Venezuela—
Singapore21
—Syrian Arab
Rep.
ThailandTrinidad and
Tobago
Venezuela—
Singapore——
Thailand—
—Venezuela—
Singapore21
——
Thailand22
—
Tunisia25
Venezuela26
—
—Sudan—
Thailand23
—
—Venezuela27
—
367
©International Monetary Fund. Not for Redistribution
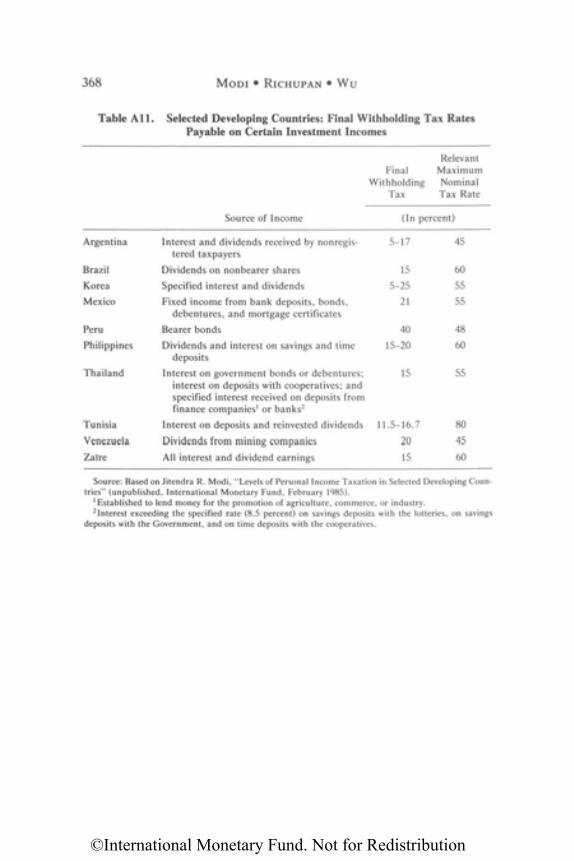
Argentina
Brazil
Korea
Mexico
Peru
Philippines
Thailand
Tunisia
Venezuela
Zaire
Interest and dividends received by nonregis-tered taxpayers
Dividends on nonbearer shares
Specified interest and dividends
Fixed income from bank deposits, bonds,debentures, and mortgage certificates
Bearer bonds
Dividends and interest on savings and timedeposits
Interest on government bonds or debentures;interest on deposits with cooperatives; andspecified interest received on deposits fromfinance companies1 or banks2
Interest on deposits and reinvested dividends
Dividends from mining companies
All interest and dividend earnings
5-17
15
5-25
21
40
15-20
15
11.5-16.7
20
15
45
60
55
55
48
60
55
80
45
60
RelevantFinal Maximum
Withholding NominalTax Tax Rate
Source of Income (In percent)
368 M O D I • RICHUPAN • WU
Table A11. Selected Developing Countries: Final Withholding Tax RatesPayable on Certain Investment Incomes
Source: Based on Jitendra R. Modi, "Levels of Personal Income Taxation in Selected Developing Coun-tries" (unpublished, International Monetary Fund, February 1985).
1Established to lend money for the promotion of agriculture, commerce, or industry.2Interest exceeding the specified rate (8.5 percent) on savings deposits with the lotteries, on savings
deposits with the Government, and on time deposits with the cooperatives.
©International Monetary Fund. Not for Redistribution
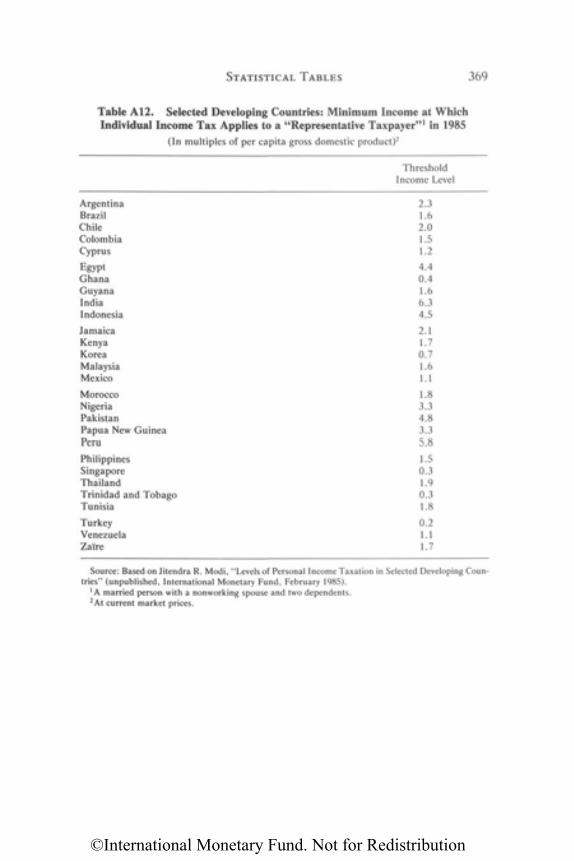
ArgentinaBrazilChileColombiaCyprus
EgyptGhanaGuyanaIndiaIndonesia
JamaicaKenyaKoreaMalaysiaMexico
MoroccoNigeriaPakistanPapua New GuineaPeru
PhilippinesSingaporeThailandTrinidad and TobagoTunisiaTurkeyVenezuelaZaire
ThresholdIncome Level
2.31.62.01.51.2
4.40.41.66.34.5
2.11.70.71.61.1
1.83.34.83.35.8
1.50.31.90.31.80.21.11.7
Source: Based on Jitendra R. Modi, "Levels of Personal Income Taxation in Selected Developing Coun-tries" (unpublished, International Monetary Fund, February 1985).
1A married person with a nonworking spouse and two dependents.2At current market prices.
STATISTICAL TABLES 369
Table A12. Selected Developing Countries: Minimum Income at WhichIndividual Income Tax Applies to a "Representative Taxpayer"1 in 1985
(In multiples of per capita gross domestic product)2
©International Monetary Fund. Not for Redistribution
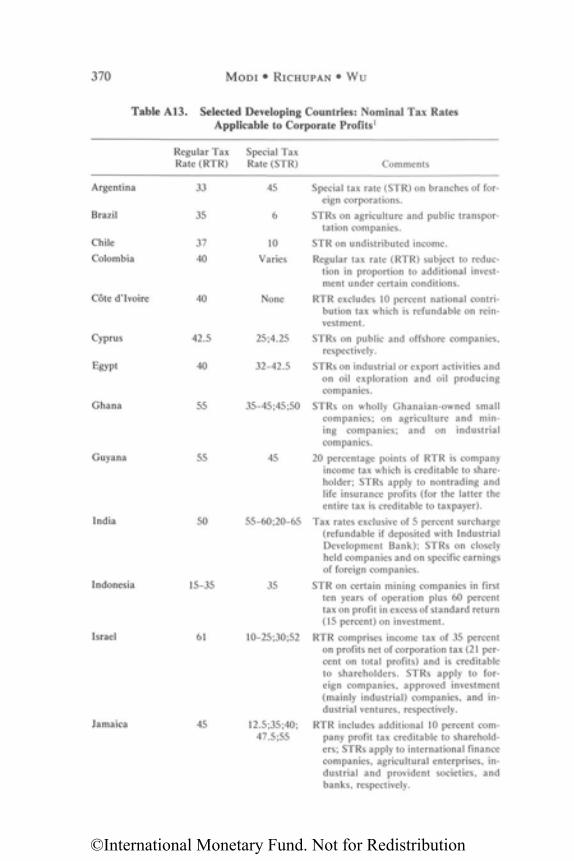
Argentina
Brazil
Chile
Colombia
Cote d'Ivoire
Cyprus
Egypt
Ghana
Guyana
India
Indonesia
Israel
Jamaica
Regular TaxRate (RTR)
33
35
37
40
40
42.5
40
55
55
50
15-35
61
45
Special TaxRate (STR)
45
6
10
Varies
None
25;4.25
32-42.5
35-45;45;50
45
55-60;20-65
35
10-25;30;52
12.5;35;40;47.5;55
Comments
Special tax rate (STR) on branches of for-eign corporations.
STRs on agriculture and public transpor-tation companies.
STR on undistributed income.
Regular tax rate (RTR) subject to reduc-tion in proportion to additional invest-ment under certain conditions.
RTR excludes 10 percent national contri-bution tax which is refundable on rein-vestment.
STRs on public and offshore companies,respectively.
STRs on industrial or export activities andon oil exploration and oil producingcompanies.
STRs on wholly Ghanaian-owned smallcompanies; on agriculture and min-ing companies; and on industrialcompanies.
20 percentage points of RTR is companyincome tax which is creditable to share-holder; STRs apply to nontrading andlife insurance profits (for the latter theentire tax is creditable to taxpayer).
Tax rates exclusive of 5 percent surcharge(refundable if deposited with IndustrialDevelopment Bank); STRs on closelyheld companies and on specific earningsof foreign companies.
STR on certain mining companies in firstten years of operation plus 60 percenttax on profit in excess of standard return(15 percent) on investment.
RTR comprises income tax of 35 percenton profits net of corporation tax (21 per-cent on total profits) and is creditableto shareholders. STRs apply to for-eign companies, approved investment(mainly industrial) companies, and in-dustrial ventures, respectively.
RTR includes additional 10 percent com-pany profit tax creditable to sharehold-ers; STRs apply to international financecompanies, agricultural enterprises, in-dustrial and provident societies, andbanks, respectively.
370 M O D I • RICHUPAN • WU
Table A13. Selected Developing Countries: Nominal Tax RatesApplicable to Corporate Profits1
©International Monetary Fund. Not for Redistribution
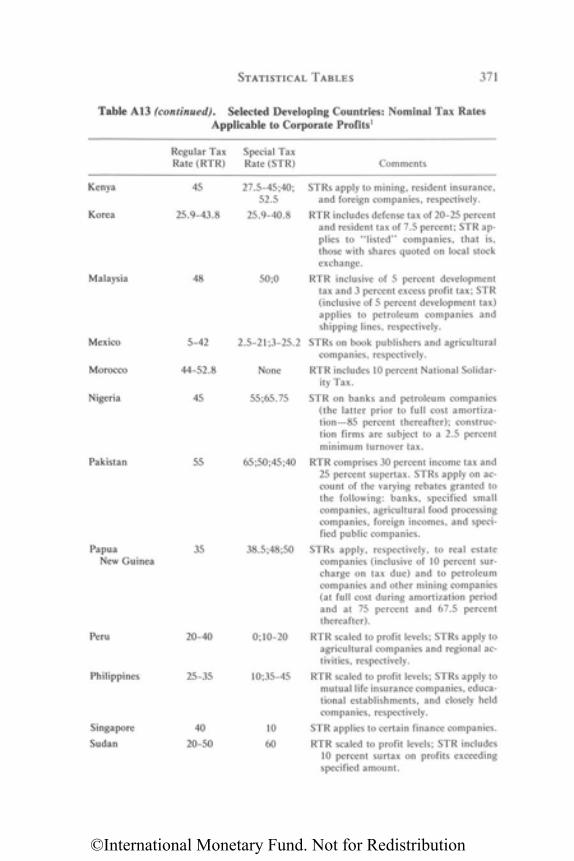
Kenya
Korea
Malaysia
Mexico
Morocco
Nigeria
Pakistan
PapuaNew Guinea
Peru
Philippines
Singapore
Sudan
Regular TaxRate (RTR)
45
25.9-43.8
48
5-42
44-52.8
45
55
35
20-40
25-35
40
20-50
Special TaxRate (STR)
27.5-45;40;52.5
25.9-40.8
50;0
2.5-21;3-25.2
None
55;65.75
65;50;45;40
38.5;48;50
0;10-20
10;35-45
10
60
Comments
STRs apply to mining, resident insurance,and foreign companies, respectively.
RTR includes defense tax of 20-25 percentand resident tax of 7.5 percent; STR ap-plies to "listed" companies, that is,those with shares quoted on local stockexchange.
RTR inclusive of 5 percent developmenttax and 3 percent excess profit tax; STR(inclusive of 5 percent development tax)applies to petroleum companies andshipping lines, respectively.
STRs on book publishers and agriculturalcompanies, respectively.
RTR includes 10 percent National Solidar-ity Tax.
STR on banks and petroleum companies(the latter prior to full cost amortiza-tion—85 percent thereafter); construc-tion firms are subject to a 2.5 percentminimum turnover tax.
RTR comprises 30 percent income tax and25 percent supertax. STRs apply on ac-count of the varying rebates granted tothe following: banks, specified smallcompanies, agricultural food processingcompanies, foreign incomes, and speci-fied public companies.
STRs apply, respectively, to real estatecompanies (inclusive of 10 percent sur-charge on tax due) and to petroleumcompanies and other mining companies(at full cost during amortization periodand at 75 percent and 67.5 percentthereafter).
RTR scaled to profit levels; STRs apply toagricultural companies and regional ac-tivities, respectively.
RTR scaled to profit levels; STRs apply tomutual life insurance companies, educa-tional establishments, and closely heldcompanies, respectively.
STR applies to certain finance companies.
RTR scaled to profit levels; STR includes10 percent surtax on profits exceedingspecified amount.
STATISTICAL TABLES 371
Table A13 (continued). Selected Developing Countries: Nominal Tax RatesApplicable to Corporate Profits1
©International Monetary Fund. Not for Redistribution
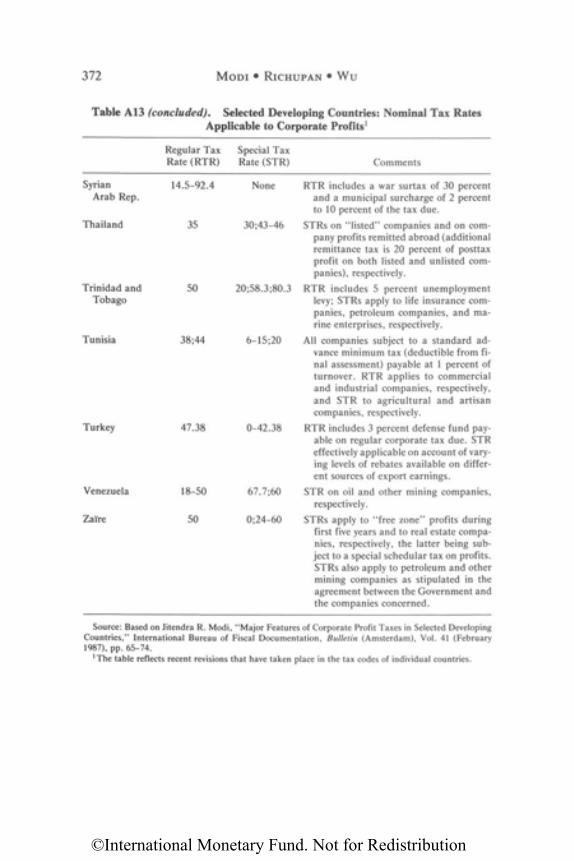
SyrianArab Rep.
Thailand
Trinidad andTobago
Tunisia
Turkey
Venezuela
Zaire
Regular TaxRate (RTR)
14.5-92.4
35
50
38;44
47.38
18-50
50
Special TaxRate (STR)
None
30;43-46
20;58.3;80.3
6-15;20
0-42.38
67.7;60
0;24-60
Comments
RTR includes a war surtax of 30 percentand a municipal surcharge of 2 percentto 10 percent of the tax due.
STRs on "listed" companies and on com-pany profits remitted abroad (additionalremittance tax is 20 percent of posttaxprofit on both listed and unlisted com-panies), respectively.
RTR includes 5 percent unemploymentlevy; STRs apply to life insurance com-panies, petroleum companies, and ma-rine enterprises, respectively.
All companies subject to a standard ad-vance minimum tax (deductible from fi-nal assessment) payable at 1 percent ofturnover. RTR applies to commercialand industrial companies, respectively,and STR to agricultural and artisancompanies, respectively.
RTR includes 3 percent defense fund pay-able on regular corporate tax due. STReffectively applicable on account of vary-ing levels of rebates available on differ-ent sources of export earnings.
STR on oil and other mining companies,respectively.
STRs apply to "free zone" profits duringfirst five years and to real estate compa-nies, respectively, the latter being sub-ject to a special schedular tax on profits.STRs also apply to petroleum and othermining companies as stipulated in theagreement between the Government andthe companies concerned.
Source: Based on Jitendra R. Modi, "Major Features of Corporate Profit Taxes in Selected DevelopingCountries," International Bureau of Fiscal Documentation, Bulletin (Amsterdam), Vol. 41 (February1987), pp. 65-74.
1The table reflects recent revisions that have taken place in the tax codes of individual countries.
372 M O D I • RICHUPAN • WU
Table A13 (concluded). Selected Developing Countries: Nominal Tax RatesApplicable to Corporate Profits1
©International Monetary Fund. Not for Redistribution
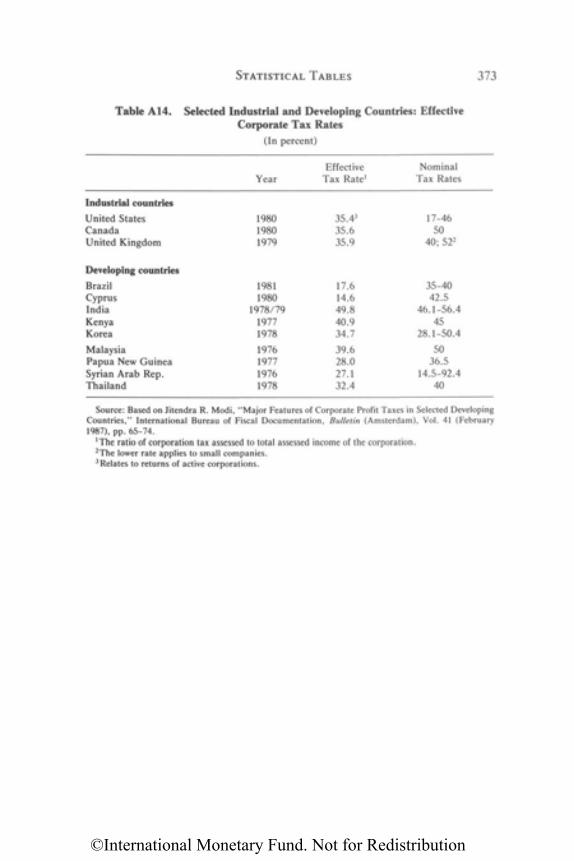
Industrial countries
United StatesCanadaUnited Kingdom
Developing countries
BrazilCyprusIndiaKenyaKorea
MalaysiaPapua New GuineaSyrian Arab Rep.Thailand
Year
198019801979
19811980
1978/7919771978
1976197719761978
EffectiveTax Rate1
35.43
35.635.9
17.614.649.840.934.7
39.628.027.132.4
NominalTax Rates
17-4650
40; 522
35-4042.5
46.1-56.445
28.1-50.4
5036.5
14.5-92.440
Source: Based on Jitendra R. Modi, "Major Features of Corporate Profit Taxes in Selected DevelopingCountries," International Bureau of Fiscal Documentation, Bulletin (Amsterdam), Vol. 41 (February1987), pp. 65-74.
1The ratio of corporation tax assessed to total assessed income of the corporation.2The lower rate applies to small companies.3 Relates to returns of active corporations.
STATISTICAL TABLES 373
Table A14. Selected Industrial and Developing Countries: EffectiveCorporate Tax Rates
(In percent)
©International Monetary Fund. Not for Redistribution
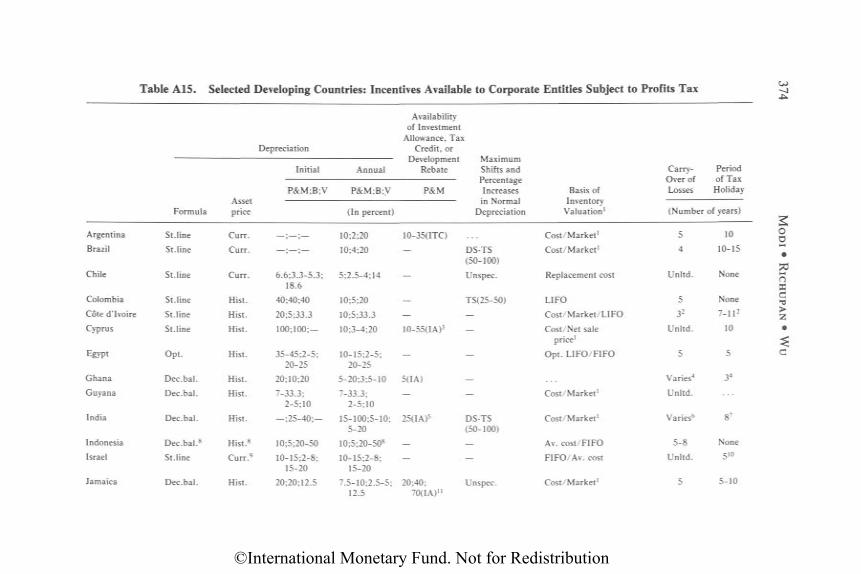
Table A15. Selected Developing Countries: Incentives Available to Corporate Entities Subject to Profits Tax
Depreciation
Availabilityof Investment
Allowance, TaxCredit, or
DevelopmentRebate
FormulaAssetprice
Initial Annual
P&M;B;V P&M;B;V P&M
MaximumShifts andPercentageIncreasesin Normal
Depreciation
Basis ofInventory
Valuation1
Carry-over ofLosses
Periodof TaxHoliday
(Number of years)(In percent)
Argentina
Brazil
Chile
Colombia
Cote d'Ivoire
Cyprus
Egypt
Ghana
Guyana
India
Indonesia
Israel
Jamaica
St.line
St.line
St.line
St.line
St.line
St.line
Opt.
Dec.bal.
Dec.bal.
Dec.bal.
Dec.bal.8
St.line
Dec.bal.
Curr.
Curr.
Curr.
Hist.
Hist.
Hist.
Hist.
Hist.
Hist.
Hist.
Hist.8
Curr.9
Hist.
; ;
6.6;3.3-5.3;18.6
40;40;40
20;5;33.3
100;100;-
35-45;2-5;20-25
20;10;20
7-33.3;2-5;10
- ; 2 5 - 4 0 ; -
10;5;20-50
10-15;2-8;15-20
20;20;12.5
10;2;20
10;4;20
5;2.5-4;14
10;5;20
10;5;33.3
10;3-4;20
10-15;2-5;20-25
5-20;3;5-10
7-33.3;2-5;10
15-100;5-10;5-20
10;5;20-508
10-15;2-8;15-20
7.5-10;2.5-5;12.5
10-35(ITC)
-
—
—
—
10-55(IA)3
-
5(IA)
-
25(IA)5
—
-
20;40;70(IA)11
DS-TS(50-100)
Unspec.
TS(25-50)
—
—
-
—
-
DS-TS(50-100)
—
-
Unspec.
Cost/Market1
Cost/Market1
Replacement cost
LIFO
Cost/Market/LIFO
Cost/Net saleprice1
Opt. LIFO/FIFO
Cost/Market1
Cost/Market1
Av. cost/FIFO
FIFO/Av. cost
Cost/Market1
5
4
Unltd.
5
32
Unltd.
5
Varies4
Unltd.
Varies6
5-8
Unltd.
5
10
10-15
None
None
7-112
10
5
34
87
None
510
5-10
374
©International Monetary Fund. Not for Redistribution
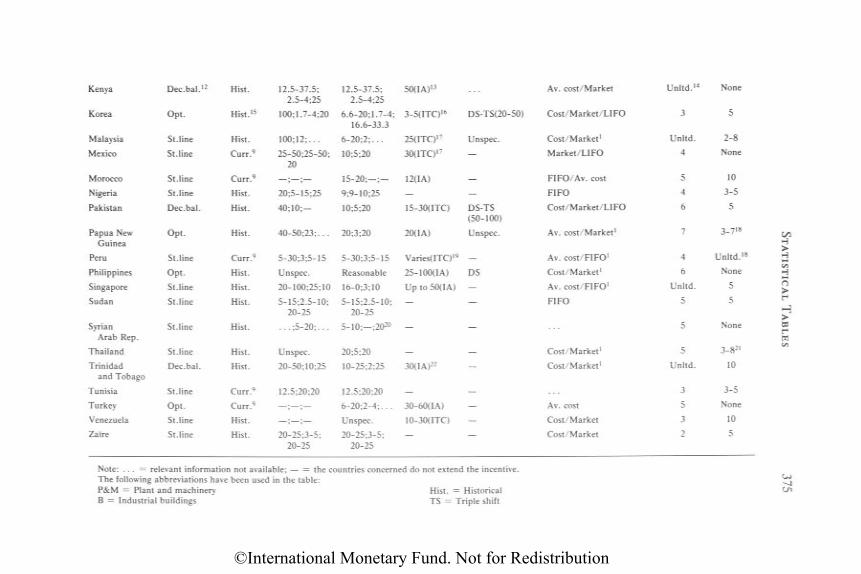
Note: . . . = relevant information not available; — = the countries concerned do not extend the incentive.The following abbreviations have been used in the table:P&M = Plant and machinery Hist. = HistoricalB = Industrial buildings TS = Triple shift
Kenya
Korea
Malaysia
Mexico
Morocco
Nigeria
Pakistan
Papua NewGuinea
Peru
Philippines
Singapore
Sudan
SyrianArab Rep.
Thailand
Trinidadand Tobago
Tunisia
Turkey
Venezuela
Zaire
Dec.bal.12
Opt.
St.line
St.line
St.line
St.line
Dec.bal.
Opt.
St.line
Opt.
St.line
St.line
St.line
St.line
Dec.bal.
St.line
Opt.
St.line
St.line
Hist.
Hist.15
Hist.
Curr.9
Curr.9
Hist.
Hist.
Hist.
Curr.9
Hist.
Hist.
Hist.
Hist.
Hist.
Hist.
Curr.9
Curr.9
Hist.
Hist.
12.5-37.5;2.5-4;25
100;1.7-4;20
100;12;...
25-50;25-50;20
—;—;—
20;5-15;25
40;10;—
40-50;23;.. .
5-30;3;5-15
Unspec.
20-100;25;10
5-15;2.5-10;20-25
. . . ; 5 - 2 0 ; . . .
Unspec.
20-50;10;25
12.5;20;20
—;—;—
—;—;—
20-25;3-5;20-25
12.5-37.5;2.5-4;25
6.6-20;1.7-4;16.6-33.3
6-20;2;. . .
10;5;20
1 5 - 2 0 ; - ; -
9;9-10;25
10;5;20
20;3;20
5-30;3;5-15
Reasonable
16-0;3;10
5-15;2.5-10;20-25
5-10;—;2020
20;5;20
10-25;2;25
12.5;20;20
6-20;2-4;.. .
Unspec.
20-25;3-5;20-25
50(IA)13
3-5(ITC)16
25(ITC)17
30(ITC)17
12(IA)
—
15-30(ITC)
20(IA)
Varies(ITC)19
25-100(1A)
Up to 50(IA)
—
-
—
30(IA)22
—
30-60(IA)
10-30(ITC)
—
DS-TS(20-50)
Unspec.
-
—
—
DS-TS(50-100)
Unspec.
—
DS
—
—
-
—
—
—
-
—
—
Av. cost/Market
Cost/Market/LIFO
Cost/Market1
Market/LIFO
FIFO/Av. cost
FIFO
Cost/Market/LIFO
Av. cost/Market1
Av. cost/FIFO1
Cost/Market1
Av. cost/FIFO1
FIFO
Cost/Market1
Cost/Market1
Av. cost
Cost/Market
Cost/Market
Unltd.14
3
Unltd.
4
5
4
6
7
4
6
Unltd.
5
5
5
Unltd.
3
5
3
2
None
5
2-8
None
10
3-5
5
3-718
Unltd.18
None
5
5
None
3-821
10
3-5
None
10
5
375
©International Monetary Fund. Not for Redistribution
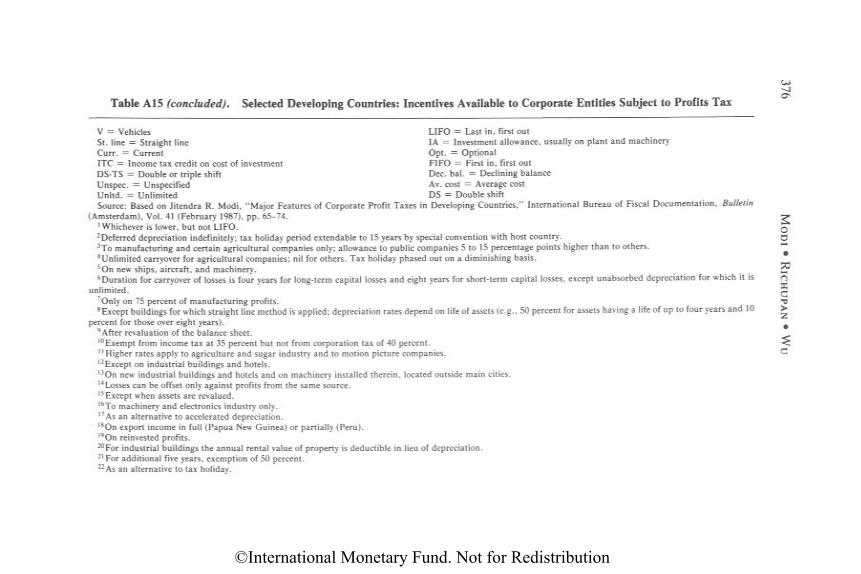
Table A15 (concluded). Selected Developing Countries: Incentives Available to Corporate Entities Subject to Profits Tax
V = Vehicles LIFO = Last in, first outSt. line = Straight line IA = Investment allowance, usually on plant and machineryCurr. = Current Opt. = OptionalITC = Income tax credit on cost of investment FIFO = First in, first outDS-TS = Double or triple shift Dec. bal. = Declining balanceUnspec. = Unspecified Av. cost = Average costUnltd. = Unlimited DS = Double shiftSource: Based on Jitendra R. Modi, "Major Features of Corporate Profit Taxes in Developing Countries," International Bureau of Fiscal Documentation, Bulletin
(Amsterdam), Vol. 41 (February 1987), pp. 65-74.1 Whichever is lower, but not LIFO.2Deferred depreciation indefinitely; tax holiday period extendable to 15 years by special convention with host country.3To manufacturing and certain agricultural companies only; allowance to public companies 5 to 15 percentage points higher than to others.4Unlimited carryover for agricultural companies; nil for others. Tax holiday phased out on a diminishing basis.5On new ships, aircraft, and machinery.6Duration for carryover of losses is four years for long-term capital losses and eight years for short-term capital losses, except unabsorbed depreciation for which it is
unlimited.7Only on 75 percent of manufacturing profits.8Except buildings for which straight line method is applied; depreciation rates depend on life of assets (e.g., 50 percent for assets having a life of up to four years and 10
percent for those over eight years).9After revaluation of the balance sheet.10Exempt from income tax at 35 percent but not from corporation tax of 40 percent.11Higher rates apply to agriculture and sugar industry and to motion picture companies.12Except on industrial buildings and hotels.13On new industrial buildings and hotels and on machinery installed therein, located outside main cities.14Losses can be offset only against profits from the same source.15Except when assets are revalued.16To machinery and electronics industry only.17As an alternative to accelerated depreciation.18On export income in full (Papua New Guinea) or partially (Peru).19On reinvested profits.20For industrial buildings the annual rental value of property is deductible in lieu of depreciation.21 For additional five years, exemption of 50 percent.22 As an alternative to tax holiday.
376
©International Monetary Fund. Not for Redistribution
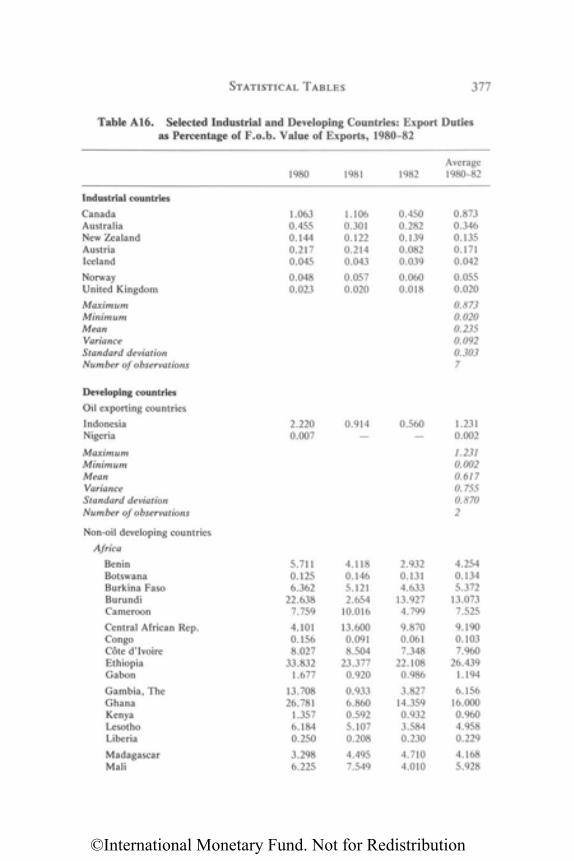
STATISTICAL TABLES 377
Table A16. Selected Industrial and Developing Countries: Export Dutiesas Percentage of F.o.b. Value of Exports, 1980-82
Industrial countries
CanadaAustraliaNew ZealandAustriaIceland
NorwayUnited Kingdom
MaximumMinimumMeanVarianceStandard deviationNumber of observations
Developing countries
Oil exporting countries
IndonesiaNigeria
MaximumMinimumMeanVarianceStandard deviationNumber of observations
Non-oil developing countries
Africa
BeninBotswanaBurkina FasoBurundiCameroon
Central African Rep.CongoCote d'IvoireEthiopiaGabon
Gambia, TheGhanaKenyaLesothoLiberia
MadagascarMali
1980
1.0630.4550.1440.2170.045
0.0480.023
2.2200.007
5.7110.1256.362
22.6387.759
4.1010.1568.027
33.8321.677
13.70826.781
1.3576.1840.250
3.2986.225
1981
1.1060.3010.1220.2140.043
0.0570.020
0.914—
4.1180.1465.1212.654
10.016
13.6000.0918.504
23.3770.920
0.9336.8600.5925.1070.208
4.4957.549
1982
0.4500.2820.1390.0820.039
0.0600.018
0.560—
2.9320.1314.633
13.9274.799
9.8700.0617.348
22.1080.986
3.82714.3590.9323.5840.230
4.7104.010
Average1980-82
0.8730.3460.1350.1710.042
0.0550.020
0.8730.0200.2350.0920.3037
1.2310.002
1.2310.0020.6170.7550.8702
4.2540.1345.372
13.0737.525
9.1900.1037.960
26.4391.194
6.15616.0000.9604.9580.229
4.1685.928
©International Monetary Fund. Not for Redistribution
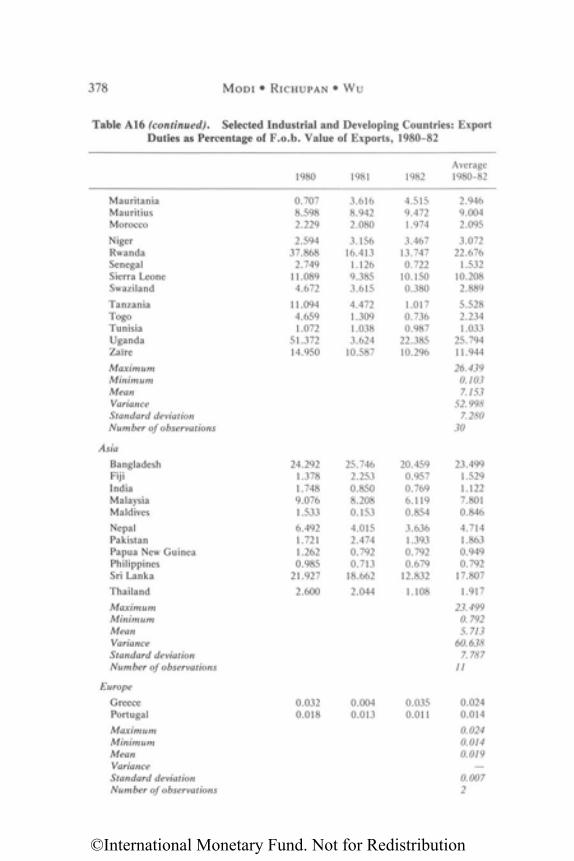
378 M O D I • RICHUPAN • W u
Table A16 (continued). Selected Industrial and Developing Countries: ExportDuties as Percentage of F.o .b . Value of Exports, 1980-82
MauritaniaMauritiusMorocco
NigerRwandaSenegalSierra LeoneSwaziland
TanzaniaTogoTunisiaUgandaZaire
MaximumMinimumMeanVarianceStandard deviationNumber of observations
Asia
BangladeshFijiIndiaMalaysiaMaldives
NepalPakistanPapua New GuineaPhilippinesSri Lanka
Thailand
MaximumMinimumMeanVarianceStandard deviationNumber of observations
Europe
GreecePortugal
MaximumMinimumMeanVarianceStandard deviationNumber of observations
1980
0.7078.5982.229
2.59437.868
2.74911.0894.672
11.0944.6591.072
51.37214.950
24.2921.3781.7489.0761.533
6.4921.7211.2620.985
21.927
2.600
0.0320.018
1981
3.6168.9422.080
3.15616.413
1.1269.3853.615
4.4721.3091.0383.624
10.587
25.7462.2530.8508.2080.153
4.0152.4740.7920.713
18.662
2.044
0.0040.013
1982
4.5159.4721.974
3.46713.7470.722
10.1500.380
1.0170.7360.987
22.38510.296
20.4590.9570.7696.1190.854
3.6361.3930.7920.679
12.832
1.108
0.0350.011
Average1980-82
2.9469.0042.095
3.07222.676
1.53210.2082.889
5.5282.2341.033
25.79411.944
26.4390.1037.153
52.9987.280
30
23.4991.5291.1227.8010.846
4.7141.8630.9490.792
17.8071.917
23.4990.7925.713
60.6387.787
11
0.0240.014
0.0240.0140.019
—0.0072
©International Monetary Fund. Not for Redistribution
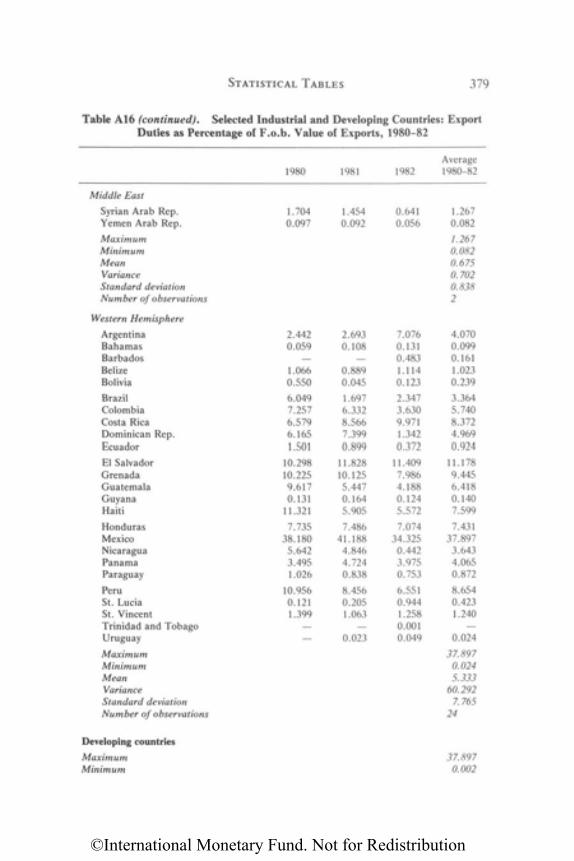
STATISTICAL TABLES 379
Table A 1 6 (continued). Selected Industrial and Developing Countries: ExportDuties as Percentage of F . o . b . Value of Exports, 1980-82
Middle EastSyrian Arab Rep.Yemen Arab Rep.MaximumMinimumMeanVarianceStandard deviationNumber of observations
Western HemisphereArgentinaBahamasBarbadosBelizeBoliviaBrazilColombiaCosta RicaDominican Rep.EcuadorEl SalvadorGrenadaGuatemalaGuyanaHaitiHondurasMexicoNicaraguaPanamaParaguayPeruSt. LuciaSt. VincentTrinidad and TobagoUruguayMaximumMinimumMeanVarianceStandard deviationNumber of observations
Developing countriesMaximumMinimum
1980
1.7040.097
2.4420.059
—1.0660.5506.0497.2576.5796.1651.501
10.29810.2259.6170.131
11.3217.735
38.1805.6423.4951.026
10.9560.1211.399
——
1981
1.4540.092
2.6930.108
—0.8890.0451.6976.3328.5667.3990.899
11.82810.1255.4470.1645.9057.486
41.1884.8464.7240.8388.4560.2051.063
—0.023
1982
0.6410.056
7.0760.1310.4831.1140.1232.3473.6309.9711.3420.372
11.4097.9864.1880.1245.5727.074
34.3250.4423.9750.7536.5510.9441.2580.0010.049
Average1980-82
1.2670.0821.2670.0820.6750.7020.8382
4.0700.0990.1611.0230.2393.3645.7408.3724.9690.924
11.1789.4456.4180.1407.5997.431
37.8973.6434.0650.8728.6540.4231.240
—0.024
37.8970.0245.333
60.2927.765
24
37.8970.002
©International Monetary Fund. Not for Redistribution
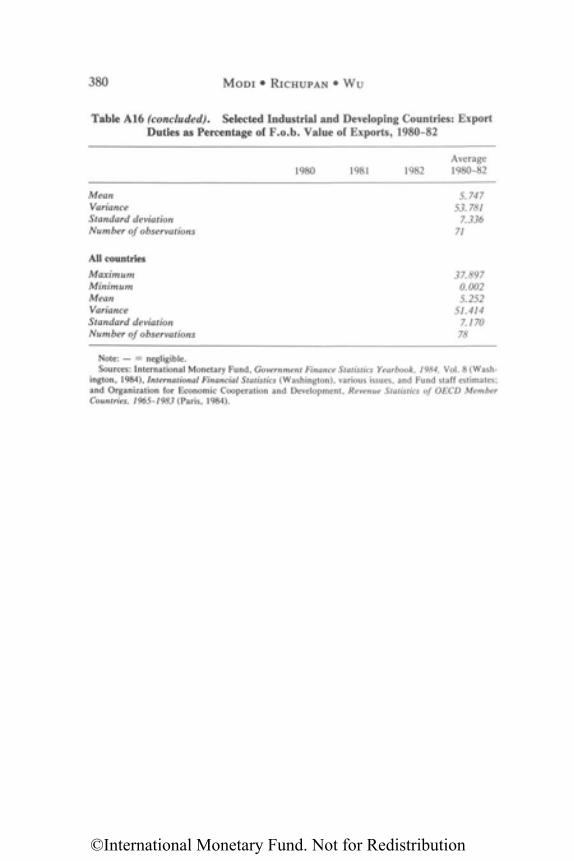
380 M O D I • RICHUPAN • W u
Table A 1 6 (concluded). Selected Industrial and Developing Countries: ExportDuties as Percentage of F.o .b. Value of Exports, 1980-82
Note: — = negligible.Sources: International Monetary Fund, Government Finance Statistics Yearbook, 1984, Vol. 8 (Wash-
ington, 1984), International Financial Statistics (Washington), various issues, and Fund staff estimates;and Organization for Economic Cooperation and Development, Revenue Statistics of OECD MemberCountries, 1965-1983 (Paris, 1984).
1980
MeanVarianceStandard deviationNumber of observations
All countries
MaximumMinimumMeanVarianceStandard deviationNumber of observations
1981 1982Average1980-82
5.74753.781
7.33671
37.8970.0025.252
51.4147.17078
©International Monetary Fund. Not for Redistribution
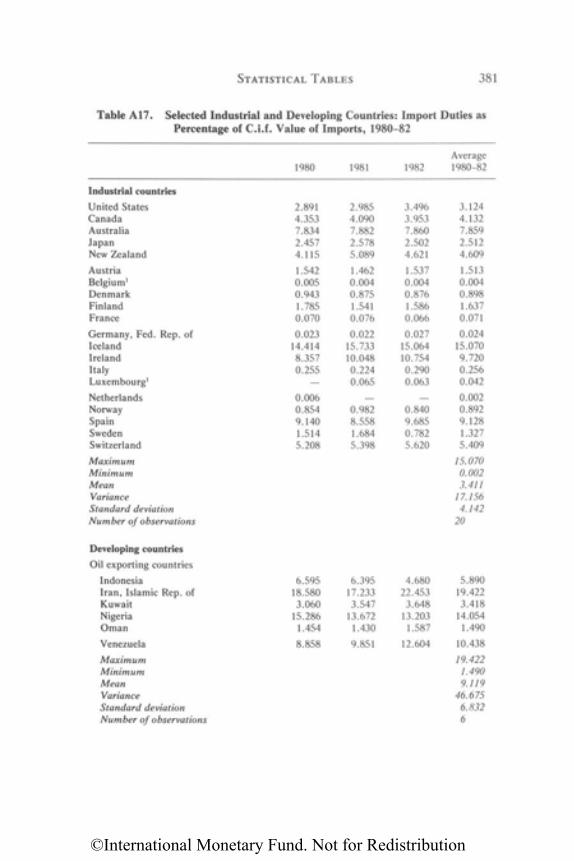
S T A T I S T I C A L T A B L E S 381
Table A 1 7 . Selected Industrial and Developing Countries: Import Duties asPercentage of C.i.f. Value of Imports, 1980-82
Industrial countries
United StatesCanadaAustraliaJapanNew Zealand
AustriaBelgium1
DenmarkFinlandFrance
Germany, Fed. Rep. ofIcelandIrelandItalyLuxembourg1
NetherlandsNorwaySpainSwedenSwitzerland
MaximumMinimumMeanVarianceStandard deviationNumber of observations
Developing countries
Oil exporting countries
IndonesiaIran, Islamic R e p . ofKuwaitNigeriaO m a n
Venezuela
MaximumMinimumMeanVarianceStandard deviationNumber of observations
1980
2.8914.3537.8342.4574.115
1.5420.0050.9431.7850.070
0.02314.4148.3570.255
—
0.0060.8549.1401.5145.208
6.59518.5803.060
15.2861.454
8.858
1981
2.9854.0907.8822.5785.089
1.4620.0040.8751.5410.076
0.02215.73310.0480.2240.065
0.9828.5581.6845.398
6.39517.2333.547
13.6721.430
9.851
1982
3.4963.9537.8602.5024.621
1.5370.0040.8761.5860.066
0.02715.06410.7540.2900.063
0.8409.6850.7825.620
4.68022.453
3.64813.203
1.587
12.604
Average1980-82
3.1244.1327.8592.5124.609
1.5130.0040.8981.6370.071
0.02415.0709.7200.2560.042
0.0020.8929.1281.3275.409
15.0700.0023.411
17.1564.142
20
5.89019.4223.418
14.0541.490
10.438
19.4221.4909.119
46.6756.8326
©International Monetary Fund. Not for Redistribution
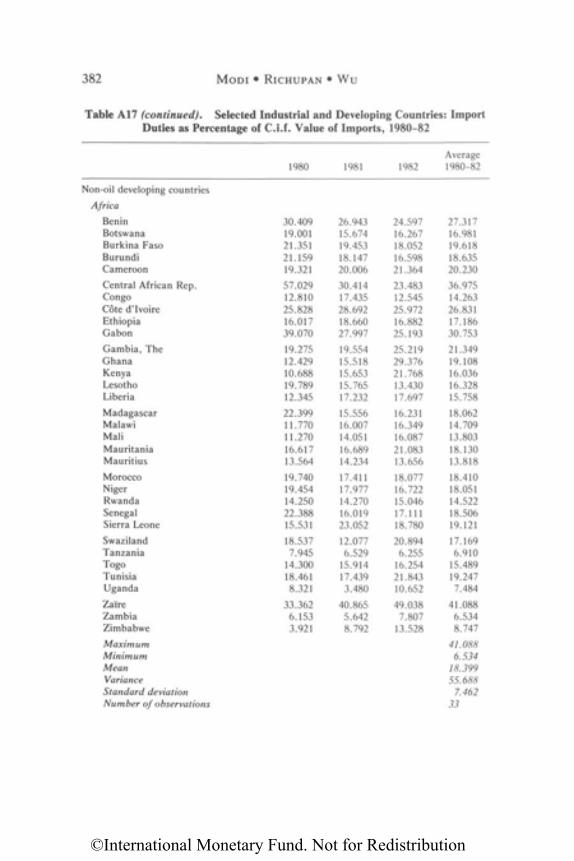
382 M O D I • RICHUPAN • Wu
Table A 1 7 (continued). Selected Industrial and Developing Countries: ImportDuties as Percentage of C.i.f. Value of Imports, 1980-82
Non-oil developing countries
AfricaBeninBotswanaBurkina FasoBurundiCameroon
Central African Rep.CongoCote d'IvoireEthiopiaGabon
Gambia, TheGhanaKenyaLesothoLiberia
MadagascarMalawiMaliMauritaniaMauritius
MoroccoNigerRwandaSenegalSierra Leone
SwazilandTanzaniaTogoTunisiaUganda
ZaireZambiaZimbabwe
MaximumMinimumMeanVarianceStandard deviationNumber of observations
1980
30.40919.00121.35121.15919.321
57.02912.81025.82816.01739.070
19.27512.42910.68819.78912.345
22.39911.77011.27016.61713.564
19.74019.45414.25022.38815.531
18.5377.945
14.30018.4618.321
33.3626.1533.921
1981
26.94315.67419.45318.14720.006
30.41417.43528.69218.66027.997
19.55415.51815.65315.76517.232
15.55616.00714.05116.68914.234
17.41117.97714.27016.01923.052
12.0776.529
15.91417.4393.480
40.8655.6428.792
1982
24.59716.26718.05216.59821.364
23.48312.54525.97216.88225.193
25.21929.37621.76813.43017.697
16.23116.34916.08721.08313.656
18.07716.72215.04617.11118.780
20.8946.255
16.25421.84310.652
49.0387.807
13.528
Average1980-82
27.31716.98119.61818.63520.230
36.97514.26326.83117.18630.753
21.34919.10816.03616.32815.758
18.06214.70913.80318.13013.818
18.41018.05114.52218.50619.121
17.1696.910
15.48919.2477.484
41.0886.5348.747
41.0886.534
18.39955.688
7.46233
©International Monetary Fund. Not for Redistribution
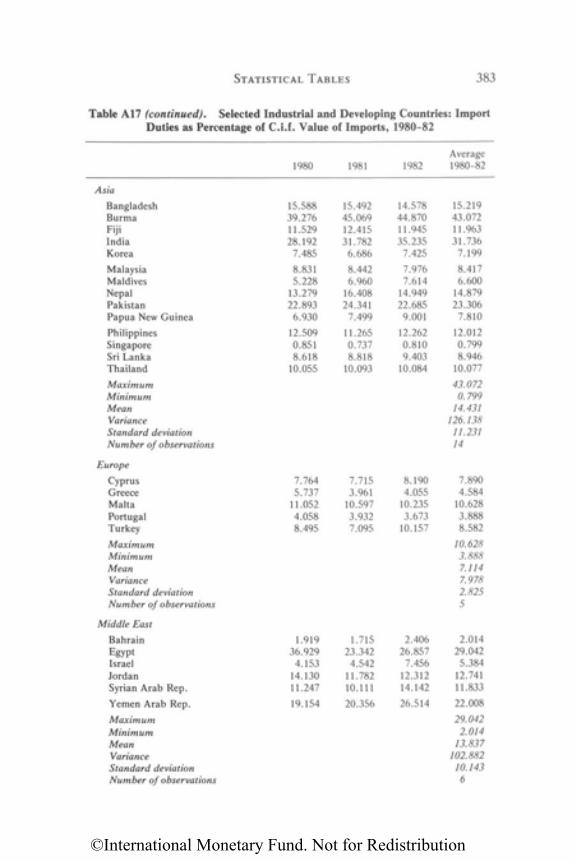
STATISTICAL TABLES 383
Table A 1 7 (continued). Selected Industrial and Developing Countries: ImportDuties as Percentage of C.i.f. Value of Imports, 1980-82
Asia
BangladeshBurmaFijiIndiaKorea
MalaysiaMaldivesNepalPakistanPapua N e w Guinea
PhilippinesSingaporeSri LankaThailand
MaximumMinimumMeanVarianceStandard deviationNumber of observations
Europe
CyprusGreeceMaltaPortugalTurkey
MaximumMinimumMeanVarianceStandard deviationNumber of observations
Middle East
BahrainEgyptIsraelJordanSyrian Arab Rep.
Yemen Arab Rep.
MaximumMinimumMeanVarianceStandard deviationNumber of observations
1980
15.58839.27611.52928.192
7.485
8.8315.228
13.27922.893
6.930
12.5090.8518.618
10.055
7.7645.737
11.0524.0588.495
1.91936.929
4.15314.13011.247
19.154
1981
15.49245.06912.41531.782
6.686
8.4426.960
16.40824.341
7.499
11.2650.7378.818
10.093
7.7153.961
10.5973.9327.095
1.71523.342
4.54211.78210.111
20.356
1982
14.57844.87011.94535.235
7.425
7.9767.614
14.94922.685
9.001
12.2620.8109.403
10.084
8.1904.055
10.2353.673
10.157
2.40626.857
7.45612.31214.142
26.514
Average1980-82
15.21943.07211.96331.736
7.199
8.4176.600
14.87923.306
7.810
12.0120.7998.946
10.077
43.0720.799
14.431126.138
11.23114
7.8904.584
10.6283.8888.582
10.6283.8887.1147.9782.8255
2.01429.042
5.38412.74111.833
22.008
29.0422.014
13.837102.882
10.1436
©International Monetary Fund. Not for Redistribution
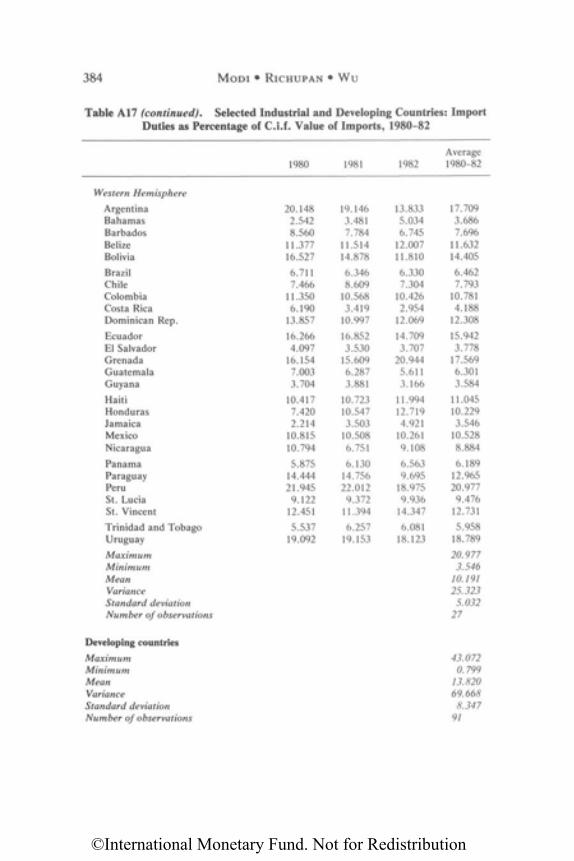
384 M O D I • RICHUPAN • W u
Table A 1 7 (continued). Selected Industrial and Developing Countries: ImportDuties as Percentage of C.i.f. Value of Imports, 1980-82
Western HemisphereArgentinaBahamasBarbadosBelizeBoliviaBrazilChileColombiaCosta RicaDominican Rep.EcuadorEl SalvadorGrenadaGuatemalaGuyanaHaitiHondurasJamaicaMexicoNicaraguaPanamaParaguayPeruSt. LuciaSt. VincentTrinidad and TobagoUruguayMaximumMinimumMeanVarianceStandard deviationNumber of observations
Developing countriesMaximumMinimumMeanVarianceStandard deviationNumber of observations
1980
20.1482.5428.560
11.37716.5276.7117.466
11.3506.190
13.85716.2664.097
16.1547.0033.704
10.4177.4202.214
10.81510.7945.875
14.44421.945
9.12212.4515.537
19.092
1981
19.1463.4817.784
11.51414.8786.3468.609
10.5683.419
10.99716.8523.530
15.6096.2873.881
10.72310.5473.503
10.5086.7516.130
14.75622.012
9.37211.3946.257
19.153
1982
13.8335.0346.745
12.00711.8106.3307.304
10.4262.954
12.06914.7093.707
20.9445.6113.166
11.99412.7194.921
10.2619.1086.5639.695
18.9759.936
14.3476.081
18.123
Average1980-82
17.7093.6867.696
11.63214.4056.4627.793
10.7814.188
12.30815.9423.778
17.5696.3013.584
11.04510.2293.546
10.5288.8846.189
12.96520.977
9.47612.7315.958
18.78920.977
3.54610.19125.323
5.03227
43.0720.799
13.82069.668
8.34791
©International Monetary Fund. Not for Redistribution
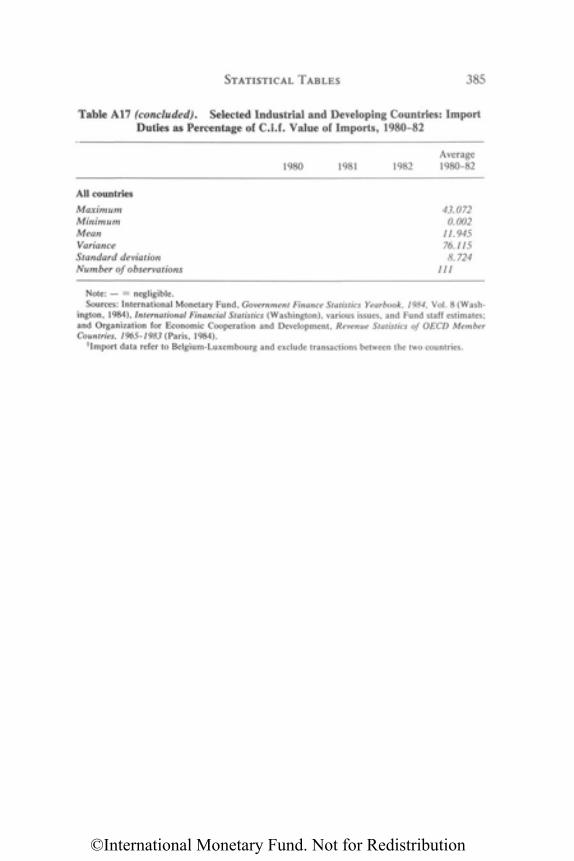
All countries
MaximumMinimumMeanVarianceStandard deviationNumber of observations
1980 1981 1982Average1980-82
43.0720.002
11.94576.1158.724
111
STATISTICAL T A B L E S 385
Table A 1 7 (concluded). Selected Industrial and Developing Countries: ImportDuties as Percentage of C.i.f. Value of Imports, 1980-82
Note: — = negligible.Sources: International Monetary Fund, Government Finance Statistics Yearbook, 1984, Vol. 8 (Wash-
ington, 1984), International Financial Statistics (Washington), various issues, and Fund staff estimates;and Organization for Economic Cooperation and Development, Revenue Statistics of OECD MemberCountries, 1965-1983 (Paris, 1984).
1Import data refer to Belgium-Luxembourg and exclude transactions between the two countries.
©International Monetary Fund. Not for Redistribution
APPENDIX II
Selected Bibliography
This bibliography covers major publications containing the views ofpopular supply-side economists in the United States on taxation and theLaffer curve. It also covers a few publications on related subjects such astax incentives, tax evasion, and progressivity of tax rates.
Agell, Jonas, "Subsidy to Capital Through Tax Incentives in the A S E A N Coun-tries: A n Application of the Cost of Capital Approach Under Inflationary Sit-uations," Singapore Economic Review (Singapore), Vol. 28 (October 1983),pp. 98-128.
Bartlett, Bruce R . , Reagonomics: Supply Side Economics in Action (New York:Quill, updated ed., 1982).
, "Supply-Side Economics: Theory and Evidence," Quarterly Review, Na-tional Westminster Bank (London), February 1985, pp. 18-29.
Bird, R . , Tax Incentives for Investment: The State of the Art, Canadian Tax PaperN o . 64 (Toronto: Canadian Tax Foundation, 1980).
Bosworth, Barry P . , Tax Incentives and Economic Growth (Washington: Brook-ings Institution, 1984).
Canto, Victor A . , Douglas H . Joines, and Arthur B . Laffer, Foundations of Sup-ply-Side Economics: Theory and Evidence (New York: Academic Press,1983).
Chatterji, M . , " A Note on Progressive Taxes and the Supply of Labor," Journal ofPublic Economics (Amsterdam), Vol. 12 (October 1979), pp. 215-20.
Cozzi, Terenzio, "Supply-Side Economics," Rivista di Politica Economica: Se-lected Papers (Rome), LXXII, 3rd Series (December 1982), pp. 59-86.
Evans, Michael K . , The Truth About Supply-Side Economics (New York: BasicBooks, 1983).
Federal Reserve Bank of Atlanta and Emory University Law and Economics Cen-ter, Supply-Side Economics in the 1980s: Conference Proceedings (Westport,Connecticut: Quorum Books, 1982).
Fink, Richard H . , ed., Supply-Side Economics: A Critical Appraisal (Frederick,Maryland: University Publications of America, 1982).
386
©International Monetary Fund. Not for Redistribution
S E L E C T E D B I B L I O G R A P H Y 387
Fullerton, Don , " O n the Possibility of an Inverse Relationship Between Tax Ratesand Government Revenues," Journal of Public Economics (Amsterdam), Vol.19 (October 1982), pp. 3-22.
Gardner, Martin, "Mathematical Games: The Laffer Curve and Other Laughs inCurrent Economics," Scientific American (New York), December 1981, pp.18-31c.
Hailstones, Thomas J., A Guide to Supply-Side Economics (Richmond, Virginia:Robert F. D a m e , Inc., 1982).
, ed., Viewpoints on Supply-Side Economics (Richmond, Virginia: RobertF. D a m e , Inc., 1982).
Hall, Robert E . , and Alvin Rabushka, Low Tax, Simple Tax, Flat Tax (New York:McGraw-Hill, 1983).
Hemming, R . , and J.A. Kay, "The Laffer Curve," Fiscal Studies (London), Vol. 1(March 1980), pp. 83-90.
Jameson, Kenneth P . , and Joseph Philips, "Supply-Side Economics: A SkepticalView," Economic Forum (Salt Lake City, Utah), Vol. 12, N o . 1 (Summer1981), pp. 81-88.
K w o n , Ohchul, "Taxes, Tax Revenues, and the Laffer Curve for a DevelopingCountry Like Korea," International Tax Journal (New York), Vol. 10, No. 4(May 1984), pp. 269-72.
Meyer, Laurence H . , ed., The Supply-Side Effects of Economic Policy (Boston,Massachusetts: Kluwer-Nijhoff, 1981).
McMullen, B . Starr, "The Laffer-Curve: Fact or Convenient Fantasy," EconomicForum (Salt Lake City, Utah), Vol. 12, N o . 2 (Winter 1981-82), pp. 113-15.
Mirowski, Philip, "What's Wrong With the Laffer Curve?" Journal of EconomicIssues (Sacramento, California), Vol. 16 (September 1982), pp. 815-28.
Modi, Jitendra R . , "Major Features of Corporate Profit Taxes in Selected Devel-oping Countries," Bulletin, International Bureau of Fiscal Documentation(Amsterdam), Vol. 41 (February 1987), pp. 65-74.
Raboy, David G . , ed., Essays in Supply Side Economics (Washington: Institute forResearch on the Economics of Taxation, 1982).
Rabushka, Alvin, From Adam Smith to the Wealth of America (New Brunswick,New Jersey: Transaction Books, 1985).
, and Bruce Bartlett, Tax Policy and Economic Growth in Developing Na-tions (Washington: P P C / E A , U . S . Agency for International Development,1985, mimeographed).
Reynolds, Alan, "The World: O n the Wrong Side of the Laffer Curve," paper pre-sented to a Conference on "The Flat Rate Tax," Policy Sciences Program,Florida State University (Tallahassee, Florida, March 1985, mimeographed).
, "Some International Comparisons of Supply-Side Tax Policy," Cato Jour-nal (Washington), Vol. 5 (Fall 1985), pp. 543-69.
©International Monetary Fund. Not for Redistribution
388 S E L E C T E D B I B L I O G R A P H Y
Richupan, Somchai, "Income Tax Evasion: A Review of the Measurement Tech-niques and Some Estimates for the Developing Countries" (unpublished, In-ternational Monetary Fund, July 23, 1984).
, "Revenue Significance of the Individual Income Tax in Developing Coun-tries" (unpublished, International Monetary Fund, April 22, 1985).
Roberts, Paul C . , The Supply-Side Revolution: An Insider's Account of Policy-making in Washington (Cambridge, Massachusetts: Harvard UniversityPress, 1984).
Rousseas, Stephen, "The Poverty of Wealth," Journal of Post Keynesian Eco-nomics (Armonk, N e w York), Vol. 4, N o . 2 (Winter 1981-82), pp. 192-213.
Sautter, Hermann, "Socio-Cultural Aspects of Supply-Side Economics for Devel-oping Countries," Inter economics: Review of International Trade and Devel-opment (Hamburg), N o . 6 (November-December 1983), pp. 278-85.
Tanzi, Vito, "The Policy Lessons of Supply-Side Economics: A Very Personal In-terpretation," paper presented at the Fifty-Third Annual Conference of theSouthern Economic Association (Washington, November 1983, mimeo-graphed).
, "The Underground Economy: The Causes and Consequences of thisWorldwide Phenomenon," Finance & Development (Washington), Vol. 20(December 1983), pp. 10-13.
, "Quantitative Characteristics of the Tax Systems of Developing Coun-tries," in The Theory of Taxation for Developing Countries, ed. by DavidNewbery and Nicholas Stern (New York: Oxford University Press, 1987).
United States, Department of the Treasury, Tax Reform for Fairness, Simplicityand Economic Growth: The Treasury Department Report to the President,Vols. I-III (Washington: Office of the Secretary, Department of the Treasury,November 1984).
U . S . Congress, House Committee on the Budget, Supply-Side Economics, HearingBefore the Task Force on Tax Policy of the Committee on the Budget, Houseof Representatives, 97th Congress, 1st Session, March 10, 1981 (Washington:Government Printing Office, 1981).
Wanniski, Jude, "Taxes, Revenues, and the 'Laffer Curve,'" The Public Interest,National Affairs, Inc. (New York), Winter 1978, pp. 3-16.
, The Way the World Works (New York: Simon and Schuster, rev. andupdated ed., 1983).
Weintraub, Sidney, "Keynesian D e m a n d Serendipity in Supply-Side Economics,"Journal of Post Keynesian Economics (Armonk, N e w York), Vol. 4, N o . 2(Winter 1981-82), pp. 181-91.
©International Monetary Fund. Not for Redistribution
Related Documents


