Power Point Accompaniment for “Supply, Demand, and Market Equilibrium”

Welcome message from author
This document is posted to help you gain knowledge. Please leave a comment to let me know what you think about it! Share it to your friends and learn new things together.
Transcript
Power Point Accompaniment for
“Supply, Demand, and Market
Equilibrium”

Introduction to Demand
• In the United States, the forces of supply and demand work
together to set prices.
• Demand is the desire, willingness, and ability to buy a good or
service.
– Supply can refer to one individual consumer or to the total demand
of all consumers in the market (market demand).
• Based on that definition, which of the following do you have a
demand for?
Introduction to Demand
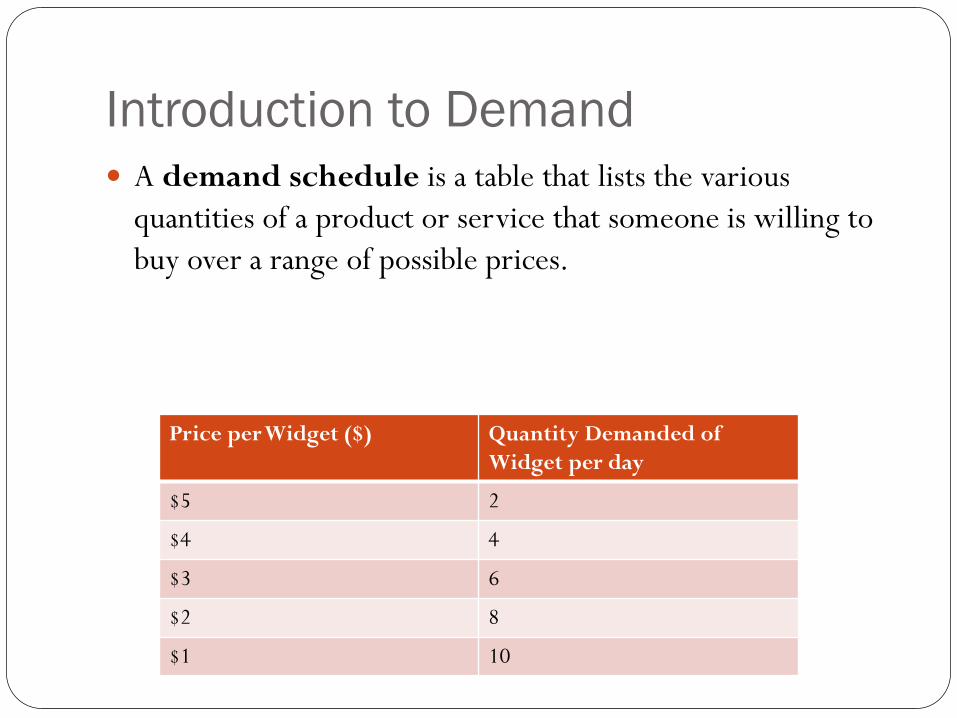
A demand schedule is a table that lists the various
quantities of a product or service that someone is willing to
buy over a range of possible prices.
Price per Widget ($) Quantity Demanded of
Widget per day
$5 2
$4 4
$3 6
$2 8
$1 10

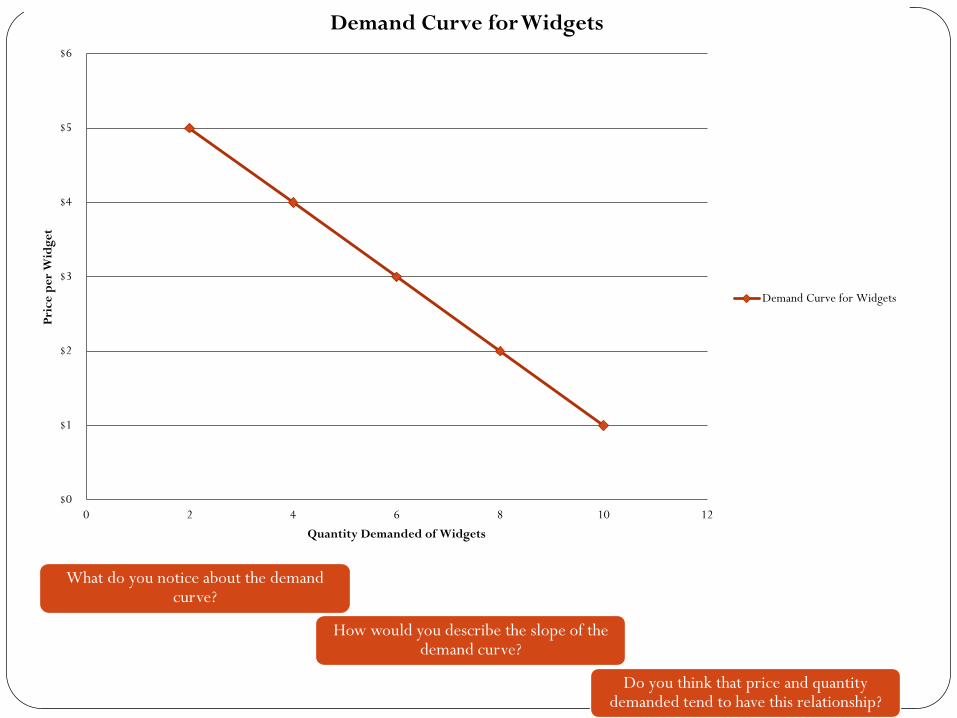
Introduction to Demand A demand schedule can be shown as points on a graph.
The graph lists prices on the vertical axis and quantities demanded on the horizontal axis.
Each point on the graph shows how many units of the product or service an individual will buy at a particular price.
The demand curve is the line that connects these points.
$0
$1
$2
$3
$4
$5
$6
0 2 4 6 8 10 12
Pri
ce
pe
r W
idg
et
Quantity Demanded of Widgets
Demand Curve for Widgets
Demand Curve for Widgets
What do you notice about the demand curve?
How would you describe the slope of the demand curve?
Do you think that price and quantity demanded tend to have this relationship?

Introduction to Demand The demand curve slopes downward.
This shows that people are normally willing to buy less of a
product at a high price and more at a low price.
According to the law of demand, quantity demanded and
price move in opposite directions.
$0
$1
$2
$3
$4
$5
$6
0 2 4 6 8 10 12
Pri
ce
pe
r W
idg
et
Quantity Demanded of Widgets
Demand Curve for Widgets
Demand Curve for Widgets

Introduction to Demand • We buy products for their utility- the pleasure, usefulness, or
satisfaction they give us.
• What is your utility for the following products? (Measure your
utility by the maximum amount you would be willing to pay
for this product)
• Do we have the same utility for these goods?

Introduction to Demand
• One reason the demand curve slopes downward is due to
diminish marginal utility
– The principle of diminishing marginal utility says
that our additional satisfaction tends to go down as we
consume more and more units.
• To make a buying decision, we consider whether the
satisfaction we expect to gain is worth the money we must
give up.

Changes in Demand Change in the quantity demanded due to a price change occurs
ALONG the demand curve
$0
$1
$2
$3
$4
$5
$6
0 2 4 6 8 10 12
Pri
ce
pe
r W
idg
et
Quantity Demanded of Widgets
Demand Curve for Widgets
Demand Curve for Widgets
•At $3 per Widget, the Quantity demanded of widgets is 6.
•An increase in the Price of Widgets from $3 to $4 will lead to a decrease in the Quantity Demanded of Widgets from 6 to 4.

Changes in Demand
• Demand Curves can also shift in response to the following
factors:
– Buyers (# of): changes in the number of consumers
– Income: changes in consumers’ income
– Tastes: changes in preference or popularity of product/ service
– Expectations: changes in what consumers expect to happen in the
future
– Related goods: compliments and substitutes
• BITER: factors that shift the demand curve

Changes in Demand • Prices of related goods affect on demand
– Substitute goods a substitute is a product that can be used in the
place of another.
• The price of the substitute good and demand for the other good are directly
related
• For example, Coke Price Pepsi Demand
– Complementary goods a compliment is a good that goes well
with another good.
• When goods are complements, there is an inverse relationship between the
price of one and the demand for the other
• For example, Peanut Butter Jam Demand
Changes in Demand
$0
$1
$2
$3
$4
$5
$6
0 2 4 6 8 10 12
Pri
ce
pe
r W
idg
et
Quantity Demanded of Widgets
Demand Curve for Widgets
Demand Curve for Widgets
$0
$1
$2
$3
$4
$5
$6
0 2 4 6 8 10 12 14
Pri
ce
pe
r W
idg
et
Quantity Demanded of Widets
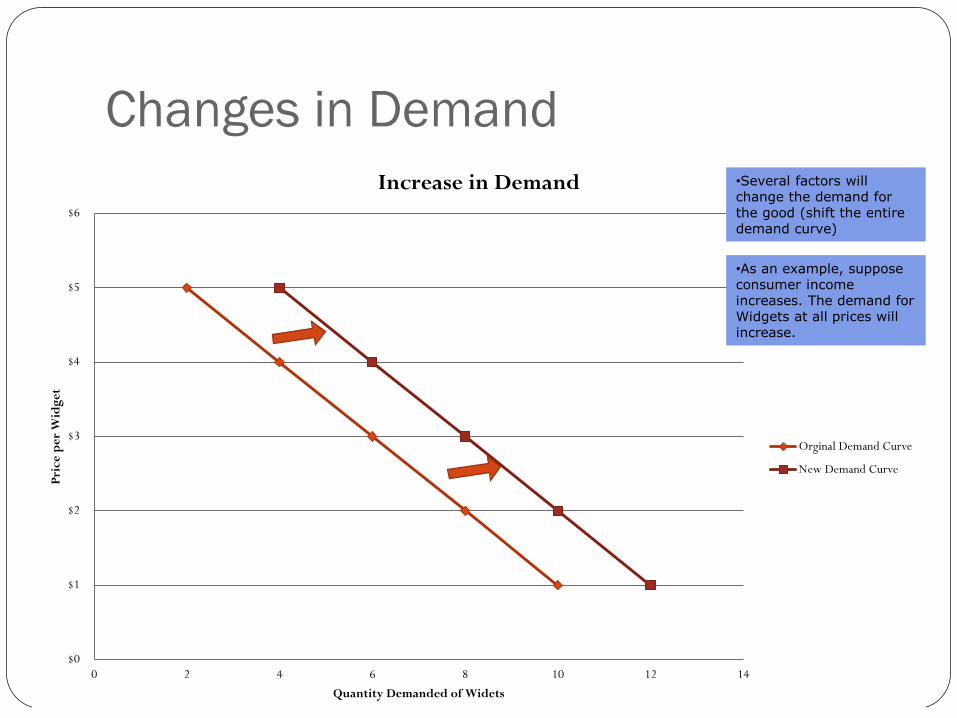
Increase in Demand
Orginal Demand Curve
New Demand Curve
•Several factors will change the demand for the good (shift the entire demand curve)
•As an example, suppose consumer income increases. The demand for Widgets at all prices will increase.
Changes in Demand
$0
$1
$2
$3
$4
$5
$6
0 2 4 6 8 10 12
Pri
ce
pe
r W
idg
et
Quantity Demanded of Widgets
Demand Curve for Widgets
Demand Curve for Widgets
$0
$1
$2
$3
$4
$5
$6
0 2 4 6 8 10 12
Pri
ce
pe
r W
idg
et
Quantity Demanded of Widgets
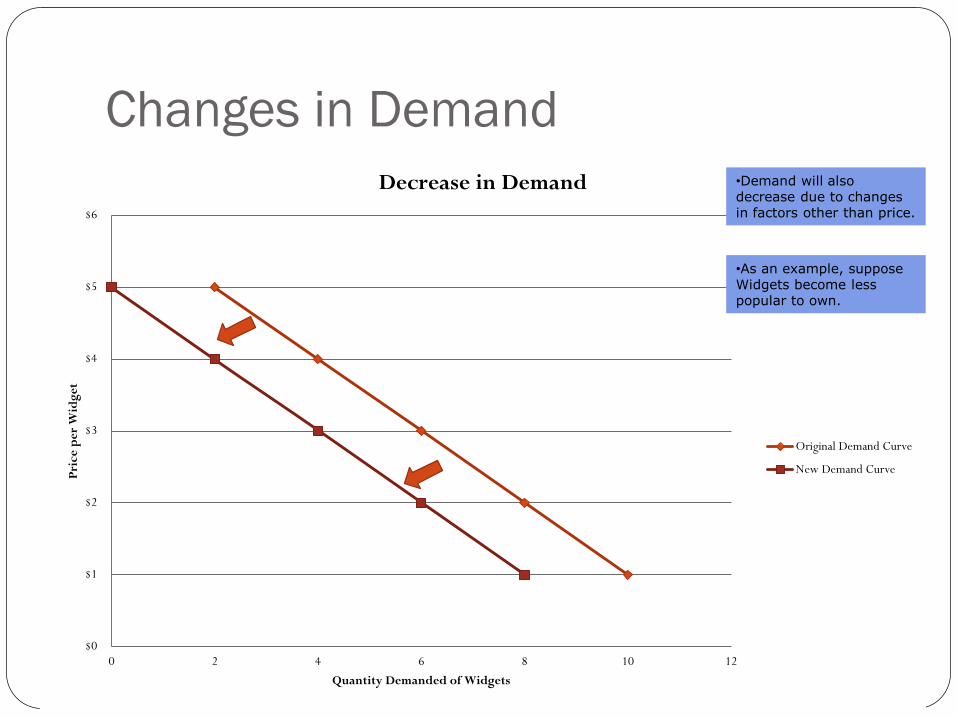
Decrease in Demand
Original Demand Curve
New Demand Curve
•As an example, suppose Widgets become less popular to own.
•Demand will also decrease due to changes in factors other than price.

Changes in Demand
Changes in any of the factors other than price causes the
demand curve to shift either:
Decrease in Demand shifts to the Left (Less demanded at
each price)
OR
Increase in Demand shifts to the Right (More demanded at
each price)

Introduction to Supply
• Supply refers to the various quantities of a good or
service that producers are willing to sell at all possible
market prices.
• Supply can refer to the output of one producer or to
the total output of all producers in the market
(market supply).
Introduction to Supply
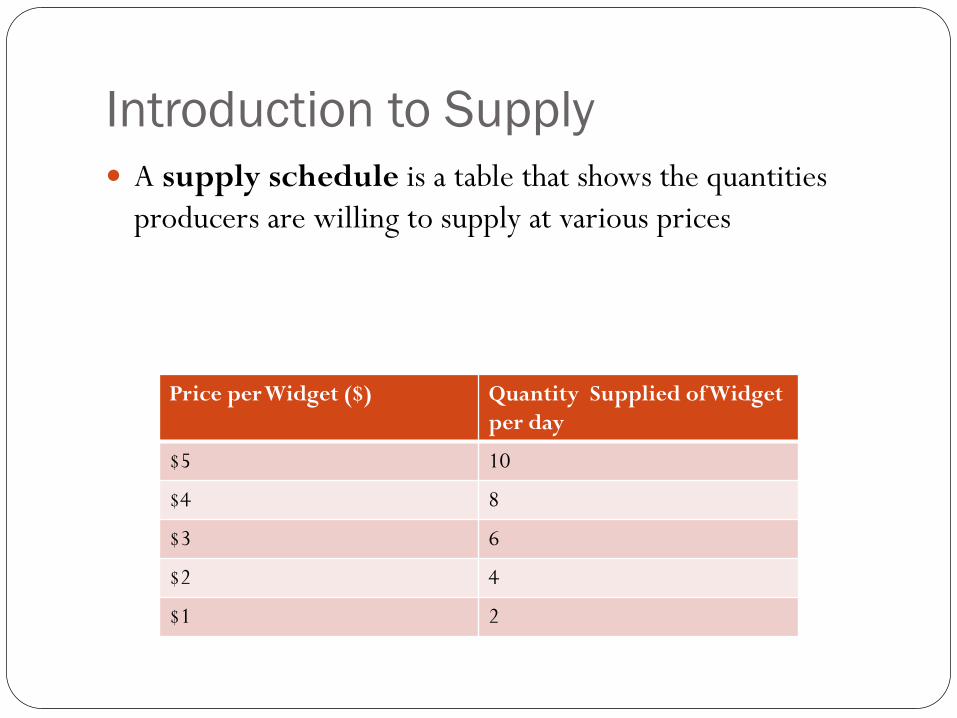
A supply schedule is a table that shows the quantities
producers are willing to supply at various prices
Price per Widget ($) Quantity Supplied of Widget
per day
$5 10
$4 8
$3 6
$2 4
$1 2

Introduction to Supply A supply schedule can be shown as points on a graph.
The graph lists prices on the vertical axis and quantities supplied on the horizontal axis.
Each point on the graph shows how many units of the product or service a producer (or group of producers) would willing sell at a particular price.
The supply curve is the line that connects these points.

What do you notice about the supply curve?
How would you describe the slope of the supply curve?
Do you think that price and quantity supplied tend to have this relationship?
$0
$1
$2
$3
$4
$5
$6
0 2 4 6 8 10 12
Pri
ce
pe
r W
idg
et
Quantity Supplied of Widgets
Supply Curve for Widgets
Supply Curve

Introduction to Supply • As the price for a good rises, the quantity supplied rises and
the quantity demanded falls. As the price falls, the quantity
supplied falls and the quantity demanded rises.
• The law of supply holds that producers will normally offer
more for sale at higher prices and less at lower prices.
$0
$1
$2
$3
$4
$5
$6
0 2 4 6 8 10 12
Pri
ce
pe
r W
idg
et
Quantity Supplied of Widgets
Supply Curve for Widgets
Supply Curve

Introduction to Supply
The reason the supply curve slopes upward is due to costs and
profit.
Producers purchase resources and use them to produce output.
Producers will incur costs as they bid resources away from their
alternative uses.

Introduction to Supply
Businesses provide goods and services hoping to make a
profit.
Profit is the money a business has left over after it
covers its costs.
Businesses try to sell at prices high enough to cover
their costs with some profit left over.
The higher the price for a good, the more profit a
business will make after paying the cost for resources.

Changes in Supply
$0
$1
$2
$3
$4
$5
$6
0 2 4 6 8 10 12
Pri
ce
pe
r W
idg
et
Quantity Supplied of Widgets
Supply Curve for Widgets
Supply Curve
•At $3 per Widget, the Quantity supplied of widgets is 6.
•If the price of Widgets fell to $2, then the Quantity Supplied would fall to 4 Widgets.
•Change in the quantity supplied due to a price change occurs ALONG the supply curve

Changes in Supply
• Supply Curves can also shift in response to the following factors:
– Subsidies and taxes: government subsides encourage production, while taxes discourage production
– Technology: improvements in production increase ability of firms to supply
– Other goods: businesses consider the price of goods they could be producing
– Number of sellers: how many firms are in the market
– Expectations: businesses consider future prices and economic conditions
– Resource costs: cost to purchase factors of production will influence business decisions
• STONER: factors that shift the supply curve

Changes in Supply
$0
$1
$2
$3
$4
$5
$6
0 2 4 6 8 10 12
Pri
ce
pe
r W
idg
et
Quantity Supplied of Widgets
Supply Curve for Widgets
Supply Curve
$0
$1
$2
$3
$4
$5
$6
0 2 4 6 8 10 12 14
Pri
ce
pe
r W
idg
et
Quantities Supplied of Widgets
Increase in Supply
Original Supply Curve
New Supply Curve
•Several factors will change the demand for the good (shift the entire demand curve)
•As an example, suppose that there is an improvement in the technology used to produce widgets.
Changes in Supply
$0
$1
$2
$3
$4
$5
$6
0 2 4 6 8 10 12
Pri
ce
pe
r W
idg
et
Quantity Supplied of Widgets
Supply Curve for Widgets
Supply Curve
$0
$1
$2
$3
$4
$5
$6
0 2 4 6 8 10 12
Pri
ce
pe
r W
idg
et
Quantity Supplied of Widgets
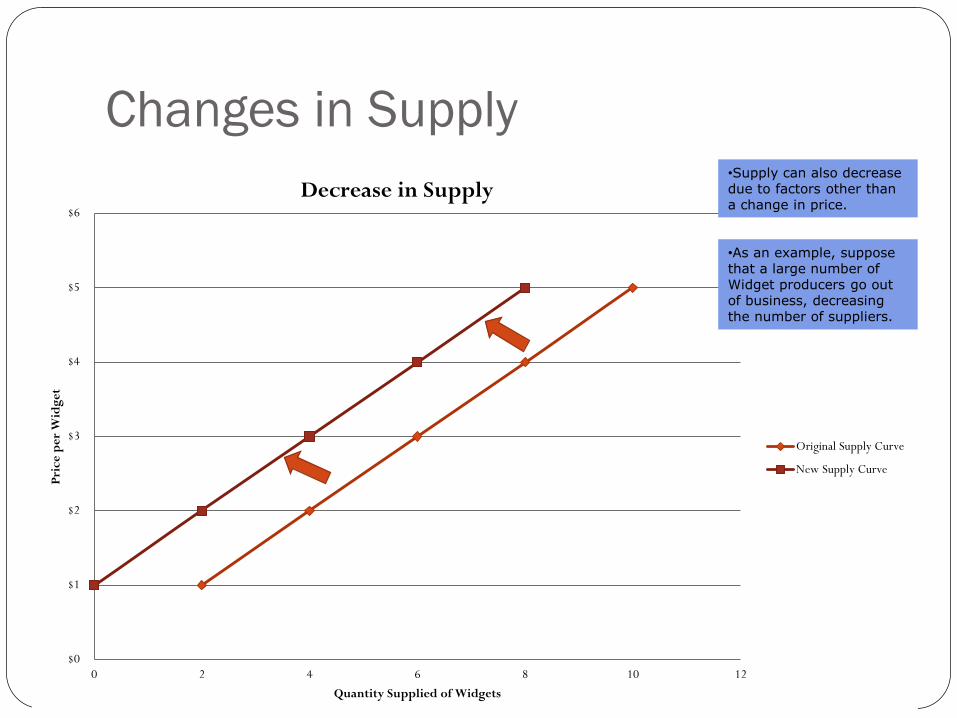
Decrease in Supply
Original Supply Curve
New Supply Curve
•Supply can also decrease due to factors other than a change in price.
•As an example, suppose that a large number of Widget producers go out of business, decreasing the number of suppliers.

Changes in Supply
Changes in any of the factors other than price causes the
supply curve to shift either:
Decrease in Supply shifts to the Left (Less supplied at each
price)
OR
Increase in Supply shifts to the Right (More supplied at each
price)

Supply Practice Answers

Supply and Demand at Work
Markets bring buyers and sellers together.
The forces of supply and demand work together in
markets to establish prices.
In our economy, prices form the basis of economic
decisions.

Supply and Demand at Work
Supply and Demand Schedule can be combined into one
chart.
Price per Widget ($) Quantity Demanded
of Widget per day
Quantity Supplied
of Widget per day
$5 2 10
$4 4 8
$3 6 6
$2 8 4
$1 10 2

Supply and Demand at Work
$0
$1
$2
$3
$4
$5
$6
0 2 4 6 8 10 12
Pri
ce
pe
r W
idg
et
Quantity of Widgets
Supply and Demand for Widgets
Demand Curve
Supply Curve

Supply and Demand at Work
• A surplus is the amount by which the quantity
supplied is higher than the quantity demanded.
– A surplus signals that the price is too high.
– At that price, consumers will not buy all of the product
that suppliers are willing to supply.
– In a competitive market, a surplus will not last. Sellers
will lower their price to sell their goods.

Supply and Demand at Work
$0
$1
$2
$3
$4
$5
$6
0 2 4 6 8 10 12
Pri
ce
pe
r W
idg
et
Quantity of Widgets
Supply and Demand for Widgets
Demand Curve
Supply Curve
•Suppose that the price in the Widget market is $4.
•At $4, Quantity demanded will be 4 Widgets
•At $4, Quantity supplied will be 8 Widgets.
•At $4, there will be a surplus of 4 Widgets.
Surplus

Supply and Demand at Work
A shortage is the amount by which the quantity
demanded is higher than the quantity supplied
A shortage signals that the price is too low.
At that price, suppliers will not supply all of the product
that consumers are willing to buy.
In a competitive market, a shortage will not last. Sellers
will raise their price.

Supply and Demand at Work
$0
$1
$2
$3
$4
$5
$6
0 2 4 6 8 10 12
Pri
ce
pe
r W
idg
et
Quantity of Widgets
Supply and Demand for Widgets
Demand Curve
Supply Curve
•Suppose that the price in the Widget market is $2.
•At $2, Quantity supplied will be 4 Widgets
•At $2, Quantity demanded will be 8 Widgets.
•At $2, there will be a shortage of 4 Widgets.
Shortage
Supply and Demand at Work • When operating without restriction, our market
economy eliminates shortages and surpluses. – Over time, a surplus forces the price down and a shortage forces
the price up until supply and demand are balanced.
– The point where they achieve balance is the equilibrium price. At this price, neither a surplus nor a shortage exists.
• Once the market price reaches equilibrium, it tends to stay there until either supply or demand changes.
– When that happens, a temporary surplus or shortage occurs until the price adjusts to reach a new equilibrium price.

Supply and Demand at Work
$0
$1
$2
$3
$4
$5
$6
0 2 4 6 8 10 12
Pri
ce
pe
r W
idg
et
Quantity of Widgets
Supply and Demand for Widgets
Demand Curve
Supply Curve
•Suppose that the price in the Widget market is $3.
•At $3, Quantity supplied will be 6 Widgets
•At $3, Quantity demanded will be 6 Widgets.
•At $3, there will be neither a surplus or a shortage.

Supply and Demand Practice
Answers

$0
$2
$4
$6
$8
$10
$12
0 2 4 6 8 10 12
Pri
ce
pe
r B
oo
me
ran
g
Quantity of Boomerangs
Supply and Demand for Boomerangs
Demand
Supply
Surplus

$0
$2
$4
$6
$8
$10
$12
0 2 4 6 8 10 12
Pri
ce
pe
r B
oo
me
ran
g
Quantity of Boomerangs
Supply and Demand for Boomerangs
Demand
Supply
Shortage

6
$0
$2
$4
$6
$8
$10
$12
0 2 4 6 8 10 12
Pri
ce
pe
r B
oo
me
ran
g
Quantity of Boomerangs
Supply and Demand for Boomerangs
Demand
Supply
Market Equilibrium

$0
$2
$4
$6
$8
$10
$12
0 2 4 6 8 10 12 14 16
Pri
ce
pe
r B
oo
me
ran
g
Quantity of Boomerangs
Supply and Demand for Boomerangs
Original Demand
Supply
New Demand

1. Basketball tickets – the IU Hoosiers start the
season with 10 straight losses (bball tickets)
Quantity
Pri
ce
D
S
D1
P1
Q1
P2
Q2

2. Greene County is named “Most Beautiful
County” in the U.S. and tourism doubles.
(hotel rooms)
Quantity
Pri
ce
D
S
D1
P2
P1
Q1 Q2

3. The Federal government has been warning the
public about the possibility of a recession and job
loss in the midwest. (sports cars)(Think
expectations!)
Quantity
Pri
ce
D
S
D1
P1
Q1
P2
Q2
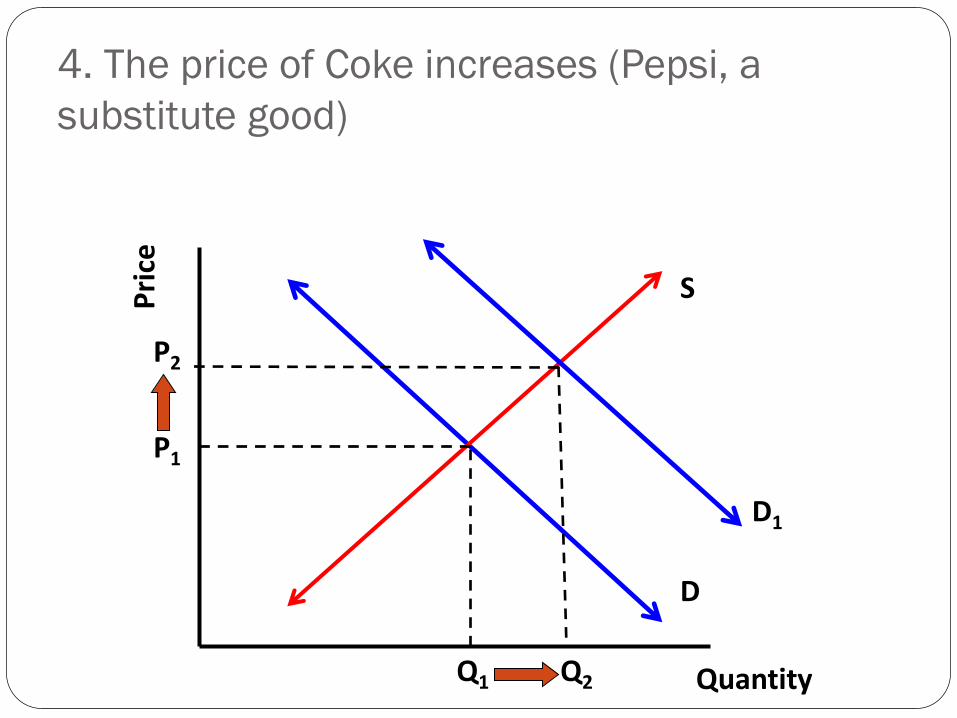
4. The price of Coke increases (Pepsi, a
substitute good)
Quantity
Pri
ce
D
S
D1
P1
Q1
P2
Q2

5. The price of silk increases (silk ties).
Quantity
Pri
ce
D
S
P2
S1
P1
Q2 Q1

6. The government adds a subsidy to tie
production. (ties)
Quantity
Pri
ce
D
S
S1
P1
Q1
P2
Q2

7. Congress enacts new tax on the production of
cigarettes. (cigarettes)
Quantity
Pri
ce
D
S
S1
P1
Q1
P2
Q2

8. Craft beer companies have been popping
up everywhere recently. (craft beer)
Quantity
Pri
ce
D
S
S1
P1
Q1
P2
Q2

9. Flannel shirts are named by GQ magazine as a “must
have” for all young professionals. At the same time, a
new textile machine decreases the cost of producing
flannel shirts.
Quantity
Pri
ce
D
S S1
D1
P1
Q1 Q2

10. Workers at the Colgate toothpaste factory go on strike. At the same
time, it is learned that Colgate actually stains teeth more than other pastes.
(Colgate toothpaste)
Quantity
Pri
ce
D
S
S1
D1
P1
Q1 Q2
Related Documents