Friday June 11 th , 2021 Thematic workshop Supply chains, logistics, and the economics of mobility

Welcome message from author
This document is posted to help you gain knowledge. Please leave a comment to let me know what you think about it! Share it to your friends and learn new things together.
Transcript

Friday June 11th, 2021
Thematic workshop
Supply chains, logistics, and the economics of mobility

2
Welcome to the thematic workshop on supply chains, logistics, and the
economics of mobility
The plenary sessions will be recorded - please turn off your camera if you do not want to be recorded
Associate Partner
McKinsey & Company
Milan, Italy
Luca Milani
Associate Partner
McKinsey & Company
Munich, Germany
Stephanie Haag
Associate Partner
McKinsey & Company
Munich, Germany
Anja Huber
Vice President of
Smart State Initiatives
Arizona Commerce
Authority
Dominic Papa
Strategic Advisor
Smart Mobility
Province of North
Holland, Metropolitan
Area Amsterdam
Chris de Veer
Consultant Modal Shift
City of Antwerp
Tim Vervoort
Policy Officer
European Commission,
DG MOVE
Paola Chiarini
Project Officer
City of Milan
Elisa Torricelli

3
Our Agenda today
13:45-14:20
14:20-14:55
Time
13:30-13:35
13:35-13:45
Speaker
Stephanie Haag
Paola Chiarini
Luca Milani
Dominic Papa
Chris de Veer
Anja Huber
Tim Vervoort
Elisa torricelli
Stephanie Haag
Title
Thematic Network Coordinator, McKinsey
Policy officer, EC, DG MOVE
Themative Netowkr Coordinator, McKinsey
Vice President of Smart State Initiatives, Arizona
Commerce Authority (ACA)
Strategic Advisor Smart Mobility, Province of
North Holland, Metropolitan Area Amsterdam
Thematic Network Coordinator, McKinsey
Consultant Modal Shift, City of Antwerp
Project Officer, City of Milan
Thematic Network Coordinator, McKinsey14:55-15:00
Agenda
Topic 1: Urban mobility
Topic 2: Freight and
industrial transport
Welcome
Remarks by DG MOVE
Closing remarks

Welcome
Stephanie Haag
McKinsey & Company

Sustainable urban mobility and
logistics: DG MOVE’s main policies
and initiatives relevant to cities
Paola Chiarini
Policy Officer, European Commission,
DG MOVE

Sustainable and Smart Mobility Strategy
New Urban Mobility Framework
Research and innovation opportunities
Digitalisation of freight transport
1
2
3
4
6

7
1 Sustainable and Smart Mobility Strategy
Objective1
SustainableMobility
Objective2
SmartMobility
Objective3
ResilientMobility
A MORE RESILIENT SINGLE EUROPEAN TRANSPORT AREA: FOR INCLUSIVE CONNECTIVITY
AN IRREVERSIBLE SHIFT TOZERO-EMISSION MOBILITY
ACHIEVING SEAMLESS, SAFEAND EFFICIENT CONNECTIVITY
90 % reduction in transport emissions;
All transport modes are mademore sustainable;
Sustainable alternatives are available;
Right incentives are in place forsustainable choices
Seamless multimodal transport based on digital solutions;
Unleash full potential of data;
Develop and deploy connected, cooperative, and automated mobility services;
Paperless freight transport in favour of fast, digital procedures.
Reinforced Single Market:- more investment in infrastructure and fleets;- deepening and enforcing internal market;- making our system crisis proof.
Fair and just mobility (that is affordableand accessible);
Enhanced safety and security.

Urban mobility and logistics in the StrategyFLAGSHIP 3 – Making interurban and urban mobility more sustainable and healthy
FLAGSHIP 4 – Greening freight transport
Increasing modal shares of collective transport, walking and cycling, as
well as automated, connected and multimodal mobility will significantly lower pollution and congestion.
Engaging with cities to ensure that all large and medium-sized cities that
are urban nodes on the TEN-T network put in place their own sustainable urban mobility plans (SUMPs) by 2030.
Active transport modes, such as cycling, have seen growth with cities
announcing over 2300 km of extra cycling infrastructure. This should be doubled in the next decade towards 5000 km in safe bike lanes.
Clearer guidance is needed on mobility management at local and regional level,
including on better urban planning, and on connectivity with rural and suburban areas, so that commuters are given sustainable mobility options.
Multimodal logistics must be part of this transformation. SUMPs
should also include the freight dimension through dedicated sustainable urban logistics plans, to accelerate the deployment of zero-emission solutions already available, including cargo bikes, automated deliveries and drones and better use of inland waterways into cities.
Boosting the uptake of zero-emission vehicles in corporate and urban
fleets. In addition, the European Green Deal calls for a substantial part of the 75% of inland freight carried today by road to shift to rail and inland waterways.
Helping cities modernise their policy toolbox, including in areas such as
micromobility, support for the procurement of zero-emission vehicles, including buses and ferries, and associated infrastructure.
Pricing carbon the Commission plans to establish a European
framework for the harmonised measurement of transport and logistics greenhouse gas emissions

9
2 New Urban Mobility Framework
How
• Five consultation workshops for
stakeholders in June
• Urban logistics consultation
workshop on 21 June
• 12-week Open Public Consultation
– imminent launch – see
@Transport_EU or DG MOVE
website
Why
• Need for a more coordinated
approach, esp. in areas where EU
action can contribute the most
• To reinforce the support to
European cities for tackling urban
mobility challenges
What
• Sustainable Urban Mobility Plans
• guidance on urban logistics and UVAR
• urban Intelligent Transport Systems
• data and indicators (SUMI)
• urban road safety
• and more
When
• Roadmap published in April
• Adoption planned by end
2021

Urban freight transport and logistics in UMF
WHY? Objective: Support cities in achieving carbon-neutral logistics, focusing on TEN-T urban nodes
Target in the Communication (tbc): reaching zero emission delivery in urban nodes (above 100 000 inhabitants) by 2030
/ aim for 2040 in other (medium/bigger) EU cities
WHAT? Tentative content of the proposal
• Support the uptake of Sustainable Urban Logistics Plans (SULPs)
• Support the development of multimodal (micro)consolidation centres /
freight routes to facilitate esp. the first/last mile logistics and connect to
the long haul cargo networks (TEN-T)
• Improve urban logistics data provision (loading zones/multimodal urban
freight network/routing optimisation)
• Raise the need to standardise data exchange with (big) platforms on
urban supply chain to facilitate groupage of (e-commerce) deliveries
• Accelerate the uptake of new/innovative delivery methods (cargo
bikes, LEFVs, drones etc.) and business/operating models to green the
last mile
HOW?
• In the Urban Mobility Framework
Communication
• In TEN-T revised regulation: Urban
nodes > 100 000 on TEN-T adopt a
dedicated urban logistics plan (SULP) (+
recommend for other cities)
• In funding programmes, e.g. ESIF,
Horizon Europe, Connecting Europe
Facility
• In actions planned in the Green Cargo
flagship
• In DG CLIMA: internationalisation of
external costs

11
3 Freight transport and logistics research
and innovation opportunities

Urban mobility and logistics in Horizon 2020
CIVITAS ELEVATE (CSA)
Tackling Congestion (RIAs)
Urban freight and logistics (RIAs)
CITYLAB, NOVELOG,SUCCESS, U-TURN
Sustainable Urban Mobility Planning -
SUMP projects (RIAs)
PROSPERITY SUMPsUp
SUITS Smart electric mobility in cities (IAs)
CIVITAS DemoActions/ Living Labs (IAs)
DESTINATIONS, ECCENTRIC,
PORTIS
Co-creating urban mobility in neighbourhoods (RIAs)
Cities4People, Metamorphosis,SUNRISE, MUV
2015 -
2018
2016 -
2019/2
020
Multi-modal inter-urban transport, regional mobility (RIAs)
The impacts of new technologies and changes on
policy making (RIAs)
HANDSHAKE,CityChangerCargoBike,
Park4SUMP
MEISTERGreenCharge
HARMONY
MOMENTUM, SproutSUMP-PLUS, ReVEaL
CIVITAS.EU
CREATE, CIPTEC,EMPOWER,
FLOW, TRACE
Electric two-wheelers and new ultra-light
vehicle concepts (RIAs)
ESPRITEU-LIVE
Electromobility and electrification of PT (RIAs)
ELIPTICEBSF_2
Demonstration for integration of electrified vehicles in the urban transport system (IAs)
ASSURED, ELVITENSTEVE
Electric vehicles integration into the
transport system and the grid (RIAs)
ELECTRIFIC
ART is urban context (IAs)
AVENUESHOW
ERA-NET accessibility in urban
EN-UAC
Shared and low emission logistics operations in urban
areas (RIAs)
LEAD, SENATORUlaaDs
Socio-economic aspects of transport: VTR, TP
accessibility, women in transport, vulnerable groups
accessibility… (RIAs)
SKILFULL, Hi-Reach, Inclusion, STARs, MoTiv,
GECKO, DIAMOND, TinnGo, TRIPS, INDIMO
Urban mobility and sustainable electrification in large urban areas InCo (IAs)
SOLUTIONSPlus
Road/street (re)design (RIAs)
MORE
CIVITAS SATELLITE (CSA)
2017/2
018 -
2020/2
021
2019 -
2022/2
023
Take-up of innovative transport and mobility
solutions (IAs)

• Work programme 2021-2022 calls to
be open and published around mid-
June in Funding & Tender portal
• European R&I Days on 23-24 June
• Cluster 5 (Climate, Energy & Mobility)
work programme 2021-2022 InfoDay
and Brokerage event on 5-7 July
Freight transport and logistics R&I in Horizon Europe
Sustainable and smart freight
transport and logistics
• Pilot actions on multimodal nodes and
logistics networks integration
• Resilient logistics networks
• Smart enforcement in road transport
Innovative urban logistics and
mobility
• Greening the last mile
• Planning: anticipating demand,
digitalisation
a strategic priority for joint action: “100 climate-
neutral cities by 2030”
[to be adopted towards end 2021]
Work programme 2021-2022 topics:
Mission “Climate-neutral and Smart Cities”

14
4 Digital Transport and Logistics Forum
Expert Group of the Commission
➢ Mission: to provide a platform for structural dialogue, exchange and provision of technical expertise, cooperation and coordination between the Commission, Member States and industry
➢ Established in 2015, more than 100 members
➢ 2 work streams:
1. Electronic freight transport information regulation (eFTI) – implementation ongoing, fully applicable in 2025
• legal framework for the electronic B2A communication of existing regulatory information on cargo (but not vehicles or drivers)
• common data model, requirements for data processing and interfaces, obligation to authorities to accept the information provided by any certified eFTI platform
2. Trusted environment for corridor data exchange
• A proposal on a technical, organisational and legal framework and governance structure for cost effective and secure B2B data exchange to support collaborative logistics (architecture and rules for bringing together various exiting platforms – a logistics common data space)

Thank you
© European Union 2020
Unless otherwise noted the reuse of this presentation is authorised under the CC BY 4.0 license
Paola Chiarini

Urban Mobility Topic 1

Trends disrupting Urban Mobility
Luca Milani
Associate Partner,
McKinsey & Company
18
The main trends that are impacting and impacting the mobility sector
over the next 10 yearsR
eg
ula
tory
an
d
mark
et
en
vir
on
men
t
Dig
itiz
ati
on
/
Inn
ovati
on
Co
nsu
mers
Short term
Medium term
EvidenceDescriptionDescription Evidence
Growth of micro-mobility systems (e.g. e-scooters,
electric scooters) and related ancillary services offered
by municipalities/ transport operators
150 EUR billion as the market value of
micro-mobility in Europe
Growing demand for technology from citizens and
progressive development of "smart" applications in
various sectors of the urban ecosystem
Growing deployment of Mobility-as-a-Service
platforms and use of sensors and connected devices
to provide live mobility information
55 billion connected devices by
2025
Growing electric vehicle deployment supported by
increased investment in R&D for electric and
hydrogen technology development
Potential deployment of self-driving vehicles due
to lower transport costs for the final consumer (e.g.,
robotaxi) and increased safety (autonomous
private cars)
Increasing fragmentation of purchases through e-
commerce, with significant impacts on first/ last mile
transport and urban logistics flows
1.5x impact of e-commerce on global
purchases by 2024
Progressive ageing of the population, combined
with a reduction in spending capacity
Progressive diffusion / use of shared mobility
systems perceived as more sustainable
9
%
growth per year on shared
mobility by 2030
Growing demand for customer customization of the
offer of products and services
50% Customer interactions that will
be customized by 2024 through
digital channels and physical
stores
Italians who rely on smart city
solutions to improve liveability in
their cities
80%+
penetration of new registrations
of private electric vehicles in Italy
by 2030
33%
reduction of transport costs
through autonomous TPL for the
consumer
-50%
annual growth age group 64+
years in Italy between 2019-2030
(vs.
-0.1% at country level)
1,5
%
60+ Races in Italy in the coming years Increased competition in the TPL market with
potential entry of international players into the
Italian TPL
Establishment of funds at European level (e.g. EU
next generation fund) and at national level to support
the TPL sector limited to initiatives with a strong
sustainability footprint (e.g., financing or only for
electric and non-hybrid buses)
750
-90%
EUR billion guaranteed by the
Recovery Fund at European level
(~EUR 210 billion to Italy)
reduction of greenhouse gas
emissions from means of
transport by 2050 in Italy

19
5 different concepts are key to sustainable, urban new mobility and zero-
emission areas
People transport Goods transport
Autonomous ground vehicles
(on street transport)
Droids (pavement)
Robo taxisAutonomous mobility3
E-Mobility and
charging
infrastructure
1 Fleet incentives & TCO
Yard charging
Consumer incentives & TCO
Home charging
Public charging network
New business models (e.g., battery
swaps)
Seamless mobility2 Urban consolidation centers,
cargo bikes etc.
Cargo/freight sharing
Micro-mobility
Car sharing, e-hailing
Multi-modal mobility/hubs
Integrated people/goods transport
(e.g., goods tram)
Smart, dynamic traffic
mgmt. & connected
infrastructure
4 Smart and shared mobility
Dynamic road pricing
Smart parking / dynamic curb mgmt
Intelligent traffic systems (ITS)
Urban space re-design
Data management &
platform
Data standards and sharing5
Detailed next
SELECTED EXAMPLES ONLY

20
I: The growing demand for technology from citizens and public
administrations will lead to a progressive 'smartification' of cities
Implications for ...
Identify and evaluate
options for the
development of smart
solutions for urban
mobility by leveraging
the "infrastructure -
user" connection
through the use of data
and technology (e.g.
creation of platforms for
the centralization of
services to citizens; smart
parking solutions; traffic
control systems)
Examples of services offered relating to city mobility
Smart parking Smart parking platform with parking
booking and verification software
Smart mobility System and platform for the
management of ZTL and light signs
(e.g. green waves) for traffic regulation
Smart
surveillance
Smart video surveillance systems with
dedicated platform and video-analysis
software
Climate change
resilience
Monitoring and prevention systems for
public infrastructure and risk areas (e.g.
bridges, viaducts, roads)
60%Penetration of
smart home devices
in Italy
80%+Italians rely on
smart city solutions
to increase the
liveability of
their cities
Source: McKinsey

21
Opportunities to enhance transportation, equity and economic outcomes
across the city
2
1
ChallengeChallenge
5
3
4
Opportunities
Increase supply of mobility solutions in connection
with managing congestion and demand through
pricing
Reaffirm commitment to transit solutions and
robust mix of mobility options
Adopt comprehensive Vision Zero goals to enhance
safety outcomes
Adopt new regulations, uses, and pricing scheme
Close equity gaps through new mobility options
(e.g., microtransit) and target traditional fixed-route
high-frequency routes targeting transit “deserts”
Details
Increase integration and agility of existing networks for long-term sustainability
and financial viabilityA
Adopt mobility solutions based on dynamic pricingC
Invest in streetscape to support walking, cycling-, and micro-mobilityD
Develop employer-back transit solutionsE
View long-term transit health as integrated with land use solutions that increase
density, affordability, and access to transitB
Fastrack Vision Zero initiatives (e.g., District-wide reduction of speed limits,
streetscape redesigns)K
Dynamically price on-street parking to reduce congestion and raise revenuesF
Facilitate technological solutions to improve delivery managementG
Provide subsidies for low-income residents for transit usageH
Leverage microtransit or ride-sharing partnerships for new routesI
Review and redesign traditional fixed-route high-frequency routes targeting
underserved communitesJ
Best practices
PRELIMINARY, PROPRIETARY, PRE-DECISIONAL NON-EXHAUSTIVE

22
We see multiple examples how cities are compensating this shift to keep
balance between public and private transport
Mobility development depending on the measures, and their impact
Types of influence
on the choice of transport Examples of measures in the cities (news date)
Measures to be
assessed in
the model
Zonal speed limits for
private cars
Promotion of active
movement
Reduction of public
transport fares outside of
peak hours
Safer travel by public
transport (disinfection, PPE
checks, etc.)
Downtown parking rate
change
Comfort
Travel time
Safety (COVID-19)
Cost of travel
Bicycles
Private cars/
public
transport
Public
transport
Public
transport
October 2020
Private cars
Additional priority lanes for
public transport and taxi
May 2020
August 2020
October 2020
November 2020
April 2020
July 2020
May 2020
May 2020
September 2020
May 2020
November 2020
Madrid: In 2020, they launched 138 (+21%) new bus lanes (797 in total)
London: The parking rate is raised by 30% (from GBP 5.2 to GBP 6.72 for 30 min) in Croydon business area
New York: They launched 32 km (+17%) of new bus lanes to serve 750,000 passengers per day
Paris: Since 2021, they plan to switch to full limitation of speed to 30 km/h in most streets, in 2020 this has
already been done in central districts
Madrid: 30 km/h limit is introduced in more than 80% of city streets
Milan: 35 kilometers of motor roads will be converted to bicycle roads
New York: They launched a mobile app for tracking bus crowding in real time
London: The mayor has launched the Streetspace Program to increase bicycle travel 10-fold and pedestrian
travel 5-fold
Singapore: On weekdays until 7:45 the Mass Rapid Transit (MRT) and Light Rail Transit (LRT) fare is reduced
by 28% (from SGD 1.76 to SGD 1.26)
Dresden: To promote the use of public transport, they for the first time in 14 years raised the parking rate
twofold (from EUR 1.5 to EUR 3 per hour) in the central area and fourfold (by EUR 0.5 to EUR 2 per hour) in
the rest of the city, the day rate (fixed price for 24 hours of parking, which used to be EUR 6) is cancelled in
the central area
Paris: 1. Pilot project: In the buses of one line, they installed touchless request buttons for door opening and
stops
2. During a lockdown, travel by public transport in peak hours is allowed only to those who have a
certificate issued by their employer
Moscow: Moscow Metro introduced fare discounts up to 50% on 2 lines for passengers who entered metro
stations from opening to 7:15 and 8:45 to 9:15

Arizona & P3 Efforts for Mobility
Innovation
Dominic Papa
Vice President of Smart State
Initiatives, Arizona Commerce
Authority


Diagram Source: Deloitte Insights, “Forces of change: The future of mobility”
The global CAV market is estimated to reach USD 60B by 2030…or USD 557B by 2026Business Wire/Allied Market Research
JUST HOW MUCH MONEY…

VIBRANT CAV ECOSYSTEM

Provide the technical guidance and coordination required to ensure the prudent implementation of safe, efficient automated
mobility across Arizona.
Industry Government Research

Technical Focus
Current Safety Projects:
• OSA Metrics Definition and Measurement
• Naturalistic Driving Analysis
• State-wide Camera Network Data Analysis
Deploy automation to significantly increase roadway safety
Safety
Projects in the pipeline:
• Smart Road Side Unit (RSU): Collaboration between Intel, ADOT, UArizona, Cohda, McDOT and ADOT to develop a 5G-based RSU. Project lays the foundation for the future of smart intersections, utilizes AI based vision analytics, C-V2X communications and edge computing to enhance safety and positions IAM as a center of excellence and innovation hub for new startups.
• Operational Safety Assessment (OSA) Testbed: Collaboration between Exponent, Luminar, ASU, McDOT and ADOT to develop a controlled testing site for high conflict scenarios e.g. near misses and crashes. The project builds on the real world data collection work underway at the Anthem testbed and furthers the objectives outlined in the IAM executive order to develop a network of testing capabilities.
• Vehicle and Driver Data-Gathering Infrastructure: Collaboration between UArizona, ADOT and McDOT to deploy a unique data collection system of driver and vehicle interaction data from fleets of L1 automation and Advanced Driver Assistance System (ADAS) equipped vehicles. The project leverages data analysis, machine learning and artificial intelligence to produce a novel Arizona centric dataset for new breakthroughs in mobility and transportation and guide new infrastructure investments.
• AV Perception Redundancy Assessment and Validation: Collaboration between Intel and UArizona to validate AV perception systems by developing a methodology to explore impact of dual perception systems redundancy. The project offers the potential to design a groundbreaking means to independently “vision test” AVs and address a critical missing element of AV safety assessment not yet addressed by industry.
• Automated Traffic Incident Reconstruction, Indexing, and Reporting: Collaboration with State Farm, ASU, Exponent, and McDOT to use safety assessment data to reconstruct traffic incidents for more accurate and efficient reporting. The project represents cutting edge research in computer science and traffic engineering and holds promise for new commercialization and market investment opportunities.

Inefficient Process• Time from project design to project implementation was TOO LONG!• Continuously explaining and informing about IAM.• Separate agreements for each and every city.

The Mobility Innovation Zone
The "Mobility Innovation Zone" is a multi-regional commercialization test-bed effort providing a framework to empower industry leaders to collaborate with government and utility partners across the state, to rapidly and seamlessly deploy emerging mobility technologies across jurisdictions.
The purpose of the zone is to be the new, 21st century, future mobility proving grounds for industry, and to position our regions and state as a leader in both the development and adoption of mobility technologies.
In particular the MIZ has a key priority around electrified mobility.

The Mobility Innovation Zone:
• Public-Private-Academic Consortium to accelerate innovation in Mobility
• Establishes a “Results Management Office” RMO to help move pilots and projects forward on behalf of the cities.
• Expedites permitting and review process to speed up the time from “pitch to pilot”
• Creates data sharing agreement whereby all parties get access to nonproprietary data
• Accelerate progress on regional and state mobility challenges

Create the Win-Win-Win for Scale
Access to data and tech to improve services and
safety. FREE R&D
Expedited process to deploy tech and gather data for
research
Access to infrastructure and
expedited process to test and validate
new technology and business models
Industry
Government
Research
MIZ

Mobility Pilots in the Mobility Innovation ZoneThe goal of mobility pilots within the Mobility Innovation Zone framework are to accelerate progress on regional and state mobility challenges, as well as showcasing Arizona as an international leader in the future of mobility.
It is also designed to empower interested industry partners to explore and demonstrate viable business models, ROI and a clear vision to investors. These E-Mobility pilots are able to access existing and new modern infrastructure for testing and validating the new use cases, to explore enhanced personal e-mobility options for fleet operators.

From one region

To a Mega-Region
• +30 Cities
• 2 Universities
• 2 Community College Districts
• 3 Levels of Government (city, county, state)

Mobility Innovation Zone
Value Proposition
“”
The Arizona Mobility Innovation Zone (AZ MIZ) is a collaborative, institutional platform convening talent and innovation across Arizona’s diverse communities to support the multi-modal demands of the rapidly growing Sun Corridor region. Building upon Arizona’s legacy as a transportation innovation leader, the innovation zone strives to create equity in mobility access, foster innovation among public-private partnerships, and pave pathways for implementing sustainable mobility technologies that
positively impact the lives of all citizens.
Equitable Access
Champion mobility programs that provide all citizens access to effective and efficient transportation throughout the Phoenix/Tucson region. This includes giving both urban and rural communities the opportunity to bring mobility ideas and solutions to the table.
Economic Impact
Provide an ecosystem that advances innovation through economic, physical, and networking assets. This establishes a collaborative community to share ideas, enable business investment and scale both existing industry solutions and home-grown startups
Sustainability
Promote mobility initiatives that focus on environment sustainability and improve quality of life for all Arizonans. Prioritizing sustainability in all mobility projects will ensure that Arizona’s infrastructure system is positioned to support a growing population and remain resilient in the face of future challenges
Safety
Increase safety across all modes of transportation through utilizing proven intelligent infrastructure systems (ITS). Leveraging this mobility technology to implement solutions that better connect all throughout the rapidly growing region and create more efficient and safe travel options.

Arizona Welcomes You!
We have a collaboration first mind-set and we encourage other government, industry, and academic partners to come and work with us to solve our collective challenges together!


Good Luck!! GOOD LUCK!

Hub in the MRA
Moving together
Chris de Veer
Strategic Advisor Smart Mobility
Province of North Holland,
Metropolitan Area Amsterdam

•
•
•
•

2006 2016


90% in 2050

•
•


•
•
•
•
•
•
•


Experiment in Alkmaar
• Gain experience in the field of hubs, including for policy making
• Gain data insights for decision making
• Gain insight into changing user group behavior
• Getting an oversight on partners for the realization of hubs
• Developing a scalable & sustainable hub
• Gain insight into the role of the government (province and municipality)

DIFFERENT PARTNERS, DIFFERENT ROLES
STRATEGIC
PARTNERS
OPERATIONAL
PARTNERS
Strategic partners
• Regional scope
• Strategy
• Scalability
• Budget
• Communication
Operational partners
• Business model
• Flexibility
• Local entrepeneurs
• Contact end users
NS
Province Municipality
Alkmaar
Connex
xionSmartmile
DeBuren
JUUVE
Hely
GreenWheels
Mobipunten

KEY INSIGHTS (SO FAR…)
• Parking restrictions are (considered) essential for the success of shared mobility solutions
• It is difficult to get relevant mobility data (with the exception of cars)
• It is important to take future area developments into account in the solution
• Many stakeholders, which has a delaying effect
• Positive business case is a (huge!) challenge
• Participation with residents and (local) entrepreneurs: early involvement to get an idea of needs

Challenges
• Combining partners and building trust
• A fair platform (Findable, Accessible, Interoperable, and Reusable)
• Targeting users
• Scalability
• Business models
• Naivety

McKinsey & Company 55
Q&A@Team - Shall we
keep it?

Freight and industrial transport
Topic 2

Last Mile in the Next Normal
Anja Huber
Associate Partner, McKinsey &
Company

58
-15
0
5
-10
-5
10
15
20
25
30
20 21 22 2023
Trough Covid, markets for B2B/B2C parcel and mail
have shifted dramatically
1 UPS Q1 2020 Earnings Call, Apr 28, 2020, 2. https://blog.aboutamazon.com/company-news/amazon-hiring-for-additional-75-000-jobs
3 Announcement already in 2019, proactive announcement in 2020: No change due to COVID-19
100,000EV orders from Rivian by Amazon –
Electrification at the tipping point3
100,000employees hired by Amazon in
March, with 75,000 more planned
in April2
15%increase in total average
daily stops1
Forecasted global volumes growth rate, in percent
23-26%
-10-15%
-12-6%
B2B parcel
B2C parcel
Immediate
impact
+40-50%
-25%
-20-30%
~10-20% of the
immediate online penetration
increase will remain sticky;
reflected in the volume basis
and
not the growth rate
2019 indexed 2020 2021 2022 2023

59
2030 scenario without effective interventions
2019 2030
5.3
7.2
+36%
Delivery vehicles
Million vehicles
Emissions
Million-tons CO2
Congestion
Average commute1, minutes
19
25
2019 2030
+6 Mt
2019 2030
64
Last-mile
induced53
+21%
NOTE: Top 100 cities globally only 1 Average commute for representative city

60
There are many potential interventions
Customer movement
Multi-brand parcel
shop
Parcel locker
Office delivery
Delivery environment
Night delivery
Express lanes
Delivery parking zones
Real-time traffic lights
Dynamic re-routing
Double parking
enforcement
Vehicle change
Fuel cell EV
Drones & truck
Autonomous
vehicle
Battery-electric EV
Combustion
engine
Last leg change
Retro-fitting of
infrastructure
Droid (on pavement)
Autonomous
ground vehicle
locker (street)
Goods tram
Micro-hub
Consolidation
Consolidation
center (UCC)
Load pooling
Secure delivery
Secure delivery
systems
Parcel box
Trunk delivery

61
-4
3
-18
-6
-20
-5 -6 -10 -7
25
-25
-2
-29-18
-5
-29
-15
00 00 00 0
-60
-28-40
-1
0
-1 -2 -2 -2 -5 -2 -1 -1 -6 -6 -5
2
-1 -1 0 -4
0 0
0
-2
2 5
-4 -1 -1
1
-6-12
-1
-17
-3-8
-1 -1
18
-20
-4
13
-5 -6
6
-28
Co
mb
ust
ion
en
gin
e
Fu
el ce
ll E
V
Au
ton
om
ou
s
veh
icle
Batt
ery
-ele
ctri
c
EV
Dro
nes
& t
ruck
Tru
nk d
elivery
Parc
el b
ox
Secu
re d
elivery
syst
em
s
Off
ice d
elivery
Parc
el lo
cker
Mu
lti-
bra
nd
parc
el sh
op
Co
nso
lid
ati
on
cen
ter
(UC
C)
Lo
ad
po
olin
g
Mic
ro-h
ub
Retr
o-f
itti
ng
of
infr
ast
ruct
ure
Au
ton
om
ou
s g
rou
nd
veh
icle
lo
cker
(str
eet)
Go
od
s tr
am
Dro
id
(pavem
en
t)
Do
ub
le p
ark
ing
en
forc
em
en
t
Exp
ress
lan
es
Real-
tim
e t
raff
ic
lig
hts
Delivery
park
ing
zon
es
Dyn
am
ic r
e-
rou
tin
g
Nig
ht
delivery
Delivery
costs
CO2
emissions
Congestion
Low Medium High
Competitive
dynamics
We built a 'last mile interventions grid'
Mandated
adoption
scenario

62
Transition scenarios
Sustainability scenario
Multiplayer ecosystem scenario
Economic scenario
1. Disruption referring to a) disruption of customer behavior/processes, and b) disruption of competitive dynamics and business models
Unit cost CongestionEmissions Disruption1
2030 potential impact across entire delivery fleet
vs. 2030 "business as usual" scenario
Night delivery Electric vehicles
Double-parking
areas &
enforcement-15% -25%-35% Minor
Night
delivery
Electric
vehicles
Parcel boxes
and lockersExpress lanes
Dynamic re-
routing & load-
pooling-30% -30%-10% Medium
Parcel boxes &
lockersExpress lanes
EVs
Night deliveries
and adjacent
time deliveries
Multi-brand
parcel lockers
and boxes-25% -30%-30% Medium
Dynamite re-
routing &
load-pooling
EVs
Night
deliveries &
adjacent time
deliveries
Multi-brand
parcel lockers
& boxes

63
We see 4 key
areas of
structural
change for the
Last Mile in the
Next Normal
Source: McKinsey & Company
1 2 3 4
Rigorous
sustainability
requirements to
obtain public
bailout funding and
governmental
support for Last
Mile ecosystem
players
Government
support
City
regulation
Consumer
behavior
Technology
acceleration
Increasing
urgency and
willingness to act
on part of
regulators (e.g.,
multiple cities
moving forward
on zero emission
zones and road
pricing)
New categories
moving online and
increasing
awareness on part
of customers who
elevate the need
for change,
especially
regarding
sustainable
deliveries
Changed timeline
and demand for Last
Mile specific
technologies, e.g.,
EVs, autonomous
goods transport,
unattended delivery
technologies and
curb management

64
Quelle: McKinsey Center for Future Mobility; Online-Recherche
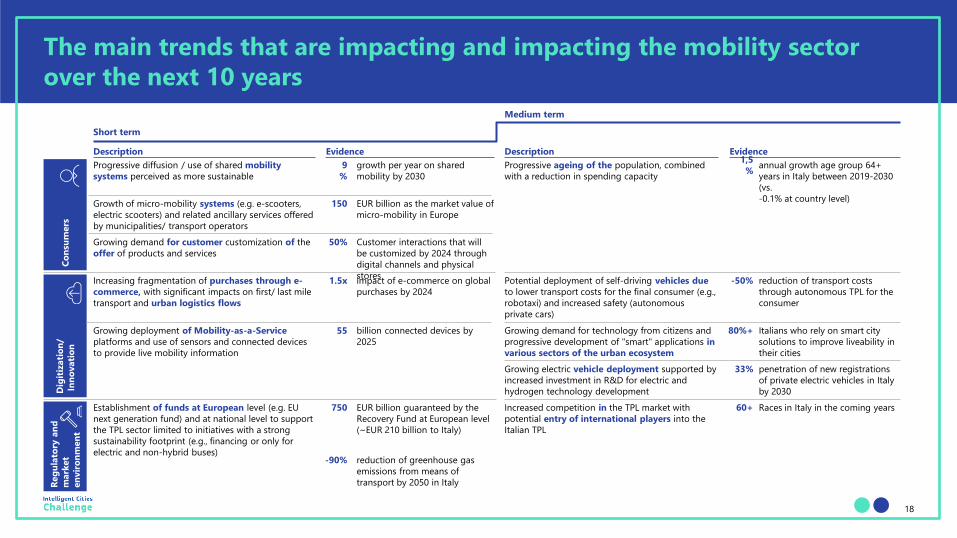
2. Cities are emerging as drivers of global surge in launch or
announcement of zero-emission-areas
SeattlePermanent closure of 30 km residential road network, all ride-hailing trips emission-free by 2030, one third of deliveries emission free
PortlandTemporary reduction of fees for e-scooters and bike sharing
MontrealPlanned addition of over 320 km new pedestrian and bicycle lanes
Paris"15min city"; Investment of over 300 Mio. EUR into both modernization and expansion of 650 km cycleways
AmsterdamAnd 13 other Dutch cities will move to purely electric delivery from 2025
BrusselsTransformation of 40 km traffic roads into bike lanes
BerlinRepurposing of 18 roads into slow streets during certain hours
MilanIncrease of bike-sharing fleet to 8.000 bikes and addition of 3.500 new e-scooters; free access for electric delivery vehicles into congestion charge area
Santa MonicaIntroduction of voluntary „zero-emission" delivery zones for commercial vehicles in 2021
StockholmImposing inner city tolls from 6:30h to 18:30h (up to ~6 EUR)
Cities
worldwide have
planned or
initiated ideas
to reduce
mobility
related
emissions
150+
Madrid4,5 km2 zone allowing only public transport and zero-emission vehicles
BarcelonaExpanding low emission zones with restricted access and speed limits
LondonBuying only zero-emission buses from 2025, expansion of ZEA to HDT
Austin40% of vehicle miles travelled electrified by 2030
Sacramento Considering introduction of zero-emission-area

65
3: Increasing
consciousness about
environmental impact
of parcel delivery
among customers
Consumer behavior
Want parcel
packaging to
be recyclable
Prefer carbon-
neutral delivery
Are conscious of
the
environmental
issue in e-
commerce
of consumers
choose
consolidation into
one package if that
service is offered
of millennials
choose
alternative to
home delivery
Of cross-border
shoppers are
willing wait longer
to reduce
environmental
impact
Source: International Post Corporation: Postal Sector Sustainability Report,
Metapack, Doddle
47% 28% 51%
47% 56% 28%

66
Summary of key
changes in the
Next Normal
COVID-19 structurally accelerates the evolvement of
the Last Mile ecosystem (unlike most other sectors)
Decarbonization happens faster
We see both a stronger push and pull from cities –
Need to act and stronger willingness to shape mobility
Changed end consumer behavior is here to stay
The Last Mile revolution will happen with technology
already available today – Not with drones

Freight transport planner
Tim Vervoort
Consultant Modal Shift, City of
Antwerp

• Traffic safety
• Traffic flow/travel time
• Efficiency
3 main challenges
1. The challenge
Motivation
• Ambition in city board’s agreement
• Explicit need from private sector tovalidate routes

• Heavy vehicles
• Frequent deliveries
→ Developing a freight route planner tool
Pilot with supermarkets
2. The solution
Main tool = ArcGIS
• Data layers, each given a certain ‘resistance’
• Road categories, school areas, sharp turns…
• Route choice = route with least resistance
• Avoiding school areas, staying on high-category roads for as long as possible

2. The solution
Freight route planner (final choice) Google (fastest route)Retailer route
Google route = physically not possible
2 proposed variants by freight planner:
• Red: avoids sharp turns, but crosses school areas
• Purple: avoids sharp turns and schools, but uses residential streets

• How to bring route advice into the driver’s cabin?
• Proposed safe routes are effective
• Dynamic routing advice is needed! Road works, accidents, congestion…
• Digitalisation of existing regulations is needed
• Safe routes → safe roads
• Role of the city: stimulate use of the route planner
3. Lessons learned

Sustainable Mobility Milan
Elisa Torricelli
Project Officer, City of Milan

Sustainable MobilityMilan
Direzione Città Resilienti | Comune di Milano

As climate changes,Milan does too
Mean Annual Temperature(1901-2017)
+2°C
Projected minimum and maximumIncrease in temperature in 2050
above 2°C summer
above 1°C winter
fonte: Profile Climatico Locale, Arpa Lombardia e Arpa Emilia Romagna, Comune di Milano
PM10 : 32 μg/m3
PM2,5 : 21 μg/m3
20 μg/m3
10 μg/m3
Media annua 2019 Linee Guida OMS
NO2 : 44 μg/m3
O3 : 59 superamenti annui
40 μg/m3
0 superamenti annui

2
3
1
Reduction of concentration of Nox, PMx and Ozone
ADAPTING to Climate Change
Cliamate ChangeMITIGATION
Improvement ofAIR QUALITY
FloodingExtreme Heat
Deca
Air and Climate PlanAn integrated plan to fight the effects of Climate Change
Decarbonization
CO2 StorageMilano Carbon Neutral by 2050
< 2°C contain the increase in urban temperature
45% CO2 emission reductionby 2030 compared with 2005

Air and Climate Plan structure
01. Healthy and Inclusive Milan: a healthier, safer and more equitable City.
02. Connected and highly accessible Milan: a well connected and flexible City, with smooth and sustainable mobility.
03. Positive Energy Milan: a City that consumes less and consumes energy better.
04. Cool Milan: a greener city, cooler and liveable, which adapts to climate change.
05. Aware Citizens: a City which adopts an aware and sustainable lifestyle.

2. Connected and highly accessible Milan
Vision 2050: transform personal mobility in active mobility giving priority to bicycles and pedestrians.
Goal 2030: highly reduce motorised private traffic1. Reinforce existing LEZs (Low Emission Zone) to reduce air
emissions 2. Plan actions and agreements for sustainable mobility (promote
sharing at urban scale, politics for public transport, etc)3. Set a Zero Emissions Zone
A well connected and flexible City with smooth and sustainable movements.

3. Positive Energy Milan
A City that consumes less and
consumes energy better
Vision 2050:Creation of a Carbon Neutral CityGoal 2030:1. Reduction of 50 % CO2 emissions by 2030 related to public
buildings 2. Carbon Neutral Urban Regeneration projects3. Identification of a strategy for a new thermal energy production
and to accelerate the deep energy renovation of private buildings4. Develop an efficient district heating grid5. Advance use of renewable sources through agreements for the
development of energy communities6. Definition of a strategy for the efficiency of electrical uses in the
tertiary sector

Full Electric Trasport
Goal:Achieve total electrification of the LPT fleetincluding the bus network, urban and suburban, in order to have a zero emission public transport by 2030.
In 2020 the number of diesel powered vehicles will be reduced to 60%, 40% will be hybrids and electric; in 2028 80% will be full electric vehicles and 20% hybrids; by the end of 2030 the bus fleet will be 100% electric.
Alongside the municipal commitment to electrifyall local public transport transport by 2030, goodsand emergency transport and will also be gradually converted to electric.
Air and Climate Plan Action

Zero Emission Zone
The historic center of Milan (“Area C”) willbecome an area with "zero emission" mobilityby 2030, both for private, public and goodstransport, creating better environmentalconditions for all users.
Green and Healthy Streets (GHS) Declaration, 2017, C40 network
Air and Climate Plan action
Area C
Area C is now a Limited Traffic Zone (ZTL) with access restrictions for certain types of vehicles.

Zero Emission Urban Goods Transportation programme
"Zero Emission Urban Goods Transportationtechnical assistance programme" (C40) to encourage zero emission urban logistics and goodsdelivery.
C40
GOALTest a model of urban distribution of goods, especially those of the last mile, using only electricvehicles or cargo-bikes with the identification of an Urban Distribution Center located in a strategicposition, alongside the "city HUBs" located in variousparts of the city for the delivery of goods to the end user.

Thank you!

McKinsey & Company 83
Q&A@Team - Shall we
keep it?

Closing remarks
Stephanie Haag
McKinsey & Company

Thank you!

Backup

87
We observe three groups of trends shaping urban mobility in the new
normal
Technological
trends
Demographic
trends
A
BC
Socio-economic
trends, incl.
impact of
COVID-19
Urban
mobility
Demographic trends
Increasing population of city agglomerations,
especially in boroughs of the city
A
Technological trends
Autonomization, Internet of Things, electrification,
shared mobility / MaaS
User acceptance for technological innovations
B
Socio-economic changes, including those
induced by Covid-19
Changing the consumption model, in particular on
the axis "owner" vs. "user"
Rapid digitization, increasing cleanliness and
hygiene requirements
C

88
Our solution: McKinsey supports cities in decision-making with urban
mobility simulation
1 2 3 4
88
Design of integrated urban
mobility strategy based on
scenario analysis
Prioritization of most effective
solutions for both Cities and
mobility players
Fact-based evaluation of
interventions based on
decision-oriented urban
mobility simulation
Framework and catalogue of
interventions to assess
interventions against
predefined performance metrics
4. Performance metrics:
Evaluate how the selected
interventions impact key
mobility performance
metrics
3. Future scenario:
Evaluate the impact of
the interventions, by
origin, for the
selected KPI
2. Selected
interventions: Turn
on/ off individual
interventions
1. Status quo: View of
the selected KPI in 2030
without any
interventions
Dashboard allows to evaluate effects of selected interventions on
mobility performance metrics in future scenario Key benefits

89
Smart parking garages will use technological
solutions to integrate the digital and physical world
Urban parking
Related Documents