1 Supply Chain Teacher Workshop – Final Report Leslie Gardner, Ph.D. EXECUTIVE SUMMARY The supply chain workshop for teachers was designed to enable high school and middle school mathematics teachers and business teachers to integrate supply chain, logistics and advanced manufacturing applications of topics from the Indiana Mathematics Standards into their teaching so that they can better engage students and make mathematics relevant by teaching mathematics and business in the context of supply chain management and logistics they can introduce students to high paying jobs of the future that are critical to Indiana‟s economic future which in turn provides motivation for students to take support career and technical education (CTE) courses, they can better support CTE by reinforcing applications of manufacturing, transportation, distribution, and logistics that students learn in their CTE courses, and they can dispel myths about manufacturing, transportation, distribution, and logistics being dirty, menial, low-paying, and boring and recruit students into careers in these fields of study. The workshop participants visited a variety of manufacturing, transportation, distribution and logistics companies representing various aspects of the supply chain. They participated in several hands on labs to give them a real understanding of issues involved in supply chains and to provide them with examples of hands on activities that can be used to teach math. They heard a variety of guest speakers from business, state government, and economic development organizations addressing issues that may not have been covered in the field trips and labs. Finally, they developed lesson plans to implement real world supply chain applications in their classrooms. OVERVIEW OF WORKSHOP SCHEDULE This workshop was structured to give an overview of manufacturing supply chains, starting with conversion of raw materials, and moving through fabrication of parts, assembly of final products, and distribution. The first four days focused mainly on manufacturing and internal logistics, the next four days focused on transportation between stages in the supply chain, packaging, distribution, and external logistics, and the final two days were spent on lesson planning and presentations. Field trips were scheduled to follow this structure. Speakers and labs were scheduled to supplement the field trips and provide information about supporting technologies, supporting management techniques and philosophies, the mathematics behind technologies and management, issues involved with global supply chains supply chains and international business, economic development, and workforce development. At least two of the speakers are entrepreneurs who were able to give the workshop participants an entrepreneur‟s perspective on business and the world in general. Exposing teachers to people with entrepreneurial attitudes is extremely important because to bring real improvement and change to education – including implementing examples from this workshop, teachers need to be “intrepreneurs,” that is, entrepreneurs within their school systems – willing to try new approaches that carry some risk in terms of spending time on something that may not yield immediate results and that may not be

Welcome message from author
This document is posted to help you gain knowledge. Please leave a comment to let me know what you think about it! Share it to your friends and learn new things together.
Transcript
1
Supply Chain Teacher Workshop – Final Report
Leslie Gardner, Ph.D.
EXECUTIVE SUMMARY
The supply chain workshop for teachers was designed to enable high school and middle school
mathematics teachers and business teachers to integrate supply chain, logistics and advanced
manufacturing applications of topics from the Indiana Mathematics Standards into their teaching
so that
they can better engage students and make mathematics relevant by teaching mathematics
and business in the context of supply chain management and logistics
they can introduce students to high paying jobs of the future that are critical to Indiana‟s
economic future which in turn provides motivation for students to take support career and
technical education (CTE) courses,
they can better support CTE by reinforcing applications of manufacturing, transportation,
distribution, and logistics that students learn in their CTE courses, and
they can dispel myths about manufacturing, transportation, distribution, and logistics
being dirty, menial, low-paying, and boring and recruit students into careers in these
fields of study.
The workshop participants visited a variety of manufacturing, transportation, distribution and
logistics companies representing various aspects of the supply chain. They participated in several
hands on labs to give them a real understanding of issues involved in supply chains and to
provide them with examples of hands on activities that can be used to teach math. They heard a
variety of guest speakers from business, state government, and economic development
organizations addressing issues that may not have been covered in the field trips and labs.
Finally, they developed lesson plans to implement real world supply chain applications in their
classrooms.
OVERVIEW OF WORKSHOP SCHEDULE
This workshop was structured to give an overview of manufacturing supply chains, starting with
conversion of raw materials, and moving through fabrication of parts, assembly of final products,
and distribution. The first four days focused mainly on manufacturing and internal logistics, the
next four days focused on transportation between stages in the supply chain, packaging,
distribution, and external logistics, and the final two days were spent on lesson planning and
presentations. Field trips were scheduled to follow this structure. Speakers and labs were
scheduled to supplement the field trips and provide information about supporting technologies,
supporting management techniques and philosophies, the mathematics behind technologies and
management, issues involved with global supply chains supply chains and international business,
economic development, and workforce development. At least two of the speakers are
entrepreneurs who were able to give the workshop participants an entrepreneur‟s perspective on
business and the world in general. Exposing teachers to people with entrepreneurial attitudes is
extremely important because to bring real improvement and change to education – including
implementing examples from this workshop, teachers need to be “intrepreneurs,” that is,
entrepreneurs within their school systems – willing to try new approaches that carry some risk in
terms of spending time on something that may not yield immediate results and that may not be

2
welcomed or understood by other people in the educational system. All speakers talked about
their career paths, educations, and the qualifications for potential employees at their companies.
Lunches were working lunches that allowed workshop participants to visit informally with guest
speakers. A chronology of field trips, speakers and labs for the workshop is given below.
Monday June 8
Introduction of participants and facilitators
Speaker – What is supply chain management and why is it important for Indiana?
(Leslie Gardner, Professor of Mathematics and Operations Management,
University of Indianapolis)
Lab – Introduction to just-in-time manufacturing and flow of materials.
o Poker chips and Dice demonstration (Steve Wallen, Director of Human
Resources, IMMI)
o Just-in-time sequencing (Chris Kelly, Instructor of Supply Chain Management,
University of Indianapolis)
o Mathematics of variability in sequential processes such as supply chains and stock
values (Leslie Gardner)
Lab – Process analysis and design
o PERT/CPM, line balancing, time studies and other design and analysis techniques
(Leslie Gardner)
o Manufacturing activity – Designing the process of making a no-bake lime pie
(Tim Brown, Teacher, Speedway High School)
Tuesday June 9
Speaker – Information systems to support supply chains and ERP (Jerry Flatto, Associate
Professor of Information Systems, University of Indianapolis)
Field trip – Conversion of scrap steel into sheet steel and Nucor Steel
o Overview of castrip process (Eric Gallo, Technical Services Manager)
o Scheduling the processes of a steel mill (Jim Devis, Special Projects Coordinator)
Wednesday June 10
Field Trip – Applications of geometry to fabrication of high precision metal parts at
Garrity Tool
o History of Garrity Tool, careers at Garrity Tool, and skills needed by prospective
employees (Don Garrity, President, Garrity Tool)
o Tour and technology (Dwight Griggs, Vice-President, Garrity Tool)
Speaker – ERP and manufacturing issues (John Pennington, President, PCI Associates)
Speaker – Conexus Indiana‟s initiatives to generate interest in careers in manufacturing,
transportation, distribution, and logistics (Claudia Cummings, Vice President, Workforce
and Community Programs at Conexus Indiana)
3
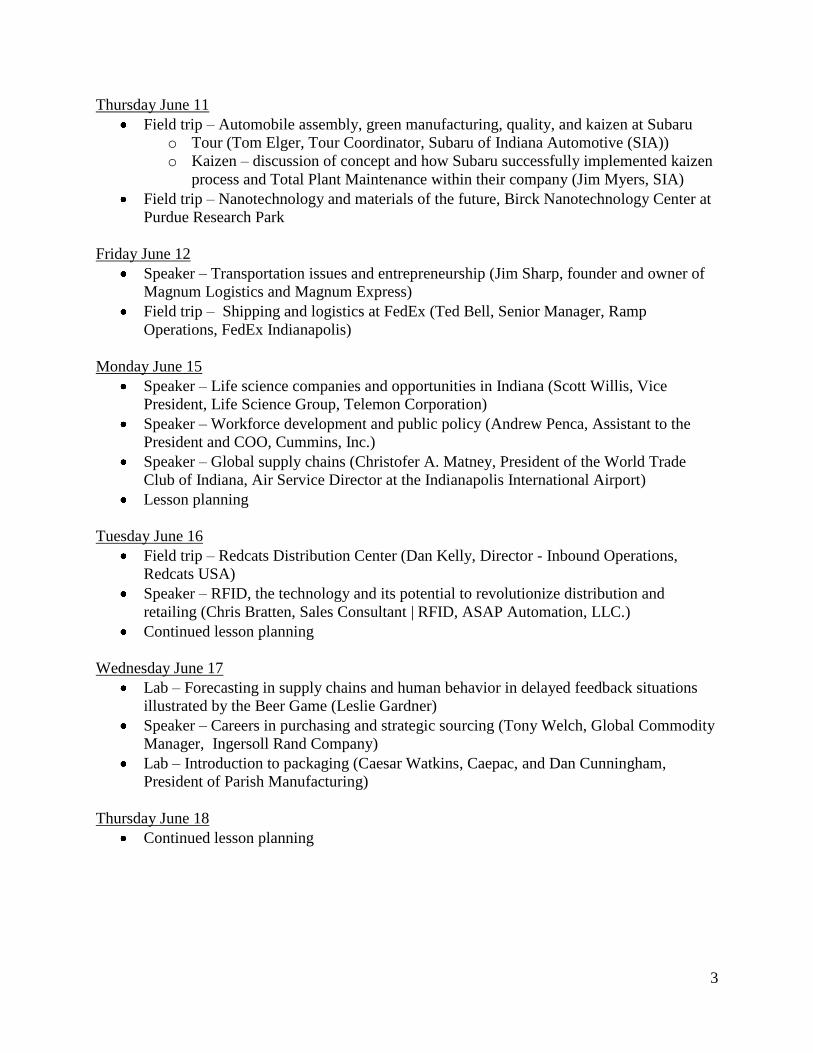
Thursday June 11
Field trip – Automobile assembly, green manufacturing, quality, and kaizen at Subaru
o Tour (Tom Elger, Tour Coordinator, Subaru of Indiana Automotive (SIA))
o Kaizen – discussion of concept and how Subaru successfully implemented kaizen
process and Total Plant Maintenance within their company (Jim Myers, SIA)
Field trip – Nanotechnology and materials of the future, Birck Nanotechnology Center at
Purdue Research Park
Friday June 12
Speaker – Transportation issues and entrepreneurship (Jim Sharp, founder and owner of
Magnum Logistics and Magnum Express)
Field trip – Shipping and logistics at FedEx (Ted Bell, Senior Manager, Ramp
Operations, FedEx Indianapolis)
Monday June 15
Speaker – Life science companies and opportunities in Indiana (Scott Willis, Vice
President, Life Science Group, Telemon Corporation)
Speaker – Workforce development and public policy (Andrew Penca, Assistant to the
President and COO, Cummins, Inc.)
Speaker – Global supply chains (Christofer A. Matney, President of the World Trade
Club of Indiana, Air Service Director at the Indianapolis International Airport)
Lesson planning
Tuesday June 16
Field trip – Redcats Distribution Center (Dan Kelly, Director - Inbound Operations,
Redcats USA)
Speaker – RFID, the technology and its potential to revolutionize distribution and
retailing (Chris Bratten, Sales Consultant | RFID, ASAP Automation, LLC.)
Continued lesson planning
Wednesday June 17
Lab – Forecasting in supply chains and human behavior in delayed feedback situations
illustrated by the Beer Game (Leslie Gardner)
Speaker – Careers in purchasing and strategic sourcing (Tony Welch, Global Commodity
Manager, Ingersoll Rand Company)
Lab – Introduction to packaging (Caesar Watkins, Caepac, and Dan Cunningham,
President of Parish Manufacturing)
Thursday June 18
Continued lesson planning
4
Friday June 19
Presentation of lesson plans
Speaker – The new Indiana Standards for Mathematics, (Mike Roach, Indiana
Department of Education)
Speaker – The I-STEM network and grant opportunities for mathematics teachers
(Brandon Sorge, I-STEM network)
Wrap up
This report provides details of the field trips, labs, and speakers and discusses the workshop
evaluation, how the budget was spent, and how to build on what has been started.
INTRODUCING TEACHERS TO SUPPLY CHAIN MANAGEMENT AND WHY IS IT
IMPORTANT FOR INDIANA
The lead speaker was Leslie Gardner, Professor of Mathematics and Operations Management at
the University of Indianapolis, whose purpose was to explain what supply chain management is
and why it is important for the economic development of the state of Indiana. Supply chain
management is a cutting edge business strategy that integrates internal and external logistics
across many manufacturers, suppliers, distributors, retailers, transportation providers, and third
party logistics firms to increase productivity and to obtain a competitive advantage for all parties
involved. The basic concept is coordinate material, information, and cash flows across the
enterprises in a supply network to shorten the time between when each company orders and pays
for the materials and component parts that go into its product and the time that it receives the
payment for its products from its customers. It is motivated by the globalization of business and
made possible by information technology. It has potential to create many high paying jobs.
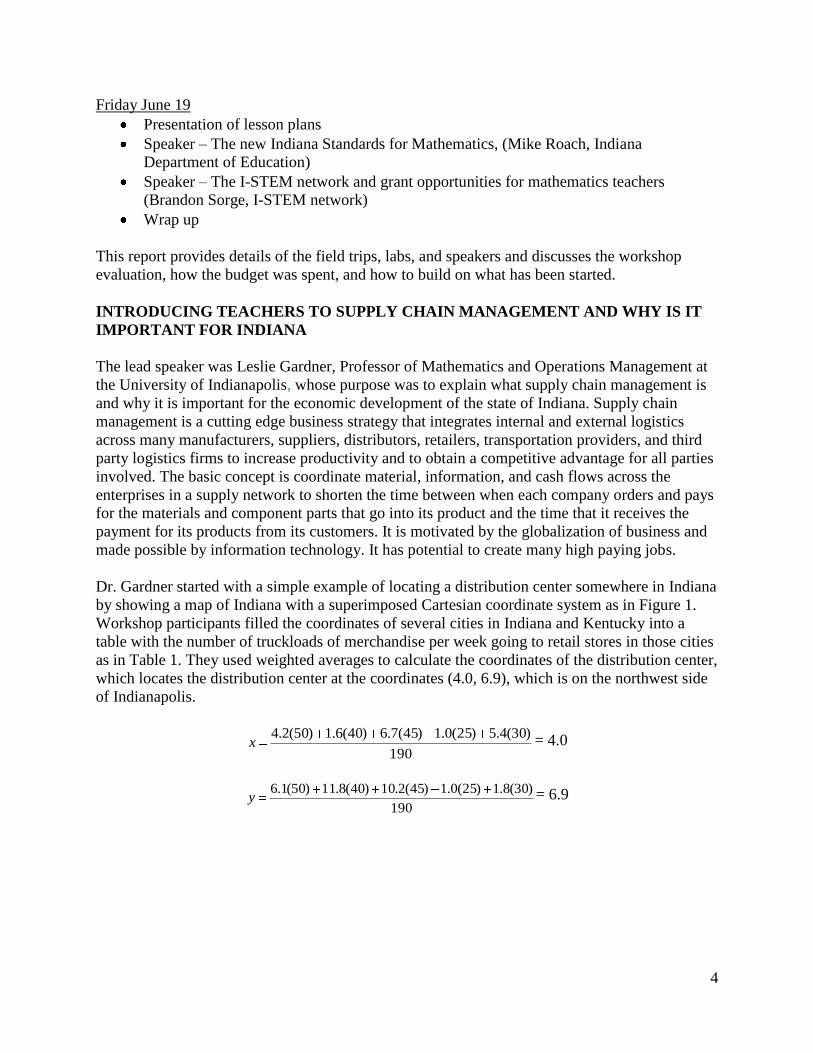
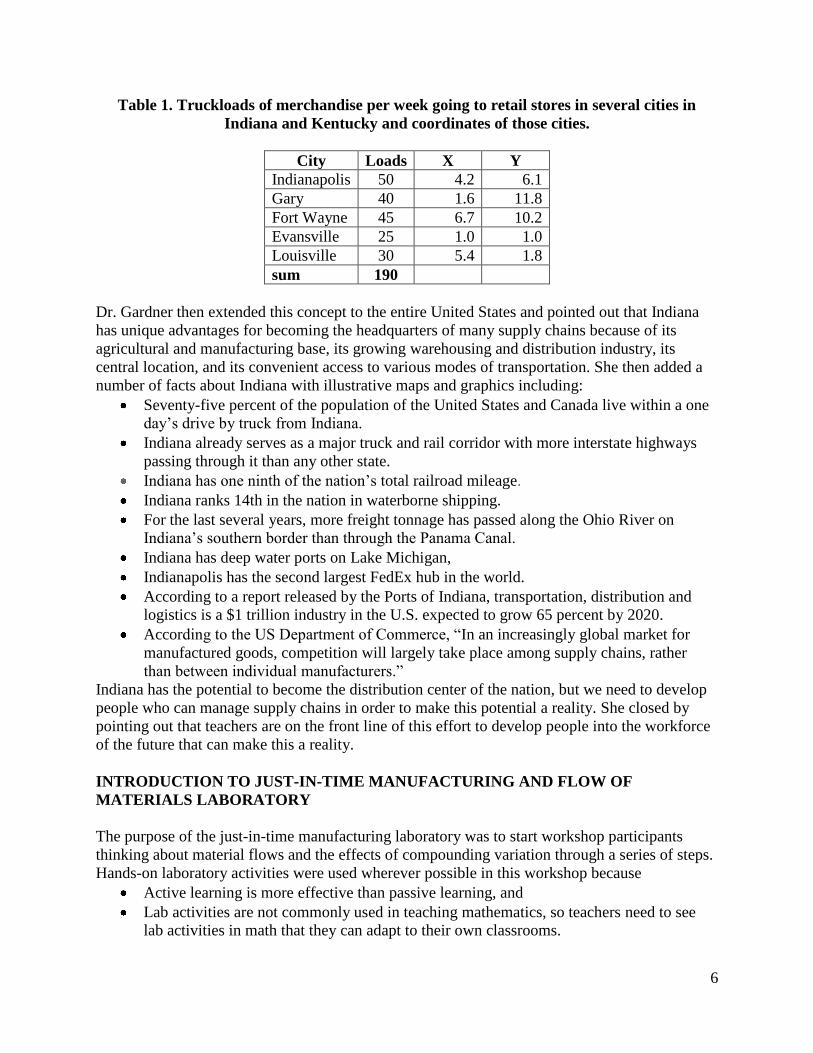
Dr. Gardner started with a simple example of locating a distribution center somewhere in Indiana
by showing a map of Indiana with a superimposed Cartesian coordinate system as in Figure 1.
Workshop participants filled the coordinates of several cities in Indiana and Kentucky into a
table with the number of truckloads of merchandise per week going to retail stores in those cities
as in Table 1. They used weighted averages to calculate the coordinates of the distribution center,
which locates the distribution center at the coordinates (4.0, 6.9), which is on the northwest side
of Indianapolis.
190
)30(4.5)25(0.1)45(7.6)40(6.1)50(2.4x = 4.0
190
)30(8.1)25(0.1)45(2.10)40(8.11)50(1.6y = 6.9

5
Figure 1: Cartesian coordinate system superimposed on map of Indiana.
1 0
1
2
2
3
3
4 5 6 7 8 - 1
7
6
5
4
12
11
10
9
8
6
Table 1. Truckloads of merchandise per week going to retail stores in several cities in
Indiana and Kentucky and coordinates of those cities.
City Loads X Y
Indianapolis 50 4.2 6.1
Gary 40 1.6 11.8
Fort Wayne 45 6.7 10.2
Evansville 25 1.0 1.0
Louisville 30 5.4 1.8
sum 190
Dr. Gardner then extended this concept to the entire United States and pointed out that Indiana
has unique advantages for becoming the headquarters of many supply chains because of its
agricultural and manufacturing base, its growing warehousing and distribution industry, its
central location, and its convenient access to various modes of transportation. She then added a
number of facts about Indiana with illustrative maps and graphics including:
Seventy-five percent of the population of the United States and Canada live within a one
day‟s drive by truck from Indiana.
Indiana already serves as a major truck and rail corridor with more interstate highways
passing through it than any other state.
Indiana has one ninth of the nation‟s total railroad mileage.
Indiana ranks 14th in the nation in waterborne shipping.
For the last several years, more freight tonnage has passed along the Ohio River on
Indiana‟s southern border than through the Panama Canal.
Indiana has deep water ports on Lake Michigan,
Indianapolis has the second largest FedEx hub in the world.
According to a report released by the Ports of Indiana, transportation, distribution and
logistics is a $1 trillion industry in the U.S. expected to grow 65 percent by 2020.
According to the US Department of Commerce, “In an increasingly global market for
manufactured goods, competition will largely take place among supply chains, rather
than between individual manufacturers.”
Indiana has the potential to become the distribution center of the nation, but we need to develop
people who can manage supply chains in order to make this potential a reality. She closed by
pointing out that teachers are on the front line of this effort to develop people into the workforce
of the future that can make this a reality.
INTRODUCTION TO JUST-IN-TIME MANUFACTURING AND FLOW OF
MATERIALS LABORATORY
The purpose of the just-in-time manufacturing laboratory was to start workshop participants
thinking about material flows and the effects of compounding variation through a series of steps.
Hands-on laboratory activities were used wherever possible in this workshop because
Active learning is more effective than passive learning, and
Lab activities are not commonly used in teaching mathematics, so teachers need to see
lab activities in math that they can adapt to their own classrooms.
7
This lab was done in three parts. First, Steve Wallen, Director of Human Resources at IMMI and
formerly general manager of their child safety seat division, did a poker chips and dice
demonstration and introduced workshop participants to just-in-time manufacturing. Supply chain
management is the extension of just-in-time to suppliers and customers up and down supply
chains. Second, Chris Kelly, Instructor of Supply Chain Management at the University of
Indianapolis, introduced setup reduction and the use of the least common denominator in just-in-
time sequencing. Third, Leslie Gardner extended the concepts of variability in sequential
processes as demonstrated in the poker chips and dice demonstration to stock values and finance.
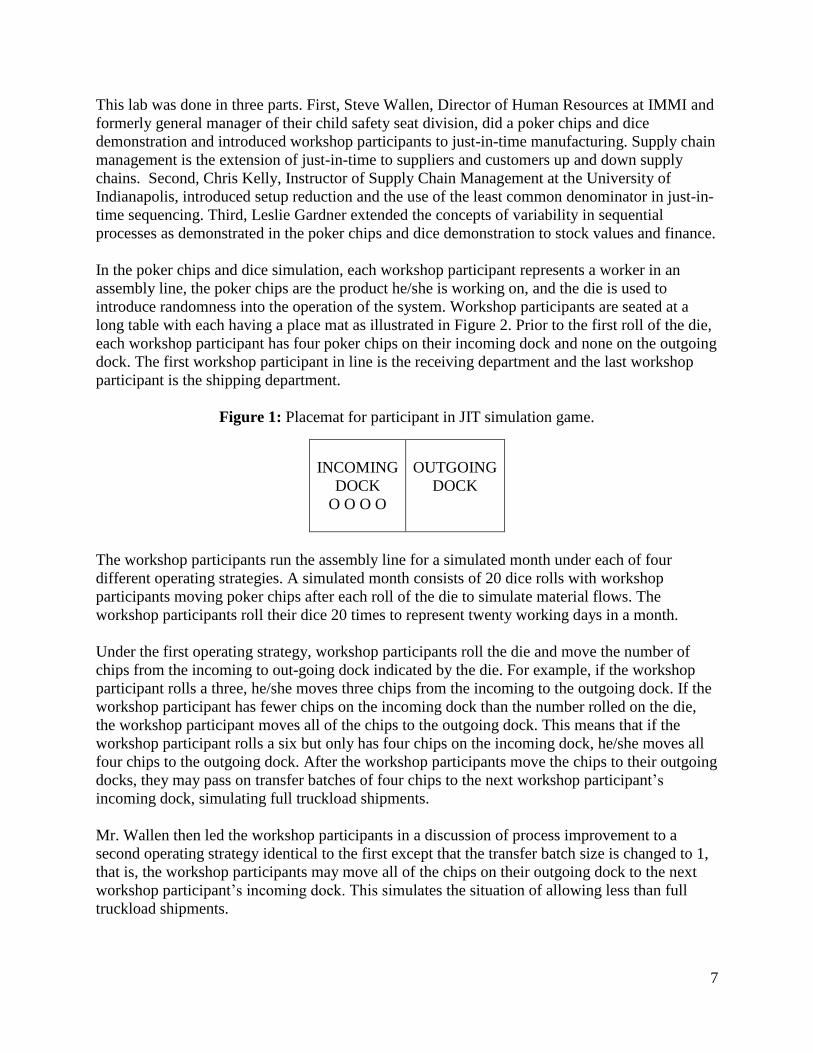
In the poker chips and dice simulation, each workshop participant represents a worker in an
assembly line, the poker chips are the product he/she is working on, and the die is used to
introduce randomness into the operation of the system. Workshop participants are seated at a
long table with each having a place mat as illustrated in Figure 2. Prior to the first roll of the die,
each workshop participant has four poker chips on their incoming dock and none on the outgoing
dock. The first workshop participant in line is the receiving department and the last workshop
participant is the shipping department.
Figure 1: Placemat for participant in JIT simulation game.
INCOMING
DOCK
O O O O
OUTGOING
DOCK
The workshop participants run the assembly line for a simulated month under each of four
different operating strategies. A simulated month consists of 20 dice rolls with workshop
participants moving poker chips after each roll of the die to simulate material flows. The
workshop participants roll their dice 20 times to represent twenty working days in a month.
Under the first operating strategy, workshop participants roll the die and move the number of
chips from the incoming to out-going dock indicated by the die. For example, if the workshop
participant rolls a three, he/she moves three chips from the incoming to the outgoing dock. If the
workshop participant has fewer chips on the incoming dock than the number rolled on the die,
the workshop participant moves all of the chips to the outgoing dock. This means that if the
workshop participant rolls a six but only has four chips on the incoming dock, he/she moves all
four chips to the outgoing dock. After the workshop participants move the chips to their outgoing
docks, they may pass on transfer batches of four chips to the next workshop participant‟s
incoming dock, simulating full truckload shipments.
Mr. Wallen then led the workshop participants in a discussion of process improvement to a
second operating strategy identical to the first except that the transfer batch size is changed to 1,
that is, the workshop participants may move all of the chips on their outgoing dock to the next
workshop participant‟s incoming dock. This simulates the situation of allowing less than full
truckload shipments.
8
Mr. Wallen again led the workshop participants in a process improvement discussion to a third
operating strategy involving variation reduction. If a workshop participant rolls a one, two, or
three on the die, he/she moves three chips from the incoming to the outgoing dock. If a workshop
participant rolls a four, five, or six on the die, he/she moves four chips from the incoming to the
outgoing dock. The transfer batch remains the same.
Under the fourth and final operating strategy, the only player who rolls the dice is the last player
who represents the shipping department. The remaining workshop participants operate under a
pull system. A pull system means that each player keeps the chips on their outgoing dock and
rather than passing the contents of the outgoing dock to the next player, the next player takes it
when his or her outgoing chips are taken. Each player replaces their outgoing chips by taking the
previous player‟s outgoing chips and processing them. This is the basic procedure pioneered by
Toyota to maintain precise timing of material movements. Mr. Wallen then gave workshop
participants a brief overview of the history of just-in-time manufacturing and even showed them
a kanban used to signal when it is time to produce in a pull system.
Under each operating strategy, each workshop participant processes 3.5 chips on average
because that is the average of the numbers that appear on a die. The theoretical output of the
system is a total of 70 chips, that is, 3.5 per simulated day over a period of 20 days. These are
easy calculations for middle school workshop participants and this provides an opportunity for
them to use mathematics to understand the system.
The simulation provides insight into the more sophisticated concepts of probability and the
effects of variation over time – in particular, how hard it is to catch up once the manufacturing
system falls behind. Under the first strategy, workshop participants rarely achieve an output of
more than 50 and it is often much lower. Under the second strategy, they usually produce slightly
more than under the first strategy, but almost never more than the upper 50s. Under the third
strategy, the workshop participants usually come very close to achieving the goal of 70 and they
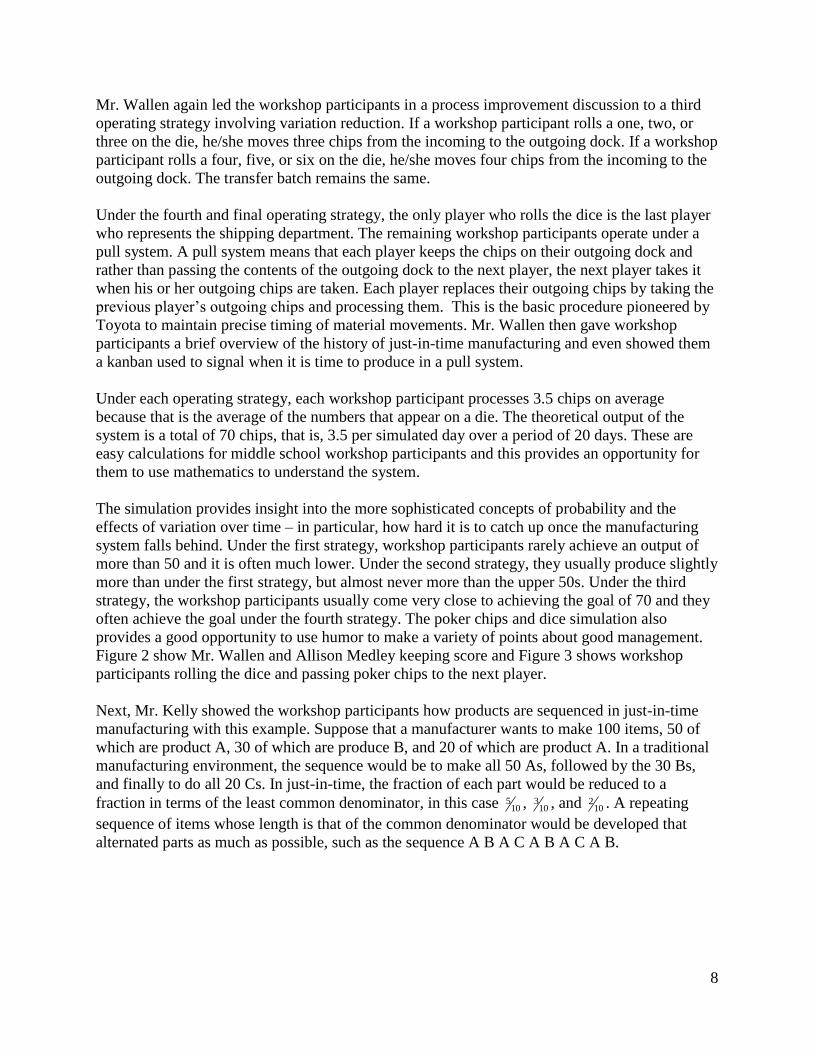
often achieve the goal under the fourth strategy. The poker chips and dice simulation also
provides a good opportunity to use humor to make a variety of points about good management.
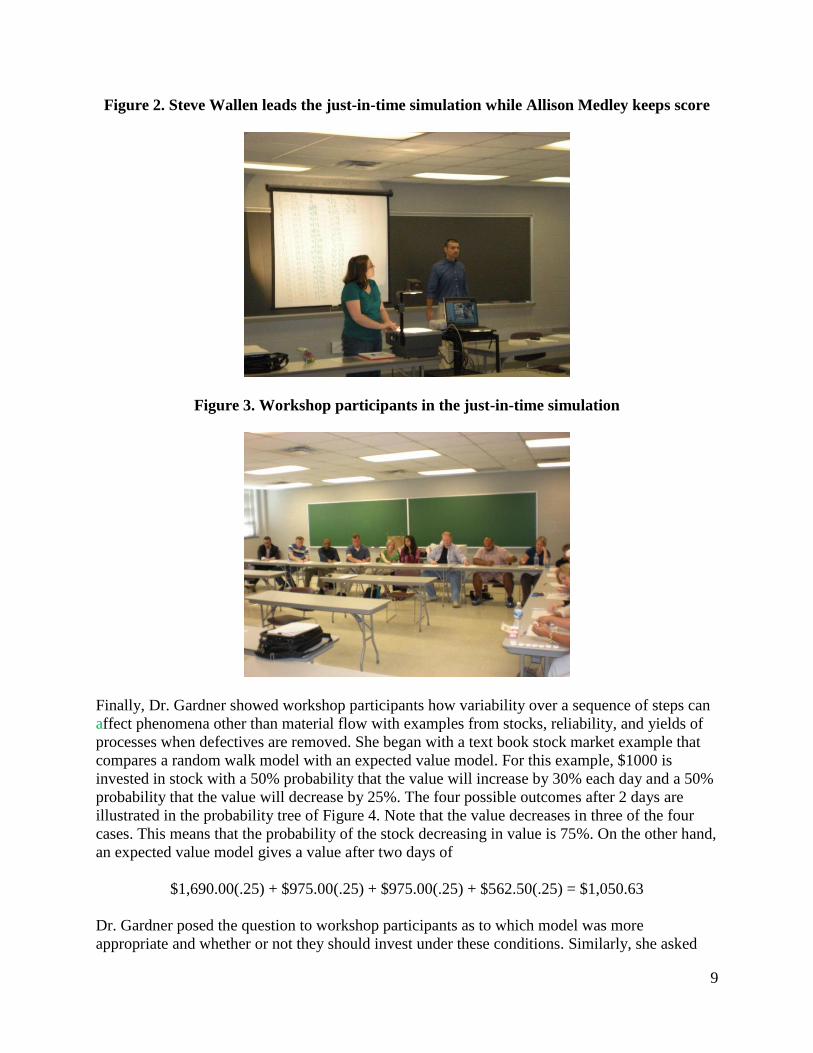
Figure 2 show Mr. Wallen and Allison Medley keeping score and Figure 3 shows workshop
participants rolling the dice and passing poker chips to the next player.
Next, Mr. Kelly showed the workshop participants how products are sequenced in just-in-time
manufacturing with this example. Suppose that a manufacturer wants to make 100 items, 50 of
which are product A, 30 of which are produce B, and 20 of which are product A. In a traditional
manufacturing environment, the sequence would be to make all 50 As, followed by the 30 Bs,
and finally to do all 20 Cs. In just-in-time, the fraction of each part would be reduced to a
fraction in terms of the least common denominator, in this case 105 , 10
3 , and 102 . A repeating
sequence of items whose length is that of the common denominator would be developed that
alternated parts as much as possible, such as the sequence A B A C A B A C A B.
9
Figure 2. Steve Wallen leads the just-in-time simulation while Allison Medley keeps score
Figure 3. Workshop participants in the just-in-time simulation
Finally, Dr. Gardner showed workshop participants how variability over a sequence of steps can
affect phenomena other than material flow with examples from stocks, reliability, and yields of
processes when defectives are removed. She began with a text book stock market example that
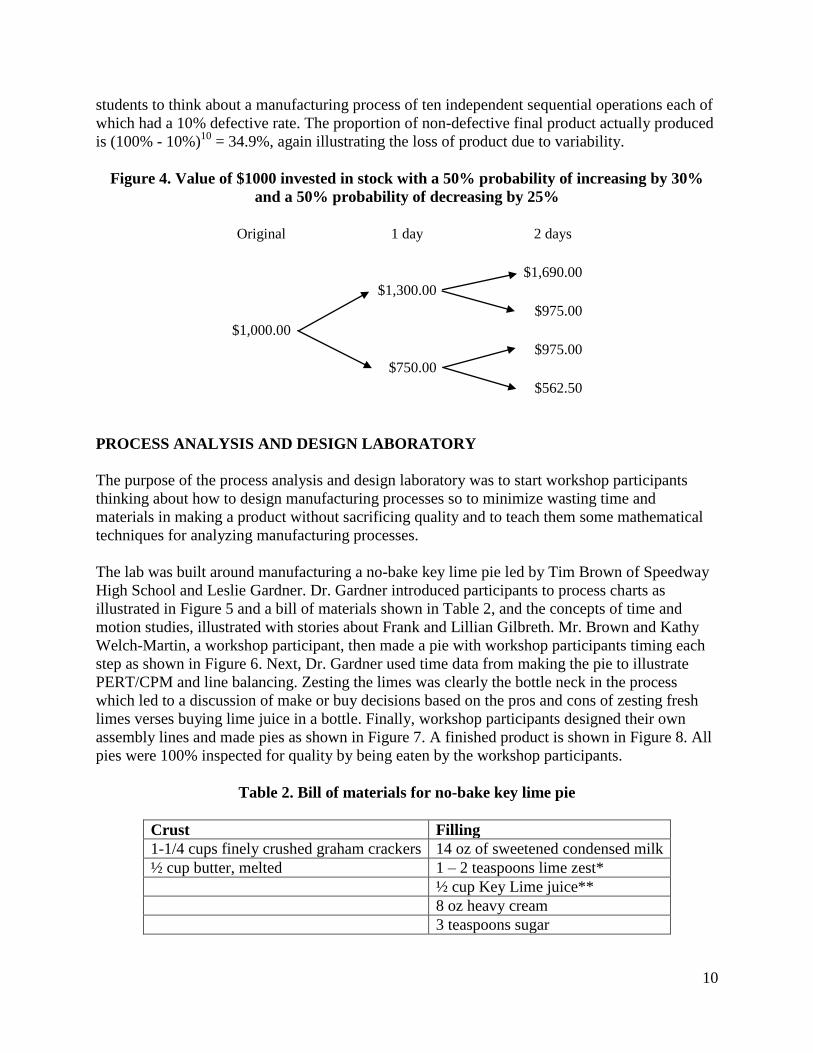
compares a random walk model with an expected value model. For this example, $1000 is
invested in stock with a 50% probability that the value will increase by 30% each day and a 50%
probability that the value will decrease by 25%. The four possible outcomes after 2 days are
illustrated in the probability tree of Figure 4. Note that the value decreases in three of the four
cases. This means that the probability of the stock decreasing in value is 75%. On the other hand,
an expected value model gives a value after two days of
$1,690.00(.25) + $975.00(.25) + $975.00(.25) + $562.50(.25) = $1,050.63
Dr. Gardner posed the question to workshop participants as to which model was more
appropriate and whether or not they should invest under these conditions. Similarly, she asked
10
students to think about a manufacturing process of ten independent sequential operations each of
which had a 10% defective rate. The proportion of non-defective final product actually produced
is (100% - 10%)10
= 34.9%, again illustrating the loss of product due to variability.
Figure 4. Value of $1000 invested in stock with a 50% probability of increasing by 30%
and a 50% probability of decreasing by 25%
Original 1 day 2 days
$1,690.00
$1,300.00
$975.00
$1,000.00
$975.00
$750.00
$562.50
PROCESS ANALYSIS AND DESIGN LABORATORY
The purpose of the process analysis and design laboratory was to start workshop participants
thinking about how to design manufacturing processes so to minimize wasting time and
materials in making a product without sacrificing quality and to teach them some mathematical
techniques for analyzing manufacturing processes.
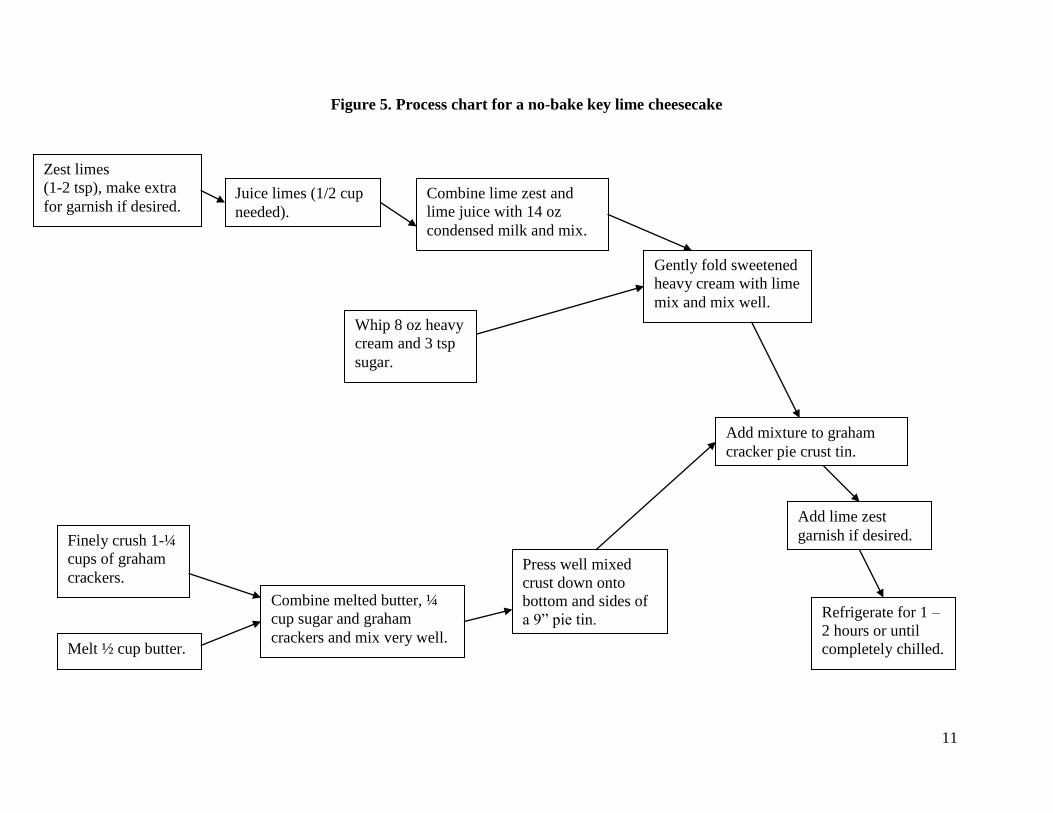
The lab was built around manufacturing a no-bake key lime pie led by Tim Brown of Speedway
High School and Leslie Gardner. Dr. Gardner introduced participants to process charts as
illustrated in Figure 5 and a bill of materials shown in Table 2, and the concepts of time and
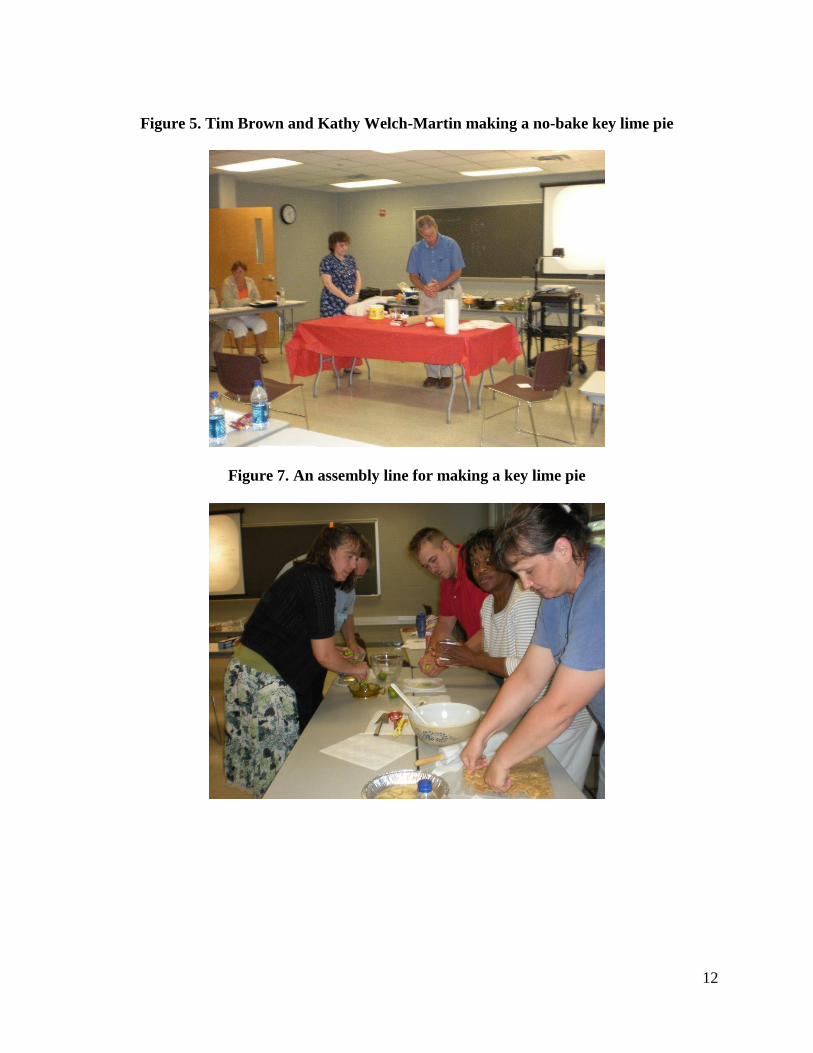
motion studies, illustrated with stories about Frank and Lillian Gilbreth. Mr. Brown and Kathy
Welch-Martin, a workshop participant, then made a pie with workshop participants timing each
step as shown in Figure 6. Next, Dr. Gardner used time data from making the pie to illustrate
PERT/CPM and line balancing. Zesting the limes was clearly the bottle neck in the process
which led to a discussion of make or buy decisions based on the pros and cons of zesting fresh
limes verses buying lime juice in a bottle. Finally, workshop participants designed their own
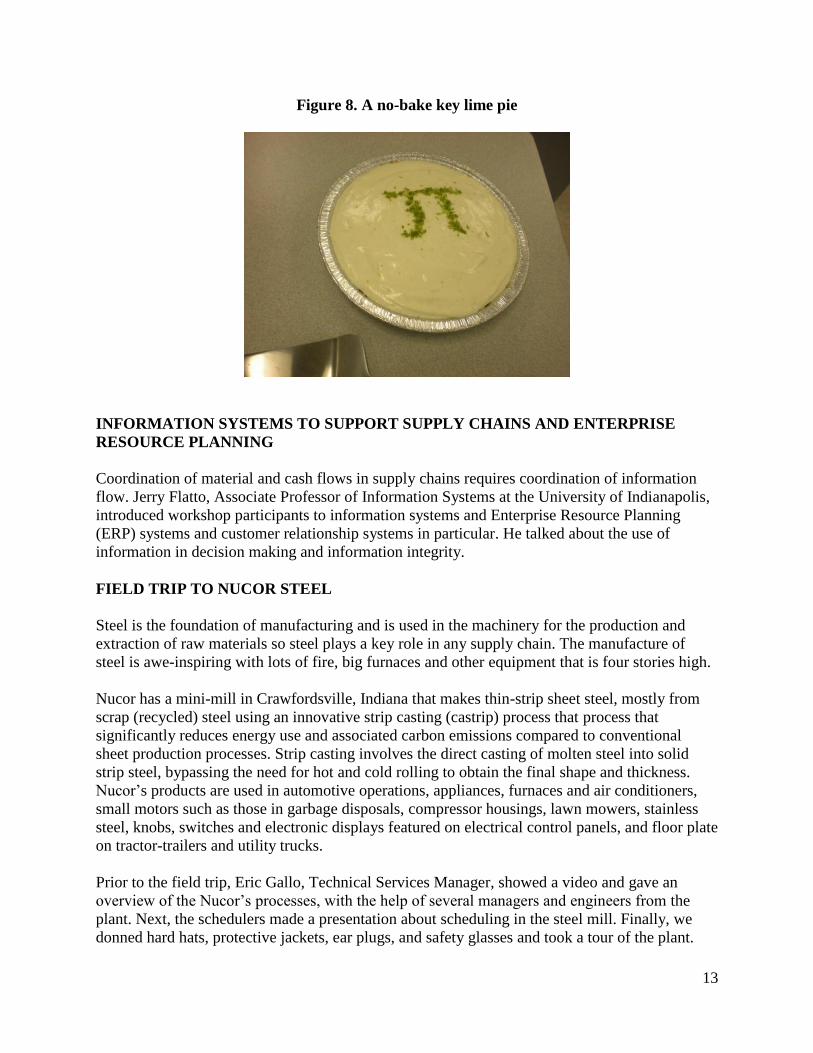
assembly lines and made pies as shown in Figure 7. A finished product is shown in Figure 8. All
pies were 100% inspected for quality by being eaten by the workshop participants.
Table 2. Bill of materials for no-bake key lime pie
Crust Filling
1-1/4 cups finely crushed graham crackers 14 oz of sweetened condensed milk
½ cup butter, melted 1 – 2 teaspoons lime zest*
½ cup Key Lime juice**
8 oz heavy cream
3 teaspoons sugar
11
Figure 5. Process chart for a no-bake key lime cheesecake
Whip 8 oz heavy
cream and 3 tsp
sugar.
Zest limes
(1-2 tsp), make extra
for garnish if desired. Juice limes (1/2 cup
needed).
Combine lime zest and
lime juice with 14 oz
condensed milk and mix.
Gently fold sweetened
heavy cream with lime
mix and mix well.
Finely crush 1-¼
cups of graham
crackers.
Melt ½ cup butter.
Combine melted butter, ¼
cup sugar and graham
crackers and mix very well.
Press well mixed
crust down onto
bottom and sides of
a 9” pie tin.
Add mixture to graham
cracker pie crust tin.
Add lime zest
garnish if desired.
Refrigerate for 1 –
2 hours or until
completely chilled.
12
Figure 5. Tim Brown and Kathy Welch-Martin making a no-bake key lime pie
Figure 7. An assembly line for making a key lime pie
13
Figure 8. A no-bake key lime pie
INFORMATION SYSTEMS TO SUPPORT SUPPLY CHAINS AND ENTERPRISE
RESOURCE PLANNING
Coordination of material and cash flows in supply chains requires coordination of information
flow. Jerry Flatto, Associate Professor of Information Systems at the University of Indianapolis,
introduced workshop participants to information systems and Enterprise Resource Planning
(ERP) systems and customer relationship systems in particular. He talked about the use of
information in decision making and information integrity.
FIELD TRIP TO NUCOR STEEL
Steel is the foundation of manufacturing and is used in the machinery for the production and
extraction of raw materials so steel plays a key role in any supply chain. The manufacture of
steel is awe-inspiring with lots of fire, big furnaces and other equipment that is four stories high.
Nucor has a mini-mill in Crawfordsville, Indiana that makes thin-strip sheet steel, mostly from
scrap (recycled) steel using an innovative strip casting (castrip) process that process that
significantly reduces energy use and associated carbon emissions compared to conventional
sheet production processes. Strip casting involves the direct casting of molten steel into solid
strip steel, bypassing the need for hot and cold rolling to obtain the final shape and thickness.
Nucor‟s products are used in automotive operations, appliances, furnaces and air conditioners,
small motors such as those in garbage disposals, compressor housings, lawn mowers, stainless
steel, knobs, switches and electronic displays featured on electrical control panels, and floor plate
on tractor-trailers and utility trucks.
Prior to the field trip, Eric Gallo, Technical Services Manager, showed a video and gave an
overview of the Nucor‟s processes, with the help of several managers and engineers from the
plant. Next, the schedulers made a presentation about scheduling in the steel mill. Finally, we
donned hard hats, protective jackets, ear plugs, and safety glasses and took a tour of the plant.
14
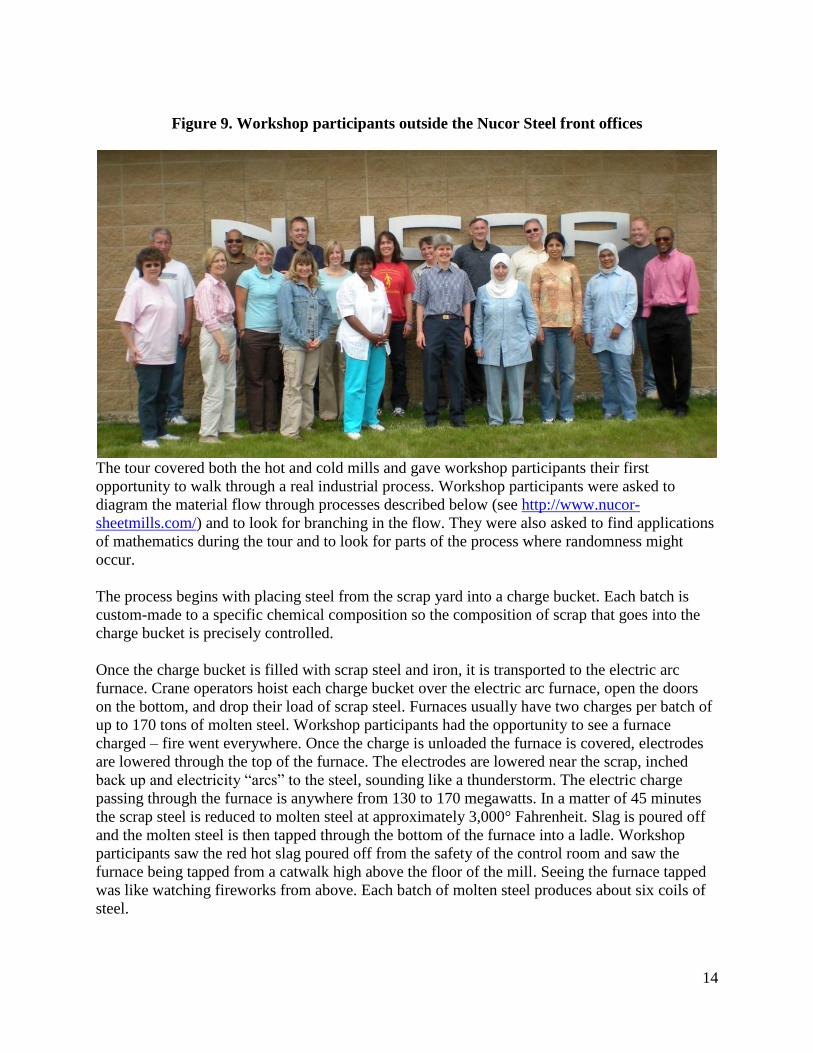
Figure 9. Workshop participants outside the Nucor Steel front offices
The tour covered both the hot and cold mills and gave workshop participants their first
opportunity to walk through a real industrial process. Workshop participants were asked to
diagram the material flow through processes described below (see http://www.nucor-
sheetmills.com/) and to look for branching in the flow. They were also asked to find applications
of mathematics during the tour and to look for parts of the process where randomness might
occur.
The process begins with placing steel from the scrap yard into a charge bucket. Each batch is
custom-made to a specific chemical composition so the composition of scrap that goes into the
charge bucket is precisely controlled.
Once the charge bucket is filled with scrap steel and iron, it is transported to the electric arc
furnace. Crane operators hoist each charge bucket over the electric arc furnace, open the doors
on the bottom, and drop their load of scrap steel. Furnaces usually have two charges per batch of
up to 170 tons of molten steel. Workshop participants had the opportunity to see a furnace
charged – fire went everywhere. Once the charge is unloaded the furnace is covered, electrodes
are lowered through the top of the furnace. The electrodes are lowered near the scrap, inched
back up and electricity “arcs” to the steel, sounding like a thunderstorm. The electric charge
passing through the furnace is anywhere from 130 to 170 megawatts. In a matter of 45 minutes
the scrap steel is reduced to molten steel at approximately 3,000° Fahrenheit. Slag is poured off
and the molten steel is then tapped through the bottom of the furnace into a ladle. Workshop
participants saw the red hot slag poured off from the safety of the control room and saw the
furnace being tapped from a catwalk high above the floor of the mill. Seeing the furnace tapped
was like watching fireworks from above. Each batch of molten steel produces about six coils of
steel.
15
Before each heat goes to the continuous caster, it is processed at the ladle metallurgy furnace
(LMF). At the LMF, the exact chemistry and temperature are achieved by adding and trimming
alloying elements to precise levels. At this step, Nucor can deoxidize, desulfurize, and modify
other non-metallic substances in the steel, while monitoring the overall chemistry, cleanliness
and temperature needed for casting. Alloys are added in either bulk or wire form. The
temperature is adjusted with a set of electrodes similar to those at the electric furnace. An
electromagnetic stirring process and argon gas are used to mix the alloy additions and help
remove undesirable substances. Workshop participants spent time in the control room of the
LMF having a metallurgist explain steel chemistry to them.
When each heat leaves the LMF, it has the proper chemistry and temperature for casting. Steel
pours from the ladle into the tundish, which serves as a reservoir to allow multiple heats to be
sequentially cast. The tundish maintains a constant ferro static pressure, which insures consistent
flow into the mold. Finally, the liquid flow in the tundish is used to help remove impurities from
the steel. The steel flows from the tundish into the mold through the submerged entry nozzle or
the SEN. The SEN delivers the steel beneath a layer of mold powder. The mold powder protects
it from re-oxidation in the air and regulates heat transfer to the mold walls. The mold powder
also lubricates the slab mold interface to ensure good surface quality. At Nucor the cast slab is
between two and three inches thick, as compared to slabs between eight and twelve inches for
the process at most steel makers. This allows for greater energy efficiency and cost effectiveness
in the hot rolling process. As the slab leaves the mold, it enters a water spray chamber. After the
slab is sheared to length at the end of the caster, it goes into a tunnel furnace. Workshop
participants were able to watch this entire process. Figure 9 shows a diagram of the process from http://www.analysnorden.org/pub/miljo/miljo/uk/US2006410.pdf.
In the tunnel furnace the slab temperature is equalized to approximately 1,900° Fahrenheit. It
takes approximately 15 minutes for each slab to make its way through a tunnel furnace. Each
slab is transported from the tunnel furnace to the rolling mill by a “shuttle furnace.” After the
shuttle furnace each slab goes through a de-scaling process where high-pressure water jets
remove the scale from the top and bottom of the slab at approximately 3,200 psi. From the de-
scaler the coil heads into the hot-strip mill where the steel is rolled to customer gauge or pre-cold
rolled thickness. Here, each slab travels through up to six rolling stands, which reduce the
thickness of the slab from roughly two inches to gauges from 0.055” to 0.94”. Through these
processes, workshop participants were able to see how the speed of the rollers increased as the
thickness of the steel decreased to keep the mass of steel flowing past a point per unit time
constant. This provided workshop participants with an interesting mathematical application of
rates.

16
Figure 10. Castrip plant(http://www.analysnorden.org/pub/miljo/miljo/uk/US2006410.pdf)
When the steel has been reduced to the proper gauge, it passes over a “run out” table where it is
sprayed with water from the top and bottom in order to reach the desired coiling temperature.
The steel chemistry and processing temperature determine the mechanical properties. Coils
leaving the hot mill are called hot bands. Workshop participants found out just how hot these
coils were as we stood next to them. The largest amount of hot-band steel is used in the pipe and
tubing industry.
Once the hot-band coil leaves the hot mill it may go through a series of value-added processing
steps. The first step is pickling, which involves unwinding the steel and running it through a
series of hydrochloric acid tanks and rinse tanks. The pickling process removes iron oxide from
the hot mill and leaves a clean surface on the steel. Once the steel is free of scale it is coated with
rust preventative oil and coiled. Pickled steel can be sold directly into the market or sent to the
cold mill for further processing. Applications for pickled and oiled steel include automotive
frames, electrical cabinets, stampings, and painted unexposed structural parts.
Pickled steel can also be cold-rolled at the single-stand reversing mill. During this added-value
stage the steel is cold reduced 50-80% using up to 1,800 tons of roll force. Typically, the steel
will go through three to five passes before it is reduced to a specific gauge. The product at this
stage is termed „full-hard‟ and can be sold in this state. Cold-rolled full-hard sheet steel is
primarily used in roll formed applications such as building panels and roof decking. Full-hard
product may also be sent to a galvanizing line for coating.
Full-hard steel can also go through a process called “annealing,” in which coils are placed in a
hydrogen atmosphere furnace for up to three days. The coils are laid on their sides, stacked three
to five high, and heated to approximately 1,300° Fahrenheit, which softens the steel, and greatly
improves its formability. This is an excellent example of batch sizing for workshop participants.
17
We talked about the importance of having a batch size of one during the just-in-time simulation
but in this case, the furnaces require four coils of steel to heat properly.
After the steel is annealed, tempering is necessary in order to meet the customer‟s specifications.
Steel that has gone through the annealing process is tempered – meaning it‟s rolled one last time
through a single-stand mill with a one to three percent elongation. Tempering is necessary for
crown reduction to provide the proper surface finish, and improve the mechanical properties to
meet the customer‟s specifications. Cold-rolled steel is used in applications such as appliances;
tubing; motor lamination; building panels; stampings and shelving.
Cold-rolled full-hard steel can also be sent through a galvanizing line where the steel is cleaned,
annealed, coated with zinc, and finally tempered. Some of our galvanizing lines are also
equipped with leveling for shape corrections, additional coatings or an annealing section to make
galvanneal. All of these steps occur in one uninterrupted process with the steel traveling through
each station in a single pass until it‟s finally recoiled. Galvanized steel is used in such
applications as heating and air conditioning units, appliances, tractor-trailers, decking,
agricultural applications, and other outdoor applications requiring superior corrosion and rust
resistance.
FIELD TRIP TO GARRITY TOOL
Garrity Tool Company is a supplier of high quality machining services and high precision parts
for a variety of industries including automotive, aerospace/defense, medical devices, and
material handling. It is owned and was founded by Don Garrity, an entrepreneur machinist who
is president of the company, in the garage of his home and has grown to over $3,500,000 in sales
annually.
Mr. Garrity himself met the workshop participants and made a presentation about the history of
Garrity Tool, career paths at Garrity Tool, and skills needed by prospective employees (Figure
11). He pointed out that they had hired a number of machinists from Vincennes University‟s
associate degree program in machine tool technology, but that they really needed high school
graduates with machining skills, with a work ethic, with a commitment to quality, and who could
think analytically and geometrically. Mr. Garrity also talked about corporate security because
Garrity tool is a contractor for the U.S. Department of Defense. He noted that the security was
even tighter for their medical device work because of the risk of patent infringement.
Next, Dwight Griggs, the Vice President, gave an overview of the technology in the shop and
took the workshop participants on a tour. First, he took us into the CAD/CAM labs. The
workshop participants were fascinated by this by the direct application of geometry and
trigonometry which many of them teach. We then proceeded through various departments of
numerically controlled machines including horizontal machining, vertical machining, lathes and
inspection (Figure 12). Again, the workshop participants were very engaged and kept
brainstorming as we went about how they could simulate the 3-dimensional geometry problems
by having students cut out shapes from bars of soap and other relatively soft but solid substances.
Dwight discussed the precision of the instruments and the precision of measurements used in
18
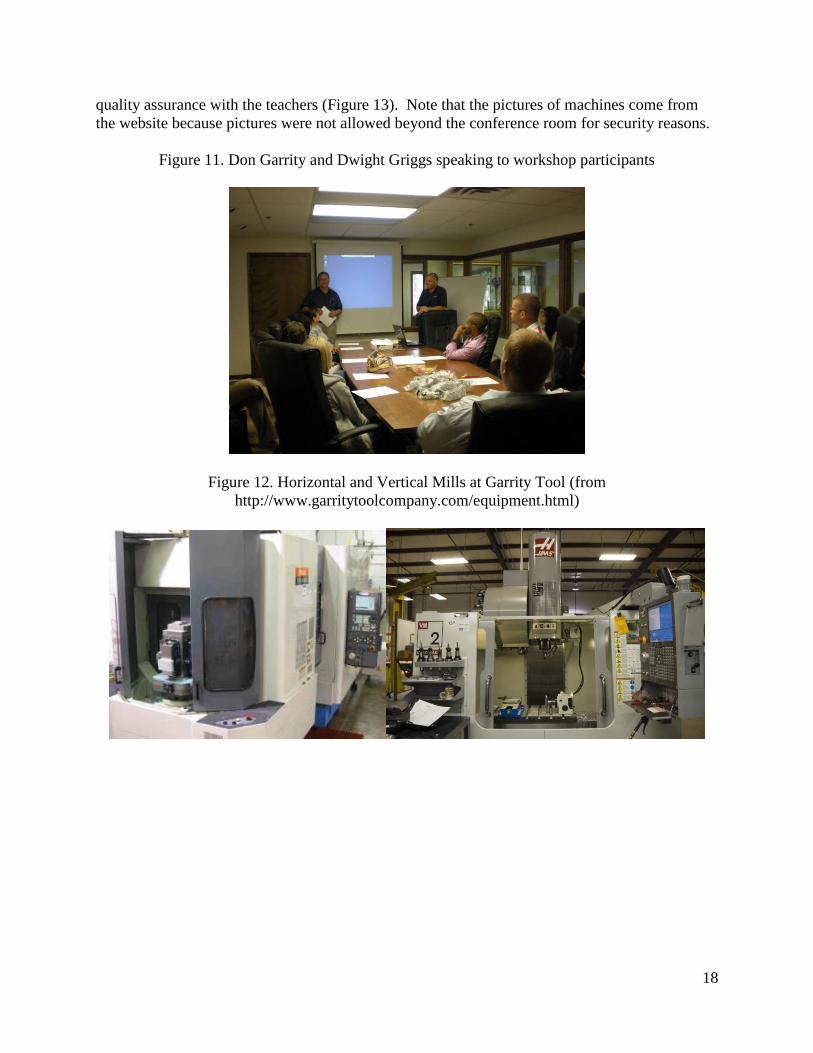
quality assurance with the teachers (Figure 13). Note that the pictures of machines come from
the website because pictures were not allowed beyond the conference room for security reasons.
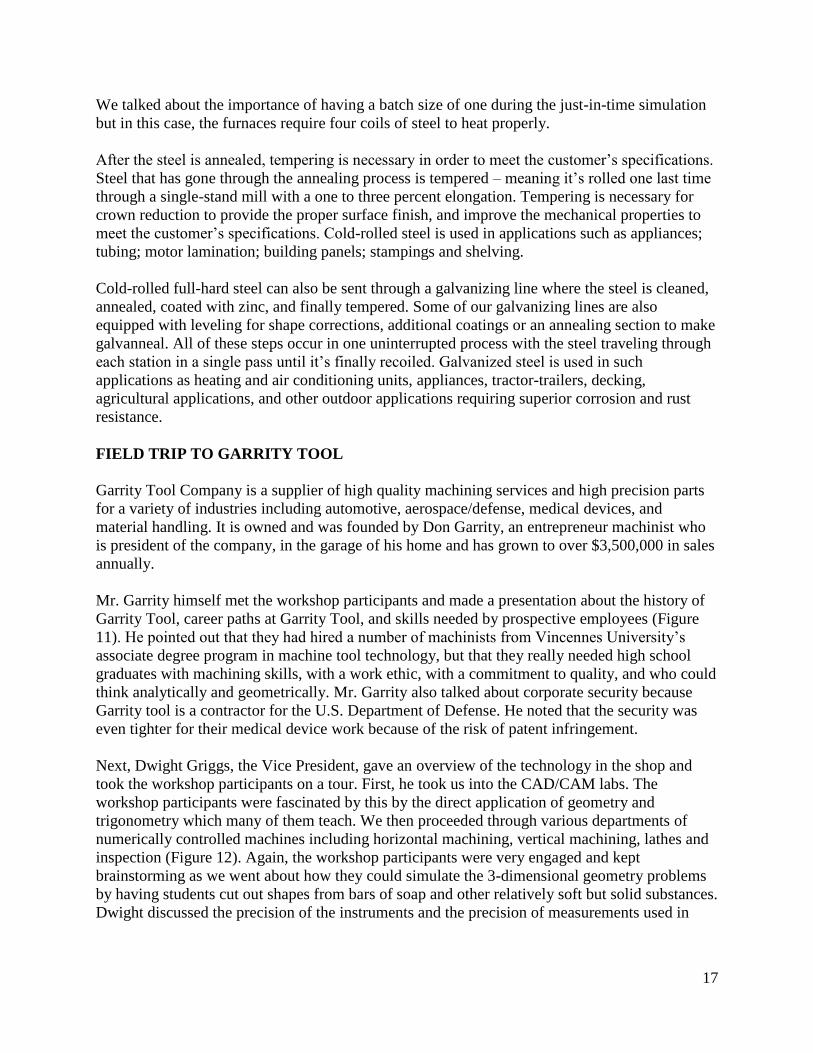
Figure 11. Don Garrity and Dwight Griggs speaking to workshop participants
Figure 12. Horizontal and Vertical Mills at Garrity Tool (from
http://www.garritytoolcompany.com/equipment.html)

19
Figure 13. Zeiss measuring machines used in quality inspections
MANUFACTURING ISSUES
John Pennington, President of PCI Associates, talked to the workshop participants about what it
is really like to work in a manufacturing environment, to manage an manufacturing enterprise,
and to use data and information in decision-making. Mr. Pennington has over 30 years of
experience in manufacturing and has held a variety of offices on the local, regional, and national
levels of APICS. He talked about the importance of being a team player, being flexible, being a
problem solver, thinking quantitatively, and using statistics because change is a given and
mathematics is necessary for understanding change. He discussed how information for decision
making must be accurate, relevant, and timely to decisions being made, and gave some
forecasting examples. He lamented the lack of basic algebra and statistical skills in machine
operators, distribution workers, and technicians and pointed out that there is a race among
companies for the best talent.
CONEXUS INDIANA’S INITIATIVES TO GENERATE INTEREST IN CAREERS IN
MANUFACTURING, TRANSPORTATION, DISTRIBUTION, AND LOGISTICS
Claudia Cummings, Vice President, Workforce and Community Programs at Indiana Conexus
spoke to the workshop participants about the state‟s initiative in advanced manufacturing and
logistics initiative, dedicated to making Indiana a global leader in these high-growth, high-tech
industries. She demonstrated some video and internet recruiting tools and recruited teachers to be
champions for the Dream-It-Do-It program.
FIELD TRIP TO SUBARU OF INDIANA AUTOMOTIVE
Subaru of Indiana Automotive, Inc. (SIA) is an Indiana-based manufacturer of the Subaru
Outback, Legacy, and Tribeca line of vehicles located in Lafayette, Indiana. SIA is the only
Subaru auto assembly plant in the United States. SIA also builds the Toyota Camry through a
business collaboration with Toyota. SIA is best known for its environmental commitment in
being the first automotive assembly plant to be “Zero-Landfill” which means that SIA has
reduced waste to the point that it sends nothing from its manufacturing process to the landfill. A
typical household puts more trash in the ground than SIA‟s entire manufacturing facility.
20
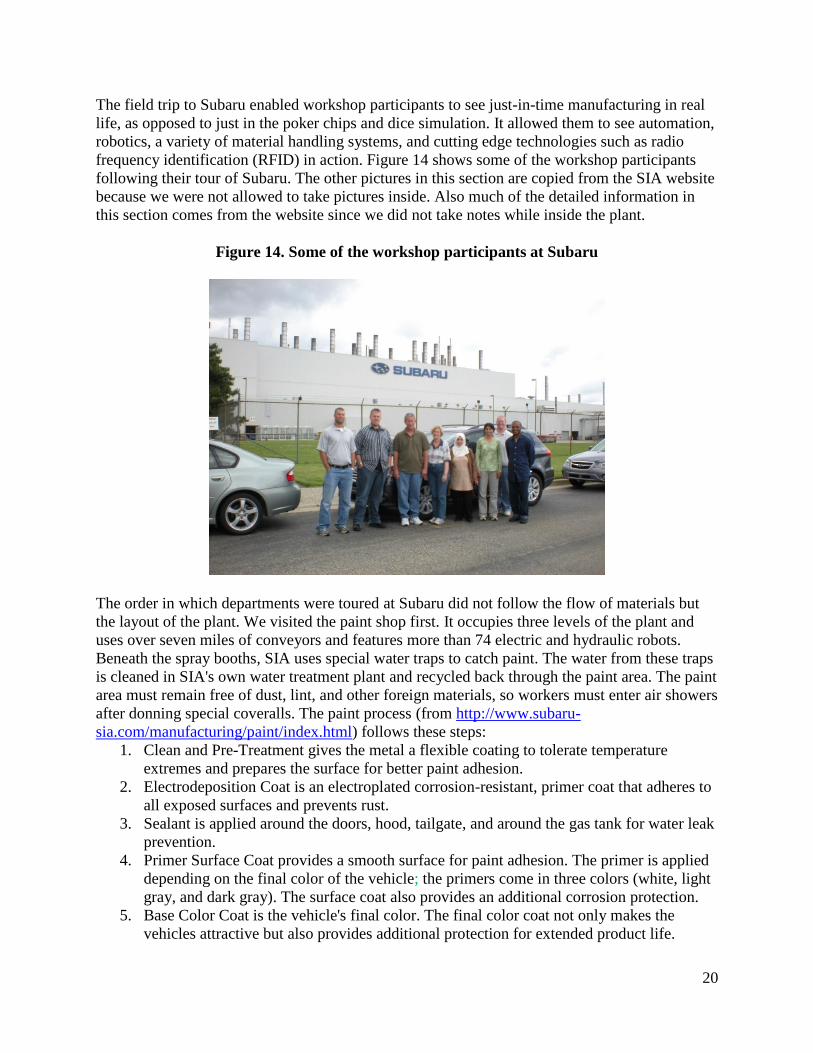
The field trip to Subaru enabled workshop participants to see just-in-time manufacturing in real
life, as opposed to just in the poker chips and dice simulation. It allowed them to see automation,
robotics, a variety of material handling systems, and cutting edge technologies such as radio
frequency identification (RFID) in action. Figure 14 shows some of the workshop participants
following their tour of Subaru. The other pictures in this section are copied from the SIA website
because we were not allowed to take pictures inside. Also much of the detailed information in
this section comes from the website since we did not take notes while inside the plant.
Figure 14. Some of the workshop participants at Subaru
The order in which departments were toured at Subaru did not follow the flow of materials but
the layout of the plant. We visited the paint shop first. It occupies three levels of the plant and
uses over seven miles of conveyors and features more than 74 electric and hydraulic robots.
Beneath the spray booths, SIA uses special water traps to catch paint. The water from these traps
is cleaned in SIA's own water treatment plant and recycled back through the paint area. The paint
area must remain free of dust, lint, and other foreign materials, so workers must enter air showers
after donning special coveralls. The paint process (from http://www.subaru-
sia.com/manufacturing/paint/index.html) follows these steps:
1. Clean and Pre-Treatment gives the metal a flexible coating to tolerate temperature
extremes and prepares the surface for better paint adhesion.
2. Electrodeposition Coat is an electroplated corrosion-resistant, primer coat that adheres to
all exposed surfaces and prevents rust.
3. Sealant is applied around the doors, hood, tailgate, and around the gas tank for water leak
prevention.
4. Primer Surface Coat provides a smooth surface for paint adhesion. The primer is applied
depending on the final color of the vehicle; the primers come in three colors (white, light
gray, and dark gray). The surface coat also provides an additional corrosion protection.
5. Base Color Coat is the vehicle's final color. The final color coat not only makes the
vehicles attractive but also provides additional protection for extended product life.
21
6. Clear Coat is the final spray application. It is gives the vehicle its luster and protects the
vehicle finish from sunlight deterioration.
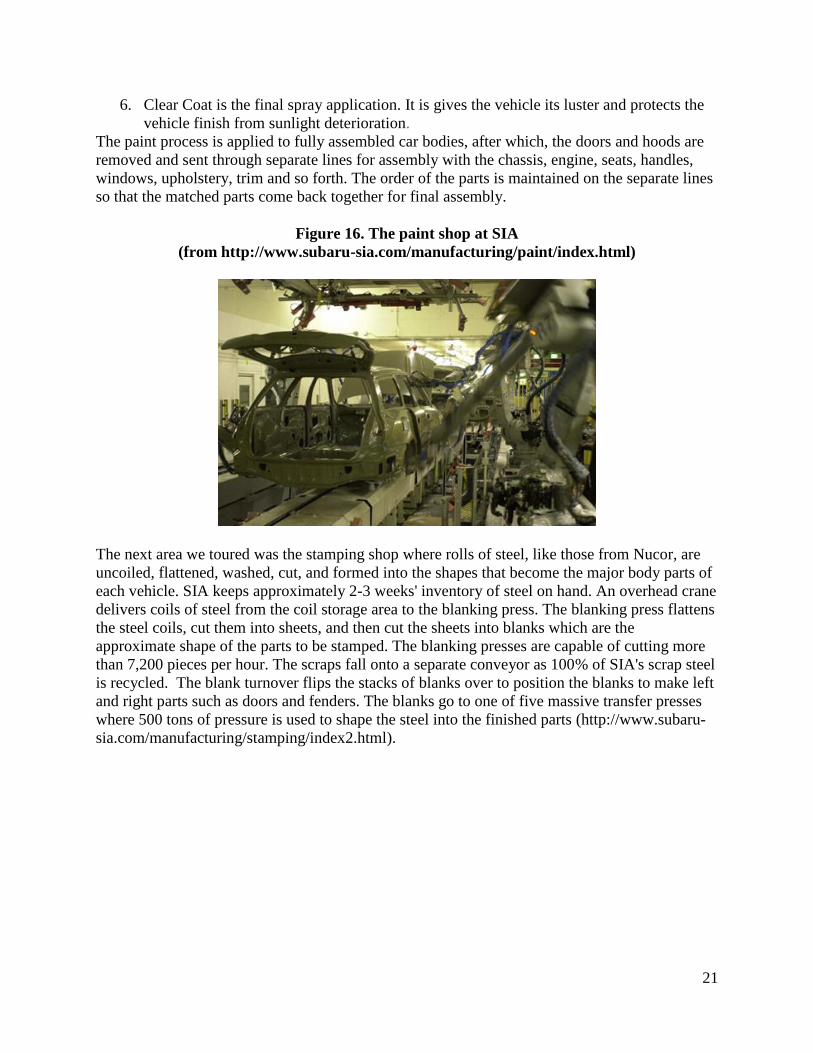
The paint process is applied to fully assembled car bodies, after which, the doors and hoods are
removed and sent through separate lines for assembly with the chassis, engine, seats, handles,
windows, upholstery, trim and so forth. The order of the parts is maintained on the separate lines
so that the matched parts come back together for final assembly.
Figure 16. The paint shop at SIA
(from http://www.subaru-sia.com/manufacturing/paint/index.html)
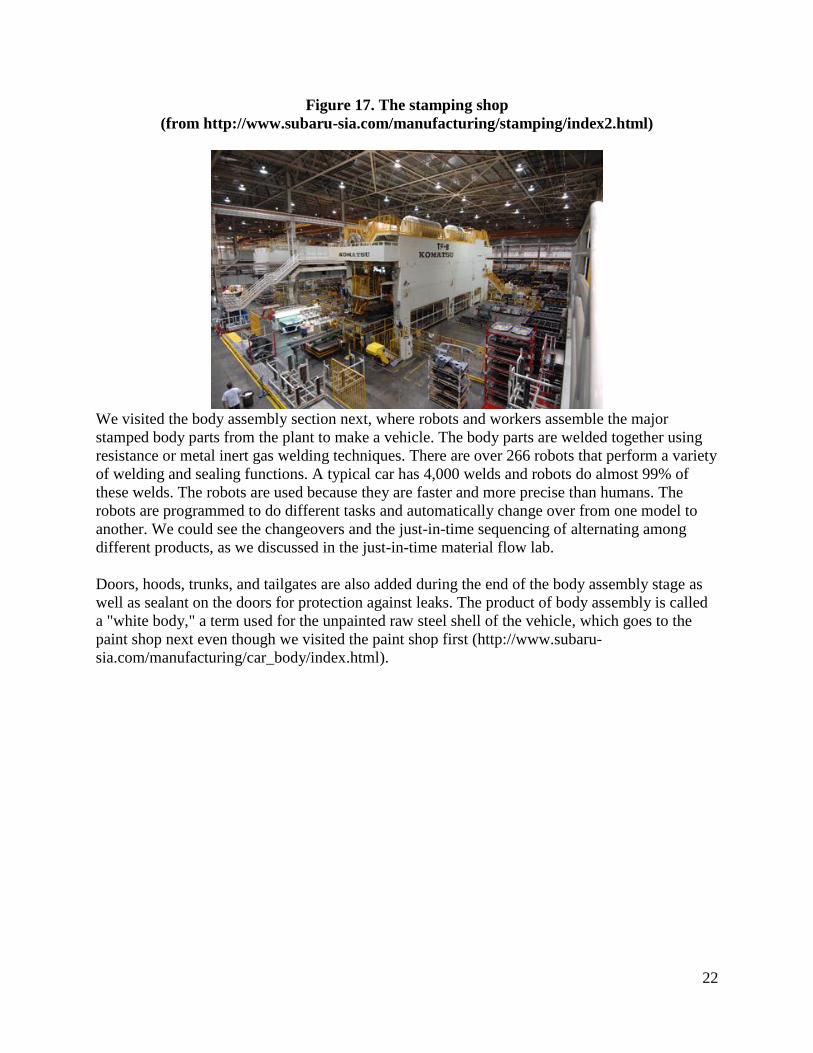
The next area we toured was the stamping shop where rolls of steel, like those from Nucor, are
uncoiled, flattened, washed, cut, and formed into the shapes that become the major body parts of
each vehicle. SIA keeps approximately 2-3 weeks' inventory of steel on hand. An overhead crane
delivers coils of steel from the coil storage area to the blanking press. The blanking press flattens
the steel coils, cut them into sheets, and then cut the sheets into blanks which are the
approximate shape of the parts to be stamped. The blanking presses are capable of cutting more
than 7,200 pieces per hour. The scraps fall onto a separate conveyor as 100% of SIA's scrap steel
is recycled. The blank turnover flips the stacks of blanks over to position the blanks to make left
and right parts such as doors and fenders. The blanks go to one of five massive transfer presses
where 500 tons of pressure is used to shape the steel into the finished parts (http://www.subaru-
sia.com/manufacturing/stamping/index2.html).
22
Figure 17. The stamping shop
(from http://www.subaru-sia.com/manufacturing/stamping/index2.html)
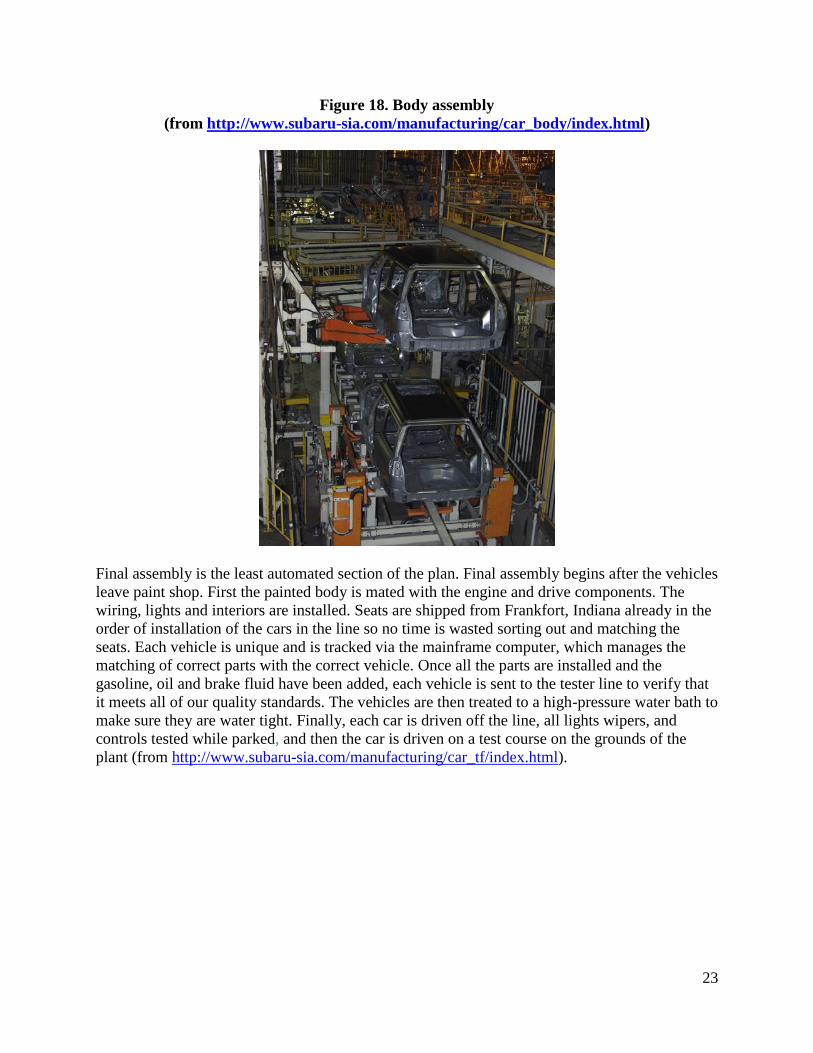
We visited the body assembly section next, where robots and workers assemble the major
stamped body parts from the plant to make a vehicle. The body parts are welded together using
resistance or metal inert gas welding techniques. There are over 266 robots that perform a variety
of welding and sealing functions. A typical car has 4,000 welds and robots do almost 99% of
these welds. The robots are used because they are faster and more precise than humans. The
robots are programmed to do different tasks and automatically change over from one model to
another. We could see the changeovers and the just-in-time sequencing of alternating among
different products, as we discussed in the just-in-time material flow lab.
Doors, hoods, trunks, and tailgates are also added during the end of the body assembly stage as
well as sealant on the doors for protection against leaks. The product of body assembly is called
a "white body," a term used for the unpainted raw steel shell of the vehicle, which goes to the
paint shop next even though we visited the paint shop first (http://www.subaru-
sia.com/manufacturing/car_body/index.html).
23
Figure 18. Body assembly
(from http://www.subaru-sia.com/manufacturing/car_body/index.html)
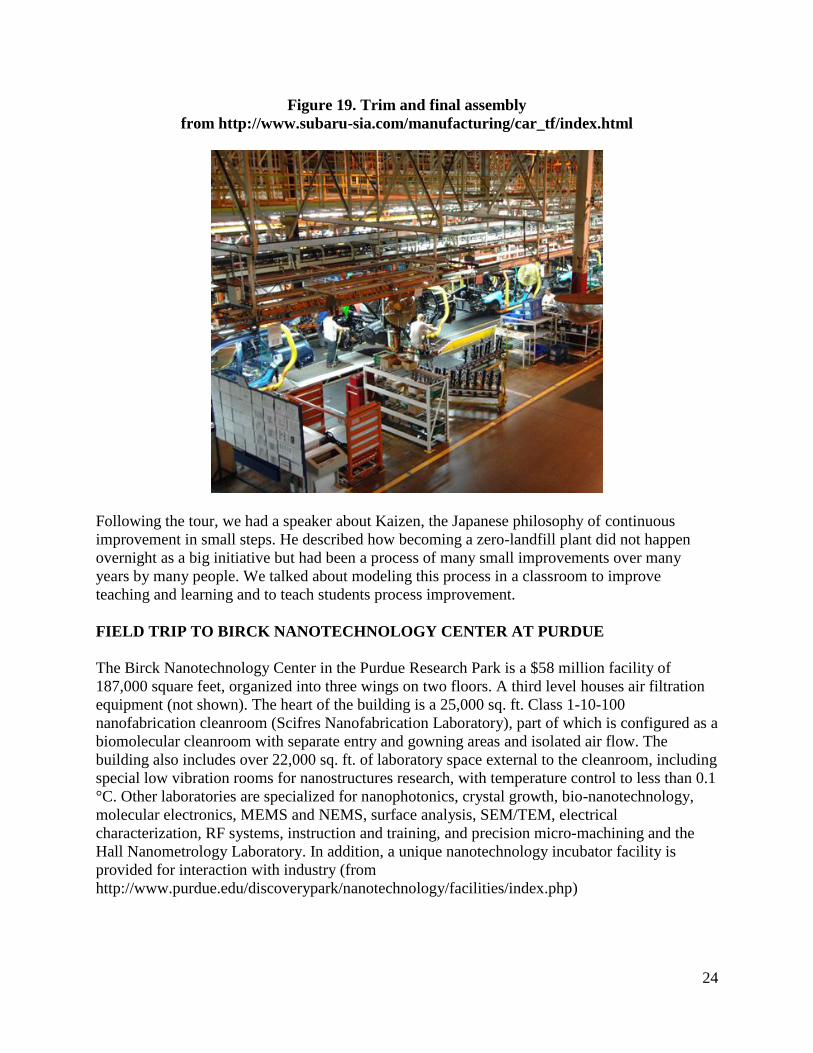
Final assembly is the least automated section of the plan. Final assembly begins after the vehicles
leave paint shop. First the painted body is mated with the engine and drive components. The
wiring, lights and interiors are installed. Seats are shipped from Frankfort, Indiana already in the
order of installation of the cars in the line so no time is wasted sorting out and matching the
seats. Each vehicle is unique and is tracked via the mainframe computer, which manages the
matching of correct parts with the correct vehicle. Once all the parts are installed and the
gasoline, oil and brake fluid have been added, each vehicle is sent to the tester line to verify that
it meets all of our quality standards. The vehicles are then treated to a high-pressure water bath to
make sure they are water tight. Finally, each car is driven off the line, all lights wipers, and
controls tested while parked, and then the car is driven on a test course on the grounds of the
plant (from http://www.subaru-sia.com/manufacturing/car_tf/index.html).
24
Figure 19. Trim and final assembly
from http://www.subaru-sia.com/manufacturing/car_tf/index.html
Following the tour, we had a speaker about Kaizen, the Japanese philosophy of continuous
improvement in small steps. He described how becoming a zero-landfill plant did not happen
overnight as a big initiative but had been a process of many small improvements over many
years by many people. We talked about modeling this process in a classroom to improve
teaching and learning and to teach students process improvement.
FIELD TRIP TO BIRCK NANOTECHNOLOGY CENTER AT PURDUE
The Birck Nanotechnology Center in the Purdue Research Park is a $58 million facility of
187,000 square feet, organized into three wings on two floors. A third level houses air filtration
equipment (not shown). The heart of the building is a 25,000 sq. ft. Class 1-10-100
nanofabrication cleanroom (Scifres Nanofabrication Laboratory), part of which is configured as a
biomolecular cleanroom with separate entry and gowning areas and isolated air flow. The
building also includes over 22,000 sq. ft. of laboratory space external to the cleanroom, including
special low vibration rooms for nanostructures research, with temperature control to less than 0.1
°C. Other laboratories are specialized for nanophotonics, crystal growth, bio-nanotechnology,
molecular electronics, MEMS and NEMS, surface analysis, SEM/TEM, electrical
characterization, RF systems, instruction and training, and precision micro-machining and the
Hall Nanometrology Laboratory. In addition, a unique nanotechnology incubator facility is
provided for interaction with industry (from
http://www.purdue.edu/discoverypark/nanotechnology/facilities/index.php)
25
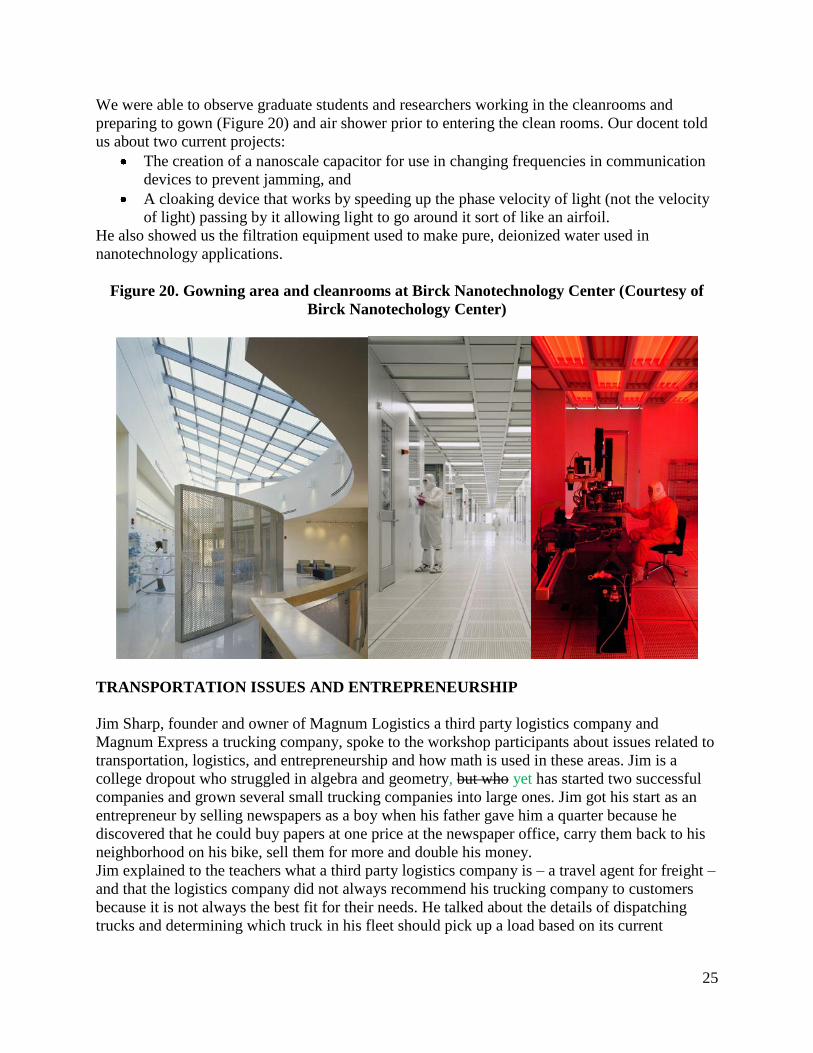
We were able to observe graduate students and researchers working in the cleanrooms and
preparing to gown (Figure 20) and air shower prior to entering the clean rooms. Our docent told
us about two current projects:
The creation of a nanoscale capacitor for use in changing frequencies in communication
devices to prevent jamming, and
A cloaking device that works by speeding up the phase velocity of light (not the velocity
of light) passing by it allowing light to go around it sort of like an airfoil.
He also showed us the filtration equipment used to make pure, deionized water used in
nanotechnology applications.
Figure 20. Gowning area and cleanrooms at Birck Nanotechnology Center (Courtesy of
Birck Nanotechology Center)
TRANSPORTATION ISSUES AND ENTREPRENEURSHIP
Jim Sharp, founder and owner of Magnum Logistics a third party logistics company and
Magnum Express a trucking company, spoke to the workshop participants about issues related to
transportation, logistics, and entrepreneurship and how math is used in these areas. Jim is a
college dropout who struggled in algebra and geometry, but who yet has started two successful
companies and grown several small trucking companies into large ones. Jim got his start as an
entrepreneur by selling newspapers as a boy when his father gave him a quarter because he
discovered that he could buy papers at one price at the newspaper office, carry them back to his
neighborhood on his bike, sell them for more and double his money.
Jim explained to the teachers what a third party logistics company is – a travel agent for freight –
and that the logistics company did not always recommend his trucking company to customers
because it is not always the best fit for their needs. He talked about the details of dispatching
trucks and determining which truck in his fleet should pick up a load based on its current

26
location, delivery schedule and other factors. He also pointed out how GPS and other
technologies are impacting trucking.
Jim pointed out that careers in transportation and logistics are great for people with short
attention spans because things are always changing and changing rapidly and that there are many
more opportunities than being a truck driver. He pleaded with the teachers to not give up on
under-achievers but to motivate them with mathematics applied to the real world.
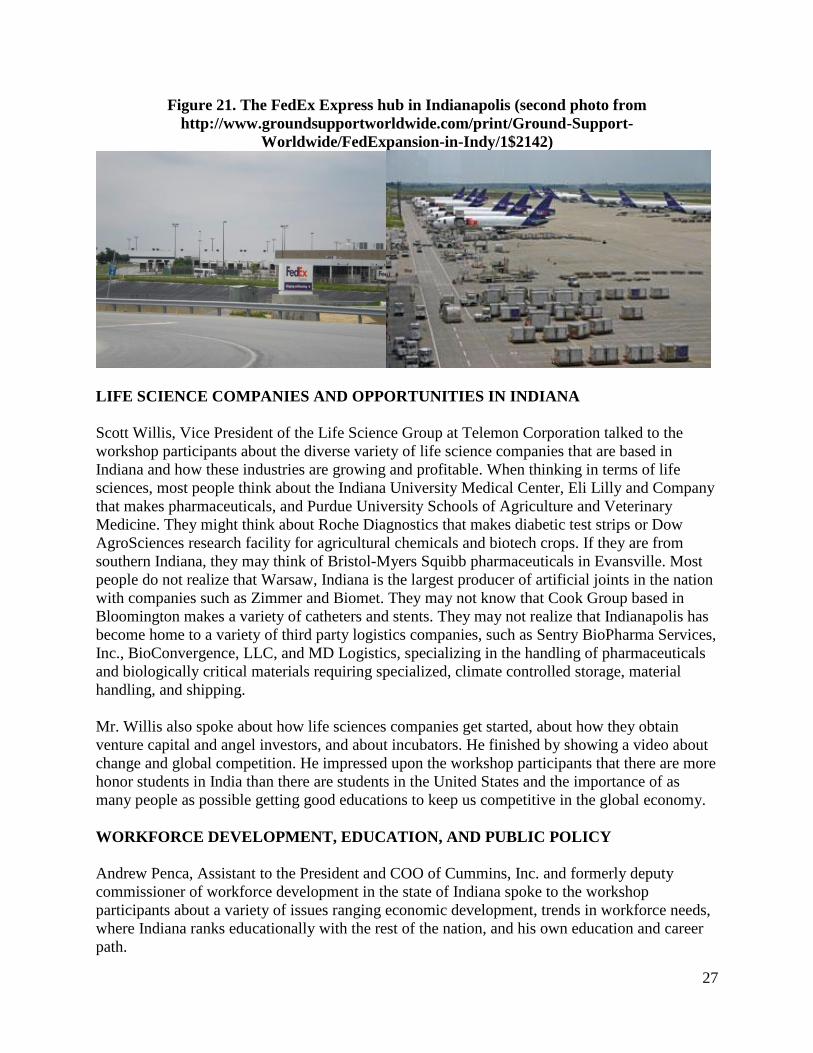
FIELD TRIP TO FEDEX
Our field trip to the FedEx Express hub in Indianapolis gave workshop participants a first-hand
look at shipping and logistics. Our host and tour guide was Ted Bell, Senior Manager of Ramp
Operations. Ted started the tour with a presentation on the Indianapolis Hub which is the second
largest in the United States with Memphis, TN being the largest. The FedEx Express Hub at the
Indianapolis International Airport helps connect customers to more than 220 countries and
territories on six continents. It began operations in 1988 and now employs a workforce of more
than 4,000 FedEx Express employees in a nearly two million square-foot facility on
approximately 280 acres within the Indianapolis International Airport complex. The hub operates
24 hours a day, 7 days a week, 365 days a year at a volume of more than 650 flights per month.
Two sorts per day bring an average of 50,000 packages through the facility daily. This volume of
freight has made Indianapolis International Airport one of the top ten busiest air cargo facilities
in the United States and among the top 25 in the world.
After the presentation, we got in a bus and drove around the ramp to see the planes and stopped
in some buildings where large pieces of freight are handled, getting a chance to see the platforms
with rollers making it easy for people to move the large “cans” that freight is shipped in and also
seeing a variety of trucks, tugs, and other vehicles used in moving freight around the hub. Next
we went to the control tower where incoming and outgoing flights are monitored. The most
interesting stop was the “matrix”, the automated system of conveyors and chutes where
documents and packages from incoming trucks and planes are sorted and collected by destination
for loading onto outgoing trucks and planes. Packages entering the matrix at one of several
conveyors have a bar code read, and are kicked off the conveyor to go down a chute to a lower
conveyor to the loading area for the truck or plane outbound to the destination. The choice of
chute at which the packages are kicked off the first conveyor is determined by the barcode and
the time based on the speed of the conveyor to reach the correct chute is automatically read into
the system, so that the paddle kicks the package off at the right place and time. Our final stop on
the tour was the control room from which the entire facility is monitored on video screens.
Weather radar is also monitored from the control room because safety procedures require the
outside ramps to be shut down if there is lightning within a certain number of miles.
27
Figure 21. The FedEx Express hub in Indianapolis (second photo from
http://www.groundsupportworldwide.com/print/Ground-Support-
Worldwide/FedExpansion-in-Indy/1$2142)
LIFE SCIENCE COMPANIES AND OPPORTUNITIES IN INDIANA
Scott Willis, Vice President of the Life Science Group at Telemon Corporation talked to the
workshop participants about the diverse variety of life science companies that are based in
Indiana and how these industries are growing and profitable. When thinking in terms of life
sciences, most people think about the Indiana University Medical Center, Eli Lilly and Company
that makes pharmaceuticals, and Purdue University Schools of Agriculture and Veterinary
Medicine. They might think about Roche Diagnostics that makes diabetic test strips or Dow
AgroSciences research facility for agricultural chemicals and biotech crops. If they are from
southern Indiana, they may think of Bristol-Myers Squibb pharmaceuticals in Evansville. Most
people do not realize that Warsaw, Indiana is the largest producer of artificial joints in the nation
with companies such as Zimmer and Biomet. They may not know that Cook Group based in
Bloomington makes a variety of catheters and stents. They may not realize that Indianapolis has
become home to a variety of third party logistics companies, such as Sentry BioPharma Services,
Inc., BioConvergence, LLC, and MD Logistics, specializing in the handling of pharmaceuticals
and biologically critical materials requiring specialized, climate controlled storage, material
handling, and shipping.
Mr. Willis also spoke about how life sciences companies get started, about how they obtain
venture capital and angel investors, and about incubators. He finished by showing a video about
change and global competition. He impressed upon the workshop participants that there are more
honor students in India than there are students in the United States and the importance of as
many people as possible getting good educations to keep us competitive in the global economy.
WORKFORCE DEVELOPMENT, EDUCATION, AND PUBLIC POLICY
Andrew Penca, Assistant to the President and COO of Cummins, Inc. and formerly deputy
commissioner of workforce development in the state of Indiana spoke to the workshop
participants about a variety of issues ranging economic development, trends in workforce needs,
where Indiana ranks educationally with the rest of the nation, and his own education and career
path.

28
GLOBAL SUPPLY CHAINS
Christofer A. Matney, President of the World Trade Club of Indiana and Air Service Director at
the Indianapolis International Airport spoke to the workshop participants about global supply
chains and international business. He talked about how difficult it is to establish trade relations
with overseas markets. He discussed taking businesses global, including legal implications,
cultural issues, and customs. He introduced the workshop participants to the concept of foreign
trade zones as a way to avoid paying customs until the product is actually needed by a customer.
He provided the workshop participants with a lot of statistics about the Indianapolis International
Airport and made it clear that Indiana is becoming a major hub for international business,
particularly in high value biocritical materials and pharmaceuticals that are shipped via air
freight. For these products, our major import/export partners are in the United Kingdom,
Germany, Canada, and China. He also told workshop participants about his own, interesting
career path.
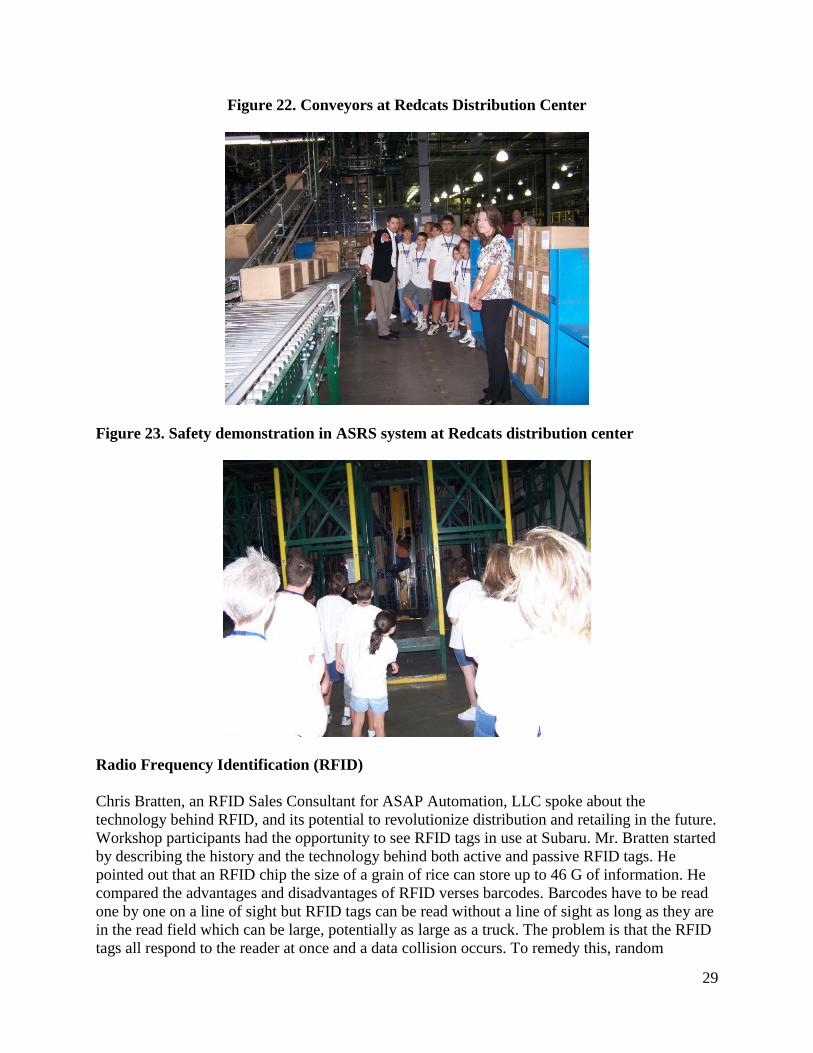
FIELD TRIP TO REDCATS DISTRIBUTION CENTER
Our field trip to Redcats Distribution Center was hosted by Dan Kelly, Director of Inbound
Operations. Redcats USA is a multi-channel home shopping company specializing in apparel,
lifestyle and domestic goods and sporting goods. The facility was originally built in 1962 as a
mail order facility for Lane Bryant and acquired by Redcats in 1998. Over the years, it has been
expanded to a 750,000 square foot distribution. In this facility, the workshop participants had the
opportunity to see a variety of types of conveyors, sortation systems, pallet trucks, lift trucks,
automated storage and retrieval systems (ASRS) and other material handling equipment. Mr.
Kelly talked about safety throughout the tour and introduced workshop participants to
applications of ergonomics, both to prevent repetitive strain injuries and to make the workers
more efficient. He emphasized material flow and introduced workshop participants to the
practice of cross-docking. We saw inspection and repackaging of returns. We even saw a
shipment that had been damaged by water being unloaded, inspected, and reloaded to be
examined and repackaged by the vendor. Following the tour, a number of people from the
facility came in to describe their career paths and jobs with the teachers to demonstrate the
diverse skills, talents, and levels of education that are needed to run a distribution facility. No
pictures were taken on this tour but Redcats provided us with pictures from a tour of a middle
school group to illustrate their conveyor system (Figure 22) and ASRS system (Figure 23).
29
Figure 22. Conveyors at Redcats Distribution Center
Figure 23. Safety demonstration in ASRS system at Redcats distribution center
Radio Frequency Identification (RFID)
Chris Bratten, an RFID Sales Consultant for ASAP Automation, LLC spoke about the
technology behind RFID, and its potential to revolutionize distribution and retailing in the future.
Workshop participants had the opportunity to see RFID tags in use at Subaru. Mr. Bratten started
by describing the history and the technology behind both active and passive RFID tags. He
pointed out that an RFID chip the size of a grain of rice can store up to 46 G of information. He
compared the advantages and disadvantages of RFID verses barcodes. Barcodes have to be read
one by one on a line of sight but RFID tags can be read without a line of sight as long as they are
in the read field which can be large, potentially as large as a truck. The problem is that the RFID
tags all respond to the reader at once and a data collision occurs. To remedy this, random

30
response pauses are used. There are also problems with the size and shape of read fields. On the
other hand, Wal-Mart has pioneered the use of RFID with some success and Subaru is using it in
its assembly plant with considerable success. Mr. Bratten also described his education, his
research on RFID while a graduate student at Purdue, and his career path.
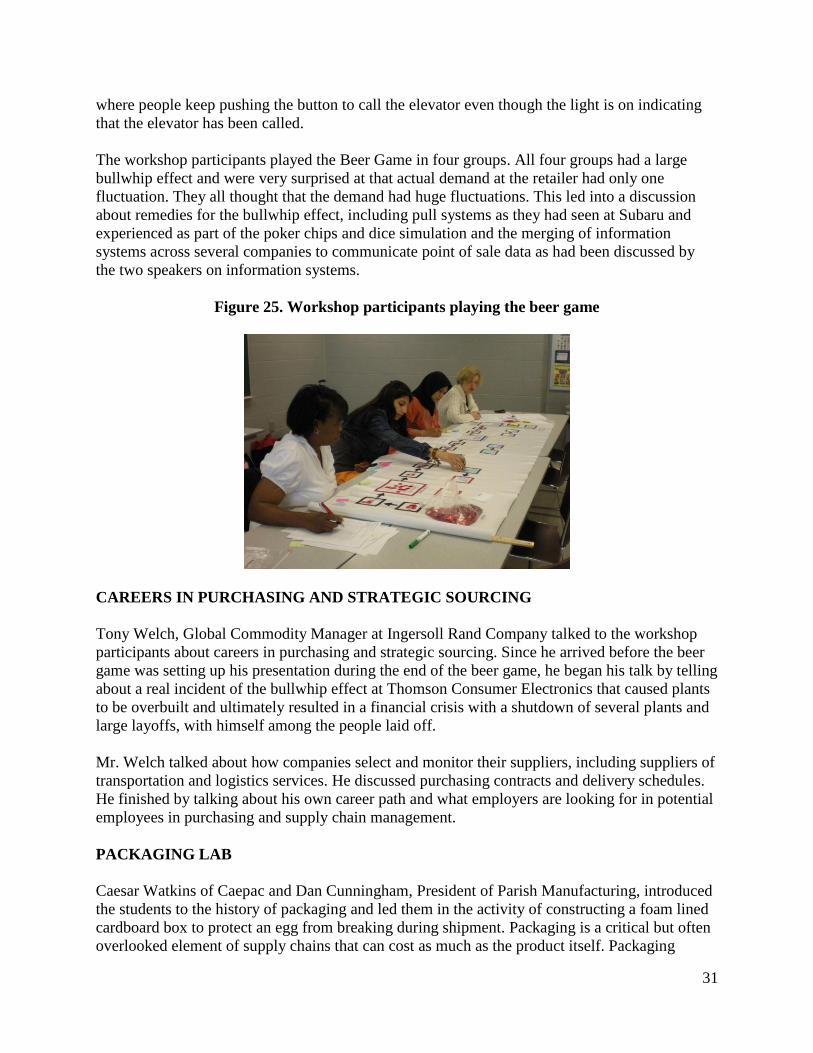
HUMAN BEHAVIOR IN DELAYED FEEDBACK SITUATIONS ILLUSTRATED BY
THE BEER GAME
The Beer Game is a popular classroom exercise for demonstrating material and information
flows in a supply chain that was developed at the Massachusetts Institute of Technology Sloan
School of Management. It dramatically demonstrates to students the bullwhip effect which is the
amplification of variance in demand up the supply chain resulting first in large backlogs and then
in excessive inventories due to the typical human response to information delays. Time plots of
inventory levels have a shape similar to that of a whip when it is cracked.
The beer game is played as a board game with four players: a retailer, a wholesaler, a distributor,
and a factory. Customer orders are placed with the retailer who fills them to the extent possible.
The retailer then orders from the wholesaler to replenish his/her stock. Similarly the wholesaler
fills retailer orders and replenishes from the distributor who in turn fills wholesaler orders and
replenishes from the factory. The factory fills distributor orders and replenishes from a limitless
supply of raw material. All players keep records of backlogs, or unfilled orders, and attempt to
fill them as soon as possible. Shipping delays of two periods separate each player, as do
information delays of two periods. Initially, all four players have twelve units of inventory and
four units of inventory are on each square representing a shipping delay. Similarly, all of the
orders in the information pipeline at the start of the game are for four units. The game board is
shown in Figure 24.
Prod’n Delay oooo
RETAIL oooooo oooooo
WHLSLR oooooo oooooo
DIST’R oooooo oooooo
FACT’RY oooooo oooooo
Shipping
Delay oooo
Shipping Delay oooo
Shipping
Delay oooo
Shipping Delay oooo
Shipping Delay oooo
Shipping
Delay oooo
Prod’n Delay oooo
Raw Mat’l
Cust Order
Order Plac’d
Inc’g Order
Order Plac’d
Inc’g Order
Order Plac’d
Inc’g Order
Prod Order
Figure 24: The initial setup for the board game version of the beer game
The object of the game is to fill all customer orders without carrying excessive inventories or
having excessive backlogs. The players must fill backlogs eventually. For the first several
periods of the game, the customer orders are at four units each period. At some point, the
customer orders jump to eight units and remain at that level for the rest of the game. The game
runs for 50 periods or until the players become frustrated with excessive backlogs and
inventories and the point about the bullwhip effect has been made. The only stochastic part of the
beer game is the human behavior in placing orders but human behavior rarely fails to produce the
bullwhip effect. Students tend to overestimate demand, underestimate orders in the pipeline, and
lack patience with delays. Good examples of this can be seen in human behavior at elevators
31
where people keep pushing the button to call the elevator even though the light is on indicating
that the elevator has been called.
The workshop participants played the Beer Game in four groups. All four groups had a large
bullwhip effect and were very surprised at that actual demand at the retailer had only one
fluctuation. They all thought that the demand had huge fluctuations. This led into a discussion
about remedies for the bullwhip effect, including pull systems as they had seen at Subaru and
experienced as part of the poker chips and dice simulation and the merging of information
systems across several companies to communicate point of sale data as had been discussed by
the two speakers on information systems.
Figure 25. Workshop participants playing the beer game
CAREERS IN PURCHASING AND STRATEGIC SOURCING
Tony Welch, Global Commodity Manager at Ingersoll Rand Company talked to the workshop
participants about careers in purchasing and strategic sourcing. Since he arrived before the beer
game was setting up his presentation during the end of the beer game, he began his talk by telling
about a real incident of the bullwhip effect at Thomson Consumer Electronics that caused plants
to be overbuilt and ultimately resulted in a financial crisis with a shutdown of several plants and
large layoffs, with himself among the people laid off.
Mr. Welch talked about how companies select and monitor their suppliers, including suppliers of
transportation and logistics services. He discussed purchasing contracts and delivery schedules.
He finished by talking about his own career path and what employers are looking for in potential
employees in purchasing and supply chain management.
PACKAGING LAB
Caesar Watkins of Caepac and Dan Cunningham, President of Parish Manufacturing, introduced
the students to the history of packaging and led them in the activity of constructing a foam lined
cardboard box to protect an egg from breaking during shipment. Packaging is a critical but often
overlooked element of supply chains that can cost as much as the product itself. Packaging
32
protects products during shipment and is an important marketing tool. Packaging has become
increasingly environmentally friendly with much packaging being reused or recycled. Reuse of
packaging was emphasized earlier on the trip to Subaru.
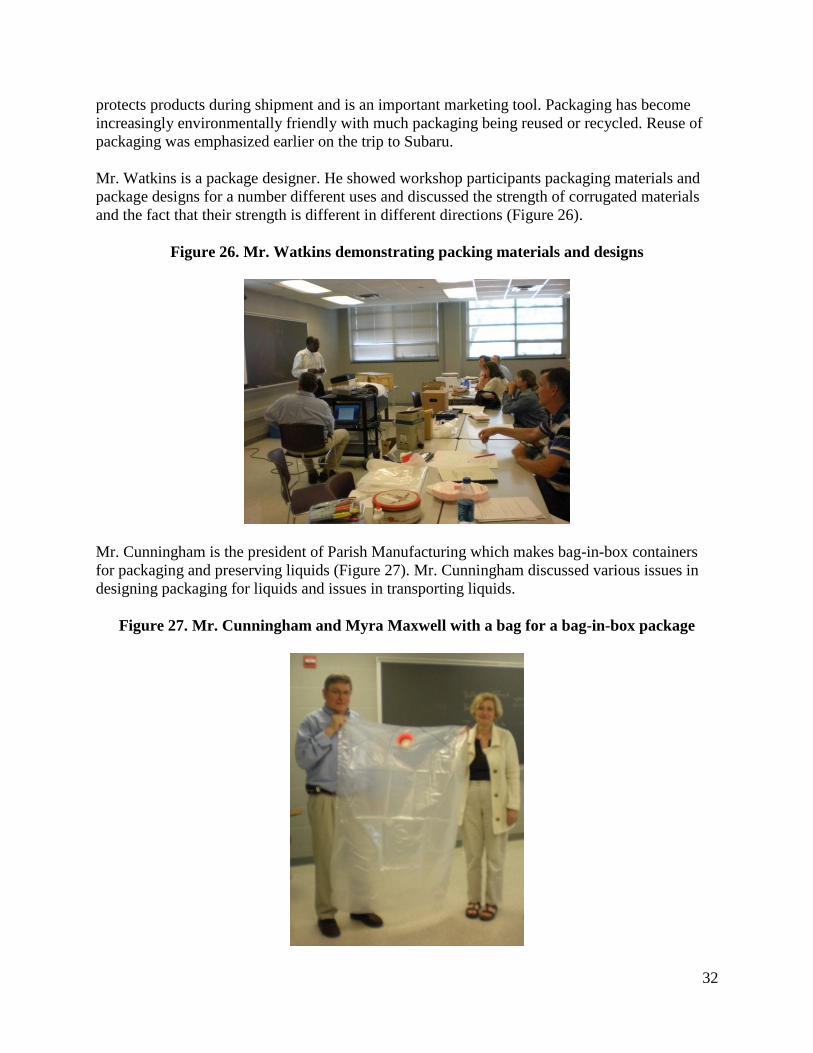
Mr. Watkins is a package designer. He showed workshop participants packaging materials and
package designs for a number different uses and discussed the strength of corrugated materials
and the fact that their strength is different in different directions (Figure 26).
Figure 26. Mr. Watkins demonstrating packing materials and designs
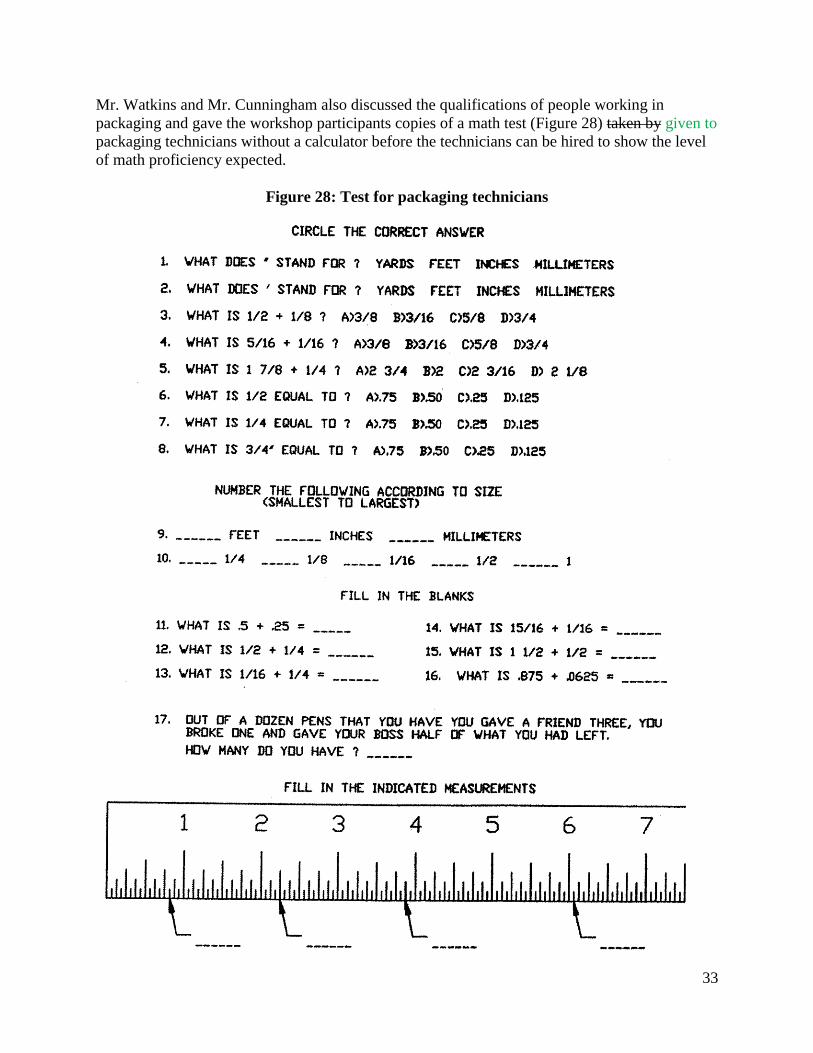
Mr. Cunningham is the president of Parish Manufacturing which makes bag-in-box containers
for packaging and preserving liquids (Figure 27). Mr. Cunningham discussed various issues in
designing packaging for liquids and issues in transporting liquids.
Figure 27. Mr. Cunningham and Myra Maxwell with a bag for a bag-in-box package
33
Mr. Watkins and Mr. Cunningham also discussed the qualifications of people working in
packaging and gave the workshop participants copies of a math test (Figure 28) taken by given to
packaging technicians without a calculator before the technicians can be hired to show the level
of math proficiency expected.
Figure 28: Test for packaging technicians
34
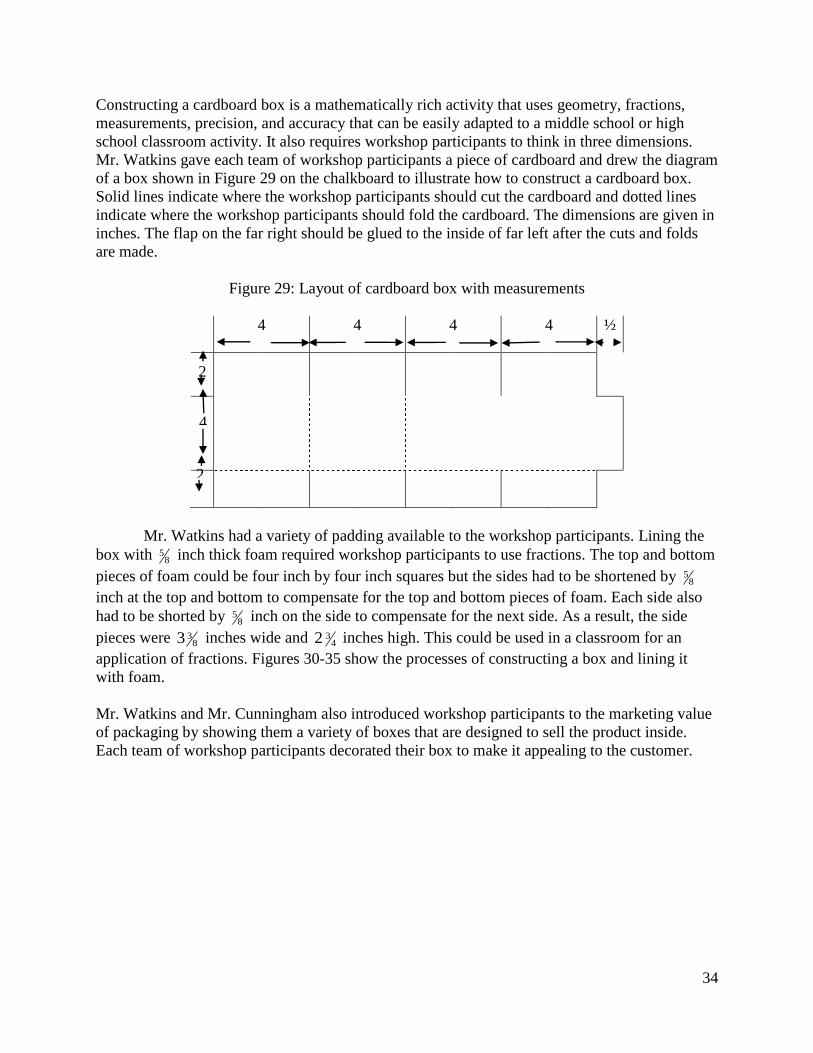
Constructing a cardboard box is a mathematically rich activity that uses geometry, fractions,
measurements, precision, and accuracy that can be easily adapted to a middle school or high
school classroom activity. It also requires workshop participants to think in three dimensions.
Mr. Watkins gave each team of workshop participants a piece of cardboard and drew the diagram
of a box shown in Figure 29 on the chalkboard to illustrate how to construct a cardboard box.
Solid lines indicate where the workshop participants should cut the cardboard and dotted lines
indicate where the workshop participants should fold the cardboard. The dimensions are given in
inches. The flap on the far right should be glued to the inside of far left after the cuts and folds
are made.
Figure 29: Layout of cardboard box with measurements
4 4 4 4 ½
Mr. Watkins had a variety of padding available to the workshop participants. Lining the
box with 85 inch thick foam required workshop participants to use fractions. The top and bottom
pieces of foam could be four inch by four inch squares but the sides had to be shortened by 85
inch at the top and bottom to compensate for the top and bottom pieces of foam. Each side also
had to be shorted by 85 inch on the side to compensate for the next side. As a result, the side
pieces were 833 inches wide and 4
32 inches high. This could be used in a classroom for an
application of fractions. Figures 30-35 show the processes of constructing a box and lining it
with foam.
Mr. Watkins and Mr. Cunningham also introduced workshop participants to the marketing value
of packaging by showing them a variety of boxes that are designed to sell the product inside.
Each team of workshop participants decorated their box to make it appealing to the customer.
2
4
2

35
Figure 30. Laying out the plan of the box
Figure 31. Cutting out the box
Figure 32. Scoring the box before folding
36
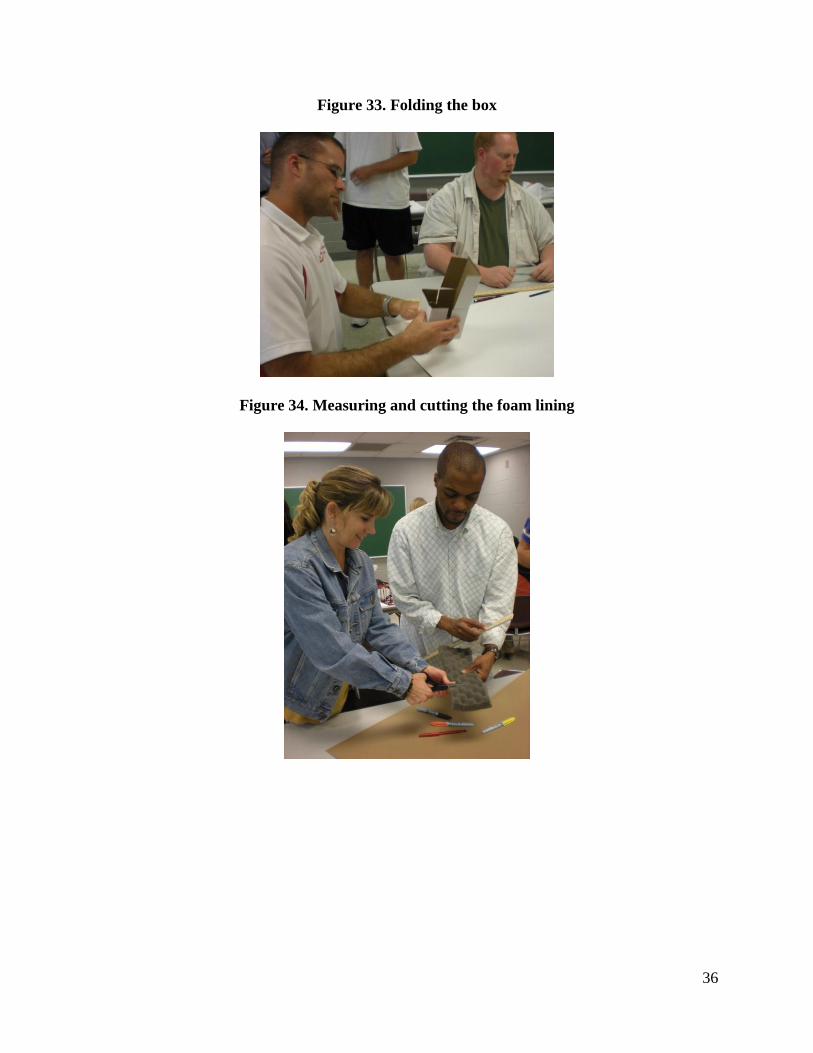
Figure 33. Folding the box
Figure 34. Measuring and cutting the foam lining

37
Figure 35. Lining the box with foam
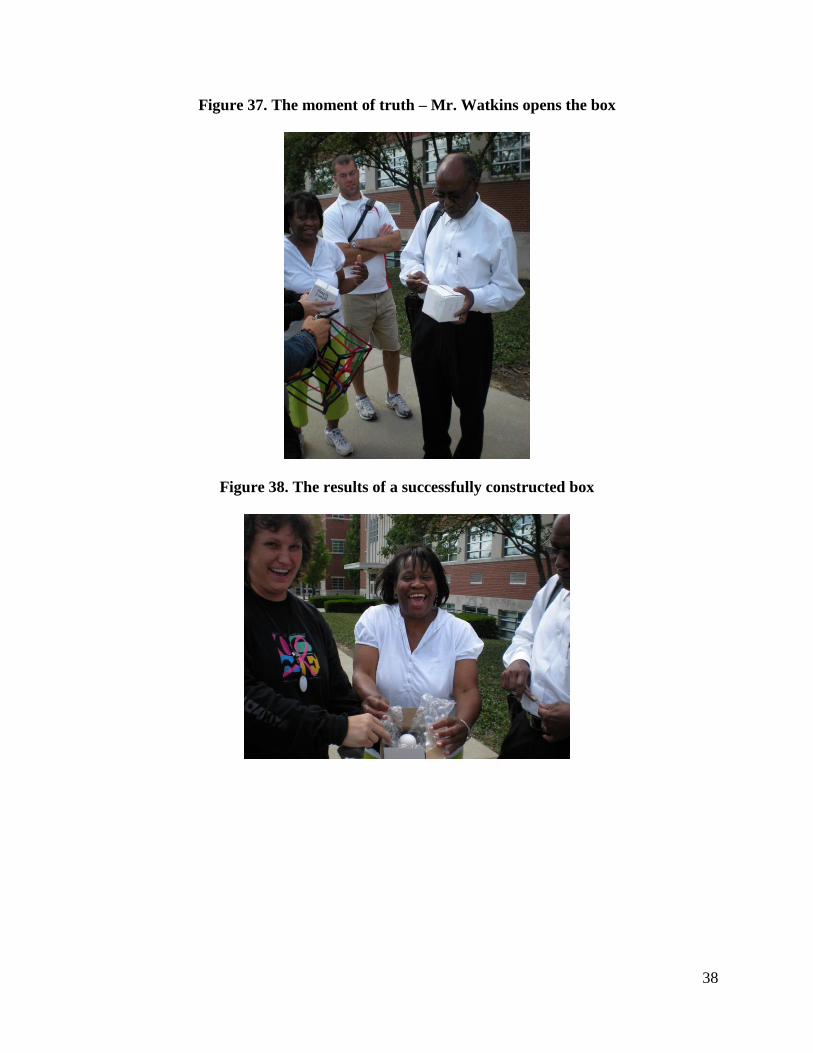
The true test of good box construction was the egg drop. Mr. Cunningham dropped the boxes
with eggs in them from the steps of Lilly Science Hall.
Figure 36. Mr. Cunningham tests a box
38
Figure 37. The moment of truth – Mr. Watkins opens the box
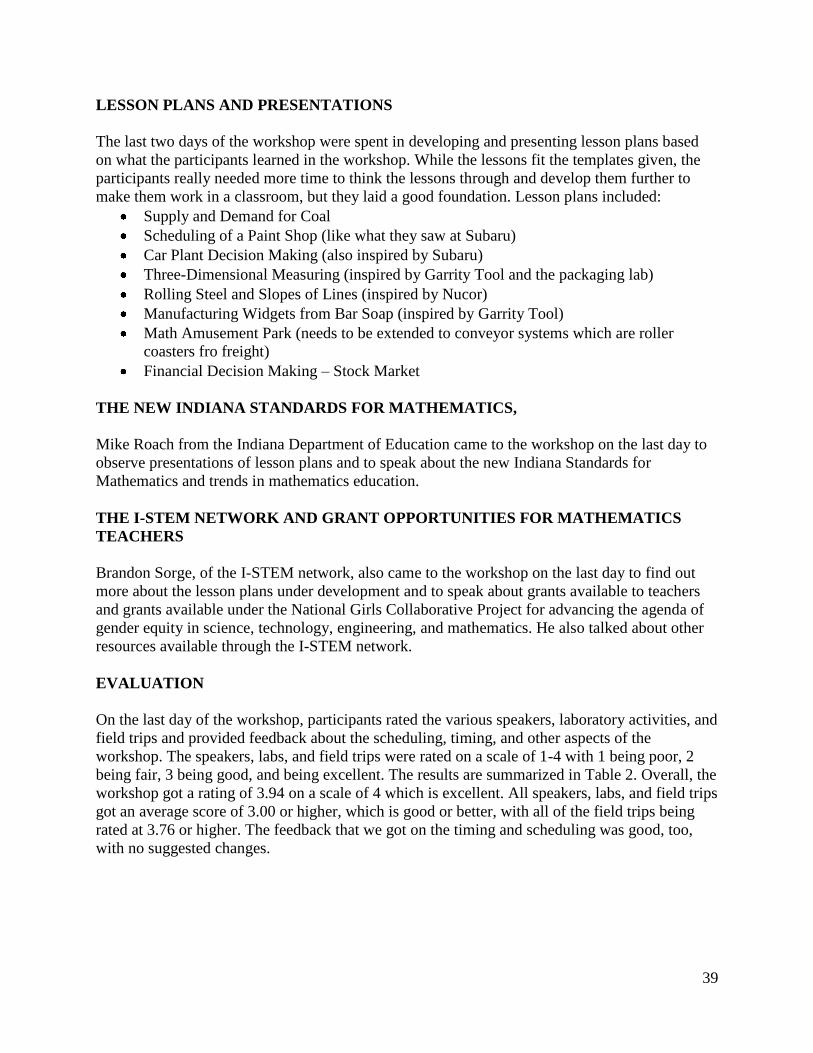
Figure 38. The results of a successfully constructed box
39
LESSON PLANS AND PRESENTATIONS
The last two days of the workshop were spent in developing and presenting lesson plans based
on what the participants learned in the workshop. While the lessons fit the templates given, the
participants really needed more time to think the lessons through and develop them further to
make them work in a classroom, but they laid a good foundation. Lesson plans included:
Supply and Demand for Coal
Scheduling of a Paint Shop (like what they saw at Subaru)
Car Plant Decision Making (also inspired by Subaru)
Three-Dimensional Measuring (inspired by Garrity Tool and the packaging lab)
Rolling Steel and Slopes of Lines (inspired by Nucor)
Manufacturing Widgets from Bar Soap (inspired by Garrity Tool)
Math Amusement Park (needs to be extended to conveyor systems which are roller
coasters fro freight)
Financial Decision Making – Stock Market
THE NEW INDIANA STANDARDS FOR MATHEMATICS,
Mike Roach from the Indiana Department of Education came to the workshop on the last day to
observe presentations of lesson plans and to speak about the new Indiana Standards for
Mathematics and trends in mathematics education.
THE I-STEM NETWORK AND GRANT OPPORTUNITIES FOR MATHEMATICS
TEACHERS
Brandon Sorge, of the I-STEM network, also came to the workshop on the last day to find out
more about the lesson plans under development and to speak about grants available to teachers
and grants available under the National Girls Collaborative Project for advancing the agenda of
gender equity in science, technology, engineering, and mathematics. He also talked about other
resources available through the I-STEM network.
EVALUATION
On the last day of the workshop, participants rated the various speakers, laboratory activities, and
field trips and provided feedback about the scheduling, timing, and other aspects of the
workshop. The speakers, labs, and field trips were rated on a scale of 1-4 with 1 being poor, 2
being fair, 3 being good, and being excellent. The results are summarized in Table 2. Overall, the
workshop got a rating of 3.94 on a scale of 4 which is excellent. All speakers, labs, and field trips
got an average score of 3.00 or higher, which is good or better, with all of the field trips being
rated at 3.76 or higher. The feedback that we got on the timing and scheduling was good, too,
with no suggested changes.
40
Table 2. Workshop Evaluation Summary
Speaker / Fieldtrip Excellent Good Fair Poor No
Response
Avg
Score
Leslie Gardner - Intro to SCM 15 1 1 3.94
Steve Wallen - JIT simulation 12 3 2 3.80
Chris Kelly - JIT sequencing & lean
production
4 8 3 2 3.07
Tim Brown / Leslie Gardner -
Process Design
12 4 1 3.75
Jerry Flatto - Information Systems
and ERP
7 6 3 1 3.25
Nucor Steel 13 2 2 3.87
Garrity Tool 13 4 3.76
John Pennington - ERP and
manufacturing issues
8 8 1 3.50
Claudia Cummings - Conexus
Indiana
10 7 3.59
Subaru 14 2 1 3.88
Nanotechnology Center 13 3 1 3.81
Jim Sharp - Transportation &
Entrepreneurship
13 3 1 3.71
FedEx 13 4 3.76
Scott Willis - Biotechnology 8 8 1 3.50
Andrew Penca - Cummins 12 3 1 1 3.69
Christofer Matney - Global Supply
Chains
8 7 2 3.53
Redcats 12 3 2 3.80
Chris Bratten - RFID 12 4 1 3.75
Leslie Gardner - Beer Game 7 7 1 2 3.40
Tony Welch - Purchasing 4 7 4 2 3.00
Caesar Watkins & Dan
Cunningham - Packaging
12 4 1 3.75
Mike Roach - Indiana DOE 11 6 3.65
Overall workshop rating 16 1 3.94
We also collected data in the workshop evaluation about follow-up mini-workshops in future
years. Having math teachers take a course in advanced manufacturing or robotics in a career
center that would be an intensive version of the courses that offered to high school students could
create more engagement with CTE for teachers of academic subjects. A short workshop on the
science and mathematics behind manufacturing and technology might focus on steel chemistry or
the physics of RFID might involve university faculty from the sciences and use university
laboratory facilities. A mathematical modeling course would be a computer based course to teach
workshop participants more about forecasting, ERP, network algorithms, and linear
programming. Field trips to other manufacturing and logistics facilities might be part of
workshops focused on energy supply chains, medical or life science supply chains, and would
41
include the extraction or production of raw materials which time prohibited us from covering in
detail in this workshop. The workshop participants‟ preferences are summarized in Table 3. Note
that most participants would attend these possible workshops if offered at a time that they could
attend.
Table 3. Follow-up workshop preferences
Would
attend
Might
attend
Would not
attend
Hands on activities such as advanced manufacturing lab,
building a robot, etc
15 2
More information about the science and mathematics
behind manufacturing and technology w/ labs and
simulations.
15 2
Mathematical modeling to support business, manufacturing
and logistics using spreadsheets and software
14 3
Field trips to other manufacturing and logistics facilities. 15 2
IMPROVING THE WORKSHOP
Although the participants did not have suggestions for improvement, the facilitators did. For
every speaker, lab and field trip, the workshop participants filled out a form with lesson ideas.
From these, the facilitators could assess what the workshop participants learned and understood
and what they did not. For field trips of Nucor and Subaru, participants were asked to draw
flowcharts or diagrams of material flow. Providing these diagrams prior to the field trip and
asking participants to take the virtual tour online prior to the field trip might enhance their
experiences. The request to draw material flow diagrams might be reserved for an advanced
follow-up workshop.
The two speakers on information systems really did not adequately cover the nuts and bolts of
ERP in the way that math teachers should understand it. This could be reworked into a computer
lab experience in the future.
The process design workshop could be enhanced by having assembly lines of small individual
pies with changeovers from key lime to chocolate that would require a setup and make
participants deal with setup issues. Additionally, we might include more discussion of bottleneck
operations and how to deal with them.
BUDGET FOR SUPPLY CHAIN TEACHER WORKSHOP
The supply chain teacher workshop came in nearly $6000 below budget because the budget was
for 25 participants and we only had 19 participants, and some of the participants did not attend
every day because of work and family obligations. The budget does not include the project
director‟s time because she was doing a number of other tasks, such as developing plans of
study, interspersed with planning the workshop and this was covered by the summer salary she is
receiving for a number of tasks. This would need to be included in the budget for a future
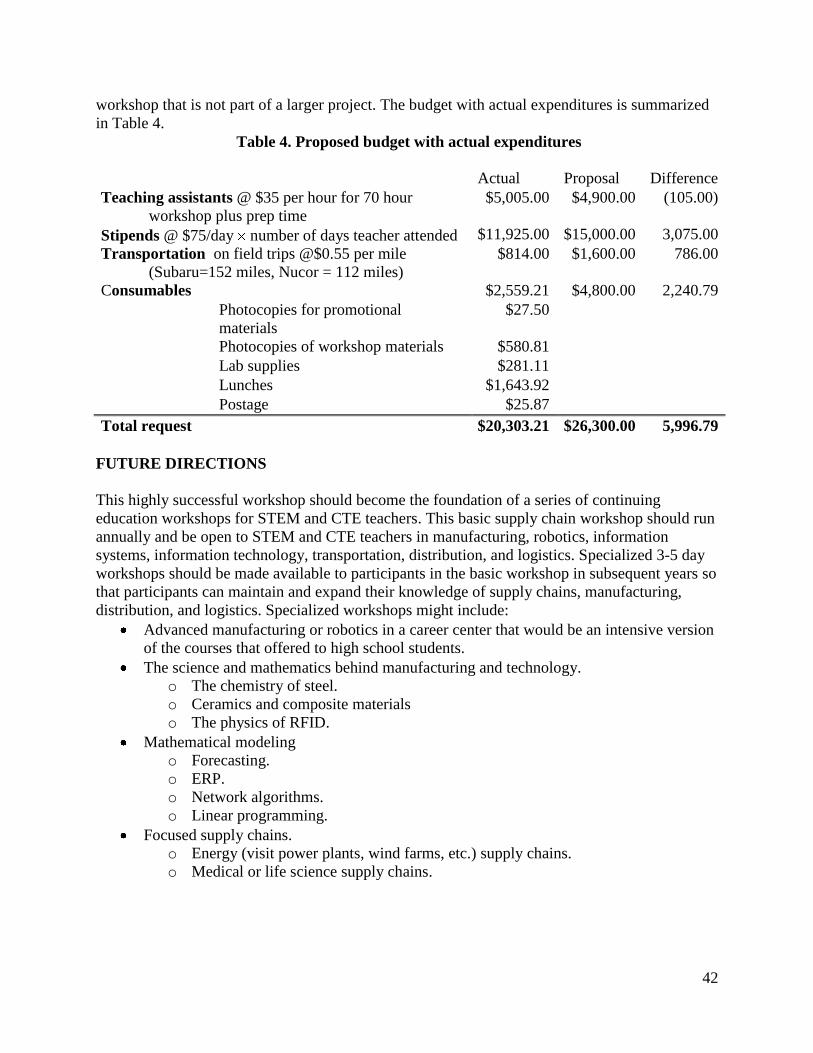
42
workshop that is not part of a larger project. The budget with actual expenditures is summarized
in Table 4.
Table 4. Proposed budget with actual expenditures
Actual Proposal Difference
Teaching assistants @ $35 per hour for 70 hour
workshop plus prep time
$5,005.00 $4,900.00 (105.00)
Stipends @ $75/day number of days teacher attended $11,925.00 $15,000.00 3,075.00
Transportation on field trips @$0.55 per mile
(Subaru=152 miles, Nucor = 112 miles)
$814.00 $1,600.00 786.00
Consumables $2,559.21 $4,800.00 2,240.79
Photocopies for promotional
materials
$27.50
Photocopies of workshop materials $580.81
Lab supplies $281.11
Lunches $1,643.92
Postage $25.87
Total request $20,303.21 $26,300.00 5,996.79
FUTURE DIRECTIONS
This highly successful workshop should become the foundation of a series of continuing
education workshops for STEM and CTE teachers. This basic supply chain workshop should run
annually and be open to STEM and CTE teachers in manufacturing, robotics, information
systems, information technology, transportation, distribution, and logistics. Specialized 3-5 day
workshops should be made available to participants in the basic workshop in subsequent years so
that participants can maintain and expand their knowledge of supply chains, manufacturing,
distribution, and logistics. Specialized workshops might include:
Advanced manufacturing or robotics in a career center that would be an intensive version
of the courses that offered to high school students.
The science and mathematics behind manufacturing and technology.
o The chemistry of steel.
o Ceramics and composite materials
o The physics of RFID.
Mathematical modeling
o Forecasting.
o ERP.
o Network algorithms.
o Linear programming.
Focused supply chains.
o Energy (visit power plants, wind farms, etc.) supply chains.
o Medical or life science supply chains.
Related Documents