Supply Chain Maturity Study Summary Charts June-July 2015

Supply Chain Maturity Study Summary Charts June-July 2015.
Jan 02, 2016
Welcome message from author
This document is posted to help you gain knowledge. Please leave a comment to let me know what you think about it! Share it to your friends and learn new things together.
Transcript

Supply Chain Maturity Study
Summary ChartsJune-July 2015
Supply Chain Insights LLC Copyright © 2015, p. 2
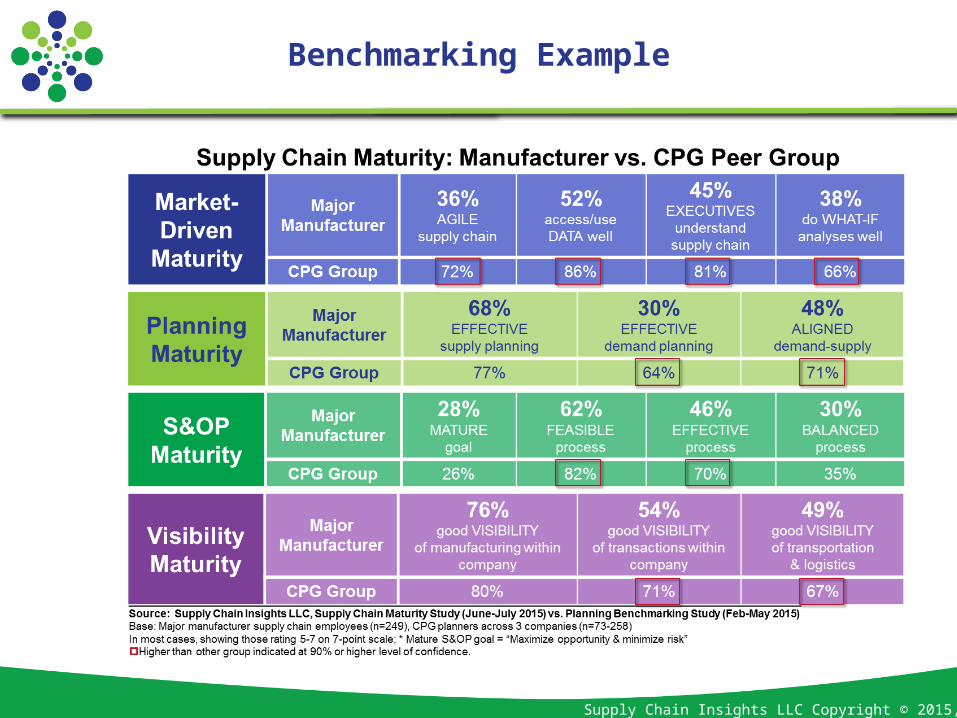
Benchmarking Example

Supply Chain Insights LLC Copyright © 2015, p. 3
Alignment

Supply Chain Insights LLC Copyright © 2015, p. 4
Alignment Comparison

Supply Chain Insights LLC Copyright © 2015, p. 5
Visibility Comparison

Supply Chain Insights LLC Copyright © 2015, p. 6
S&OP Effectiveness:By Company/Division
Supply Chain Insights LLC Copyright © 2015, p. 7
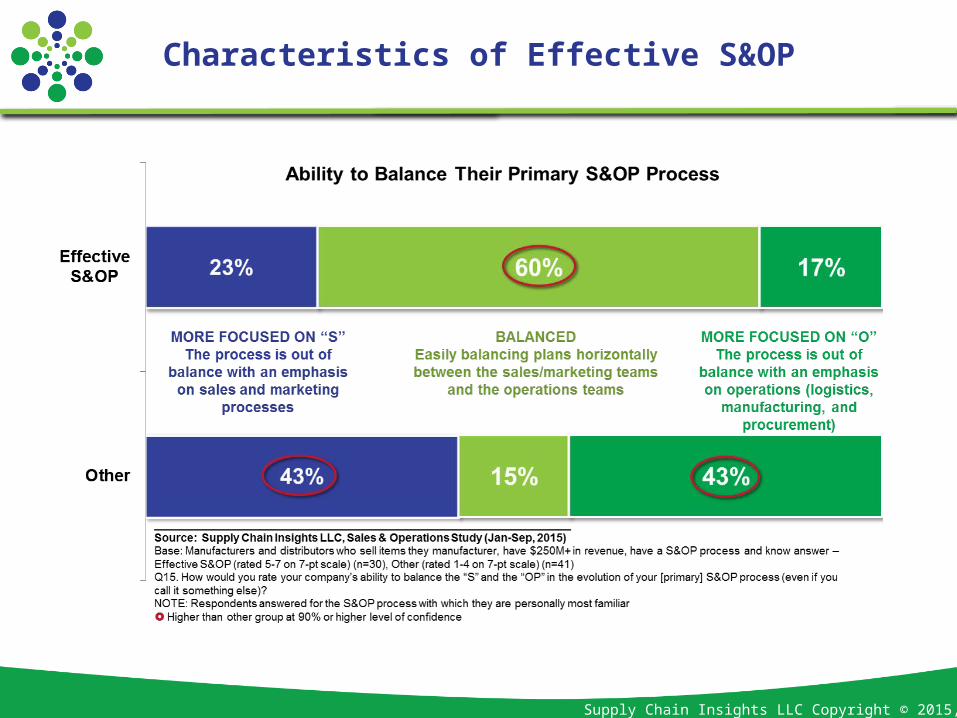
Characteristics of Effective S&OP

Supply Chain Insights LLC Copyright © 2015, p. 8
Planning Benchmarking Peer Group

Supply Chain Insights LLC Copyright © 2015, p. 9
Sales and Supply Chain Alignment:By Company/Division

Supply Chain Insights LLC Copyright © 2015, p. 10
Demand/Supply Alignment:By Company/Division
Related Documents