SUPPLY AND DEMAND: HOW MARKETS WORK © Dusit/Shutterstock 2 NEL 30853_04_CH04.indd 65 03/09/13 5:57 PM FOR REVIEW ONLY

Welcome message from author
This document is posted to help you gain knowledge. Please leave a comment to let me know what you think about it! Share it to your friends and learn new things together.
Transcript

NELNEL
PO/PT5SuPPly and demand: HOw markeTS wOrk
© Dusit/Shutterstock
2
NEL
30853_04_CH04.indd 65 03/09/13 5:57 PM
FOR REVIEW ONLY

30853_04_CH04.indd 66 03/09/13 5:57 PM
FOR REVIEW ONLY
In this chapter, you will …
● Learn the nature of a com-petitive market
● Examine what determines the demand for a good in a competitive market
● Examine what determines the supply of a good in a competitive market
● See how supply and demand together set the price of a good and the quantity sold
● Consider the key role of prices in allocating scarce resources in market economies
When a cold snap hits Florida, the price of orange juice rises in supermarkets throughout Canada. When the weather turns warm in Quebec every summer, the price of hotel rooms in the Caribbean plummets. When a war breaks out in the Middle East, the price of gasoline in Canada rises and the price of a used SUV falls. What do these events have in common? They all show the workings of supply and demand. Supply and demand are the two words that economists use most often—and for good reason. Supply and demand are the forces that make market economies work. They determine the quantity of each good produced and the price at which it is sold. If you want to know how any event or policy will affect the economy, you must think first about how it will affect supply and demand. This chapter introduces the theory of supply and demand. It considers how buyers and sellers behave and how they interact with one another. It shows how supply and demand determine prices in a market economy and how prices, in turn, allocate the economy’s scarce resources.
Learning Objectives
THe markeT FOrceS OF SuPPly and demand
© D
usit/
Shu
tters
tock
4
NEL
30853_04_CH04.indd 67 03/09/13 5:57 PM
FOR REVIEW ONLY
68 PART 2 SuPPly And demAnd: How mARkeTS woRk
NEL
markeTS and cOmPeTiTiOn
The terms supply and demand refer to the behaviour of people as they interact with one another in competitive markets. Before discussing how buyers and sellers behave, let’s first consider more fully what we mean by a “market” and “competition.”
what is a market?
A market is a group of buyers and sellers of a particular good or service. The buyers as a group determine the demand for the product, and the sellers as a group determine the supply of the product. Markets take many forms. Some markets are highly organized, such as the markets for many agricultural commodities. In these markets, buyers and sellers meet at a specific time and place, where an auctioneer helps set prices and arrange sales. More often, markets are less organized. For example, consider the market for ice cream in a particular town. Buyers of ice cream do not meet together at any one time. The sellers of ice cream are in different locations and offer somewhat different products. There is no auctioneer calling out the price of ice cream. Each seller posts a price for an ice-cream cone, and each buyer decides how much ice cream to buy at each store. Nonetheless, these consumers and producers of ice cream are closely connected. The ice-cream buyers are choosing from the various ice-cream sellers to satisfy their craving, and the ice-cream sellers are all trying to appeal to the same ice-cream buyers to make their businesses successful. Even though it is not as orga-nized, the group of ice-cream buyers and ice-cream sellers forms a market.
what is competition?
The market for ice cream, like most markets in the economy, is highly competitive. Each buyer knows that there are several sellers from which to choose, and each seller is aware that his product is similar to that offered by other sellers. As a result, the price of ice cream and the quantity of ice cream sold are not determined by any single buyer or seller. Rather, price and quantity are determined by all buyers and sellers as they interact in the marketplace. Economists use the term competitive market to describe a market in which there are so many buyers and so many sellers that each has a negligible impact on the market price. Each seller of ice cream has limited control over the price because other sellers are offering similar products. A seller has little reason to charge less than the going price, and if he charges more, buyers will make their purchases elsewhere. Similarly, no single buyer of ice cream can influence the price of ice cream because each buyer purchases only a small amount. In this chapter, we assume that markets are perfectly competitive. To reach this highest form of competition, a market must have two characteristics: (1) the goods offered for sale are all exactly the same, and (2) the buyers and sellers are so numerous that no single buyer or seller has any influence over the market price. Because buyers and sellers in perfectly competitive markets must accept the price the market determines, they are said to be price takers. At the market price, buyers can buy all they want, and sellers can sell all they want.
marketa group of buyers and sellers of a particular good or service
competitive marketa market in which there are many buyers and many sellers so that each has a negligible impact on the market price
30853_04_CH04.indd 68 03/09/13 5:57 PM
FOR REVIEW ONLY
69 CHAPTeR 4 THe mARkeT FoRCeS oF SuPPly And demAnd
NEL
There are some markets in which the assumption of perfect competition applies perfectly. In the wheat market, for example, there are thousands of farmers who sell wheat and millions of consumers who use wheat and wheat products. Because no single buyer or seller can influence the price of wheat, each takes the price as given. Not all goods and services, however, are sold in perfectly competitive mar-kets. Some markets have only one seller, and this seller sets the price. Such a seller is called a monopoly. Your local cable television company, for instance, may be a monopoly. Residents of your small town probably have only one cable company from which to buy this service. Still other markets fall between the extremes of perfect competition and monopoly. Despite the diversity of market types we find in the world, assuming perfect competition is a useful simplification and, therefore, a natural place to start. Perfectly competitive markets are the easiest to analyze because everyone par-ticipating in the market takes the price as given by market conditions. Moreover, because some degree of competition is present in most markets, many of the les-sons that we learn by studying supply and demand under perfect competition apply in more complicated markets as well.
QuickQuiz What is a market? ● What are the characteristics of a competitive market?
demand
We begin our study of markets by examining the behaviour of buyers. To focus our thinking, let’s keep in mind a particular good—ice cream.
The demand curve: The relationship between Price and Quantity demanded
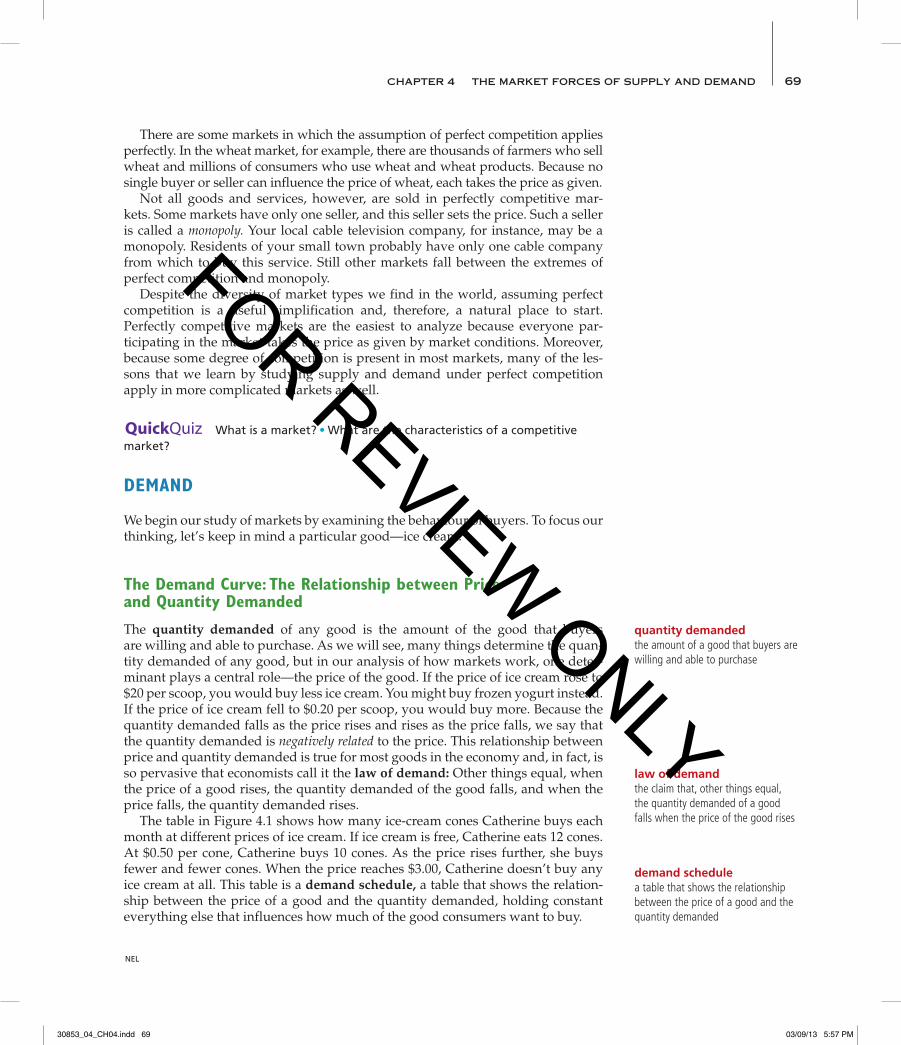
The quantity demanded of any good is the amount of the good that buyers are willing and able to purchase. As we will see, many things determine the quan-tity demanded of any good, but in our analysis of how markets work, one deter-minant plays a central role—the price of the good. If the price of ice cream rose to $20 per scoop, you would buy less ice cream. You might buy frozen yogurt instead. If the price of ice cream fell to $0.20 per scoop, you would buy more. Because the quantity demanded falls as the price rises and rises as the price falls, we say that the quantity demanded is negatively related to the price. This relationship between price and quantity demanded is true for most goods in the economy and, in fact, is so pervasive that economists call it the law of demand: Other things equal, when the price of a good rises, the quantity demanded of the good falls, and when the price falls, the quantity demanded rises. The table in Figure 4.1 shows how many ice-cream cones Catherine buys each month at different prices of ice cream. If ice cream is free, Catherine eats 12 cones. At $0.50 per cone, Catherine buys 10 cones. As the price rises further, she buys fewer and fewer cones. When the price reaches $3.00, Catherine doesn’t buy any ice cream at all. This table is a demand schedule, a table that shows the relation-ship between the price of a good and the quantity demanded, holding constant everything else that influences how much of the good consumers want to buy.
quantity demandedthe amount of a good that buyers are willing and able to purchase
law of demandthe claim that, other things equal, the quantity demanded of a good falls when the price of the good rises
demand schedulea table that shows the relationship between the price of a good and the quantity demanded
30853_04_CH04.indd 69 03/09/13 5:57 PM
FOR REVIEW ONLY
70 PART 2 SuPPly And demAnd: How mARkeTS woRk
NEL
The graph in Figure 4.1 uses the numbers from the table to illustrate the law of demand. By convention, the price of ice cream is on the vertical axis, and the quantity of ice cream demanded is on the horizontal axis. The downward-sloping line relating price and quantity demanded is called the demand curve.
market demand versus individual demand
The demand curve in Figure 4.1 shows an individual’s demand for a product. To analyze how markets work, we need to determine the market demand, which is the sum of all the individual demands for a particular good or service. The table in Figure 4.2 shows the demand schedules for ice cream of two individuals—Catherine and Nicholas. At any price, Catherine’s demand schedule tells us how much ice cream she buys, and Nicholas’s demand schedule tells us how much ice cream he buys. The market demand at each price is the sum of the two individual demands. The graph in Figure 4.2 shows the demand curves that correspond to these demand schedules. Notice that we sum the individual demand curves horizontally to obtain the market demand curve. That is, to find the total quantity demanded at any price, we add the individual quantities found on the horizontal axis of the indi-vidual demand curves. Because we are interested in analyzing how markets work,
demand curvea graph of the relationship between the price of a good and the quantity demanded
Price ofIce-Cream Cone
0
2.50
2.00
1.50
1.00
0.50
1 2 3 4 5 6 7 8 9 10 11 Quantity ofIce-Cream Cones
$3.00
12
1. A decrease in price . . .
2. . . . increases quantity of cones demanded.
Catherine’s Demand Schedule and Demand Curve
The demand schedule shows the quantity demanded at each price. The demand curve, which graphs the demand schedule, shows how the quantity demanded of the good changes as its price varies. Because a lower price increases the quantity demanded, the demand curve slopes downward.
FIGuRe 4.1
Price of Quantity of Ice-Cream Cone Cones Demanded
$0.00 12 0.50 10 1.00 8 1.50 6 2.00 4 2.50 2 3.00 0
30853_04_CH04.indd 70 03/09/13 5:57 PM
FOR REVIEW ONLY

71 CHAPTeR 4 THe mARkeT FoRCeS oF SuPPly And demAnd
NEL
we will work most often with the market demand curve. The market demand curve shows how the total quantity demanded of a good varies as the price of the good varies, while all the other factors that affect how much consumers want to buy are held constant.
Shifts in the demand curve
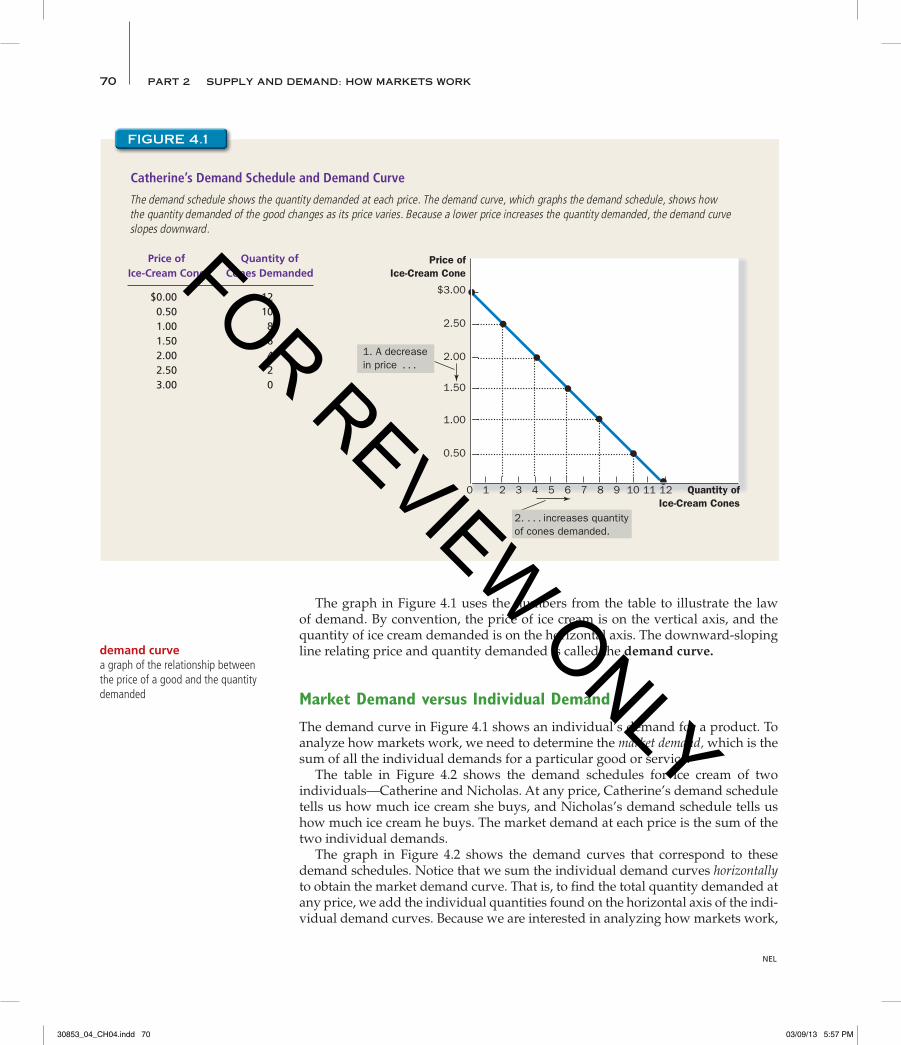
The demand curve for ice cream shows how much ice cream people buy at any given price, holding constant the many other factors beyond price that influence consumers’ buying decisions. As a result, this demand curve need not be stable over time. If something happens to alter the quantity demanded at any given price, the demand curve shifts. For example, suppose the Canadian Medical Association discovered that people who regularly eat ice cream live longer, healthier lives. The discovery would raise the demand for ice cream. At any given price, buyers would now want to purchase a larger quantity of ice cream, and the demand curve for ice cream would shift. Figure 4.3 illustrates shifts in demand. Any change that increases the quan-tity demanded at every price, such as our imaginary discovery by the Canadian Medical Association, shifts the demand curve to the right and is called an increase
Market Demand as the Sum of Individual Demands
The quantity demanded in a market is the sum of the quantities demanded by all the buyers at each price. Thus, the market demand curve is found by adding horizontally the individual demand curves. At a price of $2, Catherine demands 4 ice-cream cones, and Nicholas demands 3 ice-cream cones. The quantity demanded in the market at this price is 7 cones.
FIGuRe 4.2
Price of Ice-Cream Cone Catherine Nicholas Market
$0.00 12 1 7 5 19 0.50 10 6 16 1.00 8 5 13 1.50 6 4 10 2.00 4 3 7 2.50 2 2 4 3.00 0 1 1
Price ofIce-Cream
Cone
Price ofIce-Cream
Cone
Price ofIce-Cream
Cone
$3.00
2.50
2.00
1.50
1.00
0.50
0 1 2 3 4 5 6
Quantity of Ice-Cream Cones
DCatherine
7 8 9 10 11 12
Catherine’s Demand Nicholas’s Demand Market Demand+ =
$3.00
2.50
2.00
1.50
1.00
0.50
0 1 2 3 4 5 6
Quantity of Ice-Cream Cones
7 8 9 10 11 12
$3.00
2.50
2.00
1.50
1.00
0.50
0 2 4 6
Quantity of Ice-Cream Cones
8 10 12 14 16 18
DNicholas
DMarket
30853_04_CH04.indd 71 03/09/13 5:57 PM
FOR REVIEW ONLY
72 PART 2 SuPPly And demAnd: How mARkeTS woRk
NEL
in demand. Any change that reduces the quantity demanded at every price shifts the demand curve to the left and is called a decrease in demand. There are many variables that can shift the demand curve. Here are the most important:
Income What would happen to your demand for ice cream if you lost your job one summer? Most likely, it would fall. A lower income means that you have less to spend in total, so you would have to spend less on some—and probably most—goods. If the demand for a good falls when income falls, the good is called a normal good. Not all goods are normal goods. If the demand for a good rises when income falls, the good is called an inferior good. An example of an inferior good might be bus rides. As your income falls, you are less likely to buy a car or take a cab, and more likely to ride the bus.
Prices of Related Goods Suppose that the price of frozen yogurt falls. The law of demand says that you will buy more frozen yogurt. At the same time, you will probably buy less ice cream. Because ice cream and frozen yogurt are both cold, sweet, creamy desserts, they satisfy similar desires. When a fall in the price of one good reduces the demand for another good, the two goods are called substitutes. Substitutes are often pairs of goods that are used in place of each other, such as hot dogs and hamburgers, sweaters and sweatshirts, and movie tickets and DVD rentals. Now suppose that the price of hot fudge falls. According to the law of demand, you will buy more hot fudge. Yet, in this case, you will buy more ice cream as well because ice cream and hot fudge are often used together. When a fall in the price of one good raises the demand for another good, the two goods are called
normal gooda good for which, other things equal, an increase in income leads to an increase in demand
inferior gooda good for which, other things equal, an increase in income leads to a decrease in demand
substitutestwo goods for which an increase in the price of one leads to an increase in the demand for the other
Price ofIce-Cream
Cone
Quantity ofIce-Cream Cones
Increasein demand
Decreasein demand
Demand curve, D3
Demandcurve, D1
Demandcurve, D2
0
Shifts in the Demand Curve
Any change that raises the quantity that buyers wish to purchase at a given price shifts the demand curve to the right. Any change that lowers the quantity that buyers wish to purchase at a given price shifts the demand curve to the left.
FIGuRe 4.3
30853_04_CH04.indd 72 03/09/13 5:57 PM
FOR REVIEW ONLY
73 CHAPTeR 4 THe mARkeT FoRCeS oF SuPPly And demAnd
NEL
complements. Complements are often pairs of goods that are used together, such as gasoline and automobiles, computers and software, and peanut butter and jelly.
Tastes The most obvious determinant of your demand is your tastes. If you like ice cream, you buy more of it. Economists normally do not try to explain people’s tastes because tastes are based on historical and psychological forces that are beyond the realm of economics. Economists do, however, examine what happens when tastes change.
Expectations Your expectations about the future may affect your demand for a good or service today. If you expect to earn a higher income next month, you may be more willing to spend some of your current savings buying ice cream. If you expect the price of ice cream to fall tomorrow, you may be less willing to buy an ice-cream cone at today’s price.
Number of Buyers In addition to the preceding factors, which influence the behaviour of individual buyers, market demand depends on the number of these buyers. If Peter, another consumer of ice cream, were to join Catherine and Nicholas, the quantity demanded in the market would be higher at every price and the demand curve would shift to the right.
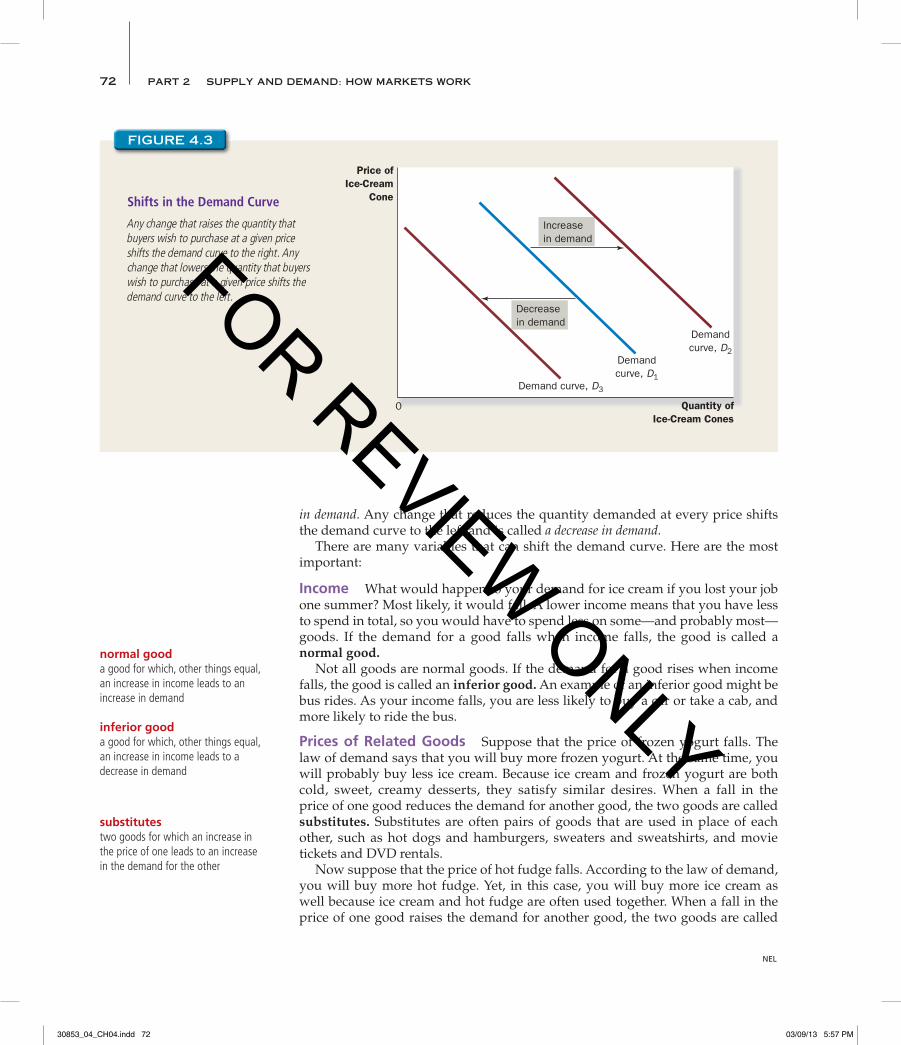
Summary The demand curve shows what happens to the quantity demanded of a good when its price varies, holding constant all the other variables that influ-ence buyers. When one of these other variables changes, the demand curve shifts. Table 4.1 lists all the variables that influence how much consumers choose to buy of a good. If you have trouble remembering whether you need to shift or move along the demand curve, it helps to recall a lesson from the appendix to Chapter 2. A curve shifts when there is a change in a relevant variable that is not measured on either axis. Because the price is on the vertical axis, a change in price represents a move-ment along the demand curve. By contrast, income, the prices of related goods, tastes, expectations, and the number of buyers are not measured on either axis, so a change in one of these variables shifts the demand curve.
complementstwo goods for which an increase in the price of one leads to a decrease in the demand for the other
TABle 4.1
Variables That Influence Buyers
This table lists the variables that affect how much consumers choose to buy of any good. Notice the special role that the price of the good plays: A change in the good’s price represents a movement along the demand curve, whereas a change in one of the other variables shifts the demand curve.
Variable A Change in This Variable . . .
Price of the good itself Represents a movement along the demand curveIncome Shifts the demand curvePrices of related goods Shifts the demand curveTastes Shifts the demand curveExpectations Shifts the demand curveNumber of buyers Shifts the demand curve
30853_04_CH04.indd 73 03/09/13 5:57 PM
FOR REVIEW ONLY
74 PART 2 SuPPly And demAnd: How mARkeTS woRk
NEL
Case Study
Two wAyS To REDuCE ThE QuANTITy of SMokING DEMANDED
Public policymakers often want to reduce the amount that people smoke because of smoking’s adverse health effects. There are two ways that policy can attempt to achieve this goal. One way to reduce smoking is to shift the demand curve for cigarettes and other tobacco products. Public service announcements, mandatory health warn-ings on cigarette packages, and the prohibition of cigarette advertising on televi-sion are all policies aimed at reducing the quantity of cigarettes demanded at any given price. If successful, these policies shift the demand curve for cigarettes to the left, as in panel (a) of Figure 4.4. Alternatively, policymakers can try to raise the price of cigarettes. If the gov-ernment taxes the manufacture of cigarettes, for example, cigarette companies pass much of this tax on to consumers in the form of higher prices. A higher price encourages smokers to reduce the number of cigarettes they smoke. In this case, the reduced amount of smoking does not represent a shift in the demand curve. Instead, it represents a movement along the same demand curve to a point with a higher price and lower quantity, as in panel (b) of Figure 4.4.What is the best way
to stop this?
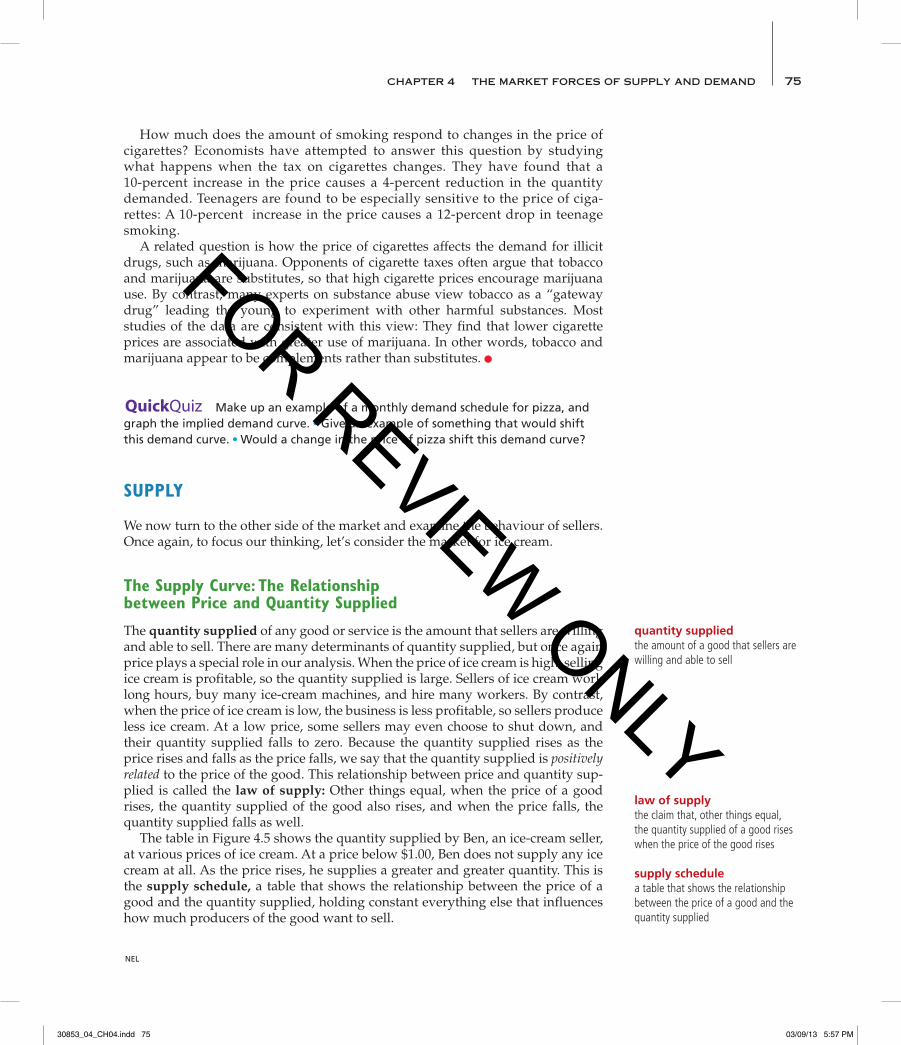
Shifts in the Demand Curve versus Movements along the Demand Curve
If warnings on cigarette packages convince smokers to smoke less, the demand curve for cigarettes shifts to the left. In panel (a), the demand curve shifts from D1 to D2. At a price of $10.00 per pack, the quantity demanded falls from 20 to 10 cigarettes per day, as reflected by the shift from point A to point B. By contrast, if a tax raises the price of cigarettes, the demand curve does not shift. Instead, we observe a move-ment to a different point on the demand curve. In panel (b), when the price rises from $10.00 to $20.00, the quantity demanded falls from 20 to 12 cigarettes per day, as reflected by the movement from point A to point C.
FIGuRe 4.4
D2
D1
0 10 20
$10.00B A
(a) A Shift in the Demand Curve
A policy to discouragesmoking shifts the demand curve to the left.
Number of Cigarettes Smoked per Day
Price ofCigarettes,
per Pack
D1
0 12 20
10.00
$20.00 C
A
(b) A Movement along the Demand Curve
Number of Cigarettes Smoked per Day
Price ofCigarettes,
per Pack
A tax that raises theprice of cigarettesresults in a movement along the demand curve.
© M
aliv
an_I
uliia
/Shu
tters
tock
30853_04_CH04.indd 74 03/09/13 5:57 PM
FOR REVIEW ONLY
75 CHAPTeR 4 THe mARkeT FoRCeS oF SuPPly And demAnd
NEL
How much does the amount of smoking respond to changes in the price of cigarettes? Economists have attempted to answer this question by studying what happens when the tax on cigarettes changes. They have found that a 10-percent increase in the price causes a 4-percent reduction in the quantity demanded. Teenagers are found to be especially sensitive to the price of ciga-rettes: A 10-percent increase in the price causes a 12-percent drop in teenage smoking. A related question is how the price of cigarettes affects the demand for illicit drugs, such as marijuana. Opponents of cigarette taxes often argue that tobacco and marijuana are substitutes, so that high cigarette prices encourage marijuana use. By contrast, many experts on substance abuse view tobacco as a “gateway drug” leading the young to experiment with other harmful substances. Most studies of the data are consistent with this view: They find that lower cigarette prices are associated with greater use of marijuana. In other words, tobacco and marijuana appear to be complements rather than substitutes.
QuickQuiz Make up an example of a monthly demand schedule for pizza, and graph the implied demand curve. ● Give an example of something that would shift this demand curve. ● Would a change in the price of pizza shift this demand curve?
SuPPly
We now turn to the other side of the market and examine the behaviour of sellers. Once again, to focus our thinking, let’s consider the market for ice cream.
The Supply curve: The relationship between Price and Quantity Supplied
The quantity supplied of any good or service is the amount that sellers are willing and able to sell. There are many determinants of quantity supplied, but once again price plays a special role in our analysis. When the price of ice cream is high, selling ice cream is profitable, so the quantity supplied is large. Sellers of ice cream work long hours, buy many ice-cream machines, and hire many workers. By contrast, when the price of ice cream is low, the business is less profitable, so sellers produce less ice cream. At a low price, some sellers may even choose to shut down, and their quantity supplied falls to zero. Because the quantity supplied rises as the price rises and falls as the price falls, we say that the quantity supplied is positively related to the price of the good. This relationship between price and quantity sup-plied is called the law of supply: Other things equal, when the price of a good rises, the quantity supplied of the good also rises, and when the price falls, the quantity supplied falls as well. The table in Figure 4.5 shows the quantity supplied by Ben, an ice-cream seller, at various prices of ice cream. At a price below $1.00, Ben does not supply any ice cream at all. As the price rises, he supplies a greater and greater quantity. This is the supply schedule, a table that shows the relationship between the price of a good and the quantity supplied, holding constant everything else that influences how much producers of the good want to sell.
quantity suppliedthe amount of a good that sellers are willing and able to sell
law of supplythe claim that, other things equal, the quantity supplied of a good rises when the price of the good rises
supply schedulea table that shows the relationship between the price of a good and the quantity supplied
30853_04_CH04.indd 75 03/09/13 5:57 PM
FOR REVIEW ONLY
76 PART 2 SuPPly And demAnd: How mARkeTS woRk
NEL
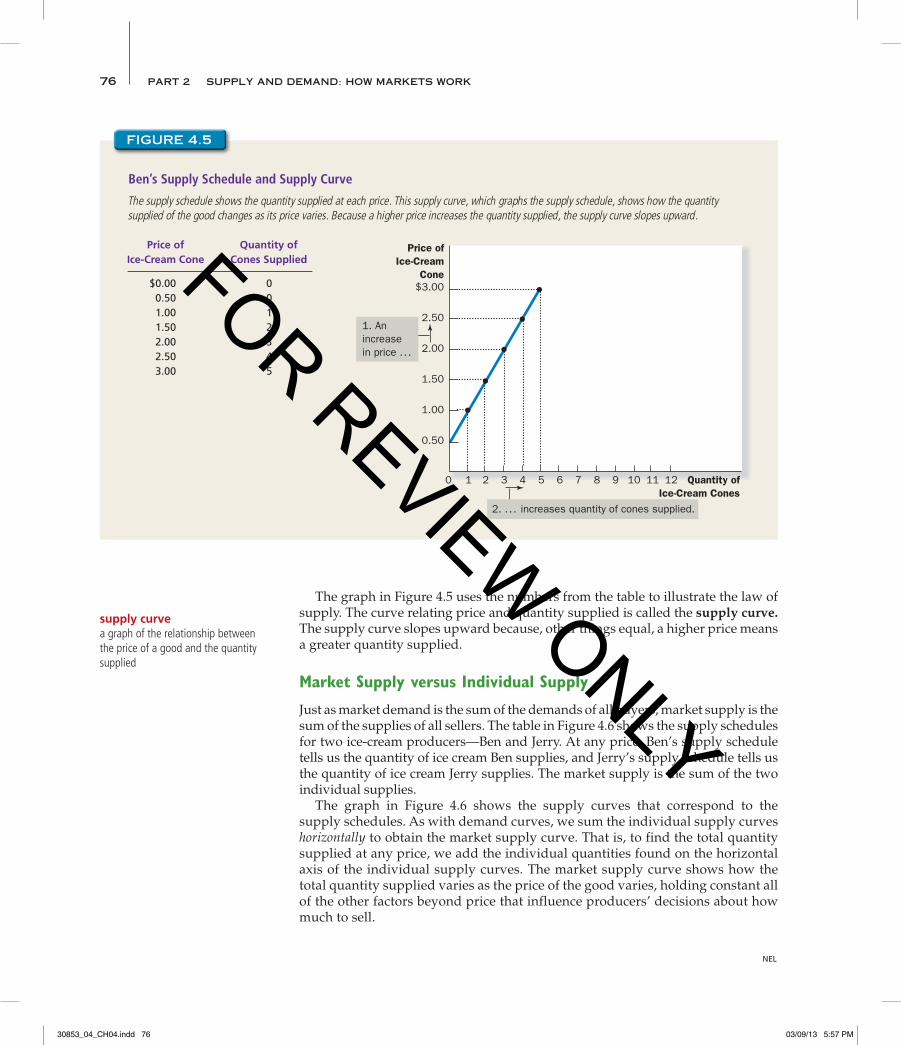
The graph in Figure 4.5 uses the numbers from the table to illustrate the law of supply. The curve relating price and quantity supplied is called the supply curve. The supply curve slopes upward because, other things equal, a higher price means a greater quantity supplied.
market Supply versus individual Supply
Just as market demand is the sum of the demands of all buyers, market supply is the sum of the supplies of all sellers. The table in Figure 4.6 shows the supply schedules for two ice-cream producers—Ben and Jerry. At any price, Ben’s supply schedule tells us the quantity of ice cream Ben supplies, and Jerry’s supply schedule tells us the quantity of ice cream Jerry supplies. The market supply is the sum of the two individual supplies. The graph in Figure 4.6 shows the supply curves that correspond to the supply schedules. As with demand curves, we sum the individual supply curves horizontally to obtain the market supply curve. That is, to find the total quantity supplied at any price, we add the individual quantities found on the horizontal axis of the individual supply curves. The market supply curve shows how the total quantity supplied varies as the price of the good varies, holding constant all of the other factors beyond price that influence producers’ decisions about how much to sell.
supply curvea graph of the relationship between the price of a good and the quantity supplied
Price ofIce-Cream
Cone
0
2.50
2.00
1.50
1.00
1 2 3 4 5 6 7 8 9 10 11 Quantity ofIce-Cream Cones
$3.00
12
0.50
1. Anincreasein price . . .
2. . . . increases quantity of cones supplied.
Ben’s Supply Schedule and Supply Curve
The supply schedule shows the quantity supplied at each price. This supply curve, which graphs the supply schedule, shows how the quantity supplied of the good changes as its price varies. Because a higher price increases the quantity supplied, the supply curve slopes upward.
FIGuRe 4.5
Price of Quantity of Ice-Cream Cone Cones Supplied
$0.00 0 0.50 0 1.00 1 1.50 2 2.00 3 2.50 4 3.00 5
30853_04_CH04.indd 76 03/09/13 5:57 PM
FOR REVIEW ONLY
77 CHAPTeR 4 THe mARkeT FoRCeS oF SuPPly And demAnd
NEL
Shifts in the Supply curve
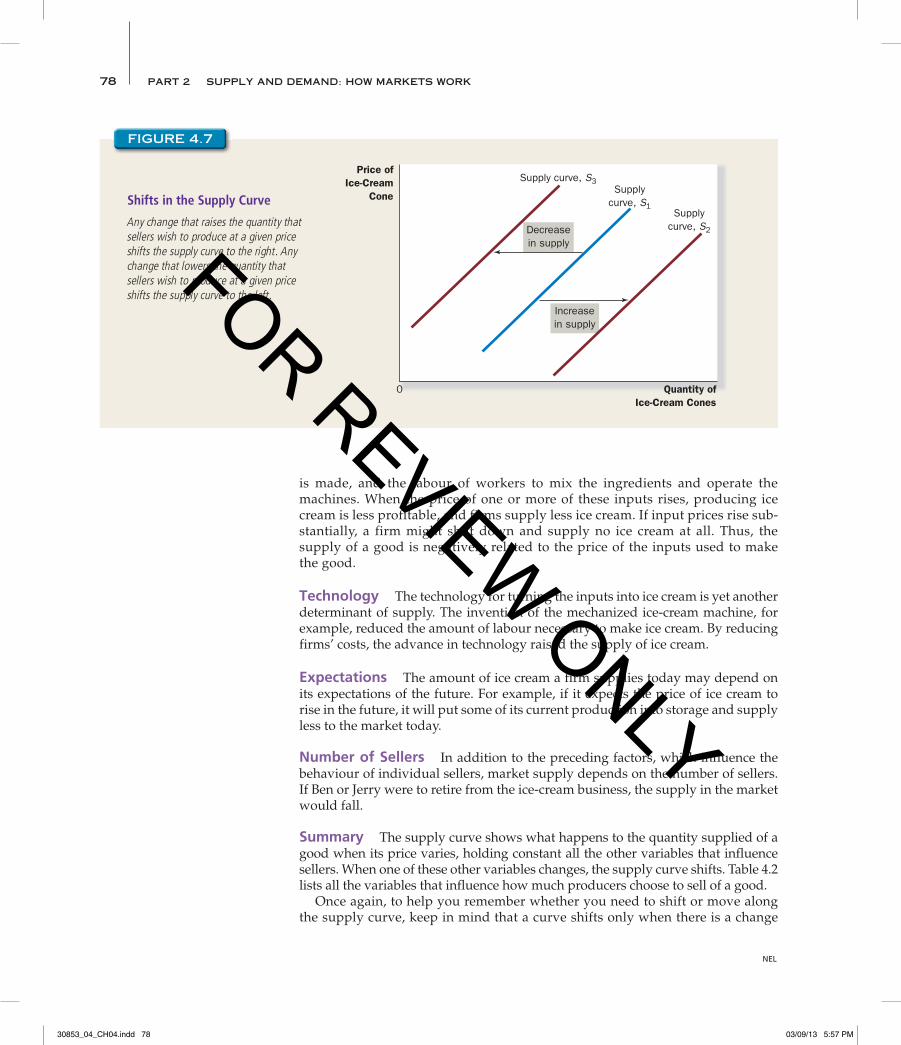
Because the market supply curve holds other things constant, the curve shifts when one of these factors changes. For example, suppose the price of sugar falls. Sugar is an input into producing ice cream, so the fall in the price of sugar makes selling ice cream more profitable. This raises the supply of ice cream: At any given price, sellers are now willing to produce a larger quantity. Thus, the supply curve for ice cream shifts to the right. Figure 4.7 illustrates shifts in supply. Any change that raises quantity supplied at every price, such as a fall in the price of sugar, shifts the supply curve to the right and is called an increase in supply. Similarly, any change that reduces the quantity supplied at every price shifts the supply curve to the left and is called a decrease in supply. There are many variables that can shift the supply curve. Here are some of the most important variables:
Input Prices To produce their output of ice cream, sellers use various inputs: cream, sugar, flavouring, ice-cream machines, the buildings in which the ice cream
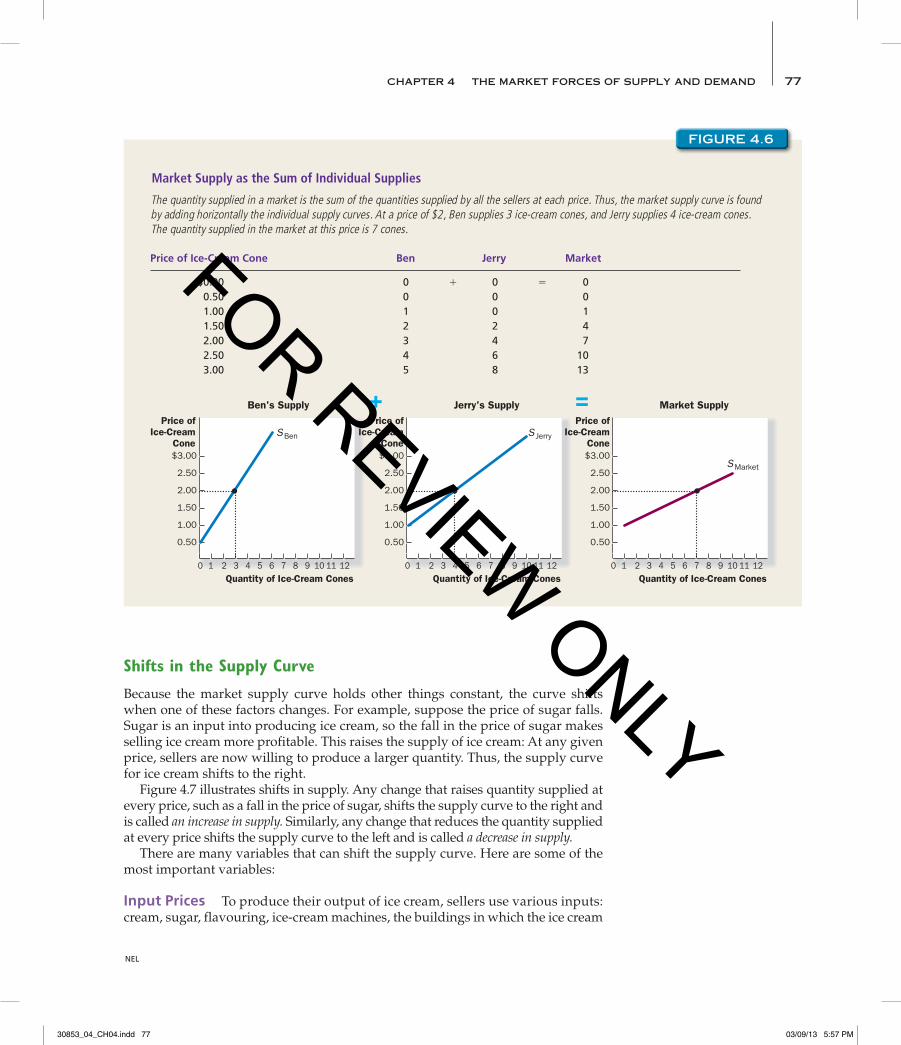
Market Supply as the Sum of Individual Supplies
The quantity supplied in a market is the sum of the quantities supplied by all the sellers at each price. Thus, the market supply curve is found by adding horizontally the individual supply curves. At a price of $2, Ben supplies 3 ice-cream cones, and Jerry supplies 4 ice-cream cones. The quantity supplied in the market at this price is 7 cones.
FIGuRe 4.6
Price of Ice-Cream Cone Ben Jerry Market
$0.00 0 1 0 5 0 0.50 0 0 0 1.00 1 0 1 1.50 2 2 4 2.00 3 4 7 2.50 4 6 10 3.00 5 8 13
$3.00
2.50
2.00
1.50
1.00
0.50
0 1 2 3 4 5 6
Quantity of Ice-Cream Cones7 8 9 10 11 12
Ben's Supply Jerry's Supply Market Supply+ =Price of
Ice-CreamCone
Price ofIce-Cream
Cone
Price ofIce-Cream
Cone$3.00
2.50
2.00
1.50
1.00
0.50
0 1 2 3 4 5 6
Quantity of Ice-Cream Cones7 8 9 10 11 12
$3.00
2.50
2.00
1.50
1.00
0.50
0 1 2 3 4 5 6
Quantity of Ice-Cream Cones7 8 9 10 11 12
SBen S Jerry
SMarket
30853_04_CH04.indd 77 03/09/13 5:57 PM
FOR REVIEW ONLY
78 PART 2 SuPPly And demAnd: How mARkeTS woRk
NEL
is made, and the labour of workers to mix the ingredients and operate the machines. When the price of one or more of these inputs rises, producing ice cream is less profitable, and firms supply less ice cream. If input prices rise sub-stantially, a firm might shut down and supply no ice cream at all. Thus, the supply of a good is negatively related to the price of the inputs used to make the good.
Technology The technology for turning the inputs into ice cream is yet another determinant of supply. The invention of the mechanized ice-cream machine, for example, reduced the amount of labour necessary to make ice cream. By reducing firms’ costs, the advance in technology raised the supply of ice cream.
Expectations The amount of ice cream a firm supplies today may depend on its expectations of the future. For example, if it expects the price of ice cream to rise in the future, it will put some of its current production into storage and supply less to the market today.
Number of Sellers In addition to the preceding factors, which influence the behaviour of individual sellers, market supply depends on the number of sellers. If Ben or Jerry were to retire from the ice-cream business, the supply in the market would fall.
Summary The supply curve shows what happens to the quantity supplied of a good when its price varies, holding constant all the other variables that influence sellers. When one of these other variables changes, the supply curve shifts. Table 4.2 lists all the variables that influence how much producers choose to sell of a good. Once again, to help you remember whether you need to shift or move along the supply curve, keep in mind that a curve shifts only when there is a change
Price ofIce-Cream
Cone
Quantity ofIce-Cream Cones
0
Increasein supply
Decreasein supply
Supply curve, S3Supply
curve, S1Supply
curve, S2
Shifts in the Supply Curve
Any change that raises the quantity that sellers wish to produce at a given price shifts the supply curve to the right. Any change that lowers the quantity that sellers wish to produce at a given price shifts the supply curve to the left.
FIGuRe 4.7
30853_04_CH04.indd 78 03/09/13 5:57 PM
FOR REVIEW ONLY
79 CHAPTeR 4 THe mARkeT FoRCeS oF SuPPly And demAnd
NEL
in a relevant variable that is not named on either axis. The price is on the vertical axis, so a change in price represents a movement along the supply curve. By con-trast, because input prices, technology, expectations, and the number of sellers are not measured on either axis, a change in one of these variables shifts the supply curve.
QuickQuiz Make up an example of a monthly supply schedule for pizza, and graph the implied supply curve. ● Give an example of something that would shift this supply curve. ● Would a change in the price of pizza shift this supply curve?
SuPPly and demand TOgeTHer
Having analyzed supply and demand separately, we now combine them to see how they determine the price and quantity of a good sold in the market.
equilibrium
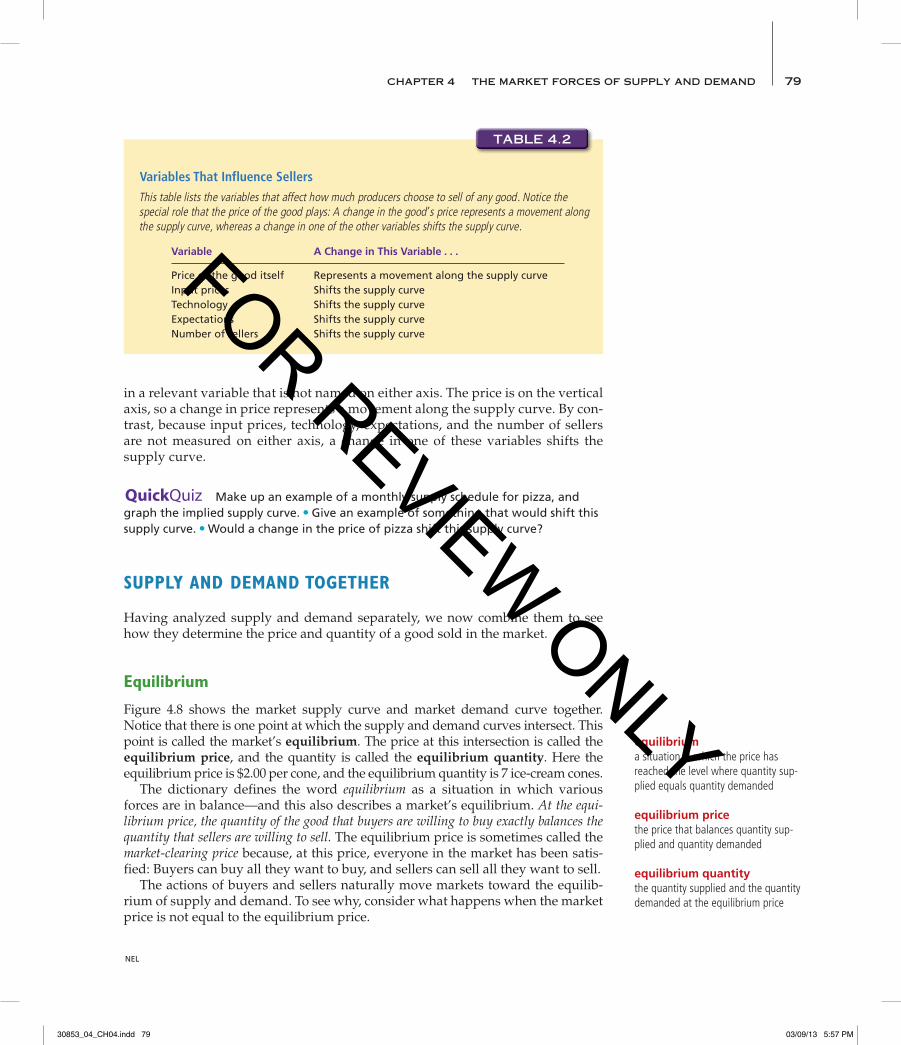
Figure 4.8 shows the market supply curve and market demand curve together. Notice that there is one point at which the supply and demand curves intersect. This point is called the market’s equilibrium. The price at this intersection is called the equilibrium price, and the quantity is called the equilibrium quantity. Here the equilibrium price is $2.00 per cone, and the equilibrium quantity is 7 ice-cream cones. The dictionary defines the word equilibrium as a situation in which various forces are in balance—and this also describes a market’s equilibrium. At the equi-librium price, the quantity of the good that buyers are willing to buy exactly balances the quantity that sellers are willing to sell. The equilibrium price is sometimes called the market-clearing price because, at this price, everyone in the market has been satis-fied: Buyers can buy all they want to buy, and sellers can sell all they want to sell. The actions of buyers and sellers naturally move markets toward the equilib-rium of supply and demand. To see why, consider what happens when the market price is not equal to the equilibrium price.
equilibriuma situation in which the price has reached the level where quantity sup-plied equals quantity demanded
equilibrium pricethe price that balances quantity sup-plied and quantity demanded
equilibrium quantitythe quantity supplied and the quantity demanded at the equilibrium price
TABle 4.2
Variables That Influence Sellers
This table lists the variables that affect how much producers choose to sell of any good. Notice the special role that the price of the good plays: A change in the good’s price represents a movement along the supply curve, whereas a change in one of the other variables shifts the supply curve.
Variable A Change in This Variable . . .
Price of the good itself Represents a movement along the supply curveInput prices Shifts the supply curveTechnology Shifts the supply curveExpectations Shifts the supply curveNumber of sellers Shifts the supply curve
30853_04_CH04.indd 79 03/09/13 5:57 PM
FOR REVIEW ONLY
80 PART 2 SuPPly And demAnd: How mARkeTS woRk
NEL
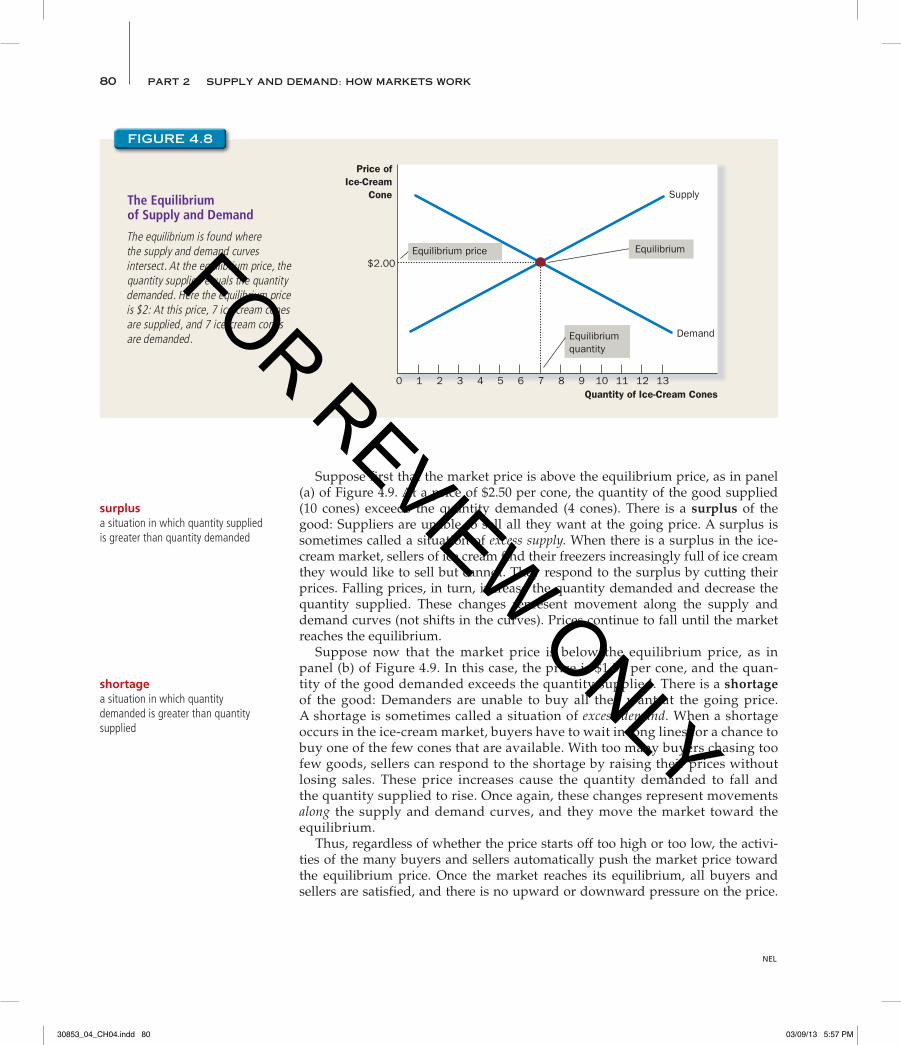
Suppose first that the market price is above the equilibrium price, as in panel (a) of Figure 4.9. At a price of $2.50 per cone, the quantity of the good supplied (10 cones) exceeds the quantity demanded (4 cones). There is a surplus of the good: Suppliers are unable to sell all they want at the going price. A surplus is sometimes called a situation of excess supply. When there is a surplus in the ice-cream market, sellers of ice cream find their freezers increasingly full of ice cream they would like to sell but cannot. They respond to the surplus by cutting their prices. Falling prices, in turn, increase the quantity demanded and decrease the quantity supplied. These changes represent movement along the supply and demand curves (not shifts in the curves). Prices continue to fall until the market reaches the equilibrium. Suppose now that the market price is below the equilibrium price, as in panel (b) of Figure 4.9. In this case, the price is $1.50 per cone, and the quan-tity of the good demanded exceeds the quantity supplied. There is a shortage of the good: Demanders are unable to buy all they want at the going price. A shortage is sometimes called a situation of excess demand. When a shortage occurs in the ice-cream market, buyers have to wait in long lines for a chance to buy one of the few cones that are available. With too many buyers chasing too few goods, sellers can respond to the shortage by raising their prices without losing sales. These price increases cause the quantity demanded to fall and the quantity supplied to rise. Once again, these changes represent movements along the supply and demand curves, and they move the market toward the equilibrium. Thus, regardless of whether the price starts off too high or too low, the activi-ties of the many buyers and sellers automatically push the market price toward the equilibrium price. Once the market reaches its equilibrium, all buyers and sellers are satisfied, and there is no upward or downward pressure on the price.
surplusa situation in which quantity supplied is greater than quantity demanded
shortagea situation in which quantity demanded is greater than quantity supplied
Price ofIce-Cream
Cone
$2.00
0 1 2 3 4 5 6 7 8 9 10 11 12Quantity of Ice-Cream Cones
13
Equilibriumquantity
Equilibrium price Equilibrium
Supply
Demand
The Equilibrium of Supply and Demand
The equilibrium is found where the supply and demand curves intersect. At the equilibrium price, the quantity supplied equals the quantity demanded. Here the equilibrium price is $2: At this price, 7 ice-cream cones are supplied, and 7 ice-cream cones are demanded.
FIGuRe 4.8
30853_04_CH04.indd 80 03/09/13 5:57 PM
FOR REVIEW ONLY
81 CHAPTeR 4 THe mARkeT FoRCeS oF SuPPly And demAnd
NEL
How quickly equilibrium is reached varies from market to market, depending on how quickly prices adjust. In most free markets, surpluses and shortages are only temporary because prices eventually move toward their equilibrium levels. Indeed, this phenomenon is so pervasive that it is called the law of supply and demand: The price of any good adjusts to bring the quantity supplied and quan-tity demanded for that good into balance.
Three Steps to analyzing changes in equilibrium
So far we have seen how supply and demand together determine a market’s equilibrium, which in turn determines the price of the good and the quantity of the good that buyers buy and sellers sell. The equilibrium price and quantity depend on the position of the supply and demand curves. When some event shifts one of these curves, the equilibrium in the market changes, resulting in a new price and a new quantity exchanged between buyers and sellers. When analyzing how some event affects a market, we proceed in three steps. First, we decide whether the event shifts the supply curve, the demand curve, or in some cases, both curves. Second, we decide whether the curve shifts to the right or to the left. Third, we use the supply-and-demand diagram to compare
law of supply and demandthe claim that the price of any good adjusts to bring the quantity supplied and the quantity demanded for that good into balance
Markets Not in Equilibrium
In panel (a), there is a surplus. Because the market price of $2.50 is above the equilibrium price, the quantity supplied (10 cones) exceeds the quantity demanded (4 cones). Suppliers try to increase sales by cutting the price of a cone, and this moves the price toward its equilibrium level. In panel (b), there is a shortage. Because the market price of $1.50 is below the equilibrium price, the quantity demanded (10 cones) exceeds the quantity supplied (4 cones). With too many buyers chasing too few goods, suppliers can take advantage of the shortage by raising the price. Hence, in both cases, the price adjustment moves the market toward the equilibrium of supply and demand.
FIGuRe 4.9
Price ofIce-Cream
Cone
Price ofIce-Cream
Cone
2.00
$2.50
0 4 7 10
Supply
Demand
(a) Excess Supply
Quantitydemanded
Quantitysupplied
Surplus
$2.00
1.50
0 4 7 10Quantity ofIce-Cream
Cones
Quantity ofIce-Cream
Cones
Supply
Demand
(b) Excess Demand
Quantitysupplied
Quantitydemanded
Shortage
30853_04_CH04.indd 81 03/09/13 5:57 PM
FOR REVIEW ONLY

82 PART 2 SuPPly And demAnd: How mARkeTS woRk
NEL
the initial equilibrium and the new equilibrium, which shows how the shift affects the equilibrium price and quantity. Table 4.3 summarizes these three steps. To see how this recipe is used, let’s consider various events that might affect the market for ice cream.
Example: A Change in Market Equilibrium Due to a Shift in Demand Suppose that one summer the weather is very hot. How does this event affect the market for ice cream? To answer this question, let’s follow our three steps.
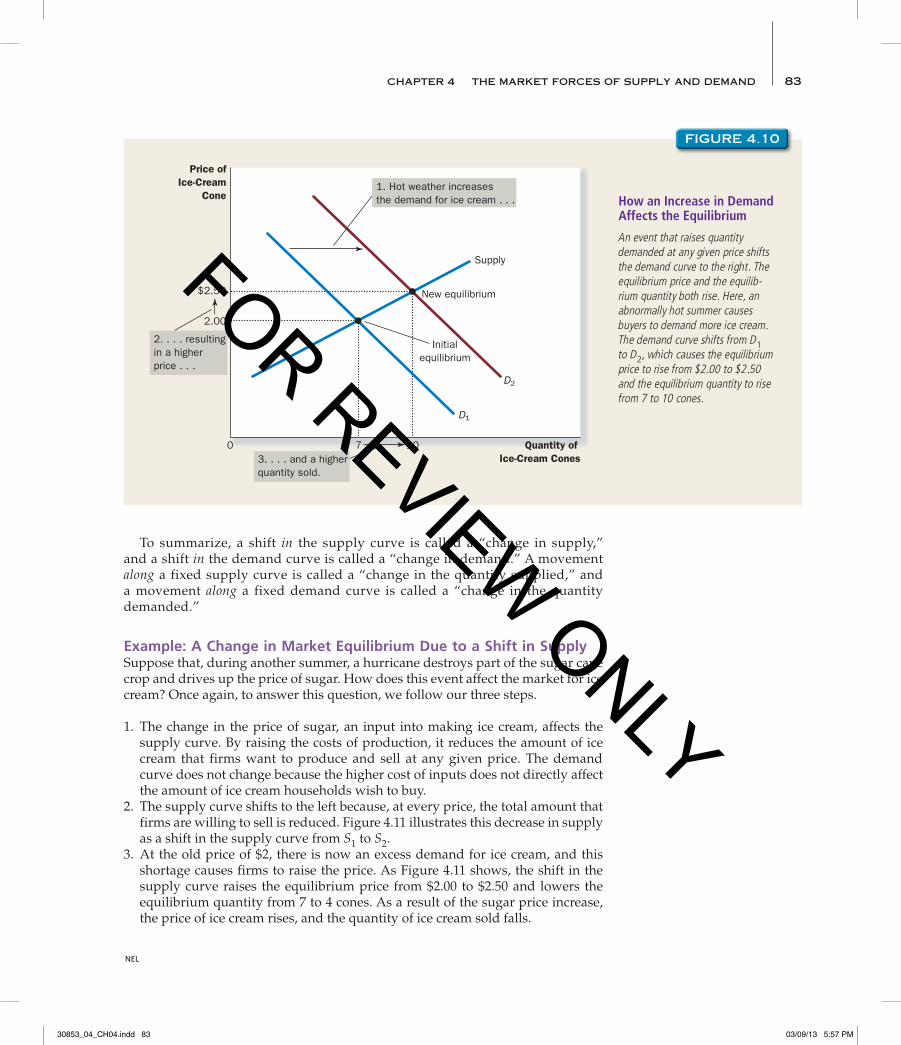
1. The hot weather affects the demand curve by changing people’s taste for ice cream. That is, the weather changes the amount of ice cream that people want to buy at any given price. The supply curve is unchanged because the weather does not directly affect the firms that sell ice cream.
2. Because hot weather makes people want to eat more ice cream, the demand curve shifts to the right. Figure 4.10 shows this increase in demand as the shift in the demand curve from D1 to D2. This shift indicates that the quantity of ice cream demanded is higher at every price.
3. At the old price of $2, there is now an excess demand for ice cream, and this shortage induces firms to raise the price. As Figure 4.10 shows, the increase in demand raises the equilibrium price from $2.00 to $2.50 and the equilibrium quantity from 7 to 10 cones. In other words, the hot weather increases the price of ice cream and the quantity of ice cream sold.
Shifts in Curves versus Movements along Curves Notice that when hot weather drives up the price of ice cream, the quantity of ice cream that firms supply rises, even though the supply curve remains the same. In this case, econo-mists say there has been an increase in “quantity supplied” but no change in “supply.” “Supply” refers to the position of the supply curve, whereas the “quantity supplied” refers to the amount suppliers wish to sell. In this example, supply does not change because the weather does not alter firms’ desire to sell at any given price. Instead, the hot weather alters consumers’ desire to buy at any given price and thereby shifts the demand curve. The increase in demand causes the equilibrium price to rise. When the price rises, the quantity supplied rises. This increase in quantity supplied is represented by the movement along the supply curve.
A Three-Step Program for Analyzing Changes in Equilibrium
1. Decide whether the event shifts the supply or demand curve (or perhaps both).2. Decide in which direction the curve shifts.3. Use the supply-and-demand diagram to see how the shift changes the equilibrium price
and quantity.
TABle 4.3
30853_04_CH04.indd 82 03/09/13 5:57 PM
FOR REVIEW ONLY
83 CHAPTeR 4 THe mARkeT FoRCeS oF SuPPly And demAnd
NEL
To summarize, a shift in the supply curve is called a “change in supply,” and a shift in the demand curve is called a “change in demand.” A movement along a fixed supply curve is called a “change in the quantity supplied,” and a movement along a fixed demand curve is called a “change in the quantity demanded.”
Example: A Change in Market Equilibrium Due to a Shift in SupplySuppose that, during another summer, a hurricane destroys part of the sugar cane crop and drives up the price of sugar. How does this event affect the market for ice cream? Once again, to answer this question, we follow our three steps.
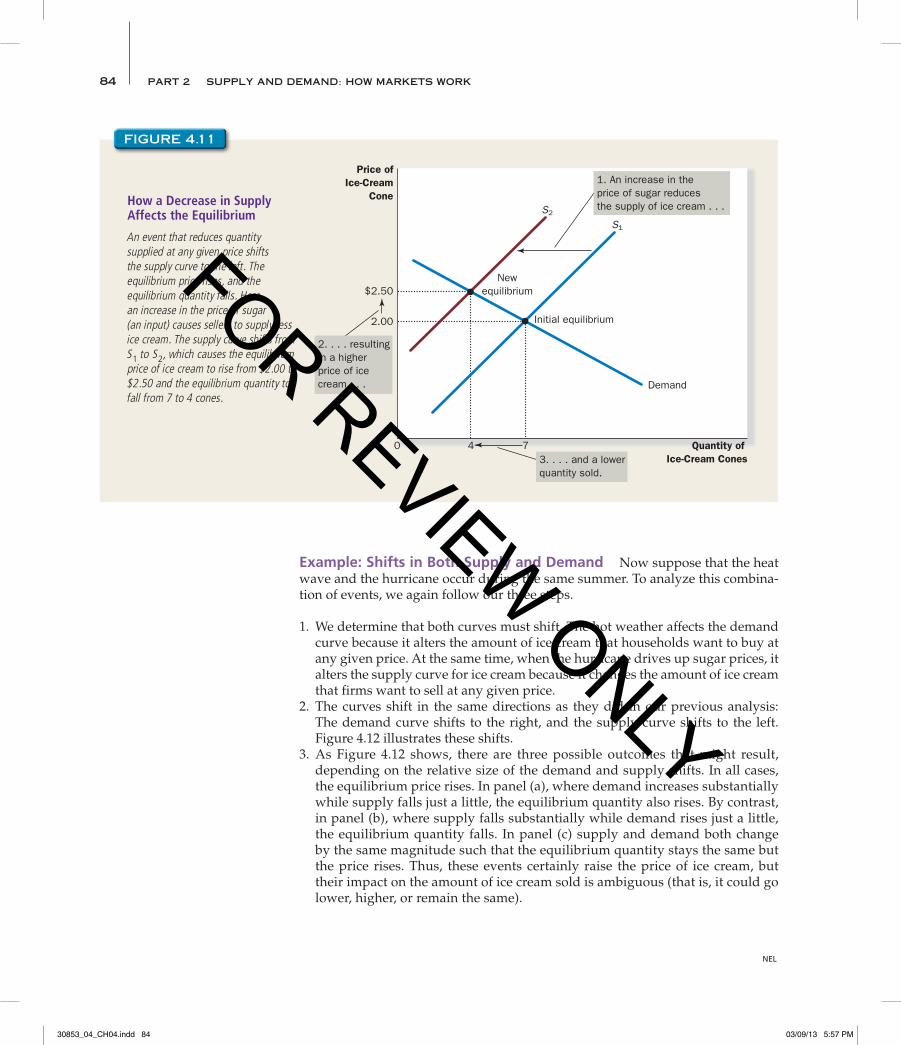
1. The change in the price of sugar, an input into making ice cream, affects the supply curve. By raising the costs of production, it reduces the amount of ice cream that firms want to produce and sell at any given price. The demand curve does not change because the higher cost of inputs does not directly affect the amount of ice cream households wish to buy.
2. The supply curve shifts to the left because, at every price, the total amount that firms are willing to sell is reduced. Figure 4.11 illustrates this decrease in supply as a shift in the supply curve from S1 to S2.
3. At the old price of $2, there is now an excess demand for ice cream, and this shortage causes firms to raise the price. As Figure 4.11 shows, the shift in the supply curve raises the equilibrium price from $2.00 to $2.50 and lowers the equilibrium quantity from 7 to 4 cones. As a result of the sugar price increase, the price of ice cream rises, and the quantity of ice cream sold falls.
Price ofIce-Cream
Cone
2.00
$2.50
0 7 10 Quantity of Ice-Cream Cones
Supply
New equilibrium
Initialequilibrium
D1
D2
3. . . . and a higherquantity sold.
2. . . . resultingin a higherprice . . .
1. Hot weather increasesthe demand for ice cream . . . How an Increase in Demand
Affects the Equilibrium
An event that raises quantity demanded at any given price shifts the demand curve to the right. The equilibrium price and the equilib-rium quantity both rise. Here, an abnormally hot summer causes buyers to demand more ice cream. The demand curve shifts from D1 to D2, which causes the equilibrium price to rise from $2.00 to $2.50 and the equilibrium quantity to rise from 7 to 10 cones.
FIGuRe 4.10
30853_04_CH04.indd 83 03/09/13 5:57 PM
FOR REVIEW ONLY
84 PART 2 SuPPly And demAnd: How mARkeTS woRk
NEL
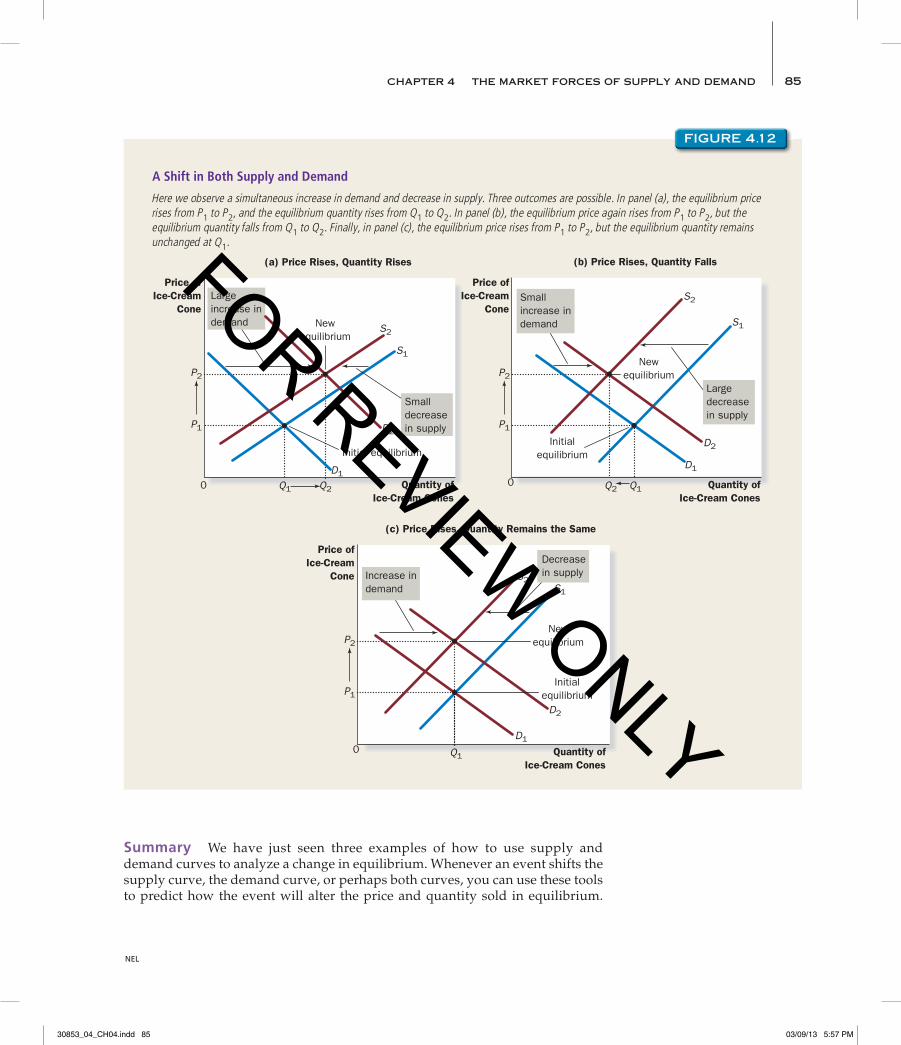
Example: Shifts in Both Supply and Demand Now suppose that the heat wave and the hurricane occur during the same summer. To analyze this combina-tion of events, we again follow our three steps.
1. We determine that both curves must shift. The hot weather affects the demand curve because it alters the amount of ice cream that households want to buy at any given price. At the same time, when the hurricane drives up sugar prices, it alters the supply curve for ice cream because it changes the amount of ice cream that firms want to sell at any given price.
2. The curves shift in the same directions as they did in our previous analysis: The demand curve shifts to the right, and the supply curve shifts to the left. Figure 4.12 illustrates these shifts.
3. As Figure 4.12 shows, there are three possible outcomes that might result, depending on the relative size of the demand and supply shifts. In all cases, the equilibrium price rises. In panel (a), where demand increases substantially while supply falls just a little, the equilibrium quantity also rises. By contrast, in panel (b), where supply falls substantially while demand rises just a little, the equilibrium quantity falls. In panel (c) supply and demand both change by the same magnitude such that the equilibrium quantity stays the same but the price rises. Thus, these events certainly raise the price of ice cream, but their impact on the amount of ice cream sold is ambiguous (that is, it could go lower, higher, or remain the same).
Price ofIce-Cream
Cone
2.00
$2.50
0 4 7 Quantity of Ice-Cream Cones
Demand
Newequilibrium
Initial equilibrium
S1
S2
2. . . . resultingin a higherprice of icecream . . .
1. An increase in theprice of sugar reducesthe supply of ice cream . . .
3. . . . and a lowerquantity sold.
How a Decrease in Supply Affects the Equilibrium
An event that reduces quantity supplied at any given price shifts the supply curve to the left. The equilibrium price rises, and the equilibrium quantity falls. Here, an increase in the price of sugar (an input) causes sellers to supply less ice cream. The supply curve shifts from S1 to S2, which causes the equilibrium price of ice cream to rise from $2.00 to $2.50 and the equilibrium quantity to fall from 7 to 4 cones.
FIGuRe 4.11
30853_04_CH04.indd 84 03/09/13 5:57 PM
FOR REVIEW ONLY
85 CHAPTeR 4 THe mARkeT FoRCeS oF SuPPly And demAnd
NEL
A Shift in Both Supply and Demand
Here we observe a simultaneous increase in demand and decrease in supply. Three outcomes are possible. In panel (a), the equilibrium price rises from P1 to P2, and the equilibrium quantity rises from Q1 to Q2. In panel (b), the equilibrium price again rises from P1 to P2, but the equilibrium quantity falls from Q1 to Q2. Finally, in panel (c), the equilibrium price rises from P1 to P2, but the equilibrium quantity remains unchanged at Q1.
FIGuRe 4.12
(b) Price Rises, Quantity Falls
0
Newequilibrium
Initialequilibrium
(a) Price Rises, Quantity Rises
Quantity ofIce-Cream Cones
Quantity ofIce-Cream Cones
0
Newequilibrium
Initial equilibrium
S1
S1
D1D1
D2
D2
S2
S2
Q1 Q2Q2 Q1
P2
P1
P2
P1
Largeincrease indemand
Smalldecreasein supply
Smallincrease indemand
Largedecreasein supply
Price ofIce-Cream
Cone
Price ofIce-Cream
Cone
(c) Price Rises, Quantity Remains the Same
0
Newequilibrium
Initialequilibrium
Quantity ofIce-Cream Cones
S1
D1
D2
S2
Q1
P2
P1
Increase indemand
Price ofIce-Cream
Cone
Decreasein supply
Summary We have just seen three examples of how to use supply and demand curves to analyze a change in equilibrium. Whenever an event shifts the supply curve, the demand curve, or perhaps both curves, you can use these tools to predict how the event will alter the price and quantity sold in equilibrium.
30853_04_CH04.indd 85 03/09/13 5:57 PM
FOR REVIEW ONLY

86 PART 2 SuPPly And demAnd: How mARkeTS woRk
NEL
Analysts Say Pulp Mill Closure Signals Tougher Times Ahead
FREDERICTON (CP) – Forestry officials are warning of tough times ahead as technology and the rise of the Internet swing through the pulp and paper industry like an axe. The axe fell earlier this month on the small town of Nackawic in western New Brunswick, where 400 jobs were lost and hundreds of other people were affected by the abrupt closure of the St. Anne-Nackawic pulp mill. The New York-based owners of the mill blamed the rising cost of wood and the rising value of the loonie as major reasons for the closure. Industry observers say it didn’t help that the mill produced bleached hardwood pulp for use in products like
photographic paper. David Chaundy, senior economist with the Atlantic Provinces Economic Council, said dig-ital photography and the Internet are depressing demand for items like photo-graphic paper and newsprint. He said the Maritimes could see more closures in its all-important for-estry sector. “There are definitely con-cerns that some of our mills are on the higher end of the cost curve and there-fore are more vulnerable to reductions in commodity prices, or, if they’re part of a multinational operation, to the clo-sure of plants,” Chaundy said. “That risk remains.” Analysts expect the demand for pulp, lumber and newsprint to be weaker over the next two to three years. Competition from countries in the southern hemisphere is hurting Canadian pulp and paper production.
The strong Canadian dollar is also a factor in declining profits, since forest products such as lumber, pulp, and paper trade on world markets in U.S. dollars. It’s estimated that each one-cent rise in the Canadian dollar drains about $500 million Cdn in revenues from the country’s forest industry. Yvon Poitras of the New Brunswick Forest Products Association said indus-tries in New Brunswick feel the impact of volatile world markets more acutely because the province is so small. He said there are no other forestry clo-sures in New Brunswick’s immediate future. But he said all bets are off looking ahead to the next two or three years.
Source: Canadian Press, “Tough times seen for forestry industry,” September 27, 2004. Copyright by The Canadian Press.
This article discusses how technology (a supply shifter) and changes in tastes and preferences (a demand shifter) can have a big impact on the market for traditional goods, such as pulp and paper.
SuPPly, DEMAND, AND TEChNoloGy
IN THE NEWSIN THE NEWS
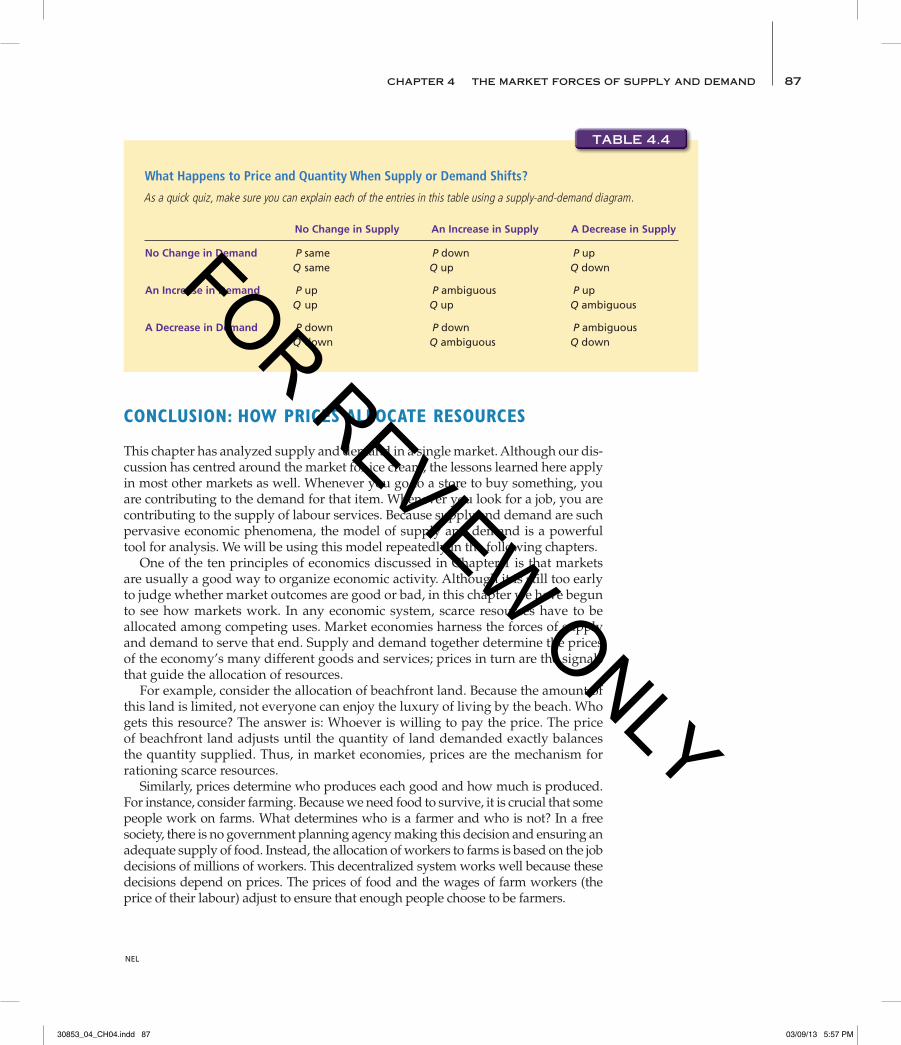
Table 4.4 shows the predicted outcome for any combination of shifts in the two curves. To make sure you understand how to use the tools of supply and demand, pick a few entries in this table and make sure you can explain to your-self why the table contains the prediction it does.
QuickQuiz on the appropriate diagram, show what happens to the market for pizza if the price of tomatoes rises. ● on a separate diagram, show what happens to the market for pizza if the price of hamburgers falls.
30853_04_CH04.indd 86 03/09/13 5:57 PM
FOR REVIEW ONLY
87 CHAPTeR 4 THe mARkeT FoRCeS oF SuPPly And demAnd
NEL
cOncluSiOn: HOw PriceS allOcaTe reSOurceS
This chapter has analyzed supply and demand in a single market. Although our dis-cussion has centred around the market for ice cream, the lessons learned here apply in most other markets as well. Whenever you go to a store to buy something, you are contributing to the demand for that item. Whenever you look for a job, you are contributing to the supply of labour services. Because supply and demand are such pervasive economic phenomena, the model of supply and demand is a powerful tool for analysis. We will be using this model repeatedly in the following chapters. One of the ten principles of economics discussed in Chapter 1 is that markets are usually a good way to organize economic activity. Although it is still too early to judge whether market outcomes are good or bad, in this chapter we have begun to see how markets work. In any economic system, scarce resources have to be allocated among competing uses. Market economies harness the forces of supply and demand to serve that end. Supply and demand together determine the prices of the economy’s many different goods and services; prices in turn are the signals that guide the allocation of resources. For example, consider the allocation of beachfront land. Because the amount of this land is limited, not everyone can enjoy the luxury of living by the beach. Who gets this resource? The answer is: Whoever is willing to pay the price. The price of beachfront land adjusts until the quantity of land demanded exactly balances the quantity supplied. Thus, in market economies, prices are the mechanism for rationing scarce resources. Similarly, prices determine who produces each good and how much is produced. For instance, consider farming. Because we need food to survive, it is crucial that some people work on farms. What determines who is a farmer and who is not? In a free society, there is no government planning agency making this decision and ensuring an adequate supply of food. Instead, the allocation of workers to farms is based on the job decisions of millions of workers. This decentralized system works well because these decisions depend on prices. The prices of food and the wages of farm workers (the price of their labour) adjust to ensure that enough people choose to be farmers.
What Happens to Price and Quantity When Supply or Demand Shifts?
As a quick quiz, make sure you can explain each of the entries in this table using a supply-and-demand diagram.
TABle 4.4
No Change in Supply An Increase in Supply A Decrease in Supply
No Change in Demand P same P down P up Q same Q up Q down
An Increase in Demand P up P ambiguous P up Q up Q up Q ambiguous
A Decrease in Demand P down P down P ambiguous Q down Q ambiguous Q down
30853_04_CH04.indd 87 03/09/13 5:57 PM
FOR REVIEW ONLY
88 PART 2 SuPPly And demAnd: How mARkeTS woRk
NEL
Key ConCepts
summary
If a person had never seen a market economy in action, the whole idea might seem preposterous. Economies are large groups of people engaged in many inter-dependent activities. What prevents decentralized decision making from degen-erating into chaos? What coordinates the actions of the millions of people with their varying abilities and desires? What ensures that what needs to be done does, in fact, get done? The answer, in a word, is prices. If market economies are guided by an invisible hand, as Adam Smith famously suggested, then the price system is the baton that the invisible hand uses to conduct the economic orchestra.
● Economists use the model of supply and demand to analyze competitive markets. In a competitive market, there are many buyers and sellers, each of whom has little or no influence on the market price.
● The demand curve shows how the quantity of a good demanded depends on the price. According to the law of demand, as the price of a good falls, the quantity demanded rises. Therefore, the demand curve slopes downward.
● In addition to price, other determinants of how much consumers want to buy include income, the prices of substitutes and complements, tastes, expectations, and the number of buyers. If one of these factors changes, the demand curve shifts.
● The supply curve shows how the quantity of a good supplied depends on the price. According to the law of supply, as the price of a good rises, the quantity supplied rises. Therefore, the supply curve slopes upward.
● In addition to price, other determinants of how much producers want to sell include input prices, technology, expectations, and the number of sellers. If one of these factors changes, the supply curve shifts.
● The intersection of the supply and demand curves determines the market equilibrium. At the
equilibrium price, the quantity demanded equals the quantity supplied.
● The behaviour of buyers and sellers naturally drives markets toward their equilibrium. When the market price is above the equilibrium price, there is a surplus of the good, which causes the market price to fall. When the market price is below the equilibrium price, there is a shortage, which causes the market price to rise.
● To analyze how any event influences a market, we use the supply-and-demand diagram to examine how the event affects the equilibrium price and quantity. To do this we follow three steps. First, we decide whether the event shifts the supply curve or the demand curve (or both). Second, we decide which direction the curve shifts. Third, we compare the new equilibrium with the initial equilibrium.
● In market economies, prices are the signals that guide economic decisions and thereby allocate scarce resources. For every good in the economy, the price ensures that supply and demand are in balance. The equilibrium price then determines how much of the good buyers choose to purchase and how much sellers choose to produce.
market, p. 68competitive market, p. 68quantity demanded, p. 69law of demand, p. 69demand schedule, p. 69demand curve, p. 70normal good, p. 72
inferior good, p. 72substitutes, p. 72complements, p. 73quantity supplied, p. 75law of supply, p. 75supply schedule, p. 75supply curve, p. 76
equilibrium, p. 79equilibrium price, p. 79equilibrium quantity, p. 79surplus, p. 80shortage, p. 80law of supply and demand, p. 81
30853_04_CH04.indd 88 03/09/13 5:57 PM
FOR REVIEW ONLY
89 CHAPTeR 4 THe mARkeT FoRCeS oF SuPPly And demAnd
NEL
Quest ions for rev iew
problems and appl iCat ions
1. What is a competitive market? Briefly describe the types of markets other than perfectly competitive markets.
2. What are the demand schedule and the demand curve, and how are they related? Why does the demand curve slope downward?
3. Does a change in consumers’ tastes lead to a movement along the demand curve or a shift in the demand curve? Does a change in price lead to a movement along the demand curve or a shift in the demand curve?
4. Popeye’s income declines and, as a result, he buys more spinach. Is spinach an inferior or a normal good? What happens to Popeye’s demand curve for spinach?
5. What are the supply schedule and the supply curve, and how are they related? Why does the supply curve slope upward?
6. Does a change in producers’ technology lead to a movement along the supply curve or a shift in the supply curve? Does a change in price lead to a movement along the supply curve or a shift in the supply curve?
7. Define the equilibrium of a market. Describe the forces that move a market toward its equilibrium.
8. Beer and pizza are complements because they are often enjoyed together. When the price of beer rises, what happens to the supply, demand, quan-tity supplied, quantity demanded, and the price in the market for pizza?
9. Describe the role of prices in market economies.
1. Explain each of the following statements using supply-and-demand diagrams.a. When a cold snap hits Florida, the price
of orange juice rises in supermarkets throughout Canada.
b. When the weather turns warm in Quebec every summer, the prices of hotel rooms in Caribbean resorts plummet.
c. When a war breaks out in the Middle East, the price of gasoline rises, while the price of a used SUV falls.
2. “An increase in the demand for notebooks raises the quantity of notebooks demanded, but not the quantity supplied.” Is this statement true or false? Explain.
3. Consider the market for minivans. For each of the events listed below, identify which of the determinants of demand or supply are affected. Also indicate whether demand or supply is increased or decreased. Then show the effect on the price and quantity of minivans.a. People decide to have more children.b. A strike by steelworkers raises steel prices.
c. Engineers develop new automated machinery for the production of minivans.
d. The price of SUVs rises.e. A stock market crash lowers people’s wealth.
4. Over the past 20 years, technological advances have reduced the cost of computer chips. How do you think this has affected the market for com-puters? For computer software? For typewriters?
5. Using supply-and-demand diagrams, show the effect of the following events on the market for sweatshirts.a. A hurricane in South Carolina damages the
cotton crop.b. The price of leather jackets falls.c. All universities require morning calisthenics
in appropriate attire.d. New knitting machines are invented.
6. Suppose that in the year 2010, the number of births was temporarily high. How will this baby boom affect the price of baby-sitting services in 2015 and 2025? (Hint: Five-year-olds need baby-sitters, whereas fifteen-year-olds can be baby-sitters.)
30853_04_CH04.indd 89 03/09/13 5:57 PM
FOR REVIEW ONLY
90 PART 2 SuPPly And demAnd: How mARkeTS woRk
NEL
7. Ketchup is a complement (as well as a condiment) for hot dogs. If the price of hot dogs rises, what happens to the market for ketchup? For toma-toes? For tomato juice? For orange juice?
8. The market for pizza has the following demand and supply schedules:
Price Quantity Demanded Quantity Supplied
$4 135 26 5 104 53 6 81 81 7 68 98 8 53 110 9 39 121
Graph the demand and supply curves. What is the equilibrium price and quantity in this market? If the actual price in this market was above the equilibrium price, what would drive the market toward the equilibrium? If the actual price in this market was below the equilibrium price, what would drive the market toward the equilibrium?
9. Because bagels and cream cheese are often eaten together, they are complements.a. We observe that both the equilibrium price of
cream cheese and the equilibrium quantity of bagels have risen. What could be responsible for this pattern—a fall in the price of flour or a fall in the price of milk? Illustrate and explain your answer.
b. Suppose instead that the equilibrium price of cream cheese has risen but the equi-librium quantity of bagels has fallen. What could be responsible for this pattern—a rise in the price of flour or a rise in the price of milk? Illustrate and explain your answer.
10. Suppose that the price of hockey tickets at your school is determined by market forces. Currently, the demand and supply schedules are as follows:
Price Quantity Demanded Quantity Supplied
$4 10 000 8000 8 8 000 800012 6 000 800016 4 000 800020 2 000 8000
a. Draw the demand and supply curves. What is unusual about this supply curve? Why might this be true?
b. What are the equilibrium price and quantity of tickets?
c. Your school plans to increase total enrollment next year by 5000 students. The additional students will have the following demand schedule:
Price Quantity Demanded
$4 4000 8 300012 200016 100020 0
Now add the old demand schedule and the demand schedule for the new students to calculate the new demand schedule for the entire school. What will be the new equilib-rium price and quantity?
11. Consider the markets for DVD movies, TV screens, and tickets to movie theatres.a. For each pair, identify whether they are
complements or substitutes: —DVDs and TV screens —DVDs and movie tickets —TV screens and movie ticketsb. Suppose a technological advance reduces
the cost of manufacturing TV screens. Draw a diagram to show what happens to the market for TV screens.
c. Draw two more diagrams to show how the change in the market for TV screens affects the markets for DVDs and movie tickets
12. Market research has revealed the following information about the market for chocolate bars: The demand schedule can be represented by the equation QD 5 1600 2 300P, where QD is the quantity demanded and P is the price. The supply schedule can be represented by the equation QS 5 1400 1 700P, where QS is the quantity supplied. a. Calculate the equilibrium price and quan-
tity in the market for chocolate bars.b. Say that in response to a major industry
ad campaign, the demand schedule for chocolate bars shifted to the right, as
30853_04_CH04.indd 90 03/09/13 5:57 PM
FOR REVIEW ONLY
91 CHAPTeR 4 THe mARkeT FoRCeS oF SuPPly And demAnd
NEL
represented by the equation QD 5 1800 2 300P. What happens to the equilibrium price and quantity of chocolate bars in this case?
c. Returning to the original demand schedule, say that the price of cocoa beans, a major ingredient in the production of chocolate bars, increased because of a drought in sub-Saharan Africa, a major producer of cocoa, changing the supply schedule to QS 5 1100 1 700P. What happens to the equilibrium price and quantity in this case?
13. A survey shows an increase in drug use by young people. In the ensuing debate, two hypotheses are proposed:— Reduced police efforts have increased the
availability of drugs on the street.— Cutbacks in educational efforts have
decreased awareness of the dangers of drug addiction.
a. Use supply-and-demand diagrams to show how each of these hypotheses could lead to an increase in the quantity of drugs consumed.
b. How could information on what has hap-pened to the price of drugs help us to dis-tinguish between these explanations?
14. Consider the following events: Scientists reveal that consumption of oranges decreases the risk of diabetes and, at the same time, farmers use a new fertilizer that makes orange trees more productive. Illustrate and explain what effect these changes have on the equilibrium price and quantity of oranges.
15. Suppose that the demand curve for concert tickets is linear. When the price of a ticket is $5.00, the number of tickets purchased is 1000; when the price of a ticket is $15.00, the number of tickets purchased is 200. Find the slope of the demand curve.
16. At a price of $320 per tonne, the supply of wheat in Canada is 25 million tonnes and the demand is 26 million tonnes. When the price increases to $340 per tonne, the supply increases to 27 million tonnes and the demand decreases to 22 million tonnes. Assume that both the demand and supply curves are linear.a. What is the equation for the demand curve
for wheat?b. What is the equation of the supply curve for
wheat?c. Using these equations, what is the equilib-
rium price and quantity of wheat?17. The demand and supply functions for hockey
sticks are given by
QD 5 286 2 20PQS 5 88 1 40P
a. Graph the supply and the demand curves, clearly showing the intercepts and indicating the slopes of the two curves.
b. Determine the equilibrium price and quantity of hockey sticks.
c. Suppose that both the men’s and the women’s teams win Olympic gold medals, causing an increase in the demand for hockey sticks across the country to QD 5 328 2 20P. What impact does this have on the price of hockey sticks and the quantity sold?
For more study tools, please visit www.nelson.com/mankiwmacro6e.
30853_04_CH04.indd 91 03/09/13 5:57 PM
FOR REVIEW ONLY
92 PART 2 SuPPly And demAnd: How mARkeTS woRk
NEL
appendiX : the mathematiCs of marKet eQuil ibr ium
The appendix to Chapter 2 presented a review of how economists use graphs to help explain mathematical relationships among variables. We have already seen that these are very valuable tools to help us understand economic relationships. Sometimes, however, it is useful to be more precise about the nature of these relationships, which requires the explicit use of mathematics. In this appendix, we illustrate how simple mathematical methods can help us solve algebraically for a market’s equilibrium price and quantity using supply and demand curves. In Figure 4.8, we saw how the equilibrium price and quantity for a good are determined by the intersection of the supply and demand curves. Although they don’t have to be, for simplicity, we often draw these curves as linear (so our “curves” are actually straight lines!). The general equation for a linear demand curve is as follows:
QD 5 a 2 bP
where QD is the quantity demanded and P is the price of the good. The letters a and b are referred to as demand parameters. They represent positive numbers that capture the various things that affect demand. Sometimes economists like to use letters or symbols rather than numbers in order to keep the analysis general. The parameter a can be viewed as incorporating all of the things other than the own price of the good that affect demand (income, prices of other goods, number of buyers, etc.). As these are held constant along the demand curve, we can incor-porate them all into the parameter a, which is constant. A change in the parameter a can then be used to represent a shift in the demand curve due to changes in things other than the own price of the good. The parameter b reflects the sensitivity of demand to changes in its own price. Since b is a positive number and there is a minus sign in front of bP, as the price of the good increases, the quantity demanded falls. Of course, this is because demand curves are downward sloping. As we have seen, we plot demand curves by putting the price on the vertical axis (the y-axis) and the quantity demanded on the horizontal axis (the x-axis). For a linear demand curve we can determine its intercept with the price axis (the y-intercept) by setting QD 5 0 and solving the demand equation for P. The y-intercept is therefore determined by 0 5 a 2 bP; solving for P gives P 5 a/b. Similarly, the intercept with the quantity axis (the x-intercept) is determined by setting P 5 0 and solving for QD, which gives QD 5 a. Figure 4A.1 plots the demand curve for a general linear demand curve given by the equation QD 5 a 2 bP, identifying the x- and y-intercepts determined above. We saw in the appendix to Chapter 2 that the slope of a linear demand curve is equal to the “rise over the run” as we move along the line. The “rise” is the change in price measured along the y-axis (y, where you’ll recall that is the Greek letter delta, which stands for “change in”) as we move from one point on the demand curve to another; the “run” is the change in quantity demanded measured along the x-axis (x). So the slope of the demand curve is measured as y/x, as we move from one point on the demand curve to another.
30853_04_CH04.indd 92 03/09/13 5:57 PM
FOR REVIEW ONLY
93 CHAPTeR 4 THe mARkeT FoRCeS oF SuPPly And demAnd
NEL
Since the slope of a line is constant all along the line (that is what makes it a line!), we can use any two points on the demand curve to determine its slope. Two particularly useful points on the demand curve are the x- and y-intercepts deter-mined above. We can use these points to determine the “rise over the run” from moving from the point on the demand curve that intersects the x-axis (point A in Figure 4A.1) to the point on the demand curve that intersects the y-axis (point B). In this case, the “rise” is the increase in price resulting from moving from point A to point B. At point A (the x-intercept), the price is zero and at point B (the y-intercept) the price is a/b, therefore the “rise” in moving from point A to point B is y = a/b. Similarly, the “run” is the decrease in quantity demanded resulting from moving from point A to point B. At point A (the x-intercept), the quantity demanded is a, and at point B (the y-intercept), the quantity demanded is 0, there-fore the “run” in moving from point A to point B is x 5 2a. So the slope of the demand curve, the “rise over the run” in moving from point A to point B, is y/x 5 2(a/b)/a 5 21/b. The general equation for a linear supply curve is
QS 5 c 1 dP
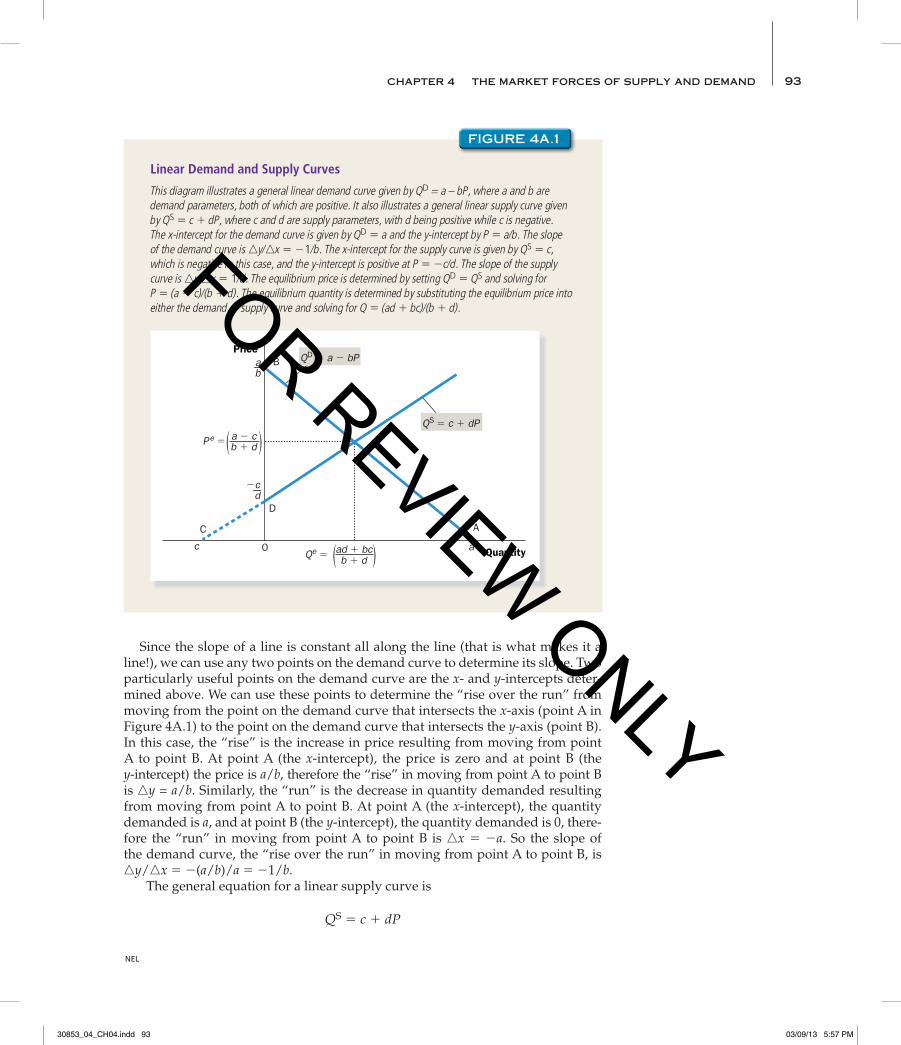
Linear Demand and Supply Curves
This diagram illustrates a general linear demand curve given by QD = a – bP, where a and b are demand parameters, both of which are positive. It also illustrates a general linear supply curve given by QS 5 c 1 dP, where c and d are supply parameters, with d being positive while c is negative. The x-intercept for the demand curve is given by QD 5 a and the y-intercept by P 5 a/b. The slope of the demand curve is y/x 5 21/b. The x-intercept for the supply curve is given by QS 5 c, which is negative in this case, and the y-intercept is positive at P 5 2c/d. The slope of the supply curve is y/x 5 1/d. The equilibrium price is determined by setting QD 5 QS and solving for P 5 (a 2 c)/(b 1 d). The equilibrium quantity is determined by substituting the equilibrium price into either the demand or supply curve and solving for Q 5 (ad 1 bc)/(b 1 d).
FIGuRe 4A.1
Qe 5 ad 1 bcb 1 d
Pe 5 a 2 cb 1 d
ab
d
Price
Quantityac
A
B
C
D
0
QS 5 c 1 dP
QD 5 a 2 bP
c
30853_04_CH04.indd 93 03/09/13 5:57 PM
FOR REVIEW ONLY
94 PART 2 SuPPly And demAnd: How mARkeTS woRk
NEL
where QS is quantity supplied and P is again the price of the good. The letters c and d are referred to as the supply parameters. The parameter c can be viewed as incorpo-rating all of the factors other than the own price of the good that affect supply (tech-nology, input prices, number of sellers, etc.). As these things are held constant along the supply curve, we can incorporate them all into the parameter c, which is con-stant. A change in the parameter c can thus be used to represent a shift in the supply curve. As will be discussed below, c may be either a positive or a negative number. The parameter d, which is positive, reflects the sensitivity of supply to changes in its own price. Because d is a positive number and there is a plus sign in front of dP, as the price of the good increases, the quantity supplied increases because supply curves are upward sloping. As with the demand curve, we can determine the intercept of the linear supply curve with the price axis (the y-intercept) by setting QS 5 0 and solving the supply equation for P. The y-intercept is therefore determined by 0 5 c 1 dP; solving for P gives P 5 2c/d. Similarly, the intercept with the quantity axis (the x-intercept) is determined by setting P 5 0 and solving for QS, which gives QS 5 c. You may have noticed that because supply curves are upward sloping, they can intersect the x- or y-axis at either a positive or negative number, so the supply param-eter c can be either positive or negative (although d is always positive). Figure 4A.1 illustrates the case where c is negative, which is often the case. Since supply curves make sense only for positive prices and quantities, we illustrate the “projection” of the curve into the negative quadrant with a dashed line. We see that if the supply curve intersects the y-axis at a positive price, the projection must intersect the x-axis at a negative quantity in which case the parameter c is negative. As with the demand curve we can use any two points on the supply curve to determine its slope. Again, it is convenient to use the x- and y-intercepts of the supply curve determined above. In this case the “rise” is the increase in price resulting from moving from the point that intersects the x-axis (point C on the projected supply curve) to the point that intersects the y-axis (point D). At point C (the x-intercept), the price is 0 and at point D (the y-intercept) the price is 2c/d, so the “rise” in moving from point C to point D on the supply curve is y 5 2c/d (which is positive because c is a negative number in this case). Similarly, the “run” is the increase in quantity supplied resulting from moving from point C to point D. At point C (the x-intercept), the quantity supplied is c, and at point D (the y-intercept) the quantity supplied is 0, therefore the “run” is x 5 2c. So the slope of the supply curve, the “rise over the run”, in moving from point C to point D, is y/x 5 (2c/d)/2c 5 1/d. We have seen that the market equilibrium price and quantity are determined by the intersection of the demand and supply curves. The equilibrium price is such that the quantity demanded exactly equals the quantity supplied. Using our equa-tions for linear demand and supply curves, we can therefore determine the equi-librium price by setting quantity demanded equal to quantity supplied (QD 5 QS) and solving for the price P:
a 2 bP 5 c 1 dP
Using simple algebra to gather terms with P on the left-hand side and the other terms on the right-hand side gives
P(b 1 d) 5 a 2 c
30853_04_CH04.indd 94 03/09/13 5:57 PM
FOR REVIEW ONLY
95 CHAPTeR 4 THe mARkeT FoRCeS oF SuPPly And demAnd
NEL
Dividing both sides by (b 1 d) to solve for P gives an equilibrium price of
Pe 51a 2 c 21b 1 d 2
You will notice that in order for the equilibrium price to be positive, the demand parameter a must be greater than the supply parameter c. Since a is positive, in the case where c is negative (as in the case illustrated in Figure 4A.1), this is no problem. But if c is a positive number it must be less than a. To determine the equilibrium quantity in the market, substitute the equi-librium price into the equation for quantity demanded and do some simple algebra to get:
QD 5 a 2 bP e 5 a 2 b 1a 2 c 21b 1 d 2 5
1ad 1 bc 21b 1 d 2
Alternatively, we could substitute the equilibrium price into the equation for the quantity supplied and do some simple algebra to get
QS 5 c 1 dP e 5 c 1 d 1a 2 c 21b 1 d 2 5
1ad 1 bc 21b 1 d 2
As we would expect, at the equilibrium price, quantity demanded equals quantity supplied (denoted Qe). The equilibrium for the general linear demand and supply curves is illustrated in Figure 4A.1. This discussion has taken place using letters (a, b, c, d) for the demand and supply parameters. As mentioned earlier, economists often do this in models in order to keep things general. Of course, demand and supply schedules for par-ticular goods may be represented by particular numerical values for these demand parameters. For example, let’s say that the demand schedule for a good is given by QD 5 20 2 2P and the supply schedule is given by QS 5 210 1 4P. In this case, a 5 20, b 5 2, c 5 210, and d 5 4. Using the above general expressions for the x- and y-intercepts and the slopes of the demand and supply curves, we see that for the demand curve, the x-intercept occurs at QD 5 a 5 20, the y-intercept occurs at P 5 a/b 5 10, and the slope of the demand curve is y/x 5 21/b 5 21/2. For the supply curve, the x-intercept occurs at QS 5 c 5 210, the y-intercept occurs at P 5 2c/d 5 2.5, and the slope is y/x 5 1/d 5 1/4. We can also substitute the values for the demand and supply parameters into the general equations for the equilibrium prices and quantities for linear demand and supply curves that we derived above to determine an equilibrium price and quantity. The equilibrium price is therefore
P e 5
1a 2 c 21b 1 d 2 5
120 1 10 212 1 4 2 5
306
5 5
30853_04_CH04.indd 95 03/09/13 5:57 PM
FOR REVIEW ONLY
96 PART 2 SuPPly And demAnd: How mARkeTS woRk
NEL
and the equilibrium quantity is
Q e 5
1ad 1 bc 21b 1 d 2 5
180 2 20 212 1 4 2 5
606
5 10
Alternatively, we could simply follow the general steps discussed above for these particular demand and supply schedules, as follows:
QD 5 20 2 2P
QS 5 210 1 4P
Set QD 5 QS:
20 2 2P 5 210 1 4P
Solve for P:
P 5306
5 5
Now use the demand curve to get
QD 5 20 2 2(5) 5 10
which we can confirm by using the supply curve to get
QS 5 210 1 4(5) 5 10
30853_04_CH04.indd 96 03/09/13 5:57 PM
FOR REVIEW ONLY
Related Documents