Linnaeus Business School Supplier Selection Process Improvement through Six-Sigma DMAIC “A case of Lafarge Pakistan Cement Limited” Degree Project Advanced Level - Business Administration 15 ECTS Credits Business Process and Supply Chain Management, 4FE02E, Spring 2010 Authors: Muhammad Rizwan ul Haque Ahmed Nawaz Shaikh Kamonmarn Jaenglom Zaheer Tariq Tutor: Petra Andersson Examiner: Åsa Gustavsson

Welcome message from author
This document is posted to help you gain knowledge. Please leave a comment to let me know what you think about it! Share it to your friends and learn new things together.
Transcript
Linnaeus Business School
Supplier Selection Process Improvement through Six- Sigma DMAIC
“A case of Lafarge Pakistan Cement Limited”
Degree Project Advanced Level - Business Administra tion
15 ECTS Credits
Business Process and Supply Chain Management, 4FE02 E, Spring 2010
Authors:
Muhammad Rizwan ul Haque
Ahmed Nawaz Shaikh
Kamonmarn Jaenglom
Zaheer Tariq
Tutor:
Petra Andersson
Examiner:
Åsa Gustavsson

i
Master Thesis
Dedication
We dedicate this thesis in the honour of our parents who have been the source
of inspiration and motivation all lifelong….
ii
Master Thesis
Acknowledgement
Working on this thesis provided us with the opportunity to explore our concepts profoundly
as regard to supplier selection process. This work has extensively developed our
understanding and allowed us to spread out on modern-day perspectives of the subject. We
shall take this opportunity to show our gratitude for all those who helped us getting this task
done in time.
First of all, we are reciprocally thankful to our families back home who have been the sources
of continuous encouragement and support all the way long. Their paramount encouragement
and confidence always pushed us to go one step further in doing this task brilliantly to meet
our degree requirements. Second, we are greatly indebted to our tutor Petra Andersson who
helped us a lot in the completion of this thesis and without her guidance we would not be able
to write this thesis. Her critical judgement and review shaped this thesis up to the mark of
being a quality manuscript. Third, we are particularly thankful to our opposition group for
their valuable comments and suggestions on our script. They have been competently helpful
and we owe them our sincere appreciation. Moreover, we also owe a favour to our examiner
Åsa Gustavsson for her understanding and feedback throughout the seminars. Finally, we are
single handedly thankful to each other in a group to stand committed and cooperative in
completing our thesis.
Last but not the least; we are whole heartedly like to thank Mr. Attique Aslam (Head Supply
Chain, LPCL) and Mr Naveed Ijaz (Plant Manager, LPCL) for their confidence
encouragement throughout the entire thesis of ours. They have been supportive enough to in
time provision of relevant data and information whenever we asked for. Their continuous
review of the work helped us to secure scientific credibility of our thesis. Moreover, we are
also obliged to thank purchasing managers at LPCL for their precious time.
Kamonmarn Jaenglom Ahmed Nawaz Shaikh Zaheer Tariq
____________________ ____________________ _______________
M. Rizwan ul Haque
___________________
iii
Master Thesis
Summary
Degree Project Advanced Level - Business Administration, Linnaeus Business School at
Linnaeus University, Business Process and Supply Chain Management, 4FE02E, Spring
2010.
Authors: Muhammad Rizwan ul Haque, Ahmed Nawaz Shaikh, Kamonmarn Jaenglom,
Zaheer Tariq
Tutor: Petra Andersson
Title: Supplier Selection Process Improvement through Six-Sigma DMAIC (A case of
Lafarge Pakistan Cement Limited)
Background: Cement industry is considered to be an intensive supplier base industry.
Cement manufacturing involves several types of suppliers ranging from general utilities to
large plant equipments. Also, supply chain performance is significant topic in many cement
organisations. The supply chain department at Lafarge Pakistan Cement Limited (LPCL)
wants to inspect and improve their supplier selection process. The intended objective of this
inspection is two folded. First, LPCL wants to develop a competitive supplier base out of
bulk suppliers available in the market that would result in competitive advantage over its
competitors. Second, they want to improve their supplier selection process so that there
would be low variance and exclusion of unnecessary activities that would ultimately help in
achieving the cost, quality and service enhancement objectives.
Research question:
How can the existing supplier selection process at Lafarge Pakistan Cement Limited (LPCL)
be improved by applying Six-Sigma DMAIC?
Methodology:
This thesis is a descriptive case study and was conducted with a deductive approach. Data
was collected through interviews, discussions and questionnaire. The scientific credibility of
this thesis was secured by using many sources, avoidance of assumptions, studying a
common process and following standardized steps of supplier selection.
iv
Master Thesis
Conclusion:
The existing process of supplier selection at LPCL was defined and mapped to understand the
process characteristics and capabilities. The existing process was then analysed to identify
problem areas, variations and unnecessary activities. Corrective actions were recommended
to deal with problem areas and an improved supplier selection process for LPCL was
suggested with process coordination and control measures.
Suggestions for future research:
Based on the findings of this thesis, we suggest that the further research for LPCL could be
done in the area of sourcing and suppliers relationship management. Sourcing; a study could
examine the sourcing policy at LPCL on purchasing practises of products. It would also be
interesting to focus more on this area which leads to excellent cost reduction. Using scenario
method could compare and analyse regional, national and worldwide sourcing. Supplier
Relationship Management; a study could investigate supplier relationship management that
leads to creating a competitive advantage for LPCL through the development of supplier
performance monitoring and supplier development programme. More details could
continuously move towards cost reduction, increased reliability and risk mitigation,
transparency of supplier costs and quality, and enhanced efficiency of sourcing process.
v
Master Thesis
Table of Contents
Dedication ...................................................................................................................................i
Acknowledgement .....................................................................................................................ii
Summary.................................................................................................................................. iii
List of Abbreviation............................................................................................................... viii
1. Introduction............................................................................................................................1
1.1 Background......................................................................................................................1
1.2 Problem Discussion .........................................................................................................3
1.3 Research Question ...........................................................................................................4
1.4 Purpose.............................................................................................................................4
1.5 Thesis Disposition............................................................................................................4
1.6 Time Schedule .................................................................................................................5
2. Methodology..........................................................................................................................6
2.1 Research Strategy: Case Study ........................................................................................6
2.2 Scientific Perspective: Positivistic...................................................................................7
2.3 Scientific Approach: Deductive.......................................................................................8
2.4 Scientific Method: Qualitative.........................................................................................9
2.5 Data Collection: Primary and Secondary.......................................................................11
2.6 Scientific Credibility......................................................................................................13
2.6.1 Validity and Reliability...........................................................................................13
2.7 Summary........................................................................................................................15
3. Company Description ..........................................................................................................16
3.1 Company Presentation ...................................................................................................16
3.2 Vision.............................................................................................................................17
3.3 Mission...........................................................................................................................17
3.4 Milestones......................................................................................................................17
3.5 Products..........................................................................................................................17
3.5.1 Ordinary Portland Cement ......................................................................................17
3.5.2 Sulphate Resistant Cement .....................................................................................18
3.6 Supply Chain: Organisational Chart ..............................................................................19
4. Theoretical Framework........................................................................................................20
4.1 Supplier selection and its importance ............................................................................20
4.2 Six-Sigma – DMAIC .....................................................................................................24
vi
Master Thesis
4.3 Define.............................................................................................................................25
4.4 Measure..........................................................................................................................25
4.4.1 Process Mapping: Purpose......................................................................................25
4.4.2 Process Mapping: Flowcharting .............................................................................26
4.5 Analyse ..........................................................................................................................28
4.5.1 5W2H......................................................................................................................29
4.5.2 Cause and Effect Diagram ......................................................................................30
4.6 Improve..........................................................................................................................32
4.6.1 Failure Mode and Effect Analysis: FMEA .............................................................32
4.7 Control ...........................................................................................................................35
4.8 Chapter Summary ..........................................................................................................36
5. Empirical Findings...............................................................................................................37
5.1 Define: What is the scope/focus of process? .................................................................38
5.2 Measure: How does the process work?..........................................................................40
5.3 Analyse: What are the problems? ..................................................................................42
5.4 Improve: What can be improved?..................................................................................44
5.5 Control: How the processed is controlled? ....................................................................46
6. Empirical Analysis...............................................................................................................47
6.1 Define and Measure .......................................................................................................48
6.2 Analyse ..........................................................................................................................48
6.2.1 5W2H......................................................................................................................49
6.2.2 Cause and Effect Diagram – LPCL Supplier Selection Process.............................54
6.3 Improve..........................................................................................................................58
6.3.1 Failure Mode and Effect Analysis: FMEA .............................................................60
6.3.2 Corrective actions / Recommendations ..................................................................60
6.4 Control ...........................................................................................................................63
6.4.1 Process Management and Communication.............................................................63
7. Conclusion ...........................................................................................................................65
7.1 Results............................................................................................................................65
7.1.1 Define:.....................................................................................................................65
7.1.2 Measure:..................................................................................................................65
7.1.3 Analyse: ..................................................................................................................66
7.1.4 Improve:..................................................................................................................66
vii
Master Thesis
7.1.5 Control: ...................................................................................................................67
7.2 Own Reflections.............................................................................................................67
7.3 Suggestions for Future Research ...................................................................................68
References................................................................................................................................69
Appendix A: Questionnaire .....................................................................................................76
Appendix B: FMEA Worksheet...............................................................................................78
Appendix C: Cause & Effect Diagram ....................................................................................80
List of Figures
Figure 1: Supplier Selection Process (Wu et al., 2008).............................................................2 Figure 2: Thesis Disposition ......................................................................................................4 Figure 3: Time Schedule of Thesis ............................................................................................5 Figure 4: Difference between Scientific Approaches (Skinner, 2010) ......................................9 Figure 5: Scientific Credibility of Thesis.................................................................................14 Figure 6: Summary of Research Methodology........................................................................15 Figure 7: Organisational Chart (Supply Chain, LPCL)...........................................................19 Figure 8: The Process of Supplier Selection (Fangqi et al., 2009) ..........................................21 Figure 9: Suppliers Connectivity and enablement with company (Source: Wade, 2007) .......22 Figure 10: Supplier segmentation based on general attributes (Source: Yelvington, 2002) ...23 Figure 11: Theoretical Model ..................................................................................................23 Figure 12: Process Flowcharting Symbols (Six-Sigma Training Resource, 2009) .................27 Figure 13: 5W2H (The UK Office of Government Commerce, 2006)....................................29 Figure 14: Example of cause-and-effect diagram (Source: Goldsby and Martichenko, 2005, pp 220) .....................................................................................................................................31 Figure 15: Process FMEA Detection Evaluation Criteria (McDermott et al., 2009) ..............33 Figure 16: FMEA worksheet and the process step by step (Bolhouse, 2008) .........................34 Figure 17: Summary of Theoretical Framework .....................................................................36 Figure 18: Empirical Model.....................................................................................................37 Figure 19: LPCL Purchasing from Product Family Standpoint...............................................38 Figure 20: Procurement Process of LPCL ...............................................................................38 Figure 21: Current Supplier Selection Process Map of LPCL.................................................40 Figure 22: Procure to Pay Process in Oracle E-business Suite................................................41 Figure 23: Suppliers Module in Oracle E-business Suite ........................................................41 Figure 24: Analysis Model.......................................................................................................47 Figure 25: Existing Supplier Selection Process Map of LPCL................................................48 Figure 26: Cause-and-Effect Diagram for LPCL Supplier Selection Process.........................55 Figure 27: Improved Supplier Selection Process for LPCL ....................................................59
viii
Master Thesis
List of Tables
Table 1: Differing Characteristics of Qualitative and Quantitative Research Methods (Sogunro, 2001) .......................................................................................................................10 Table 2: Interview/Discussion Schedule..................................................................................12 Table 3: LPCL Milestones.......................................................................................................17 Table 4: Meanings of 5W2H (Changqing et al., 2005, pp 3) ..................................................30 Table 5: Problem Occurrence table..........................................................................................52 Table 6: Risk Priority Numbers from FMEA ..........................................................................60
List of Abbreviation
C3A Calcium Triode DET Ability of controls to prevent or detect DP Direct Purchase DMAIC Define, Measure, Analyze, Improve, Control EOI Expression of Interest ERP Enterprise Resource Planning ELIN Electronic Library Information Navigator FMEA Failure Mode and Effect Analysis ISM Institute for Supply Management JIT Just in Time LIT Limited Invitation of Tender LPCL Lafarge Pakistan Cement Limited LOI Letter of Intent L/C Letter of Credit MBO Management By Objectives OCC Frequency of occurrence OCI Orascom Construction Industries OPC EN Ordinary Portland Cement (European Standard) PO Purchase Order PR Purchase Request PAKCEM Pakistan Cement RFI Request for Information RFQ Request for Quotation RPN Risk Priority Number SRC Sulphate Resistant Cement SAQ Self-Assessment Questionnaire SEV Severity of effects SS Single Source SPSS Statistical Package for the Social Science TCO Total Cost of Ownership TE Tender Enquiry TQM Total Quality Management 5W2H Why, What, Where, Who, When, How and How much 5W1H Why, What, Where, Who, When and How
Chapter 1: Introduction
1
1. Introduction
I n this first chapter, reader will be introduced to the subject. The background will provide reader with an overview to subject area of this thesis. Further on the problem discussion will be presented which will then be translated into research question for this thesis. Finally, the objective of this thesis will be devised.
1.1 Background
A basic part of business management is the purchasing function which has the prime
responsibility of supplier selection. This is valid for both types of business enterprises,
manufacturing and service firms, and for the acquisition of all types of products and services,
including major materials and equipment. In highly competitive global operating
environment, it is impossible to produce low cost and high quality products successfully
without competent suppliers. (Weber et al., 1991)
The selection of competent suppliers has long been regarded as one of the most important
functions to be performed by a purchasing department. For example, in one of the earliest
purchasing texts, Lewis (1943) stated that among all those responsibilities which belong to
purchasing officer - selection of proper source is likely to be more important responsibility
and in his views in some cases it is the most significant factor in purchasing.
The current competitive environment in global marketplace is continuously changing. To be
successful in this uncertain environment, all the players in supply chain should respond
quickly to the market demand. A supplier plays an important role in supply chain in term of
production cost and product quality. Consequently, supplier selection becomes even more
critical for most organisations to develop a closer and long term relationship with their
supplier to build an effective supply chain. (Xiao Xia et al., 2008)
In current business environment, organisations are relying heavily on suppliers for products
and services. With this increased dependence on suppliers and the growing complexity of
products & services, an extended supply chain raises the importance of having an effective
supplier selection process. With the millions of suppliers in the world, an effective supplier
selection process is needed to gather intelligence on potential suppliers and select the best
suppliers. When developing partnerships with suppliers and maintaining relationship with
them, an effective supplier selection process is essential. This effective process helps
Chapter 1: Introduction
2
organisation improve process capability, improve delivery schedules, eliminate avoidable
costs and improve overall efficiency. (Zeng et al., 2008)
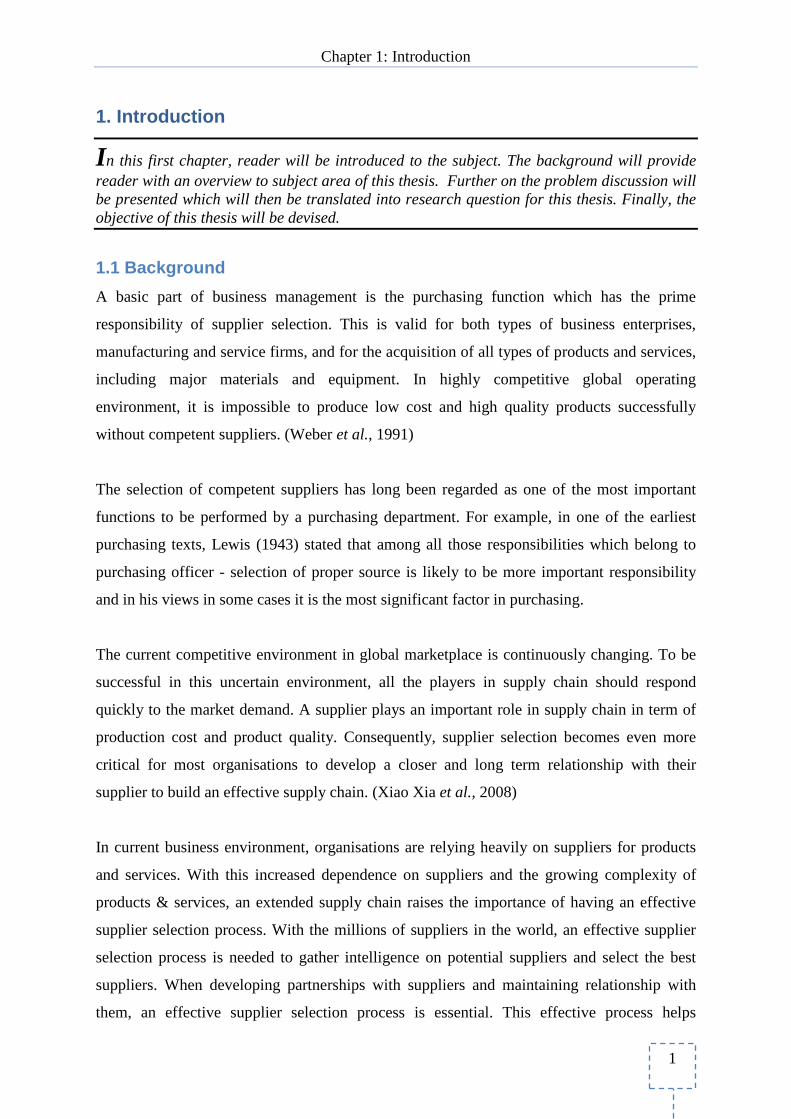
According to Wu et al. (2008), supplier selection process is like Figure 1. Enterprises
analyse market condition first. Then they ascertain supplier target that can be selected.
Supplier selection guideline is made next. Enterprise evaluates and selects excellent supplier
according to suppliers’ target and selection guideline. At last the supply chain cooperation is
established between enterprise and supplier to actualise working relationship. The supplier’s
evaluation and selection information can also feedback to market and resultantly by having
this kind of feedback suppliers can improve their capabilities/abilities. In supplier selection
process, enterprise must determine starting point of every step because every step is a
dynamic procedure to improve the business.
Figure 1: Supplier Selection Process (Wu et al., 2008)
The purchasing function has been receiving increasing importance as a critical supply chain
management component. This is mainly due to the significant impact of material costs on
profits, increased investments in advanced manufacturing and information technologies, and
a growing emphasis on Just-In-Time (JIT) production. The critical objectives of purchasing
department include obtaining the product; at the right cost, in the right quantity, with the right
Chapter 1: Introduction
3
quality, at the right time and from the right source. So, executing effective decisions
concerning supplier selection is single handily critical part of purchasing function. (Sarkis
and Talluri, 2002)
Today, the uncertainty creates a drag on supply chain performance involving all processes.
Thus, Six-Sigma has become useful methodology to improve the quality of all supply chain
processes intended to cost reduction, improved resource utilization, and improved process
efficiency (Wang et al., 2004). Conceptually, Six-Sigma is focused on variation reduction. If
companies can understand and reduce variation in their processes, then they can implement
improvement initiatives that will stabilise the process and ensure accuracy and reliability
according to the expectations (Goldsby and Martichenko, 2005).
1.2 Problem Discussion
Cement industry is considered as an intensive supplier based industry. Cement manufacturing
involves several types of suppliers ranging from general utilities to large plant equipments.
Supply chain performance is also a significant topic in many cement organisations. The
supply chain department at Lafarge Pakistan Cement Limited (LPCL) wants to inspect and
improve their supplier selection process. The intended objective of this inspection is two
folded. First, LPCL wants to develop a competitive supplier base out of bulk suppliers
available in the market that will result in competitive advantage over its competitors. Second,
they want to improve their supplier selection process so that there would be low variance and
exclusion of unnecessary activities which will ultimately help in achieving the cost, quality
and service enhancement objectives.
An effective supplier selection process assures the success of organisation in a highly
competitive environment. To upgrade their supply chain performance and competitiveness,
organisations are seeking the ways to deal with suppliers. Supplier selection and relationship
strategies have become part of a well-managed supply chain and affect the competitiveness of
the entire supply chain. Hence, the supplier selection has become a very important matter for
effective supply chain functions of any organisation. (Xiao Xia et al., 2008)
Six-Sigma DMAIC methods can improve supplier selection process by identifying weak
areas, take corrective actions and improve continuously. This methodology is very helpful to
Chapter 1: Introduction
4
improve the supplier selection process in order to have competitive advantage. Moreover,
applying DMAIC methods to supplier selection process is one way to improve supplier base
as regard to quality, cost and service function. It will be more effective if organisations
spread Six-Sigma DMAIC methods throughout supply chain functions that have a direct
upshot on organisation’s performance. (Coronado and Antony, 2002)
1.3 Research Question
After the problem discussion and motivation of carrying out this inspection initiative,
research question for this thesis is devised as;
“How can the existing supplier selection process at Lafarge Pakistan Cement Limited
(LPCL) be improved by applying Six-Sigma DMAIC?”
1.4 Purpose
The purpose of this thesis is to study and evaluate the supplier selection process at LPCL, and
give suggestions for improvements to develop a competitive supplier base in order to get
competitive advantage in the long run. Process improvement objectives of LPCL are
matching to the rationale of Six-Sigma DMAIC process improvement methods. So, the LPCL
supplier selection process improvement by applying Six-Sigma DMAIC methods is set to be
the objective of carrying out this thesis.
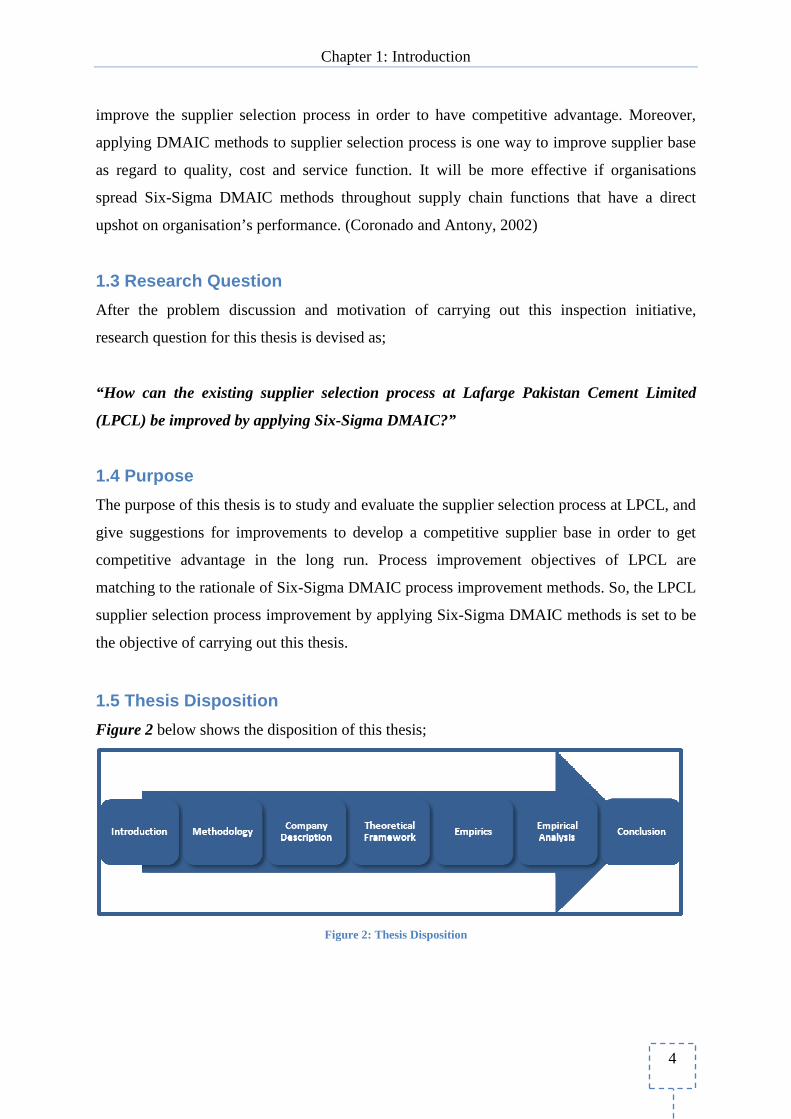
1.5 Thesis Disposition
Figure 2 below shows the disposition of this thesis;
Figure 2: Thesis Disposition
Chapter 1: Introduction
5
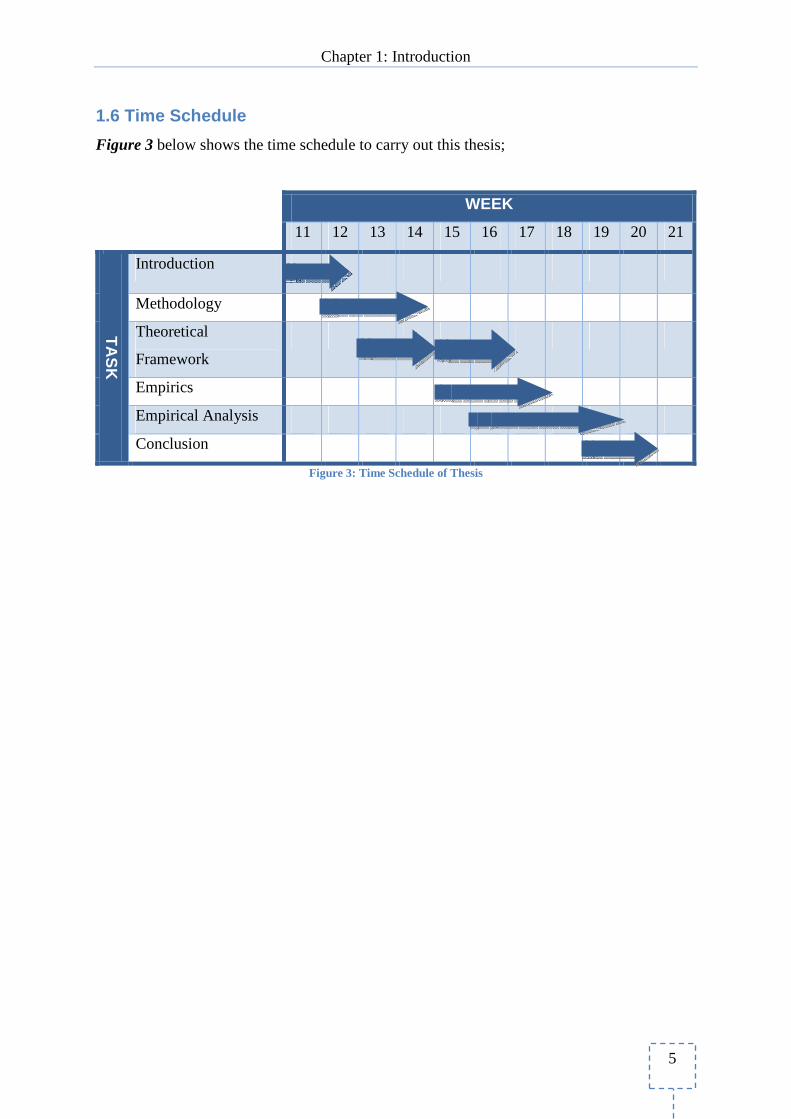
1.6 Time Schedule
Figure 3 below shows the time schedule to carry out this thesis;
WEEK
11 12 13 14 15 16 17 18 19 20 21
Introduction
Methodology
Theoretical
Framework
Empirics
Empirical Analysis
TA
SK
Conclusion
Figure 3: Time Schedule of Thesis
Chapter 2: Methodology
6
2. Methodology
I n this chapter, methodological choices for this research will be presented and motivated. The research strategy will be discussed. The scientific perspective, approach and method for thesis will be discussed in details. Further on the data collection methodologies will be presented and finally the scientific credibility of thesis will be discussed in details.
According to Jonker and Pennink (2010), methodology is, broadly speaking, the way in
which a researcher conducts research. The researcher has to consider the way in which he is
going to organise and establish his overall research approach, by choosing how he wishes to
conduct the research. The researcher may decide to create a questionnaire and send it to
people in the organisation. He can also opt to work in the organisation in order to be able to
observe the organisation as he collects data. The method he selects depends both on the
nature of the question, and on the view of what he considers to be a good research.
There are two clear categories as suggested by Jonker and Pennink (2010):
• The first researcher conducts research in the organisation by means of a well defined
research question. This question often appears to have a closed character. This form
of research is characterized by research activities that are accomplished in a definite
order of rank.
• The second researcher conducts research ‘with’ the organisation, often based on an
open question. What needs to be examined exactly, let alone how it should be done, is
not determined in advance. The most important element of research based on an open
question is the ‘search behaviour’ of the researcher. Research questions are used as
‘road signs’ leading from one place to the next.
2.1 Research Strategy: Case Study
According to Yin (2003), the case study method has a distinct advantage in situations when a
"how" or "why" question is being asked about a contemporary set of events, over which the
investigator has little or no control and when the focus is on contemporary phenomenon
within some real-life context.
Chapter 2: Methodology
7
Case studies are found even in economics, in which the structure of a given industry may be
investigated by using the case study method. The case study, like other research strategies, is
a way of investigating an empirical topic by following a set of pre-specified procedures (Yin,
2003).
Case Study of Thesis
In today’s highly competitive environment, an effective supplier selection process is very
important. Under this situation, LPCL wants to improve quality of its supplier selection
process to develop a competitive supplier base in order to achieve continuous improvement
and service enhancement of supply chain department at LPCL.
This thesis contains interviews with different people from different position concerning
supplier selection process at LPCL. The case study method is a way to investigate supplier
selection process to understand the current process in depth. Further, the thesis figure out how
to deal with problems in this process and provide process improvements that company needs
to follow.
2.2 Scientific Perspective: Positivistic
In view of Thomas (2004), there are two major orientations in scientific perspective;
positivism and hermeneutics. However, there are several key differences in main idea within
each orientation. According to Jonker and Pennink (2010), a specific research methodology
explains the behaviour of the researcher. Therefore, the affinity will be determined in
drawing up a research.
The Positivism approach is commonly used in science. The researchers express relationship
between elements or variables, and then relate them to theory (Neville, 2005). This approach
is aimed to build general theories and provide solution in practice. Researchers deal with
problems by following three steps; diagnose a clear problem definition, design the solution
and implement the solution (Thomas, 2004). Practically, the result of development and
implementation come with numerous techniques. The researchers attribute these tools and
techniques during implementation approach and lead the project in a methodologically
correct way for specific situation (Jonker and Pennink, 2010).
Chapter 2: Methodology
8
The Hermeneutics approach, according to Neville (2005), intends to understand human
behaviour; however, it is not easy to generalise in the natural sciences regarding to inner
thought processes. In this perspective, researcher places his/her own thought on events and
perform action in unpredictable ways. According to the human stage, there are a wide range
of variables. This approach relates to the understanding behaviour from the participants
reference and tries to describe and explain events from behaviour.
Scientific Perspective of Thesis
This thesis has mainly a positivism approach by using general theories such as Six-Sigma
DMAIC for supplier selection process at LPCL. The information used was collected from
interviews and historical/current data from LPCL. Further, this thesis analyses the current
supplier selection process with the application of Six-Sigma DMAIC methods for ultimately
achieving process improvement objectives.
2.3 Scientific Approach: Deductive
There are two aspects of scientific research, one is deduction method and the other is
induction method (Perry and Jensen, 2001). Inductive and deductive methods are more or less
presumed as learning style issue (Grumbine et al., 2005).
Deductive approach can be used in a systematic way on the basis of established ideas
(Neville, 2005). Generally deductive method is used by researchers who want to have general
principles identified and try to get the results out of them (Grumbine et al., 2005). The
deduction method prevails in marketing research (Perry and Jensen, 2001). Pre-existing
frameworks to the data are involved in deductive methods (Fook, 2002).
Induction method is also used in qualitative data analysis (Thomas, 2003). The involvement
of induction method is used to develop a theory form the data. For qualitative research
inductive approach is commonly used, but it is suggested to use both types (Fook, 2002). If
researcher wants to have a fresh way of looking at the subject in terms of reward he might use
inductive approach (Neville, 2005). For management and sociology research, induction
method is widely used (Perry and Jensen, 2001).
Chapter 2: Methodology
9
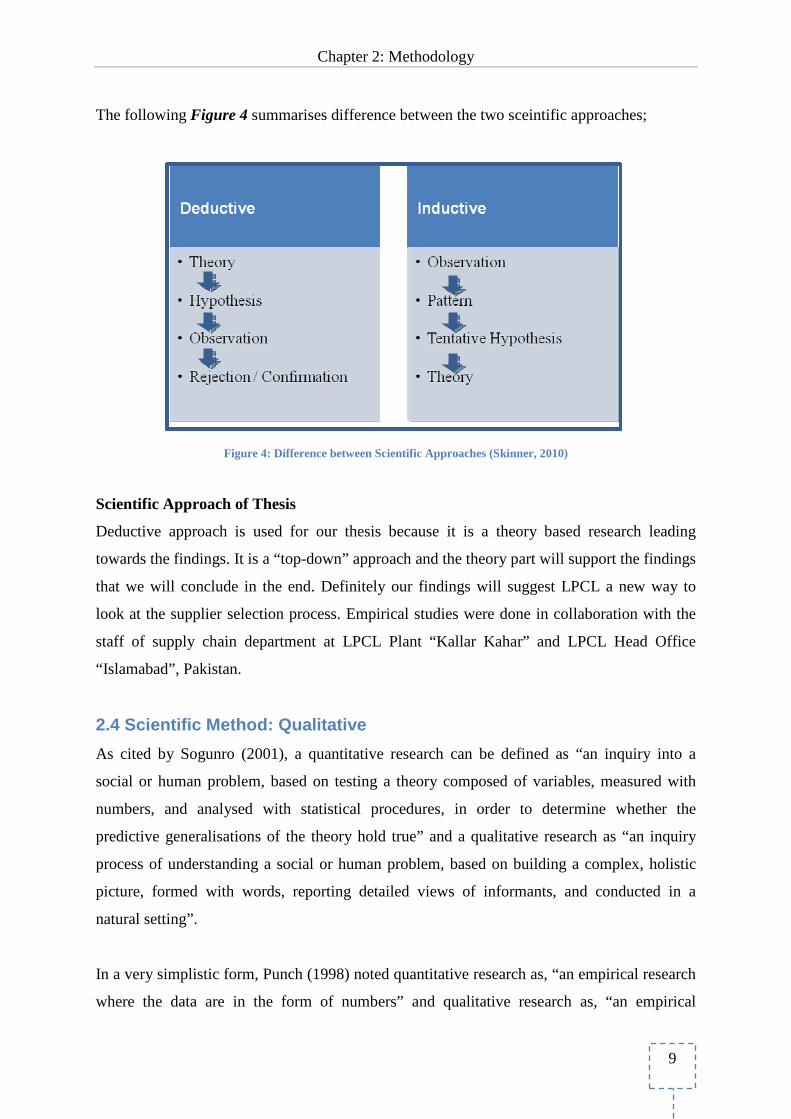
The following Figure 4 summarises difference between the two sceintific approaches;
Figure 4: Difference between Scientific Approaches (Skinner, 2010)
Scientific Approach of Thesis
Deductive approach is used for our thesis because it is a theory based research leading
towards the findings. It is a “top-down” approach and the theory part will support the findings
that we will conclude in the end. Definitely our findings will suggest LPCL a new way to
look at the supplier selection process. Empirical studies were done in collaboration with the
staff of supply chain department at LPCL Plant “Kallar Kahar” and LPCL Head Office
“Islamabad”, Pakistan.
2.4 Scientific Method: Qualitative
As cited by Sogunro (2001), a quantitative research can be defined as “an inquiry into a
social or human problem, based on testing a theory composed of variables, measured with
numbers, and analysed with statistical procedures, in order to determine whether the
predictive generalisations of the theory hold true” and a qualitative research as “an inquiry
process of understanding a social or human problem, based on building a complex, holistic
picture, formed with words, reporting detailed views of informants, and conducted in a
natural setting”.
In a very simplistic form, Punch (1998) noted quantitative research as, “an empirical research
where the data are in the form of numbers” and qualitative research as, “an empirical
Chapter 2: Methodology
10
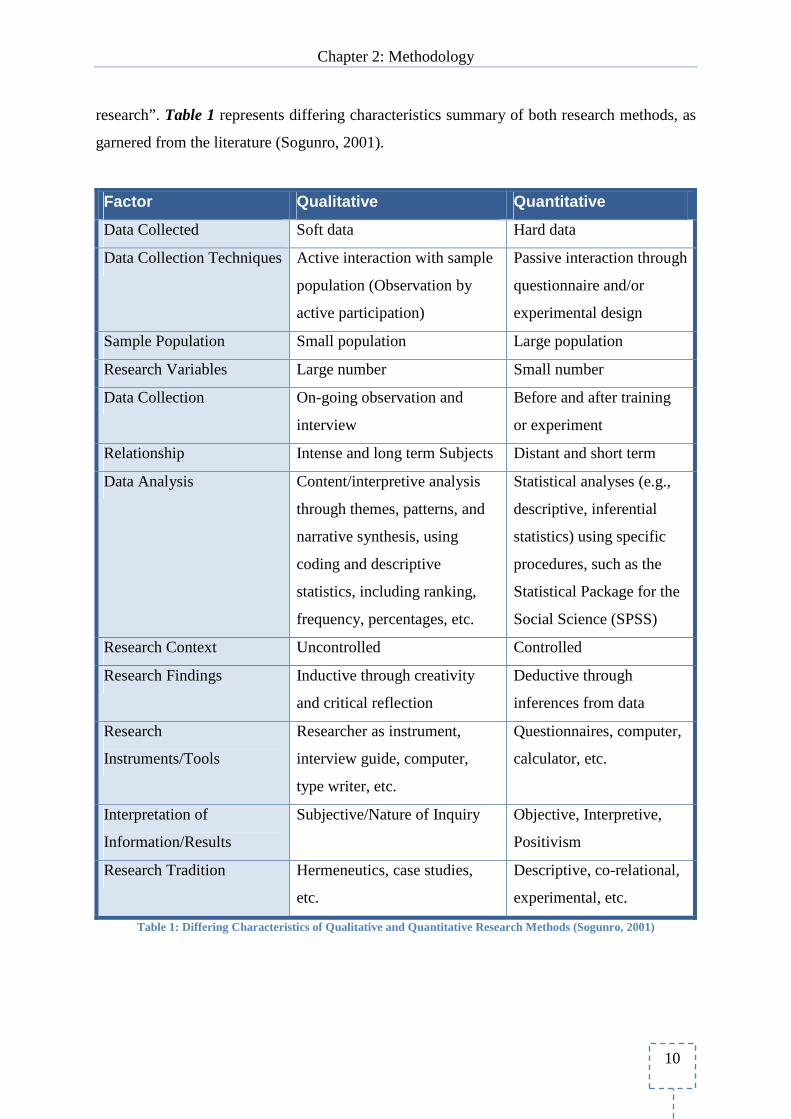
research”. Table 1 represents differing characteristics summary of both research methods, as
garnered from the literature (Sogunro, 2001).
Factor Qualitative Quantitative
Data Collected Soft data Hard data
Data Collection Techniques Active interaction with sample
population (Observation by
active participation)
Passive interaction through
questionnaire and/or
experimental design
Sample Population Small population Large population
Research Variables Large number Small number
Data Collection On-going observation and
interview
Before and after training
or experiment
Relationship Intense and long term Subjects Distant and short term
Data Analysis Content/interpretive analysis
through themes, patterns, and
narrative synthesis, using
coding and descriptive
statistics, including ranking,
frequency, percentages, etc.
Statistical analyses (e.g.,
descriptive, inferential
statistics) using specific
procedures, such as the
Statistical Package for the
Social Science (SPSS)
Research Context Uncontrolled Controlled
Research Findings Inductive through creativity
and critical reflection
Deductive through
inferences from data
Research
Instruments/Tools
Researcher as instrument,
interview guide, computer,
type writer, etc.
Questionnaires, computer,
calculator, etc.
Interpretation of
Information/Results
Subjective/Nature of Inquiry Objective, Interpretive,
Positivism
Research Tradition Hermeneutics, case studies,
etc.
Descriptive, co-relational,
experimental, etc.
Table 1: Differing Characteristics of Qualitative and Quantitative Research Methods (Sogunro, 2001)
Chapter 2: Methodology
11
Scientific Method of Thesis
In this thesis, the qualitative research method is used in order to understand the current
process in depth. For example, the approach was to investigate the current supplier selection
process at LPCL and suggest improvements after identifying the variations, unnecessary
activities and problems. The information was collected from interviews. The thesis will be
expected to clarify the LPCL’s current supplier selection process about what kind of
problems there are in the current process; furthermore, create an improved process map in
order to continuous improvement and service enhancement objectives at LPCL.
2.5 Data Collection: Primary and Secondary
Two major types of data have dominated debate in methodology research i.e., primary data
and secondary data. The primary data is facts and information collected by researchers for
specific purpose (Rabianski, 2003). The methods for primary data involve interviews,
observation and questionnaire. Interview techniques can be used in different forms such as
personal direct contact, phone, e-mail or other communication media. The interviews consist
of three main types: structured interviews, semi-structured interviews and unstructured
interviews. Structured Interviews are the use of questions based on specific set of queries
read out by a researcher. For Semi-structured interviews, the interviewer will have a list of
some standardised questions but the interviewer may add or omit some questions depending
on the situation. Unstructured interviews are informal discussions. The researcher will have a
range of topics to handle the discussion. (Neville, 2005)
The process of observation is the way of gathering data by researcher and sharing the
experiences in any situation. The observers will see a true fact while being observed.
Observation takes place at the same place and same time when the action occurs. During the
observation, the observer risks loss of information concerning to forgetfulness,
disorganisation, or mismanagement of the facts. The questioning process can provide
information through the set of question. However, the collected information might be
inaccurate due to misunderstood question and fabricated answer. Primary data can lead to
error or less accuracy, therefore secondary data is considered for more accurate information.
(Rabianski, 2003)
Chapter 2: Methodology
12
Secondary data is the facts and information from secondary source including published and
unpublished work based on research of primary data (Rabianski, 2003). The greater use of
secondary data is freely available without limitation. Everyone can access to data and get
benefit from the shared research data. The researcher may add value by analysis of impartial
secondary source. Secondary data can be found in all written material such as books, articles,
and reports. However, the researchers commonly use more than one sources; primary data
and secondary data, to arise their knowledge of the subject. (Nicholson and Bennett, 2009)
Data collection of this thesis
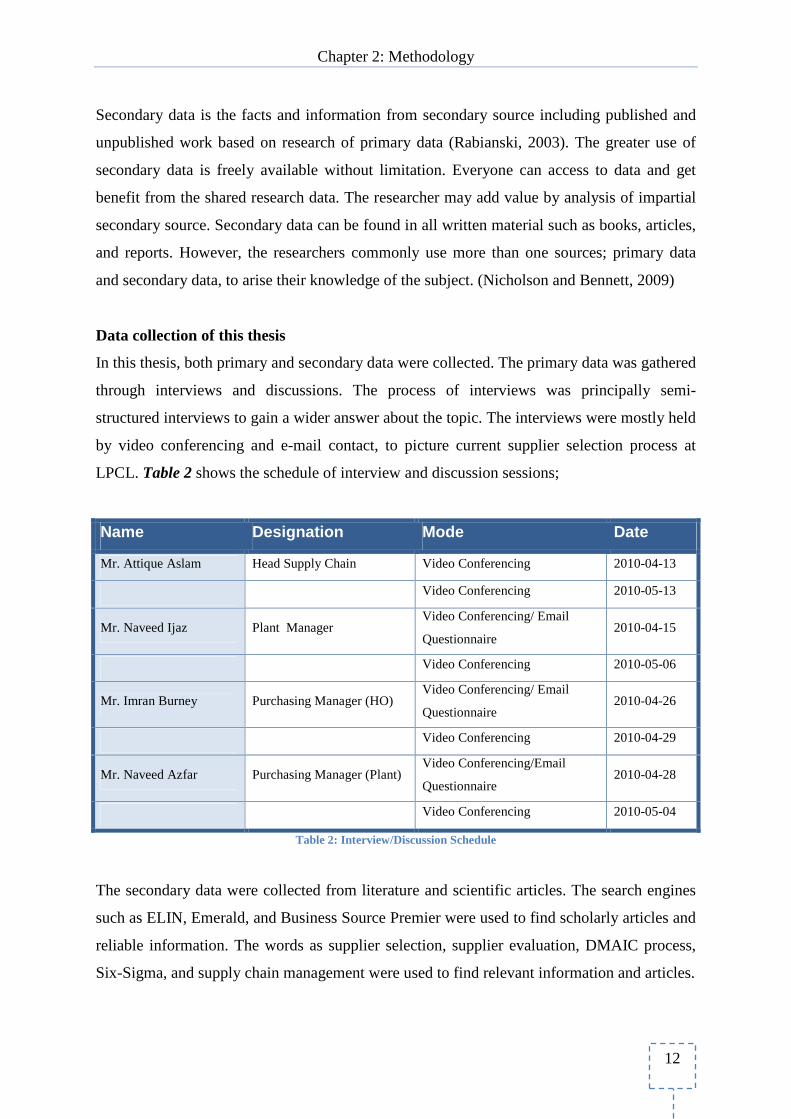
In this thesis, both primary and secondary data were collected. The primary data was gathered
through interviews and discussions. The process of interviews was principally semi-
structured interviews to gain a wider answer about the topic. The interviews were mostly held
by video conferencing and e-mail contact, to picture current supplier selection process at
LPCL. Table 2 shows the schedule of interview and discussion sessions;
Name Designation Mode Date
Mr. Attique Aslam Head Supply Chain Video Conferencing 2010-04-13
Video Conferencing 2010-05-13
Mr. Naveed Ijaz Plant Manager Video Conferencing/ Email
Questionnaire 2010-04-15
Video Conferencing 2010-05-06
Mr. Imran Burney Purchasing Manager (HO) Video Conferencing/ Email
Questionnaire 2010-04-26
Video Conferencing 2010-04-29
Mr. Naveed Azfar Purchasing Manager (Plant) Video Conferencing/Email
Questionnaire 2010-04-28
Video Conferencing 2010-05-04
Table 2: Interview/Discussion Schedule
The secondary data were collected from literature and scientific articles. The search engines
such as ELIN, Emerald, and Business Source Premier were used to find scholarly articles and
reliable information. The words as supplier selection, supplier evaluation, DMAIC process,
Six-Sigma, and supply chain management were used to find relevant information and articles.
Chapter 2: Methodology
13
2.6 Scientific Credibility
Bocking (2004) defined scientific credibility as the range of science related to reliable
information source of the world. Adams et al. (2007) identified three general criteria’s for
testing and evaluating variable measurements that also assess data quality and overall
precision of study results. These three criteria’s are reliability, validity and generalisation.
These are considered to be very important, both in qualitative and quantitative research.
These three criteria’s are commonly found in quantitative research as the findings of actual
reality can be generalised. However qualitative research includes theoretical complexity and
methodological rigidity therefore findings are difficult to generalise.
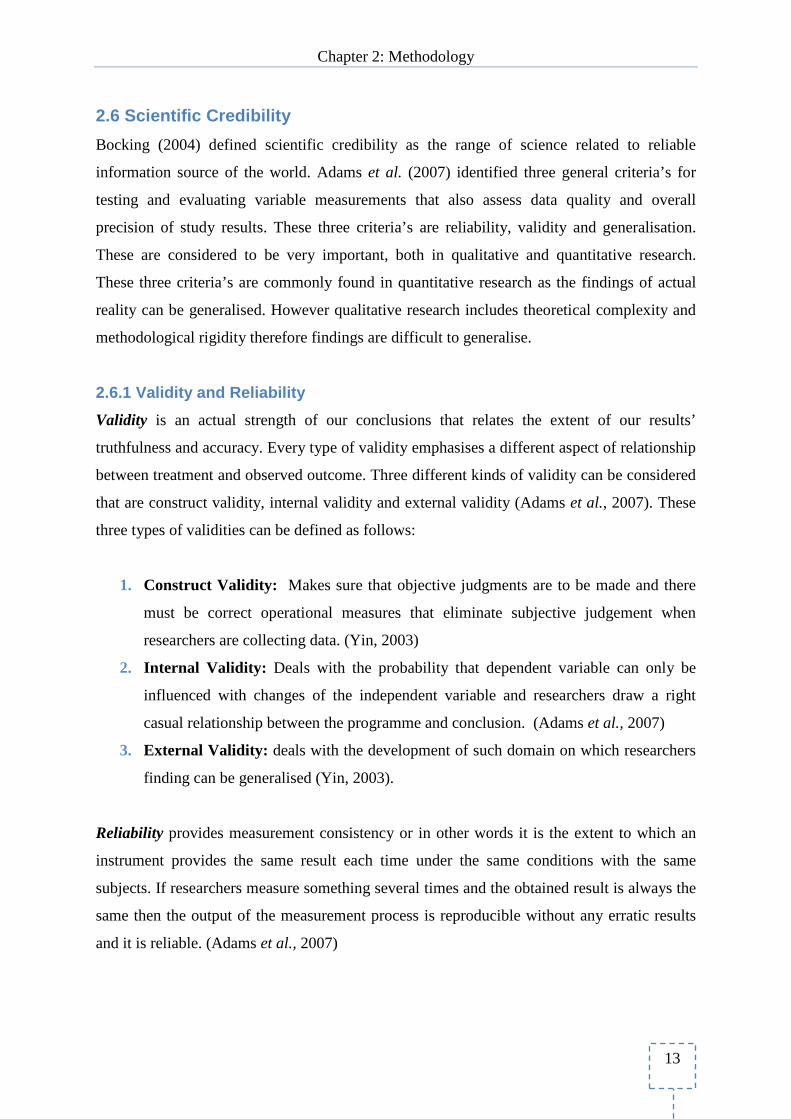
2.6.1 Validity and Reliability
Validity is an actual strength of our conclusions that relates the extent of our results’
truthfulness and accuracy. Every type of validity emphasises a different aspect of relationship
between treatment and observed outcome. Three different kinds of validity can be considered
that are construct validity, internal validity and external validity (Adams et al., 2007). These
three types of validities can be defined as follows:
1. Construct Validity: Makes sure that objective judgments are to be made and there
must be correct operational measures that eliminate subjective judgement when
researchers are collecting data. (Yin, 2003)
2. Internal Validity: Deals with the probability that dependent variable can only be
influenced with changes of the independent variable and researchers draw a right
casual relationship between the programme and conclusion. (Adams et al., 2007)
3. External Validity: deals with the development of such domain on which researchers
finding can be generalised (Yin, 2003).
Reliability provides measurement consistency or in other words it is the extent to which an
instrument provides the same result each time under the same conditions with the same
subjects. If researchers measure something several times and the obtained result is always the
same then the output of the measurement process is reproducible without any erratic results
and it is reliable. (Adams et al., 2007)
Chapter 2: Methodology
14
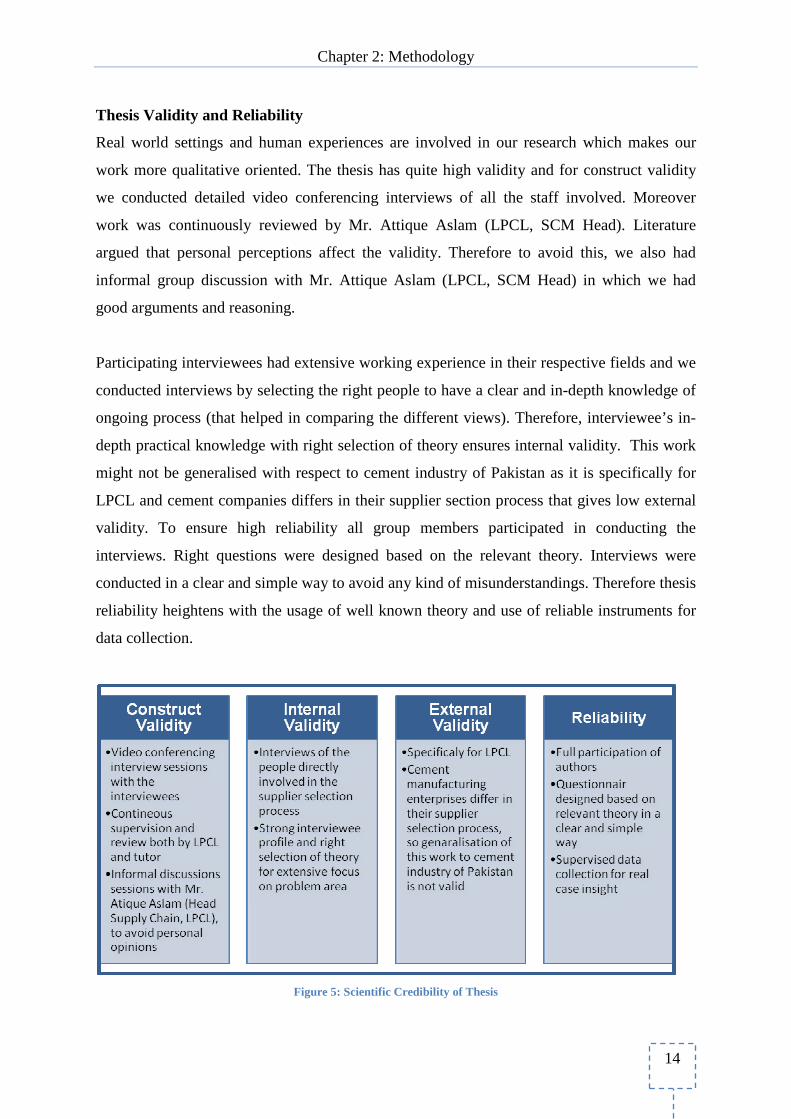
Thesis Validity and Reliability
Real world settings and human experiences are involved in our research which makes our
work more qualitative oriented. The thesis has quite high validity and for construct validity
we conducted detailed video conferencing interviews of all the staff involved. Moreover
work was continuously reviewed by Mr. Attique Aslam (LPCL, SCM Head). Literature
argued that personal perceptions affect the validity. Therefore to avoid this, we also had
informal group discussion with Mr. Attique Aslam (LPCL, SCM Head) in which we had
good arguments and reasoning.
Participating interviewees had extensive working experience in their respective fields and we
conducted interviews by selecting the right people to have a clear and in-depth knowledge of
ongoing process (that helped in comparing the different views). Therefore, interviewee’s in-
depth practical knowledge with right selection of theory ensures internal validity. This work
might not be generalised with respect to cement industry of Pakistan as it is specifically for
LPCL and cement companies differs in their supplier section process that gives low external
validity. To ensure high reliability all group members participated in conducting the
interviews. Right questions were designed based on the relevant theory. Interviews were
conducted in a clear and simple way to avoid any kind of misunderstandings. Therefore thesis
reliability heightens with the usage of well known theory and use of reliable instruments for
data collection.
Figure 5: Scientific Credibility of Thesis
Chapter 2: Methodology
15
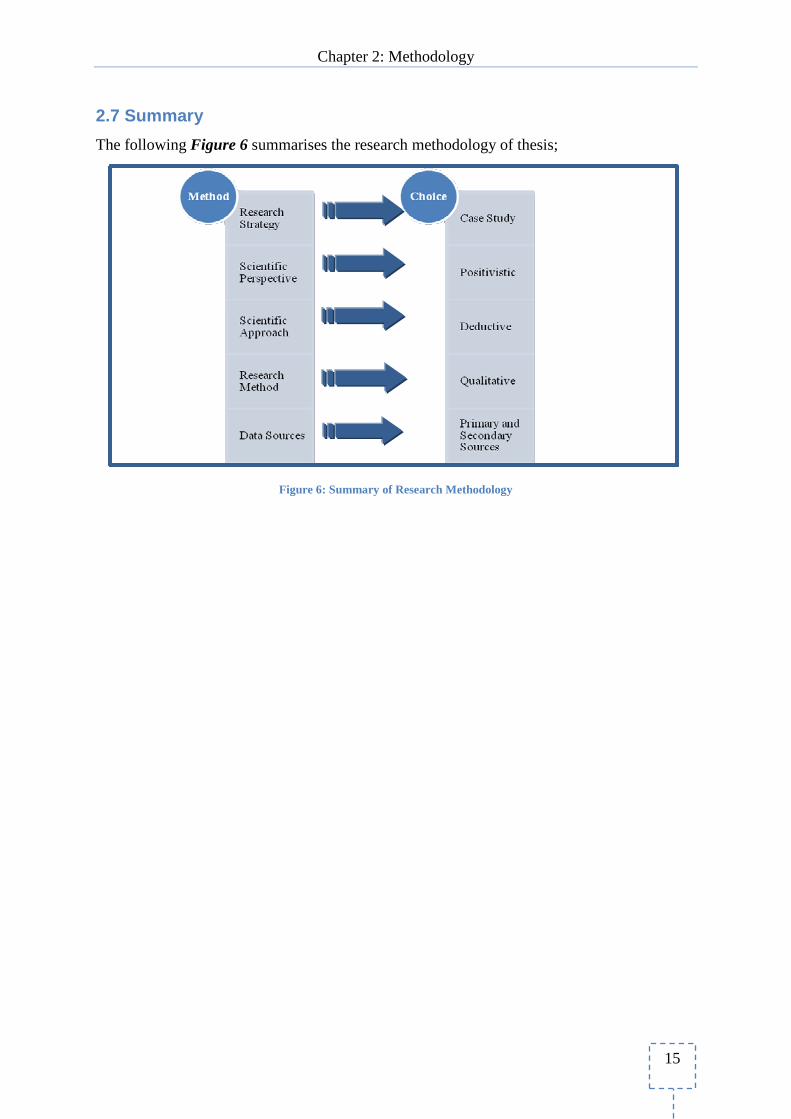
2.7 Summary
The following Figure 6 summarises the research methodology of thesis;
Figure 6: Summary of Research Methodology
Chapter 3: Company Description
16
3. Company Description
This chapter includes the company presentation. The organisation’s operations will be discussed. Company’s mission, vision, milestones and products will be presented. Finally, the organisational chart of supply chain department will be presented. The information presented in this chaptered is gathered directly from LPCL and its web-site.
3.1 Company Presentation
Lafarge Pakistan Cement Limited (LPCL) is a part of Lafarge, world leader of construction
materials. The state-of-the-art plant commenced Commercial Operations in December 2006
with an annual cement production capacity of 2.5m tons, thus becoming the largest
production line in Pakistan. LPCL is proud of its product PAKCEM which is the leader on all
quality scales. PAKCEM is the first cement in Pakistan to comply with European Standards
(EN 197) and Indian Standards (IS 12269) also far exceeding requirements of Pakistani
Standard (PS 232). LPCL’s aim of being at the forefront in creating foundations for a
prosperous tomorrow is backed by the Company’s philosophy of providing outstanding value
to its customers, a safe and stimulating work environment for its employees, superior returns
for its shareholders and special focus on social responsibility and environmental protection.
Lafarge Pakistan Cement Limited (LPCL) is a subsidiary of Lafarge, world leader of building
materials with its corporate headquarter in Paris, France. Lafarge is world leader in Cement
and Aggregates, and number three in Concrete and Gypsum. Lafarge extracts resources from
the heart of the earth to make materials to bring to the heart of life. Present in 78 countries,
the Group responds to the world's demand for housing and infrastructure. Lafarge is driven
by the needs of its customers, shareholders, local communities and architects. The Group
creates high value-added solutions which encourage creativity whilst leaving a lighter trace
on the world. Lafarge believes that ongoing advances in building materials must integrate
respect for people, their different needs and their environment. This strong conviction is
reflected in a strategy which combine industrial know-how with performance, value creation,
respect for employees and local cultures, environmental protection and conversation of
natural resources and energy.
Chapter 3: Company Description
17
3.2 Vision
Strive to exceed the expectations of our stakeholders through sustainable growth and high
quality performance.
3.3 Mission
We are committed to providing outstanding value to our customers, a safe and stimulating
work environment for our employees and superior returns for our shareholders.
3.4 Milestones
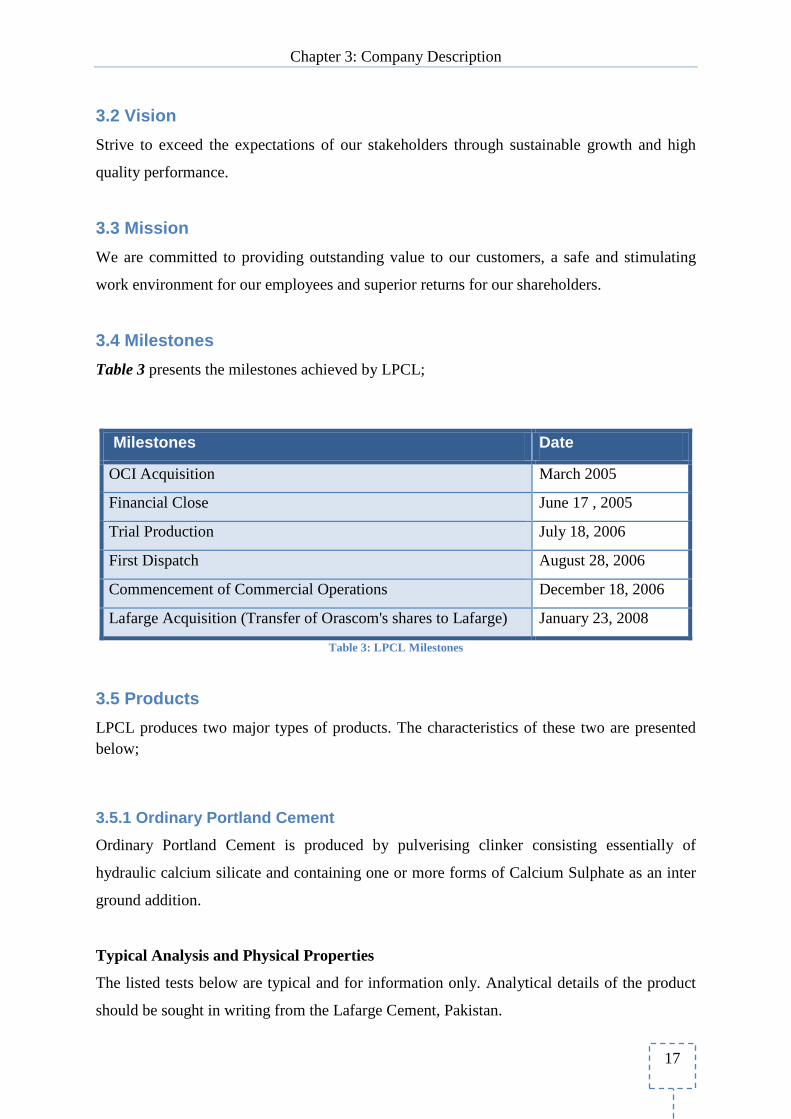
Table 3 presents the milestones achieved by LPCL;
Milestones Date
OCI Acquisition March 2005
Financial Close June 17 , 2005
Trial Production July 18, 2006
First Dispatch August 28, 2006
Commencement of Commercial Operations December 18, 2006
Lafarge Acquisition (Transfer of Orascom's shares to Lafarge) January 23, 2008
Table 3: LPCL Milestones
3.5 Products
LPCL produces two major types of products. The characteristics of these two are presented below;
3.5.1 Ordinary Portland Cement
Ordinary Portland Cement is produced by pulverising clinker consisting essentially of
hydraulic calcium silicate and containing one or more forms of Calcium Sulphate as an inter
ground addition.
Typical Analysis and Physical Properties
The listed tests below are typical and for information only. Analytical details of the product
should be sought in writing from the Lafarge Cement, Pakistan.
Chapter 3: Company Description
18
Application
The product has been designed to give enhance concrete properties in the fresh “wet” state
with adequate high early strength levels upon setting and hardening.
Assured Compliance With
European Standard
OPC EN 197-1 CEM I 52.5 R
Indian Standard
IS 12269 Grade 53
Pakistani Standard
PS 232/1983(R)
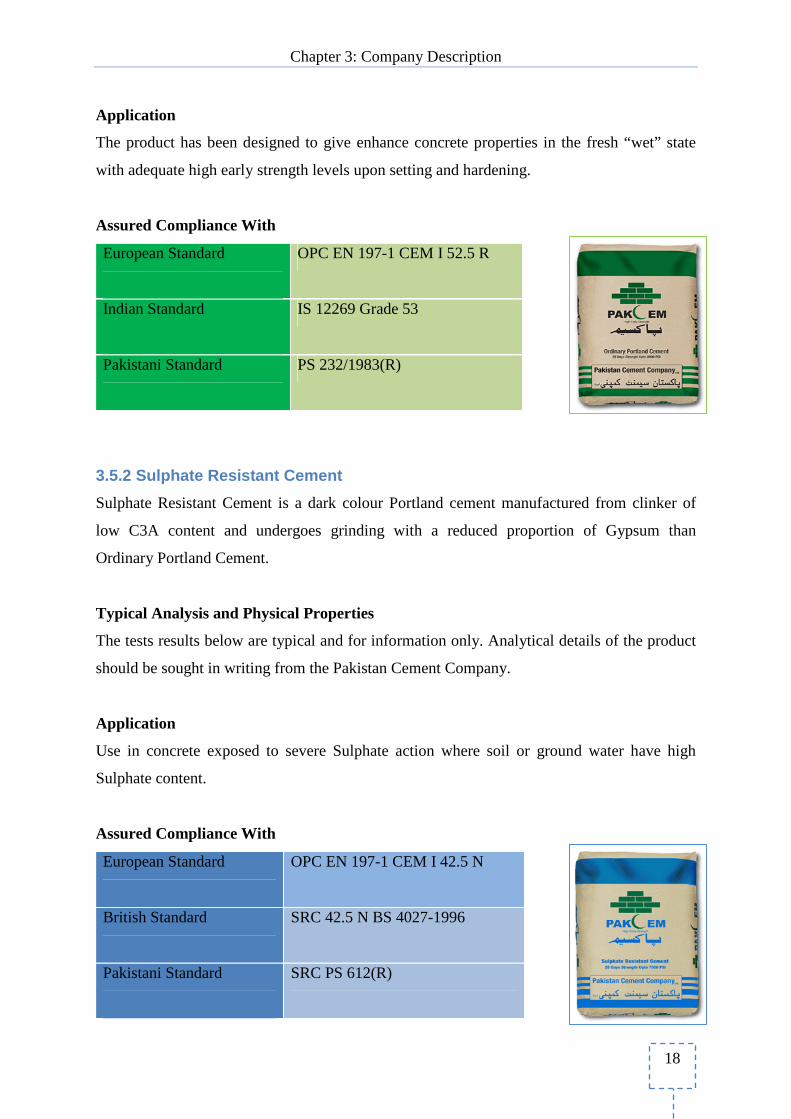
3.5.2 Sulphate Resistant Cement
Sulphate Resistant Cement is a dark colour Portland cement manufactured from clinker of
low C3A content and undergoes grinding with a reduced proportion of Gypsum than
Ordinary Portland Cement.
Typical Analysis and Physical Properties
The tests results below are typical and for information only. Analytical details of the product
should be sought in writing from the Pakistan Cement Company.
Application
Use in concrete exposed to severe Sulphate action where soil or ground water have high
Sulphate content.
Assured Compliance With
European Standard
OPC EN 197-1 CEM I 42.5 N
British Standard
SRC 42.5 N BS 4027-1996
Pakistani Standard
SRC PS 612(R)
Chapter 3: Company Description
19
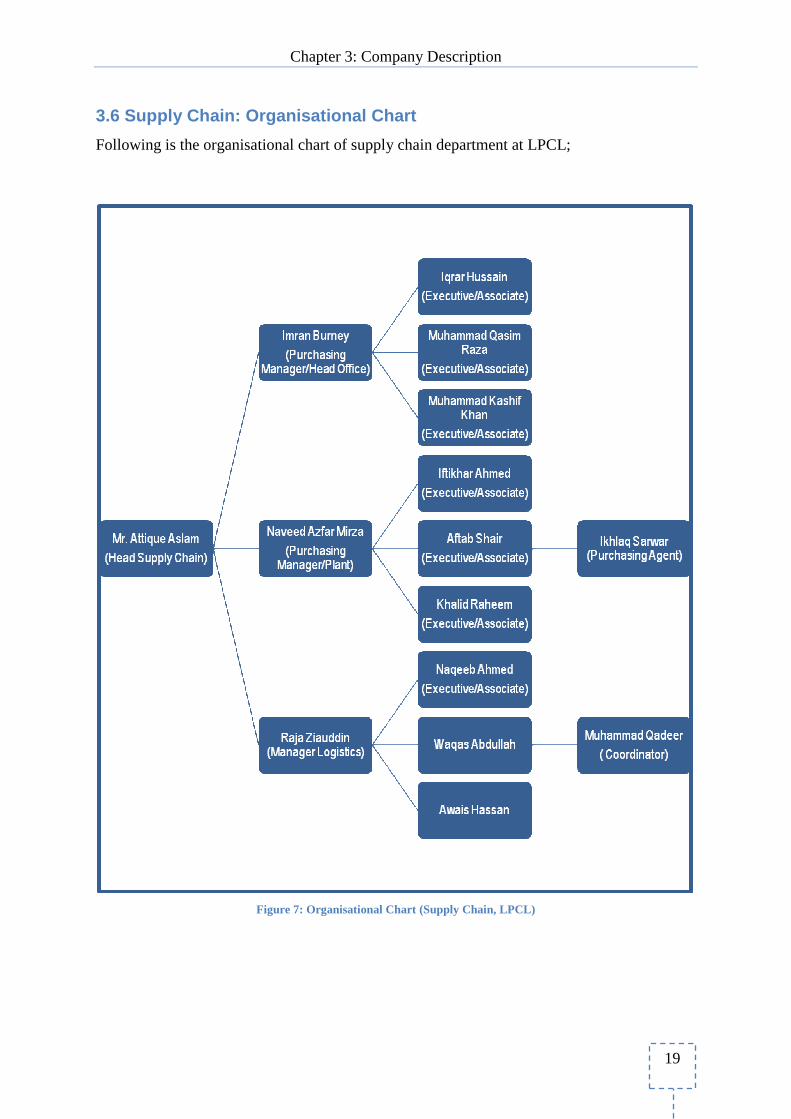
3.6 Supply Chain: Organisational Chart
Following is the organisational chart of supply chain department at LPCL;
Figure 7: Organisational Chart (Supply Chain, LPCL)
Chapter 4: Theoretical Framework
20
4. Theoretical Framework
This chapter will present theoretical references to this thesis. Initially, some reference literature about importance of supplier selection process will be presented. Further, literature references to Six-Sigma DMAIC application will be presented. This chapter will follow the structure of DMAIC model to relate its application to LPCL in the later chapters.
4.1 Supplier selection and its importance
Era of 21st century brought rapidly changing market demands and fierce global competition
for manufacturing industries. Raw materials and component parts can cost up to 70 % of the
product cost where as customers are demanding more products with high quality, low cost
and short lead time. With this kind of state of affairs, importance of appropriate supplier
selection is on the rise for manufacturers. Selecting a right supplier (having variety of
competency levels) from multiple available sources is a significant task and it is a multi-
criteria decision making problem (Fangqi et al., 2009).
The contemporary competition in the business world is not only the competition between
companies but also the competition between supply chains. In order to improve the
competitiveness of whole supply chain, companies should be very cautious when selecting
suppliers. So, the research on supplier selection has always been in focus. Supplier selection
is considered as an increasing critical issue of a supply chain for the success of an
organisation and supplier selection process is represented as competitive strategy (Saen,
2009). In support of this Heinritz et al. (1991) argued that companies having a competitive
supplier base, leads to cost-reduction possibilities, better sources for their products input and
also can have collaborative planning.
In views of Mitchell (1998) initially price factor was the primary factor of supplier selection
however recently companies not only consider the price factor but also select suppliers based
on their capabilities/abilities with mutually (win/win) beneficial relationship. By having a
supplier who offers the cheapest price does not guarantee of having a best product/service
and mutually beneficial relationship. Moreover supplier selection process should be simple
and there must not be any personal biasness in selecting the suppliers because whenever
clients (buyer) have a strong mutual benefit with specific suppliers (with the influence of
personal biasness) then errors can occur in selecting a right supplier.
Chapter 4: Theoretical Framework
21
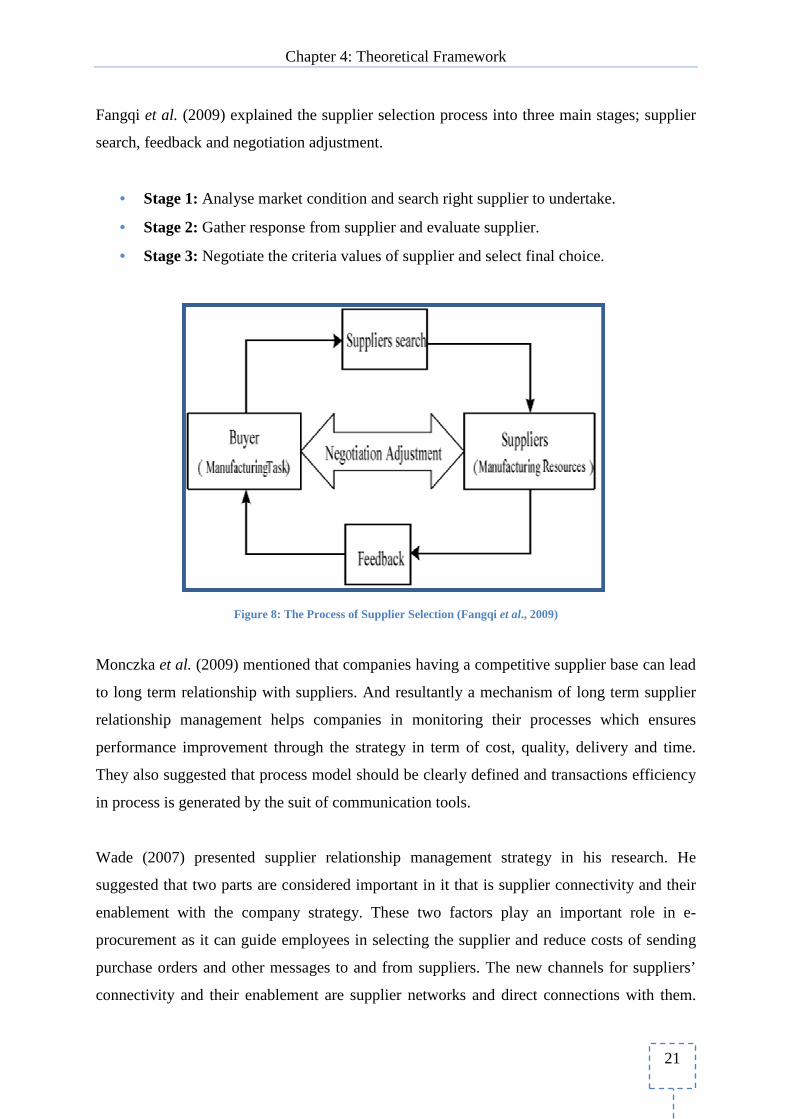
Fangqi et al. (2009) explained the supplier selection process into three main stages; supplier
search, feedback and negotiation adjustment.
• Stage 1: Analyse market condition and search right supplier to undertake.
• Stage 2: Gather response from supplier and evaluate supplier.
• Stage 3: Negotiate the criteria values of supplier and select final choice.
Figure 8: The Process of Supplier Selection (Fangqi et al., 2009)
Monczka et al. (2009) mentioned that companies having a competitive supplier base can lead
to long term relationship with suppliers. And resultantly a mechanism of long term supplier
relationship management helps companies in monitoring their processes which ensures
performance improvement through the strategy in term of cost, quality, delivery and time.
They also suggested that process model should be clearly defined and transactions efficiency
in process is generated by the suit of communication tools.
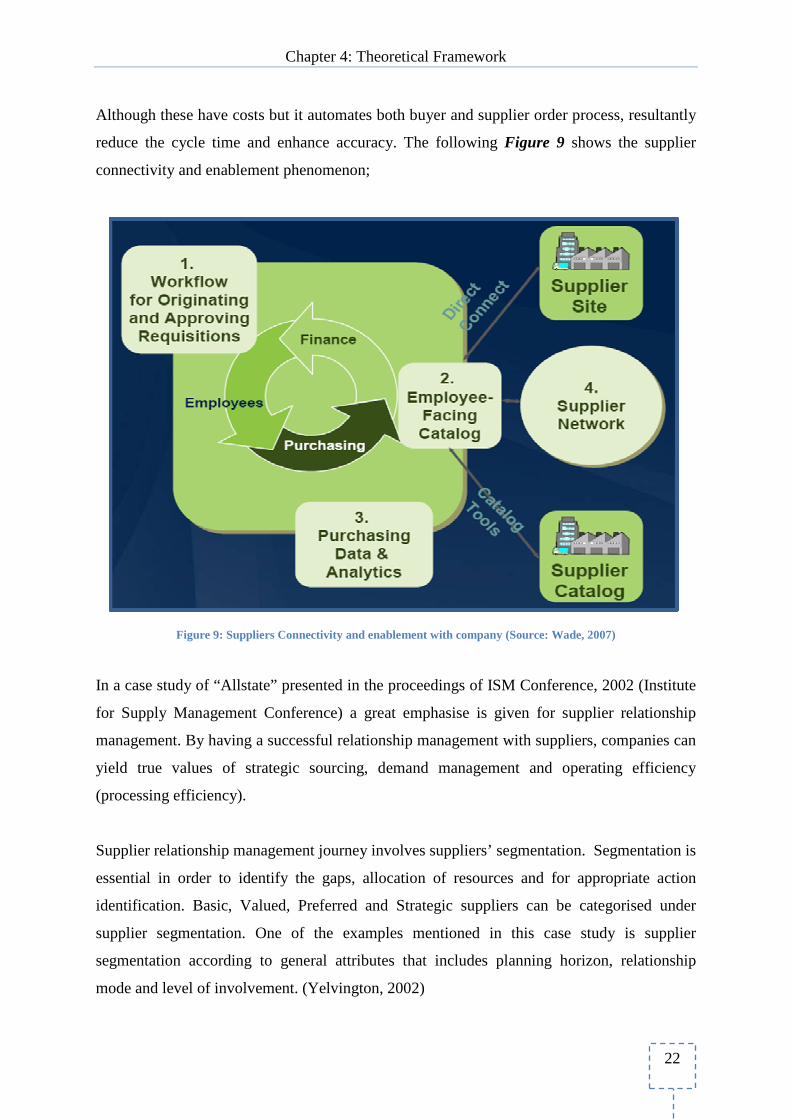
Wade (2007) presented supplier relationship management strategy in his research. He
suggested that two parts are considered important in it that is supplier connectivity and their
enablement with the company strategy. These two factors play an important role in e-
procurement as it can guide employees in selecting the supplier and reduce costs of sending
purchase orders and other messages to and from suppliers. The new channels for suppliers’
connectivity and their enablement are supplier networks and direct connections with them.
Chapter 4: Theoretical Framework
22
Although these have costs but it automates both buyer and supplier order process, resultantly
reduce the cycle time and enhance accuracy. The following Figure 9 shows the supplier
connectivity and enablement phenomenon;
Figure 9: Suppliers Connectivity and enablement with company (Source: Wade, 2007)
In a case study of “Allstate” presented in the proceedings of ISM Conference, 2002 (Institute
for Supply Management Conference) a great emphasise is given for supplier relationship
management. By having a successful relationship management with suppliers, companies can
yield true values of strategic sourcing, demand management and operating efficiency
(processing efficiency).
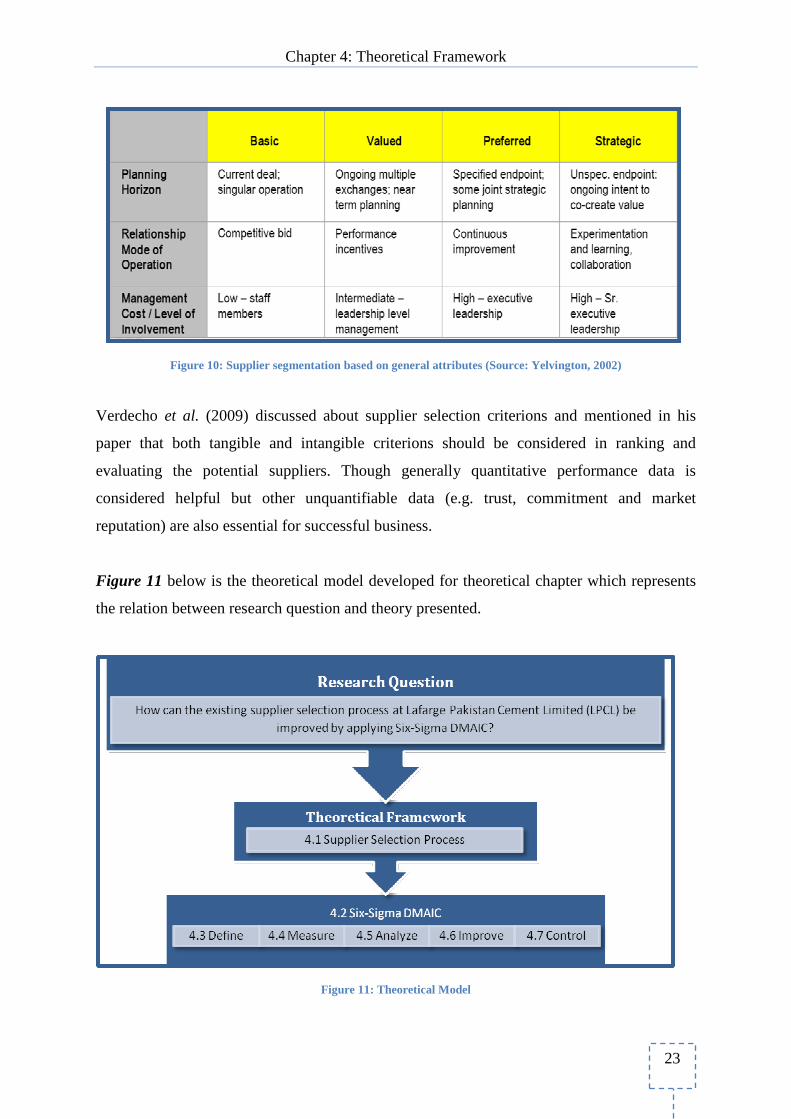
Supplier relationship management journey involves suppliers’ segmentation. Segmentation is
essential in order to identify the gaps, allocation of resources and for appropriate action
identification. Basic, Valued, Preferred and Strategic suppliers can be categorised under
supplier segmentation. One of the examples mentioned in this case study is supplier
segmentation according to general attributes that includes planning horizon, relationship
mode and level of involvement. (Yelvington, 2002)
Chapter 4: Theoretical Framework
23
Figure 10: Supplier segmentation based on general attributes (Source: Yelvington, 2002)
Verdecho et al. (2009) discussed about supplier selection criterions and mentioned in his
paper that both tangible and intangible criterions should be considered in ranking and
evaluating the potential suppliers. Though generally quantitative performance data is
considered helpful but other unquantifiable data (e.g. trust, commitment and market
reputation) are also essential for successful business.
Figure 11 below is the theoretical model developed for theoretical chapter which represents
the relation between research question and theory presented.
Figure 11: Theoretical Model
Chapter 4: Theoretical Framework
24
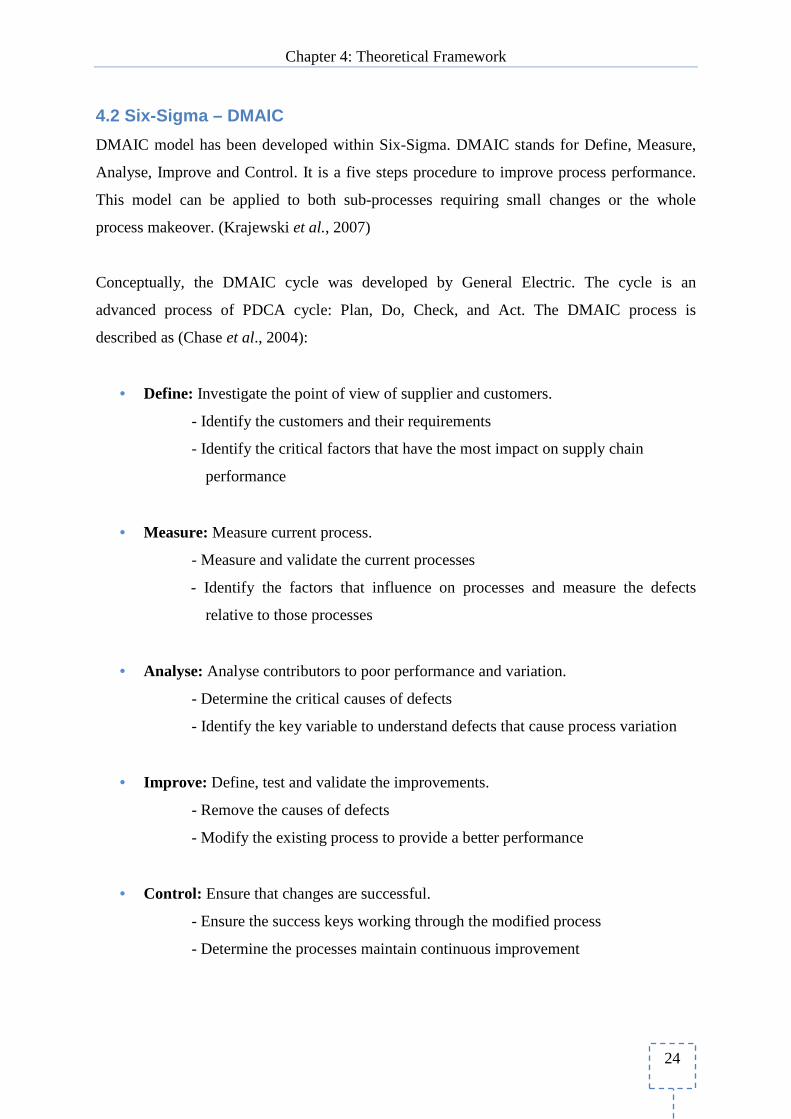
4.2 Six-Sigma – DMAIC
DMAIC model has been developed within Six-Sigma. DMAIC stands for Define, Measure,
Analyse, Improve and Control. It is a five steps procedure to improve process performance.
This model can be applied to both sub-processes requiring small changes or the whole
process makeover. (Krajewski et al., 2007)
Conceptually, the DMAIC cycle was developed by General Electric. The cycle is an
advanced process of PDCA cycle: Plan, Do, Check, and Act. The DMAIC process is
described as (Chase et al., 2004):
• Define: Investigate the point of view of supplier and customers.
- Identify the customers and their requirements
- Identify the critical factors that have the most impact on supply chain
performance
• Measure: Measure current process.
- Measure and validate the current processes
- Identify the factors that influence on processes and measure the defects
relative to those processes
• Analyse: Analyse contributors to poor performance and variation.
- Determine the critical causes of defects
- Identify the key variable to understand defects that cause process variation
• Improve: Define, test and validate the improvements.
- Remove the causes of defects
- Modify the existing process to provide a better performance
• Control: Ensure that changes are successful.
- Ensure the success keys working through the modified process
- Determine the processes maintain continuous improvement
Chapter 4: Theoretical Framework
25
4.3 Define
In Six-Sigma DMAIC implementation, define phase is to identify a complete description of
the issue. The historical data and experiences are gathered to investigate problem (Jalali et
al., 2008). In the define phase, the question “What is important” is addressed to identify the
goal and scope of process. (Islam, 2006)
This phase determines the characteristics of process’s output that are critical to customer
requirements. This is done by identifying process characteristics and capabilities gaps. The
identified gaps become improvement targets later on. (Krajewski et al., 2007)
Many different processes build up a company. The possibility of achieving satisfying results
is directly related to identification of right process with right characteristics. To achieve the
improvement objectives, knowledge of process characteristics is of utmost importance.
(Tang, 2007)
4.4 Measure
There are some questions which we can put in the measure phase like; if you want to know
how the current process is practiced today. It is necessary that you measure your current
process in a way which leads you to measure the improvement in a process as well. If you are
not willing to measure the improvement you can bear some possible negative effects in the
end. (Koanit, 2003)
Selected Tool: Process mapping is the tool used for the measure stage which is elaborated
below.
4.4.1 Process Mapping: Purpose
To understand or improve the process, process mapping is considered at the early stages. If
we want a dynamic model, we can do it by putting the activities in the picture which can be
constructed through the gathered information. This communication tool is very much helpful
to understand the process and helps to find the opportunities for improvement. (Department
of Trade & Industry: DTI, n.d)
Chapter 4: Theoretical Framework
26
The common advantages of process mapping are common framework, discipline, language
and systematic way of working. Process mapping always helps to present the complex
interactions in a logical, visible and in an objective way. This common decision making
framework helps teams to improve the judgment criteria about the issues which exist within
the process. (DTI, n.d)
Steps to be considered while constructing a process map are following: (DTI, n.d)
• Consider all the routine activities which are performed within the scope of the
process.
• Construct the activities into 4-6 main sub-processes.
• Sequence of events should be identified and join them between these sub processes.
• Visualise high level process maps and sub-process maps using different tools.
4.4.2 Process Mapping: Flowcharting
According to Campbell (2004), Processes can be graphically represented through flowcharts.
Flowchart is a pictorial representation of the steps within the process. There are number of
things which can be handled through flowchart other than the pictorial representation; like
1. The steps can be simplified within the process by using flowchart.
2. Flowchart can help employees to communicate processes.
3. By using flowchart unnecessary steps can be eliminated within the process.
4. It is a roadmap for process improvement.
Understanding the steps involved in each of the process is difficult for the companies
sometimes. Companies should visualise the processes for the better understanding of their
employees and make sure that everything is included. (Campbell, 2004)
Flowchart is also known as flow diagram. It is a logical flow of activities within the process
from the start till the end. The starting and ending points should be considered when drawing
the process flow diagram. It would help the reader to understand the steps easily. (Islam,
2006)
Chapter 4: Theoretical Framework
27
Flowcharting can help in understanding the basic concepts behind its methodology. Technical
experts sometimes use this shared language to deal with simple and complex processes.
(Nash and Poling, 2009)
It is a matter of having the easiest way to draw an accurate and self explanatory map so that
all employees can understand it which sometimes becomes a challenge for them. If we talk
about accuracy, time limit may exceed up to weeks to get it accurate. It is more or less a
challenging job as well but people used to call it curse when time limit exceeds more than
weeks. Finally, it should be presented in the logical flow of product or service (Nash and
Poling, 2009). Norman and Kehoe (1997) defined flowchart in detail and suggested the
process of developing a flowchart as below;
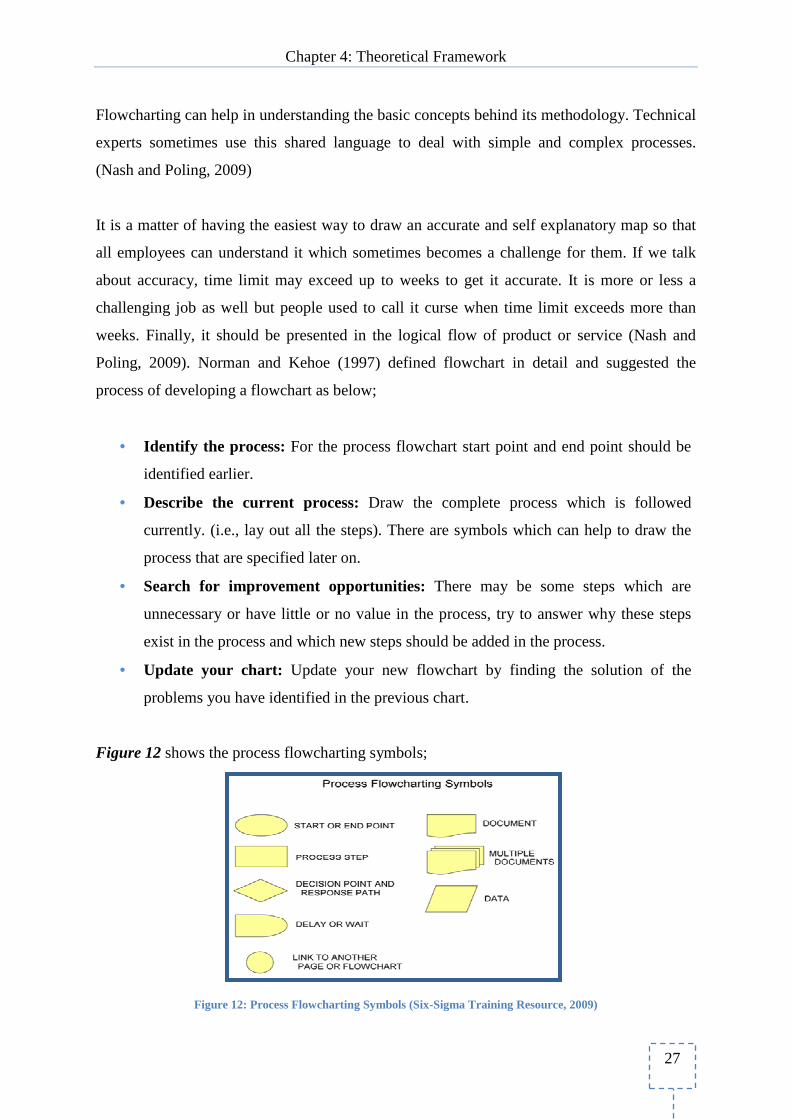
• Identify the process: For the process flowchart start point and end point should be
identified earlier.
• Describe the current process: Draw the complete process which is followed
currently. (i.e., lay out all the steps). There are symbols which can help to draw the
process that are specified later on.
• Search for improvement opportunities: There may be some steps which are
unnecessary or have little or no value in the process, try to answer why these steps
exist in the process and which new steps should be added in the process.
• Update your chart: Update your new flowchart by finding the solution of the
problems you have identified in the previous chart.
Figure 12 shows the process flowcharting symbols;
Figure 12: Process Flowcharting Symbols (Six-Sigma Training Resource, 2009)
Chapter 4: Theoretical Framework
28
4.5 Analyse
Goldsby and Martichenko (2005) explained Six-Sigma and suggested that Six-Sigma
DMAIC concept provides a wealth of methods and tools that assist in problem solving.
Where as its main objective is to align the problem leading to analysis and solution. After
having a clear statement of the problem and proper identification of its measurement, the
DMAIC process moves forward with the “Analyse” step.
According to Pyzdek (2003), this stage involves two different steps:
1. Divergent thinking: Considering the maximum possible solutions.
2. Convergent thinking: Can help to identify the best solution.
For divergent thinking 5W2H can help to obtain maximum possible solutions through
brainstorming and for convergent thinking cause and effect diagram is opted to come up with
the best possible solution.
In the Analyse phase of Six-Sigma DMAIC methodology, quantifying the existing process
helps to determine how best process improvement goals can be achieved. Pyzdek (2003) and
Brassard et al. (2002) suggested there are many tools and techniques that can be used in this
phase, which may include the following:
• Run charts
• Descriptive statistical analysis
• Exploratory data analysis
• Cause & Effect
• Design of Experiments
• Analytic data analysis
• Process capability analysis
• Process yield analysis
• Scatter plots
Chapter 4: Theoretical Framework
29
In views of Pyzdek and Keller (2010), at this stage the system is analysed in order to identify
those ways that can eliminate the gap between the system’s ongoing performance and the
desired goal. They suggested that following could be the key objectives of the Analyse phase:
• Identification and elimination of gap between the current and desired performance.
• Analyse the factors of variations that lead to performance gap.
• Determine those drivers that relate to the customer requirements in terms of Quality,
Cost, and Schedules and have significant influence on the process.
Selected Tools: 5W2H and Cause and Effect diagram are the tools that are selected for the
Analyse stage which are elaborated below.
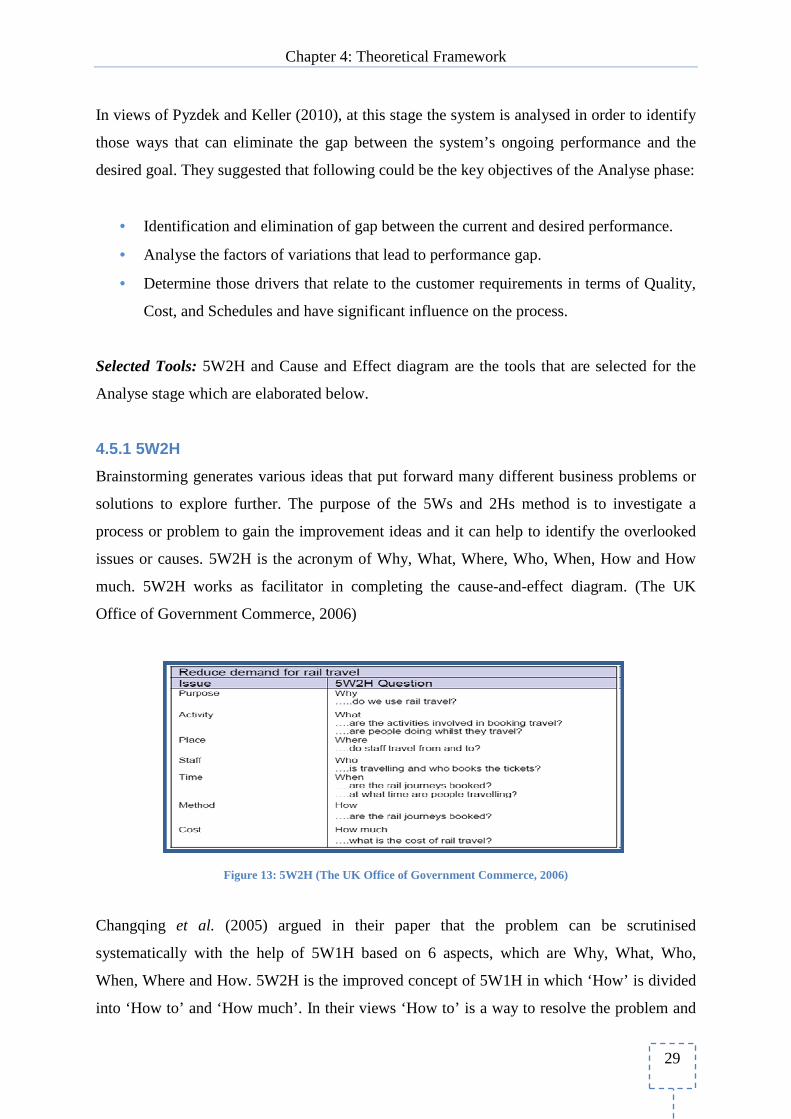
4.5.1 5W2H
Brainstorming generates various ideas that put forward many different business problems or
solutions to explore further. The purpose of the 5Ws and 2Hs method is to investigate a
process or problem to gain the improvement ideas and it can help to identify the overlooked
issues or causes. 5W2H is the acronym of Why, What, Where, Who, When, How and How
much. 5W2H works as facilitator in completing the cause-and-effect diagram. (The UK
Office of Government Commerce, 2006)
Figure 13: 5W2H (The UK Office of Government Commerce, 2006)
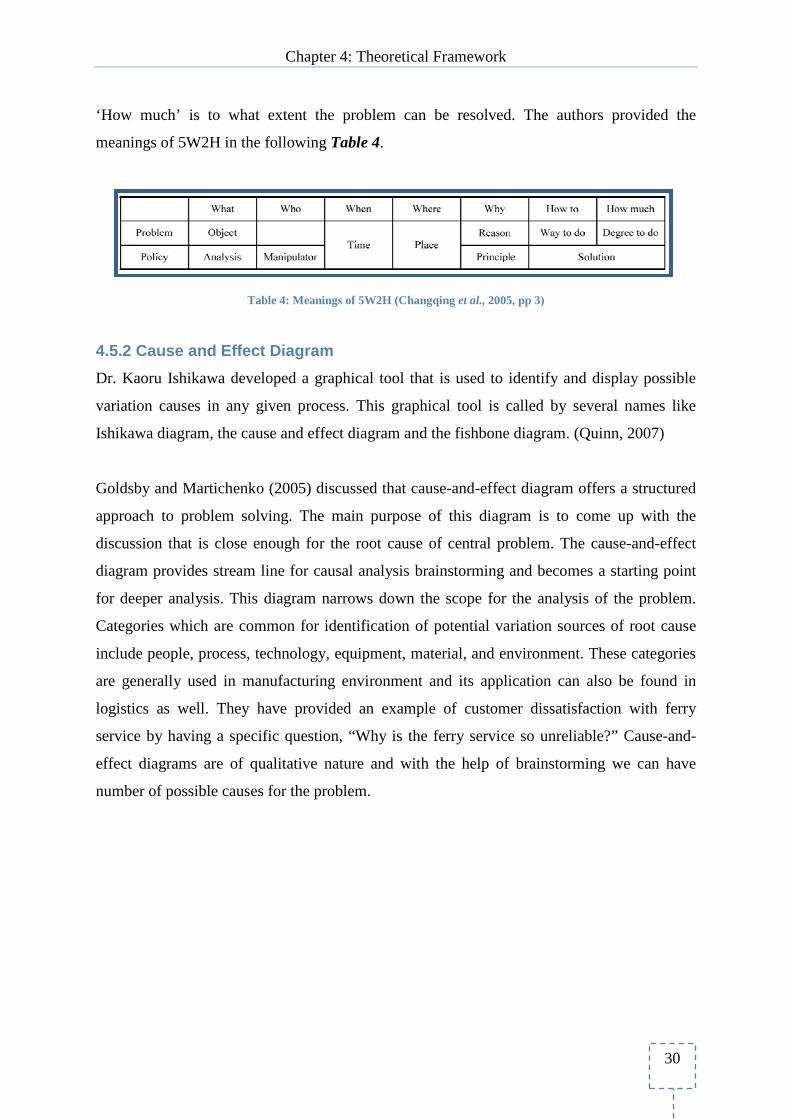
Changqing et al. (2005) argued in their paper that the problem can be scrutinised
systematically with the help of 5W1H based on 6 aspects, which are Why, What, Who,
When, Where and How. 5W2H is the improved concept of 5W1H in which ‘How’ is divided
into ‘How to’ and ‘How much’. In their views ‘How to’ is a way to resolve the problem and
Chapter 4: Theoretical Framework
30
‘How much’ is to what extent the problem can be resolved. The authors provided the
meanings of 5W2H in the following Table 4.
Table 4: Meanings of 5W2H (Changqing et al., 2005, pp 3)
4.5.2 Cause and Effect Diagram
Dr. Kaoru Ishikawa developed a graphical tool that is used to identify and display possible
variation causes in any given process. This graphical tool is called by several names like
Ishikawa diagram, the cause and effect diagram and the fishbone diagram. (Quinn, 2007)
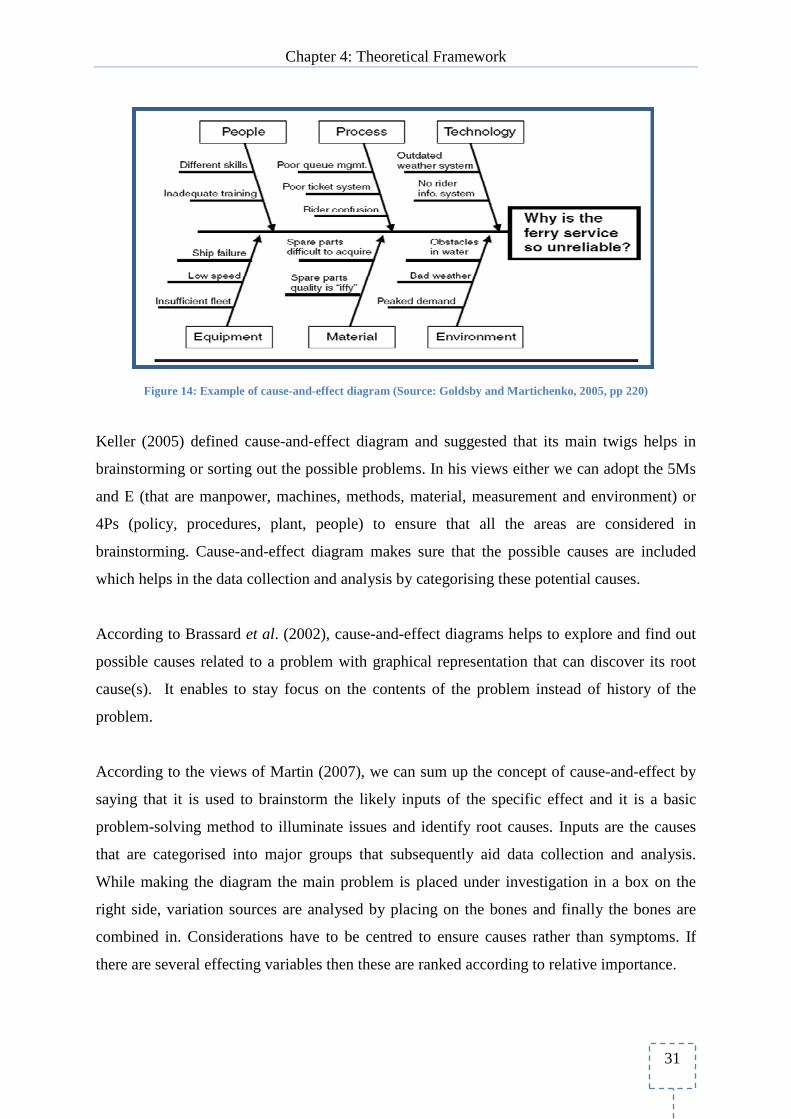
Goldsby and Martichenko (2005) discussed that cause-and-effect diagram offers a structured
approach to problem solving. The main purpose of this diagram is to come up with the
discussion that is close enough for the root cause of central problem. The cause-and-effect
diagram provides stream line for causal analysis brainstorming and becomes a starting point
for deeper analysis. This diagram narrows down the scope for the analysis of the problem.
Categories which are common for identification of potential variation sources of root cause
include people, process, technology, equipment, material, and environment. These categories
are generally used in manufacturing environment and its application can also be found in
logistics as well. They have provided an example of customer dissatisfaction with ferry
service by having a specific question, “Why is the ferry service so unreliable?” Cause-and-
effect diagrams are of qualitative nature and with the help of brainstorming we can have
number of possible causes for the problem.
Chapter 4: Theoretical Framework
31
Figure 14: Example of cause-and-effect diagram (Source: Goldsby and Martichenko, 2005, pp 220)
Keller (2005) defined cause-and-effect diagram and suggested that its main twigs helps in
brainstorming or sorting out the possible problems. In his views either we can adopt the 5Ms
and E (that are manpower, machines, methods, material, measurement and environment) or
4Ps (policy, procedures, plant, people) to ensure that all the areas are considered in
brainstorming. Cause-and-effect diagram makes sure that the possible causes are included
which helps in the data collection and analysis by categorising these potential causes.
According to Brassard et al. (2002), cause-and-effect diagrams helps to explore and find out
possible causes related to a problem with graphical representation that can discover its root
cause(s). It enables to stay focus on the contents of the problem instead of history of the
problem.
According to the views of Martin (2007), we can sum up the concept of cause-and-effect by
saying that it is used to brainstorm the likely inputs of the specific effect and it is a basic
problem-solving method to illuminate issues and identify root causes. Inputs are the causes
that are categorised into major groups that subsequently aid data collection and analysis.
While making the diagram the main problem is placed under investigation in a box on the
right side, variation sources are analysed by placing on the bones and finally the bones are
combined in. Considerations have to be centred to ensure causes rather than symptoms. If
there are several effecting variables then these are ranked according to relative importance.
Chapter 4: Theoretical Framework
32
4.6 Improve
The goals of this phase are to select problem solution, recognise the risks and implement
selected solution. Practically, the improvement must investigate necessary knowledge based
on brainstorming to create the best solution. (Jalali et al., 2008)
Selected Tool: Failure Mode and Effect Analysis: FMEA is selected for the Improve stage
which is elaborated below.
4.6.1 Failure Mode and Effect Analysis: FMEA
Failure Mode and Effect Analysis: FMEA has been widely used as a process quality
improvement technique. The purposes of FMEA are to prevent defects, enhance performance
and increase satisfaction level. In addition, FMEA is the technique that identifies the failures,
effects, and risks of a process, and then seeks the way to eliminate or reduce errors
(McDermott et al., 2009). The ten steps of the FMEA are described following the FMEA
worksheet as below: (Norman and Kehoe, 1997; McDermott et al., 2009)
• Step 1:
Review the process: ensure that everyone understand the process and its flow.
• Step 2:
Brainstorm potential failure modes: identify all possible failure modes by grouping
into categories such as which process could fail to meet the process requirement.
• Step 3:
List potential effects of each failure mode: create a potential effects list of failure that
occurred.
• Step 4:
Assign a severity ranking for each effect: estimate the impact of the problem when it
occurs by ranking the level of serious effect for given failure mode on a scale 1 to 10.
Chapter 4: Theoretical Framework
33
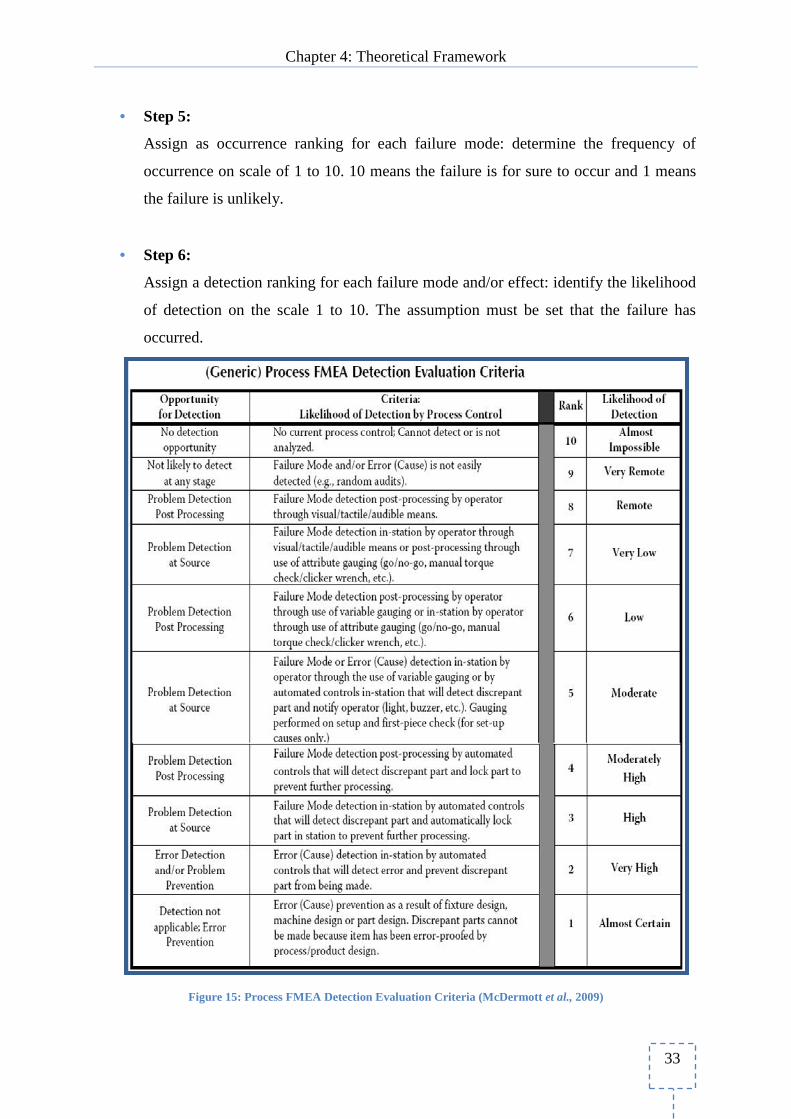
• Step 5:
Assign as occurrence ranking for each failure mode: determine the frequency of
occurrence on scale of 1 to 10. 10 means the failure is for sure to occur and 1 means
the failure is unlikely.
• Step 6:
Assign a detection ranking for each failure mode and/or effect: identify the likelihood
of detection on the scale 1 to 10. The assumption must be set that the failure has
occurred.
Figure 15: Process FMEA Detection Evaluation Criteria (McDermott et al., 2009)
Chapter 4: Theoretical Framework
34
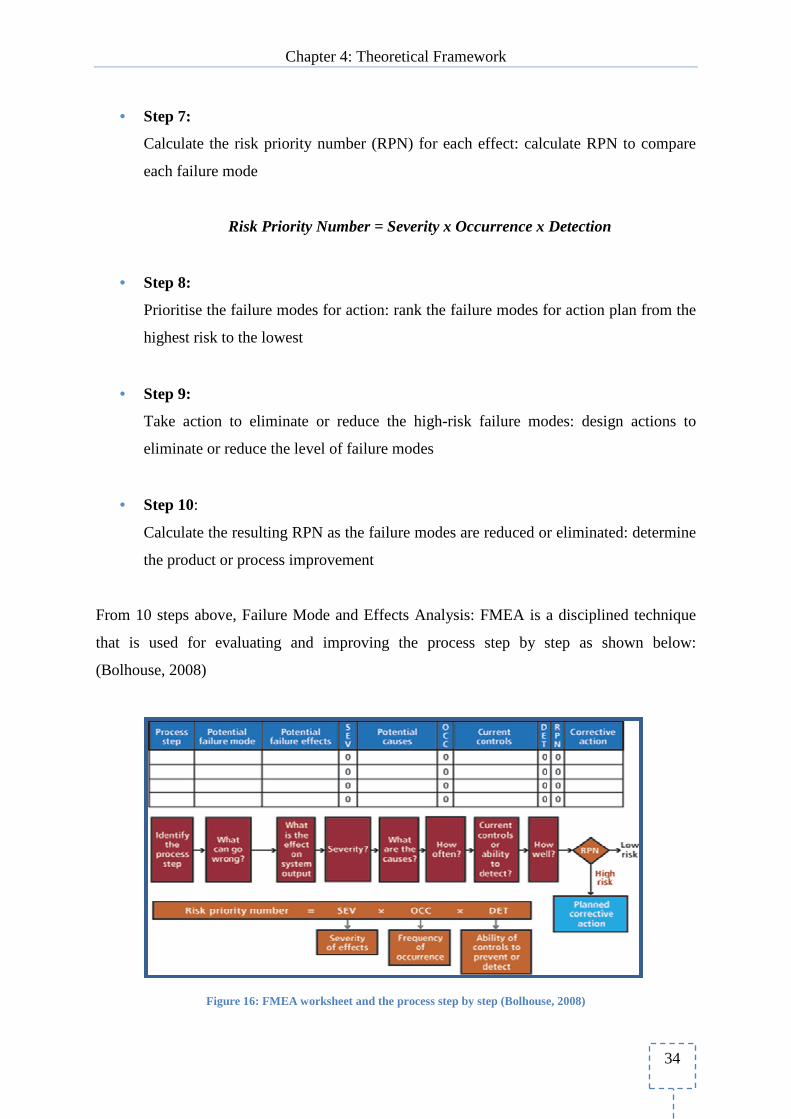
• Step 7:
Calculate the risk priority number (RPN) for each effect: calculate RPN to compare
each failure mode
Risk Priority Number = Severity x Occurrence x Detection
• Step 8:
Prioritise the failure modes for action: rank the failure modes for action plan from the
highest risk to the lowest
• Step 9:
Take action to eliminate or reduce the high-risk failure modes: design actions to
eliminate or reduce the level of failure modes
• Step 10:
Calculate the resulting RPN as the failure modes are reduced or eliminated: determine
the product or process improvement
From 10 steps above, Failure Mode and Effects Analysis: FMEA is a disciplined technique
that is used for evaluating and improving the process step by step as shown below:
(Bolhouse, 2008)
Figure 16: FMEA worksheet and the process step by step (Bolhouse, 2008)
Chapter 4: Theoretical Framework
35
4.7 Control
Control phase is the last stage and completes the DMAIC methodology. It ensures that the
day to day process variations are fully controlled and the process is working in an improved
state, and this process becomes standard once it is integrated in routine practices. (Hwang,
2004)
To sustain the Six-Sigma initiative, the objective must be to control the improved process
once the improvement is realised in the improve phase of DMAIC. The Six-Sigma initiative
must be alive throughout the DMAIC on the continual basis to meet the challenges.
Organisations have divided their working territories in each of the functional area where each
manager is responsible to improve his/her own functions on continual basis to keep Six-
Sigma initiative alive. (Gupta, 2004)
Being the last and important phase of Six-Sigma DMAIC, progress is monitored and
maintained against the actions performed in the prior phases (Bolhouse, 2008). The methods
which are used to solve the problem become standards that should be sustained and improved
time by time (Hambleton, 2008). It depends on the process which control method should be
used to control the variations in the process. Chosen control method can help a lot to control
the process effectively. Improvements and change in process should be communicated
throughout the organisation appropriately. There is an opportunity that these results could be
implemented on the other areas of the business. (Breyfogle, 2003)
After communicating the bigger picture to the users/employees, make sure that the employees
have linked it into small and actionable goals in their respective areas appropriately to ensure
the success on continual basis. You need to have an effective communication plan to share
the learned lessons and sustain your Six-Sigma success. Things like monthly newsletters,
quarterly company meetings, press releases, company intranet updates and video
presentations should be communicated regularly to the intended people inside or outside the
organisations. (Brue, 2002)
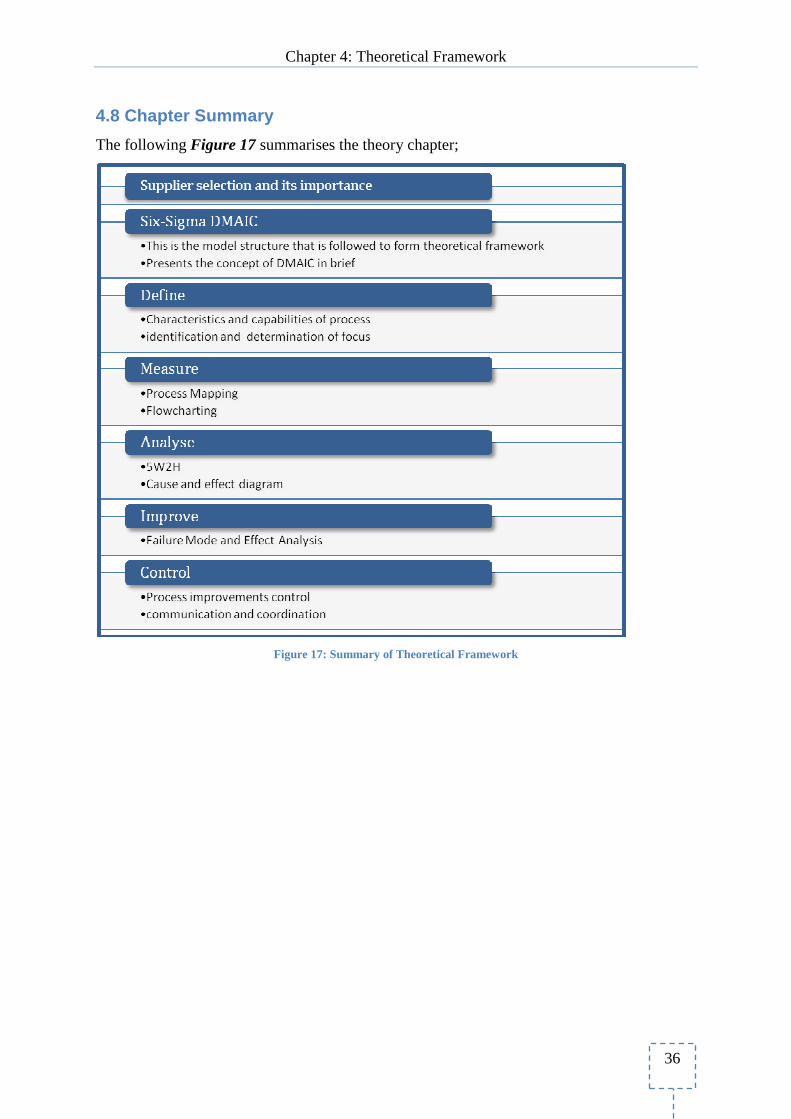
Chapter 4: Theoretical Framework
36
4.8 Chapter Summary
The following Figure 17 summarises the theory chapter;
Figure 17: Summary of Theoretical Framework
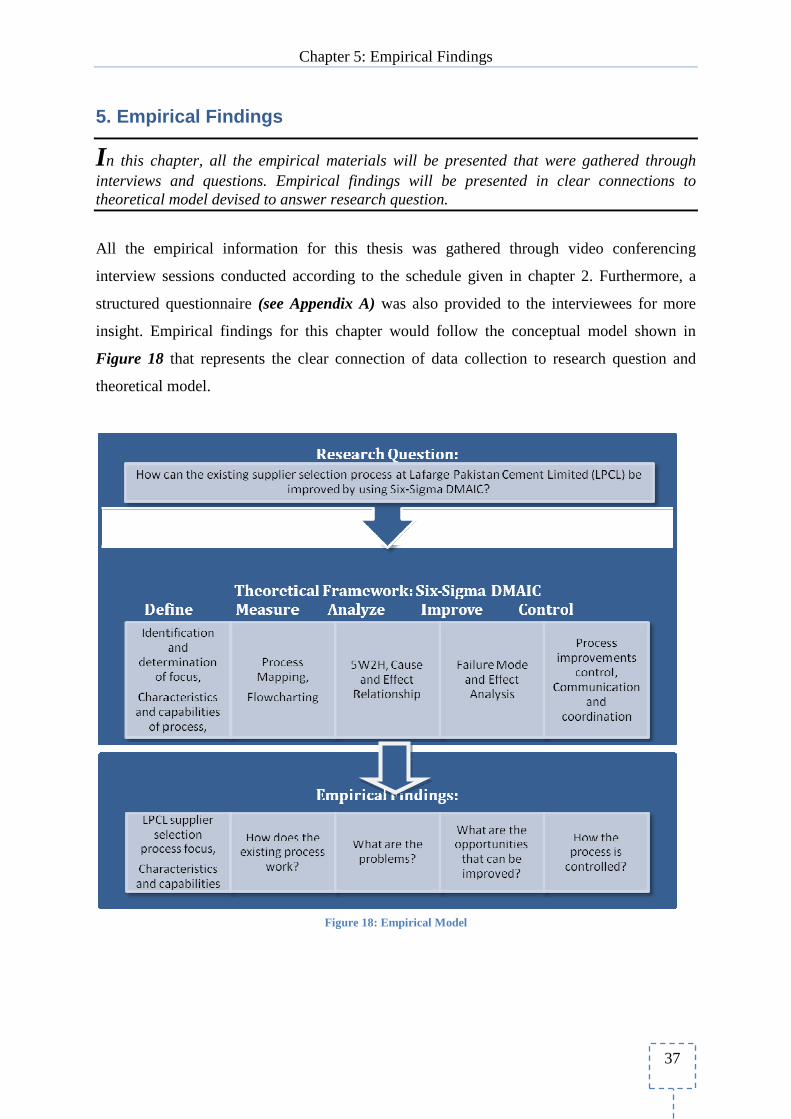
Chapter 5: Empirical Findings
37
5. Empirical Findings
I n this chapter, all the empirical materials will be presented that were gathered through interviews and questions. Empirical findings will be presented in clear connections to theoretical model devised to answer research question.
All the empirical information for this thesis was gathered through video conferencing
interview sessions conducted according to the schedule given in chapter 2. Furthermore, a
structured questionnaire (see Appendix A) was also provided to the interviewees for more
insight. Empirical findings for this chapter would follow the conceptual model shown in
Figure 18 that represents the clear connection of data collection to research question and
theoretical model.
Figure 18: Empirical Model
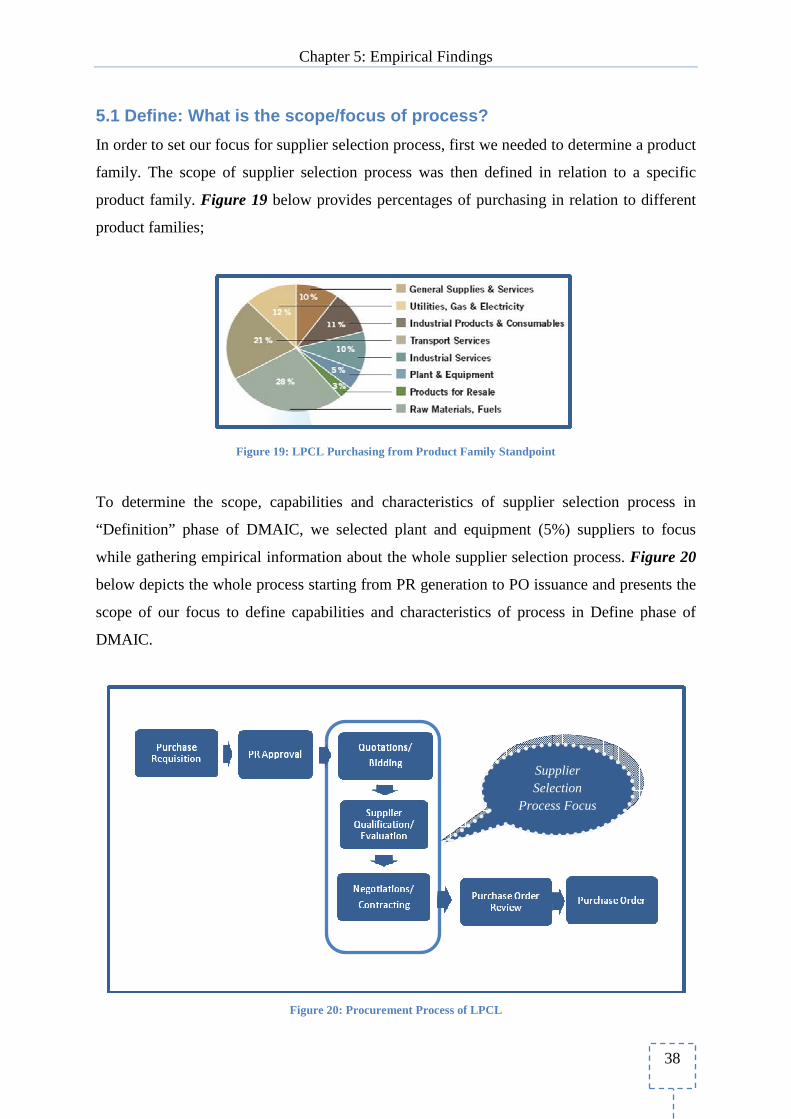
Chapter 5: Empirical Findings
38
5.1 Define: What is the scope/focus of process?
In order to set our focus for supplier selection process, first we needed to determine a product
family. The scope of supplier selection process was then defined in relation to a specific
product family. Figure 19 below provides percentages of purchasing in relation to different
product families;
Figure 19: LPCL Purchasing from Product Family Standpoint
To determine the scope, capabilities and characteristics of supplier selection process in
“Definition” phase of DMAIC, we selected plant and equipment (5%) suppliers to focus
while gathering empirical information about the whole supplier selection process. Figure 20
below depicts the whole process starting from PR generation to PO issuance and presents the
scope of our focus to define capabilities and characteristics of process in Define phase of
DMAIC.
Figure 20: Procurement Process of LPCL
Supplier Selection
Process Focus
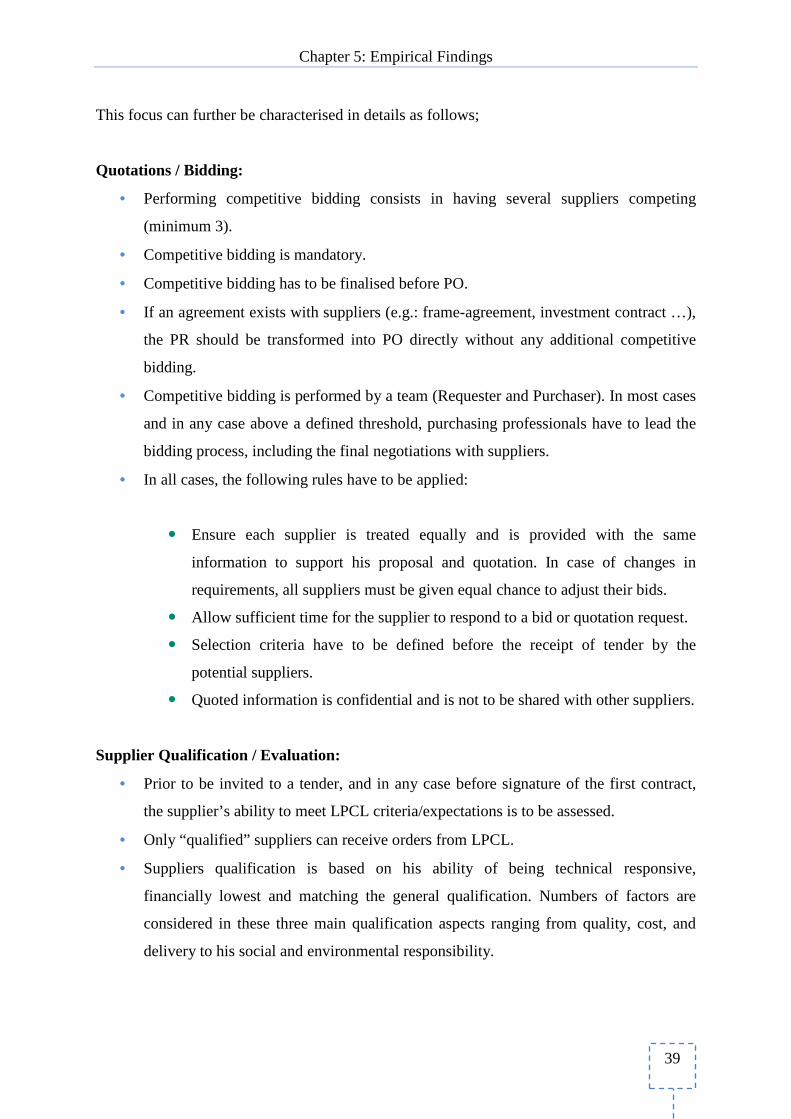
Chapter 5: Empirical Findings
39
This focus can further be characterised in details as follows;
Quotations / Bidding:
• Performing competitive bidding consists in having several suppliers competing
(minimum 3).
• Competitive bidding is mandatory.
• Competitive bidding has to be finalised before PO.
• If an agreement exists with suppliers (e.g.: frame-agreement, investment contract …),
the PR should be transformed into PO directly without any additional competitive
bidding.
• Competitive bidding is performed by a team (Requester and Purchaser). In most cases
and in any case above a defined threshold, purchasing professionals have to lead the
bidding process, including the final negotiations with suppliers.
• In all cases, the following rules have to be applied:
� Ensure each supplier is treated equally and is provided with the same
information to support his proposal and quotation. In case of changes in
requirements, all suppliers must be given equal chance to adjust their bids.
� Allow sufficient time for the supplier to respond to a bid or quotation request.
� Selection criteria have to be defined before the receipt of tender by the
potential suppliers.
� Quoted information is confidential and is not to be shared with other suppliers.
Supplier Qualification / Evaluation:
• Prior to be invited to a tender, and in any case before signature of the first contract,
the supplier’s ability to meet LPCL criteria/expectations is to be assessed.
• Only “qualified” suppliers can receive orders from LPCL.
• Suppliers qualification is based on his ability of being technical responsive,
financially lowest and matching the general qualification. Numbers of factors are
considered in these three main qualification aspects ranging from quality, cost, and
delivery to his social and environmental responsibility.
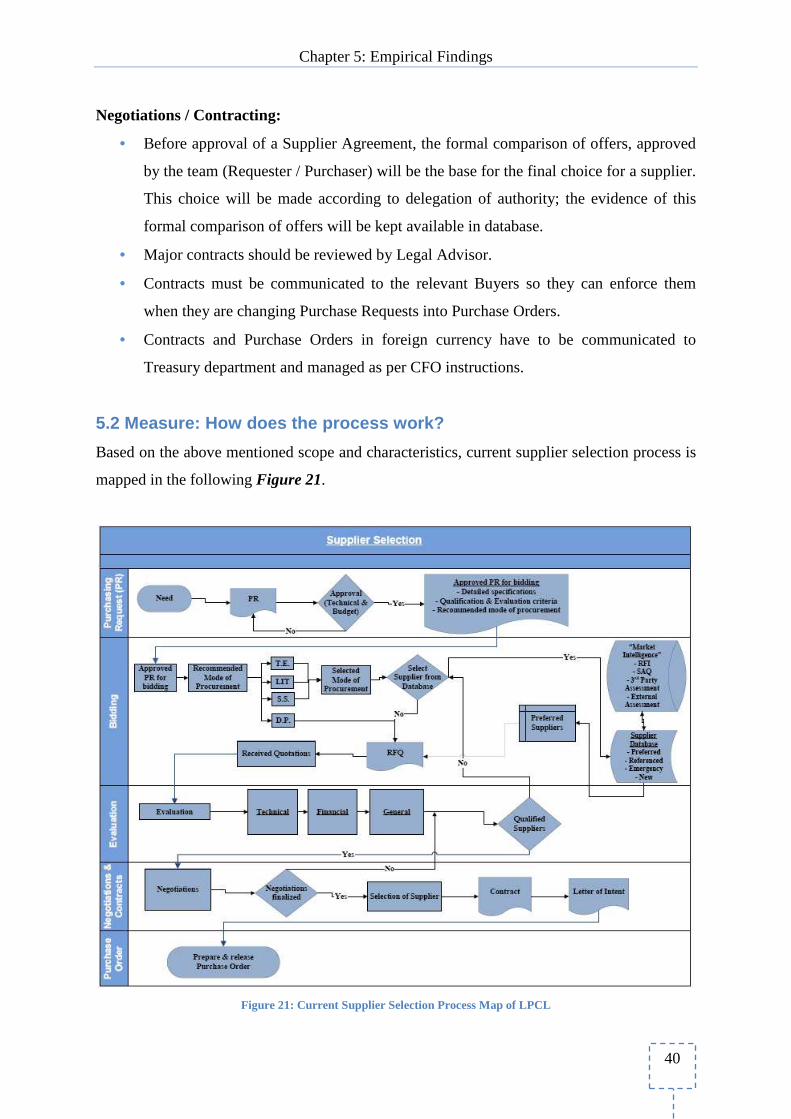
Chapter 5: Empirical Findings
40
Negotiations / Contracting:
• Before approval of a Supplier Agreement, the formal comparison of offers, approved
by the team (Requester / Purchaser) will be the base for the final choice for a supplier.
This choice will be made according to delegation of authority; the evidence of this
formal comparison of offers will be kept available in database.
• Major contracts should be reviewed by Legal Advisor.
• Contracts must be communicated to the relevant Buyers so they can enforce them
when they are changing Purchase Requests into Purchase Orders.
• Contracts and Purchase Orders in foreign currency have to be communicated to
Treasury department and managed as per CFO instructions.
5.2 Measure: How does the process work?
Based on the above mentioned scope and characteristics, current supplier selection process is
mapped in the following Figure 21.
Figure 21: Current Supplier Selection Process Map of LPCL
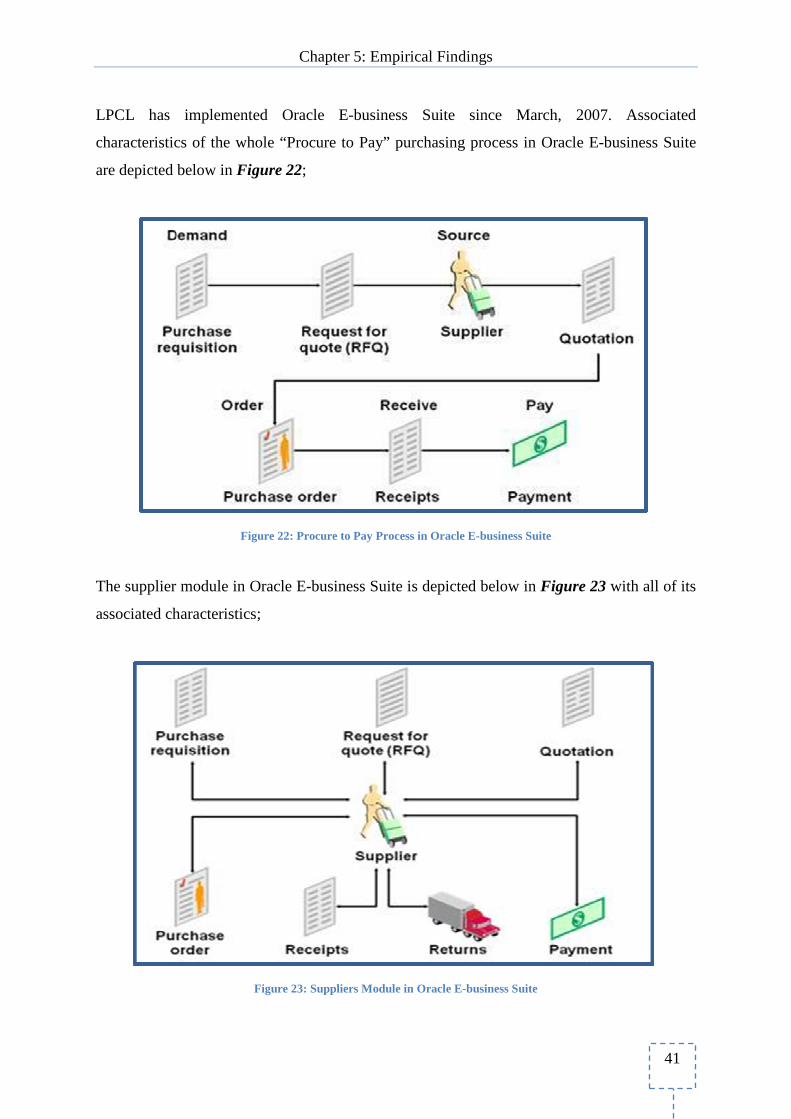
Chapter 5: Empirical Findings
41
LPCL has implemented Oracle E-business Suite since March, 2007. Associated
characteristics of the whole “Procure to Pay” purchasing process in Oracle E-business Suite
are depicted below in Figure 22;
Figure 22: Procure to Pay Process in Oracle E-business Suite
The supplier module in Oracle E-business Suite is depicted below in Figure 23 with all of its
associated characteristics;
Figure 23: Suppliers Module in Oracle E-business Suite
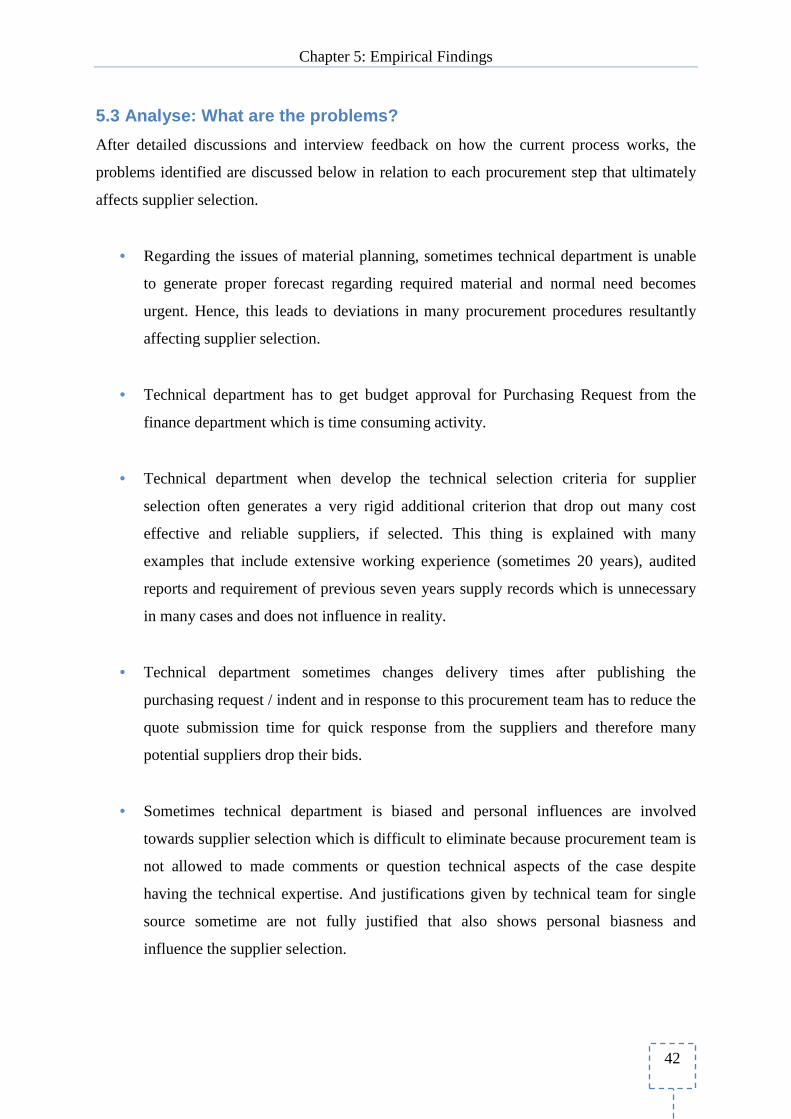
Chapter 5: Empirical Findings
42
5.3 Analyse: What are the problems?
After detailed discussions and interview feedback on how the current process works, the
problems identified are discussed below in relation to each procurement step that ultimately
affects supplier selection.
• Regarding the issues of material planning, sometimes technical department is unable
to generate proper forecast regarding required material and normal need becomes
urgent. Hence, this leads to deviations in many procurement procedures resultantly
affecting supplier selection.
• Technical department has to get budget approval for Purchasing Request from the
finance department which is time consuming activity.
• Technical department when develop the technical selection criteria for supplier
selection often generates a very rigid additional criterion that drop out many cost
effective and reliable suppliers, if selected. This thing is explained with many
examples that include extensive working experience (sometimes 20 years), audited
reports and requirement of previous seven years supply records which is unnecessary
in many cases and does not influence in reality.
• Technical department sometimes changes delivery times after publishing the
purchasing request / indent and in response to this procurement team has to reduce the
quote submission time for quick response from the suppliers and therefore many
potential suppliers drop their bids.
• Sometimes technical department is biased and personal influences are involved
towards supplier selection which is difficult to eliminate because procurement team is
not allowed to made comments or question technical aspects of the case despite
having the technical expertise. And justifications given by technical team for single
source sometime are not fully justified that also shows personal biasness and
influence the supplier selection.
Chapter 5: Empirical Findings
43
• Procurement is only made from preferred suppliers because of the previous
experience with the supplier and technical teams are to some extent biased towards
these suppliers and criterions for preferred suppliers are not continuously evaluated.
• Preferred suppliers are also required to submit bid bond that increases the
administrative work.
• Market Intelligence is not fully analyzing the market resources and not giving the real
input for updating the suppliers’ database. This thing is explained in the general
discussion that though Market Intelligence team has mentioned RFI, self assessment
questionnaires, 3rd party assessments as mode of suppliers search but in reality only
those suppliers who approach LPCL directly get registered in their database.
• Expression of interest is not obtained from preferred suppliers before request for
quotation that sometimes causes delay in process.
• Request for quotation is advised to suppliers through only ordinary mail that is time
consuming.
• Often technical team takes more time than usual for technical evaluation, leaving very
less margin for bid validity and resultantly it affects suppliers bid validity.
• No personal meetings with suppliers are arranged during negotiations.
• After finalising negotiations the Letter of Intent is sent to suppliers, rather than a
straight contract.
• Purchase order is issued through fax and ordinary mail which are duplication of work
activities.
• Direct purchases sometimes skip transaction recording in ERP suite and heave
transparency issues.
Chapter 5: Empirical Findings
44
• Company is not maintaining any kind of Supplier Portal that can provide access to
suppliers to view general supply chain information from LPCL, and suppliers
individual information related to their contracts and payments.
5.4 Improve: What can be improved?
In relation to the problem identified in the Analyse phase, the improvement areas are
determined as regard to the empirical information gathered through discussions and
interviews.
• Forecasting material requirements is not properly done at LPCL. Resultantly, normal
needs become urgent, and on the same continuum it creates stocking issues. Proper
check on available stock and required stock in future may answer these types of
issues.
• For budget check, the PR has to route from technical department to finance
department. It is only an excessive exercise while the technical department has
previously been allotted annual budget. Here the unity of command may resolve the
issue.
• There are some of the criteria’s which are necessary to follow when evaluating the
technical perspective of the supplier. But additional criterions being rigid need to be
overlooked in some cases.
• Due to urgent change in delivery time by the technical department during the pre-
defined stages of purchasing process may lose some of the good suppliers. Again lack
of calculating incorrect time for the forecasted need leads in the reduction of pre-
defined number of days in delivery time.
• Personal relations influence the supplier selection process used by technical
department and this is the area where technical team always has some issues with
procurement team.
Chapter 5: Empirical Findings
45
• Preferred suppliers in database always come into consideration when fulfilling the
need but LPCL does not consider in great deal the potentially good suppliers
registered in the new category of database.
• Submission of bid bond in case of preferred suppliers is an excessive activity.
• Although, market intelligence measures are specified but not effectively exercised.
• The inclusion of EOI may help LPCL to reduce the complexity of interested suppliers.
• The reach of advanced technology increases the use of technology which needs to be
adopted more rigorously by LPCL. There are some procedures like sending request
for quotation through ordinary mail which is one of the examples of outdated
procedures followed by LPCL.
• Supplier’s technical evaluation period is not properly adhered by the technical
department.
• In person negotiation meetings with suppliers at the workplace or outside the work
place are hardly exercised which in some cases impacts the supplier selection in great
deal.
• Letter of intent is a document which compiles the negotiations and all other matters in
one document and is issued before the contract. Contract is also the same document in
which everything is mentioned. It is duplication of activities.
• The mode of sending documents to the supplier like purchase order or other
documents should be updated to cater complains from the supplier like unreadable fax
and delay in delivery of ordinary mail.
• Direct Purchase is used to fulfil the urgent need, this type of transaction is recorded
after the purchase is made which is against the existing procedure at LPCL and in
some cases the transparency is questionable.
Chapter 5: Empirical Findings
46
• Supplier’s access to LPCL general information is not practiced electronically these
days. Suppliers do face many problems in gathering information regarding contracts
and payments.
5.5 Control: How the processed is controlled?
Considering the feedbacks from previous phases that provide a picture of process and
discussions with LPCL Supply Chain Head, current supplier selection process at LPCL seems
to have less control on overall process. While problem arises more often in managing the
process, the delay in the process was found simultaneously.
The procurement complexity creates the need of communication channels with high
information processing capabilities to encourage fast response when problem occurs. Open
channels of communication should willingly share responsibility for process integrity and
reliability. Moreover, coordination of work is an important dimension. Effective coordination
between different levels of management and across functional areas is not widely apparent to
adhere to any quality and reliability measures thorough supplier selection process.
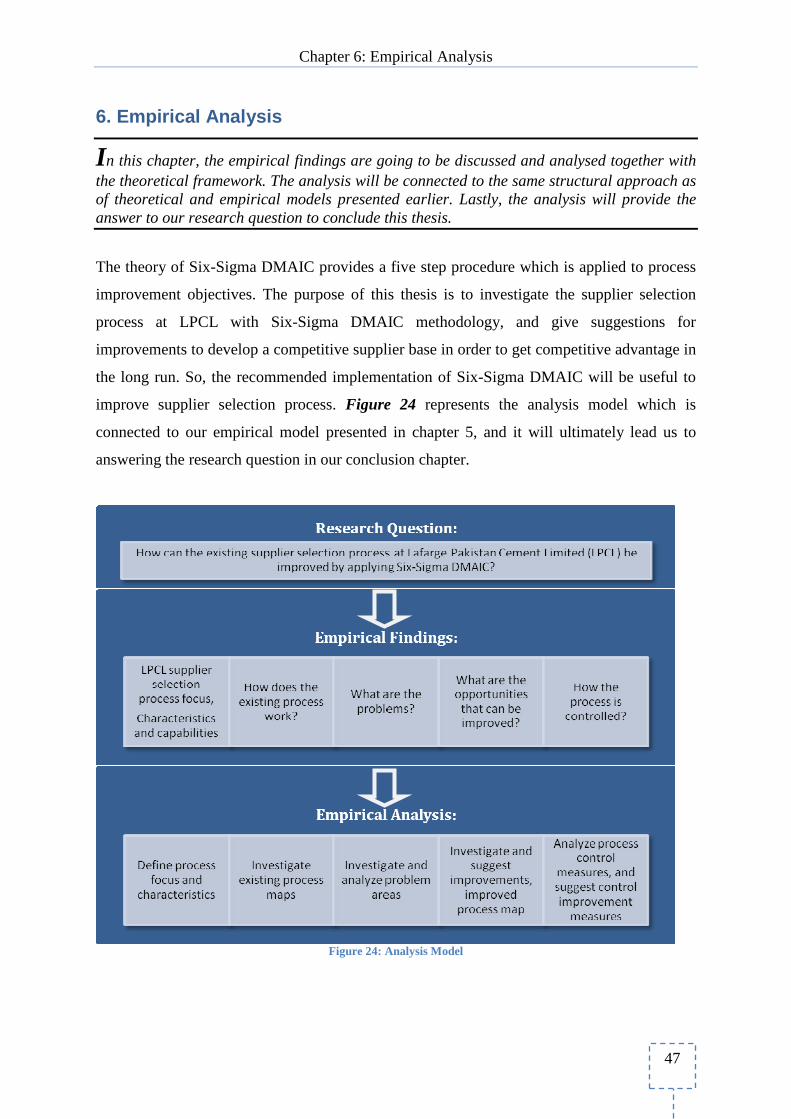
Chapter 6: Empirical Analysis
47
6. Empirical Analysis
I n this chapter, the empirical findings are going to be discussed and analysed together with the theoretical framework. The analysis will be connected to the same structural approach as of theoretical and empirical models presented earlier. Lastly, the analysis will provide the answer to our research question to conclude this thesis.
The theory of Six-Sigma DMAIC provides a five step procedure which is applied to process
improvement objectives. The purpose of this thesis is to investigate the supplier selection
process at LPCL with Six-Sigma DMAIC methodology, and give suggestions for
improvements to develop a competitive supplier base in order to get competitive advantage in
the long run. So, the recommended implementation of Six-Sigma DMAIC will be useful to
improve supplier selection process. Figure 24 represents the analysis model which is
connected to our empirical model presented in chapter 5, and it will ultimately lead us to
answering the research question in our conclusion chapter.
Figure 24: Analysis Model
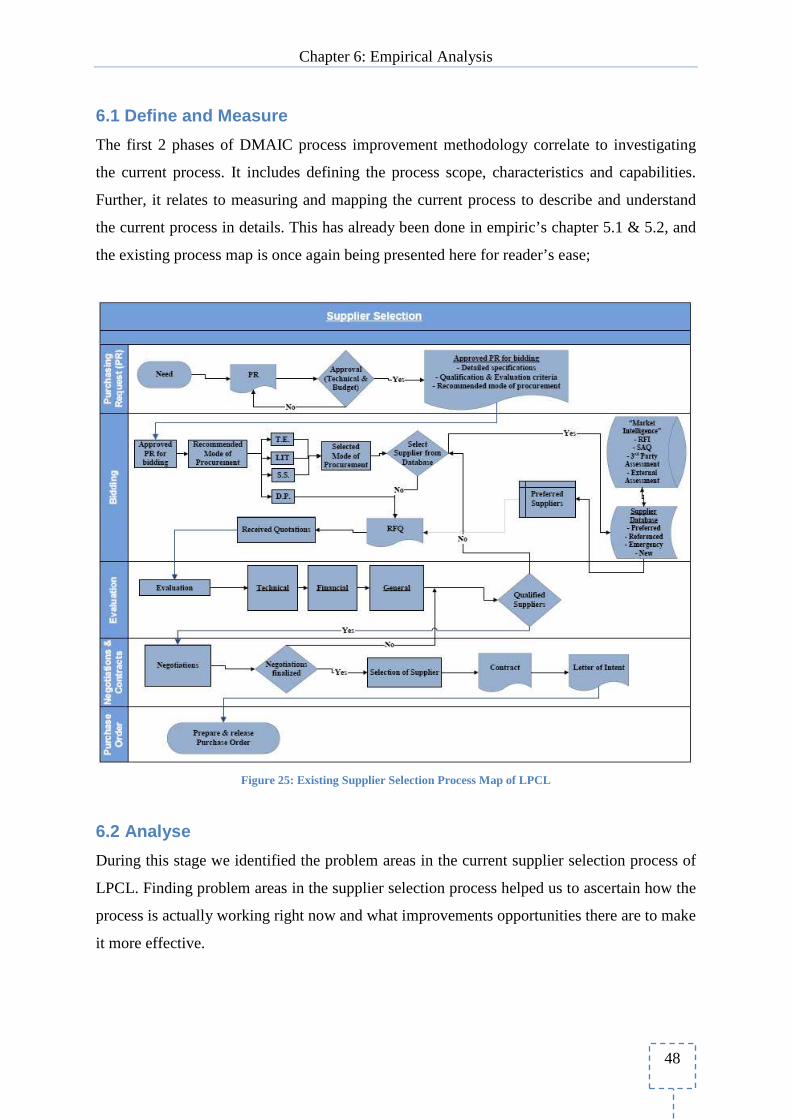
Chapter 6: Empirical Analysis
48
6.1 Define and Measure
The first 2 phases of DMAIC process improvement methodology correlate to investigating
the current process. It includes defining the process scope, characteristics and capabilities.
Further, it relates to measuring and mapping the current process to describe and understand
the current process in details. This has already been done in empiric’s chapter 5.1 & 5.2, and
the existing process map is once again being presented here for reader’s ease;
Figure 25: Existing Supplier Selection Process Map of LPCL
6.2 Analyse
During this stage we identified the problem areas in the current supplier selection process of
LPCL. Finding problem areas in the supplier selection process helped us to ascertain how the
process is actually working right now and what improvements opportunities there are to make
it more effective.
Chapter 6: Empirical Analysis
49
6.2.1 5W2H
Mitchell (1998) in her paper discussed that previously vendors were primarily selected on the
price factor but now a day supplier’s capabilities/abilities and win/win relationship are
considered more important. Suppliers who offer the lowest prices for their product/service
does not always mean that they can provide the best product/service and nor it guarantees a
mutually beneficial buyer/supplier relationship.
Many researchers use 5W2H framework which is a supportive tool in different situations and
can help to understand the structure in more depth that is why while collecting empirics’
authors kept this structure/strategy in their mind for data collection. 5W2H described below
includes Why, What, Where, Who, When, How and How much for LPCL supplier selection
process.
Why: Purpose – Why is it a problem?
LPCL wants to improve their current supplier selection process because of the following:
• To develop a competitive supplier base
• To reduce the complexity & eliminate unnecessary activities in supplier selection
process
• To make the process more transparent while minimizing the human interventions
• To develop the suite of communication channel to achieve the efficiency in supplier
selection process
What: Symptoms – What’s wrong in it?
In views of LPCL supply chain authorities the following symptoms create an urge for
improvement in their supplier selection process.
• Lack of market intelligence
• Unnecessary activities are found in the process
• Technical team biasness influences on supplier selection
• Delay in current process because of ineffective tools of communication
Chapter 6: Empirical Analysis
50
Where: Place – Where the problem takes place?
After analysing the current process map of LPCL supplier selection process the above
discussed problems arise at the following stages in the process.
• Purchasing Request + Bidding + Evaluation (TCO + Market Intelligence)
At the time of Purchasing Request estimation cost is wrongly stated without considering
the total cost of ownership, evaluation criteria is not mutually formulised and mode of
procurement is suggested based on only preferred suppliers. Bidding stage lacks full
utilisation of market resources. Only preferred suppliers from internal suppliers’ database
are considered, other recourses like 3rd party assessments, suppliers’ plant visits and
external assessment including trade exhibitions, supplier referrals are not considered. In
the evaluation stage problems arise due to the non-involvement of procurement team in
supplier evaluations.
• Purchasing Request + Evaluation Criteria (Long Term Relationship)
As discussed above at the stage of Purchasing Request and Evaluation LPCL technical
selection team sometimes develops a very rigid criterion for selection and evaluation that
leads to less suppliers’ participation that is considered important in long term. Moreover
technical selection team only considers quantitative factors (like price, quality and
delivery time) where as qualitative factors (like financial health, operational performance,
business process & practices, risk factors and cultural factors) are not considered.
• Bidding (D.P., & EOI) + Negotiations & Contracts (LOI) (Process Complexity)
Process complexities can be found at the stage of Bidding and Negotiations & Contracts
stage. Like during bidding stage no expression of interest is sent to suppliers that can be
effective in terms of knowing how many suppliers are interested and will send their
quotations. Direct purchases make the process complex with the transparency issues and
manual transactions. Further at the stage of negotiations with suppliers and after finalising
it, LPCL sends letter of intent to finally selected supplier which is duplication of activity
as direct contract with purchase order can be issued to save the time.
Chapter 6: Empirical Analysis
51
• Purchasing Request + Bidding (Mode of procurement) + Evaluation (technical
matters) (Human Intervention)
Human interventions that are biasness of technical selection team can be found during the
formulisation of Purchasing Request, Bidding and Evaluation stages. Procurement team
is not allowed to comment during development of technical criteria and technical
evaluation despite having the technical expertise. Similarly procurement team has to go
for the bidding process under that procurement mode which is advised by the technical
team, especially when it comes for limited suppliers selection (limited invitation of
tenders) and single source (single source/propriety) supplier selection.
• Bidding (RFQ & D.P.) + Negotiations & Contracts (Negotiations & finalization)
(Suite of Communication)
Process delays because of ineffective tool of communication can be found at the stage of
Bidding and Negotiations & Contracts. In bidding RFQ is obtained through ordinary mail
system in order to maintain office records which take more time. In direct purchases
manual transactions are carried out which can lead to process transparency issues. Only
manual quotations are received and considered in the evaluation stage. Moreover during
negotiation stage ordinary mail correspondence is carried out by LPCL which is
ineffective tool. Personal meetings are considered as more effective however if not
possible at least electronic modes of communication like video conferencing should be
adopted to carried out the negotiations with suppliers.
Who: Involvement – Who are involved?
Generally following five departments of LPCL are involved in the supplier selection process
having a major or minor influence on the process.
• Technical Team
• Financial Team
• Procurement Team
• Legal Team
• I.T. Team (Information Technology Team)
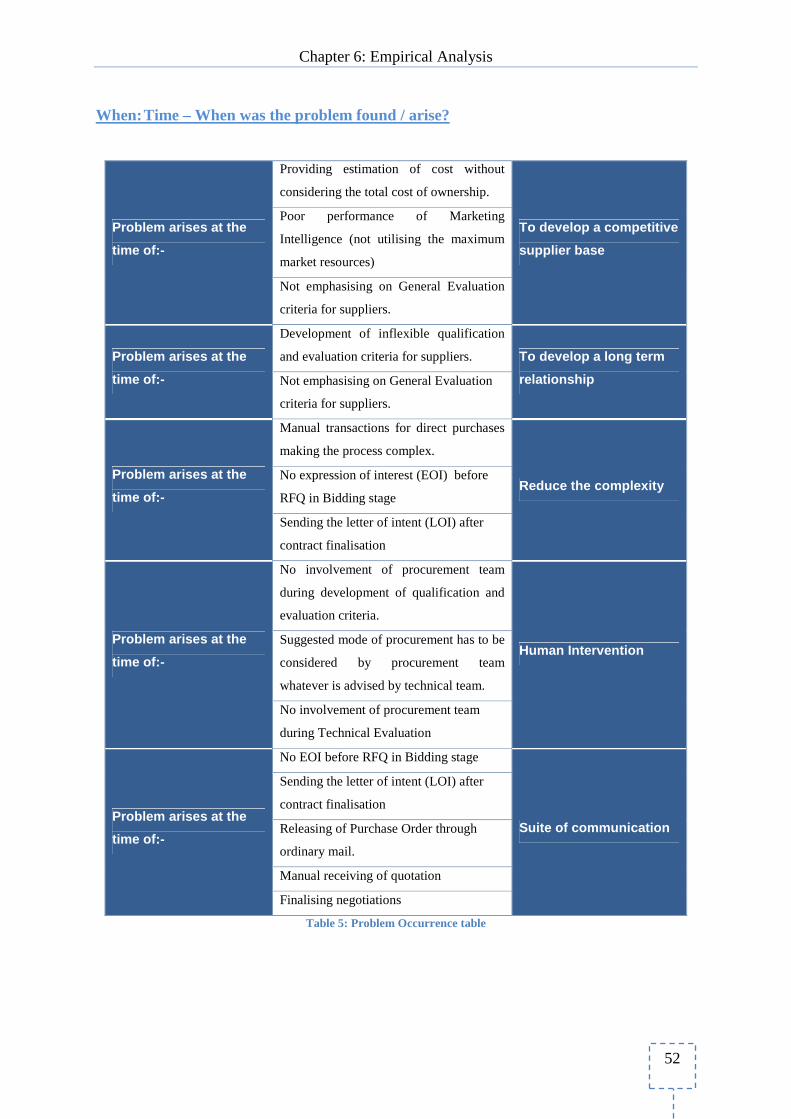
Chapter 6: Empirical Analysis
52
When: Time – When was the problem found / arise?
Providing estimation of cost without
considering the total cost of ownership.
Poor performance of Marketing
Intelligence (not utilising the maximum
market resources)
Problem arises at the
time of:-
Not emphasising on General Evaluation
criteria for suppliers.
To develop a competitive
supplier base
Development of inflexible qualification
and evaluation criteria for suppliers. Problem arises at the
time of:- Not emphasising on General Evaluation
criteria for suppliers.
To develop a long term
relationship
Manual transactions for direct purchases
making the process complex.
No expression of interest (EOI) before
RFQ in Bidding stage
Problem arises at the
time of:-
Sending the letter of intent (LOI) after
contract finalisation
Reduce the complexity
No involvement of procurement team
during development of qualification and
evaluation criteria.
Suggested mode of procurement has to be
considered by procurement team
whatever is advised by technical team.
Problem arises at the
time of:-
No involvement of procurement team
during Technical Evaluation
Human Intervention
No EOI before RFQ in Bidding stage
Sending the letter of intent (LOI) after
contract finalisation
Releasing of Purchase Order through
ordinary mail.
Manual receiving of quotation
Problem arises at the
time of:-
Finalising negotiations
Suite of communication
Table 5: Problem Occurrence table
Chapter 6: Empirical Analysis
53
How: Method/Solution – How to improve?
Generally discussing the following points should be considered for improvement in the LPCL
current supplier selection process.
• Forecasting and material planning
• Analyse all resources of market intelligence
• Evaluation criteria must be continuously evaluated with the mutual involvement of
procurement and technical team
• Discouragement of Direct Purchases
• Direct issuance of contract
• There must be mutual involvement of technical & procurement team in whole
supplier selection process
• Effective suite of communication tool must be adopted and used in each process of
supplier selection to make it more efficient
How much / how many?
How many processes are to be improved? How many / how much improvement can be
brought in current supplier selection process?
• To develop competitive supply base:
Provide better decision making and deliver a competitive advantage particularly in
cost saving and responsiveness to requirements. Heinritz et al. (1991) indicated the
competitive supply base development provides cost-reduction possibilities, better
sources, collaborative planning with supplier.
• To develop a long term relationship:
This can result in a joint support concerning cost reduction, risk sharing, and supplier
capabilities development. Monczka et al. (2009) mentioned that a long term supplier
relationship management works as one of the most critical tools in monitoring process
ensuring the performance improvement achieved thorough the strategy in term of
cost, quality, delivery and time.
Chapter 6: Empirical Analysis
54
• Reduce the complexity:
Robust process and be simple use. Monczka et al. (2009) stated that the process
model should be clearly defined and simplifying process. Different people from
difference functional area involved in the process can understand a routine and
process model easier including a reduction of errors in the process.
• Human Intervention:
Standardise evaluation and measurement process can help LPCL selects good
suppliers in right products. Consequently, the good relationship between LPCL and
supplier will take place. Mitchell (1998) stated that whenever clients have a strong
mutual benefit with suppliers, the errors in selecting supplier will be occurs.
• Suite of communication:
Reduce a time-consuming process and eliminate paper work handling. Monczka et al.
(2009) also mentioned the efficiency transactions in process were generated by the
suit of communication tools.
6.2.2 Cause and Effect Diagram – LPCL Supplier Sele ction Process
Problem sources for LPCL supplier selection process were brainstormed through cause-and-
effect diagram. However the process of doing this is also assisted with 5W2H framework.
The problem sources are divided into six different categorizes that are People, Process,
Communication, Management, Supplier and Technology. Each cause has its sub-cause which
affects the selection process at LPCL. The potential reasons being found in the process are
included in the cause-and-effect diagram which can be shown by the following Figure 26.
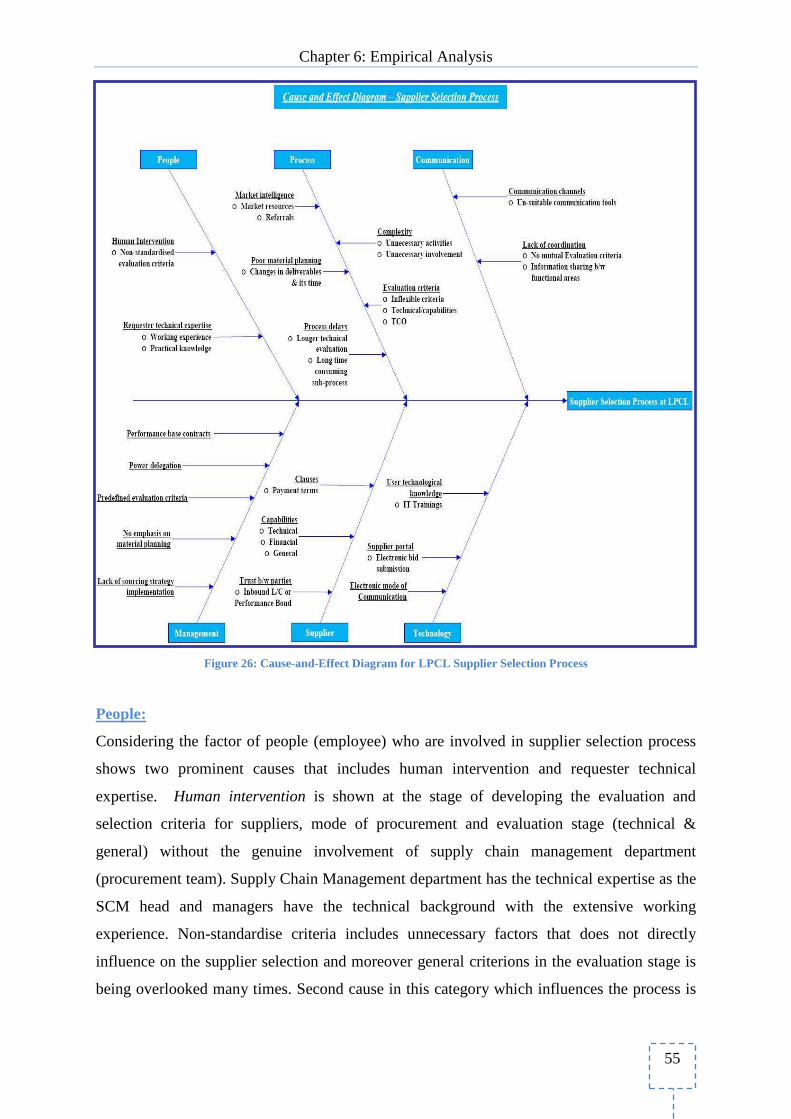
Chapter 6: Empirical Analysis
55
Figure 26: Cause-and-Effect Diagram for LPCL Supplier Selection Process
People:
Considering the factor of people (employee) who are involved in supplier selection process
shows two prominent causes that includes human intervention and requester technical
expertise. Human intervention is shown at the stage of developing the evaluation and
selection criteria for suppliers, mode of procurement and evaluation stage (technical &
general) without the genuine involvement of supply chain management department
(procurement team). Supply Chain Management department has the technical expertise as the
SCM head and managers have the technical background with the extensive working
experience. Non-standardise criteria includes unnecessary factors that does not directly
influence on the supplier selection and moreover general criterions in the evaluation stage is
being overlooked many times. Second cause in this category which influences the process is
Chapter 6: Empirical Analysis
56
requestor technical expertise, in which practical knowledge and working experience matters
a lot in the selection of right supplier. In the discussion with LPCL SCM head, we analysed
that the impact of working experience and technical knowledge of the requester matters a lot
while developing the specific criteria for evaluation. Because user has to analyse the received
quotations and his decisions will truly base on his technical expertise.
Process:
Some issues connected with process have been found. The first comes regarding working of
marketing intelligence which is not actually performing up to the mark. This sub team is not
utilising the full market resources for supplier search. Currently only those suppliers get
registered in LPCL database who themselves request LPCL to add in supplier database and
send information about their businesses to them. Technical selection team is greatly inclined
towards the selection of preferred suppliers (with whom they already had a business) and
procurement team is not continuously doing market analysis for supplier search that might
include personal referrals, trade exhibitions, yellow pages, and internet search engines,
external assessments through blog and forums and third party assessments. Material planning
is not actively carried out which creates a hurdle for the procurement team. With the absence
of right forecasting the actual needs becomes urgent and resultantly in order to meet the
desired need procurement team has to deviate from its procedures that affect the supplier
selection process. In some cases technical team makes changes in the delivery time after
issuing the enquiry to suppliers, resultantly with this change some potential suppliers drop
their bids as they cannot make an urgent delivery. Complexity can be found in the current
process with the unnecessary activities (like expression of interest is not obtained and
issuance of letter of intent after finalisation of contract) and unnecessary involvement of
finance department for budget approval. Technical team has to get budget approval from the
finance team which is a time consuming process. However department wise budget authority
can be transferred to respective department heads. Evaluation criteria issue covers inflexible
criteria given by the technical team which is rigid in some cases and demands fulfilment of
unnecessary requirements that do not directly influence on the selection. Supplier’s selection
is greatly influenced by their technical capabilities however other intangible criterions must
also considered which most of the time is overlooked. Total cost of ownership is not
considered for the material estimation cost that results in huge variation when the actual price
is received. Process delays can also be found under this category as its some sub-process are
Chapter 6: Empirical Analysis
57
time consuming. Technical team takes more time than usual while evaluating the technical
bids, leaving less period for bid validity.
Communication:
The third problem source is named as communication. At many steps unsuitable tools of
communication are adopted. Examples includes request for quotation is obtained though
ordinary email, electronic quotations are not accepted and no electronic mode of
communication is adopted at the stage of negotiations and contracts. Lack of coordination
exists between the departments and information sharing is not free carried out. This thing can
be exemplified by non–involvement of procurement team in technical selection team.
Management:
Different issues are connected with the management problem source. Based on the detailed
discussion with authorities, we came to the point that there is a lack of strong implementation
of sourcing strategy with less emphasise on material planning. Concerned department heads
are validating the predefined evaluation criterions which are not continuously updating and
also leading to personal influences. The other sub-cause is a power delegation of authorities
from the management which is no involvement of SCM authorities in technical matters
despite having the technical expertise. Another important aspect arise from the management
side is the non-existence of performance base contract system. A performance base contract
with suppliers ensures and fosters a successful long term working relationship.
Supplier:
There is no apparent problem at the supplier’s side however different issues are connected
with this problem source. Supplier capabilities that affect the supplier selection in this
process are their technical, financial and general capabilities. The matter of trust between the
parties has been observed in the process which affects the supplier selection. Because of lack
of trust LPCL demands performance bond from the supplier and/or opening of inbound L/C
with them and non compliance of this can disqualify the supplier. Another important issue is
the imposition of clauses from the suppliers’ side including payment term clauses. And not
withdrawing the clauses by suppliers can disqualify them from the process.
Chapter 6: Empirical Analysis
58
Technology:
The technology as problem source in the cause-and-effect diagram that affects the supplier
selection process includes lack of electronic modes of communication at different stages, no
supplier portal including no electronic bid submission and user technological knowledge.
LPCL is not managing any kind of supplier portal to manage its suppliers however its
availability is mutually beneficial and because of its absence suppliers cannot submit their
bids electronically. User technical knowledge affects the usage of LPCL Oracle – SCM suite.
And very less training sessions are arranged for the users to accommodate them to quickly
understand the newer version of Oracle; therefore resultantly users take more time to get
familiar with the newer versions.
6.3 Improve
With the help of above discussed Analyse stage, we identified the problems using cause and
effect diagram. In this improve stage those problem were removed and the existing process
was modified to provide an improved supplier selection process for LPCL which is shown in
Figure 27. The improvement practically provides the best possible solution and corrective
actions will deliver a better performance of supplier selection process.
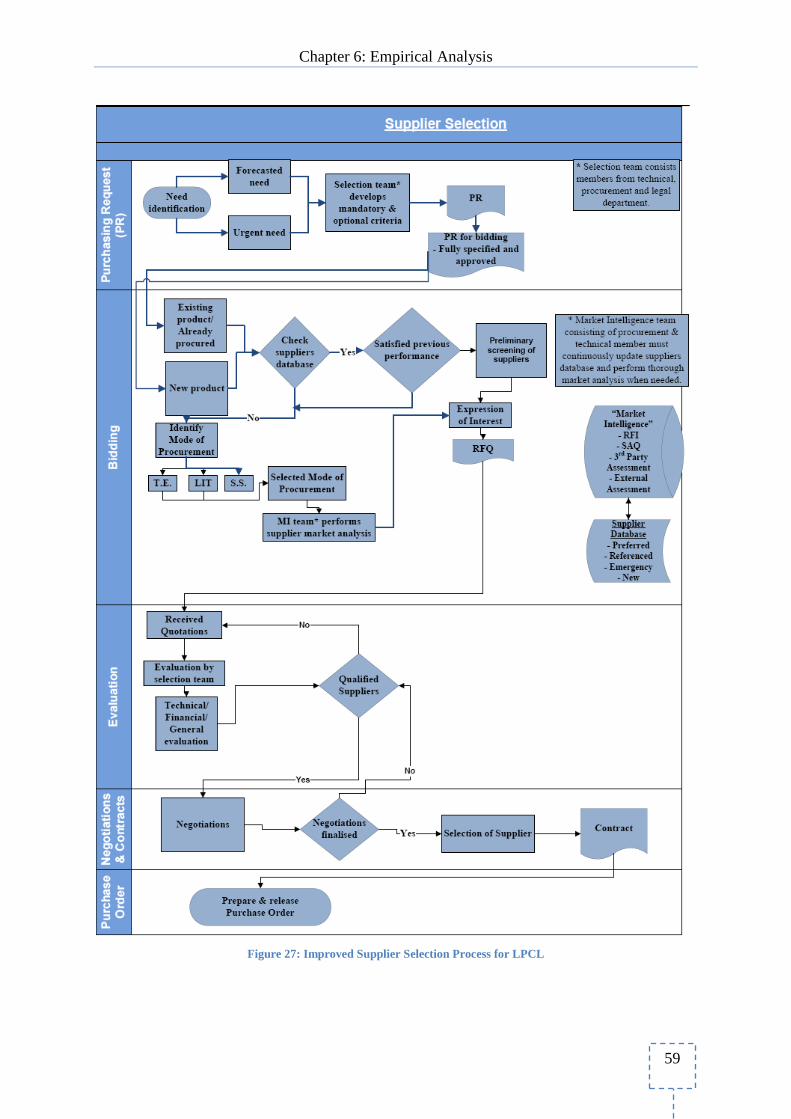
Chapter 6: Empirical Analysis
59
Figure 27: Improved Supplier Selection Process for LPCL
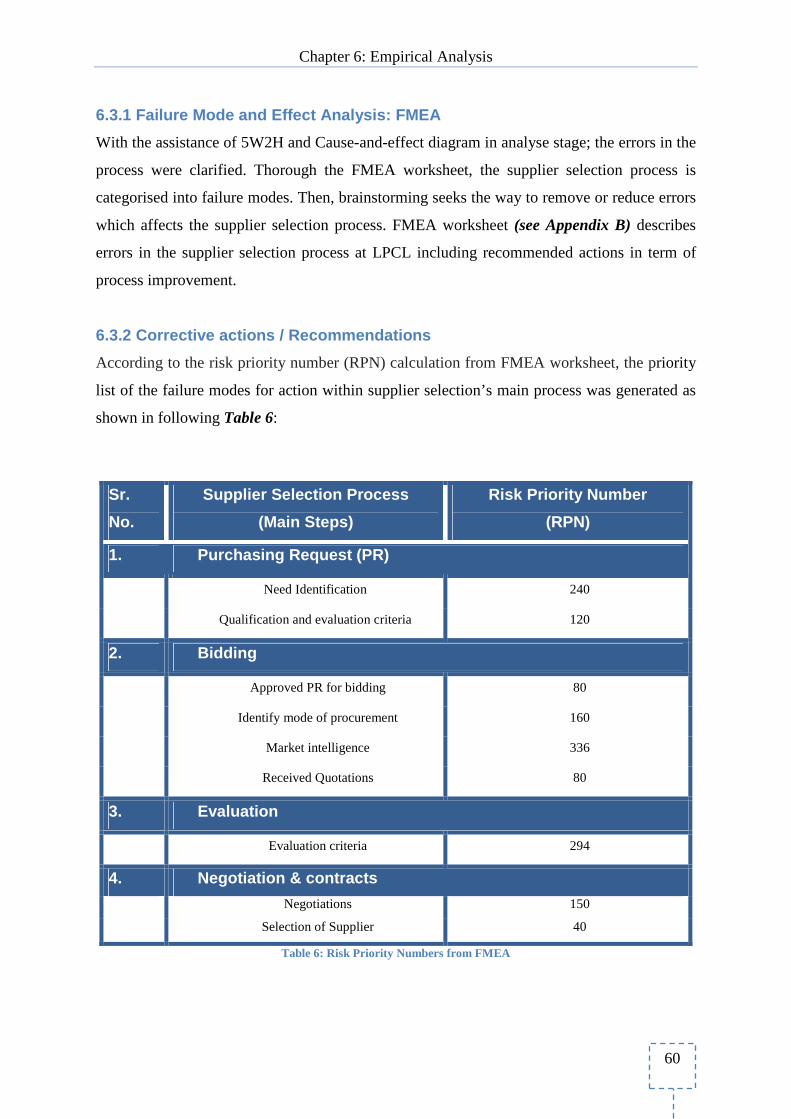
Chapter 6: Empirical Analysis
60
6.3.1 Failure Mode and Effect Analysis: FMEA
With the assistance of 5W2H and Cause-and-effect diagram in analyse stage; the errors in the
process were clarified. Thorough the FMEA worksheet, the supplier selection process is
categorised into failure modes. Then, brainstorming seeks the way to remove or reduce errors
which affects the supplier selection process. FMEA worksheet (see Appendix B) describes
errors in the supplier selection process at LPCL including recommended actions in term of
process improvement.
6.3.2 Corrective actions / Recommendations
According to the risk priority number (RPN) calculation from FMEA worksheet, the priority
list of the failure modes for action within supplier selection’s main process was generated as
shown in following Table 6:
Table 6: Risk Priority Numbers from FMEA
Sr.
No.
Supplier Selection Process
(Main Steps)
Risk Priority Number
(RPN)
1. Purchasing Request (PR)
Need Identification 240
Qualification and evaluation criteria 120
2. Bidding
Approved PR for bidding 80
Identify mode of procurement 160
Market intelligence 336
Received Quotations 80
3. Evaluation
Evaluation criteria 294
4. Negotiation & contracts
Negotiations 150
Selection of Supplier 40
Chapter 6: Empirical Analysis
61
Purchasing Request (PR)
To reduce high level of total cost of ownership (TCO) and inventory, the best solution for
LPCL is material planning by using information from ERP system. Basically, production and
inventory forecast can identify the future need and the technical team can schedule its need.
As the result, the process will prevent from the errors. The ways to gather cost information
are benchmarking with competitors and updating internal cost and financial analysis. To get
accurate information, LPCL should not consider only price, but also after sale package such
as warranty, spare parts, maintenance cost. Inflexible criteria are the critical cause of
dropping out many suppliers. Reviewing current criteria, then eliminate unnecessary criteria
is the way to ensure that reasonable and effective criteria are used regarding qualification and
evaluation criteria. Moreover, there is a coordination gap between technical team and
procurement team at LPCL. To reduce this gap, a team has to formalise internal customer
guidelines regarding to a clear communication for what exactly the internal customer wants
and needs.
Bidding
Another cause of delay process for urgent need product is power delegation. Most current
making decision was hold by high management level. Supplier selection process can respond
shortly if LPCL provide authority to lower management for making decision. During the
bidding, technical team sometimes changes their needs in deliverable and its time.
Procurement team should give all suppliers equal change to adjust their bids and non-equality
can reduce the number of supplier by dropping their bids. Conflict of interest influences on
process delay with personal biasness. Employees who are in a position to influence
purchasing transactions are required to avoid situations, relationships or perceptions where
their personal interests may conflict. To prevent conflict of interest, employee must deal with
supplier and other business partners in an ethical manner such as honestly, fairness and
integrity. Moreover, some mode of procurement such as direct purchase provides process
complexity, manual transaction and transparency issue. Adopting effective mode of
procurement for each product will help team to shortcut the bidding process. Based on
current market intelligence, it does not give the real input for updating the supplier database
and use only preferred supplier. Practically, LPCL should analyse all source of market
intelligence (e.g. press, articles, supplier document and visits to suppliers), and keep
monitoring supplier market. Also, a team should continuously update and review the list of
Chapter 6: Empirical Analysis
62
supplier by structuring supplier into 3 categories; preferred, referenced and accepted.
Evidentially, employees have little or limited technical knowledge of market intelligence.
Setting up basic training program will develop their purchasing skills that lead to a better
performance. Electronic mode of communication such as Supplier Portal is meaningful for
LPCL to develop their process. It is an effective communication channel that increased
transparency internally and externally, gain time through more efficient interactions and real
time information sharing with supplier and internal sourcing team.
Evaluation
Choosing the potential suppliers, criterion should be a continuous consideration. In fact,
different criterion may be used for suppliers. Basically, suppliers were considered in area of
cost, flexibility, quality, service and delivery. LPCL as business unit does not fully conform
to group policy; therefore, management must emphasis and impose policy specially sourcing
policy concerning to continuously consider general criteria by adopting different methods
like employee trainings, periodic meetings with senior management and so on. In this
process, inflexible criterion is also a cause. Reviewing and continuously updating are
working as recommended action like above. In the existing process we identified that no
mutual evaluation criteria and information sharing among teams exist therefore it leads to
human intervention. LPCL should have regular meeting to increase visibility for the team and
knowledge sharing. In addition to this evaluation should be performed by a team (requester,
and purchaser) to ensure that a team has standardised evaluation criteria. Lastly, procurement
team tend to take longer time in technical evaluation. The management should schedule the
project and set up lead time for each process to provide fast response for a need.
Negotiation & Contracts
Negotiating for a fair and reasonable price and selecting the supplier best meeting the need
are the main objectives in this process. The suitable communication channel is required for
information processing capabilities. Nowadays number of new tools such as internet auctions
has been adopted during negotiation stage. However, manual communication channels; face-
to-face negotiation and conventional sealed bids, are still more polite than email negotiation.
In some cases, electronic channels like video conference may act as a replacement.
Development of long term supplier relationship thorough strong communication and
information sharing helps parties in sharing a risk. It also provides successfully business
Chapter 6: Empirical Analysis
63
when working with the selected supplier regarding to long-range financial and value-added
benefits. A true relationship can help LPCL reduce their paperwork such as inbound L/C
opening and submission of performance bond. Moreover, double paperwork (LOI and
contract) was found in this stage. A team has to review overall process and eliminate
unnecessary paperwork for shorten time period and to improve the whole process.
6.4 Control
The control stage is the last phase of Six-Sigma DMAIC. The progress in this stage is to
ensure that changes or the modified process from improve stage are successful and
continuous improvement is taking place in supplier selection process.
6.4.1 Process Management and Communication
Wu and Barnes (2009) mentioned that, when tools/applications are adopted for process
improvement then process becomes more influential and leads to continuous improvement.
To preserve continuous improvement, LPCL should work on process improvement control.
By gathering meaningful information from the previous three stages, it can easily design the
quality management involving process for planning and controlling the flow of work through
supplier selection process as the concept of continuous improvement.
With the new flowchart, the first thing it will map the whole picture of supplier selection
process at LPCL and the second thing is that few steps of overall process will prevent a team
from problem occurring. By eliminated unnecessary activities and paperwork, the new
flowchart will expectably be more efficient than the existing one. Moreover, it possibly
guides a good plan which LPCL can perform the better process lead to the better decision
making.
The management team at LPCL also plays an important role in developing strategies based
on continual and effective communication. Simultaneously, the all members of team must
coordinate and incorporate the best practices to deliver the better performance. The ERP
system at LPCL works very well as effective computer-assisted tools in the area of planning,
monitoring, control and reporting but the system is requiring the skills. LPCL has to educate
their employees to preserve a better job and use a tool more efficiency.
Chapter 6: Empirical Analysis
64
Kist (2004) stated the need of timely, clear, effective communication is critical key affecting
to process improvement. Using a variety of communication techniques will help LPCL
enhance understanding, also increase involvement and collaboration, namely the motivation
plan. Mitchell (2006) suggested motivation plan need to start from educating and
communicating. Customer Guidelines, for example, are designed as a communication
channel for optimising supplier selection process. They work as an assistant to identify a
process in depth concerning roles, responsibilities, timeline, and documentation.
Communicate, communicate, communicate AND THEN educate, educate, educate is the
communication concept that begins with the expectations of internal customer move to
suppliers throughout supplier selection process. Each department participating in supplier
selection process must communicate the plan to each other and make sure a team understand
the process including activities and information. Then, educate internal customer purchasing
skills including what deliverables they need and what the goal is. Feisell et al (2008)
mentioned that when a team has the high level of purchasing skill, organisation will have
positively performance on strategic purchasing practices.
Through communication openness and early collaboration at different levels of management
and across functional areas urge the level of process maturity and a problem solving. The
management team need to build closely rapport within organisation because mutual positive
coordination among team members during the act of communicating provides a great
enhancement in processing capabilities. Whereas this mutual positive coordination also
encourages team members willingly sharing information and responsibility for work. The
complexity environment in some steps of supplier selection process such as evaluation
criteria create the need of effective communication channels. For LPCL, it is important to
frequently use computer technology such email or small group meeting for discussion and
planning for contingencies as fast response when problem occurring.
Chapter 7: Conclusion
65
7. Conclusion
This chapter concludes the thesis. Further on own reflections about this assignment will be presented. Finally, suggestions for future research will be given as regard to the subject of this thesis.
7.1 Results
The objective of this thesis could be concluded in connection to the same structural model of
DMAIC which we followed throughout this script.
The research question:
“How can the existing supplier selection process at Lafarge Pakistan Cement Limited
(LPCL) be improved by applying Six-Sigma DMAIC?”
Results are presented below to serve the purpose of thesis and to answer our research
question;
7.1.1 Define: To narrow down the scope of the supplier selection process we selected the plant and
equipment suppliers from the purchasing product family. Moreover in order to determine the
focus and process characteristics we selected three major steps of procure-to-pay process:
quotations and bidding, supplier selection and evaluation, and negotiations and contracting.
7.1.2 Measure: In this phase we mapped the current supplier selection process at LPCL through process
mapping. We used flowchart as a mapping tool to map the current supplier selection process
in this stage. Flowchart is the pictorial representation of the activities within the process and
by this we came to know the actual activities or steps involved in the current supplier
selection process at LPCL. There are some standard symbols in flowcharting which are used
to map the process.
Chapter 7: Conclusion
66
7.1.3 Analyse: At this stage using DMAIC approach of Six Sigma, we analysed the issues involved in
current supplier selection process that lead to increase the gap between actual and required
performance. In this phase we used the tools which are very good at identifying the problems
within the activity or among the activities. The first tool is 5W2H which also works as
facilitator for the second tool which is cause and effect diagram. The 5W2H is
comprehensive tool for identification of the problem and gave us the platform to think for the
solution. Cause and effect is used to identify the variation within the process through
graphical representation. The problematic issues identified were;
• No material planning or forecasting the need.
• Poor performance of Marketing Intelligence
• Not emphasising on General Evaluation criteria for suppliers.
• Inflexible qualification and evaluation criteria for suppliers
• Unsuited communication channel used
• No expression of interest (EOI) before RFQ in Bidding stage
• Double paperwork in some process
• No involvement between procurement team and technical team in evaluation stage.
7.1.4 Improve: Based on the problems identified at the Analyse stage, we developed an improved flow chart
of the existing supplier selection process. With the help of FMEA tool we characterised the
problems according to risk priority numbers and based on those risk priority numbers
recommended actions are given to bring improvement in the existing process. The
recommended actions for supplier selection process through Failure Mode and Effect
Analysis FMEA are:
• Production and Inventory forecast by defining target cost, updating internal cost and
financial analysis, and benchmarking with competitors.
• Review criteria and eliminate unnecessary criteria
• Coordinate and involvement between a team
• Treat all suppliers equal in any change
• Dealing with suppliers and partners in an ethical manner
Chapter 7: Conclusion
67
• Develop market Intelligence by updating data and analysing all sources.
• Set up training program to develop purchasing skill and impose sourcing policy.
• Adopt suited communication channels
• Build long term supplier relationship
7.1.5 Control:
To control the activities involved within the process of supplier selection process, LPCL
should focus on planning of activities at the right time and communicating in the right
direction. Collaboration of departments is essential to achieve the overall goal of the
organisation. Six-Sigma is a continuous improvement tool that will help LPCL to control the
activities on continuous basis. Process management and communication strategy is suggested
to ensure continuous improvement and control objectives. Majorly effective planning and
communication are two main control tools that will help LPCL to reduce the errors within the
supplier selection process.
7.2 Own Reflections
In order to achieve the primary objective of the thesis (that was to inspect current supplier
selection process at LPCL and suggest improvements), we found Six-Sigma DMAIC as the
most relevant process quality improvement methodology. This could somehow be done with
several other quality improvement methodologies available i.e. TQM, Kaizen and MBO, for
in-depth comparative investigation for LPCL. Moreover as physical presence at LPCL was
not possible due to long geographical distance, this thesis only relied on the electronic means
of data collection through emails and video conferencing.
LPCL is unable to absorb any kind of suppliers innovation as no framework exists that
encourage collaborative long term relationships with its suppliers. Moreover they do not have
any strategic suppliers in their supply base. LPCL management should categorise its suppliers
according to value driven segmentation in order to identify the value driven suppliers by
which they can enhance their technical expertise, bring process and product improvements.
Suppliers that offer value driven products can help organisation to reduce total cost of
ownership. Cement industry acts as a building block in nation’s construction industry,
therefore having a competitive supply base can help LPCL to capture big chunk of cement
market with the help of its suppliers.
Chapter 7: Conclusion
68
7.3 Suggestions for Future Research
Based on the findings of this thesis, we suggest that the further research for LPCL could be
done in the area of sourcing and suppliers relationship management. Sourcing: A study could
examine the sourcing policy at LPCL on purchasing practises of products. It would also be
interesting to focus more on this area which leads to excellent cost reduction. Using scenario
method could compare and analyse regional, national and worldwide sourcing. Supplier
Relationship Management: A study could investigate supplier relationship management that
leads to creating a competitive advantage for LPCL through the development of supplier
performance monitoring and supplier development programme. More details could
continuously move towards cost reduction, increased reliability and risk mitigation,
transparency of supplier costs and quality, and enhanced efficiency of sourcing process.
References
69
References
Adams, J., Khan, H., Raeside, R. and White, D. (2007), Research Methods for Graduate
Business and Social Science Students, Sage Publications Inc., Mathura Road, New
Delhi.
Bocking, S. (2004), Nature's experts: science, politics, and the environment, Rutgers
University Press, New Brunswick, NJ.
Bolhouse, V. (2008), "Quality Numbers: Six Sigma", Vision System Design, Vol.13 No.1, pp.
33-41.
Brassard, M., Finn, L., Ginn, D. and Ritter D. (2002), The Six Sigma Memory JoggerTM II: A
Pocket Guide of Tools for Six Sigma Improvement Teams, GOAL/QPC, Salem, NH.
Breyfogle, F.W. (2003), Implementing Six Sigma: Smarter Solutions Using Statistical
Methods, John Wiley & Sons Inc., Hoboken, NJ.
Brue, G. (2002), Six Sigma for Managers, McGraw-Hill, Madison, WI.
Campbell, G. (2004), “Flowing through a Process”, Quality, Vol. 43 No. 6, pp 50-53.
Changqing, G., Kezheng, H., and Fei, M. (2005), “Comparison of Innovation Methodologies
and TRIZ”, Triz Journal, 7 September, Issue 8, available at: http://www.triz-
journal.com/archives/2005/09/07.pdf (accessed 16 April 2010).
Chase, R. B., Jacobs, F. R., and Aquilano, N. J. (2004), Operations Management for
Competitive Advantage, McGraw-Hill, New York.
Coronado, B.R., and Antony, J. (2002), “Critical success factors for the successful
implementation of Six Sigma projects in organisations”, Total Quality Management,
Vol. 14 No. 2, pp. 92-95.
References
70
Department of Trade & Industry: DTI (n.d.), "Tools and Techniques for Process
Improvement", available at:
http://www.businessballs.com/dtiresources/TQM_process_improvement_tools.pdf
(accessed 13 April 2010).
Fangqi, C., Huaiao, W. and Feifan, Y. (2009), “A multi-criteria interval optimization model
for manufacturing supplier selection using genetic algorithm”, in proceedings of First
International Workshop on Education Technology and Computer Science, IEEE, pp.
757-761.
Feisell, E., Hartmann, E. and Jahns, C. (2008), “The impact of Human Resource Management
(HRM) practices on purchasing skills and knowledge: A German Case Study”,
competitive paper presented at the 19th Annual North American Research/Teaching
Symposium on Purchasing and Supply Chain Management, Tempe, Arizona.
Fook, J. (2002), “Theorizing from practice towards an inclusive approach for social work
research”, Qualitative Social Work, Vol.1 No.1, pp. 79-95.
Goldsby, T. and Martichenko, R. (2005), Lean Six Sigma Logistics: Strategic Development to
operational Success, J. Ross, Florida.
Grumbine, R. A., Hecker, L. and Littlefield, A. P. (2005), Biology Success! Teaching Diverse
Learners: A Resource Manual for Biology Educators, National Institute Landmark
College, Vermont.
Gupta, P. (2004), Six Sigma Business Scorecard: Ensuring Performance for Profit, McGraw-
Hill, New York, NY.
Hambleton, L. (2008), Treasure Chest of Six Sigma Growth Methods, Tools, and Best
Practices: A Desk Reference Book for Innovation and Growth, Prentice Hall, New
Jersey, NJ.
References
71
Heinritz, S., Giunipero, L.C. and Kolchin, M.G. (1991), Purchasing Principles and
Applications, Prentice-Hall, Englewood Cliffs, N.J.
Hwang, Y.D. (2004), "The practices of integrating manufacturing execution systems and Six
Sigma methodology", The International Journal of Advanced Manufacturing, Vol. 31
No. 1-2, pp. 145-154.
Islam, K.A. (2006), Developing and Measuring Training the Six Sigma Way: A Business
Approach to Training and Development, Pfeiffer, San Francisco, CA.
Jalali, S.M.J., Shafieezadeh, M. and Naiini, M.A.S. (2008), “Using Knowledge Management
in DMAIC Methodology of Six Sigma Projects”, in proceedings of the 2008 1st
International Conference on Information Technology, IT 2008, IEEE, Gdansk, pp.1-4.
Jonker, J. and Pennink, B. W. (2010), The Essence of Research Methodology: A Concise
Guide for Master and PhD Students in Management Science, Springer, Heidelberg.
Keller, P. (2005), Six Sigma Demystified: A self teaching guide, McGraw-Hill, New York,
NY.
Kist, J.F. (2004), “Supplier Relationship Management during an Acquisition”, in proceedings
of 89th Annual International Supply Management Conference, April 2004.
KoanIT (2003), "Process Improvement Methodology", available at: http://www.koan-
it.com/en/about/pdf/koan-it_whitepaper.pdf (accessed 14 April 2010).
Krajewski, J. L., Ritzman, P. L., and Malhotra, K. M. (2007), Operations Management
Process and Value Chain, Prentice Hall, New Jersey, NJ.
Lewis, H. (1943), Industrial Purchasing Principles and Practices, Richard D. Irwin,
Homewood, IL.
References
72
Martin, J.W. (2007), Lean Six Sigma for Supply Chain Management: the 10-step solution
process, McGraw-Hill, New York, NY.
McDermott, R.E, Mikulak, R.J and Beauregard, M.R. (2009), The Basics Of FMEA,
Productivity Press, New York.
Mitchell, L.K. (1998), “Having it ALL - Select the Right Supplier and Develop and
Maximize the Relationship”, in proceeding of 83rd Annual International conference,
May 1998.
Mitchell, L.K. (2006), “Developing Customer Guidelines – A Communications tool for
Optimizing Supplier Selection”, in proceedings of 91st Annual International Supply
Management Conference, May 2006.
Monczka, R.M., Handfield, R.B., Giunipero, L.C. and Patterson, J.L. (2009), Purchasing and
Supply Chain Management, South-Western, Mason, O.H.
Nash, M.A. and Poling, S. R. (2009), “Process mapping for the 21st Century”, Quality, Vol.
48 No.8, pp 24-25.
Neville, C. (2005), Introduction to Research and Research Methods, University of Bradford,
Bradford.
Nicholson, S.W. and Bennett, T.B. (2009), “Transparent Practices: Primary and Secondary
Data in Business Ethics Dissertations”, Journal of Business Ethics, Vol.84 No.3, pp.
417-425.
Norman, M. and Kehoe, D. (1997), “OQP Quality Toolbox”, working paper, Los Alamos
National Laboratory, University of California, California, 27 March.
Perry, C. and Jensen, O. (2001) “Approaches to combining induction and deduction in one
research study”, paper presented at the Australian and New Zealand Marketing
Academy Conference (ANZMAC), 1-5 December, Albany, Auckland, available at:
References
73
http://smib.vuw.ac.nz:8081/WWW/ANZMAC2001/anzmac/AUTHORS/pdfs/Perry1.
pdf (accessed 30 March 2010).
Pyzdek, T. (2003), The Six Sigma Project Planner: A Step-by-Step Guide to Leading a Six
Sigma Project through DMAIC, McGraw-Hill, New York, NY.
Pyzdek, T. and Keller, P.A. (2010), The Six Sigma Handbook: A Complete Guide for Green
Belts, Black Belts, and Managers at All Levels, McGraw-Hill, New York, NY.
Punch, K. F. (1998), Introduction to social research: Quantitative and qualitative
approaches, Sage Publications, Thousand Oaks, CA.
Quinn, D. (2007) "An Introduction to Quality Tools" available at:
http://mot.vuse.vanderbilt.edu/mt322/Ishikawa.htm (accessed 16 April 2010).
Rabianski, J.S. (2003), “Primary and Secondary Data: Concepts, Concerns, Errors, and
Issues”, Appraisal Journal, Vol. 71 No. 1, pp. 43-56.
Saen, R.F. (2009), “Supplier selection by the new AR-IDEA model”, International Journal of
Advanced Manufacturing Technology, Vol. 139 No. 11-12, pp. 1061-1071.
Sarkis, J. and Talluri, S. (2002), “A Model for Strategic Supplier Selection”, The Journal of
Supply Chain Management, Vol. 38 No. 1, pp. 18-29.
Six Sigma Training Resource (2009), "Process Flowcharts", available at:
http://www.dmaictools.com/dmaic-measure/process-flowcharts (accessed 16 April
2010).
Skinner, M. (2010) “Research – the essential guide: Ways to categories research and
methodology”, British Film Institute, Waterloo, available at:
http://www.bfi.org.uk/education/teaching/researchguide/pdf/bfi-edu-
resources_research-the-essential-guide.pdf (accessed 2 April 2010).
References
74
Sogunro, O. A. (2001), “Selecting a Quantitative or Qualitative Research Methodology: An
Experience”, Educational Research Quarterly, Vol. 26 No. 1, pp. 3-6.
Tang, C. L. (2007), Fortification of Six Sixma: Expanding the DMAIC Tools, Wiley
InterScience, OH.
The UK Office of Government Commerce (2006), "Catergory Management Toolkit: Cause
and Effect Analysis", available
at:http://www.ogc.gov.uk/documents/Cause_and_Effect_Analysis(1).pdf (accessed 16
April 2010).
Thomas, A.B. (2004), Research Skills for Management Studies, Routledge, New York.
Thomas, D. R. (2003), “A general inductive approach for qualitative data analysis”, Working
Paper, School of Population Health, University of Auckland, New Zealand, August.
Verdecho, M., Alfaro, J. and Rodriguez, R. (2009), “Supplier selection for collaborative new
product development process: an application to the automotive industry”, in
proceedings of the International Symposium on the Analytic Hierarchy Process, 2009.
Wade, S. (2007), "The Critical Role of Supplier Networks in Successful Supplier
Relationship Management Strategies" available at:
http://www.ism.ws/files/secure/index.cfm?FileID=60592 (accessed 14 May 2010).
Wang, F., Du, T.C., and Li, E.Y. (2004), “Applying Six Sigma to supplier development”,
Total Quality Management, Vol.5 No. 9-10, pp. 1217-1229.
Weber, C., Current, J., and Benton, W. (1991), “Vendor selection criteria and methods”,
European Journal of Operational Research, Vol. 50 No. 1, pp. 2-18.
Wu, C. and Barnes, D. (2009), “A Model for Continuous Improvement in Supplier Selection
in Agile Supply Chains”, Knowledge and Process Management, Vol. 16 No.3, pp. 85-
110.
References
75
Wu, J., Liu, G. and Xi, C. (2008), “The Study on Agile Supply Chain-based Supplier
Selection and Evaluation”, in proceedings of 2008 International Symposium on
Information Science and Engineering, pp. 281-282.
Xiao Xia, L.X., Ma, B., and Lim, R. (2008), “Supplier Performance Measurement in a Supply
Chain”, in proceedings of 2008 6th IEEE International Conference on Industrial
Informatics, pp. 877-881.
Yelvington, L. (2002), "Supplier Relationship Management" in proceedings of ISM Annual
Conference, 6 December, available at:
http://www.ism.ws/education/PastConfDetail.cfm?ItemNumber=6506 (accessed 14
May 2010).
Yin, R. K. (2003), “Introduction”, in Robinson, S. (Ed.), Case Study Research Design and
Methods, Sage Publications, Thousand Oaks, CA. pp. 1-15.
Zeng, S., Cohen, M. A., Steele, B. J. and Sairamesh, J. (2008), “A Supplier Performance
Evaluation Solution for Proactive Supplier Quality Management” in proceedings of
2008 IEEE International Conference on e-Business Engineering, pp. 367-373.
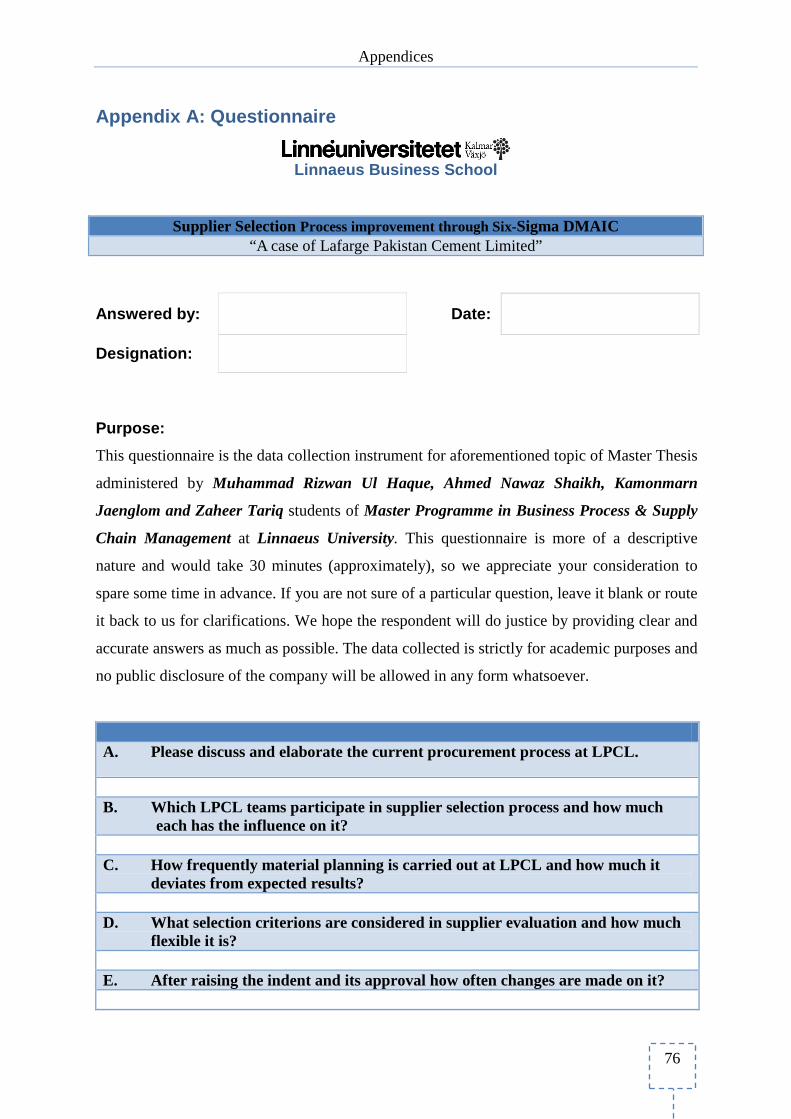
Appendices
76
Appendix A: Questionnaire
Linnaeus Business School
Supplier Selection Process improvement through Six-Sigma DMAIC “A case of Lafarge Pakistan Cement Limited”
Answered by: Date:
Designation:
Purpose:
This questionnaire is the data collection instrument for aforementioned topic of Master Thesis
administered by Muhammad Rizwan Ul Haque, Ahmed Nawaz Shaikh, Kamonmarn
Jaenglom and Zaheer Tariq students of Master Programme in Business Process & Supply
Chain Management at Linnaeus University. This questionnaire is more of a descriptive
nature and would take 30 minutes (approximately), so we appreciate your consideration to
spare some time in advance. If you are not sure of a particular question, leave it blank or route
it back to us for clarifications. We hope the respondent will do justice by providing clear and
accurate answers as much as possible. The data collected is strictly for academic purposes and
no public disclosure of the company will be allowed in any form whatsoever.
A. Please discuss and elaborate the current procurement process at LPCL.
B. Which LPCL teams participate in supplier selection process and how much
each has the influence on it? C. How frequently material planning is carried out at LPCL and how much it
deviates from expected results? D. What selection criterions are considered in supplier evaluation and how much
flexible it is? E. After raising the indent and its approval how often changes are made on it?
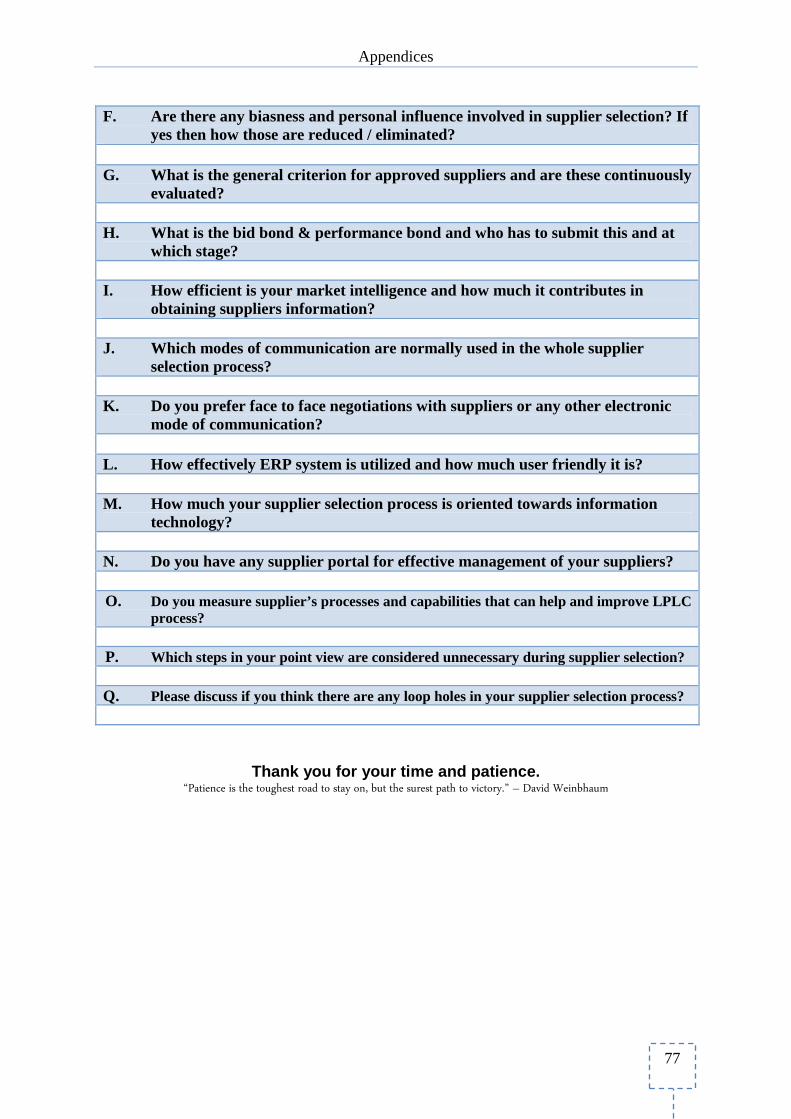
Appendices
77
F. Are there any biasness and personal influence involved in supplier selection? If yes then how those are reduced / eliminated?
G. What is the general criterion for approved suppliers and are these continuously
evaluated? H. What is the bid bond & performance bond and who has to submit this and at
which stage? I. How efficient is your market intelligence and how much it contributes in
obtaining suppliers information? J. Which modes of communication are normally used in the whole supplier
selection process? K. Do you prefer face to face negotiations with suppliers or any other electronic
mode of communication? L. How effectively ERP system is utilized and how much user friendly it is? M. How much your supplier selection process is oriented towards information
technology? N. Do you have any supplier portal for effective management of your suppliers? O. Do you measure supplier’s processes and capabilities that can help and improve LPLC
process? P. Which steps in your point view are considered unnecessary during supplier selection? Q. Please discuss if you think there are any loop holes in your supplier selection process?
Thank you for your time and patience. “Patience is the toughest road to stay on, but the surest path to victory.” – David Weinbhaum
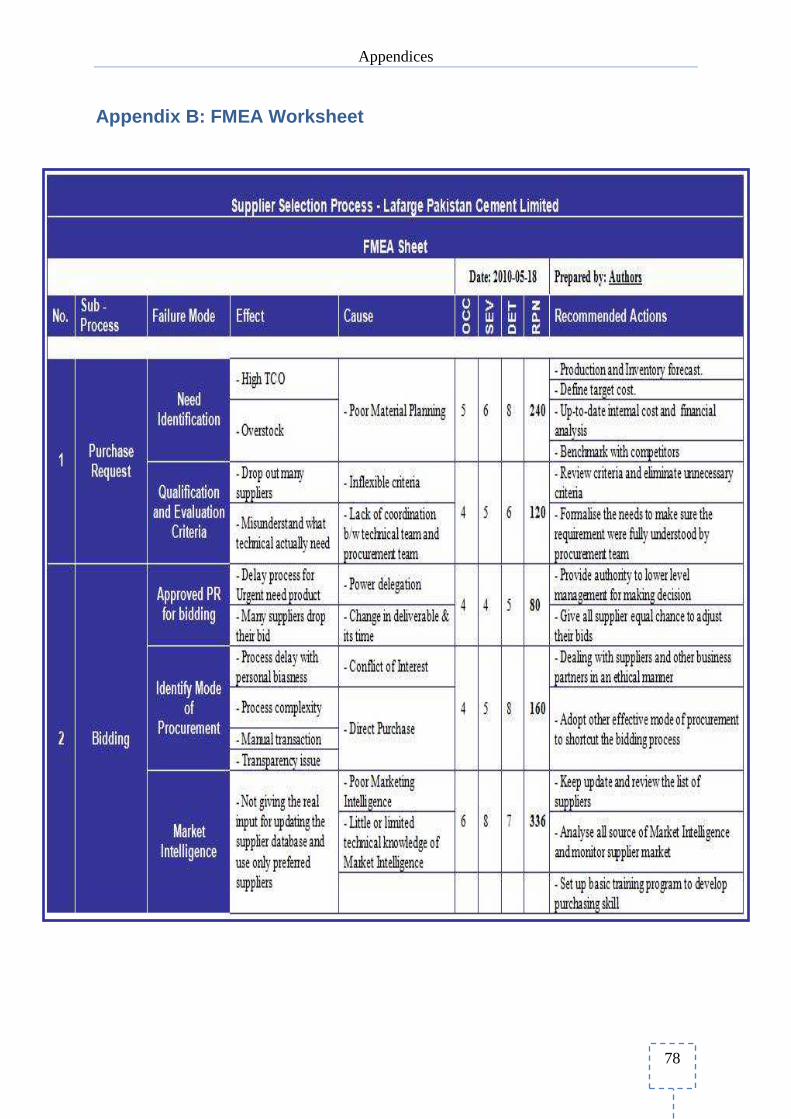
Appendices
78
Appendix B: FMEA Worksheet
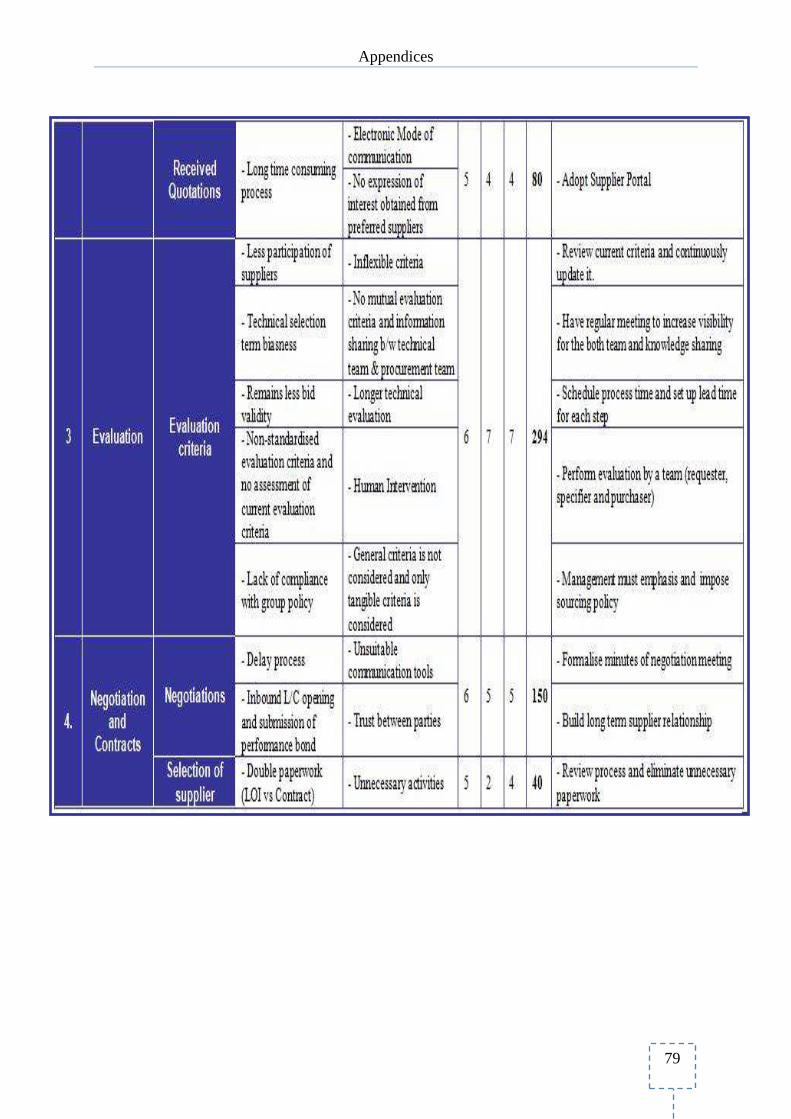
Appendices
79
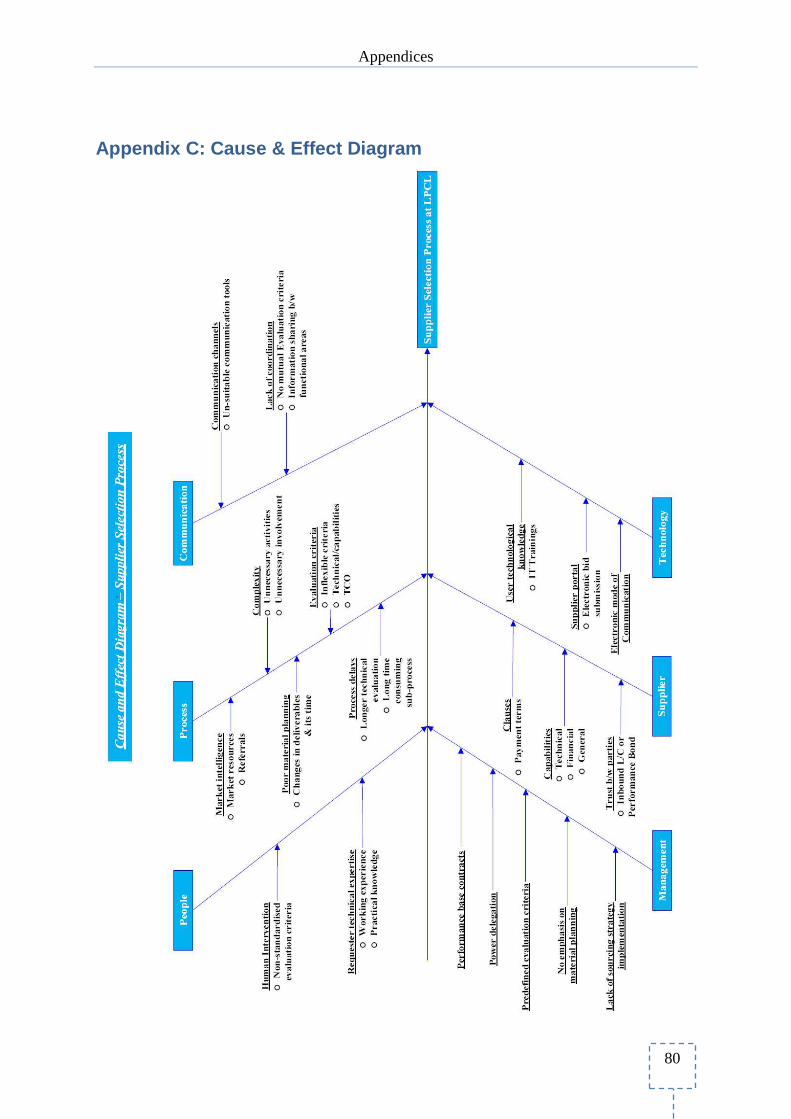
Appendices
80
Appendix C: Cause & Effect Diagram
Related Documents