SUPPLIER RELATIONSHIP MANAGEMENT AND OPERATIONAL PERFORMANCE OF SUGAR MANUFACTURING FIRMS IN KAKAMEGA COUNTY, KENYA BY WAMBANI WILSON AMUTABI A RESEARCH PROJECT PRESENTED TO THE SCHOOL OF BUSINESS IN PARTIAL FULFILLMENT OF THE REQUIREMENTS FOR THE AWARD OF THE DEGREE OF MASTER OF BUSINESS ADMINISTRATION OF THE UNIVERSITY OF NAIROBI NOVEMBER, 2017

Welcome message from author
This document is posted to help you gain knowledge. Please leave a comment to let me know what you think about it! Share it to your friends and learn new things together.
Transcript
SUPPLIER RELATIONSHIP MANAGEMENT AND OPERATIONAL
PERFORMANCE OF SUGAR MANUFACTURING FIRMS
IN KAKAMEGA COUNTY, KENYA
BY
WAMBANI WILSON AMUTABI
A RESEARCH PROJECT PRESENTED TO THE SCHOOL OF BUSINESS
IN PARTIAL FULFILLMENT OF THE REQUIREMENTS
FOR THE AWARD OF THE DEGREE OF MASTER OF BUSINESS
ADMINISTRATION OF THE UNIVERSITY OF NAIROBI
NOVEMBER, 2017
ii
DECLARATION
I declare that this research project is my own original work and does not contain any material
previously submitted for a Degree or Diploma in any university. It does not include any material
published or written by any other person or group apart from legitimate, where legitimate
reference is made as is in accordance with copy right laws and stipulations.
……………………………………….. ………………………………..
WAMBANI WILSON AMUTABI DATE
D61/83870/2016
Declaration by the University Supervisor;
This research project has been presented for examination with my approval as the university
supervisor.
……………………………………….. ………………………………..
MR. ONDIEK GERALD OCHIENG DATE
Lecturer, Department of Management Science,
School of Business - University of Nairobi.
iii
ACKNOWLEDGEMENT
I express my sincere thanks and appreciation to the University of Nairobi for having given me an
opportunity to study a course in Procurement and Supply Chain Management.
I wish to register my gratitude and appreciation to the entire School of Business for their
guidance, prior preparation and facilitating of this project. I also thank my project supervisor and
lecturer Mr. Ondiek Gerald Ochieng and Mr. Chirchir K. Michael my moderator for sacrificing
their time to guide me on how to partake the project.
Extension of gratitude goes to Grace Nyamori for her positive participation, co-operation and
financial support to make sure I achieve my objectives.

iv
DEDICATION
This research work is dedicated to all Master of Business Administration (Procurement and
Supply Chain Management option) students of the academic year 2016/2017 with gratitude and
affection.
v
ABSTRACT
Sugar firms are a major employer and a revenue earner in Kenya. Sugar manufacturing firms in Kakamega County, Kenya have continuously experienced acute shortage of suppliers for key products and services. This has currently resulted in the sugar manufacturing firms to face a
major crisis posed by high cost of production, capacity limit underutilization, absence of factory maintenance and poor transport framework. Sugar manufacturing firms in Kakamega County
have not been able to reap the benefits of their engagement despite having a contractual relationship with their suppliers. This has made them suffer from losses brought about by high litigation costs as a result of delays in supplier payment and failure to meet the buyer‟s
conditions at stipulated time. Critical review of studies revealed to the best of the researcher‟s knowledge that there is no single study which had examined the link between Supplier
Relationship Management in terms of supplier appraisal, supplier development, supplier involvement and information sharing on operational performance. This study thus aimed to fill the evident research gap by exploring how Supplier Relationship Management affects the
operational performance of sugar manufacturing firms in Kakamega County. The study specific objectives were: to find out the effect of supplier appraisal; supplier development; supplier
involvement; and information sharing on the operational performance of sugar manufacturing firms in Kakamega County. The researcher employed descriptive cross sectional survey research design. The population of the study consisted of three sugar manufacturing firms in Kakamega
County which included Mumias, West Kenya and Butali Sugar Companies. Primary data was gathered through use of quantitative approach. Both questionnaires and interview schedules were
utilized to gather primary information from various managers in the sugar manufacturing firms. The Pearson Product Moment Correlation Coefficient was used to estimate the influence of Supplier Relationship Management constructs, that is; supplier appraisal, supplier development,
supplier involvement and information sharing on operational performance of sugar manufacturing firms in Kakamega County. The study determined that Supplier Relationship
Management practices are embraced in the sugar manufacturing firms in Kakamega County. The study also found out that there is a higher positive and significant relationship between operational performance and; information sharing (r=0.696) followed by supplier development
(r=0.623) and supplier involvement (r=0.507) all at 0.01 level of significance. The study however, established that there is a weak positive and significant relationship between supplier
appraisal and operational performance (r=0.400) at 0.05 level of significance. The study thus concluded that information sharing leads to a higher operational performance as compared to supplier development, supplier involvement and supplier appraisal. Based on the study findings
and conclusion, the study recommends that sugar manufacturing firms in Kakamega County should invest much of their resources, that is, human, physical and financial in facilitating
information sharing between the firm and suppliers in order to realize a very high improvement in the operational performance of the firms. Some of the mechanisms that can be strengthened include and not limited to: continuous information sharing between the company and suppliers;
timely dissemination of data between the company and suppliers using networking; availing of personal communication between the company and suppliers; availing of suppliers‟ database;
and allowing suppliers access to company‟s critical information.
vi
TABLE OF CONTENTS
DECLARATION............................................................................................................................ ii
ACKNOWLEDGEMENT............................................................................................................ iii
DEDICATION............................................................................................................................... iv
ABSTRACT ....................................................................................................................................v
TABLE OF CONTENTS ............................................................................................................. vi
LIST OF TABLES .........................................................................................................................x
LIST OF FIGURES ...................................................................................................................... xi
ABBREVIATIONS AND ACRONYMS .................................................................................... xii
CHAPTER ONE: INTRODUCTION ......................................................................................... 1
1.1 Background of the Study .......................................................................................................... 1
1.1.1 Supplier Relationship Management .............................................................................. 3
1.1.2 Operational Performance .............................................................................................. 4
1.1.3 Sugar Manufacturing Firms in Kakamega County ....................................................... 4
1.2 Research Problem ..................................................................................................................... 6
1.3 Research Objectives .................................................................................................................. 8
1.3.1 General Objective ......................................................................................................... 8
1.3.2 Specific Objectives ....................................................................................................... 8
1.4 Value of the Study..................................................................................................................... 8
vii
CHAPTER TWO: LITERATURE REVIEW .......................................................................... 10
2.1 Introduction ............................................................................................................................. 10
2.2 Theoretical Framework ........................................................................................................... 10
2.2.1 Social Exchange Theory ............................................................................................. 10
2.2.2 Transaction Cost Economics Theory .......................................................................... 11
2.2.3 Value Chain Theory .................................................................................................... 11
2.3 Supplier Relationship Management ........................................................................................ 12
2.3.1 Supplier Appraisal ...................................................................................................... 12
2.3.2 Supplier Development ................................................................................................ 13
2.3.3 Supplier Involvement .................................................................................................. 13
2.3.4 Information Sharing .................................................................................................... 14
2.4 Operational Performance ........................................................................................................ 15
2.4.1 Level of Efficiency...................................................................................................... 15
2.4.2 Timeline in Service Delivery ...................................................................................... 16
2.4.3 Cost Reduction ............................................................................................................ 16
2.4.4 Quality Products.......................................................................................................... 16
2.5 Relationship between Supplier Relationship Management and Operational Performance .... 16
2.6 Summary of Knowledge Gaps ................................................................................................ 17
viii
CHAPTER THREE: RESEARCH METHODOLOGY ......................................................... 19
3.1 Introduction ............................................................................................................................. 19
3.2 Research Design...................................................................................................................... 19
3.3 Population of the Study........................................................................................................... 19
3.4 Sample and Sample Design .................................................................................................... 19
3.5 Data Collection ....................................................................................................................... 20
3.6 Data Analysis .......................................................................................................................... 21
CHAPTER FOUR: DATA ANALYSIS, RESULTS AND DISCUSSION ............................ 22
4.1 Introduction ............................................................................................................................. 22
4.2 Response Rate ......................................................................................................................... 22
4.3 Extent to which Sugar Manufacturing Firms have embraced Supplier Relationship
Management techniques................................................................................................................ 23
4.3.1 Supplier Appraisal ...................................................................................................... 23
4.3.2 Supplier Development ................................................................................................ 24
4.3.3 Supplier Involvement .................................................................................................. 25
4.3.4 Information Sharing .................................................................................................... 26
4.3.4 Operational Performance and Supplier Relationship Management ............................ 27
4.4 Relationship between Supplier Relationship Management and Operational Performance .... 28
4.4.1 Correlation Results...................................................................................................... 28
4.4.2 Regression Results ...................................................................................................... 29
ix
CHAPTER FIVE: SUMMARY OF FINDINGS, CONCLUSION AND
RECOMMENDATIONS ............................................................................................................ 33
5.1 Introduction ............................................................................................................................. 33
5.2 Summary of the Findings ........................................................................................................ 33
5.3 Conclusion .............................................................................................................................. 33
5.4 Recommendations ................................................................................................................... 34
5.5 Limitations of the Study.......................................................................................................... 34
5.6 Suggestions for Further Research ........................................................................................... 35
REFERENCES ............................................................................................................................ 36
APPENDICES ............................................................................................................................. 41
Appendix I: Questionnaire........................................................................................................... 41
Appendix II: Interview Schedule for Top Management Staff..................................................... 44
x
LIST OF TABLES
Table 3.1: Target Population………………………………………………………………. 19
Table 3.2: Sampling Frame………………………………………………………………... 20
Table 4.1: Table showing the extent to which Sugar Manufacturing firms have embraced
Supplier Appraisal…………………………………………………………………………. 23
Table 4.2: Table showing the extent to which Sugar Manufacturing firms have embraced
Supplier Development……………………………………………………………………... 24
Table 4.3: Table showing the extent to which Sugar Manufacturing firms have embraced
Supplier Involvement……………………………………………………………………… 25
Table 4.4: Table showing the extent to which Sugar Manufacturing firms have embraced
Information Sharing ……………………………………………………………………….. 26
Table 4.5: Table showing Operational Performance and Supplier Relationship Management
effects ………………………………………………………………………………………27
Table 4.6: Table showing SRM and Operational Performance of Sugar Manufacturing
Firms in Kakamega County Correlation Results ………………………………………….. 28
Table 4.7: Table showing Model Summary………………………………………………. 30
Table 4.8: Table showing ANOVA Results ……………………………………………… 30
Table 4.9: Table showing Coefficient Results …………………………………………… 31

xi
LIST OF FIGURES
Figure 4.1: Response Rate………………………………………………………………………22
xii
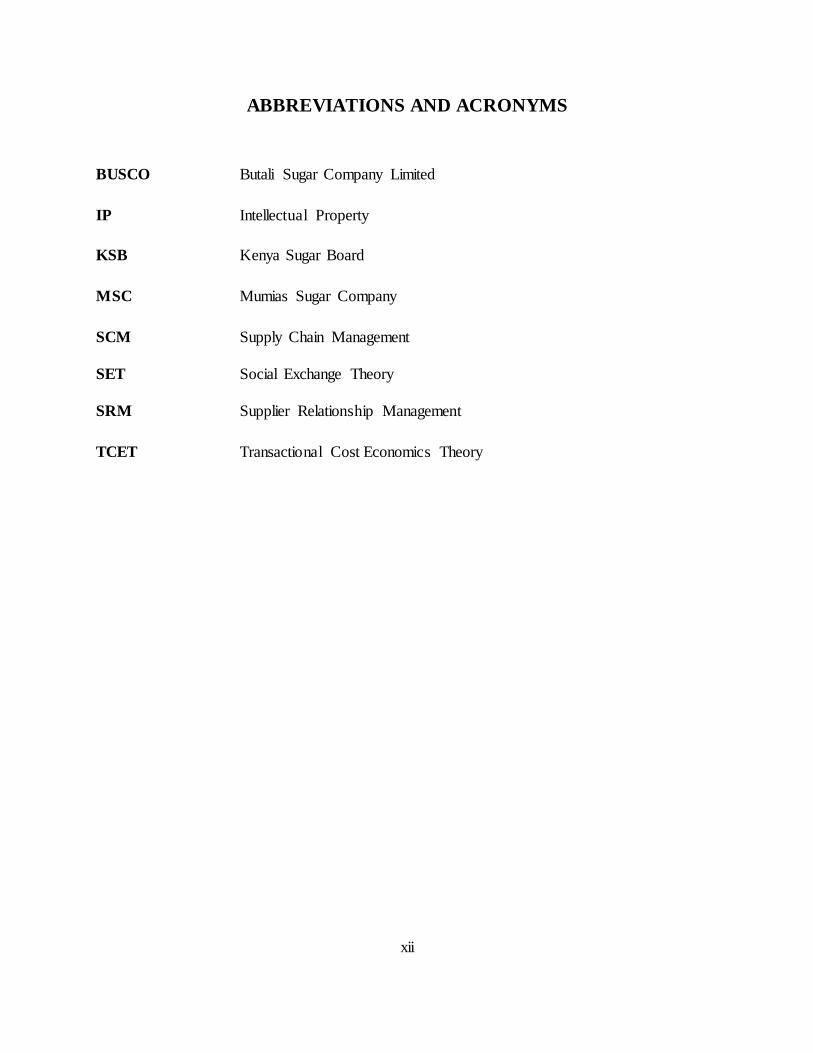
ABBREVIATIONS AND ACRONYMS
BUSCO Butali Sugar Company Limited
IP Intellectual Property
KSB Kenya Sugar Board
MSC Mumias Sugar Company
SCM Supply Chain Management
SET Social Exchange Theory
SRM Supplier Relationship Management
TCET Transactional Cost Economics Theory
1
CHAPTER ONE: INTRODUCTION
1.1 Background of the Study
Due to a lot of competition in the global world, firms have put more emphasis in not only
on customer management but also in supplier management as a strategic direction
towards building a competitive advantage for themselves. Effective and efficient Supplier
Relationship Management (SRM) not only improves organization cash flow, it also
generates the best satisfaction in building and strengthening supply chain relationship.
Creating and maintaining good and sustainable Supplier Relationship Management is one
of the philosophies of ensuring compliance with essential features such as partnership,
proper risk management, respect, growth and development and developing new
capabilities (Donoghue, 2011). McCutcheon and Stuart (2000) express that SRM is the
exact, undertaking wide evaluation of suppliers‟ abilities and assets concerning general
business technique, affirmation of what activities to partake in with different suppliers,
organizing and execution of all coordinated efforts with product or service suppliers in an
arranged way over the relationship life cycle keeping in mind the end objective is to
increase the regard recognized through those collaborations. Operational performance in
this setting is a measure of how proficient and compelling Supplier Relationship
Management outcomes help in accomplishing hierarchical targets and objectives (Lawer,
2001). Operational performance can be conceptualized as far as purchaser‟s lessening in
acquiring cost, supplier‟s operational and key execution and dynamic quality execution,
advancement and budgetary execution. In a supply chain, relationship connections are not
just utilized for associating the firm with suppliers but are also used to interface the
association all through the inventory network of the supply chain (Sanders, 2005).
The research was underpinned by three main theories namely; Social Exchange Theory
(SET), Transaction Cost Economics Theory (TCET) and Value Chain Theory. Social
Exchange Theory studies the authoritative cooperation from social structure point of view
as opposed to the transaction exchange relationship (Homans, 1958). SET proposes that
any social associations evaluated utilizing money saving advantage examination and the
2
appraisal of options; hence, this implies parties will keep on being in a relationship as
long as there is incorporated regard (Cropanzano and Mitchell, 2005). Christopher (2009)
points out that Transaction Cost Economics Theory explains how a collaborative
relationship is important for business partners because it shields them from harmful
subsidiary as opposed to differing collaborative relationship, this implies that sugar
manufacturing firms will be able to save on the cost of doing business. Value Chain
Theory postulates that creation of competitive advantage in an organization is through
effective management of activities along the value chain to provide quality services and
products to customers (Porter, 1985). This theory in the study context means that well
managed supplier relationship practices of appraisal, development, involvement and
information sharing results in superior operational performance as a result of better
services to customers, quality products, low cost of production and firms overall
effectiveness and efficiency.
Inability of the sugar companies to reap the benefits of Supplier Relationship
Management may therefore be one of factors contributing to poor operational
performance of the sugar manufacturing firms in Kakamega County. This is attributed to
poor networking of personnel and activities required to facilitate the organizing,
scheduling and deploying of resources compared to other efficiently organized, planned,
directed and controlled Supplier Relationship Management systems (Baily et al., 2008).
In Kakamega County, a region whose sixty percent of industrialization lies on the sugar
manufacturing firms also absolutely feels the impact of supplier relationships activities
since it has critical consequences on the performance of all the sugar manufacturing firms
in the region. This study therefore aimed at filling this knowledge gap by investigating
the relationship between Supplier Relationship Management and operational performance
of sugar manufacturing firms in Kakamega County, Kenya.
3
1.1.1 Supplier Relationship Management
Supplier Relationship Management is a comprehensive approach of taking care of a
firm‟s association with its products and service providers (Harland, Knight, Lamming &
Walker, 2005). SRM is one of the obtainment methodology adapted towards outlining
operational, supplier management and vital acquisition forms. Organizations and
suppliers‟ business practices collectively come in a working relationship through Supplier
Relationship Management. SRM is along these lines an approach of thoroughly dealing
with a firm‟s interactions with the providers that render any service and items and it uses.
Organizations that need to be successful should adopt Supplier Relationship Management
in terms of supplier appraisal, supplier development, supplier involvement and
information sharing to manage supplier relations. Cannon and Homburg (2001) indicate
that in supplier appraisal, a prospective vendor applies to be placed on the buyer‟s
approval list then the buyer evaluates the supplier capabilities. Supplier development is
whereby two entities jointly plan and outline the long term initiatives such as forming
joint ventures and penetrating the market or strategic alliances (Lysons and Farrington,
2006).
Supplier involvement is the extent to which a supplier can jointly work with its customer
(Feng and Wang, 2013). There is a positive correlation between supplier involvement on
performance and quality improvement in many companies across various industries.
Information sharing is the frequent updating of data among the chain individuals for
powerful Supply Chain Management (SCM). In this unusual and dynamic world, a
business‟s life expectancy relies upon its capacity to get the right information at the ideal
time. Supplier Relationship Management plays a critical role in an organization‟s
performance because suppliers determine the price, quality, delivery, reliability and
accessibility of its products and services.
4
1.1.2 Operational Performance
An organization is a social entity that is made up of two or more parties in order to
achieve its objectives. Operational performance is thus a measure of how well an
organization achieves its desired objectives. Johnston et al., (2004) demonstrates
performance as financial and non-financial gains such as: improvement in profit margin,
return on investment, growth in sales, lead time performance, growth in market shares,
customer loyalty, improved responsiveness, innovation, quality products, improvements
in process/product design, reduction in inventory and overall competitive position.
Operational performance is thus a non-financial indicator of performance which in a
manufacturing set up is an organization‟s execution measured against recommended
pointers of natural obligation, proficiency and adequacy, for example, process duration,
efficiency, squander lessening and administrative consistence (Inayatullah, Narain and
Singh, 2012).
As far as Supplier Relationship Management is concerned, performance indicators can be
in terms of delivery performance, cycle time and new product development time,
flexibility, customer satisfaction and product availability. A potential supplier alliance
leads to improvements in access to technology, reductions in transaction costs and
technology transfer. This study adopted operational performance indicators in terms of
level of efficiency, timeline in service delivery, cost reduction and quality products.
1.1.3 Sugar Manufacturing Firms in Kakamega County
Kenya Sugar Industry Strategic Plan 2010 - 2014 outlines four main reasons why sugar
companies were initially instituted by the Kenyan government. The sugar sub-segment
holds a huge position in Kenya‟s Agrarian Sector; to begin with, the government wanted
to achieve independence in sugar and its by-products such as animal feeds, industrial
sugar and alcohol. Sugar is a major food and pharmaceutical additive and sweetener
besides being a source of nutritive energy. Stick tops and molasses are vital dietary
supplements for domesticated animals. Sugar and molasses are crude materials for the
produce of sweet shops, pharmaceuticals, liquor and different refreshments. The second
reason was for making of employment opportunities to the nation subjects.
5
The sugar business underpins more than six million Kenyans and is a noteworthy
wellspring of wage for more than 250,000 little scale agriculturists who represent more
than 85% of stick supply. Thirdly, the government needed to prevent rural urban
migration by improving the socio-economic welfare of the rural population. The business
straightforwardly and in a roundabout way utilizes more than 40,000 Kenyans in this
manner checking the country‟s urban movement and advances rustic improvement
through direct cooperation of the provincial families in sugar handling ranges. Lastly,
saving the foreign exchange cost by the government through import substitution (KSB,
2013).
According to Kenya Sugar Board, the sugar industry in Kenya contributes greatly to
economic and social development of the country by revenue generation to the
government through taxation. This has led to the growth of agricultural Gross Domestic
Product (GDP). The industry has also lead to urbanization through the growth of towns
near sugar companies (KSB, 2013). Sugar companies in Kakamega County have
experienced some challenges, for instance, there has been concerns by major suppliers in
the sugar companies concerning delays in payment, poor farmers‟ relationship and sugar
cane poaching by sugar companies located outside Kakamega County (Ooko, et al.,
2016).
This study concentrated on sugar manufacturing firms in Kakamega County. Kakamega
County borders the following Counties: Busia County and Bungoma County on the West,
Uasin Gishu County and Nandi County on the East, Trans Nzoia County on the North
and Vihiga County on the South. The County experiences tropical climate with variations
due to altitude that is conducive for growing of sugar cane. The County has three major
sugar manufacturing firms namely: Mumias Sugar Company Limited (MSC), West
Kenya Sugar Company Limited and Butali Sugar Company Limited (BUSCO). The
government of Kenya has some shares in Mumias Sugar Company while the other two
companies are privately owned (KSB, 2013).
MSC is situated approximately 30 kilometers (kms) from Kakamega town in Mumias
East Sub County (www.mumias-sugar.com). The West Kenya Sugar Company Limited is
6
approximately 14 kms from Kakamega town on Kakamega-Webuye road
(www.businesslist.co.ke) while BUSCO is located at Butali area, in Kakamega County
and is about 35 kms from Kakamega town (minigrp.com). All the three sugar companies
are on the outskirt of Kakamega town peripheral (KSB, 2013).
1.2 Research Problem
The rationale behind Supplier Relationship Management is that its goal is to streamline
and make more powerful the processes between a venture and its product and service
providers (Kosgei & Gitau, 2016). Supplier Relationship Management which has gained
relevance in the recent past has been fueled by the need to grow a better relationship with
suppliers for better operational performance through reduction of procurement costs and
delivering quality and reliable products and services.
Sugar firms are a major employer and a revenue earner in Kenya (KSB, 2013). Sugar
manufacturing firms in Kakamega County, Kenya have continuously experienced acute
shortage of suppliers for key products and services. This has currently resulted in the
sugar manufacturing firms to face a major crisis posed by high cost of production,
capacity limit underutilization, absence of factory maintenance and poor transport
framework (Kegode, 2005). These difficulties have prompted low employees‟ efficiency
as few out grower farmers are joining the companies, a low number of tonnes squashed
every month, consistent clients‟ objections concerning poor service delivery conveyance
and wastage of generation time prompting low organization execution (Rapando, 2011).
Sugar manufacturing firms in Kakamega County have not been able to reap the benefits
of their engagement despite having a contractual relationship with their suppliers. This
has made them suffer from losses brought about by high litigation costs as a result of
delays in supplier payment and failure to meet the buyer‟s conditions at stipulated time.
This scenario has made the sugar companies to concentrate in areas which are non-core to
their operations (Maraka, Kibet and Iravo, 2015).
Globally, Supplier Relationship Management and organizational performance has also
been studied. Liker and Choi (2004) studied how car makers; Honda and Toyota
portrayed supplier relationship and discovered that the organizations build up their
7
provider connections which prompt common advantages for both the provider and client.
Park et al., (2010) study of supplier management on Korean semiconductor
manufacturing company found out that customary value-based system makes firms to
achieve better performance.
Locally, Kamau (2013) in his study of key supplier management relationship models
deduced that communication, trust, commitment, mutual goals and cooperation are key
enter fixings in an effective relationship which thusly influence organization performance
positively. Suppliers who failed to preserve proper records had increased costs in
procurement and long cycle times. This can result to poor organization performance due
to enterprises failing to maintain good relationships with their suppliers. Tangus et al.,
(2015) examined the effect of Supplier Relationship Management practices on
performance of manufacturing firms in Kisumu County, Kenya while Wachira (2013)
study discovered that communication, trust, chance evaluation and administration and
strategic supplier association were the basic relationship features resulting in an improved
organizational performance. The mentioned studies were limited in scope of the variables
used to operationalize Supplier Relationship Management that this study sought to
bridge.
A number of studies have been conducted in sugar companies in Kakamega County. For
example, previous studies done by Ooko, Manyasi and Ondiek (2016) and Rapando
(2011) found out that sugar manufacturing firms in Kakamega County are in brink of
collapse hence this calls for urgent measures to address the situation. A more recent study
conducted in sugar companies is by Maraka, Kibet and Iravo (2015) on Supplier
Relationship Management on organization performance in selected sugar companies in
Western Kenya. Critical review of the studies above revealed to the best of the
researcher‟s knowledge that there is no single study which had examined the link
between Supplier Relationship Management in terms of supplier appraisal, supplier
development, supplier involvement and information sharing on operational performance.
This study thus sought to fill the evident research gap by investigating how Supplier
8
Relationship Management affects the operational performance of sugar manufacturing
firms in Kakamega County.
The following research questions were answered by the study: Is there any relationship
between Supplier Relationship Management and sugar manufacturing firms‟ operational
performance in Kakamega County? What are some of the benefits in terms of operational
performance from utilizing Supplier Relationship Management?
1.3 Research Objectives
1.3.1 General Objective
This study aimed to investigate the relationship between Supplier Relationship
Management and operational performance of sugar manufacturing firms in Kakamega
County.
1.3.2 Specific Objectives
Specifically, the study sought to achieve the following objectives:
i. To find out the effect of supplier appraisal on the operational performance of
sugar manufacturing firms in Kakamega County.
ii. To assess the impact of supplier development on the operational performance
of sugar manufacturing firms in Kakamega County.
iii. To establish how supplier involvement impacts operational performance of
sugar manufacturing firms in Kakamega County.
iv. To investigate the effects of information sharing on the operational
performance of sugar manufacturing firms in Kakamega County.
1.4 Value of the Study
The study will add to the existing body of literature on Supplier Relationship
Management. Other scholars, researchers and academicians may validate the empirical
findings of the study and use it as a reference material. They may also carry out research
on the recommended area of further study.
9
The study will be useful to the national, county governments and other organizations
together with their policy-making agencies as they will optimize operational performance
by developing policy guidelines on Supplier Relationship Management as stipulated by
the study.
Finally, sugar manufacturing firms especially in Kakamega County will use the study
findings and recommendations to better their operational performance as a result of
adopting Supplier Relationship Management.
10
CHAPTER TWO: LITERATURE REVIEW
2.1 Introduction
This chapter reviewed selected conceptual and empirical literature on the key study
variables with an aim of highlighting the existing research gaps. The chapter specifically
examined the literature on the rationale of Supplier Relationship Management and
operational performance. It also covered the relationship between Supplier Relationship
Management and operational performance of the sugar manufacturing firms in Kakamega
County, Kenya. This chapter ended by discussing the summary of knowledge gaps that
the study aimed to fill.
2.2 Theoretical Framework
The research was guided by three main theories which are: Social Exchange Theory,
Transaction Cost Economics Theory as well as Value Chain Theory.
2.2.1 Social Exchange Theory
Social Exchange Theory (SET) as advanced by Homans (1958) focuses on the social
structure association as opposed to transactional based on cost-benefit examination.
Cropanzano & Mitchell (2005) point out that the relationship between the various actors
will only thrive if and only if it is beneficial to both the parties. Homans (1958) affirms
that the main aim of SET is to establish the associations between inter-organizational
based on social structures as opposed to transactional benefits. SET is applicable in
choosing strategies for suppliers. SET helps in choosing a preferred supplier who is not
merely a regular or an exit supplier thus guarantying regular supply of products and
services to the organization. This means that the theory was appropriate for this study in
that it will aid sugar manufacturing firms in Kakamega County in obtaining constant
supply of raw materials from their loyal suppliers as a result of good supplier-buyer
relationship thereby resulting to improved operational performance.
11
2.2.2 Transaction Cost Economics Theory
The theory helps business partners make informed decisions of whether to outsource or
not. The decisions are based on make-or-buy decisions (Christopher, 2009). Fink et al.,
(2006) showed that uncertainties caused by external environment and cost are the primary
drivers of the theory. Sugar companies in Kenya thus face a lot of uncertainties
necessitating the need of applying this theory to shield them from extra supplier costs.
The study utilized this theory because it will aid the companies to acquire dependable
suppliers who will ensure that sugar manufacturing firms in Kakamega County get
constant supply of raw materials and services needed for production process. This would
eliminate extra costs brought about by shortage of raw materials especially sugarcane. In
the long run, the production cost in the sugar companies would be reduced resulting to
improved operational performance.
2.2.3 Value Chain Theory
Value chain theory was propagated by Michael Porter in 1985 in his book “Competitive
Advantage: Creating and Sustaining Superior Performance.” Porter describes value chain
as an arrangement of exercises that an organization carries out to create value for its
customers thus making it have a competitive position. In applying this theory, the study
evaluated Supplier Relationship Management practices of supplier appraisal, supplier
development, supplier involvement and information sharing and related it to operational
performance in terms of level of efficiency, timeline in service delivery, cost reduction
and quality products. According to Porter, survival of the sugar manufacturing firms is
based on how well they will manage the supplier relationship elements for superior
operational performance. This theory stresses that for an organization to realize a high
profit margin depends on its abilities to link the various activities in the value chain in
order to deliver quality services and products that customers are willing and able to afford
(Porter, 1985).
12
2.3 Supplier Relationship Management
Herrmann and Hodgson (2001) described Supplier Relationship Management as a
procedure associated with overseeing favored suppliers and finding new potential ones
while diminishing costs, pooling purchaser encounter, separating the advantages of
supplier partnerships and making procurement predictable and repeatable. Various
studies have also examined the different elements of Supplier Relationship Management
like supplier collaboration, supplier integration and supplier performance management.
This study thus concentrated only on supplier appraisal, supplier development, supplier
involvement and information sharing as elements of SRM.
2.3.1 Supplier Appraisal
Supplier appraisal is the process of evaluating and approving potential suppliers using
qualitative or quantitative assessment. SRM is a procedure of measuring and observing
the execution of current suppliers. Supplier appraisal is the evaluation process of finding
out whether a supplier meets buyers‟ requirements reliably after a prospective vendor
applies for placement in the buyers list of pre-qualified suppliers. Saleemi (2007)
proposes eight perspectives of evaluating a potential supplier that includes; production
capacity and facilities, finance, human resource, performance, quality, environmental and
ethical factors, innovation and design and information technology. These criteria are
important because they determine whether the prospective supplier is competent and
capable enough to perform the work within the stipulated schedule time, budget and
required safety and quality standards.
Arsan (2011) noted that desk appraisal using published and unpublished information of
the supplier can be used to appraise supplier products, services and financial ability to
provide the needed products and services. An organization can supplement desk appraisal
with field research especially for high and risky value products for long-term
collaborative relationship. Any organization can also use third party appraisal and
conduct field visits to the supplier sites (Arsan, 2011). Mutual benefits between the
organization and the supplier are only derived if and only if both of them cooperate
actively to provide necessary inputs and support.
13
2.3.2 Supplier Development
Supplier development is a strategy of working with particular providers on a balanced
premise to upgrade their execution and capacities with respect to the upside of the
acquiring affiliation. Supplier development activities are described as the most important
effort that an organization undertakes to develop suppliers for long term partnership and
relationship enhancement and also to gain competitive advantage. According to Wenli et
al., (2012) supplier development is a cooperation that seeks continuous improvement
between a buyer and a supplier for superior performance of an organization geared
towards strengthening the buyer‟s competitive advantage. There are two objectives of
supplier development; to prevent suppliers from making immediate changes in their
operations and to increase their capabilities for improvement.
Previous studies on supplier development have linked it to organization performance in
terms of; cost reduction, quick order fulfillment, customer satisfaction and fast delivery
(Khuram, Ilkka, Elina & Shpend, 2016). Firms with supplier development programs
enjoy global competitive advantage as a result of long-term relationship with its
suppliers. Firms are more industrious in provider change programs not solely to continue
long haul association with their providers but also to grow deliberately overall upper
hand. Supplier participation makes purchasers more effective empowering products to be
bought at bring down costs and furthermore makes a purchaser focused by searching for
his center competency. Supplier development practices are an important component of
SCM which plays a very key role for bringing improvement in buyer-supplier
performance.
2.3.3 Supplier Involvement
Supplier involvement is the extent to which an organization can jointly work with its
suppliers in areas such as; internal processes like product design and development
involving some degree of risks therefore the buying organization must have solid
fundamental relationship with a supplier before implementing supplier involvement
initiatives (Feng and Wang, 2013). Supplier involvement has some inherent limitations in
that it may lead to high dependence on the supplier, especially if the supplier has a
14
market leading status in terms of high technological capabilities meaning that the supplier
can commit to the buyer‟s unique specifications hence the high risk of information
asymmetry (Melander, Rosell and Lakemond 2014). In some cases, the supplier may be
over-empowered limiting the buyer possibility of exercising a joint development effort
control thus the buyer may risk losing his Intellectual Property rights (IP) to the
supplier‟s hand. To avoid the instances of buyers excessive control needs to the supplier
which can suppress supplier‟s freedom and capability to be innovative, both the parties
need to cultivate mutual trust and strike a balance between control and empowerment in
buyer-supplier relationship.
Despite the aforementioned risks, Melander et al., (2014) highlighted some benefits of
supplier involvement which includes; greater responsiveness, shorter lead/cycle times,
reduced costs (in production, development and marketing) and better change control. On
the inter-organizational level, supplier involvement is responsible for creating an
interactive platform for information exchange and knowledge sharing and also
encouraging collaborative problem-solving mindset and conduct among staff. Past studies
have found a positive correlation between supplier involvement on organization
performance and quality improvement in many companies across various industries
especially manufacturing companies. This is because manufacturing companies mostly
rely on their production capacity, advanced and rigorous technologies to sustain their
competitive advantage.
2.3.4 Information Sharing
Kearney (2013) asserts that having the right information on suppliers is imperative to
ascertaining supplier‟s performance. Effective two-way communication is essential to
successful supplier relationship due to its creating of rich knowledge in the supply chain.
Data sharing is basic because of its need in giving the company‟s information to their
store network accomplices all together for “operational connectivity” of an activity to
happen. Firms that are key in their operations need to furnish each other with a scene of
information for example, deals conjectures, stock levels, deals advancement procedures,
showcasing plans, generation runs and criticism to providers from provider assessment in
15
this manner diminishing vulnerability amongst firms and associations and to legitimately
get ready for their own particular shared business needs.
Past studies have linked information sharing in supply chain to organization performance.
Anderson and Weitz (1992) affirm that the sharing of data prompts expanded
responsibility between supply chain accomplices. Data sharing outcomes in item quality
and making less demanding advances while taking part in new item improvement
ventures. Information sharing encourages cooperation and commitment which helps the
buyer and seller adapt to supply chain processes. Data sharing adds to the change in
perceivability between firms, stock administration and generation arranging.
2.4 Operational Performance
Performance of an organization is a primary step that enables it to know its weaknesses
and strengths hence come up with corrective measures. Performance can be measured in
financial or an operational point of view. As per Inayatullah, Narain and Singh (2012)
operational execution of an organization incorporate productivity in the authoritative
procedures measured as far as the cost of exchanges, quality, cost of the stock and
services and time. Other operational indicators of performance are receptiveness and
straightforwardness of the procurement system in terms of fairness of participants as well
as capacity to get and utilize new technologies and capability to react fast to variations in
schedules. This study adopted operational performance indicators in terms of level of
efficiency, timeline in service delivery, cost reduction and quality products.
2.4.1 Level of Efficiency
Most organizations according to MacPherson et al., (2004) view their performance in
terms of „effectiveness‟ in the achievement of its vision, mission, goals and objectives
while some view their performance in terms of „efficiency‟ in deployment of the
organizational resources, that is, human, financial and physical resources. In order for any
organization to be viable and competitive, it needs to use its resources optimally thus
avoiding wastage.
16
2.4.2 Timeline in Service Delivery
Service conveyance is an enveloping action directed at advancing the general welfare of a
group of people in society. Lead time refers to the amount of time that elapses between
when a process starts and when it is completed (Rajaniemi, 2012). In SCM, lead time
refers to the amount of time that passes between a buyer placing an order with the
supplier and receiving their product. One way that an organization can use to improve its
profitability is by reducing inventory lead time.
2.4.3 Cost Reduction
Participation with providers which is a fixing in Supplier Relationship Management can
make a purchaser more effective and along these lines obtaining products at bring down
costs. A study conducted by Khuram, Ilkka, Elina & Shpend (2016) determined that
supplier development leads to an increase in organization performance in terms of cost
reduction, customer satisfaction and faster delivery of products.
2.4.4 Quality Products
Ambe & Badenhorst-Weiss (2012a) remarked that “in the public sector, Supply Chain
Management in organizations is used as an instrument to enhance quality service delivery
to citizens.” This means that an organization with proper Supplier Relationship
Management is better placed to deliver quality products and services to its stakeholders.
Supplier quality requirements should cover four broad areas: quality measurement,
management, facilities, safety and training.
2.5 Relationship between Supplier Relationship Management and
Operational Performance
According to KiIpatrick and Ron (2000) the short-term objective of Supplier Relationship
Management is to decrease stock and process duration and to expand profitability while
its long term destinations are to build benefits for all partners of the store network and the
piece of the overall industry. Off late, purchasing is a vital capacity and a key factor
towards aggressive situating of the firm. Organizations with collaborative business
relationships have an upper hand of responding to the new business environment by
17
focusing on their core businesses and reducing business costs. Supplier Relationship
Management thus plays an essential role in optimization of operational performance in an
organization through the reduction of costs.
Tracking operational performance for continuous improvement is necessary in measuring
and following how well an organization is addressing challenges from all aspects of the
business and their key performance indicators. Baily et al., (2008) explains that an
organization which practices SRM has an improved supply chain performance. Liker and
Choi (2004) noted that a commercial or humanitarian organization that practices Supplier
Relationship Management has increased quality, improved efficiency and high
performance. Organizations which wish to be competitive should build and keep up long
term associations with their central providers by dealing with the supplier execution,
sharing data and utilizing data innovation in SCM. Realization of the Supplier
Relationship Management process is dependent on procurement function skill in
managing expenditure for the organization.
2.6 Summary of Knowledge Gaps
Liker and Choi (2004) study of Supplier Relationship Management and organization
performance described how Japanese car makers, Honda and Toyota are developing their
supplier relationships which prompts common advantages for both the supplier and
customer. Park et al., (2010) conducted a study on Korean semiconductor manufacturing
company and evolved a model for Supplier Relationship Management which integrated
supplier administration functions such as: defining procurement strategies, collaboration,
supplier evaluation and management for continuous improvement in an organization.
These studies were limited in scope because Liker and Choi study used organizational
performance but this study narrowed down to operational performance. Also Parker et
al., study focused on supplier management, collaboration, selection and purchasing
strategies as indicators of supplier management practices but this study adopted Supplier
Relationship Management practices of supplier appraisal, supplier development, supplier
involvement and information sharing.
18
Kamau (2013) concluded that buyer-supplier relationships had assisted the large
manufacturing companies in Nairobi, Kenya to enhance the performance of their
organizations. The study dwelled on organization performance while this study
concentrated on operational performance. The sector of the study was also specific, in
sugar manufacturing industry instead of manufacturing companies in general and also the
study was conducted in Kakamega County and not in Nairobi County. Tangus et al.,
(2015) analyzed the effect of Supplier Relationship Management practices on
performance of manufacturing firms in Kisumu County, Kenya. The study concentrated
on organizational performance but this study handled operational performance. A more
recent study carried on sugar companies is by Maraka, Kibet and Iravo (2015) about
Supplier Relationship Management on organization performance in selected sugar
companies in Western Kenya. Maraka et al., (2015) study was limited in scope of the
variables used to operationalize Supplier Relationship Management that this study sought
to bridge.
Critical review of the studies above revealed to the best of the researcher‟s knowledge
that none examined the link between Supplier Relationship Management in terms of
supplier appraisal, supplier development, supplier involvement and information sharing
on operational performance. This study thus sought to fill the evident research gap by
investigating how Supplier Relationship Management affects the operational performance
of sugar manufacturing firms in Kakamega County, Kenya.
19
CHAPTER THREE: RESEARCH METHODOLOGY
3.1 Introduction
This chapter presents the research methodology that was used in the study. It entails the
research design, population of the study, sample and sample design, data collection
procedures and instruments as well as data analysis and presentation.
3.2 Research Design
The researcher adopted a descriptive cross sectional survey research design to achieve the
objectives of the study. Kothari and Garg (2014) observed that descriptive design is a fact
finding enquiries of different kinds, where the researcher has no control of the variables
under the study and can only report what is happening or what has happened. Descriptive
research design was therefore appropriate for this study because it enabled the researcher
to describe the situation and also establish the relationship if any between the variables.
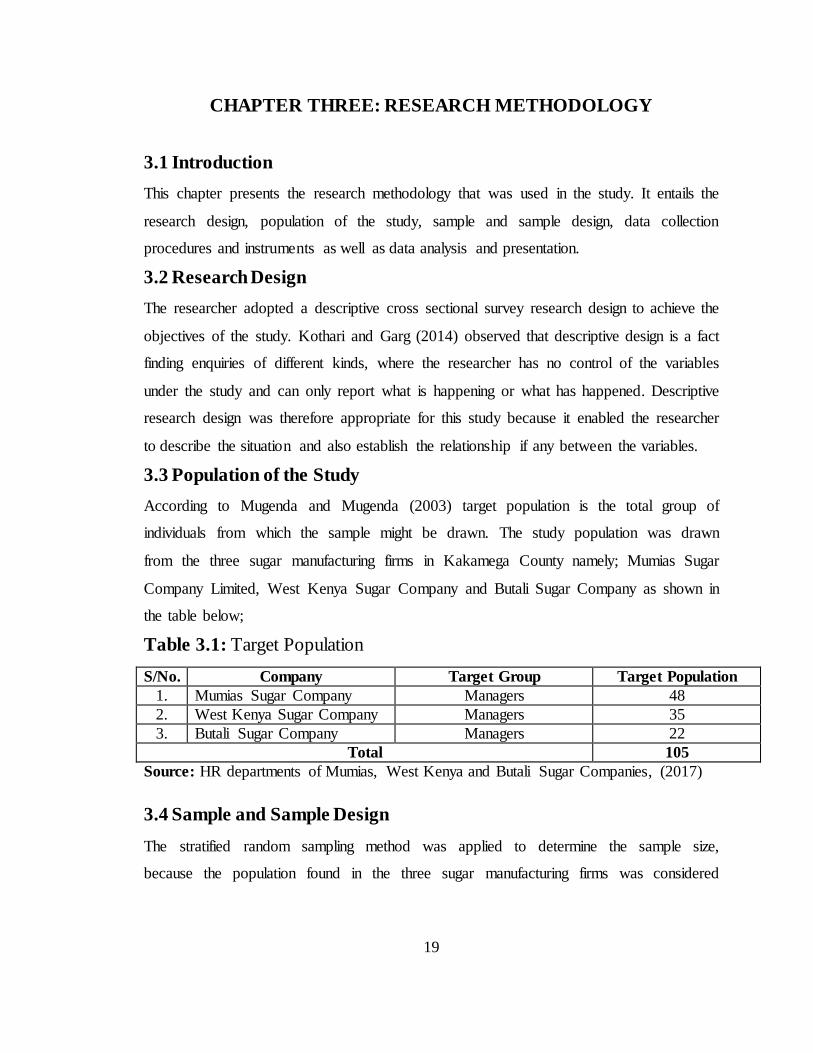
3.3 Population of the Study
According to Mugenda and Mugenda (2003) target population is the total group of
individuals from which the sample might be drawn. The study population was drawn
from the three sugar manufacturing firms in Kakamega County namely; Mumias Sugar
Company Limited, West Kenya Sugar Company and Butali Sugar Company as shown in
the table below;
Table 3.1: Target Population
S/No. Company Target Group Target Population
1. Mumias Sugar Company Managers 48
2. West Kenya Sugar Company Managers 35
3. Butali Sugar Company Managers 22
Total 105
Source: HR departments of Mumias, West Kenya and Butali Sugar Companies, (2017)
3.4 Sample and Sample Design
The stratified random sampling method was applied to determine the sample size,
because the population found in the three sugar manufacturing firms was considered
20
heterogeneous. This, as Cooper and Schindler (2003) explain, ensures that each firm is
properly represented.
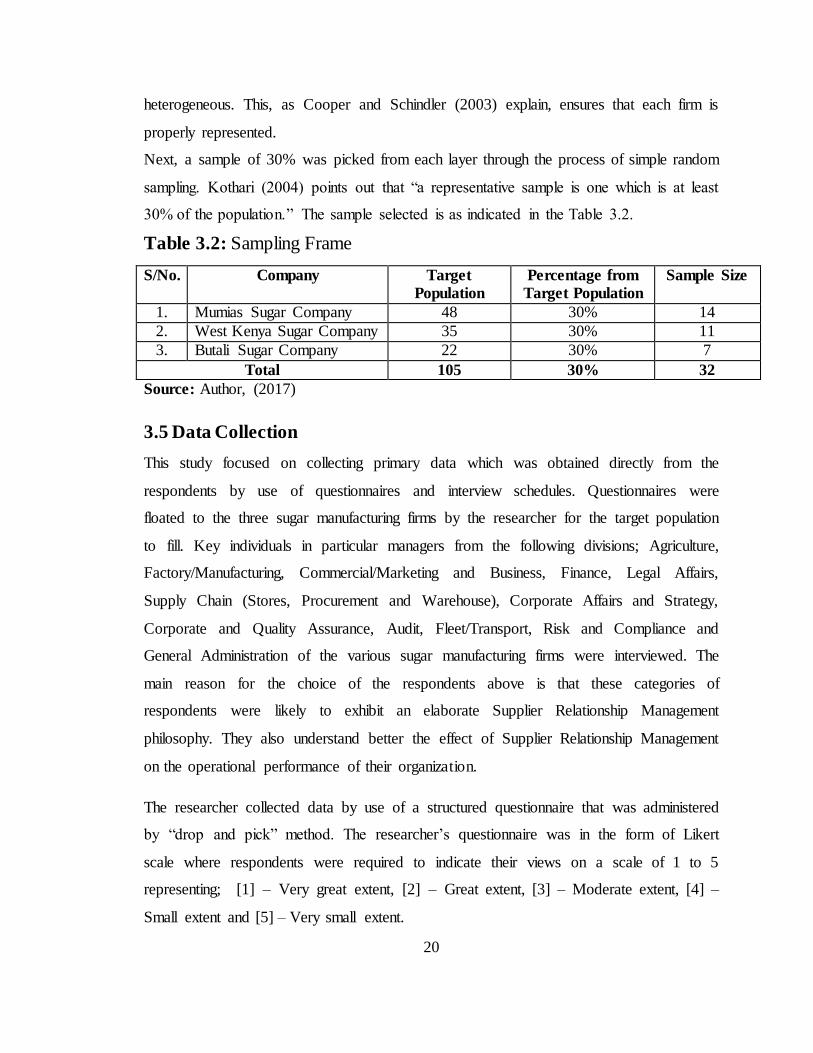
Next, a sample of 30% was picked from each layer through the process of simple random
sampling. Kothari (2004) points out that “a representative sample is one which is at least
30% of the population.” The sample selected is as indicated in the Table 3.2.
Table 3.2: Sampling Frame
S/No. Company Target
Population
Percentage from
Target Population
Sample Size
1. Mumias Sugar Company 48 30% 14
2. West Kenya Sugar Company 35 30% 11
3. Butali Sugar Company 22 30% 7
Total 105 30% 32
Source: Author, (2017)
3.5 Data Collection
This study focused on collecting primary data which was obtained directly from the
respondents by use of questionnaires and interview schedules. Questionnaires were
floated to the three sugar manufacturing firms by the researcher for the target population
to fill. Key individuals in particular managers from the following divisions; Agriculture,
Factory/Manufacturing, Commercial/Marketing and Business, Finance, Legal Affairs,
Supply Chain (Stores, Procurement and Warehouse), Corporate Affairs and Strategy,
Corporate and Quality Assurance, Audit, Fleet/Transport, Risk and Compliance and
General Administration of the various sugar manufacturing firms were interviewed. The
main reason for the choice of the respondents above is that these categories of
respondents were likely to exhibit an elaborate Supplier Relationship Management
philosophy. They also understand better the effect of Supplier Relationship Management
on the operational performance of their organization.
The researcher collected data by use of a structured questionnaire that was administered
by “drop and pick” method. The researcher‟s questionnaire was in the form of Likert
scale where respondents were required to indicate their views on a scale of 1 to 5
representing; [1] – Very great extent, [2] – Great extent, [3] – Moderate extent, [4] –
Small extent and [5] – Very small extent.
21
3.6 Data Analysis
Before the responses were processed, the researcher edited the completed questionnaires
to ensure completeness and consistency. All the responses were added up, the
percentages of variations in the responses computed, described then the data interpreted
according to the study‟s objectives. As appropriate, tables and other graphical
presentations were used for presenting the data collected. This was for the ease of
understanding as well as analysis.
Part A showing the different constructs of Supplier Relationship Management was
analyzed using descriptive statistics especially means and standard deviation.
Finally, the researcher analyzed Part B of the questionnaire using inferential statistics by
use of correlation and regression analyses. Product Moment Correlation Coefficient was
used to test the strength of the relationship between Supplier Relationship Management
and operational performance while multiple regression model was used as a basis of
rejecting or accepting the research hypotheses. Analysis of the data was based on the
research objectives and hypothesis which were analyzed by use of correlation and
regression analysis respectively.
The researcher multiple regression model was in the form of:
P =α + β1 X1 + β2 X2 + β3 X3 + β4 X4+ e. Where:
P = Operational Performance
α = the P Intercept when X is zero
β1, β2, β3 and β4, are regression coefficients of the following variables respectively; X1 =
Supplier Appraisal; X2 = Supplier Development; X3 = Supplier Involvement and X4 =
Information Sharing
e = Error term.
22
CHAPTER FOUR: DATA ANALYSIS, RESULTS AND DISCUSSION
4.1 Introduction
This chapter presents the results and discussion of the research based on the study
objectives. It contains response rate, descriptive and inferential statistics analysis on the
effect of the relationship between Supplier Relationship Management and Operational
Performance of Sugar Manufacturing Firms in Kakamega County.
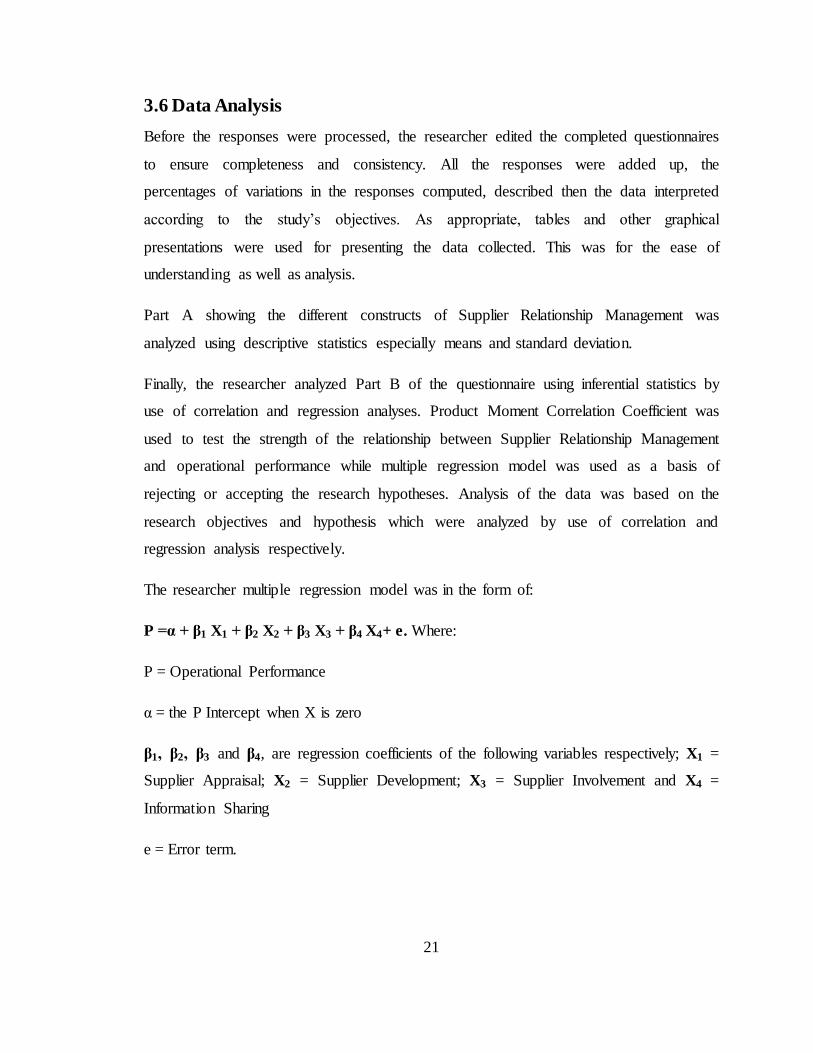
4.2 Response Rate
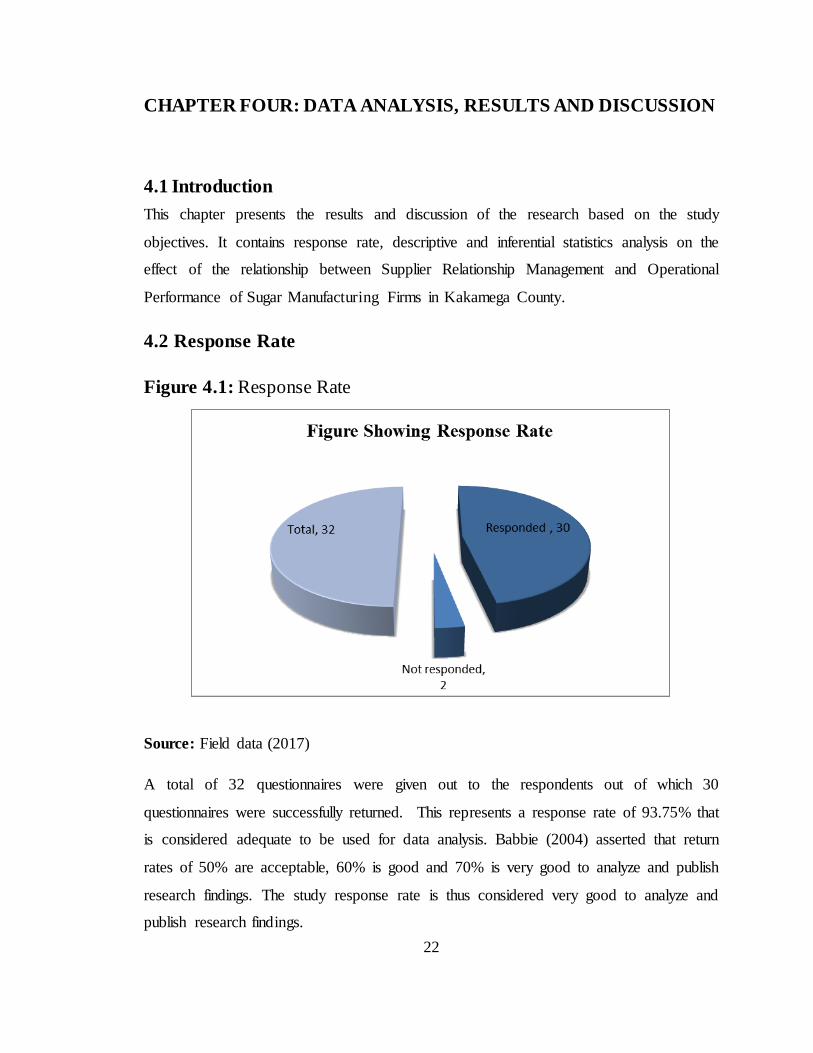
Figure 4.1: Response Rate
Source: Field data (2017)
A total of 32 questionnaires were given out to the respondents out of which 30
questionnaires were successfully returned. This represents a response rate of 93.75% that
is considered adequate to be used for data analysis. Babbie (2004) asserted that return
rates of 50% are acceptable, 60% is good and 70% is very good to analyze and publish
research findings. The study response rate is thus considered very good to analyze and
publish research findings.
23
4.3 Extent to which Sugar Manufacturing Firms have embraced
Supplier Relationship Management techniques
The study was aimed at investigating the relationship between Supplier Relationship
Management and operational performance of sugar manufacturing firms in Kakamega
County. The techniques analyzed included; supplier appraisal, supplier development,
supplier involvement and information sharing. The researcher used a five-point Likert
scale showing to what extent the respondents disagree or agree with the researcher
statements regarding the research variables. The five-point Likert scale had values from 1
to 5 where 1, 2, 3, 4 and 5 meant: Very great extent, Great extent, Moderate extent, Small
extent and Very small extent respectively. The researcher used the cumulative mean to
interpret the results (Bryman & Bell, 2011). A mean of <=2.4 means great extent, 3
moderate extent and >3 means small extent.
4.3.1 Supplier Appraisal
Table 4.1 shows the minimum, maximum, mean and standard deviation of the constructs
of supplier appraisal used to determine whether the sugar firms apply supplier appraisal
techniques in managing their supplier relationship.
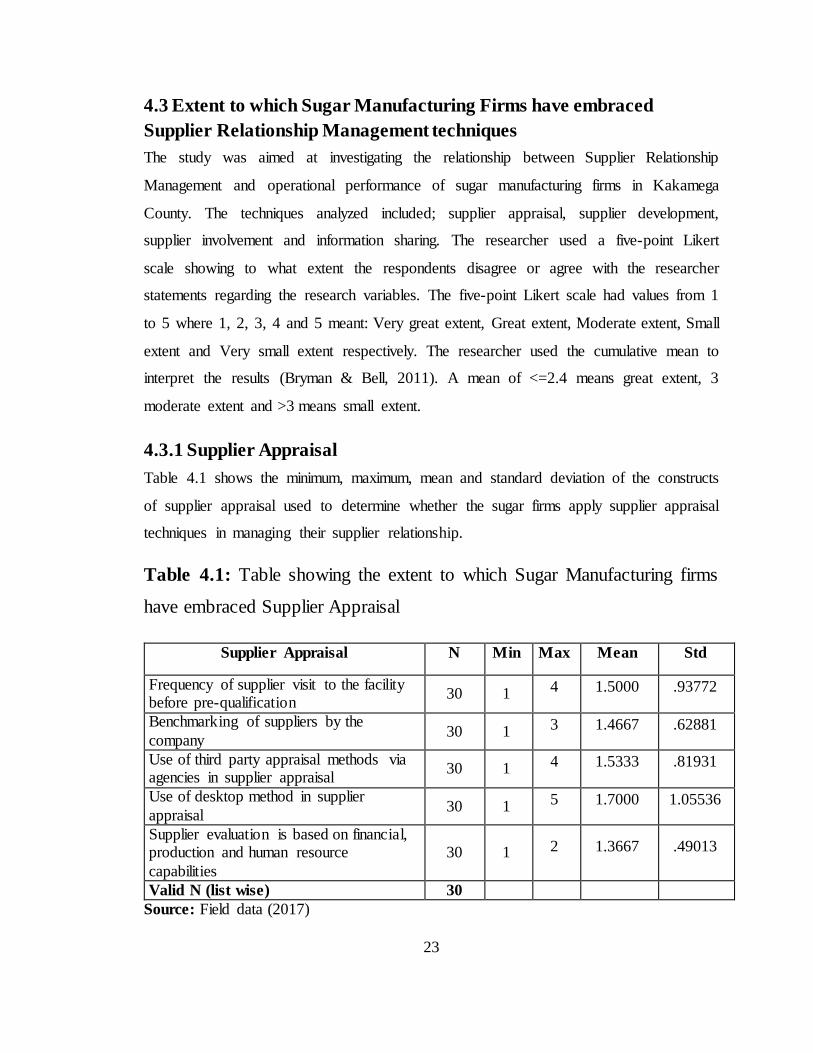
Table 4.1: Table showing the extent to which Sugar Manufacturing firms
have embraced Supplier Appraisal
Supplier Appraisal N Min Max Mean Std
Frequency of supplier visit to the facility before pre-qualification
30 1 4 1.5000 .93772
Benchmarking of suppliers by the
company 30 1 3 1.4667 .62881
Use of third party appraisal methods via agencies in supplier appraisal
30 1 4 1.5333 .81931
Use of desktop method in supplier
appraisal 30 1 5 1.7000 1.05536
Supplier evaluation is based on financial, production and human resource
capabilities
30 1 2 1.3667 .49013
Valid N (list wise) 30
Source: Field data (2017)
24
Results in Table 4.1 indicate that supplier appraisal is applied in the sampled sugar firms
as shown by the respondents agreement at a greater extent (mean<2.4). Supplier appraisal
techniques practiced by the firms entails the following: frequency of supplier visit to the
facility before pre-qualification; benchmarking of suppliers by the company; use of third
party appraisal methods via agencies in supplier appraisal; use of desktop method in
supplier appraisal; and supplier evaluation is based on financial, production and human
resource capabilities. The study results indicated that supplier appraisal which is an
element of Supplier Relationship Management practices is carried out in sugar firms in
Kakamega County thus these findings are in concomitant with research scholars like
Saleemi (2007) and Arsan (2011) who demonstrated that organizations manage their
supplier relationship through the practice of supplier appraisal.
4.3.2 Supplier Development
Table 4.2 shows the minimum, maximum, mean and standard deviation of the constructs
of supplier development used to measure the level of Supplier Relationship Management.
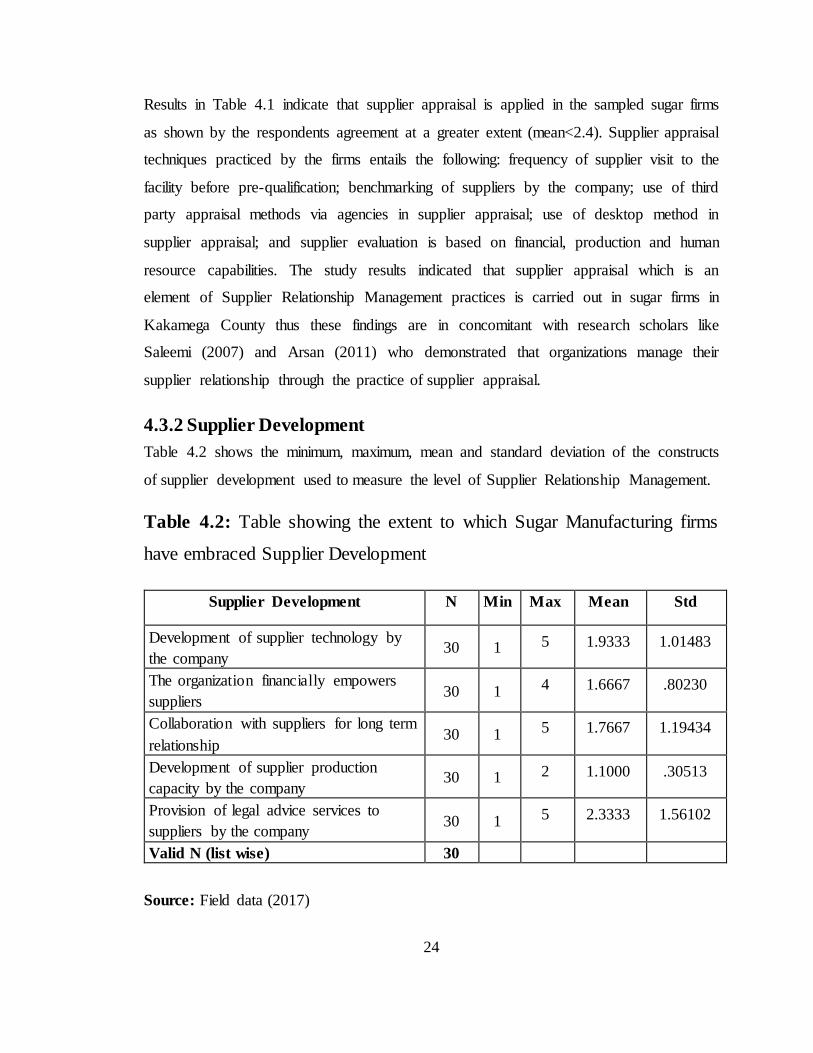
Table 4.2: Table showing the extent to which Sugar Manufacturing firms
have embraced Supplier Development
Supplier Development N Min Max Mean Std
Development of supplier technology by
the company 30 1 5 1.9333 1.01483
The organization financially empowers
suppliers 30 1 4 1.6667 .80230
Collaboration with suppliers for long term
relationship 30 1 5 1.7667 1.19434
Development of supplier production
capacity by the company 30 1 2 1.1000 .30513
Provision of legal advice services to
suppliers by the company 30 1 5 2.3333 1.56102
Valid N (list wise) 30
Source: Field data (2017)
25
From the study findings in Table 4.2, it is clearly evident that all the research study
statements on supplier development have a mean of less than 2.4 which translate to
agreement by a greater extent that supplier development is practiced in the sampled sugar
firms. This is shown by the respondents‟ agreement that their firm: develop their supplier
technology; financially empower suppliers; collaborate with suppliers for long term
relationship; develop their supplier production capacity; and provide legal advice services
to suppliers. The respondents sentiments echoes the fact that Supplier Relationship
Management is practiced by the firms through constant development of their supplier
capabilities which agrees with past researchers who found out that managing supplier
relationship can be best achieved through supplier development (Wenli et al., 2012;
Khuram, Ilkka, Elina & Shpend, 2016).
4.3.3 Supplier Involvement
Table 4.3 depicts the minimum, maximum, mean and standard deviation of the
statements on supplier involvement used to determine whether the sugar firms apply it as
a technique for managing their supplier relationship.
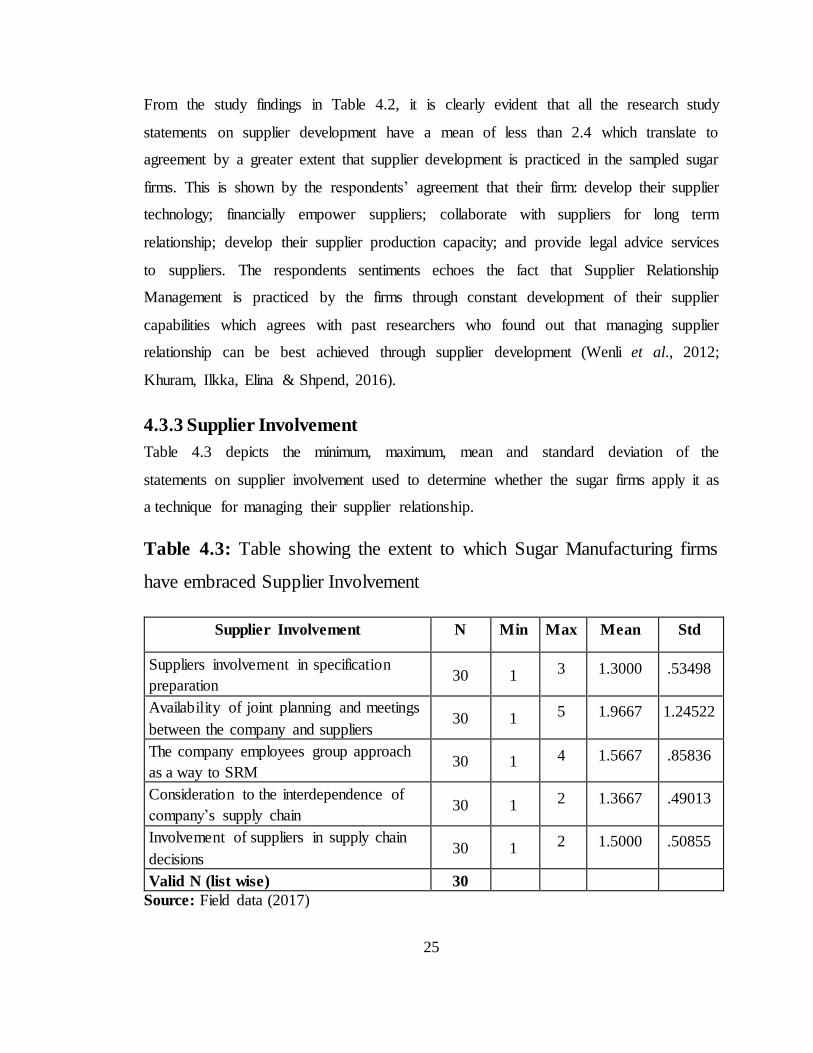
Table 4.3: Table showing the extent to which Sugar Manufacturing firms
have embraced Supplier Involvement
Supplier Involvement N Min Max Mean Std
Suppliers involvement in specification
preparation 30 1 3 1.3000 .53498
Availability of joint planning and meetings
between the company and suppliers 30 1 5 1.9667 1.24522
The company employees group approach
as a way to SRM 30 1 4 1.5667 .85836
Consideration to the interdependence of
company‟s supply chain 30 1 2 1.3667 .49013
Involvement of suppliers in supply chain
decisions 30 1 2 1.5000 .50855
Valid N (list wise) 30
Source: Field data (2017)
26
Results in Table 4.3 indicate that sugar firms involve their suppliers as a method of
improving their relationship with them. This was illustrated by the respondents agreement
to a greater extent (mean<2.4) that the following supplier involvement techniques are
practiced in their firm: suppliers involvement in specification preparation; availability of
joint planning and meetings between the company and suppliers; employees group
approach as a way to Supplier Relationship Management; consideration to the
interdependence of company‟s supply chain; and involvement of suppliers in supply
chain decisions. The results concurred with the reviewed literature on supplier
involvement as a mechanism of managing supplier relationship by scholars such as Feng
and Wang (2013) and Melander, Rosell and Lakemond (2014)
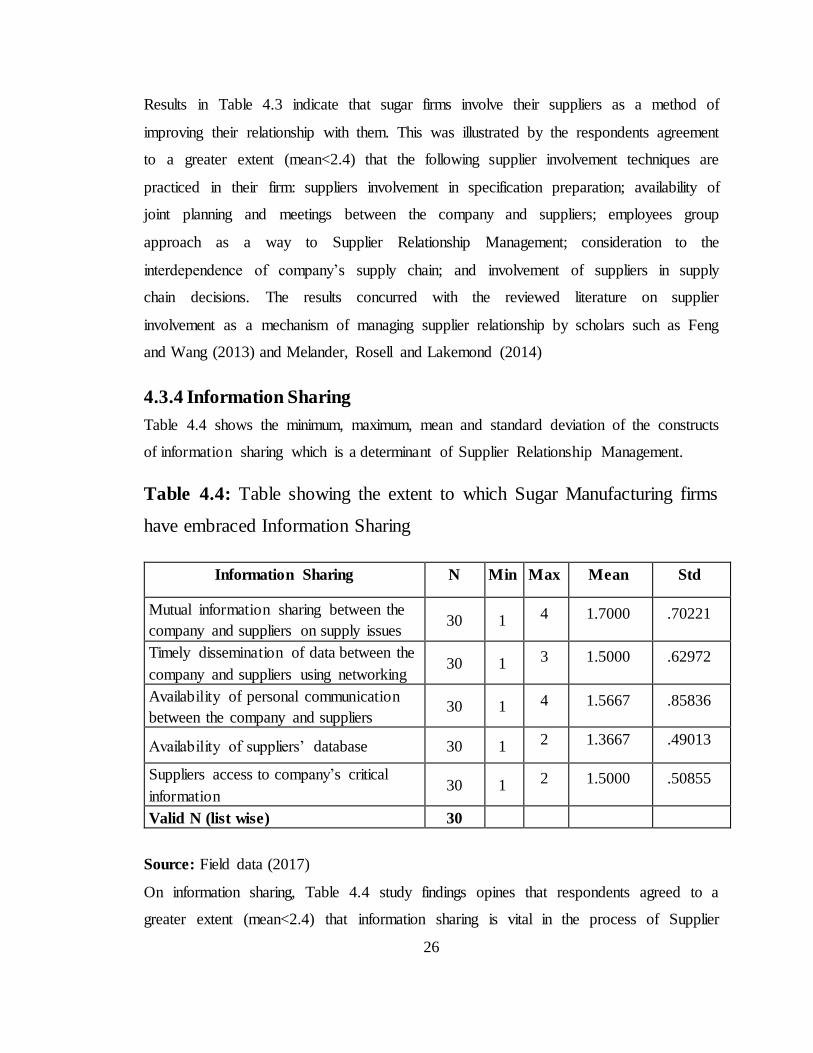
4.3.4 Information Sharing
Table 4.4 shows the minimum, maximum, mean and standard deviation of the constructs
of information sharing which is a determinant of Supplier Relationship Management.
Table 4.4: Table showing the extent to which Sugar Manufacturing firms
have embraced Information Sharing
Information Sharing N Min Max Mean Std
Mutual information sharing between the
company and suppliers on supply issues 30 1 4 1.7000 .70221
Timely dissemination of data between the
company and suppliers using networking 30 1 3 1.5000 .62972
Availability of personal communication
between the company and suppliers 30 1 4 1.5667 .85836
Availability of suppliers‟ database 30 1 2 1.3667 .49013
Suppliers access to company‟s critical
information 30 1 2 1.5000 .50855
Valid N (list wise) 30
Source: Field data (2017)
On information sharing, Table 4.4 study findings opines that respondents agreed to a
greater extent (mean<2.4) that information sharing is vital in the process of Supplier
27
Relationship Management process. This can be depicted by the fact that the firm
embraces the following ways of sharing information with their suppliers: mutual
information sharing between the company and suppliers on supply issues; timely
dissemination of data between the company and suppliers using networking; availability
of personal communication between the company and suppliers; availability of suppliers‟
database; and suppliers‟ access to company‟s critical information. The study findings on
information sharing as an important ingredient of Supplier Relationship Management
techniques is argued very well by researchers like Kearney (2013) and Weitz (1992).
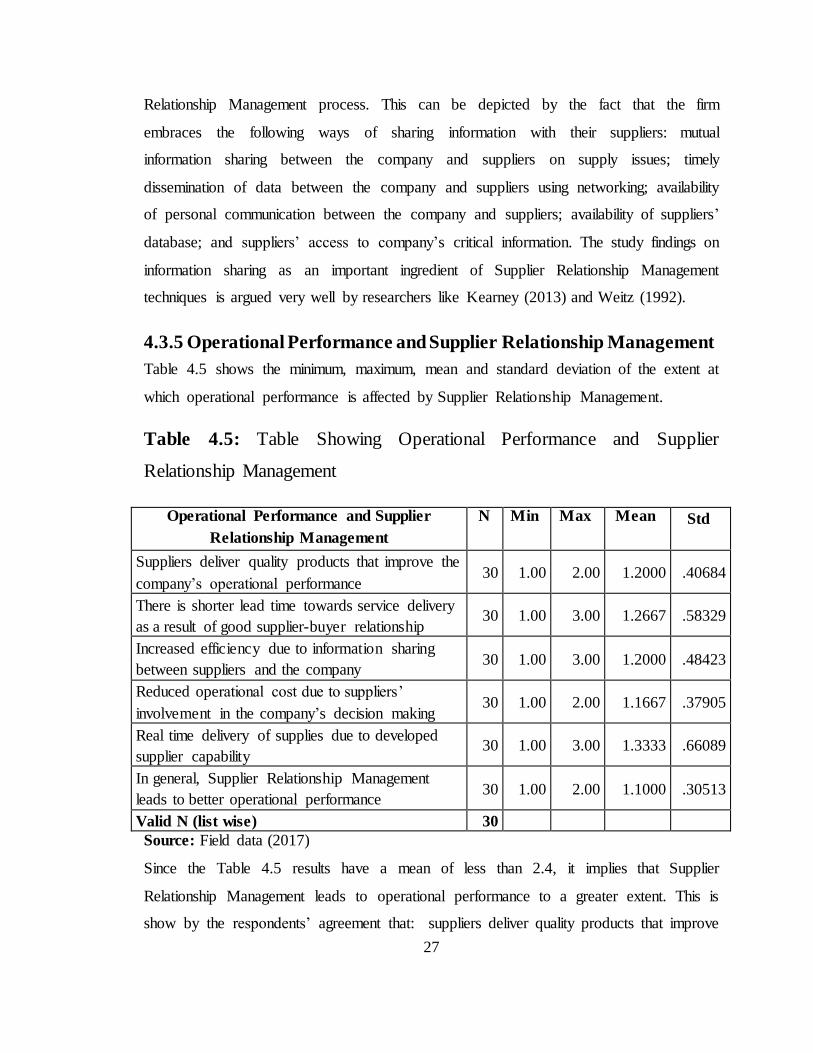
4.3.5 Operational Performance and Supplier Relationship Management
Table 4.5 shows the minimum, maximum, mean and standard deviation of the extent at
which operational performance is affected by Supplier Relationship Management.
Table 4.5: Table Showing Operational Performance and Supplier
Relationship Management
Operational Performance and Supplier
Relationship Management
N Min Max Mean Std
Suppliers deliver quality products that improve the
company‟s operational performance 30 1.00 2.00 1.2000 .40684
There is shorter lead time towards service delivery
as a result of good supplier-buyer relationship 30 1.00 3.00 1.2667 .58329
Increased efficiency due to information sharing
between suppliers and the company 30 1.00 3.00 1.2000 .48423
Reduced operational cost due to suppliers‟
involvement in the company‟s decision making 30 1.00 2.00 1.1667 .37905
Real time delivery of supplies due to developed
supplier capability 30 1.00 3.00 1.3333 .66089
In general, Supplier Relationship Management
leads to better operational performance 30 1.00 2.00 1.1000 .30513
Valid N (list wise) 30
Source: Field data (2017)
Since the Table 4.5 results have a mean of less than 2.4, it implies that Supplier
Relationship Management leads to operational performance to a greater extent. This is
show by the respondents‟ agreement that: suppliers deliver quality products that improve
28
the company‟s operational performance; there is shorter lead time towards service
delivery as a result of good supplier-buyer relationship; increased efficiency due to
information sharing between suppliers and the company; reduced operational cost due to
suppliers‟ involvement in the company‟s decision making; real time delivery of supplies
due to developed supplier capability; and in general, Supplier Relationship Management
leads to better operational performance. This result replicates past studies which found
out that Supplier Relationship Management leads to better organization performance
(KiIpatrick and Ron, 2000; Choi, 2004; Baily et al., 2008).
4.4 Relationship between Supplier Relationship Management and
Operational Performance
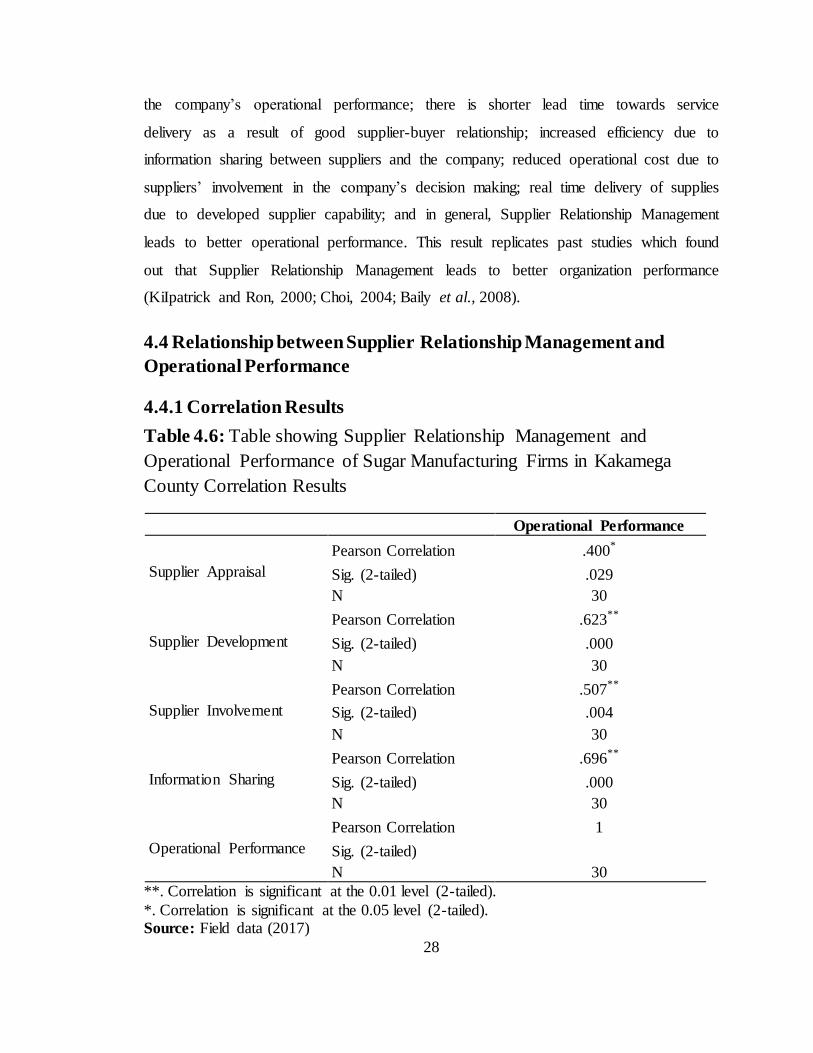
4.4.1 Correlation Results
Table 4.6: Table showing Supplier Relationship Management and
Operational Performance of Sugar Manufacturing Firms in Kakamega
County Correlation Results
Operational Performance
Supplier Appraisal
Pearson Correlation .400*
Sig. (2-tailed) .029
N 30
Supplier Development
Pearson Correlation .623**
Sig. (2-tailed) .000
N 30
Supplier Involvement
Pearson Correlation .507**
Sig. (2-tailed) .004
N 30
Information Sharing
Pearson Correlation .696**
Sig. (2-tailed) .000
N 30
Operational Performance
Pearson Correlation 1
Sig. (2-tailed)
N 30
**. Correlation is significant at the 0.01 level (2-tailed).
*. Correlation is significant at the 0.05 level (2-tailed). Source: Field data (2017)
29
Study results in Table 4.6 depict the following: there is a higher positive and significant
relationship between information sharing and operational performance (r=0.696),
followed by supplier development and operational performance (r=0.623) and supplier
involvement and operational performance (r=0.507) all at 0.01 level of significance.
The study however, found out that there is a weak positive and significant relationship
between supplier appraisal and operational performance (r=0.400) at 0.05 level of
significance.
In general, it can be deduced that Supplier Relationship Management is positively and
significantly correlated to operational performance since all the constructs of Supplier
Relationship Management of information sharing, supplier development, supplier
involvement and supplier appraisal positively and significantly correlated with
operational performance. The study findings are in agreement with past researchers who
found out that Supplier Relationship Management is positively and significantly related
to organization performance (Arsan, 2011; Wenli et al., 2012; Khuram, Ilkka, Elina &
Shpend, 2016; Weitz, 1992; KiIpatrick and Ron, 2000; Choi, 2004; Baily et al., 2008).
4.4.2 Regression Results
The results in Tables 4.7, 4.8 and 4.9 below show the test of hypothesis on the
relationship between Supplier Relationship Management and operational performance of
sugar manufacturing firms in Kakamega County. The tables below have the model
summary, ANOVA and coefficient of determination for the purpose of either rejecting or
failing to reject the study hypotheses. The F – statistic generated by regression results
was used to test the goodness of fit of the research variables (Hoe, 2008). The study used
the correlation r (Beta, β) to test the hypotheses rejection or failing to reject criteria. The
test criteria is set such that the study rejects the null hypotheses if β1≠ β2≠ β3≠ β4≠ 0,
otherwise the study will have failed to reject the null hypothesis if β1=β2=β3=β4=0 (Elam,
1979).
30
Table 4.7: Table showing Model Summary
Model Summary
Model R R Square Adjusted R Square Std. Error of the Estimate
1 .735a .540 .466 .49445
a. Predictors: (Constant), Information Sharing, Supplier Involvement, Supplier Appraisal,
Supplier Development
Source: Field data (2017)
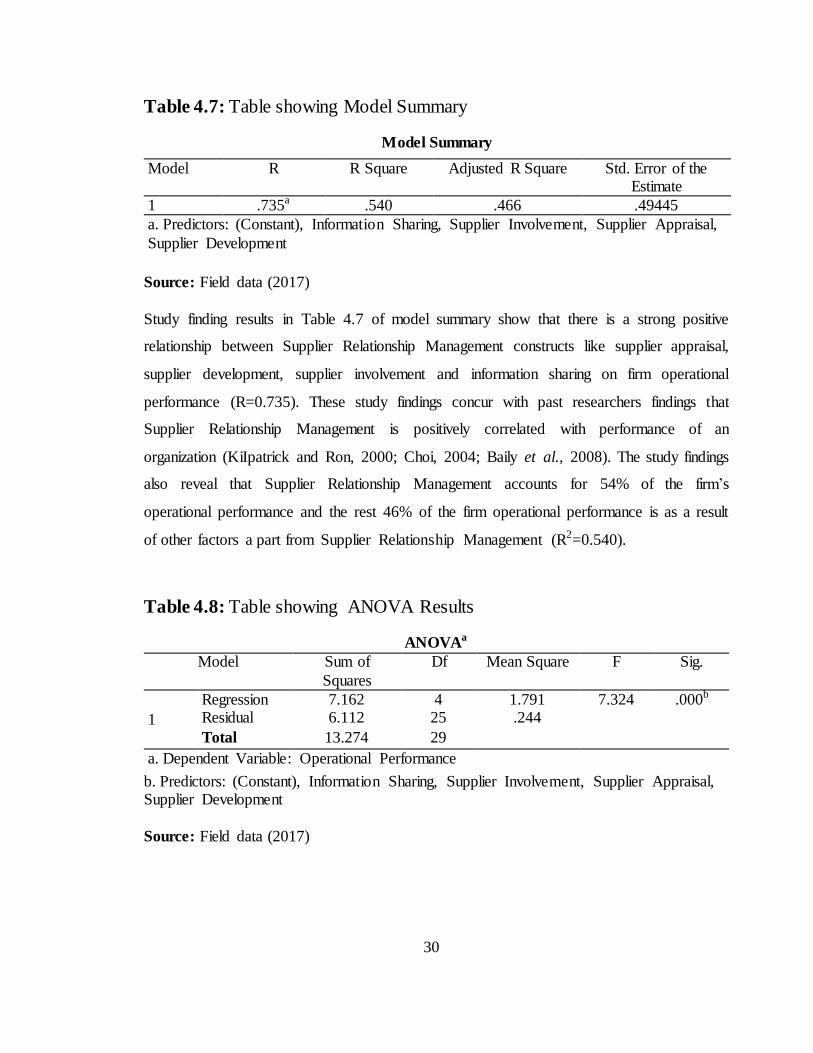
Study finding results in Table 4.7 of model summary show that there is a strong positive
relationship between Supplier Relationship Management constructs like supplier appraisal,
supplier development, supplier involvement and information sharing on firm operational
performance (R=0.735). These study findings concur with past researchers findings that
Supplier Relationship Management is positively correlated with performance of an
organization (KiIpatrick and Ron, 2000; Choi, 2004; Baily et al., 2008). The study findings
also reveal that Supplier Relationship Management accounts for 54% of the firm‟s
operational performance and the rest 46% of the firm operational performance is as a result
of other factors a part from Supplier Relationship Management (R2=0.540).
Table 4.8: Table showing ANOVA Results
ANOVAa
Model Sum of
Squares
Df Mean Square F Sig.
1
Regression 7.162 4 1.791 7.324 .000b Residual 6.112 25 .244
Total 13.274 29
a. Dependent Variable: Operational Performance
b. Predictors: (Constant), Information Sharing, Supplier Involvement, Supplier Appraisal, Supplier Development
Source: Field data (2017)
31
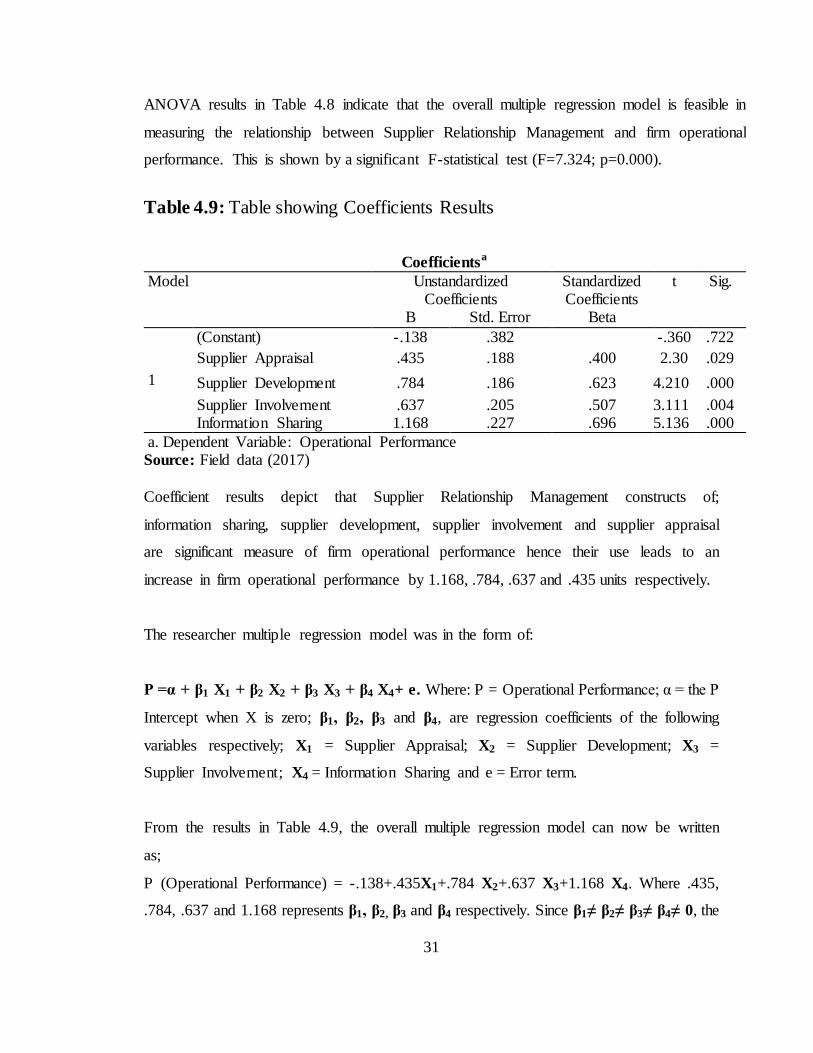
ANOVA results in Table 4.8 indicate that the overall multiple regression model is feasible in
measuring the relationship between Supplier Relationship Management and firm operational
performance. This is shown by a significant F-statistical test (F=7.324; p=0.000).
Table 4.9: Table showing Coefficients Results
Coefficientsa
Model Unstandardized Coefficients
Standardized Coefficients
t Sig.
B Std. Error Beta
1
(Constant) -.138 .382 -.360 .722
Supplier Appraisal .435 .188 .400 2.30 .029
Supplier Development .784 .186 .623 4.210 .000
Supplier Involvement .637 .205 .507 3.111 .004 Information Sharing 1.168 .227 .696 5.136 .000
a. Dependent Variable: Operational Performance Source: Field data (2017)
Coefficient results depict that Supplier Relationship Management constructs of;
information sharing, supplier development, supplier involvement and supplier appraisal
are significant measure of firm operational performance hence their use leads to an
increase in firm operational performance by 1.168, .784, .637 and .435 units respectively.
The researcher multiple regression model was in the form of:
P =α + β1 X1 + β2 X2 + β3 X3 + β4 X4+ e. Where: P = Operational Performance; α = the P
Intercept when X is zero; β1, β2, β3 and β4, are regression coefficients of the following
variables respectively; X1 = Supplier Appraisal; X2 = Supplier Development; X3 =
Supplier Involvement; X4 = Information Sharing and e = Error term.
From the results in Table 4.9, the overall multiple regression model can now be written
as;
P (Operational Performance) = -.138+.435X1+.784 X2+.637 X3+1.168 X4. Where .435,
.784, .637 and 1.168 represents β1, β2, β3 and β4 respectively. Since β1≠ β2≠ β3≠ β4≠ 0, the
32
study rejects the four research null hypotheses and concludes that there is a significant
relationship between Supplier Relationship Management and operational performance of
sugar manufacturing firms in Kakamega County. The study results are in agreement with
past research findings which found out that Supplier Relationship Management results in
improved firm performance (Arsan, 2011; Wenli et al., 2012; Khuram, Ilkka, Elina &
Shpend, 2016; Weitz, 1992; KiIpatrick and Ron, 2000; Choi, 2004; Baily et al., 2008).
33
CHAPTER FIVE: SUMMARY OF FINDINGS, CONCLUSION AND
RECOMMENDATIONS
5.1 Introduction
The chapter presents summary of the empirical findings, conclusion and
recommendations on the effect of Supplier Relationship Management and Operational
Performance of Sugar Manufacturing Firms in Kakamega County. Suggestions for
further research have also been captured.
5.2 Summary of the Findings
From the data collected it is evident that supplier appraisal, supplier development,
supplier involvement and information sharing have a positive and significant correlation
to operational performance. Supplier appraisal is a pre-requisite in Supplier Relationship
Management since it is the evaluation process of finding whether a supplier meets
organization supplier requirements. Firms in the sugar sector in Kakamega County
attribute supplier development as a useful means towards achieving goals and objectives
in their supply chain. Through supplier involvement, firms are able to jointly work with
suppliers in areas of product design and development thereby reducing costs related to
the supply chain function. The sugar manufacturing firms in Kakamega County are
embracing information sharing with their key suppliers as it helps in provision of reliable
supply data between the organization and suppliers for sustainable relationship and
operational performance.
5.3 Conclusion
The study concludes that the sugar manufacturing firms in Kakamega County have been
embracing Supplier Relationship Management in terms of supplier appraisal, supplier
development, supplier involvement and information sharing. Supplier Relationship
Management has assisted the sugar manufacturing firms to enhance the operational
performance of their organizations. This is supported by results from a regression
analysis conducted that indicated there is a strong positive and significant relationship
between Supplier Relationship Management and operational performance.
34
5.4 Recommendations
The study has confirmed that Supplier Relationship Management is very significant in
enhancing the operational performance of sugar manufacturing firms in Kakamega
County. All sugar manufacturing firms and other organizations are advised to embrace
this concept so that they can be able to reap the benefits of developing Supplier
Relationship Management. By maintaining good relationships with their suppliers, sugar
manufacturing firms will end up performing well; they will also help their key suppliers
to achieve their set goals. The sugar manufacturing firms are also advised to adopt the
practices that are currently adopted at a very small extent because they can significantly
improve their operational performance from the current position.
5.5 Limitations of the Study
According to Mugenda and Mugenda (2003), a limitation is an aspect of research that
may influence the results but over which the researcher has no control. Limitations of the
study included the following: given the busy schedule of the managers of the sampled
sugar firms in Kakamega County, it was almost impossible to administer questionnaires
to them. The researcher took this issue seriously by booking appointments for meetings
and did not tire up by coming over and again until an adequate response rate was
obtained. Some respondents were not willing to cooperate in giving required information
needed by the researcher due to fear of victimization. The respondents provided the
required information after being assured of information confidentiality as the data being
collected was for research purpose only.
35
5.6 Suggestions for Further Research
Arising from the summary of the key findings, conclusion and recommendations; the
study proposes the following: a similar study should be conducted in sugar companies in
other counties in Kenya to find out if there is or there is no disconnect between the study
findings. A comparison study is also inevitable between the private and public owned
sugar companies on Supplier Relationship Management and operational performance.
Finally, a similar study is also necessary in other sectors like service industry to link it
with findings in the manufacturing industry that this study has focused on.
36
REFERENCES
Ambe, I. M., & Badenhorst-Weiss, J. A. (2012a). Procurement Challenges in the South
African Public Sector. Journal of Transport and Supply Chain Management. 6
(1): 242-261.
Anderson, E. & Weitz, B. (1992). “The use of pledges to build and sustain commitment
in distribution channels,” Journal of Marketing Research, 29 (1), 18-3.
Arsan, (2011). Performance Measurement and Metrics: An Analysis of Supplier
Evaluation retrieved from www.scm.ncsm.edu/scm-articles on 5th September,
2013.
Baily, Farmer, Jessop and Jones, (2008). Purchasing Principles and Management, 9th
Edition.
Babbie, E. (2004). The Practice of Social Research. 8th edition Belmont California,
Wadsworth publishing company, USA.
Bryman, A., and Bell, E. (2011). Business Research Methods. 3rd Ed, Oxford: Oxford
University Press.
Cannon, J. & Homburg, C. (2001). Buyer-Supplier Relationships and Customer Firm
Costs, Journal of Marketing, Vol. 65 (1).
Christopher, M. (2009). Towards a “Theoretical tool box for strategic sourcing,” Supply
Chain Management: An International Journal, Vol. 14 (1): pp. 3-10.
Cooper, D. R., & Schindler, P. S. (2003). Business Research Methods. (8th Ed.). Boston:
McGraw- Hill Irwin.
Cropanzano, R., & Mitchell, M. S. (2005). Social Exchange Theory: An interdisciplinary
review. Journal of management, 31(6), 874-900.
37
Donoghue, J. (2011). “Creating and Maintaining a Successful Supplier Relationship,”
San Diego, CA. http://leardon.com/successful-supplier-management, download
25.01.2012.
Elam, E., M. (1979). Applied Business Statistics, 2nd Ed, Book Press, USA.
Feng, T., and Wang, D. (2013). “Supply Chain Involvement for better product
development performance,” Industrial Management & Data Systems, Vol. 113
Issue: 2, pp. 190 - 206. https://doi.org/10.1108/02635571311303532
Fink, R. C., Edelman, L. F., Hatten, K. J., & James, W. L. (2006). Transaction Cost
Economics, Resource Dependence Theory and Customer-Supplier Relationships.
Industrial and Corporate Change, 15 (3), 497-529.
Harland, C., Knight, L., Lamming, R., & Walker, H. (2005). Outsourcing: assessing the
risks and benefits for organizations, sectors and nations, International Journal of
Operations & Production Management, 25 (9), 831 – 850.
Herrmann, J. W., & Hodgson, B. (2001). SRM: leveraging the supply base for
competitive advantage. Proceedings of the SMTA International Conference,
Chicago, IL, 1 October 2001, supply works inc.
Hoe, S., L. (2008). Issues and procedures in adopting structural equation modeling
technique, Journal of applied quantitative methods, Vol. 3(1).
Homans, G., C. (1958). Social behavior as exchange. American journal of sociology,
597- 606.
Inayatullah, Narain, R., and Singh, A. (2012). Role of buyer-supplier relationship and
trust on organizational performance. Delhi Business Review Vol. 13, No 2.
38
Johnston, D. A., McCutcheon, D. M., Stuart, F. I., and Kerwood, H. (2004). “Effects of
supplier trust on performance of cooperative supplier relationships,” Journal of
Operations Management, Vol. 22, pp. 23-38.
Kamau, F. (2013). “Buyer-supplier relationships and organizational performance among
large manufacturing firms in Nairobi, Kenya.” Unpublished MBA Project,
University of Nairobi.
Kearney, D. (2013). Supplier performance management – Driving successful strategies
and relationships. www.edgererve.com/procureedge
Kegode, P. (2005). A Research Study on Economic Governance and Reforms: Challenges
& evaluating training and performance in sugar firms in western province,
Kenya. Kakamega: Masinde Muliro University.
Kenya Sugar Board, (2013). Kenya Sugar Cane Board Year Book of Statistics.
Khuram, S., Ilkka, S., Elina, S., & Shpend, I. (2016). Benchmarking Supplier
Development: An Empirical Case Study of Validating A Framework to Improve
Buyer-Supplier Relationship. Management and Production Engineering Review,
7 (1), 56–70.
KiIpatrick, J. & Ron, F. (2000). “Logistics in Canada Survey: Tracking Year 2000
Supply Issues and Trends.” Journal of Materials Management and
Distribution. 45 (1) 16-20.
Kosgei, R. C., & Gitau, R. (2016). Effect of Supplier Relationship Management on
organizational performance: A case study of Kenya Airways Limited.
International Academic Journal of Procurement and Supply Chain Management,
2 (2), 134-148.
Kothari, R. (2004). Research Methodology; Methods and Techniques: Prakashan;
Mumbai.
39
Kothari, C., R. and Garg, G. (2014). Research Methodology: Methods and Techniques;
New Delhi; New Age International.
Liker, J. K., and Choi, T. Y. (2004). Building deep suppliers relationships. Harvard
Business Review, 82 (12), 104-114.
Lysons, K. and Farrington, B. (2006). Purchasing and Supply Chain Management,
Prentice Hall, UK. 7th Edition.
MacPherson, A., Elliot, M., Harris, I., and Homan, G. (2004). „E-learning: Reflection and
Evaluation of Corporate Programmes.‟ Human Resource Development
International Journal, 7 (3): 295-313.
Maraka, Kibet and Iravo, (2015). Supplier Relationship Management on organization
performance in selected sugar companies in Western Kenya. International
Journal of Management Research. Volume 4 Issue 1.
McCutcheon, D., and Stuart, F., I. (2000). “Issues in the choice of supplier alliance
partners,” Journal of Operations Management, Vol. 18, No. 3, pp. 279-301.
Melander, L., Rosell, D., and Lakemond, N. (2014). In pursuit of control: involving
suppliers of critical technologies in new product development. Supply Chain
Management: An International Journal, Vol. 19 (6), pp. 722 – 732.
minigrp.com
Mugenda, O. M., and Mugenda, A. G. (2003). Research Methods: Qualitative and
Quantitative Approaches. Nairobi, Act Press.
Ooko. G. O., Manyasi, J., and Ondiek, B. A. (2016). Talent Retention Strategy and
Employees‟ Productivity in Private Sugar Companies in Kakamega County,
Kenya. International Journal of Multidisciplinary and Current Research, Vol. 4
(July-August, 2016).
40
Park, J., Shin, K., Chang, T. W., & Park, J. (2010). An integrative framework for
supplier relationship management. Industrial Management & Data Systems, Vol.
110 (4), 495-515.
Porter, M., E. (1985). Competitive Advantage: Creating and Sustaining Superior
Performance. The Free Press, New York.
Rajaniemi, J. (2012). Defining and Measuring Lead Time in a Telecommunication
Production. Master of Science thesis. Department of Computer Sciences and
Engineering, University of Oulu. 63 p.
Rapando, M., J. (2011). Research Study on Assessment of Financial Return Method in
Evaluating Training and Performance in Sugar Firms in Western Province,
Kenya. Kakamega: Masinde Muliro University.
Saleemi, N., A. (2007). Purchasing and Supplies Management, Saleemi Publications.
Sanders, N. (2005). IT alignment in supply chain relationships: A study of supplier
benefits. Journal of Supply Chain Management, 41(2), 4-13.
Tangus, C., Oyugi L. A., Rambo C. M., & Rono, B. K. (2015). Effects of Supplier
Relationship Management Practices on Performance of Manufacturing Firms in
Kisumu County, Kenya. International Journal of Economics, Commerce and
Management. Vol. 3 (11). Pp. 499 - 512. ISSN: 23480386, United Kingdom.
Wachira, R., (2013). Supplier Relationship Management and Supply Chain Performance
in Alcoholic Beverage Industry in Kenya, University of Nairobi.
Wenli, L, Humphreys, P. K, Yeung, C. L., & Cheng, T. C. E. (2012). The impact of
supplier development on buyer competitive advantage: A path analytic model. Int.
J. Production Economics. 135, 353–366.
www.businesslist.co.ke
www.mumias-sugar.com
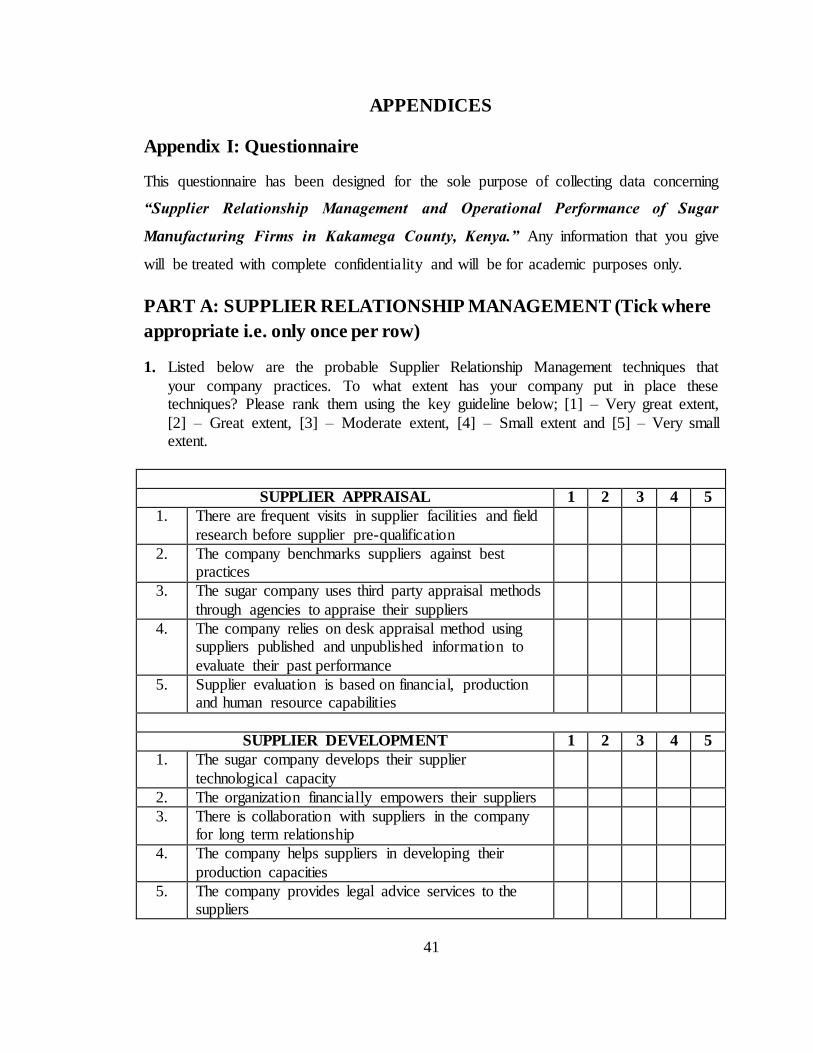
41
APPENDICES
Appendix I: Questionnaire
This questionnaire has been designed for the sole purpose of collecting data concerning
“Supplier Relationship Management and Operational Performance of Sugar
Manufacturing Firms in Kakamega County, Kenya.” Any information that you give
will be treated with complete confidentiality and will be for academic purposes only.
PART A: SUPPLIER RELATIONSHIP MANAGEMENT (Tick where
appropriate i.e. only once per row)
1. Listed below are the probable Supplier Relationship Management techniques that
your company practices. To what extent has your company put in place these techniques? Please rank them using the key guideline below; [1] – Very great extent,
[2] – Great extent, [3] – Moderate extent, [4] – Small extent and [5] – Very small extent.
SUPPLIER APPRAISAL 1 2 3 4 5
1. There are frequent visits in supplier facilities and field
research before supplier pre-qualification
2. The company benchmarks suppliers against best practices
3. The sugar company uses third party appraisal methods
through agencies to appraise their suppliers
4. The company relies on desk appraisal method using suppliers published and unpublished information to
evaluate their past performance
5. Supplier evaluation is based on financial, production and human resource capabilities
SUPPLIER DEVELOPMENT 1 2 3 4 5
1. The sugar company develops their supplier
technological capacity
2. The organization financially empowers their suppliers
3. There is collaboration with suppliers in the company for long term relationship
4. The company helps suppliers in developing their
production capacities
5. The company provides legal advice services to the suppliers
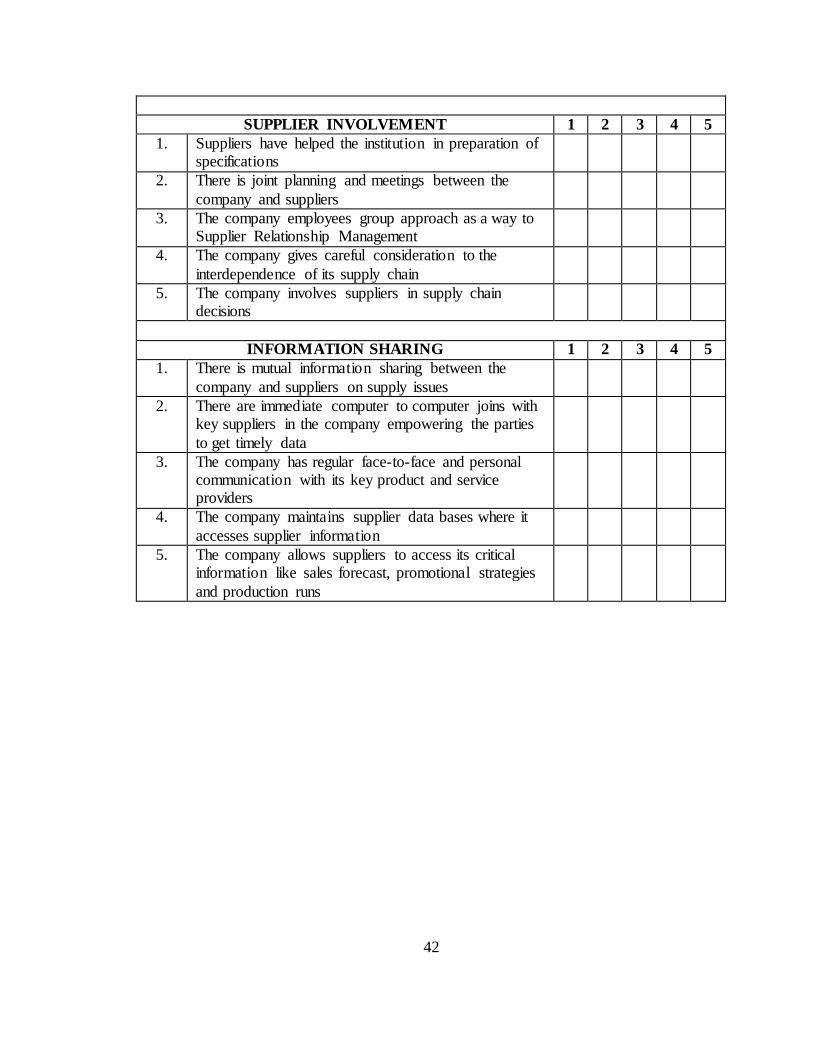
42
SUPPLIER INVOLVEMENT 1 2 3 4 5
1. Suppliers have helped the institution in preparation of specifications
2. There is joint planning and meetings between the
company and suppliers
3. The company employees group approach as a way to Supplier Relationship Management
4. The company gives careful consideration to the
interdependence of its supply chain
5. The company involves suppliers in supply chain decisions
INFORMATION SHARING 1 2 3 4 5
1. There is mutual information sharing between the
company and suppliers on supply issues
2. There are immediate computer to computer joins with key suppliers in the company empowering the parties
to get timely data
3. The company has regular face-to-face and personal communication with its key product and service providers
4. The company maintains supplier data bases where it
accesses supplier information
5. The company allows suppliers to access its critical information like sales forecast, promotional strategies
and production runs
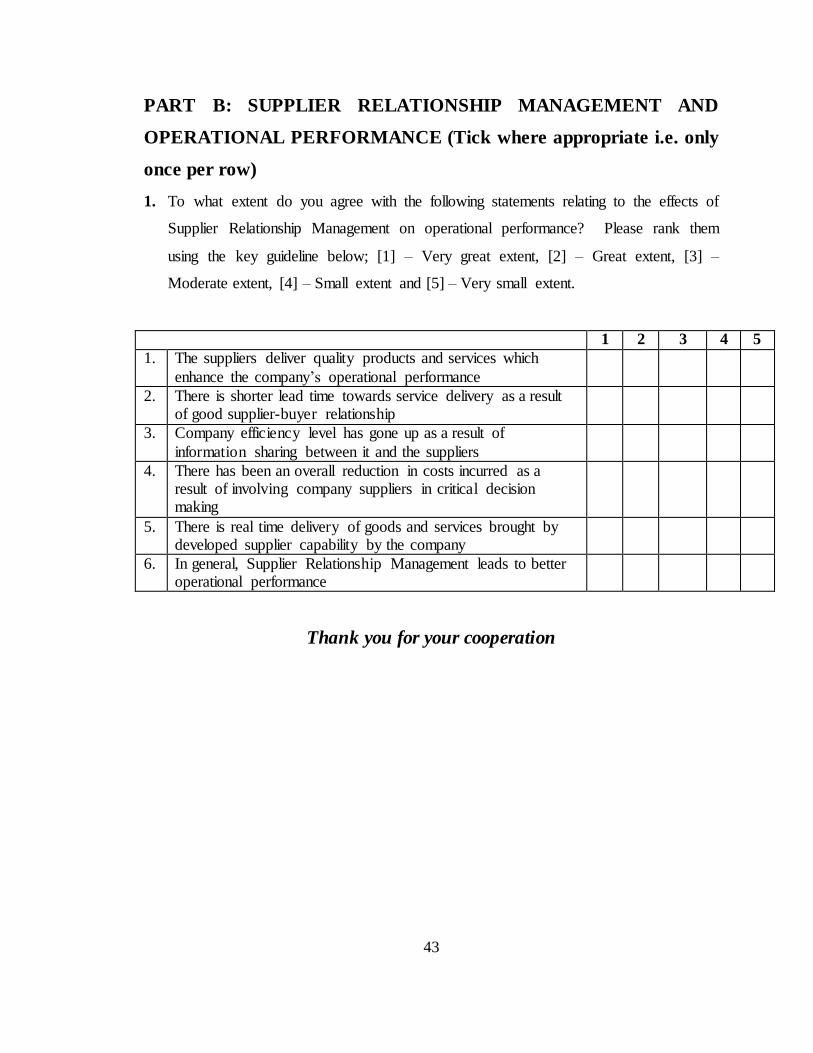
43
PART B: SUPPLIER RELATIONSHIP MANAGEMENT AND
OPERATIONAL PERFORMANCE (Tick where appropriate i.e. only
once per row)
1. To what extent do you agree with the following statements relating to the effects of
Supplier Relationship Management on operational performance? Please rank them
using the key guideline below; [1] – Very great extent, [2] – Great extent, [3] –
Moderate extent, [4] – Small extent and [5] – Very small extent.
1 2 3 4 5
1. The suppliers deliver quality products and services which
enhance the company‟s operational performance
2. There is shorter lead time towards service delivery as a result of good supplier-buyer relationship
3. Company efficiency level has gone up as a result of
information sharing between it and the suppliers
4. There has been an overall reduction in costs incurred as a result of involving company suppliers in critical decision making
5. There is real time delivery of goods and services brought by developed supplier capability by the company
6. In general, Supplier Relationship Management leads to better operational performance
Thank you for your cooperation
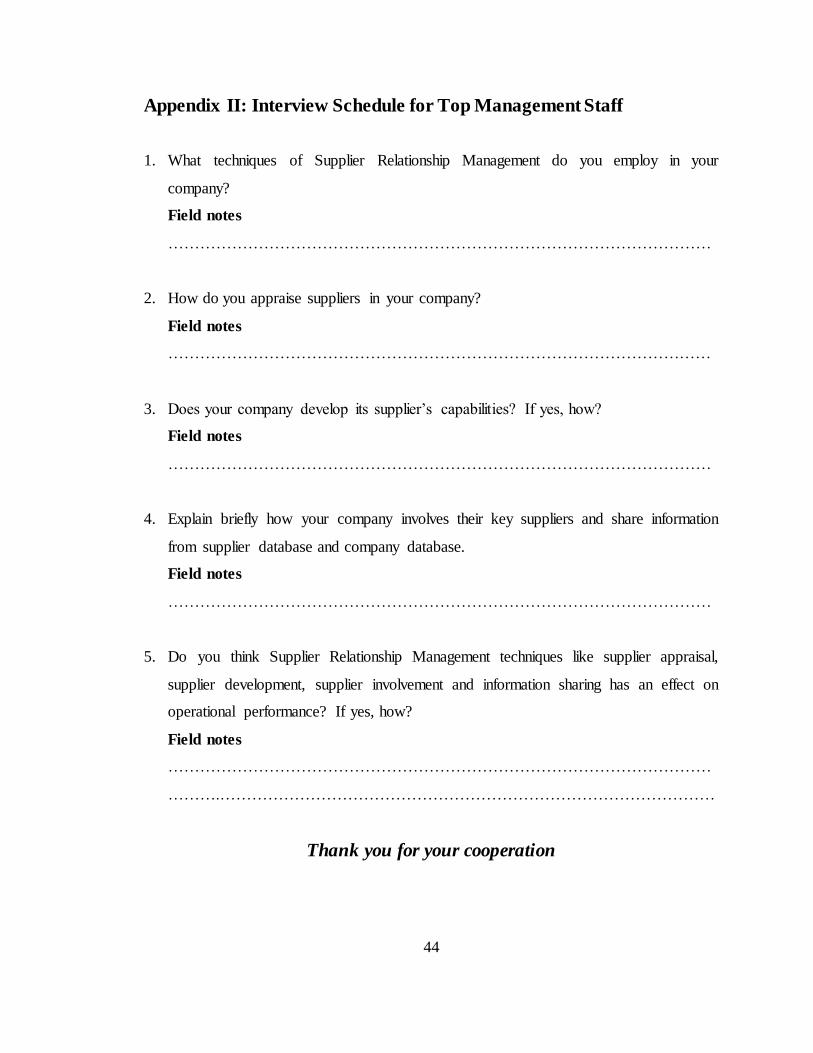
44
Appendix II: Interview Schedule for Top Management Staff
1. What techniques of Supplier Relationship Management do you employ in your
company?
Field notes
…………………………………………………………………………………………
2. How do you appraise suppliers in your company?
Field notes
…………………………………………………………………………………………
3. Does your company develop its supplier‟s capabilities? If yes, how?
Field notes
…………………………………………………………………………………………
4. Explain briefly how your company involves their key suppliers and share information
from supplier database and company database.
Field notes
…………………………………………………………………………………………
5. Do you think Supplier Relationship Management techniques like supplier appraisal,
supplier development, supplier involvement and information sharing has an effect on
operational performance? If yes, how?
Field notes
…………………………………………………………………………………………
……….…………………………………………………………………………………
Thank you for your cooperation
Related Documents