Supplementary Text Annotations status at the beginning of modENCODE At the beginning of modENCODE project, only 46% of the genes, 30% of transcripts, and 48% of exons were experimentally verified across their entire length. The annotation set that existed at the time was FlyBase version 2008_09 release 5.12 (FB5.12) 1 which we used as the starting point of our analysis. This annotation includes 15,139 genes, 22,258 transcripts, 68,739 exons, and 51,358 introns. Less than half (6,232) of the genes are well studied and named. The processed transcripts comprise 29,979,817 bp (21%) and span 78,919,140 bp (56%) of the assembled genome (Release 5; 139,731,881 bp) (Fig. 3c). Systematic experimental validation of these annotated features comes primarily from EST and cDNA sequences (reviewed in 2 ), which are biased toward abundantly expressed and moderately sized transcripts. FB5.12 contains 1,081 annotated ncRNA genes. Of these, 927 are named genes, primarily tRNAs, snoRNAs, snRNAs and miRNAs. The remaining 157 include both well-known and uncharacterized ncRNAs. From the total RNA-Seq data we detected expression of 171 of the 249 annotated snoRNAs, 14 of 32 annotated snRNAs, 115 of 292 annotated tRNAs, five of 11 annotated predicted non-coding RNAs 3 , one of 22 annotated mitochondrial tRNAs, 21 of 88 annotated miRNAs, 21 of 97 annotated RNAs (CR RNAs), seven of 40 annotated snmRNAs, as well as 7SLRNA and RNase P. Summary of RNA-Seq Experiments From the poly(A)+ RNA-Seq libraries sequenced on the Illumina GAIIx platform, a total of 3.5 billion reads (265 Gb of sequence) was generated comprising between 72 and 193 million reads from each of the 30 RNA samples (Supplementary Table 3). Between 51 and 112 million reads from each of the 30 samples were uniquely mapped to the genome (Release 5) or splice junctions (Methods) for a total of 2,286,173,597 mapped reads (171,180,620,475 bp) (Supplementary Table 3). From the total RNA-Seq libraries sequenced on the SOLiD platform, we generated between 5 and 9 million uniquely mapped reads for each time point for a total of 92,548,111 million mapped reads (4,627,405,550 bp) (Supplementary Table 4). In addition, we generated 3,225,745 single-end reads of ~250 bp (1,154,880,016 bp) using the Roche 454 platform from poly(A)+ RNA from mixed-stage embryos, adult males, and adult females (long poly(A)+ RNA-seq) (Supplementary Table 5). For the short poly(A)+ RNA-Seq experiments, replicate lanes are highly reproducible regardless of the laboratory in which the library was sequenced or whether single read or paired-end data were compared (average Pearson Correlation Coefficient (R)=0.99, tau > 0.94). The results described throughout the paper are derived from merging all lanes sequenced from each biological sample. Furthermore, there was high concordance between the RNA-Seq data and 38 bp tiling arrays when comparing annotated sequences (Supplementary Figure 6). WWW.NATURE.COM/NATURE | 1 SUPPLEMENTARY INFORMATION doi:10.1038/nature09715

Welcome message from author
This document is posted to help you gain knowledge. Please leave a comment to let me know what you think about it! Share it to your friends and learn new things together.
Transcript
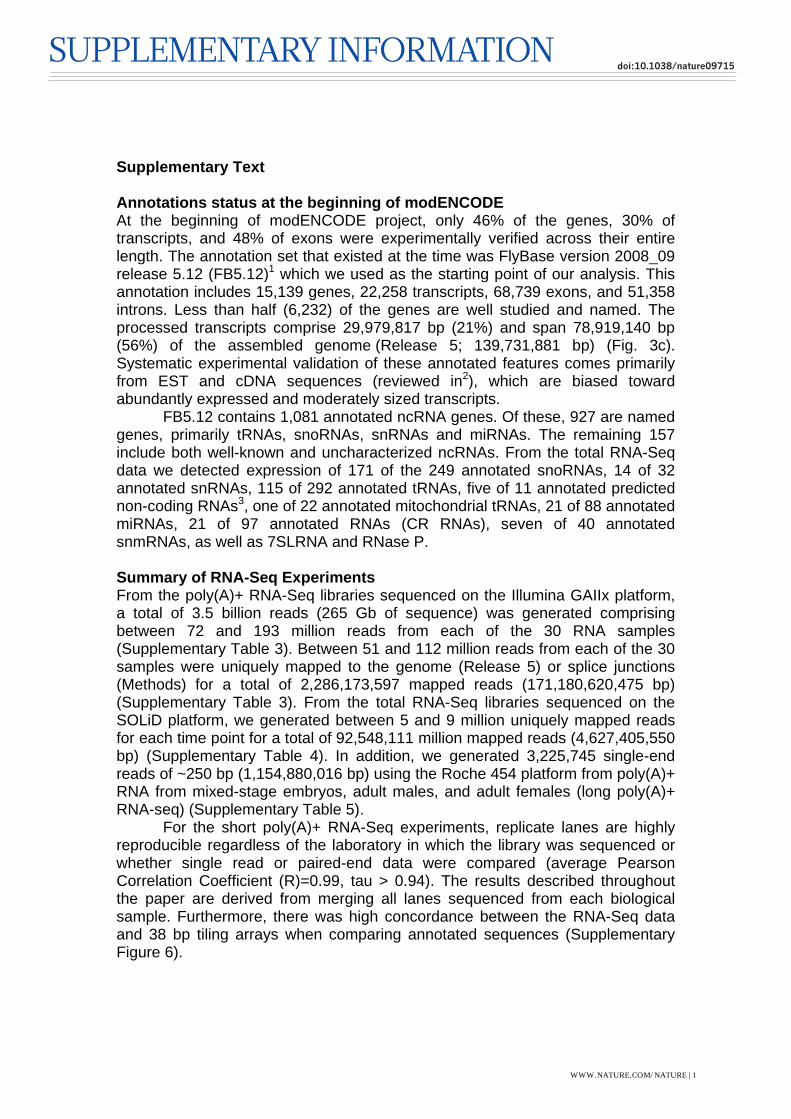
Supplementary Text Annotations status at the beginning of modENCODE At the beginning of modENCODE project, only 46% of the genes, 30% of transcripts, and 48% of exons were experimentally verified across their entire length. The annotation set that existed at the time was FlyBase version 2008_09 release 5.12 (FB5.12)1 which we used as the starting point of our analysis. This annotation includes 15,139 genes, 22,258 transcripts, 68,739 exons, and 51,358 introns. Less than half (6,232) of the genes are well studied and named. The processed transcripts comprise 29,979,817 bp (21%) and span 78,919,140 bp (56%) of the assembled genome (Release 5; 139,731,881 bp) (Fig. 3c). Systematic experimental validation of these annotated features comes primarily from EST and cDNA sequences (reviewed in2), which are biased toward abundantly expressed and moderately sized transcripts. FB5.12 contains 1,081 annotated ncRNA genes. Of these, 927 are named genes, primarily tRNAs, snoRNAs, snRNAs and miRNAs. The remaining 157 include both well-known and uncharacterized ncRNAs. From the total RNA-Seq data we detected expression of 171 of the 249 annotated snoRNAs, 14 of 32 annotated snRNAs, 115 of 292 annotated tRNAs, five of 11 annotated predicted non-coding RNAs3, one of 22 annotated mitochondrial tRNAs, 21 of 88 annotated miRNAs, 21 of 97 annotated RNAs (CR RNAs), seven of 40 annotated snmRNAs, as well as 7SLRNA and RNase P. Summary of RNA-Seq Experiments From the poly(A)+ RNA-Seq libraries sequenced on the Illumina GAIIx platform, a total of 3.5 billion reads (265 Gb of sequence) was generated comprising between 72 and 193 million reads from each of the 30 RNA samples (Supplementary Table 3). Between 51 and 112 million reads from each of the 30 samples were uniquely mapped to the genome (Release 5) or splice junctions (Methods) for a total of 2,286,173,597 mapped reads (171,180,620,475 bp) (Supplementary Table 3). From the total RNA-Seq libraries sequenced on the SOLiD platform, we generated between 5 and 9 million uniquely mapped reads for each time point for a total of 92,548,111 million mapped reads (4,627,405,550 bp) (Supplementary Table 4). In addition, we generated 3,225,745 single-end reads of ~250 bp (1,154,880,016 bp) using the Roche 454 platform from poly(A)+ RNA from mixed-stage embryos, adult males, and adult females (long poly(A)+ RNA-seq) (Supplementary Table 5).
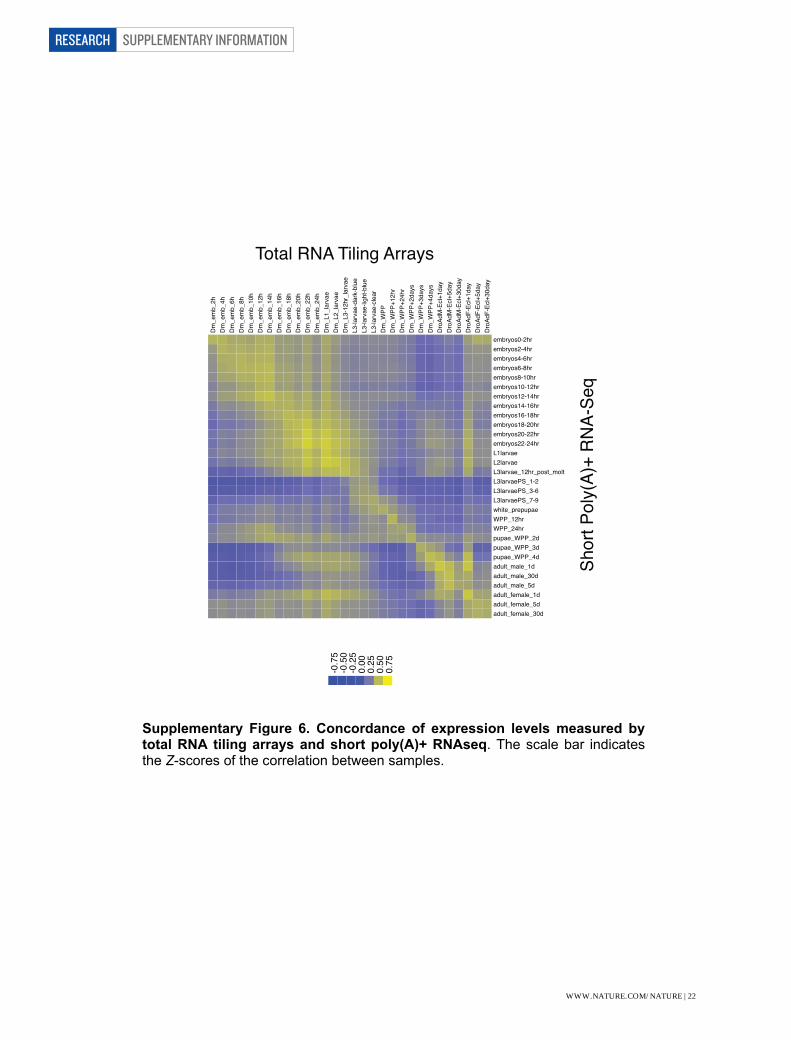
For the short poly(A)+ RNA-Seq experiments, replicate lanes are highly reproducible regardless of the laboratory in which the library was sequenced or whether single read or paired-end data were compared (average Pearson Correlation Coefficient (R)=0.99, tau > 0.94). The results described throughout the paper are derived from merging all lanes sequenced from each biological sample. Furthermore, there was high concordance between the RNA-Seq data and 38 bp tiling arrays when comparing annotated sequences (Supplementary Figure 6).
WWW.NATURE.COM/NATURE | 1
SUPPLEMENTARY INFORMATIONdoi:10.1038/nature09715

Transposable Elements Other annotated features that may be expressed include transposable elements (TE). Complete TEs and TE fragments comprise 7,450,875 bp or approximately 5% of the annotated genome4,5, the density being significantly higher in heterochromatin than euchromatin6,7. However, very few of these elements appear to be actively transposing8. Minimal evidence for expression has been obtained from EST sequencing. Expression is a function of cis-acting elements that reside within the TEs and some elements are expressed sex specifically. Embryonic spatial expression of TEs has been studied9,10 and shows restricted patterns. We observe measurable RPKM values at a given element is unknown as the number of expressed TEs is not known. As shown in Supplementary Figure 8, the expression of TEs shows stage-specificity. The highest overall expression element is TART-B, with especially high RPKM in adult female and embryonic stages. The copia element is distinguished by significantly higher expression in pupal stages, as is Tirant in adult female stages. The overall third highest RPKM element, Tom1, has only four annotated copies in the genome and the high RPKM values may be influenced by the low copy number. Splice Junction Discovery and Validation We used a variety of methods and the RNA-Seq data to predict novel splice junctions and then to evaluate the confidence level of those junctions. We aligned reads to databases of predicted splice junctions, and to models using TopHat14, STAR, and BLAT11. To identify new splice junctions we derived a set of metrics that could be used to distinguish true splice junctions from false positive splice junctions. First, we required a minimum of 6 nt overhang across a splice junction. Moreover, rather than requiring a specific number of reads to map to a given splice junction, we measured the entropy of the reads that mapped to the splice junction. The entropy score is a function of both the total number of reads that map to a given junction and the number of different offsets to which those reads map and the number that map at each offset. Thus, junctions with multiple reads mapping at each of the possible windows across the junction will be assigned a higher entropy score, than junctions where many reads map to only one or two positions. For this analysis we required that a junction have an entropy score of two or greater in at least two biological samples for junctions with canonical splice sites, and an entropy score of three or greater in at least three biological samples for junctions with non-canonical splice sites. Entropy was calculated using the following equations: pi = reads at offset i / total reads to junction window Entopy = - sumi(pi * log(pi) / log2)
We produced a total of ~79,400 high confidence junctions, ~29,000 of which are novel junctions. 259,628,732 reads map uniquely to splice junctions. Adult males, 5 days post eclosion express the largest number of unique junctions
WWW.NATURE.COM/NATURE | 2
SUPPLEMENTARY INFORMATIONRESEARCHdoi:10.1038/nature09715
(66,637) while 0-2 hour embryos express the fewest (40,945). The set of ~79K splice junctions was further filtered to exclude junctions with an intron length less than 41 nt, or that inadvertently join parologous genes. Junctions were also excluded if they had non-cannonical splice sites with the exception of those that were previously annotated or had other experimental support. This yielded a final set of 67,317 high confidence splice junctions in the short poly(A)+ RNA-Seq data that correspond to 46,566 (93%) FB5.12 annotated splice junctions and 20,751 new splice junctions.
In addition, we identified 32,917 splice junctions from the 454 data of which 28,860 (87.6%) correspond to FB5.12 annotated splice junctions and 4,057 new splice junctions. We amplified and sequenced 2,589 RT-PCR products and cloned and sequenced 3,204 cDNAs to validate splice junctions and exons discovered in the short and long poly(A)+ RNA-Seq datasets and annotated junctions that had previously not been experimentally validated. We confirmed 45,153 annotated FB5.12 junctions and validated 4,008 new splice junctions. Importantly, we identified 1,643 new splice junctions in the cDNA, EST, and RT-PCR datasets, highlighting the value of focused validation of transcript models. Conserved splicing patterns are a powerful indication that a particular junction is functional. We therefore performed short poly(A)+ RNA-Seq on transcript rich adult heads for D. mojavensis or D. pseudoobscura (Supplementary Table 31). 1,647 of the splice junctions are supported by the species RNA-Seq data (Supplementary Table 32)
There are 3,168 junctions from 1,853 gene models that were not detected. Only 299 are named and well-characterized genes such as the odorant or gustatory receptor family genes. It remains to be seen how many of these predicted genes and transcripts will ultimately be retained in a reannotated genome. Analysis of Novel Transcripts via Interspecific Comparison We characterized the NTRs using a comparative genomics approach. We identified 1,229 NTRs (containing 1,262 transcripts) that did not overlap FB 5.12, 67 were validated with cDNA evidence, 126 were novel annotations included in MB8 or FlyBase 5.23, and the remaining 1,037 were novel transcribed regions identified by Cufflinks12. 291 start with a methionine codon and end with a stop-codon, 190 have a start-codon but lack a stop-codon, and 41 lack a start-codon but have a stop-codon. We compared their patterns of sequence divergence to randomly extracted genomic sequence (see Methods). We compared Kimura 2 parameter corrected genetic distance13 between D. melanogaster and its sibling species, D. simulans (2.5-5.4 MYD)14, for identifiable NTR longest transcript orthologs (1070) and performed the same analysis on 5,000 randomly extracted orthologous coding exonic, intronic, and intergenic sequences, the size distribution of each of which was chosen to match the pooled size distribution of all NTRs (see Methods). We found that the distributions of the pairwise divergence estimates of randomly extracted sequence are significantly different from one another and follow a pattern of divergence expected from the proportion of functional sequence they contain: exons < introns < intergenic sequence
WWW.NATURE.COM/NATURE | 3
SUPPLEMENTARY INFORMATIONRESEARCHdoi:10.1038/nature09715
(pairwise permuted Kruskal-Wallis test, P < 2.2 × 10⁻¹⁶; note that all pairwise tests are Bonferroni corrected) (Figure 1A). NTRs are significantly more conserved than both random intergenic or intronic sequence (P < 2.2 × 10⁻¹⁶). While not as highly conserved as random coding exon sequence, our results suggest that NTRs are constrained.
In addition to testing for sequence conservation, we assessed whether the NTRs detected in D. melanogaster were also expressed in other, distantly related Drosophila species. Whereas expression of non-functional NTRs due to phenomena such as adventitious promoters and stably accessible chromatin confirmation may be detectable in closely-related species due to lack of sufficient sequence divergence 15, it is likely that such NTRs would degenerate neutrally and disappear given sufficient evolutionary time. We used RNA-seq data generated from dissected adult heads of D. pseudoobscura (25-55 million years diverged [MYD])16 and D. mojavensis (~60 MYD)17, and assessed expression of sequences orthologous to the D. melanogaster NTRs. We identified orthologous genomic regions corresponding to the 1,262 NTR transcripts in D. melanogaster (see Methods)11, resulting in 952 and 802 orthologs being identified in D. pseudoobscura and D. mojavensis, respectively.
We then mapped the RNA-seq reads generated from dissected heads of the three species to their respective genomes and determined the level of expression of each NTR transcript in terms of FPKM (see Methods) using a minimum of FPKM > 1. Using this threshold, 295 and 185 transcripts were detected in the heads of both D. melanogaster and D. pseudoobscura, or D. mojavensis; 148 transcripts were detectibly expressed in the heads of all three species). We performed pairwise comparisons of the mean log2 transformed (FPKM + 1) expression level estimates between D. melanogaster and each of the two other species for the orthologous NTR transcripts detected in all three species in order to determine whether NTRs showed conserved levels of expression among different species (Supplementary Figure 4c,d). FPKMs were significantly correlated in both pairwise comparisons, with higher coefficients of correlation in the comparisons between D. melanogaster and D. pseudoobscura, as compared to the former and D. mojavensis, as is expected based on phylogenetic distance (Spearman correlation test, ρ = 0.652 and 0.534, P = 2.2 ×
10-16 and = 2.2 × 10⁻¹⁶ for the comparison between D. melanogaster and D. pseudoobscura or D. mojavensis, respectively). Feature validation in other Drosophila species: Validation of Exons We used RNA-Seq results from two non-melanogaster species to provide supporting evidence of biological function of all exons, both novel and annotated. Reads from RNA-Seq experiments on D. melanogaster, D. pseudoobscura and D. mojavensis male and female dissected heads (described in GEO entries GSE20348, GSE19989 and GSE20882 respectively) were mapped to their respective genomes using Tophat12 accepting only uniquely-mapped reads (Supplementary Table 31). (Unique mapping was performed. Complete parameters supplied to Tophat: (-g 1 -F 0 -G [FB5.28 (D.mel), r1.3 (D.moj), r2.10
WWW.NATURE.COM/NATURE | 4
SUPPLEMENTARY INFORMATIONRESEARCHdoi:10.1038/nature09715
(D.pse)] --solexa1.3quals). Genomic coordinates of each putative exon in D. pseudoobscura (DP4/FB r.2 assembly) and D. mojavensis (droMoj3, FB r.1 assembly) were obtained using the UCSC genome browser liftover tool 18. Liftover coordinates were filtered to exclude spurious mappings, removing mappings that spanned less than half, or more than double, the range of the D. melanogaster exon. After filtering, 88.7% of D. melanogaster exons were successfully lifted-over to D. pseudoobscura, and 81.4% lifted-over to D. mojavensis. To estimate expression of exons in the other species, we used BedTools 19 to intersect genomic coordinates with base-level read coverage produced by Tophat. These results were parsed to quantify the read coverage for each lifted-over region. The percent of the non-melanogaster lifted-over region with coverage >= 1 (in either sex) was used as the metric to define 'validation,' or evidence of conserved expression, with a conservative cutoff of 95%. The complete list of annotated exons was first examined in D. melanogaster heads, and exons that that detected by the threshold of 95% of exon length with coverage >= 1 in either sex were then compared to the other species. Overall, 60.7% and 73.4% of all exons expressed in D. melanogaster heads showed conservation of expression in D.pseudoobscura and D.mojavensis, respectively. Putative novel exons less frequently validated than annotated ones, with 51.9% novel exons showing conservation of expression in either species. Validation of Splice Junctions Biological validation for splicing was performed by comparing Tophat predicted splice junctions. Tophat results were obtained as described above for D. pseudoobscura, D. mojavensis, and D. melanogaster. Splice junctions detected by Tophat in D. melanogaster heads were used to find the corresponding junction region in the other species using the liftover tool18 with the junction spanning region from the D. melanogaster "junctions.bed" file. Thus, each junction examined was detected in D. melanogaster heads. These results were then filtered to include only those splice junctions included in the junction database used to analyze the developmental timecourse. A junction was considered validated if at least one junction-spanning read was present in male or female heads of another species. A summary of these results is presented in Supplementary Table 32. Most splice junctions annotated in FB5.12 are detected in at least one other species (78.3%). These data provide support for 1,647 putative novel splice junctions, although these validate with a smaller percentage (31.8%). Analysis of Expression Dynamics To understand the dynamics of gene expression over the developmental time course we clustered genes using a fuzzy c-means clustering algorithm20. We identified 20 distinct clusters representing a variety of developmental gene expression patterns (Supplementary Fig. 11). By analyzing genes that were predominantly associated with each cluster, we identified between 113 and 2,573
WWW.NATURE.COM/NATURE | 5
SUPPLEMENTARY INFORMATIONRESEARCHdoi:10.1038/nature09715

(mean = 677) genes in each cluster (Supplementary Table 33). We found that clusters 1-7 are strongly associated with early-to-mid embryogenesis and adult females, the latter likely the result of our profiling of whole-body adult females containing a substantial amount of oocytes. Clusters 11-17 appear to be primarily associated with late embryogenesis and the larval stage, though several of these show significant peaks of expression during later stages as well. Clusters 18-20 show low expression during early development followed by a monotonic increase in expression level terminating in adult males – and no significant expression in adult females.
The female-biased or -specific genes are known to be enriched for expression in the ovary and larval CNS28,21, suggesting that most have ovary specific functions and/or have pleiotropic functions throughout development. Genes with male-biased or -specific expression tended to be single transcript genes and from array studies are expressed in the testis, brain and larval CNS28,21. Expression Dynamics of Non-Coding RNAs Expression of the new ncRNAs ranges between FPKM 0.16 and 24,000 and displays a median fold-increase throughout embryogenesis of 6.5 and a maximum of 300.
We also examined the expression dynamics of 1026 putative non-coding RNAs among the new transcribed regions (NTRs). These transcripts have similar expression profiles as putative protein-coding NTRs, and also tend to be observed in male-specific stages (Supplementary Fig. 12).
As most non-coding RNAs are not polyadenylated, they can easily be missed by examining the poly(A)+ fraction alone. We detected expression for 838 non-coding RNAs in the SOLiD total RNA-seq data, of which only half (405) are also detected in the poly(A)+ RNA-seq despite the fact that the poly(A)+ samples had more than twice as many time points and stages. In particular, the snRNAs, snoRNAs, and tRNAs are highly expressed and only detectable by total RNA-seq (Supplementary Figs. 12 and 13). We expect to find hundreds more non-coding RNAs by interrogating Total RNA in more stages of development.
WWW.NATURE.COM/NATURE | 6
SUPPLEMENTARY INFORMATIONRESEARCHdoi:10.1038/nature09715

SUPPLEMENTARY METHODS Animal Staging and Collection The Drosophila melanogaster isogenic sequenced8 strain y1; cn bw1 sp1 was used for the majority of our studies. Population cages were maintained at 24˚C on a 24-hour light cycle (14 hours light/10 hours dark). Embryos were collected from the cages on plates (3.3% agar, 13% unsulfured molasses, and 0.15% Tegasept) at 2-hour intervals during a light cycle and aged at 24º for the required period. Aged embryos were passed through an 850 µm screen, and collected on a 75 µm screen, then dechorionated by treatment with 50% bleach (3% sodium hypochlorite), 0.2% NaCl, and 0.02% Triton-X-100 for five minutes and washed twice with 0.2% NaCl, 0.02% Triton buffer. For quality control, approximately 5% of the sample was removed, fixed 22 and staged 23,24. The remainder was rinsed with water under mild vacuum, frozen on dry ice and stored at -80˚C.
For the larval stages, a 2-hr embryo collection was aged 20 hr. The larvae were allowed to feed until harvesting 42-44 hr after egg-lay (L1), 66-70 hr after egg-lay (L2), or 83-85 hr after egg-lay (L3+12 hr), using the same procedure used for embryos, without dechorionation.
Later L3 stages were collected by culturing larvae in fly food supplemented with 0.05% bromophenol blue to mark the guts of feeding animals 25. Wandering larvae were collected at gut stage 1 (dark blue gut), 2 (light blue gut), or 3 (clear gut), corresponding to puff stages 1, 2-6, and 7-9, respectively 26.
Prepupae, pupae, and adults were collected from bottles containing standard medium. White prepupae were collected from the walls of the bottles. For later prepupal and pupal stages the positions of white prepupae in bottles were marked, then these animals were aged for 12 hr, 1, 2, 3, or 4 days.
Adults were either collected immediately after eclosion (adults eclosion + 1 day), or transferred to fresh bottles and aged for 4 (eclosion + 5 days) or 29 days (eclosion + 30 days).
RNA extraction from whole animals Frozen samples were homogenized and extracted using the TRIzol reagent protocol (Invitrogen). RNA was purified on an RNeasy spin column (Qiagen), and DNase treated. poly(A)+ RNA was prepared from 250-500 µg aliquots, using the Oligotex mRNA Midi kit (Qiagen). RNA sample quality was assessed by Northern blots probed with RpL11-RA. RNA samples were stored at -80. Affymetrix Tiling Arrays RNA from three biological replicates of each developmental sample was independently hybridized on 38-bp Affymetrix arrays (Affymetrix GeneChip® Drosophila Tiling 2.0R Array), using standard procedures 27. Raw signals from the replicates were combined and smoothed using a 3-probe sliding window (bandwidth=50), with the intensity of each probe calculated as its background-corrected pseudomedian. Transcribed fragments (transfrags) were classified and “gene expression scores” for both novel transfrags and annotated exons calculated as described previously28.
WWW.NATURE.COM/NATURE | 7
SUPPLEMENTARY INFORMATIONRESEARCHdoi:10.1038/nature09715

Illumina Library Preparations and Sequencing Libraries were generated using the mRNA-Seq preparation kit as recommended by the manufacturer (Illumina) and sequenced on the Illumina Genome Analyzer IIx using either single or paired-end chemistry and 75-76 bp cycles per read. SOLiD Library Preparations and Sequencing To construct libraries for SOLiD sequencing, total RNA was treated with the RiboMinusTM Eukaryote Kit for RNA-Seq (Invitrogen); although the treatment failed to give significant depletion of ribosomal RNA. The samples were fragmented and ligated with SOLiD-specific adaptors using SOLiD Whole Transcriptome Analysis Kit (Ambion). Twelve samples were uniquely barcoded during PCR amplification using SOLiD Multiplexing Kit (Ambion). Sequencing was carried out to 50 bases using SOLiD V3 chemistry. 454 Library construction and Sequencing For 454 sequencing, poly(A)+ RNA from male and female Oregon R adults and mixed-staged y1; cn bw1 sp1 embryos was used. mRNA was fragmented and first strand cDNA made using of Superscript II enzyme (Invitrogen Corporation, Carlsbad, CA). After ligation of adaptors the ligated material was recovered using Sera-Mag 30 beads (Seradyn Inc, Indianapolis, IN). The sscDNA libraries were purified with RNAClean and quantified with the Quant iT Ribogreen RNA Assay Kit (Invitrogen Corporation, Carlsbad, CA) on a Synergy HT (Bio Tek Instruments Inc, Winooski, VT) instrument. The libraries were taken through emulsion PCR with both kit II and kit III reagents (Roche/454 Life Sciences, Branford, CT) allowing for bidirectional sequencing of the library fragments. A total of three sequencing runs were performed on a Genome Sequencer FLX instrument (Roche/454 Life Sciences). Targeted RT-PCR and cDNA Isolation and Sequencing Standard procedures were used for RT-PCR 3. Targeted cDNA isolation and sequencing was performed as described previously 29. ANALYSIS Identification of Unannotated Transcribed Regions from RNA-Seq Data We used Cufflinks 12 to identify regions of active transcription that do not overlap, nor are directly adjacent to existing gene annotations. In total, we identified 5,636 NTRs, of which 2,428 show evidence of being spliced to existing, annotated transcripts, and thus likely represent previously unannotated exons or untranslated regions (UTRs) within existing transcripts. Those NTRs that showed no evidence of splicing association with existing transcripts were collapsed into transcripts themselves, based on whether they possessed splice junction-spanning reads connecting them to one another (658 the remaining 3208 NTRs possessed such junction spanning reads). We therefore collapsed NTRs with evidence of splice junctions into 2,879 transcripts, of which 1,269 fall within the
WWW.NATURE.COM/NATURE | 8
SUPPLEMENTARY INFORMATIONRESEARCHdoi:10.1038/nature09715
introns of annotated genes, while the remaining 1,610 lie within intergenic segments. Identification of NTR Orthologs We identified orthologs to individual NTRs within the genomes of D. simulans (University of California at Santa Cruz [UCSC] Genome Browser release DroSim1), D. pseudoobscura (UCSC Genome Browser release dp4), and D. mojavensis (UCSC Genome Browser release droMoj3) using the UCSC Genome Browser LiftOver tool with default parameters18. We rejected any ortholog whose length in base pairs was greater or equal than 2-fold, or less than or equal to 1/2 that of D. melanogaster. The remaining individual exons identified in other species were then reassembled into transcripts based on splicing evidence from D. melanogaster. We further retained only those orthologous NTRs where all exons identified in D. melanogaster could be identified under the conditions listed above in the other species. Orthologs for 1,070, 981, and 836 NTR transcripts were detected in D. simulans, D. pseudoobscura, and D. mojavensis, respectively. Sequence Divergence Analysis We obtained the complete list of predicted coding exons, introns, and intergenic sequence according to the FB5.12 annotation and extracted random sequences matching the same size distribution the NTRs using a custom PERL script. We then used the UCSC liftover tool to obtain orthologous coordinates for 5,000 random sequences in each category. We aligned the orthologous D. melanogaster and D. simulans sequences for each of the random sequences as well as the three categories of novels using Dialign-TX 30 and then calculate pairwise Kimura 2-Parameter genetic distances for each pair of sequences using the APE package in R31. Interspecific Expression Profile Analysis We collected RNA-Seq data from dissected head tissue of eight day old males and females of D. melanogaster (OregonR), D. pseudoobscura (14011-0121.94), and D. mojavensis (15081-1352.22) using the Illumina GAII platform. A single biological sample of male and female reads were pooled before analysis, resulting in 77.1 million high quality 75 bp reads from D. melanogaster, 86.6 million high quality reads for D. pseudoobscura, and 114 million high quality reads for D. mojavensis (full information regarding procedures can be found in GEO Series numbers GSE20348, GSE19989, and GSE20882). The reads were mapped to the genomes of the species from which they were obtained using Tophat32, version 1.0.13, using the parameters "-F 0 -i 40 –solexa1.3quals -g 1", thus retaining de novo splice junction predictions derived from uniquely mapping reads. The output from Tophat was then used as input for Cufflinks12, version 0.8.3, with default parameters, and constraining the isoform abundance estimates, Fragments per Kilobase per Million Mapped reads (FPKM), to a Gene Transfer Format (GTF) file containing the NTRs - or their orthologs in the case of non-D. melanogaster species. Restricting our analysis
WWW.NATURE.COM/NATURE | 9
SUPPLEMENTARY INFORMATIONRESEARCHdoi:10.1038/nature09715
only to those NTRs detectibly expressed in the head data (FPKM > 1), we detected 364, 295, and 185 NTRs in D. melanogaster, D. pseudoobscura, and D. mojavensis heads, respectively. Gene Model Annotation Our new models include FB5.23 annotations, N-SCAN-EST33 and PASA34 gene predictions, as well as alternate transcripts based on cDNA clusters and Cufflinks transcript models. N-SCAN-EST gene predictions33 were done on the whole genome, but only the predictions that did not overlap any FlyBase annotation were kept. To generate PASA clusters, ESTs and full insert cDNAs were obtained from GenBank and any vector sequence removed. They were clustered using the PASA pipeline, which aligns sequences to the genome, validates the splice sites, and keeps alignments that have at least 90% identity to the genome over 90% of their length. These alignments are clustered into non-redundant pseudo transcripts, which can then be used to extend and alter genome annotations34. PASA also determines open reading frames for clusters that contain a full insert cDNA. If these annotations were not part of the FB5.23 set, or predicted by N-SCAN, they were added. The PASA clusters were also used to extend UTRs and add alternative splices to the N-SCAN predictions, and to the FB5.23 annotations for protein coding genes. Noncoding blocks from FB 5.23 that overlapped a gene prediction were designated as noncoding genes and employed the gene structure of the underlying gene prediction. Transcripts were assigned a confidence score based on available cDNA evidence. Annotations that were confirmed by a full insert cDNA have a lower confidence score than ones that are only partially confirmed by a PASA cluster. Known and predicted coding and noncoding gene and transcript models were assembled into a single gtf file (Supplementary Table 34). TE expression Illumina reads mapped to annotated TE regions were tabulated and each TE instance a was assigned a score equaling the reciprocal of the number of times that read was mapped. For each developmental sample, the scores were summed among all instances of each TE to determine an expression score for each class. Each score was divided by the total length (in kb) of annotated sequence for each class and the number of mapped reads. Identification of new non-coding RNAs Potential miRNA precursors were identified by manually inspecting the genomic loci containing each miRNA annotated in miRBase v15 on a genome browser. The coordinates of continuous regions of coverage of the short total RNA-Seq data that spanned the annotated miRNAs were were used in Cufflinks to calculate the expression level of each potential miRNA precursor. The snoRNA-like RNAs were discovered by identifying regions of the genome with continuous coverage from the short total RNA-Seq data that did not overlap annotated exons. FPKM levels were calculated from these intervals using Cufflinks for each of the 12 samples. Intervals with an average FPKM >20
WWW.NATURE.COM/NATURE | 10
SUPPLEMENTARY INFORMATIONRESEARCHdoi:10.1038/nature09715
were manually inspected on a genome browser and the boundaries refined based on the coverage in the RNA-Seq data. MFold35 was used determine the presence of known snoRNA motifs.
RNA Editing Short poly(A)+ RNA-Seq reads which mapped to annotated transcripts were compared to the reference sequence to find instances in which a 'G' aligned to an 'A' (for plus strand transcripts) or a 'C' aligned to a 'T' (for minus strand). We examined all but the first or last six base pairs of each read as an empirical inspection of the bases in these positions showed that they were easily mismapped to introns rather than across splice junctions.
We required at least five reads from each developmental sample to show a substitution to be considered further. Each site was examined to count the number of reads that aligned to the site with an exact nucleotide match. We created a dataset of potential editing sites with the number of edited reads and the number of non-edited read for each sample. Potential editing sites were defined as having at least 5% of the reads in two adult samples showing evidence of editing, and, to prevent a polymorphism in the sequenced strain from being reported as editing, at least 100 reads having an exact match to the genome. Expression levels and ratios of edited reads were mapped in rank order. The complete list of editing sites is included in the Supplementary materials.
Identifying alternatively spliced exons The Junction Based Analysis of Splicing Events (JuncBASE) package36 was used to identify the following alternative splicing events: cassette exon, alternative 5’ splice sites, alternative 3’ splice sites, alternative first exon, alternative last exon, mutually exclusive exons, intron retention and coordinate cassette exons36. These events were counted as follows: Cassette Exon: The number of cassette exons in the reference annotation or "new" is shown in Table 2. Each cassette exon is considered a separate cassette exon event. Alternative 5' Splice Sites, Alternative 3' splice sites, Alternative First Exons, and Alternative Last Exon Events: These alternative events were grouped by an "anchor" splice site. For example, alternative donor events were assumed to have the same acceptor site ("anchor" splice site) and grouped together in this way. The number of total splicing events in a group is equal to the number of introns involved in the group - 1. This is due to the method of calculating PSI values, where every proximal alternative splice site (inclusion isoform) is compared to more distal splice sites (exclusion isoform(s)). When comparing events between two different annotation sets, the same group of introns, with the same anchor splice site, were compared. If both annotation sets had the same anchor point, then identical introns were not considered and the remaining intron(s) equaled the number of "novel" event(s). If the reference (FB5.12)
WWW.NATURE.COM/NATURE | 11
SUPPLEMENTARY INFORMATIONRESEARCHdoi:10.1038/nature09715

annotation did not have the same anchor point, then the number of new events was equal to the number of events in the "new" annotation (number of introns in the event - 1). Mutually exclusive exons: The number of exons involved in a mutually exclusive exon event is shown in Table 2. "New" mutually exclusive exons were exons that were not part of a mutually exclusive event in the reference annotation (FlyBase r5.12). n.b. If there was evidence of an isoform that skipped all exons in a mutually exclusive event, it was still considered mutually exclusive. "Percent spliced in" (PSI) values were calculated by treating each mutually exclusive exon as an inclusion isoform of an event and all other exons in the event as possible exclusion isoforms. If there are only two exons involved in a mutually exclusive event, then a PSI was calculated for only one of the exons. Coordinate cassette exons: The number of exons involved in a coordinate cassette exon event is shown in Table 2. "New" coordinate cassette exons are exons that were not part of a coordinate cassette exon event in the reference annotation (FB5.12). A PSI was calculated for all observed coordinate cassette exon events given a set of exons. For example, there may be four consecutive exons that have evidence that all are skipped but also evidence of additional events with a subset (2 or 3 of the 4) of exons that are included while the rest are skipped. Intron Retention: The number of introns that show evidence of intron retention is given in Table 2. Intron retention events observed in the RNA-Seq data, and subsequently incorporated into the modENCODE annotation, cannot be distinguished between unprocessed RNA; therefore we report two numbers for the modENCODE intron retention events and the short read poly(A)+ RNA-Seq data: (1) intron retention events that are present in either FlyBase or from modENCODE cDNAs (2) All intron retention events. JuncBASE was also used to identify exons that were differentially spliced. Read counts to every exclusion and inclusion isoform from each alternative splicing event for each developmental sample were obtained from JuncBASE and subsequently used to perform pairwise comparisons of differential splicing between samples. Fisher's exact test was used to identify differential splicing between each pair of samples and a Benjamini-Hochberg correction was performed for all pairwise comparisons within each type of splicing event. Exon Conservation Analysis To analyze and compare the conservation of constitutive and cassette exons, we extracted the PhastCons scores of each individual exon >50 bp and calculated the average PhastCons score at each nt position across the exons within each class. Clustering alternatively spliced exons
WWW.NATURE.COM/NATURE | 12
SUPPLEMENTARY INFORMATIONRESEARCHdoi:10.1038/nature09715
For each alternatively spliced exon and for each sample, a percent spliced in (PSI) was calculated: PSI = (number of reads to inclusion isoform)/(number of reads to inclusion isoform + number of reads to exclusion isoform). The PSI was calculated only for events that had a total read count > 25. The delta PSI for an event was the difference between the highest and lowest PSI across all time points. For clustering analysis, a Z-score for each event was calculated. A negative Z-score is interpreted as an exon that is more skipped when compared to the average PSI and a positive Z-score corresponds to an exon that is more included when compared to the average PSI. We performed hierarchical clustering with optimal leaf ordering [ref: K-ary clustering with optimal leaf ordering for gene expression data. Bar-Joseph et al. Bioinformatics 2003]. Clusters were viewed with Java TreeView (http://jtreeview.sourceforge.net/). GO analysis was performed using Funcassociate 2.037.
WWW.NATURE.COM/NATURE | 13
SUPPLEMENTARY INFORMATIONRESEARCHdoi:10.1038/nature09715

SUPPLEMENTARY REFERENCES 1 Drysdale, R. FlyBase : a database for the Drosophila research community.
Methods Mol Biol 420, 45-59, (2008). 2 Celniker, S. E. & Rubin, G. M. The Drosophila melanogaster genome.
Annu Rev Genomics Hum Genet 4, 89-117 (2003). 3 Yandell, M. et al. A computational and experimental approach to validating
annotations and gene predictions in the Drosophila melanogaster genome. Proc Natl Acad Sci U S A 102, 1566-1571 (2005).
4 Kaminker, J. et al. The transposable elements of the Drosophila melanogaster euchromatin - a genomics perspective. Genome Biology 3, research0084 (2002).
5 Quesneville, H. et al. Combined evidence annotation of transposable elements in genome sequences. PLoS Comput Biol 1, 166-175, doi:10.1371/journal.pcbi.0010022 (2005).
6 Hoskins, R. A. et al. Heterochromatic sequences in a Drosophila whole genome shotgun assembly. Genome Biology 3, research0085 (2002).
7 Smith, C. D., Shu, S., Mungall, C. J. & Karpen, G. H. The Release 5.1 annotation of Drosophila melanogaster heterochromatin. Science 316, 1586-1591, (2007).
8 Celniker, S. E. et al. Finishing a whole genome shotgun: Release 3 of the Drosophila melanogaster euchromatic genome sequence. Genome Biology 3, research0079 (2002).
9 Parkhurst, S. M. & Corces, V. G. Developmental expression of Drosophila melanogaster retrovirus-like transposable elements. EMBO J 6, 419-424 (1987).
10 Ding, D. & Lipshitz, H. D. Spatially regulated expression of retrovirus-like transposons during Drosophila melanogaster embryogenesis. Genet Res 64, 167-181 (1994).
11 Kent, W. J. BLAT--the BLAST-like alignment tool. Genome Res 12, 656-664, (2002).
12 Trapnell, C. et al. Transcript assembly and quantification by RNA-Seq reveals unannotated transcripts and isoform switching during cell differentiation. Nat Biotechnol 28, 511-515, (2010).
13 Kimura, M. A simple method for estimating evolutionary rates of base substitutions through comparative studies of nucleotide sequences. J Mol Evol 16, 111-120 (1980).
14 Tamura, K., Subramanian, S. & Kumar, S. Temporal patterns of fruit fly (Drosophila) evolution revealed by mutation clocks. Mol Biol Evol 21, 36-44, (2004).
15 Khaitovich, P. et al. Functionality of intergenic transcription: an evolutionary comparison. PLoS Genet 2, e171, (2006).
16 Richards, S. et al. Comparative genome sequencing of Drosophila pseudoobscura: chromosomal, gene, and cis-element evolution. Genome Res 15, 1-18, (2005).
17 Hahn, M. W., Han, M. V. & Han, S. G. Gene family evolution across 12 Drosophila genomes. PLoS Genet 3, e197, (2007).
WWW.NATURE.COM/NATURE | 14
SUPPLEMENTARY INFORMATIONRESEARCHdoi:10.1038/nature09715
18 Rhead, B. et al. The UCSC Genome Browser database: update 2010. Nucleic Acids Res 38, D613-619, (2010).
19 Quinlan, A. R. & Hall, I. M. BEDTools: a flexible suite of utilities for comparing genomic features. Bioinformatics 26, 841-842, (2010).
20 Bezdek, J. C. Pattern recognition with fuzzy objective function algorithms. (Plenum Press, 1981).
21 Chintapalli, V. R., Wang, J. & Dow, J. A. Using FlyAtlas to identify better Drosophila melanogaster models of human disease. Nat Genet 39, 715-720, (2007).
22 Matthews, K. A., Miller, D. F. & Kaufman, T. C. Functional implications of the unusual spatial distribution of a minor alpha-tubulin isotype in Drosophila: a common thread among chordotonal ligaments, developing muscle, and testis cyst cells. Dev Biol 137, 171-183, (1990).
23 Hartenstein, V. & Campos-Ortega, J. A. The embryonic development of Drosophila melanogaster. Second edition edn, (Springer-Verlag Berlin, 1997).
24 Wilson, R. J., Goodman, J. L. & Strelets, V. B. FlyBase: integration and improvements to query tools. Nucleic Acids Res 36, D588-593, (2008).
25 Maroni, G. & Stamey, S. Use of blue food to select synchronous, late third-instar larvae. Drosophila Inf. Serv. 59, 142-143 (1983).
26 Andres, A. J. & Thummel, C. S. Methods for quantitative analysis of transcription in larvae and prepupae. Methods Cell Biol 44, 565-573 (1994).
27 Manak, J. R. et al. Biological function of unannotated transcription during the early development of Drosophila melanogaster. Nat Genet 38, 1151-1158 (2006).
28 Cherbas, L. The Transcriptional Diversity of 25 Drosophila Cell Lines. Genome Res (2010).
29 Wan, K. H. et al. High-throughput plasmid cDNA library screening. Nat Protoc 1, 624-632 (2006).
30 Subramanian, A. R., Kaufmann, M. & Morgenstern, B. DIALIGN-TX: greedy and progressive approaches for segment-based multiple sequence alignment. Algorithms Mol Biol 3, 6, (2008).
31 Paradis, E., Claude, J. & Strimmer, K. APE: Analyses of Phylogenetics and Evolution in R language. Bioinformatics 20, 289-290 (2004).
32 Trapnell, C., Pachter, L. & Salzberg, S. L. TopHat: discovering splice junctions with RNA-Seq. Bioinformatics (2009).
33 Wei, C. & Brent, M. R. Using ESTs to improve the accuracy of de novo gene prediction. BMC Bioinformatics 7, 327, (2006).
34 Haas, B. J. et al. Improving the Arabidopsis genome annotation using maximal transcript alignment assemblies. Nucleic Acids Res 31, 5654-5666 (2003).
35 Zuker, M. Mfold web server for nucleic acid folding and hybridization prediction. Nucleic Acids Res 31, 3406-3415 (2003).
36 Brooks, A. N. et al. Conservation of an RNA Regulatory Map between Drosophila and Mammals. . Genome Research (2010).
WWW.NATURE.COM/NATURE | 15
SUPPLEMENTARY INFORMATIONRESEARCHdoi:10.1038/nature09715

37 Berriz, G. F., Beaver, J. E., Cenik, C., Tasan, M. & Roth, F. P. Next generation software for functional trend analysis. Bioinformatics 25, 3043-3044, (2009).
WWW.NATURE.COM/NATURE | 16
SUPPLEMENTARY INFORMATIONRESEARCHdoi:10.1038/nature09715
SUPPLEMENTARY INFORMATION RESEARCH
!"##$%&%'()*+,-./"*%,0
1*)2%$%+!"#!$%&
,
,
3 04 03 54 53 64 63 74
3
04
03
54
53
64
63
74 485
486
487
483
489
48:
48;
48<
0
=&>*+? @)*2)% A"#)% B - =&>*+?
C?()$,DEF A?$+GFH
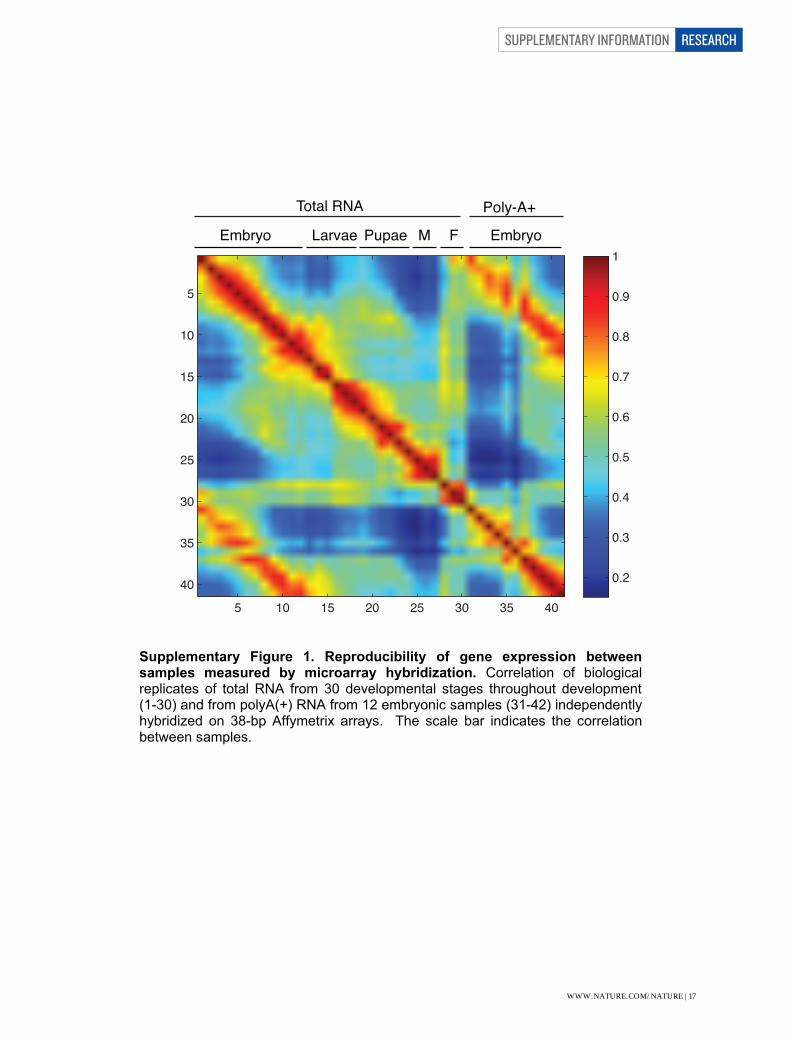
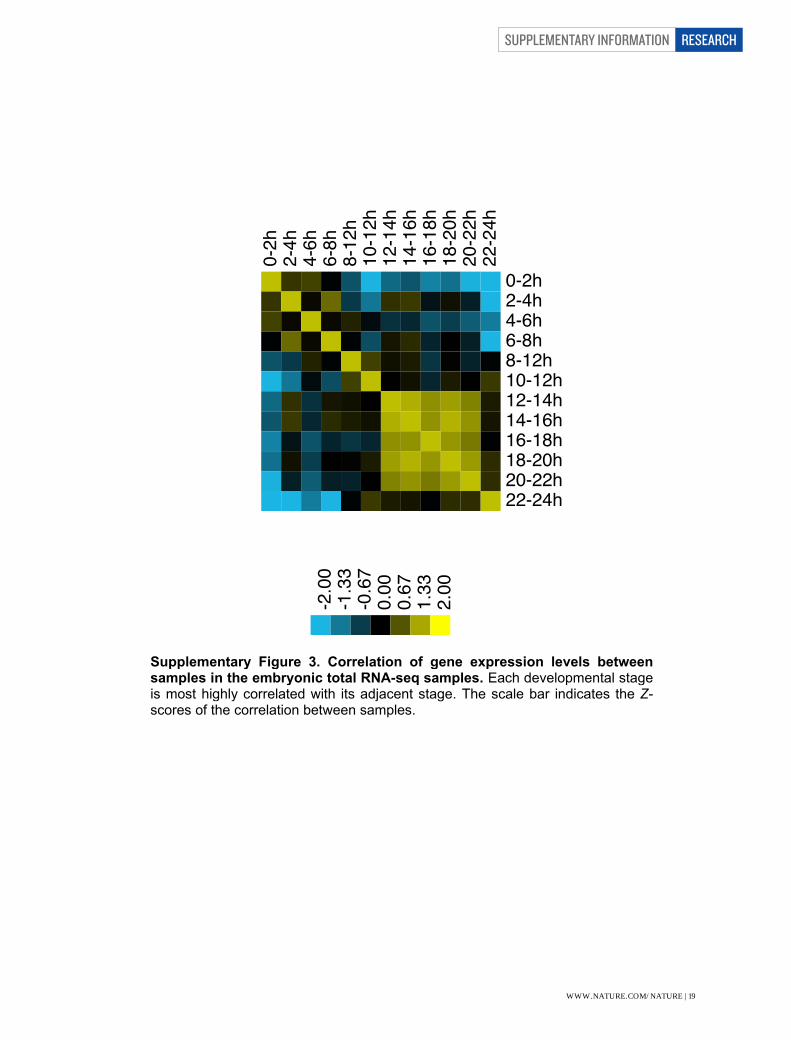
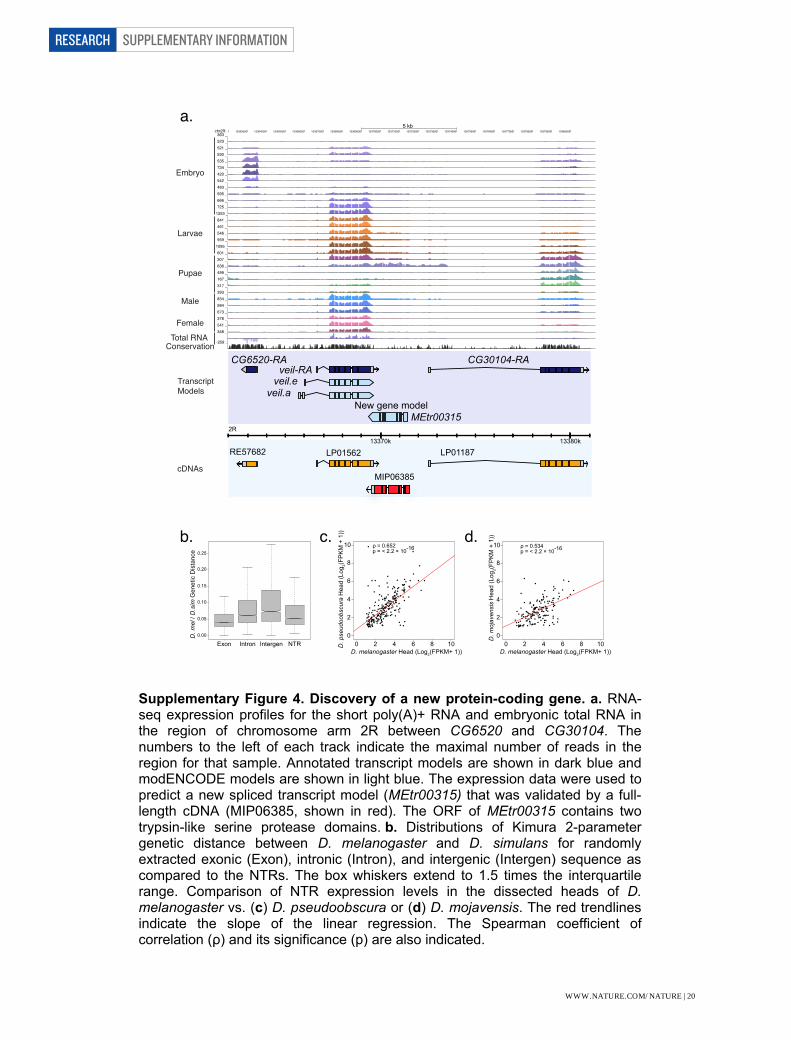
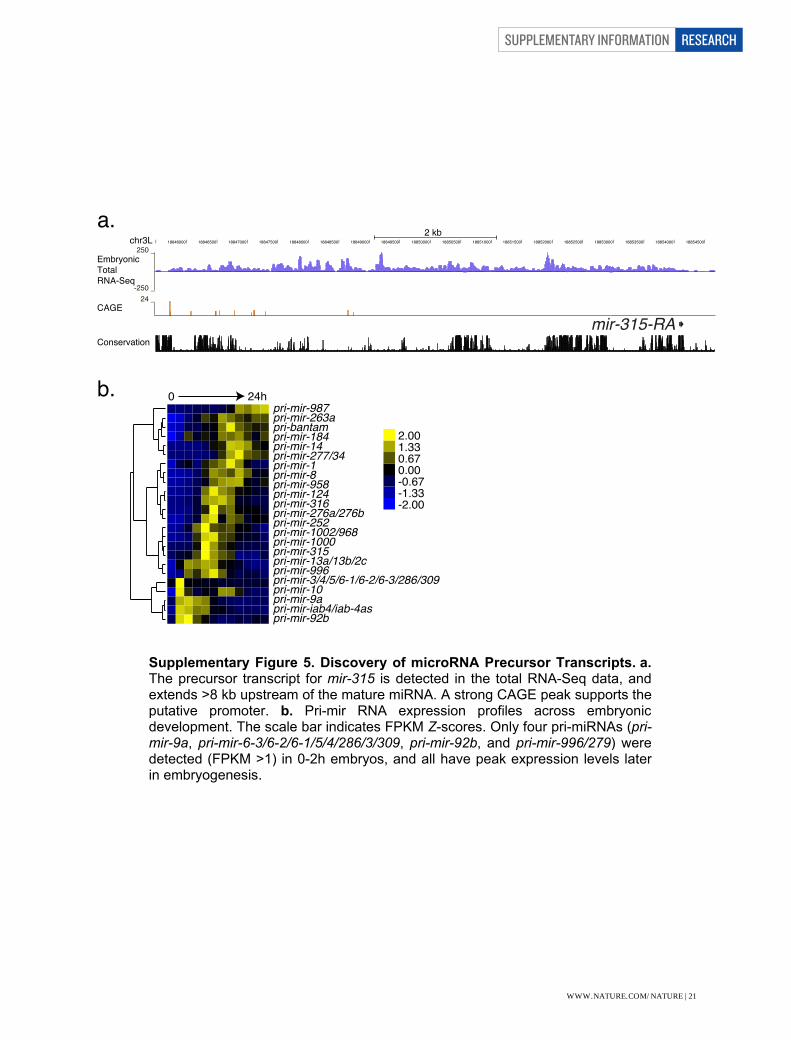
Supplementary Figure Legends Supplementary Figure 1. Reproducibility of gene expression between samples measured by microarray hybridization. Correlation of biological replicates of total RNA from 30 developmental stages throughout development (1-30) and from polyA(+) RNA from 12 embryonic samples (31-42) independently hybridized on 38-bp Affymetrix arrays. The scale bar indicates the correlation between samples. Supplementary Figure 2. Correlation of gene expression levels between stages using poly(A)+ RNA-seq data. Each developmental stage is most highly correlated with its adjacent stage, particularly in the embryonic stages. A decrease in correlation is observable in the third instar transition. Adult males and adult female form their own highly correlated groups. The scale bar indicates the Z-scores of the correlation between samples. Supplementary Figure 3. Correlation of gene expression levels between samples in the embryonic total RNA-seq samples. Each developmental stage is most highly correlated with its adjacent stage. The scale bar indicates the Z-scores of the correlation between samples. Supplementary Figure 4. Discovery of a new protein-coding gene. a. RNA-seq expression profiles for the short poly(A)+ RNA and embryonic total RNA in the region of chromosome arm 2R between CG6520 and CG30104. The numbers to the left of each track indicate the maximal number of reads in the region for that sample. Annotated transcript models are shown in dark blue and modENCODE models are shown in light blue. The expression data were used to predict a new spliced transcript model (MEtr00315) that was validated by a full-length cDNA (MIP06385, shown in red). The ORF of MEtr00315 contains two trypsin-like serine protease domains. b. Distributions of Kimura 2-parameter genetic distance between D. melanogaster and D. simulans for randomly extracted exonic (Exon), intronic (Intron), and intergenic (Intergen) sequence as compared to the NTRs. The box whiskers extend to 1.5 times the interquartile range. Comparison of NTR expression levels in the dissected heads of D.melanogaster vs. (c) D. pseudoobscura or (d) D. mojavensis. The red trendlines indicate the slope of the linear regression. The Spearman coefficient of correlation (ρ) and its significance (p) are also indicated. Supplementary Figure 5. Discovery of microRNA Precursor Transcripts. a. The precursor transcript for mir-315 is detected in the total RNA-Seq data, and extends >8 kb upstream of the mature miRNA. A strong CAGE peak supports the putative promoter. b. Pri-mir RNA expression profiles across embryonic development. The scale bar indicates FPKM Z-scores. Only four pri-miRNAs (pri-mir-9a, pri-mir-6-3/6-2/6-1/5/4/286/3/309, pri-mir-92b, and pri-mir-996/279) were detected (FPKM >1) in 0-2h embryos, and all have peak expression levels later in embryogenesis.
WWW.NATURE.COM/NATURE | 17

SUPPLEMENTARY INFORMATIONRESEARCHSupplementary Figure 2
Graveley et al.
Em
bryo
s_0-
2hr
E
mbr
yos_
2-4h
r
Em
bryo
s_4-
6hr
E
mbr
yos_
6-8h
r
Em
bryo
s_8-
10hr
E
mbr
yos_
10-1
2hr
E
mbr
yos_
12-1
4hr
E
mbr
yos_
14-1
6hr
E
mbr
yos_
16-1
8hr
E
mbr
yos_
18-2
0hr
E
mbr
yos_
20-2
2hr
E
mbr
yos_
22-2
4hr
L
1_la
rvae
L2_
larv
ae
L
3_la
rvae
_12h
r_po
st-m
olt
L
3_la
rvae
_PS1
-2
L
3_la
rvae
_PS3
-6
L
3_la
rvae
_PS7
-9
w
hite
_pre
-pup
ae
W
PP_1
2hr
W
PP_2
4hr
p
upae
_WPP
_2d
p
upae
_WPP
_3d
p
upae
_WPP
_4d
a
dult_
mal
e_1d
adu
lt_m
ale_
5d
a
dult_
mal
e_30
d a
dult_
fem
ale_
1d
a
dult_
fem
ale_
5d
a
dult_
fem
ale_
30d
Embryos_0-2hr Embryos_2-4hr Embryos_4-6hr Embryos_6-8hr Embryos_8-10hr Embryos_10-12hr Embryos_12-14hr Embryos_14-16hr Embryos_16-18hr Embryos_18-20hr Embryos_20-22hr Embryos_22-24hr L1_larvae L2_larvae L3_larvae_12hr_post-molt L3_larvae_PS1-2 L3_larvae_PS3-6 L3_larvae_PS7-9 white_pre-pupae WPP_12hr WPP_24hr pupae_WPP_2d pupae_WPP_3d pupae_WPP_4d adult_male_1d adult_male_5d adult_male_30d adult_female_1d adult_female_5d adult_female_30d
-2.0
0 -1
.33
-0.6
7 0
.00
0.6
7 1
.33
2.0
0
Supplementary Figure Legends Supplementary Figure 1. Reproducibility of gene expression between samples measured by microarray hybridization. Correlation of biological replicates of total RNA from 30 developmental stages throughout development (1-30) and from polyA(+) RNA from 12 embryonic samples (31-42) independently hybridized on 38-bp Affymetrix arrays. The scale bar indicates the correlation between samples. Supplementary Figure 2. Correlation of gene expression levels between stages using poly(A)+ RNA-seq data. Each developmental stage is most highly correlated with its adjacent stage, particularly in the embryonic stages. A decrease in correlation is observable in the third instar transition. Adult males and adult female form their own highly correlated groups. The scale bar indicates the Z-scores of the correlation between samples. Supplementary Figure 3. Correlation of gene expression levels between samples in the embryonic total RNA-seq samples. Each developmental stage is most highly correlated with its adjacent stage. The scale bar indicates the Z-scores of the correlation between samples. Supplementary Figure 4. Discovery of a new protein-coding gene. a. RNA-seq expression profiles for the short poly(A)+ RNA and embryonic total RNA in the region of chromosome arm 2R between CG6520 and CG30104. The numbers to the left of each track indicate the maximal number of reads in the region for that sample. Annotated transcript models are shown in dark blue and modENCODE models are shown in light blue. The expression data were used to predict a new spliced transcript model (MEtr00315) that was validated by a full-length cDNA (MIP06385, shown in red). The ORF of MEtr00315 contains two trypsin-like serine protease domains. b. Distributions of Kimura 2-parameter genetic distance between D. melanogaster and D. simulans for randomly extracted exonic (Exon), intronic (Intron), and intergenic (Intergen) sequence as compared to the NTRs. The box whiskers extend to 1.5 times the interquartile range. Comparison of NTR expression levels in the dissected heads of D.melanogaster vs. (c) D. pseudoobscura or (d) D. mojavensis. The red trendlines indicate the slope of the linear regression. The Spearman coefficient of correlation (ρ) and its significance (p) are also indicated. Supplementary Figure 5. Discovery of microRNA Precursor Transcripts. a. The precursor transcript for mir-315 is detected in the total RNA-Seq data, and extends >8 kb upstream of the mature miRNA. A strong CAGE peak supports the putative promoter. b. Pri-mir RNA expression profiles across embryonic development. The scale bar indicates FPKM Z-scores. Only four pri-miRNAs (pri-mir-9a, pri-mir-6-3/6-2/6-1/5/4/286/3/309, pri-mir-92b, and pri-mir-996/279) were detected (FPKM >1) in 0-2h embryos, and all have peak expression levels later in embryogenesis.
WWW.NATURE.COM/NATURE | 18
SUPPLEMENTARY INFORMATION RESEARCH
0-2
h 2
-4h
4-6
h 6
-8h
8-1
2h
10-
12h
12-
14h
14-
16h
16-
18h
18-
20h
20-
22h
22-
24h
0-2h 2-4h 4-6h 6-8h 8-12h 10-12h 12-14h 14-16h 16-18h 18-20h 20-22h 22-24h
Supplementary Figure 3
Graveley et al.
-2.0
0 -1
.33
-0.6
7 0
.00
0.6
7 1
.33
2.0
0
Supplementary Figure Legends Supplementary Figure 1. Reproducibility of gene expression between samples measured by microarray hybridization. Correlation of biological replicates of total RNA from 30 developmental stages throughout development (1-30) and from polyA(+) RNA from 12 embryonic samples (31-42) independently hybridized on 38-bp Affymetrix arrays. The scale bar indicates the correlation between samples. Supplementary Figure 2. Correlation of gene expression levels between stages using poly(A)+ RNA-seq data. Each developmental stage is most highly correlated with its adjacent stage, particularly in the embryonic stages. A decrease in correlation is observable in the third instar transition. Adult males and adult female form their own highly correlated groups. The scale bar indicates the Z-scores of the correlation between samples. Supplementary Figure 3. Correlation of gene expression levels between samples in the embryonic total RNA-seq samples. Each developmental stage is most highly correlated with its adjacent stage. The scale bar indicates the Z-scores of the correlation between samples. Supplementary Figure 4. Discovery of a new protein-coding gene. a. RNA-seq expression profiles for the short poly(A)+ RNA and embryonic total RNA in the region of chromosome arm 2R between CG6520 and CG30104. The numbers to the left of each track indicate the maximal number of reads in the region for that sample. Annotated transcript models are shown in dark blue and modENCODE models are shown in light blue. The expression data were used to predict a new spliced transcript model (MEtr00315) that was validated by a full-length cDNA (MIP06385, shown in red). The ORF of MEtr00315 contains two trypsin-like serine protease domains. b. Distributions of Kimura 2-parameter genetic distance between D. melanogaster and D. simulans for randomly extracted exonic (Exon), intronic (Intron), and intergenic (Intergen) sequence as compared to the NTRs. The box whiskers extend to 1.5 times the interquartile range. Comparison of NTR expression levels in the dissected heads of D.melanogaster vs. (c) D. pseudoobscura or (d) D. mojavensis. The red trendlines indicate the slope of the linear regression. The Spearman coefficient of correlation (ρ) and its significance (p) are also indicated. Supplementary Figure 5. Discovery of microRNA Precursor Transcripts. a. The precursor transcript for mir-315 is detected in the total RNA-Seq data, and extends >8 kb upstream of the mature miRNA. A strong CAGE peak supports the putative promoter. b. Pri-mir RNA expression profiles across embryonic development. The scale bar indicates FPKM Z-scores. Only four pri-miRNAs (pri-mir-9a, pri-mir-6-3/6-2/6-1/5/4/286/3/309, pri-mir-92b, and pri-mir-996/279) were detected (FPKM >1) in 0-2h embryos, and all have peak expression levels later in embryogenesis.
WWW.NATURE.COM/NATURE | 19
SUPPLEMENTARY INFORMATIONRESEARCH
���������������������
��
��
�� ��
���������������
����������
�������� �������� �������� �������� �������� �������� �������� �������� �������� �������� �������� �������� �������� �������� �������� �������� �������� ���������������������������������������������������������������������������������������������������������������������������������������������������������������������
������
LP01562 LP01187
veil.aveil.e
CG30104-RA
13370k 13380k
2R
CG6520-RA
RE57682
MIP06385
MEtr00315
�����������������
�����
veil-RA
������
������
�����
����
���������������
������������
0
2
4
6
8
10
D. p
seud
oobs
cura
Hea
d (L
og2(F
PK
M +
1))
D. melanogaster Head (Log2(FPKM+ 1)) D. melanogaster Head (Log2(FPKM+ 1))0 2 4 6 8 10 0 2 4 6 8 10
0
2
4
6
8
10
D. m
ojav
ensi
s H
ead
(Log
2(FP
KM
+ 1
))
�����������������������-16 ���������
��������������-16
����
����
����
����
����
����
Exon Intron Intergen NTR
D. m
el /
D.s
im G
enet
ic D
ista
nce
New gene model
Supplementary Figure Legends Supplementary Figure 1. Reproducibility of gene expression between samples measured by microarray hybridization. Correlation of biological replicates of total RNA from 30 developmental stages throughout development (1-30) and from polyA(+) RNA from 12 embryonic samples (31-42) independently hybridized on 38-bp Affymetrix arrays. The scale bar indicates the correlation between samples. Supplementary Figure 2. Correlation of gene expression levels between stages using poly(A)+ RNA-seq data. Each developmental stage is most highly correlated with its adjacent stage, particularly in the embryonic stages. A decrease in correlation is observable in the third instar transition. Adult males and adult female form their own highly correlated groups. The scale bar indicates the Z-scores of the correlation between samples. Supplementary Figure 3. Correlation of gene expression levels between samples in the embryonic total RNA-seq samples. Each developmental stage is most highly correlated with its adjacent stage. The scale bar indicates the Z-scores of the correlation between samples. Supplementary Figure 4. Discovery of a new protein-coding gene. a. RNA-seq expression profiles for the short poly(A)+ RNA and embryonic total RNA in the region of chromosome arm 2R between CG6520 and CG30104. The numbers to the left of each track indicate the maximal number of reads in the region for that sample. Annotated transcript models are shown in dark blue and modENCODE models are shown in light blue. The expression data were used to predict a new spliced transcript model (MEtr00315) that was validated by a full-length cDNA (MIP06385, shown in red). The ORF of MEtr00315 contains two trypsin-like serine protease domains. b. Distributions of Kimura 2-parameter genetic distance between D. melanogaster and D. simulans for randomly extracted exonic (Exon), intronic (Intron), and intergenic (Intergen) sequence as compared to the NTRs. The box whiskers extend to 1.5 times the interquartile range. Comparison of NTR expression levels in the dissected heads of D.melanogaster vs. (c) D. pseudoobscura or (d) D. mojavensis. The red trendlines indicate the slope of the linear regression. The Spearman coefficient of correlation (ρ) and its significance (p) are also indicated. Supplementary Figure 5. Discovery of microRNA Precursor Transcripts. a. The precursor transcript for mir-315 is detected in the total RNA-Seq data, and extends >8 kb upstream of the mature miRNA. A strong CAGE peak supports the putative promoter. b. Pri-mir RNA expression profiles across embryonic development. The scale bar indicates FPKM Z-scores. Only four pri-miRNAs (pri-mir-9a, pri-mir-6-3/6-2/6-1/5/4/286/3/309, pri-mir-92b, and pri-mir-996/279) were detected (FPKM >1) in 0-2h embryos, and all have peak expression levels later in embryogenesis.
WWW.NATURE.COM/NATURE | 20
SUPPLEMENTARY INFORMATION RESEARCH
Supplemental Figure 5
Graveley et al.
chr3L
Conservation
CAGE
EmbryonicTotalRNA-Seq
18846000 18846500 18847000 18847500 18848000 18848500 18849000 18849500 18850000 18850500 18851000 18851500 18852000 18852500 18853000 18853500 18854000 18854500
24 _
250 _
-250 _
mir-315-RA
pri-mir-9870 24h
pri-mir-263apri-bantampri-mir-184pri-mir-14pri-mir-277/34pri-mir-1pri-mir-8pri-mir-958pri-mir-124pri-mir-316pri-mir-276a/276bpri-mir-252pri-mir-1002/968pri-mir-1000pri-mir-315pri-mir-13a/13b/2cpri-mir-996pri-mir-3/4/5/6-1/6-2/6-3/286/309pri-mir-10pri-mir-9apri-mir-iab4/iab-4aspri-mir-92b
b.
a.2 kb
-2.00 -1.33 -0.67 0.00 0.67 1.33 2.00
Supplementary Figure Legends Supplementary Figure 1. Reproducibility of gene expression between samples measured by microarray hybridization. Correlation of biological replicates of total RNA from 30 developmental stages throughout development (1-30) and from polyA(+) RNA from 12 embryonic samples (31-42) independently hybridized on 38-bp Affymetrix arrays. The scale bar indicates the correlation between samples. Supplementary Figure 2. Correlation of gene expression levels between stages using poly(A)+ RNA-seq data. Each developmental stage is most highly correlated with its adjacent stage, particularly in the embryonic stages. A decrease in correlation is observable in the third instar transition. Adult males and adult female form their own highly correlated groups. The scale bar indicates the Z-scores of the correlation between samples. Supplementary Figure 3. Correlation of gene expression levels between samples in the embryonic total RNA-seq samples. Each developmental stage is most highly correlated with its adjacent stage. The scale bar indicates the Z-scores of the correlation between samples. Supplementary Figure 4. Discovery of a new protein-coding gene. a. RNA-seq expression profiles for the short poly(A)+ RNA and embryonic total RNA in the region of chromosome arm 2R between CG6520 and CG30104. The numbers to the left of each track indicate the maximal number of reads in the region for that sample. Annotated transcript models are shown in dark blue and modENCODE models are shown in light blue. The expression data were used to predict a new spliced transcript model (MEtr00315) that was validated by a full-length cDNA (MIP06385, shown in red). The ORF of MEtr00315 contains two trypsin-like serine protease domains. b. Distributions of Kimura 2-parameter genetic distance between D. melanogaster and D. simulans for randomly extracted exonic (Exon), intronic (Intron), and intergenic (Intergen) sequence as compared to the NTRs. The box whiskers extend to 1.5 times the interquartile range. Comparison of NTR expression levels in the dissected heads of D.melanogaster vs. (c) D. pseudoobscura or (d) D. mojavensis. The red trendlines indicate the slope of the linear regression. The Spearman coefficient of correlation (ρ) and its significance (p) are also indicated. Supplementary Figure 5. Discovery of microRNA Precursor Transcripts. a. The precursor transcript for mir-315 is detected in the total RNA-Seq data, and extends >8 kb upstream of the mature miRNA. A strong CAGE peak supports the putative promoter. b. Pri-mir RNA expression profiles across embryonic development. The scale bar indicates FPKM Z-scores. Only four pri-miRNAs (pri-mir-9a, pri-mir-6-3/6-2/6-1/5/4/286/3/309, pri-mir-92b, and pri-mir-996/279) were detected (FPKM >1) in 0-2h embryos, and all have peak expression levels later in embryogenesis.
WWW.NATURE.COM/NATURE | 21
SUPPLEMENTARY INFORMATIONRESEARCH
Dm
_em
b_2h
D
m_e
mb_
4h
Dm
_em
b_6h
D
m_e
mb_
8h
Dm
_em
b_10
h D
m_e
mb_
12h
Dm
_em
b_14
h D
m_e
mb_
16h
Dm
_em
b_18
h D
m_e
mb_
20h
Dm
_em
b_22
h D
m_e
mb_
24h
Dm
_L1_
larv
ae
Dm
_L2_
larv
ae
Dm
_L3-
12hr
_lar
vae
L3-
larv
ae-d
ark-
blue
L
3-la
rvae
-ligh
t-blu
e L
3-la
rvae
-cle
ar
Dm
_WPP
D
m_W
PP+1
2hr
Dm
_WPP
+24h
r D
m_W
PP+2
days
D
m_W
PP+3
days
D
m_W
PP+4
days
D
roAd
M-E
cl+1
day
Dro
AdM
-Ecl
+5da
y D
roAd
M-E
cl+3
0day
D
roAd
F-Ec
l+1d
ay
Dro
AdF-
Ecl+
5day
D
roAd
F-Ec
l+30
day
embryos0-2hr embryos2-4hr embryos4-6hr embryos6-8hr embryos8-10hr embryos10-12hr embryos12-14hr embryos14-16hr embryos16-18hr embryos18-20hr embryos20-22hr embryos22-24hr L1larvae L2larvae L3larvae_12hr_post_molt L3larvaePS_1-2 L3larvaePS_3-6 L3larvaePS_7-9 white_prepupae WPP_12hr WPP_24hr pupae_WPP_2d pupae_WPP_3d pupae_WPP_4d adult_male_1d adult_male_30d adult_male_5d adult_female_1d adult_female_5d adult_female_30d
-0.7
5 -0
.50
-0.2
5 0
.00
0.2
5 0
.50
0.7
5
Supplementary Figure 6
Total RNA Tiling Arrays
Shor
t Pol
y(A)
+ R
NA-
Seq
Graveley et al.
Supplementary Figure 6. Concordance of expression levels measured by total RNA tiling arrays and short poly(A)+ RNAseq. The scale bar indicates the Z-scores of the correlation between samples.
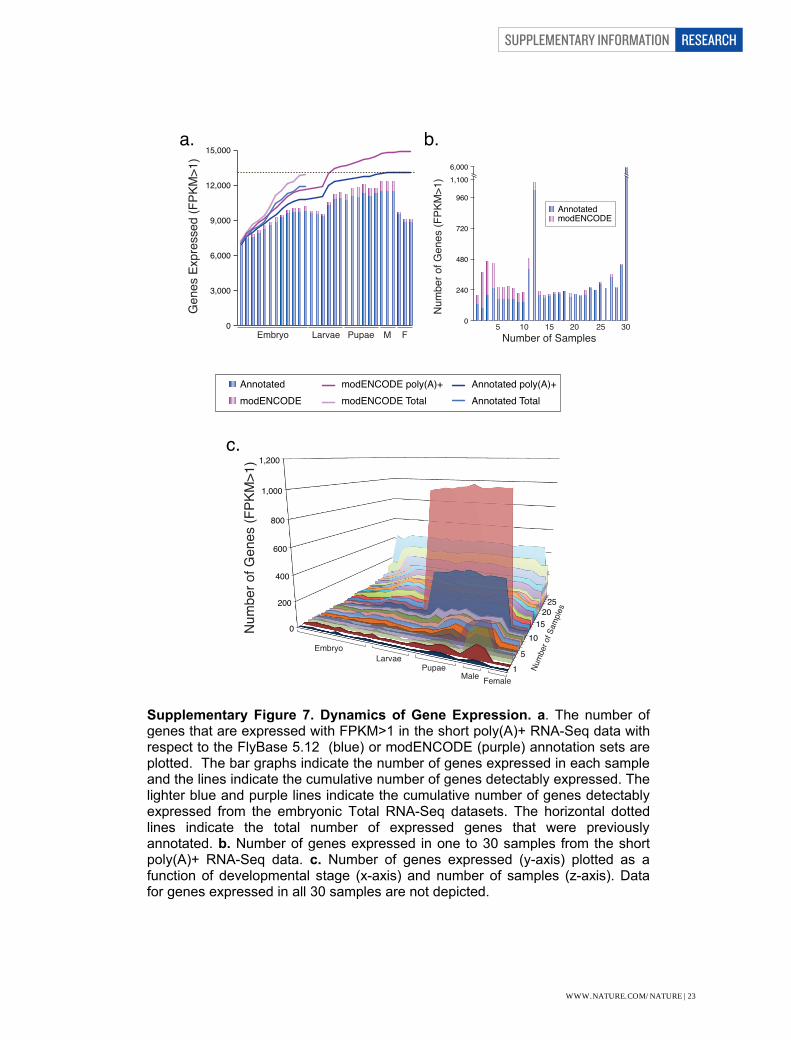
Supplementary Figure 7. Dynamics of Gene Expression. a. The number of genes that are expressed with FPKM>1 in the short poly(A)+ RNA-Seq data with respect to the FlyBase 5.12 (blue) or modENCODE (purple) annotation sets are plotted. The bar graphs indicate the number of genes expressed in each sample and the lines indicate the cumulative number of genes detectably expressed. The lighter blue and purple lines indicate the cumulative number of genes detectably expressed from the embryonic Total RNA-Seq datasets. The horizontal dotted lines indicate the total number of expressed genes that were previously annotated. b. Number of genes expressed in one to 30 samples from the short poly(A)+ RNA-Seq data. c. Number of genes expressed (y-axis) plotted as a function of developmental stage (x-axis) and number of samples (z-axis). Data for genes expressed in all 30 samples are not depicted.
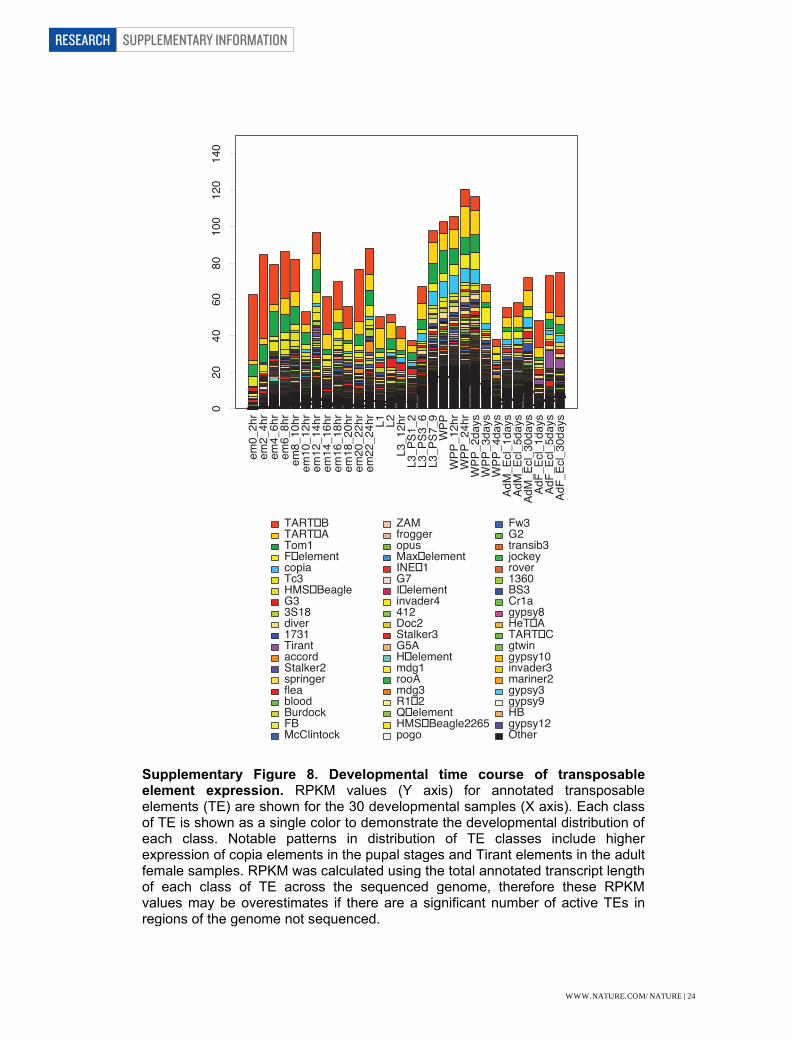
Supplementary Figure 8. Developmental time course of transposable element expression. RPKM values (Y axis) for annotated transposable elements (TE) are shown for the 30 developmental samples (X axis). Each class of TE is shown as a single color to demonstrate the developmental distribution of each class. Notable patterns in distribution of TE classes include higher expression of copia elements in the pupal stages and Tirant elements in the adult female samples. RPKM was calculated using the total annotated transcript length of each class of TE across the sequenced genome, therefore these RPKM values may be overestimates if there are a significant number of active TEs in regions of the genome not sequenced.
Supplementary Figure 9. Overview of the Transcriptome at the Exon level. a. Junction discovery and validation. The diagram shows the overlap of splice junctions of each experimental dataset and the comparison to FlyBase 5.12 annotations. The number of bp for each dataset is: short poly(A)+,171 Gbp; long poly(A)+, 441 Mbp; and EST,cDNA and RT-PCR, 183 Mbp. b. Comparison of the frame bias for internal constitutive and cassette exons that were previously annotated or discovered by modENCODE. c. Distribution of ∆Ψ values for all alternative splicing events observed in the short poly(A)+ RNA-Seq data. d. Distribution of significantly changing cassette exons that have higher Ψ values in males (blue) or females (purple). The inset depicts those cassette exons with ∆Ψ>25 between males and females. The male-specific exon in Sxl has the greatest ∆Ψ between males and females. e. Correlation of Ψ values for all alternative splicing events between the developmental time course samples.
Supplementary Figure 10. Sex-biased splicing. Male and female expression of Reps illustrating the discovery of a male-specific cassette exon. Male (blue),
WWW.NATURE.COM/NATURE | 22
SUPPLEMENTARY INFORMATION RESEARCH
a.
c.
Supplementary Figure 7
Gen
es E
xpre
ssed
(FPK
M>1
)
Embryo Larvae Pupae M F0
3,000
6,000
9,000
12,000
15,000
AnnotatedmodENCODE
modENCODE poly(A)+modENCODE Total
Annotated poly(A)+Annotated Total
b.
Num
ber o
f Gen
es (F
PKM
>1)
0
240
480
720
960
6,0001,100
5 10 15 20 25 30Number of Samples
AnnotatedmodENCODE
0
200
400
600
800
1,000
1,200
1
5
1015
2025
Embryo
Num
ber o
f Gen
es (F
PKM
>1)
Num
ber o
f Sam
ples
LarvaePupae
Male Female
Supplementary Figure 6. Concordance of expression levels measured by total RNA tiling arrays and short poly(A)+ RNAseq. The scale bar indicates the Z-scores of the correlation between samples.
Supplementary Figure 7. Dynamics of Gene Expression. a. The number of genes that are expressed with FPKM>1 in the short poly(A)+ RNA-Seq data with respect to the FlyBase 5.12 (blue) or modENCODE (purple) annotation sets are plotted. The bar graphs indicate the number of genes expressed in each sample and the lines indicate the cumulative number of genes detectably expressed. The lighter blue and purple lines indicate the cumulative number of genes detectably expressed from the embryonic Total RNA-Seq datasets. The horizontal dotted lines indicate the total number of expressed genes that were previously annotated. b. Number of genes expressed in one to 30 samples from the short poly(A)+ RNA-Seq data. c. Number of genes expressed (y-axis) plotted as a function of developmental stage (x-axis) and number of samples (z-axis). Data for genes expressed in all 30 samples are not depicted.
Supplementary Figure 8. Developmental time course of transposable element expression. RPKM values (Y axis) for annotated transposable elements (TE) are shown for the 30 developmental samples (X axis). Each class of TE is shown as a single color to demonstrate the developmental distribution of each class. Notable patterns in distribution of TE classes include higher expression of copia elements in the pupal stages and Tirant elements in the adult female samples. RPKM was calculated using the total annotated transcript length of each class of TE across the sequenced genome, therefore these RPKM values may be overestimates if there are a significant number of active TEs in regions of the genome not sequenced.
Supplementary Figure 9. Overview of the Transcriptome at the Exon level. a. Junction discovery and validation. The diagram shows the overlap of splice junctions of each experimental dataset and the comparison to FlyBase 5.12 annotations. The number of bp for each dataset is: short poly(A)+,171 Gbp; long poly(A)+, 441 Mbp; and EST,cDNA and RT-PCR, 183 Mbp. b. Comparison of the frame bias for internal constitutive and cassette exons that were previously annotated or discovered by modENCODE. c. Distribution of ∆Ψ values for all alternative splicing events observed in the short poly(A)+ RNA-Seq data. d. Distribution of significantly changing cassette exons that have higher Ψ values in males (blue) or females (purple). The inset depicts those cassette exons with ∆Ψ>25 between males and females. The male-specific exon in Sxl has the greatest ∆Ψ between males and females. e. Correlation of Ψ values for all alternative splicing events between the developmental time course samples.
Supplementary Figure 10. Sex-biased splicing. Male and female expression of Reps illustrating the discovery of a male-specific cassette exon. Male (blue),
WWW.NATURE.COM/NATURE | 23
SUPPLEMENTARY INFORMATIONRESEARCH
em0_2hr
em2_4hr
em4_6hr
em6_8hr
em8_10hr
em10_12hr
em12_14hr
em14_16hr
em16_18hr
em18_20hr
em20_22hr
em22_24hr
L1 L2L3_12hr
L3_P
S1_2
L3_P
S3_6
L3_P
S7_9
WPP
WPP
_12hr
WPP
_24hr
WPP
_2days
WPP
_3days
WPP
_4days
AdM_E
cl_1days
AdM_E
cl_5days
AdM_E
cl_30days
AdF_Ecl_1days
AdF_Ecl_5days
AdF_Ecl_30days
020
4060
80100
120
140
TART�BTART�ATom1F�elementcopiaTc3HMS�BeagleG33S18diver1731TirantaccordStalker2springerfleabloodBurdockFBMcClintock
ZAMfroggeropusMax�elementINE�1G7I�elementinvader4412Doc2Stalker3G5AH�elementmdg1rooAmdg3R1�2Q�elementHMS�Beagle2265pogo
Fw3G2transib3jockeyrover1360BS3Cr1agypsy8HeT�ATART�Cgtwingypsy10invader3mariner2gypsy3gypsy9HBgypsy12Other
Supplementary Figure 8
Graveley et al.
Supplementary Figure 6. Concordance of expression levels measured by total RNA tiling arrays and short poly(A)+ RNAseq. The scale bar indicates the Z-scores of the correlation between samples.
Supplementary Figure 7. Dynamics of Gene Expression. a. The number of genes that are expressed with FPKM>1 in the short poly(A)+ RNA-Seq data with respect to the FlyBase 5.12 (blue) or modENCODE (purple) annotation sets are plotted. The bar graphs indicate the number of genes expressed in each sample and the lines indicate the cumulative number of genes detectably expressed. The lighter blue and purple lines indicate the cumulative number of genes detectably expressed from the embryonic Total RNA-Seq datasets. The horizontal dotted lines indicate the total number of expressed genes that were previously annotated. b. Number of genes expressed in one to 30 samples from the short poly(A)+ RNA-Seq data. c. Number of genes expressed (y-axis) plotted as a function of developmental stage (x-axis) and number of samples (z-axis). Data for genes expressed in all 30 samples are not depicted.
Supplementary Figure 8. Developmental time course of transposable element expression. RPKM values (Y axis) for annotated transposable elements (TE) are shown for the 30 developmental samples (X axis). Each class of TE is shown as a single color to demonstrate the developmental distribution of each class. Notable patterns in distribution of TE classes include higher expression of copia elements in the pupal stages and Tirant elements in the adult female samples. RPKM was calculated using the total annotated transcript length of each class of TE across the sequenced genome, therefore these RPKM values may be overestimates if there are a significant number of active TEs in regions of the genome not sequenced.
Supplementary Figure 9. Overview of the Transcriptome at the Exon level. a. Junction discovery and validation. The diagram shows the overlap of splice junctions of each experimental dataset and the comparison to FlyBase 5.12 annotations. The number of bp for each dataset is: short poly(A)+,171 Gbp; long poly(A)+, 441 Mbp; and EST,cDNA and RT-PCR, 183 Mbp. b. Comparison of the frame bias for internal constitutive and cassette exons that were previously annotated or discovered by modENCODE. c. Distribution of ∆Ψ values for all alternative splicing events observed in the short poly(A)+ RNA-Seq data. d. Distribution of significantly changing cassette exons that have higher Ψ values in males (blue) or females (purple). The inset depicts those cassette exons with ∆Ψ>25 between males and females. The male-specific exon in Sxl has the greatest ∆Ψ between males and females. e. Correlation of Ψ values for all alternative splicing events between the developmental time course samples.
Supplementary Figure 10. Sex-biased splicing. Male and female expression of Reps illustrating the discovery of a male-specific cassette exon. Male (blue),
WWW.NATURE.COM/NATURE | 24

SUPPLEMENTARY INFORMATION RESEARCH
-2.00 -1.33 -0.67 0.00 0.67 1.33 2.00
Embryo Larvae Pupae M F
Embr
yoLa
rvae
Pupa
eM
F
b.a.
c.
e.
ΔΨ
Frame 0Frame 1Frame 2
0 20 40 60 80 100
0.0
0.2
0.4
0.6
0.8
1.0
AnnotatedCons ConsConsN/A N/A
N/AN/AAlt
Alt Alt modENCODE
Frac
tion
of E
xons
Splic
ing
Even
ts
0
5,000
10,000
15,000
20,000
LongPoly(A)+RNA-Seq
cDNAs,ESTs orRT-PCR
FlyBase 5.12
14,953
27,56915,799
2,312
2,364
307264
834
38
1,366
419 2,996
1,643
ShortPoly(A)+RNA-Seq
2,054
1,432
d.
0
50
0 10 20 30 40 50 60 70 80 90 100
30 40 50 60 70 80
Sxl
Num
ber o
f Exo
ns90 100
100
150
200
250
300
0
5
10
15
20
25
30
35
40
MaleFemale
ΔΨ
Supplementary Figure 9
Graveley et al.
Supplementary Figure 6. Concordance of expression levels measured by total RNA tiling arrays and short poly(A)+ RNAseq. The scale bar indicates the Z-scores of the correlation between samples.
Supplementary Figure 7. Dynamics of Gene Expression. a. The number of genes that are expressed with FPKM>1 in the short poly(A)+ RNA-Seq data with respect to the FlyBase 5.12 (blue) or modENCODE (purple) annotation sets are plotted. The bar graphs indicate the number of genes expressed in each sample and the lines indicate the cumulative number of genes detectably expressed. The lighter blue and purple lines indicate the cumulative number of genes detectably expressed from the embryonic Total RNA-Seq datasets. The horizontal dotted lines indicate the total number of expressed genes that were previously annotated. b. Number of genes expressed in one to 30 samples from the short poly(A)+ RNA-Seq data. c. Number of genes expressed (y-axis) plotted as a function of developmental stage (x-axis) and number of samples (z-axis). Data for genes expressed in all 30 samples are not depicted.
Supplementary Figure 8. Developmental time course of transposable element expression. RPKM values (Y axis) for annotated transposable elements (TE) are shown for the 30 developmental samples (X axis). Each class of TE is shown as a single color to demonstrate the developmental distribution of each class. Notable patterns in distribution of TE classes include higher expression of copia elements in the pupal stages and Tirant elements in the adult female samples. RPKM was calculated using the total annotated transcript length of each class of TE across the sequenced genome, therefore these RPKM values may be overestimates if there are a significant number of active TEs in regions of the genome not sequenced.
Supplementary Figure 9. Overview of the Transcriptome at the Exon level. a. Junction discovery and validation. The diagram shows the overlap of splice junctions of each experimental dataset and the comparison to FlyBase 5.12 annotations. The number of bp for each dataset is: short poly(A)+,171 Gbp; long poly(A)+, 441 Mbp; and EST,cDNA and RT-PCR, 183 Mbp. b. Comparison of the frame bias for internal constitutive and cassette exons that were previously annotated or discovered by modENCODE. c. Distribution of ∆Ψ values for all alternative splicing events observed in the short poly(A)+ RNA-Seq data. d. Distribution of significantly changing cassette exons that have higher Ψ values in males (blue) or females (purple). The inset depicts those cassette exons with ∆Ψ>25 between males and females. The male-specific exon in Sxl has the greatest ∆Ψ between males and females. e. Correlation of Ψ values for all alternative splicing events between the developmental time course samples.
Supplementary Figure 10. Sex-biased splicing. Male and female expression of Reps illustrating the discovery of a male-specific cassette exon. Male (blue),
WWW.NATURE.COM/NATURE | 25
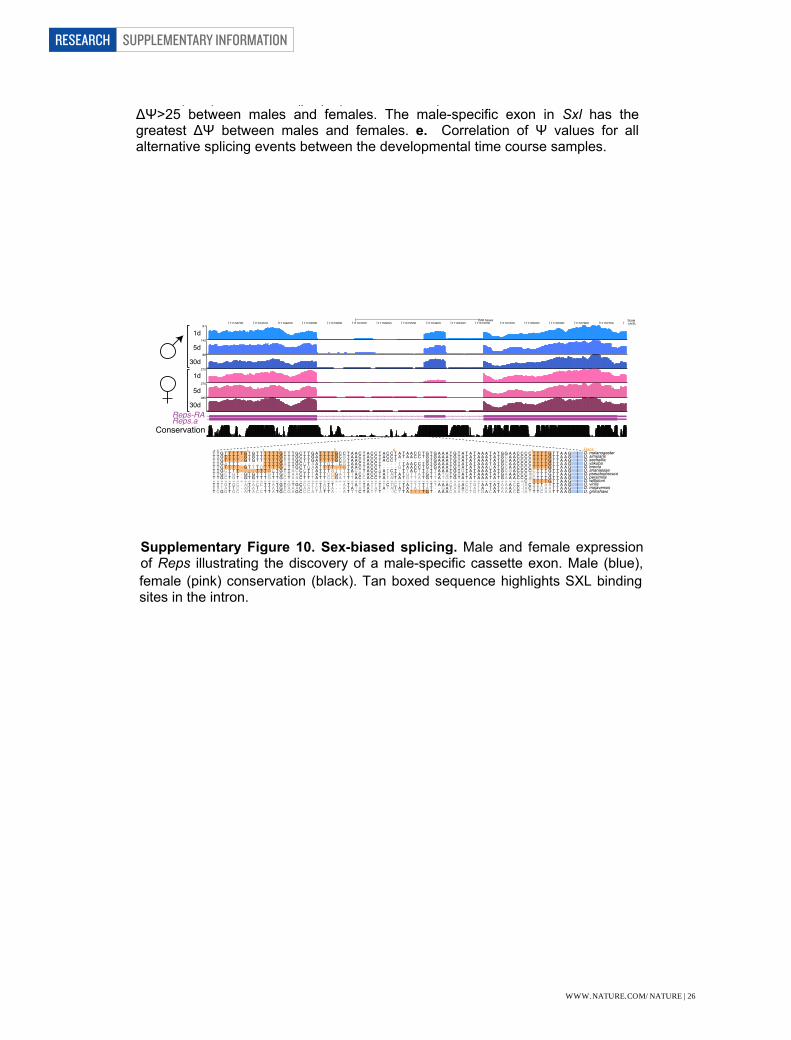
SUPPLEMENTARY INFORMATIONRESEARCH
Supplementary Figure 10
Graveley et al.
Scale:chr2L
500 bases11102700111028001110290011103000111031001110320011103300111034001110350011103600111037001110380011103900111040001110410011104200
Reps-RAReps.a
91
143
88
272
275
285
Conservation
1d
5d
30d
1d
5d
30d
GapsD. melanogasterD. simulansD. sechelliaD. yakubaD. erectaD. ananassaeD. pseudoobscuraD. persimilisD. willistoniD. virilisD. mojavensisD. grimshawi
Supplementary Figure 6. Concordance of expression levels measured by total RNA tiling arrays and short poly(A)+ RNAseq. The scale bar indicates the Z-scores of the correlation between samples.
Supplementary Figure 7. Dynamics of Gene Expression. a. The number of genes that are expressed with FPKM>1 in the short poly(A)+ RNA-Seq data with respect to the FlyBase 5.12 (blue) or modENCODE (purple) annotation sets are plotted. The bar graphs indicate the number of genes expressed in each sample and the lines indicate the cumulative number of genes detectably expressed. The lighter blue and purple lines indicate the cumulative number of genes detectably expressed from the embryonic Total RNA-Seq datasets. The horizontal dotted lines indicate the total number of expressed genes that were previously annotated. b. Number of genes expressed in one to 30 samples from the short poly(A)+ RNA-Seq data. c. Number of genes expressed (y-axis) plotted as a function of developmental stage (x-axis) and number of samples (z-axis). Data for genes expressed in all 30 samples are not depicted.
Supplementary Figure 8. Developmental time course of transposable element expression. RPKM values (Y axis) for annotated transposable elements (TE) are shown for the 30 developmental samples (X axis). Each class of TE is shown as a single color to demonstrate the developmental distribution of each class. Notable patterns in distribution of TE classes include higher expression of copia elements in the pupal stages and Tirant elements in the adult female samples. RPKM was calculated using the total annotated transcript length of each class of TE across the sequenced genome, therefore these RPKM values may be overestimates if there are a significant number of active TEs in regions of the genome not sequenced.
Supplementary Figure 9. Overview of the Transcriptome at the Exon level. a. Junction discovery and validation. The diagram shows the overlap of splice junctions of each experimental dataset and the comparison to FlyBase 5.12 annotations. The number of bp for each dataset is: short poly(A)+,171 Gbp; long poly(A)+, 441 Mbp; and EST,cDNA and RT-PCR, 183 Mbp. b. Comparison of the frame bias for internal constitutive and cassette exons that were previously annotated or discovered by modENCODE. c. Distribution of ∆Ψ values for all alternative splicing events observed in the short poly(A)+ RNA-Seq data. d. Distribution of significantly changing cassette exons that have higher Ψ values in males (blue) or females (purple). The inset depicts those cassette exons with ∆Ψ>25 between males and females. The male-specific exon in Sxl has the greatest ∆Ψ between males and females. e. Correlation of Ψ values for all alternative splicing events between the developmental time course samples.
Supplementary Figure 10. Sex-biased splicing. Male and female expression of Reps illustrating the discovery of a male-specific cassette exon. Male (blue),
Supplementary Figure 6. Concordance of expression levels measured by total RNA tiling arrays and short poly(A)+ RNAseq. The scale bar indicates the Z-scores of the correlation between samples.
Supplementary Figure 7. Dynamics of Gene Expression. a. The number of genes that are expressed with FPKM>1 in the short poly(A)+ RNA-Seq data with respect to the FlyBase 5.12 (blue) or modENCODE (purple) annotation sets are plotted. The bar graphs indicate the number of genes expressed in each sample and the lines indicate the cumulative number of genes detectably expressed. The lighter blue and purple lines indicate the cumulative number of genes detectably expressed from the embryonic Total RNA-Seq datasets. The horizontal dotted lines indicate the total number of expressed genes that were previously annotated. b. Number of genes expressed in one to 30 samples from the short poly(A)+ RNA-Seq data. c. Number of genes expressed (y-axis) plotted as a function of developmental stage (x-axis) and number of samples (z-axis). Data for genes expressed in all 30 samples are not depicted.
Supplementary Figure 8. Developmental time course of transposable element expression. RPKM values (Y axis) for annotated transposable elements (TE) are shown for the 30 developmental samples (X axis). Each class of TE is shown as a single color to demonstrate the developmental distribution of each class. Notable patterns in distribution of TE classes include higher expression of copia elements in the pupal stages and Tirant elements in the adult female samples. RPKM was calculated using the total annotated transcript length of each class of TE across the sequenced genome, therefore these RPKM values may be overestimates if there are a significant number of active TEs in regions of the genome not sequenced.
Supplementary Figure 9. Overview of the Transcriptome at the Exon level. a. Junction discovery and validation. The diagram shows the overlap of splice junctions of each experimental dataset and the comparison to FlyBase 5.12 annotations. The number of bp for each dataset is: short poly(A)+,171 Gbp; long poly(A)+, 441 Mbp; and EST,cDNA and RT-PCR, 183 Mbp. b. Comparison of the frame bias for internal constitutive and cassette exons that were previously annotated or discovered by modENCODE. c. Distribution of ∆Ψ values for all alternative splicing events observed in the short poly(A)+ RNA-Seq data. d. Distribution of significantly changing cassette exons that have higher Ψ values in males (blue) or females (purple). The inset depicts those cassette exons with ∆Ψ>25 between males and females. The male-specific exon in Sxl has the greatest ∆Ψ between males and females. e. Correlation of Ψ values for all alternative splicing events between the developmental time course samples.
Supplementary Figure 10. Sex-biased splicing. Male and female expression of Reps illustrating the discovery of a male-specific cassette exon. Male (blue), female (pink) conservation (black). Tan boxed sequence highlights SXL binding sites in the intron. Supplementary Figure 11. Clusters of co-expressed genes. We identified 20 clusters of genes with similar expression dynamics. Expression levels across development for genes in each cluster are indicated by colored lines, which fuse to form the thick red line representing the cluster consensus. Developmental stage groups (embryonic, larval, pupal, adult males, adult females) and indicated by the five horizontal color blocks. Clusters 18,19 and 20 show the surge of new gene expression at the start of the larval-to-pupal developmental transition. Supplementary Figure 12. Dynamic Expression of new non-coding RNAs. Heatmap representation of the expression dynamics of the 1,026 non-coding NTRs that are expressed at FPKM>1 in the poly(A)+ RNA-Seq data. The key indicates the FPKM scores.
Supplementary Figure 13. Dynamic Expression of annotated non-coding RNAs. Heatmap representation of the expression dynamics of all annotated classes of non-coding RNAs in poly(A)+ and Total RNA-Seq data. a. ncRNAs, b. tRNAs, c. snRNAs, d. rRNAs, e. snoRNAs. The key indicates the FPKM scores.
WWW.NATURE.COM/NATURE | 26
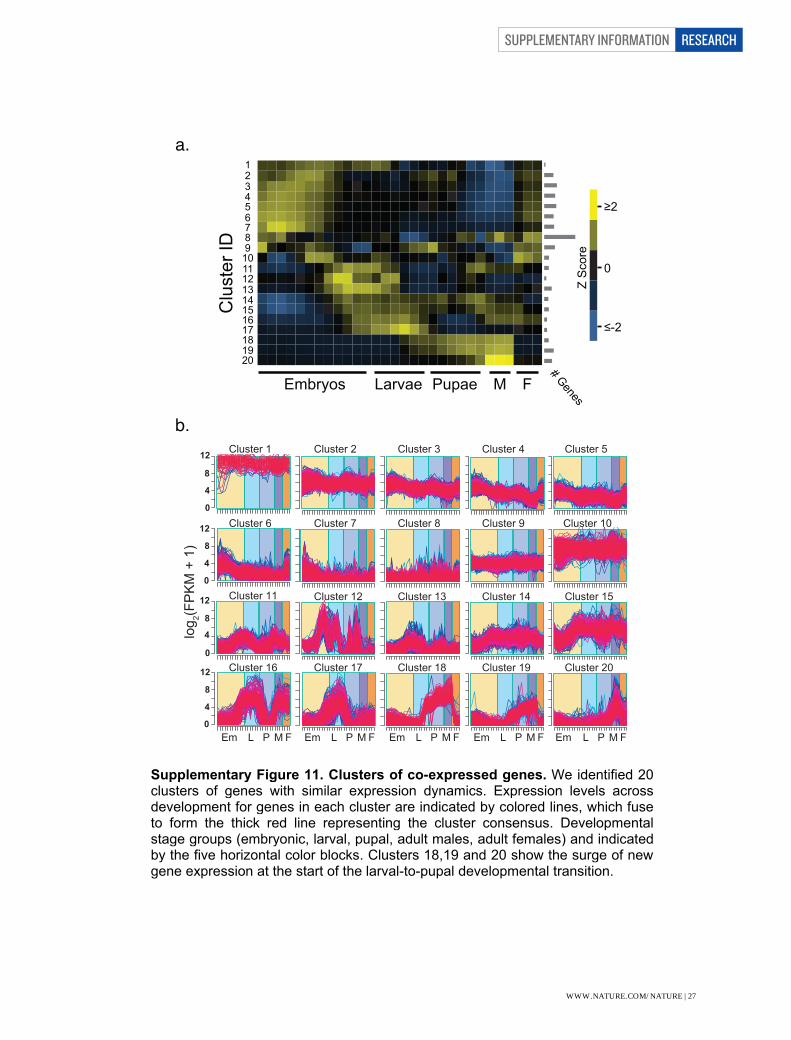
SUPPLEMENTARY INFORMATION RESEARCH
Cluster 2
Cluster 18
Cluster 14
Cluster 4
Cluster 15
Cluster 5
Cluster 19
Cluster 8
Cluster 13
Cluster 7
Cluster 20Cluster 17
Cluster 3
Cluster 10 Cluster 6
0
4
8
12
Cluster 11
0
4
8
12
Cluster 9
Cluster 1
0
4
8
12
Cluster 12
Cluster 16
0
4
8
12
log 2(F
PK
M +
1)
Em L P M F Em L P M F Em L P M F Em L P M F Em L P M F
Supplementary Figure 11
Graveley et al.
a.
b.
Embryos
≥2
≤-2
0
Larvae Pupae M F
# GenesC
lust
er ID
1234567891011121314151617181920
Z S
core
female (pink) conservation (black). Tan boxed sequence highlights SXL binding sites in the intron. Supplementary Figure 11. Clusters of co-expressed genes. We identified 20 clusters of genes with similar expression dynamics. Expression levels across development for genes in each cluster are indicated by colored lines, which fuse to form the thick red line representing the cluster consensus. Developmental stage groups (embryonic, larval, pupal, adult males, adult females) and indicated by the five horizontal color blocks. Clusters 18,19 and 20 show the surge of new gene expression at the start of the larval-to-pupal developmental transition. Supplementary Figure 12. Dynamic Expression of new non-coding RNAs. Heatmap representation of the expression dynamics of the 1,026 non-coding NTRs that are expressed at FPKM>1 in the poly(A)+ RNA-Seq data. The key indicates the FPKM scores.
Supplementary Figure 13. Dynamic Expression of annotated non-coding RNAs. Heatmap representation of the expression dynamics of all annotated classes of non-coding RNAs in poly(A)+ and Total RNA-Seq data. a. ncRNAs, b. tRNAs, c. snRNAs, d. rRNAs, e. snoRNAs. The key indicates the FPKM scores.
WWW.NATURE.COM/NATURE | 27

SUPPLEMENTARY INFORMATIONRESEARCH
Embryo Larvae Pupae M FPoly(A)+ RNA-Seq
Supplementary Figure 12
Graveley et al.
1026 Putative Noncoding NTRs
0 1 2FPKM
female (pink) conservation (black). Tan boxed sequence highlights SXL binding sites in the intron. Supplementary Figure 11. Clusters of co-expressed genes. We identified 20 clusters of genes with similar expression dynamics. Expression levels across development for genes in each cluster are indicated by colored lines, which fuse to form the thick red line representing the cluster consensus. Developmental stage groups (embryonic, larval, pupal, adult males, adult females) and indicated by the five horizontal color blocks. Clusters 18,19 and 20 show the surge of new gene expression at the start of the larval-to-pupal developmental transition. Supplementary Figure 12. Dynamic Expression of new non-coding RNAs. Heatmap representation of the expression dynamics of the 1,026 non-coding NTRs that are expressed at FPKM>1 in the poly(A)+ RNA-Seq data. The key indicates the FPKM scores.
Supplementary Figure 13. Dynamic Expression of annotated non-coding RNAs. Heatmap representation of the expression dynamics of all annotated classes of non-coding RNAs in poly(A)+ and Total RNA-Seq data. a. ncRNAs, b. tRNAs, c. snRNAs, d. rRNAs, e. snoRNAs. The key indicates the FPKM scores.
WWW.NATURE.COM/NATURE | 28
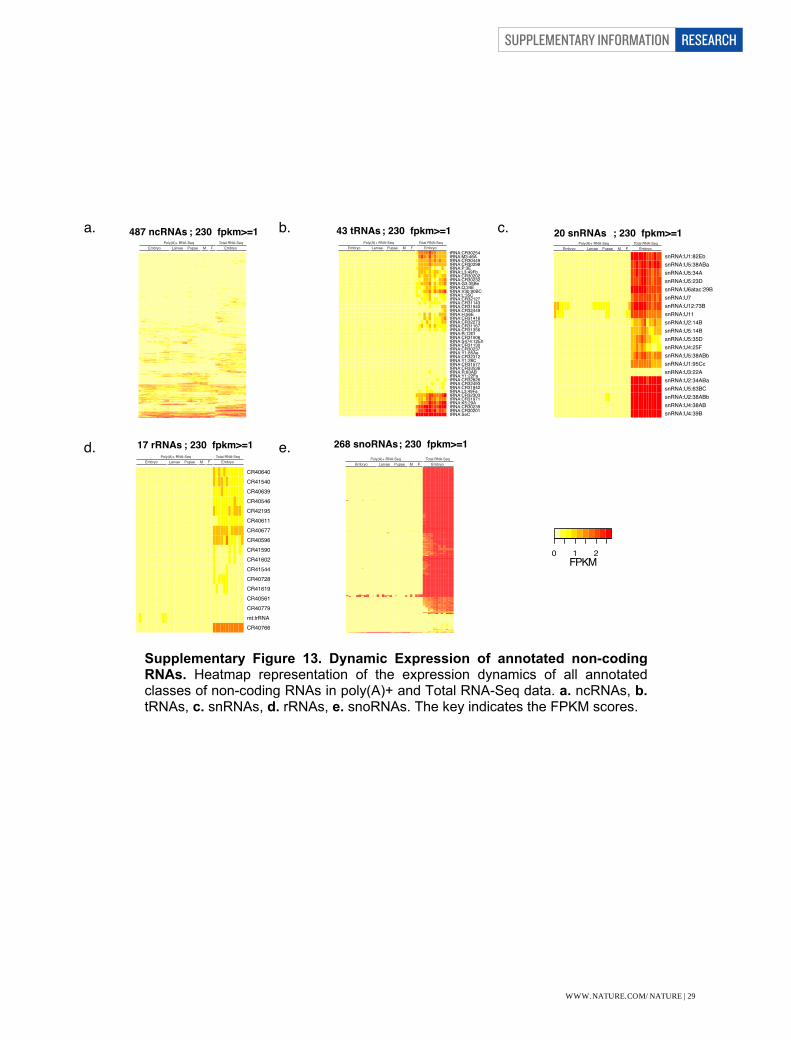
SUPPLEMENTARY INFORMATION RESEARCH
Supplementary Figure 13
a. b.
d. e.
c.
Graveley et al.
487 ncRNAs ; 230 fpkm>=1Embryo Larvae Pupae M F Embryo
Total RNA-SeqPoly(A)+ RNA-Seq
tRNA:SeCtRNA:CR30201tRNA:CR30239tRNA:K5:29AtRNA:CR31971tRNA:CR32303tRNA:L3:49FatRNA:CR31942tRNA:CR32493tRNA:CR32826tRNA:Y1:22FatRNA:R:83ABtRNA:CR33536tRNA:CR31577tRNA:Y1:28CtRNA:CR32312tRNA:Y1:85AetRNA:CR30237tRNA:CR31130tRNA:S474:12EhtRNA:CR31506tRNA:R:12EftRNA:CR31356tRNA:CR31167tRNA:CR32273tRNA:CR31416tRNA:H:56EtRNA:CR32449tRNA:CR31940tRNA:CR31143tRNA:CR32127tRNA:L:35CtRNA:V3b:90BCtRNA:Q:34EtRNA:G3:35BetRNA:CR30232tRNA:CR30202tRNA:L3:49FbtRNA:P:3EtRNA:CR30298tRNA:CR30449tRNA:M3:46AtRNA:CR30254
43 tRNAs ; 230 fpkm>=1Embryo Larvae Pupae M F Embryo
Total RNA-SeqPoly(A)+ RNA-Seq
CR40766mt:lrRNACR40779CR40561CR41619CR40728CR41544CR41602CR41590CR40596CR40677CR40611CR42195CR40546CR40639CR41540CR40640
17 rRNAs ; 230 fpkm>=1Embryo Larvae Pupae M F Embryo
Total RNA-SeqPoly(A)+ RNA-Seq
268 snoRNAs ; 230 fpkm>=1
Embryo Larvae Pupae M F EmbryoTotal RNA-SeqPoly(A)+ RNA-Seq
snRNA:U4:39BsnRNA:U4:38ABsnRNA:U2:38ABbsnRNA:U5:63BCsnRNA:U2:34ABasnRNA:U3:22AsnRNA:U1:95CcsnRNA:U5:38ABbsnRNA:U4:25FsnRNA:U5:35DsnRNA:U5:14BsnRNA:U2:14BsnRNA:U11snRNA:U12:73BsnRNA:U7snRNA:U6atac:29BsnRNA:U5:23DsnRNA:U5:34AsnRNA:U5:38ABasnRNA:U1:82Eb
20 snRNAs ; 230 fpkm>=1Embryo Larvae Pupae M F Embryo
Total RNA-SeqPoly(A)+ RNA-Seq
0 1 2FPKM
female (pink) conservation (black). Tan boxed sequence highlights SXL binding sites in the intron. Supplementary Figure 11. Clusters of co-expressed genes. We identified 20 clusters of genes with similar expression dynamics. Expression levels across development for genes in each cluster are indicated by colored lines, which fuse to form the thick red line representing the cluster consensus. Developmental stage groups (embryonic, larval, pupal, adult males, adult females) and indicated by the five horizontal color blocks. Clusters 18,19 and 20 show the surge of new gene expression at the start of the larval-to-pupal developmental transition. Supplementary Figure 12. Dynamic Expression of new non-coding RNAs. Heatmap representation of the expression dynamics of the 1,026 non-coding NTRs that are expressed at FPKM>1 in the poly(A)+ RNA-Seq data. The key indicates the FPKM scores.
Supplementary Figure 13. Dynamic Expression of annotated non-coding RNAs. Heatmap representation of the expression dynamics of all annotated classes of non-coding RNAs in poly(A)+ and Total RNA-Seq data. a. ncRNAs, b. tRNAs, c. snRNAs, d. rRNAs, e. snoRNAs. The key indicates the FPKM scores.
WWW.NATURE.COM/NATURE | 29
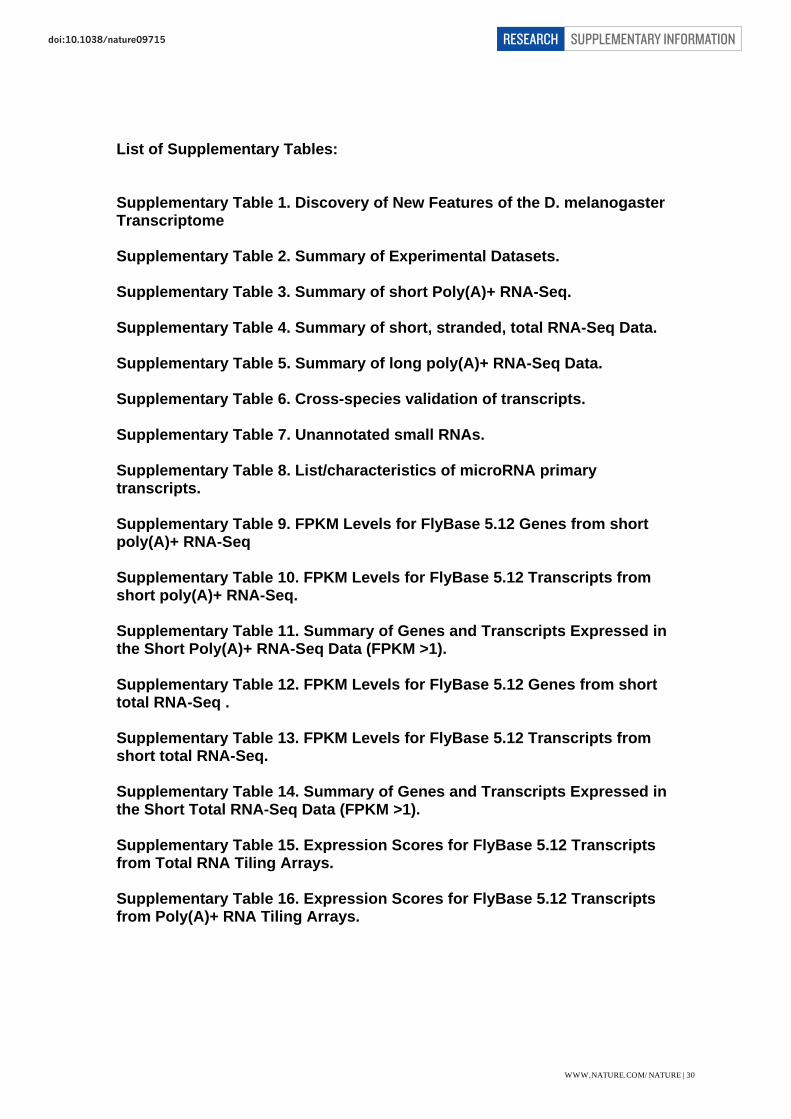
List of Supplementary Tables: Supplementary Table 1. Discovery of New Features of the D. melanogaster Transcriptome Supplementary Table 2. Summary of Experimental Datasets. Supplementary Table 3. Summary of short Poly(A)+ RNA-Seq. Supplementary Table 4. Summary of short, stranded, total RNA-Seq Data. Supplementary Table 5. Summary of long poly(A)+ RNA-Seq Data. Supplementary Table 6. Cross-species validation of transcripts. Supplementary Table 7. Unannotated small RNAs. Supplementary Table 8. List/characteristics of microRNA primary transcripts. Supplementary Table 9. FPKM Levels for FlyBase 5.12 Genes from short poly(A)+ RNA-Seq Supplementary Table 10. FPKM Levels for FlyBase 5.12 Transcripts from short poly(A)+ RNA-Seq. Supplementary Table 11. Summary of Genes and Transcripts Expressed in the Short Poly(A)+ RNA-Seq Data (FPKM >1). Supplementary Table 12. FPKM Levels for FlyBase 5.12 Genes from short total RNA-Seq . Supplementary Table 13. FPKM Levels for FlyBase 5.12 Transcripts from short total RNA-Seq. Supplementary Table 14. Summary of Genes and Transcripts Expressed in the Short Total RNA-Seq Data (FPKM >1). Supplementary Table 15. Expression Scores for FlyBase 5.12 Transcripts from Total RNA Tiling Arrays. Supplementary Table 16. Expression Scores for FlyBase 5.12 Transcripts from Poly(A)+ RNA Tiling Arrays.
WWW.NATURE.COM/NATURE | 30
SUPPLEMENTARY INFORMATIONRESEARCHdoi:10.1038/nature09715
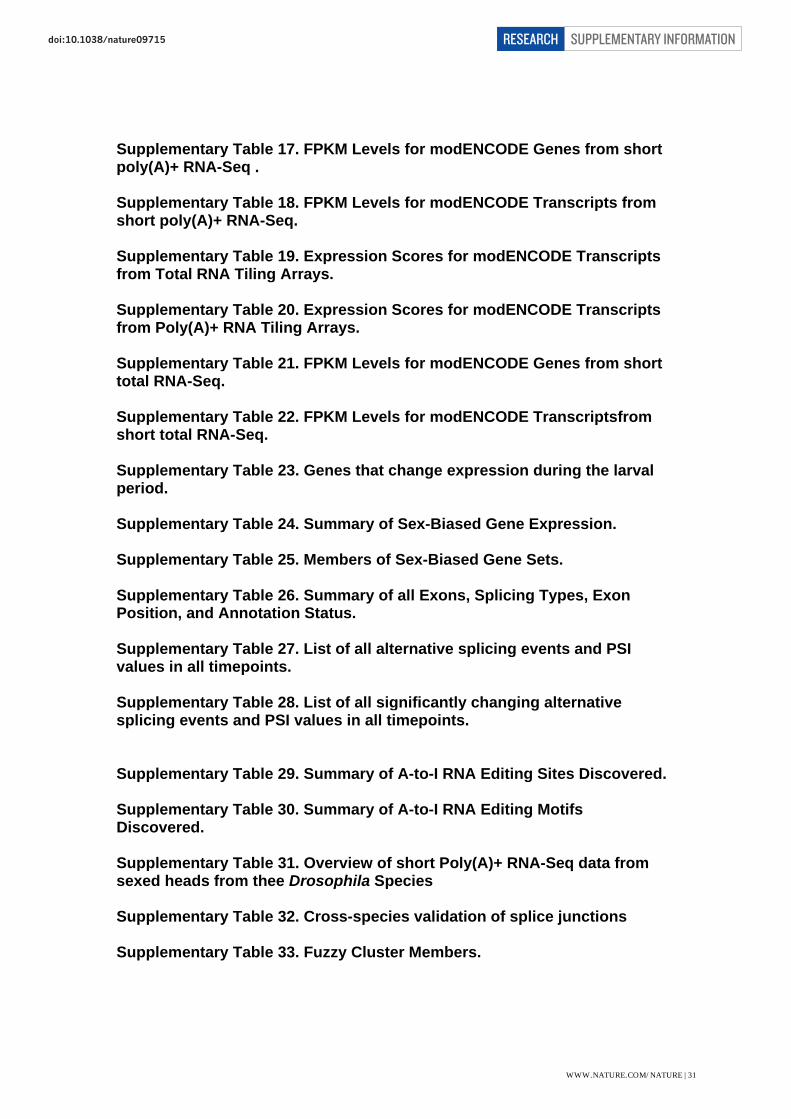
Supplementary Table 17. FPKM Levels for modENCODE Genes from short poly(A)+ RNA-Seq . Supplementary Table 18. FPKM Levels for modENCODE Transcripts from short poly(A)+ RNA-Seq. Supplementary Table 19. Expression Scores for modENCODE Transcripts from Total RNA Tiling Arrays. Supplementary Table 20. Expression Scores for modENCODE Transcripts from Poly(A)+ RNA Tiling Arrays. Supplementary Table 21. FPKM Levels for modENCODE Genes from short total RNA-Seq. Supplementary Table 22. FPKM Levels for modENCODE Transcriptsfrom short total RNA-Seq. Supplementary Table 23. Genes that change expression during the larval period. Supplementary Table 24. Summary of Sex-Biased Gene Expression. Supplementary Table 25. Members of Sex-Biased Gene Sets. Supplementary Table 26. Summary of all Exons, Splicing Types, Exon Position, and Annotation Status. Supplementary Table 27. List of all alternative splicing events and PSI values in all timepoints. Supplementary Table 28. List of all significantly changing alternative splicing events and PSI values in all timepoints. Supplementary Table 29. Summary of A-to-I RNA Editing Sites Discovered. Supplementary Table 30. Summary of A-to-I RNA Editing Motifs Discovered. Supplementary Table 31. Overview of short Poly(A)+ RNA-Seq data from sexed heads from thee Drosophila Species Supplementary Table 32. Cross-species validation of splice junctions Supplementary Table 33. Fuzzy Cluster Members.
WWW.NATURE.COM/NATURE | 31
SUPPLEMENTARY INFORMATIONRESEARCHdoi:10.1038/nature09715

Supplementary Table 34. GTF File of all modENCODE Transcript Models - modENCODE_Gene_and_Transcript_Models.gtf
WWW.NATURE.COM/NATURE | 32
SUPPLEMENTARY INFORMATIONRESEARCHdoi:10.1038/nature09715
Related Documents