1 SUPPLEMENTARY DATA Figure 1. Fixed testis in cassette prior to embedding for histology, examples shown: left is of transverse sections and right is of biopsies. Figure 2. Example of the difference between stained biopsy sections and transverse sections, high variability using biopsies. A B A B

Welcome message from author
This document is posted to help you gain knowledge. Please leave a comment to let me know what you think about it! Share it to your friends and learn new things together.
Transcript

1
SUPPLEMENTARY DATA
Figure 1. Fixed testis in cassette prior to embedding for histology, examples shown: left is of transverse sections and right is of biopsies.
Figure 2. Example of the difference between stained biopsy sections and transverse sections, high variability using biopsies.
A B
A
B

2
Figure 3. Five distinct transverse sections (A) were collected from unique regions along the entire testis, while five biopsies from unique regions were clustered (B) and subsequently step-sectioned. The resulting units of observation for comparison of TO counts were individual transverse sections vs. clusters of five biopsies. The TO counts from five units of observation were averaged to produce a mean value for each tissue collection method (bar = 2 mm; hematoxylin and eosin stain).
Figure 4. Microscopic view of undeveloped previtellogenic testicular oocytes (arrow) surrounded by testicular tissue and sperm in Micropterus salmoides largemouth bass, (a) transverse section, (b) biopsy taken adjacent to the transverse section.
A B
A B

3
Figure 5. Tissue orientation becomes an issue with the biopsy tool if targeted approach fails to collect tissue from this location.
Figure 6. Variety of immediate effects after laparoscopic biopsies.
A
B

4
Figure 7. Micropterus salmoides largemouth bass anesthetized prior to laparoscopy.
Figure 8. Surgical setup in the lab and demonstration in the field on Micropterus salmoides largemouth bass.
A B
C

5
Figure 9. Proper orientation for laparoscopy, with 30 degree viewing downwards for optimal gonad inspection.
Figure 10. Testicular oocytes clustered surrounded by mature sperm and testicular tissue from hatchery reared Micropterus salmoides largemouth bass.

6
Figure 11. Series of microscopic images of testicular oocytes to show the variety between sizes, shapes, and color.
C
E
A B
D
F

7
Figure 12. Microscopic images of testicular oocytes by biopsy from Micropterus salmoides largemouth bass.
Figure 13. Two microscopic images of testicular oocytes to show the variety between sizes, shapes, and color from Micropterus salmoides largemouth bass.
Figure 14. Parasites filling Micropterus salmoides largemouth bass, impeding laparoscopic viewing.
A B
8
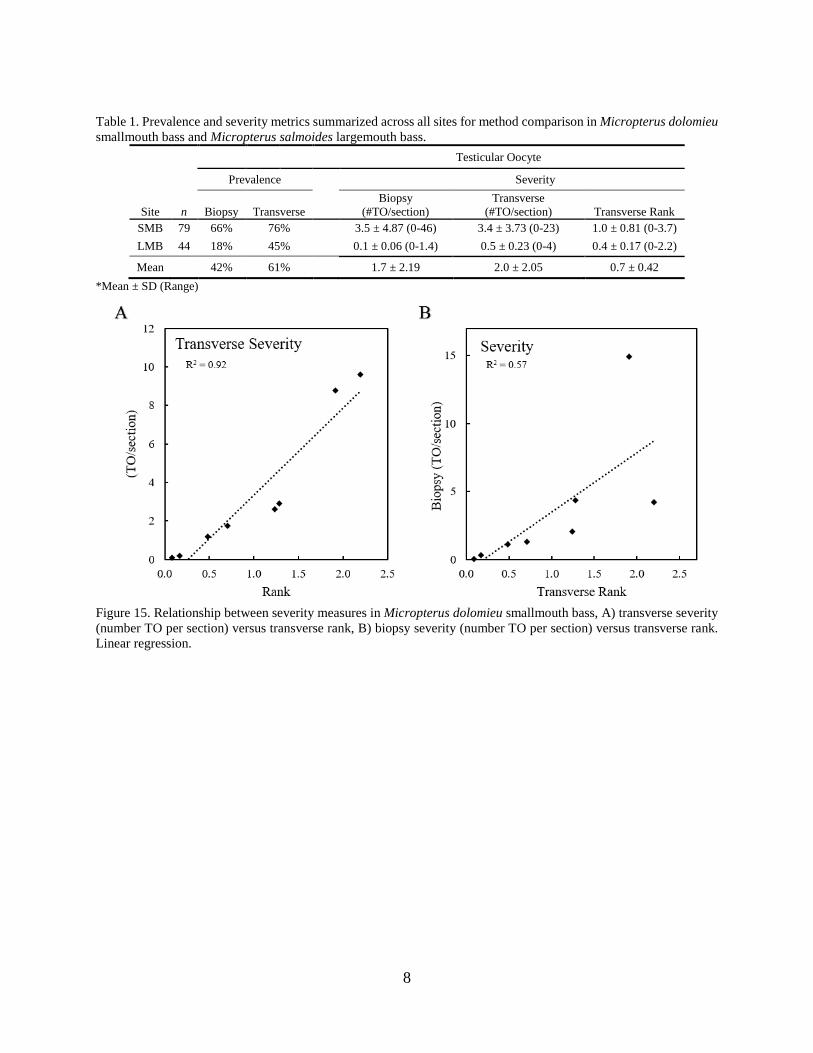
Table 1. Prevalence and severity metrics summarized across all sites for method comparison in Micropterus dolomieu smallmouth bass and Micropterus salmoides largemouth bass.
Testicular Oocyte
Prevalence Severity
Site n Biopsy Transverse Biopsy
(#TO/section) Transverse
(#TO/section) Transverse Rank SMB 79 66% 76% 3.5 ± 4.87 (0-46) 3.4 ± 3.73 (0-23) 1.0 ± 0.81 (0-3.7) LMB 44 18% 45% 0.1 ± 0.06 (0-1.4) 0.5 ± 0.23 (0-4) 0.4 ± 0.17 (0-2.2)
Mean 42% 61% 1.7 ± 2.19 2.0 ± 2.05 0.7 ± 0.42 *Mean ± SD (Range)
Figure 15. Relationship between severity measures in Micropterus dolomieu smallmouth bass, A) transverse severity (number TO per section) versus transverse rank, B) biopsy severity (number TO per section) versus transverse rank. Linear regression.
9
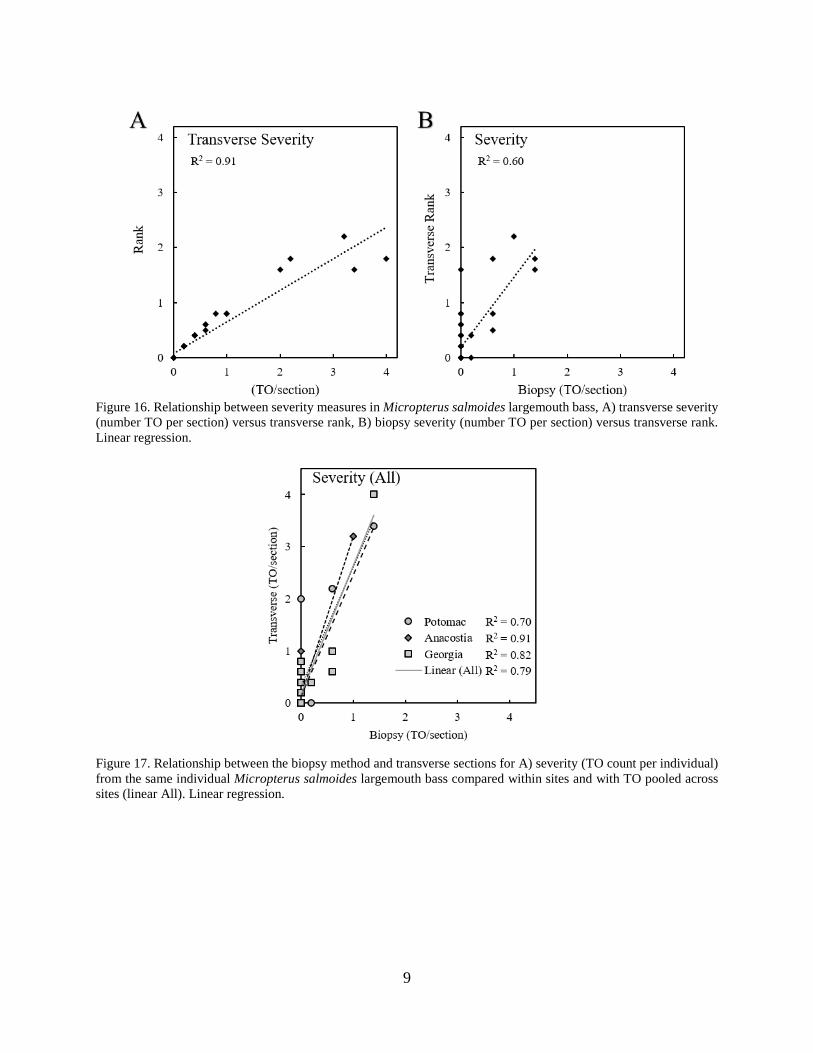
Figure 16. Relationship between severity measures in Micropterus salmoides largemouth bass, A) transverse severity (number TO per section) versus transverse rank, B) biopsy severity (number TO per section) versus transverse rank. Linear regression.
Figure 17. Relationship between the biopsy method and transverse sections for A) severity (TO count per individual) from the same individual Micropterus salmoides largemouth bass compared within sites and with TO pooled across sites (linear All). Linear regression.

10
Figure 18. Example of statistical analysis used to compare TO enumeration across sites.

11
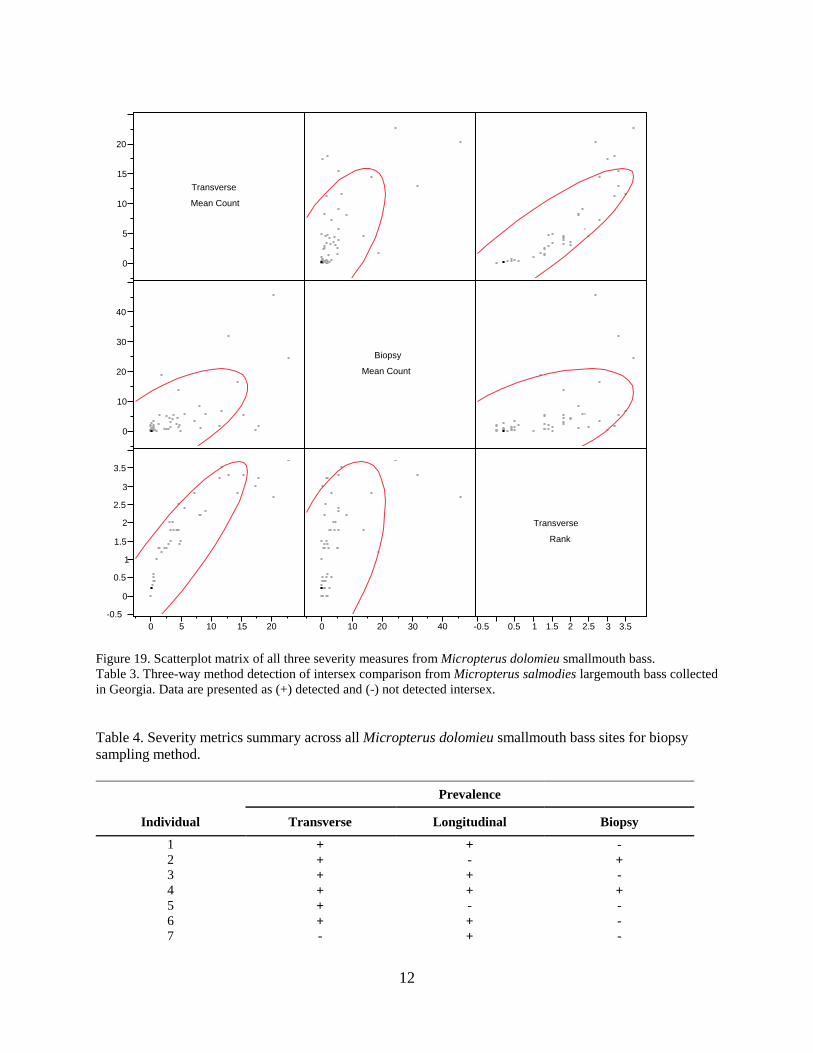
Table 2. Series of multivariate and pairwise correlations between all three severity measures for Micropterus dolomieu smallmouth bass. Multivariate Correlations Transverse Mean Count Biopsy Mean Count Transverse Rank Transverse Mean Count 1.0000 0.6596 0.8898 Biopsy Mean Count 0.6596 1.0000 0.5518 Transverse Rank 0.8898 0.5518 1.0000 Covariance Matrix Transverse Mean Count Biopsy Mean Count Transverse Rank Transverse Mean Count 27.31381 24.94359 5.13936 Biopsy Mean Count 24.94359 52.35177 4.41233 Transverse Rank 5.13936 4.41233 1.22126 Pairwise Correlations Variable by Variable Correlation Count Lower 95% Upper 95% Signif Prob Biopsy Mean Count Transverse Mean Count 0.6596 79 0.5134 0.7686 <.0001* Transverse Rank Transverse Mean Count 0.8898 79 0.8325 0.9283 <.0001* Transverse Rank Biopsy Mean Count 0.5518 79 0.3767 0.6889 <.0001*
12
Figure 19. Scatterplot matrix of all three severity measures from Micropterus dolomieu smallmouth bass. Table 3. Three-way method detection of intersex comparison from Micropterus salmodies largemouth bass collected in Georgia. Data are presented as (+) detected and (-) not detected intersex. Table 4. Severity metrics summary across all Micropterus dolomieu smallmouth bass sites for biopsy sampling method.
Prevalence
Individual Transverse Longitudinal Biopsy
1 + + - 2 + - + 3 + + - 4 + + + 5 + - - 6 + + - 7 - + -
0
5
10
15
20
0
10
20
30
40
-0.5
0
0.5
1
1.5
2
2.5
3
3.5
Transverse
Mean Count
0 5 10 15 20
Biopsy
Mean Count
0 10 20 30 40
Transverse
Rank
-0.5 0.5 1 1.5 2 2.5 3 3.5

13
8 - + - 9 - + -
10 - - - 11 - + - 12 + + - 13 + + - 14 - - - 15 - + - 16 - + - 17 - + - 18 - + - 19 - - - 20 + + + 21 + + - 22 + + + 23 + + - 24 - - -
Methodological Approach for Reconciling Transverse Sections to Biopsies
To reconcile the type of information collected between methods for consistent
interpretation of intersex in male black bass, transverse severity ranks were correlated to biopsy
oocyte counts. Since the biopsy forceps generally retrieve the same size of tissue, the biopsy
oocyte counts are easily comparable without the ambiguity of an index. Due to the nature of
biopsied tissue several factors must be considered before relatable semi-quantitative results can
be produced. Generally, five transverse sections are analyzed to evaluate for intersex and the area
of a single transverse section is on average 6x the area of a biopsy. Therefore, in order to view
the same total area, each biopsy (total of 5) must be viewed at different depths (step-sections) to
make a comparison based on total observable surface area. Thus, the unit that acts as an
equivalent to a transverse section is five biopsies placed in a cassette, embedded in paraffin and
then all five pieces of tissue are step-sectioned simultaneously with the number of TO used to
relate to severity. Using the five, 6 µm thick step-sections of all five biopsies (unit for severity
comparison) employed in this study, is still substantially less observable area as transverse
sections (Figure 1 & 2). Since the observable area of the five biopsies is much smaller than the
14
transverse sections, this results in an estimation of at least 20 and up to 60 times the tissue that is
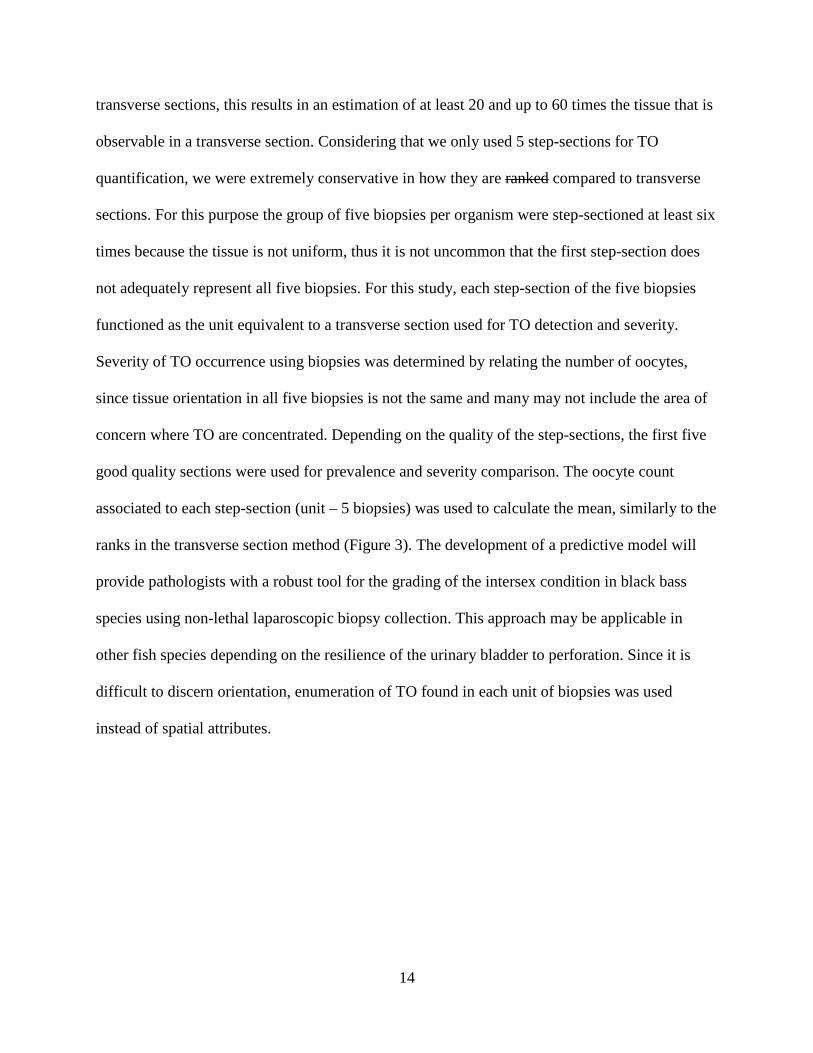
observable in a transverse section. Considering that we only used 5 step-sections for TO
quantification, we were extremely conservative in how they are ranked compared to transverse
sections. For this purpose the group of five biopsies per organism were step-sectioned at least six
times because the tissue is not uniform, thus it is not uncommon that the first step-section does
not adequately represent all five biopsies. For this study, each step-section of the five biopsies
functioned as the unit equivalent to a transverse section used for TO detection and severity.
Severity of TO occurrence using biopsies was determined by relating the number of oocytes,
since tissue orientation in all five biopsies is not the same and many may not include the area of
concern where TO are concentrated. Depending on the quality of the step-sections, the first five
good quality sections were used for prevalence and severity comparison. The oocyte count
associated to each step-section (unit – 5 biopsies) was used to calculate the mean, similarly to the
ranks in the transverse section method (Figure 3). The development of a predictive model will
provide pathologists with a robust tool for the grading of the intersex condition in black bass
species using non-lethal laparoscopic biopsy collection. This approach may be applicable in
other fish species depending on the resilience of the urinary bladder to perforation. Since it is
difficult to discern orientation, enumeration of TO found in each unit of biopsies was used
instead of spatial attributes.
Related Documents