Supplementary Material Antipruritic placebo effects by conditioning H1-antihistamine Authors and affiliations S.H. Meeuwis 1,2 , MSc, H. van Middendorp 1,2 , PhD, G. Pacheco-Lopez 1,3 , PhD, M.K. Ninaber 4 , MD PhD, A.P.M. Lavrijsen 5 , MD PhD, N. van der Wee 6 , MD PhD, D.S. Veldhuijzen, PhD 1,2 , A.W.M Evers 1,2,6 , PhD 1 Leiden University, Faculty of Social and Behavioral Sciences, Institute of Psychology, Health, Medical and Neuropsychology Unit, Leiden, The Netherlands 2 Leiden Institute for Brain and Cognition, Leiden University Medical Center, Leiden, The Netherlands 3 Metropolitan Autonomous University, Campus Lerma, Health Sciences Department, Lerma, Edo Mex, Mexico 4 Department of Pulmonology, Leiden University Medical Center, Leiden, The Netherlands 5 Department of Dermatology, Leiden University Medical Center, Leiden, The Netherlands 6 Department of Psychiatry, Leiden University Medical Center, Leiden, The Netherlands Corresponding author Stefanie H. Meeuwis, MSc Leiden University, Institute Psychology, Health, Medical and Neuropsychology Unit, P.O. box 9555 2300 RB Leiden The Netherlands 0031715274077 [email protected]

Welcome message from author
This document is posted to help you gain knowledge. Please leave a comment to let me know what you think about it! Share it to your friends and learn new things together.
Transcript
Supplementary Material
Antipruritic placebo effects by conditioning H1-antihistamine
Authors and affiliations
S.H. Meeuwis1,2, MSc, H. van Middendorp1,2, PhD, G. Pacheco-Lopez1,3, PhD, M.K.
Ninaber4, MD PhD, A.P.M. Lavrijsen5, MD PhD, N. van der Wee6, MD PhD, D.S.
Veldhuijzen, PhD1,2, A.W.M Evers1,2,6, PhD
1 Leiden University, Faculty of Social and Behavioral Sciences, Institute of Psychology, Health, Medical and
Neuropsychology Unit, Leiden, The Netherlands
2 Leiden Institute for Brain and Cognition, Leiden University Medical Center, Leiden, The Netherlands
3 Metropolitan Autonomous University, Campus Lerma, Health Sciences Department, Lerma, Edo Mex, Mexico
4 Department of Pulmonology, Leiden University Medical Center, Leiden, The Netherlands
5 Department of Dermatology, Leiden University Medical Center, Leiden, The Netherlands
6 Department of Psychiatry, Leiden University Medical Center, Leiden, The Netherlands
Corresponding author
Stefanie H. Meeuwis, MSc
Leiden University, Institute Psychology, Health, Medical and Neuropsychology Unit,
P.O. box 9555
2300 RB
Leiden
The Netherlands
0031715274077
2
Abbreviations used in the supplementary material
ANCOVA = Analysis of Covariance
ANOVA = Analysis of Variance
ATS/ERS = American Thoracic Society / European Respiratory Society (Task Force)
BIS/BAS scales = the Behavioural Inhibition System / Behavioural Approach System scales
BPM = Beats per Minute
CS = Conditioned Stimulus
DSM-IV = the Diagnostic and Statistical Manual of Mental Disorders-IV
EPQ-RSS-EN = Eysenck Personality Questionnaire short–extraversion & neuroticism
FEV1 = Forced Expiratory Volume in one second
FVC = Forced Vital Capacity
GLM = General Linear Model
HADS = the Hospital Anxiety and Depression Scale
HR = Heart Rate
IgE = Immunoglobulin-E
LOT-R = the Life Orientation Test – revised
LUMC = Leiden University Medical Center
MEFV = Maximum Expiratory Flow-Volume curve
NA = Negative Affect
NRS = Numeric Rating Scale
PA = Positive Affect
PANAS = Positive and Negative Affect Schedule
PEF = Peak Expiratory Flow
PSS = Perceived Stress Scale
PSWQ = Penn State Worry Questionnaire
3
RAND-36 = a multidimensional measure of general health status
RMA = Repeated Measures Analysis
SCL = Skin Conductance Level
SS-10 = Sensitive Scale-10
STAI-S-s = State Trait Anxiety Index – State – short scale
UCS = Unconditioned Stimulus
4
Supplementary Methods
2. Elaboration on the participant group
Healthy male and female volunteers, aged between 18 and 35 years, were recruited for this
study through advertisements at locations of Leiden University, the Leiden University Medical
Center (LUMC), the University of Amsterdam, and the University of Delft, and through social
media (e.g., Facebook). Inclusion criteria consisted of a good understanding of written and
spoken Dutch, and absence of allergic rhinitis or allergic conjunctivitis within the three months
prior to enrolment in the study. Participants were excluded in case of any (severe) allergic
condition that presented symptoms other than rhinitis or conjunctivitis (e.g., food allergy);
sensitivity to levocetirizine diHCl or other substances used in the study; lactose intolerance;
somatic morbidity that could interfere with the participant’s safety or with the study protocol
(e.g., histamine intolerance, asthma); current Diagnostic and Statistical Manual of Mental
Disorders-IV (DSM-IV) psychiatric diagnoses; recent (within past 2 months) use of
antihistamines, antibiotics, or anti-inflammatory medication; recent vaccinations; and
pregnancy. Participants were asked to refrain from consuming heavy meals, caffeine, or
smoking 2 hours, exercise 12 hours, and alcohol and drugs 24 hours prior to the sessions.
Adherence to these lifestyle guidelines, as well as any significant changes in health status during
the course of the study (e.g., illness or other changes in physical health, or occurrences of highly
stressful events) were monitored at the start of each session.
4. Elaboration on the conditioning paradigm
The CS was a distinctively-tasting green beverage that has been used as a CS in previous
conditioning studies (2-7). The beverage consisted of 150 mL of commercially available
strawberry milk, which was coloured green by adding the coloring powders Quinoline Yellow
5
(E104, 80 mg/L) and Patent Blue V (E131, 20 mg/L) and flavoured with lavender oil (0.6
mL/L)1. As unconditioned stimulus (UCS), 5 mg of levocetirizine diHCl was capsuled by the
LUMC pharmacy. Identically-looking placebo capsules were also prepared by the pharmacy.
Presentation of the CS and UCS or placebo in both the acquisition and evocation sessions was
accompanied by a brief instruction that emphasized: 1) that it was important that the beverage
and capsule were taken simultaneously, and 2) that the experimenter did not know whether the
capsule contained active medication or an inert substance (for the open-label conditioned group,
a different instruction was used, see ‘5.1. Open-label instructions’).
5. Elaboration on materials and measures
5.1. Open-label instructions
At the start of the acquisition phase, participants in the open-label conditioned group were
provided with scripted instructions regarding five points: 1) that part of the effects of anti-
allergic medication can be learned through the principle of conditioning, 2) that an example of
conditioning is the experiment of Pavlov, in which a dog was taught to respond to the ringing
of a bell with salivating, by pairing this sound with food, 3) that this learning paradigm can be
utilized for medication use by, for example, pairing medication with a beverage, 4) that these
effects may be large, and potentially just as large as the effects of the medication itself, and 5)
that effects may be noticed in the evocation phase, for example, as improved performance on
the spirometry tests and reduced itch during iontophoresis in the final session. During each
session, administration of the beverage and capsule was accompanied by instructions that
consisted of a brief repetition of points 1 and 4. In addition, point 5 was briefly repeated at the
start of the final session.
1 Three participants (1 in the open-label conditioned group, 2 in the conditioned-not-evoked group) received a
beverage containing 160 mg/L of Quinoline Yellow and 40 mg/L of Patent Blue due to administrative error.
Subanalyses of the total sample without these participants indicated no differences in the main results.
6
5.2. Histamine iontophoresis
Itch was evoked experimentally by transdermal histamine iontophoresis (Chattanooga Group,
Hixson, TN, USA) at baseline and during the final evocation session. Histamine iontophoresis
has been previously used as a reliable method to induce itch in healthy participants (8-11). An
electrode with an active surface of 11.7 cm2 (Iogel, Iomed, DJO Global, Hannover, Germany)
was treated with 2.5 ml of a 0.6% diphosphate histamine solution (prepared in distilled water
with propylene glycol and Hypromellose 4000 mPa; equivalent to 1% histamine
dihydrochloride). The prepared electrode was placed on the volar side of the non-dominant
forearm. A reference electrode was placed on the volar surface of the upper arm. Histamine
iontophoresis was conducted for 2.5 minutes with the current level set at 0.4 mA.
5.3. Primary outcome measure: self-reported itch
During iontophoresis, itch was assessed verbally every 30 seconds on a Numeric Rating Scale
(NRS) ranging from 0 (‘no itch’) to 10 (‘worst itch ever experienced’). Directly following
iontophoresis, mean self-reported itch during the test was assessed using the same NRS.
Between 1 and 4 minutes after iontophoresis, itch was again assessed every 30 seconds as a
follow-up period to the test. Mean self-reported itch during iontophoresis assessed directly
following iontophoresis was used as the primary outcome measure, and correlations with other
itch measures taken during iontophoresis were calculated in order to validate the reliability of
the main outcome measure.
5.4. Secondary outcome measures
5.4.1. Expectations regarding histamine iontophoresis
Participants rated the amount of itch they expected to experience during iontophoresis on the
same NRS as used for the itch assessments. Measures of expectations were taken at the start of
7
both the screening session and the final evocation session. Moreover, participants rated the
amount of itch they expected to experience during the final evocation session at the end of the
screening session (following the first iontophoresis test). Finally, using the same NRS,
participants rated, prior to histamine iontophoresis in the final evocation session, how much
itch they remembered experiencing at baseline (screening session), as well as the expected
efficacy of the administered capsules (0 ‘not effective’, 10 ‘very effective’).
5.4.2. Self-rated skin response
Self-rated skin response was measured using an adjusted version of the Sensitive Scale-10 (SS-
10; (12)). This questionnaire assesses a variety of skin symptoms that are either subjectively
experienced (e.g., itch, tingling, burning, pain), or visibly rateable (e.g., redness of the skin).
Symptoms are rated on a 0 (‘zero intensity’) to 10 (‘intolerable intensity’) scale. Total scores
are calculated by summing across items. For the purpose of the current study, the timeframe for
which the symptoms were rated was tailored to histamine iontophoresis (i.e., ‘during the
histamine test’, rather than the original ‘during the past three days’). As a baseline
measurement, participants also filled in the original questionnaire. Cronbach’s alpha was .58
for the original questionnaire in the current study. For the adjusted SS-10 following histamine
iontophoresis at baseline and during evocation, Cronbach’s alpha was .88 and .89, respectively.
5.4.3. Clinical skin response
A 1 cm2 gridded, transparent sheet was used to trace the wheal and flare area in response to
histamine iontophoresis. The outer edges of the drawn areas were retraced in ImageJ (13), after
which the areas of the wheal and flare response were calculated in cm2. Skin temperature
following iontophoresis was measured using a handheld infrared thermometer (accuracy ±2.0
°C, resolution 0.1 °C, BaseTech, Conrad Electronic Benelux B.V., Hirschau, Germany).
8
Measurements were taken with the thermometer held approximately 1 cm above the centre of
the wheal. A similar measurement was taken on the same area of skin on the opposite arm, to
control for individual differences in skin temperature. Increase in skin temperature as a result
of iontophoresis was calculated by subtracting temperature of the control area from temperature
of the wheal area, with positive values indicating a higher skin temperature increase following
iontophoresis.
5.4.4. Spirometry
Spirometry was performed in accordance with the American Thoracic Society/European
Respiratory Society (ATS/ERS) Task Force guidelines on the Standardisation of Lung Function
Testing (14). The experimenters were trained in spirometry by certified technicians at the
LUMC. Tests were performed using a mounted, non-heated Lilly type pneumotachograph and
SentrySuite software package Version 2.7 (Carefusion, Hoechberg, Germany). For FVC and
FEV1, percentages of the predicted scores were calculated using the standard DE#GLI 2012
reference values (15). Tests that did not meet the acceptability and repeatability criteria were
excluded from analyses.
5.4.5. Heart rate and skin conductance level
Heart rate (HR; in beats per minute, BPM) and skin conductance level (SCL) were measured
during the screening session and during the sessions of the evocation phase. Measurements
were taken using an MP150 system and Acqknowledge software, version 4.4 (BIOPAC
Systems Inc., Goleta, CA, USA). As has been done previously by our research group (16), the
skin was abraded with Nuprep scrub (Weaver and Company, Aurora, CO, USA) in preparation
of the HR measurements, after which two disposable electrodes were placed (Ø 38 mm; Kendall
200 Foam Electrode, Covidien, Mansfield, MA, USA) on the sternum and on the participant’s
9
left side below the ribs. An ECG100C amplifier at 100 Hz with a gain of 100, a 0.5-Hz high
pass and a 35-Hz low pass filter, and a 50-Hz notch filter measured the electrocardiography
signals. The skin was cleaned with water in preparation of the SCL measurements, after which
two disposable Ag/AgCl electrodes (Ø 32 mm; DBF3D77, Multi Bio Sensors Inc., El Paso, TX,
USA) were placed on the medial phalanges of the index and middle finger of the non-dominant
hand. A GSR100C amplifier at 1000 Hz with a gain of 10 μmho/V and a 1.0-Hz low pass filter
recorded SCL. Five-minute HR and SCL resting state measurements were taken, once in the
screening session, and at various time points during evocation (i.e., prior to, and every 30
minutes post-CS administration). Visual inspection of the data and calculation of mean HR and
SCL were done using the Physio Data Toolbox Version 0.1 (17), a standalone MATLAB-based
application (MATLAB Release 2016a, The MathWorks, Inc., Natick, MA, USA) that was
written at the Faculty of Social and Behavioural Sciences at Leiden University.
5.4.6. Self-rated wellbeing
Self-rated wellbeing was measured throughout the study by means of questionnaires. To
measure positive affect (PA) and negative affect (NA), the 20-item Positive and Negative Affect
Schedule (PANAS; (18)) was administered. Cronbach’s alpha ranged from .88 to .93 for PA in
the current study. As the scores for NA were only within the lower range of the scale for all
participants, NA data were not analysed. A short 6-item version of the State Trait Anxiety Index
– State Anxiety (STAI-S-s; (19)) was administered to assess state anxiety. Cronbach’s alpha
ranged from .66 to .81. In addition, participants were asked to rate seven psychological states
(relaxed, nervous, calm, well, tense, concerned, stressed) on Numeric Rating Scales (NRS)
ranging from 0 (‘not at all’) to 10 (‘very much so’). The four negative items were recoded and
all NRS were summed and divided by seven to calculate a general wellbeing score, for which
Cronbach’s alpha ranged from .81 to .91.
10
5.4.7. Taste of the Conditioned Stimulus (CS)
Following each administration of the CS in the acquisition and evocation phase, participants
rated the taste of the beverage on a 9-point Likert scale (1 ‘very unpleasant’ to 9 ‘very
pleasant’). For the conditioned-not-evoked group, the CS was not administered during the
evocation phase. Instead, the capsule was administered with water and, to standardise
procedures over all groups, participants were asked to rate the taste of the water. The ratings of
water during the evocation phase for the conditioned-not-evoked group were not analysed.
5.5. Additional measures: potential predictors of conditioned effects
5.5.1. Atopic constitution and allergy
To assess whether participants were allergic or had a tendency towards allergic or overly
sensitive responses (atopic constitution), participants were asked during the screening to
indicate whether they had ever experienced any allergic responses to food, animals or pollen.
In case of severe allergic responses, e.g., throat swelling, or in case of recent allergic responses,
participants were excluded. In addition, blood samples were taken at the LUMC, to assess
eosinophil profile and to conduct an allergy test using the blood Immunoglobulin-E (IgE)
response to inhalant allergens. Blood samples were treated with a mixture of various
aeroallergens (i.e., dust mite, grass pollen, animals, birch, mugwort) and the IgE response was
measured and divided into semiquantitative classes to determine sensitization level (20). Data
were collected in order to assess – in the event of significant effects of conditioning on the
outcome parameters – whether these effects may potentially differentiate between subgroups
of participants. Of all participants, 27 (31%) indicated being allergic to either food products or
aeroallergens, and 34 (37%) responded positively on the aeroallergen IgE test.
11
5.5.2. Individual characteristics
Individual characteristics and personality factors were assessed during the screening session.
Participants filled in the following questionnaires: a multidimensional measure of general
health status, the RAND SF-36 Health Status Inventory (RAND-36 (21)), the Behavioural
Inhibition System / Behavioural Approach System scales (BIS/BAS scales (22)), the Eysenck
Personality Questionnaire short version – subscales extraversion and neuroticism (EPQ-RSS-
EN (23)), the Hospital Anxiety and Depression Scale (HADS (24)), the Life Orientation Test –
revised (LOT-R (25)), the Perceived Stress Scale (PSS (26)), and the Penn State Worry
Questionnaire (PSWQ (27)). Potential moderating effects of individual characteristics were
tested and are described in the supplementary material (see section 7.5.).
6. Elaboration on the general procedure
6.1. Pre-enrolment procedures and additional details on the screening session
Prior to the study, potential participants were briefly screened for the in- and exclusion criteria
by telephone, and subsequently, potentially eligible participants were invited to the laboratory
for a first (screening) session. An interview was used to further assess whether participants met
the inclusion criteria (e.g., presence of any psychological diagnoses according to the DSM-IV
criteria). Afterwards, questionnaires assessing individual characteristics and personality factors
were filled in, and measurement sets A, B and C were assessed. At the end of the screening
session, blood samples were collected at the LUMC to assess eosinophil profile and
immunoglobulin-E (IgE) response to aeroallergens for potential subgroup analyses, as well as
potential analyses of baseline cytokine levels.
12
6.2. Acquisition and evocation phase
The acquisition and evocation phases were scheduled within the same 30-minutes time frame
in the next two weeks. Within each phase, all sessions started at the same time on three
consecutive days. At the start of each session, participants were given an overview of the
procedures of that day, and a brief interview was conducted (e.g., to verify adherence to lifestyle
guidelines). Within the evocation phase, participants completed several neutral filler tasks (e.g.,
reading neutral magazines, and filling out Sudoku and word search puzzles) for the purpose of
standardising the time that participants had to spend waiting between measurements. At the end
of the final evocation session, participants filled out a closing questionnaire, in which they were
asked, for example, whether they believed to have received active medication, and were
debriefed about the study purpose. Finally, participants were asked to provide a saliva sample
in order to test associations between genotype and the conditioned response (the results of
which will be described elsewhere), and a second blood sample was taken at the LUMC to
potentially assess blood cytokine levels.
7. Elaboration on statistical analysis
7.1. Pre-analyses checks of data and assumptions
Prior to analyses, variables were checked for normal distribution and outliers, and underlying
assumptions for each analysis were checked. To detect differences in demographics and
baseline measures of the study outcome parameters, χ2 tests and general linear model (GLM)
analyses of variance (ANOVAs) were used. For wellbeing during the acquisition phase, and
taste ratings for the CS throughout the study, GLM ANOVAs were also performed.
13
7.2. Reliability of primary outcome measure
The primary outcome measure of mean self-reported itch at evocation correlated highly with
the calculated average of the itch measures taken during histamine iontophoresis at evocation
(r = .96, p < .001), supporting the reliability of the primary outcome measure used for itch.
7.3. Covariates included in the analyses of the primary and secondary outcomes
All GLM analyses of covariance (ANCOVAs) conducted for expected itch, self-reported mean
itch, and the self-rated and clinical skin response were controlled for baseline values (screening
session). Expected itch was assessed twice during the screening session: once prior to baseline
histamine iontophoresis, and once following baseline iontophoresis (as a measure assessing the
amount of itch participants expected to experience during the final evocation session). The latter
was included as a covariate in the ANCOVA. For remembered itch and expected efficacy of
the capsules, no covariates were included. For the clinical skin response measures of wheal and
flare area an additional covariate was included, which consisted of the amount of time between
the end of iontophoresis and the drawing of the affected skin areas onto the transparent sheet,
in order to control for changes in skin response over time.
7.4. Missing data
Due to technical issues with the equipment for histamine iontophoresis, data of one participant
was excluded for the analyses of outcome parameters related to histamine iontophoresis (i.e.,
expected itch, measurement set C). Due to technical issues and the occurrence of artefacts (e.g.,
a significant number of extra systoles in HR data), HR and SCL data were not reliable for 4
participants. Subsequently, these participants were excluded from the analyses. For spirometry,
only data of participants who performed well on all MEFV curves assessed during evocation
(i.e., all 10 tests taken during evocation meeting the ATS/ERS criteria for acceptability and
14
repeatability, to prevent that the group composition changed for each time point in the study)
were included in subsequent analyses, resulting in loss of data of 45 participants. Since
conditioning only marginally influenced the primary outcome of itch, no further subgroup
analyses based on allergic constitution were conducted, nor were the blood samples analysed
for cytokine levels.
7.5. Testing the moderating role of individual characteristics and personality in conditioning
the effects of antihistamines for itch
To assess whether individual characteristics would influence conditioning effects on the main
outcome of self-reported itch during iontophoresis, controlled for baseline, moderation analyses
were conducted according to the Preacher and Hayes moderation regression method PROCESS
3.3. (28). For each individual characteristic (predictor of the conditioned response), a separate
moderation model was tested two-sided with an alpha level of .05. Analyses were first
conducted for the combined conditioned versus the combined control groups, and then repeated
to assess effects for the separate four groups. Bootstrap was set at 5000 samples in PROCESS,
and conditional effects were probed at -1SD, the mean, and +1SD. Prior to analyses, group
differences in individual characteristics were assessed by one-way ANOVA, and the
assumptions of regression were checked. In addition, the predictors were centered, and the
group variables were dummy coded prior to moderation analyses (with the non-conditioned
control group serving as the reference group). For some predictors (i.e., the RAND-36, the
EPQ-RSS-EN, and the HADS subscales), there was very low variance in scores between
individuals, and scores were non-normally distributed. For these factors, moderation analyses
were not conducted.
15
Supplementary Results
1. Group differences on individual characteristics and personality
No significant differences between the combined conditioned groups and the combined control
groups were found for individual characteristics (all p>.13), with the exception of optimism
(LOT-R; F(1,89)=6.07, p=.016). Participants in the conditioned groups scored higher on
optimism (M=18.33±2.72) compared to the control groups (M=16.93±2.67). Repetition of these
analyses for the separate groups showed that factors did not significantly differ between groups
(p≥.072). An overview of individual characteristics of the study sample is provided in
Supplementary Table S6.
2. Moderating role of individual characteristics and personality in conditioning the effects of
antihistamine for itch: the combined conditioned and combined control groups.
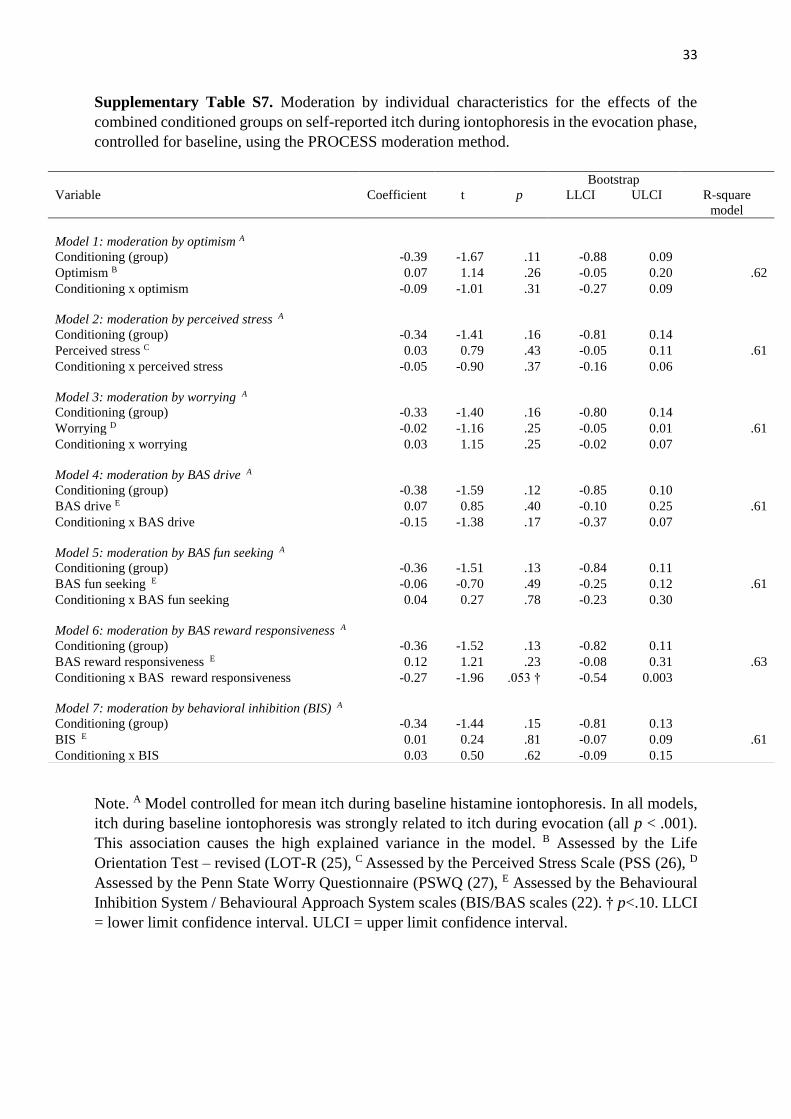
No significant moderation of the effect of the combined conditioned and the combined control
groups on mean itch in response to iontophoresis during evocation was found for optimism,
perceived stress, worrying, behavioural activation scales (BAS) drive, fun seeking, and reward
responsiveness, or behavioural inhibition scale (BIS) (all group x factor interactions: p≥.053;
see Supplementary Table S7).
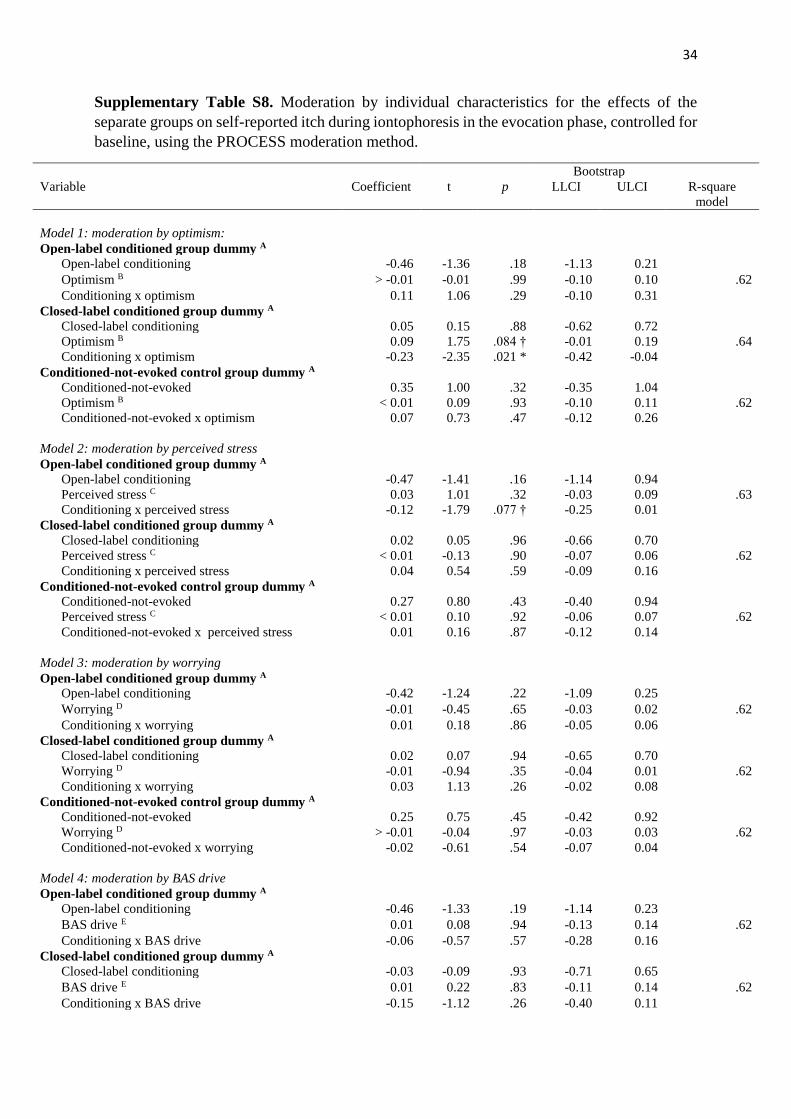
3. Moderating role of individual characteristics and personality in conditioning the effects of
antihistamines for itch: separate groups
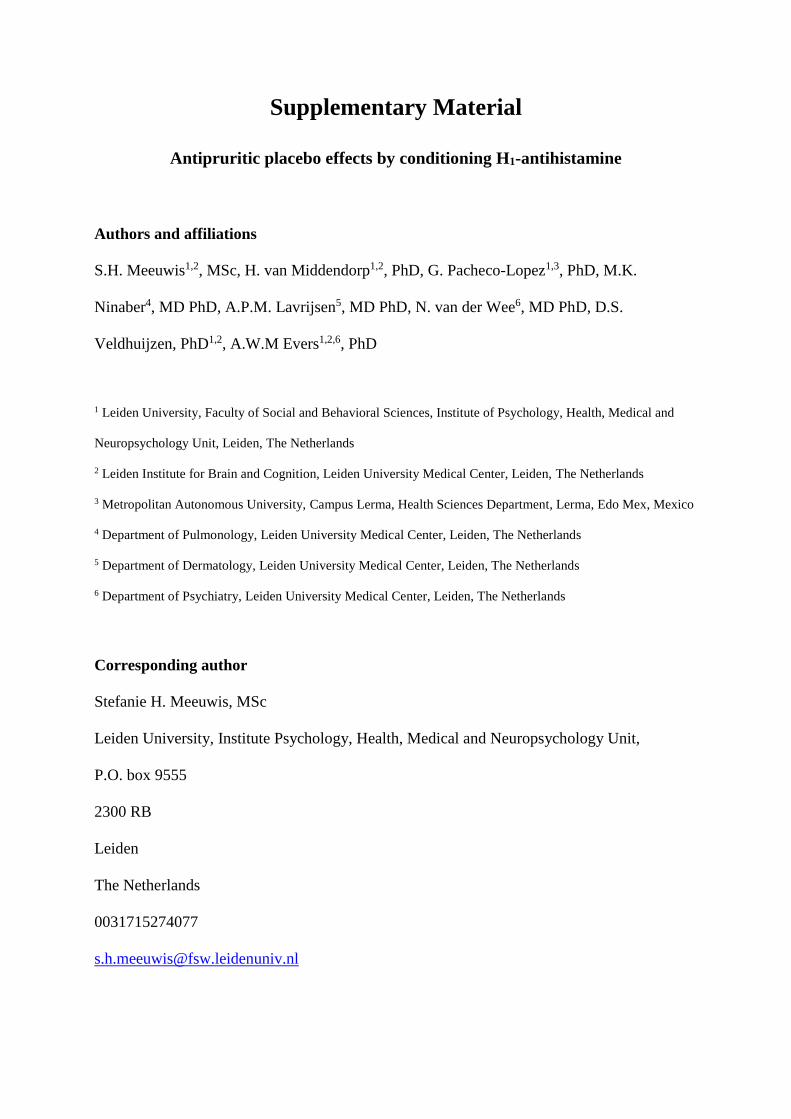
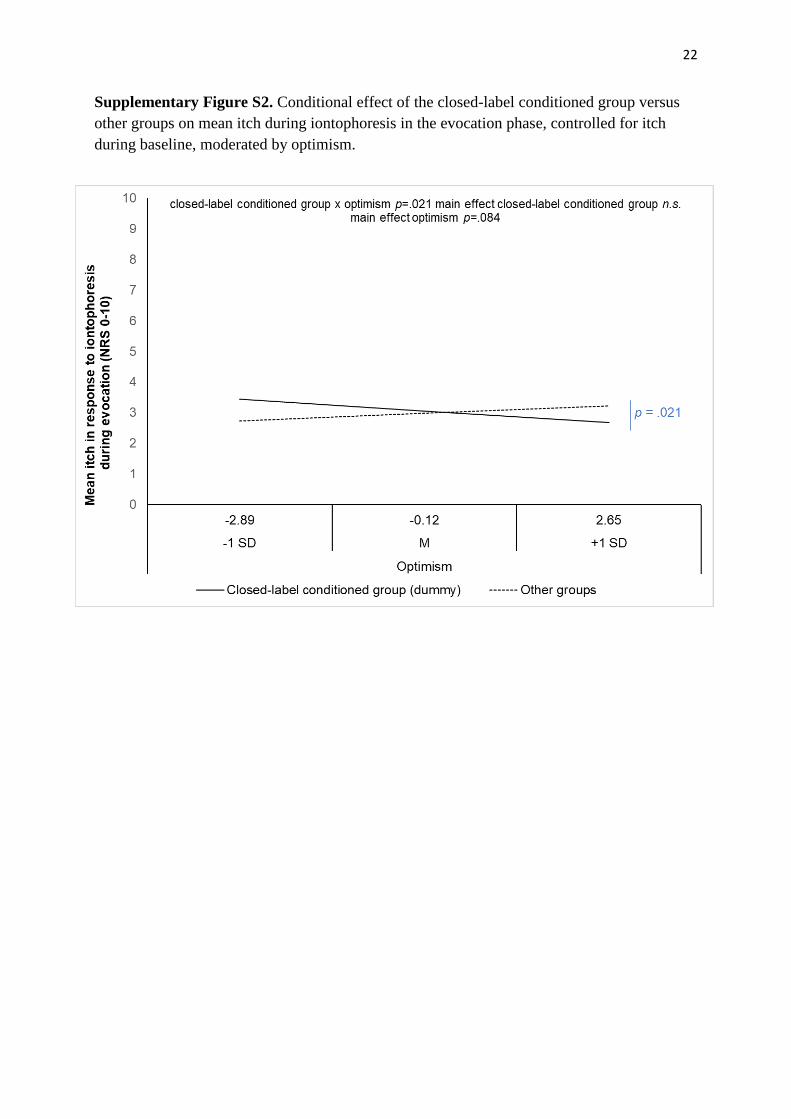
Optimism was found to moderate the effects of closed-label conditioning on mean itch in
response to iontophoresis during evocation, compared to the other groups (closed-label
conditioning dummy variable x optimism interaction: p=.021; see Supplementary Table S8).
Higher levels of optimism were related to lower levels of mean itch in the closed-label
16
conditioned group, compared to the other groups (see Supplementary Figure S2). However,
post-hoc conditional effects of group at various levels of optimism were not significant (p≥.12).
For the other dummy group factors, no effects were found (all pinteraction≥ .29).
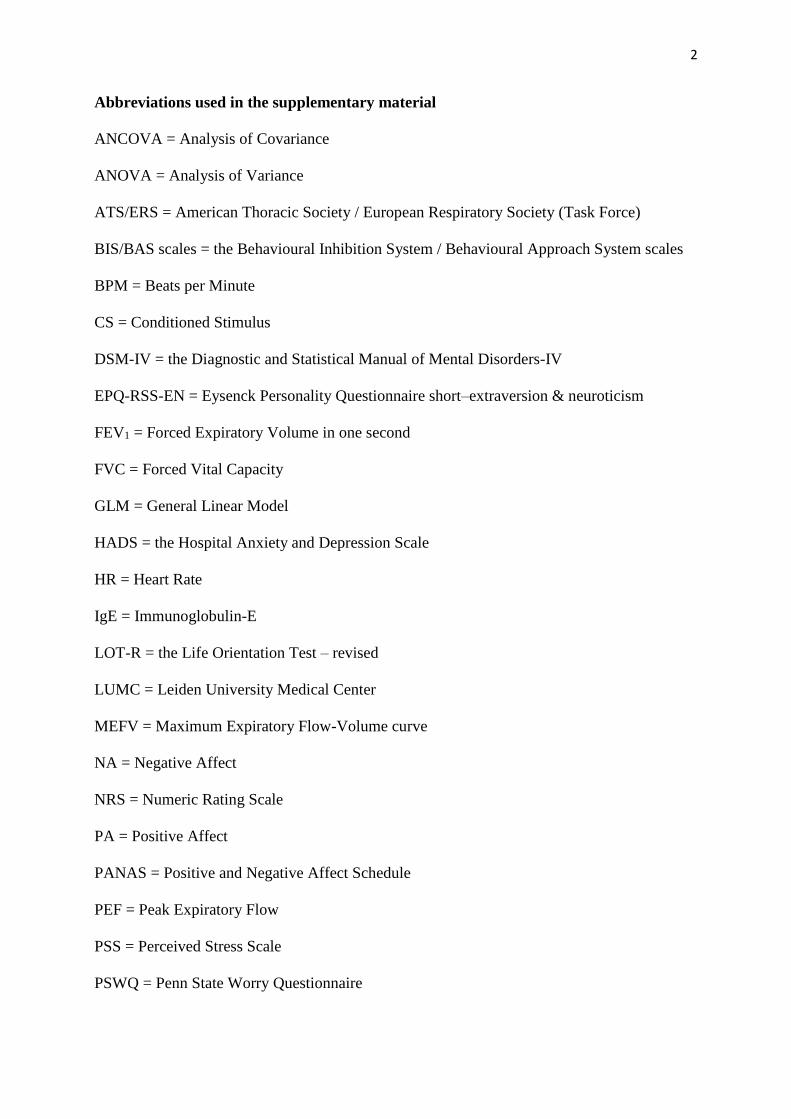
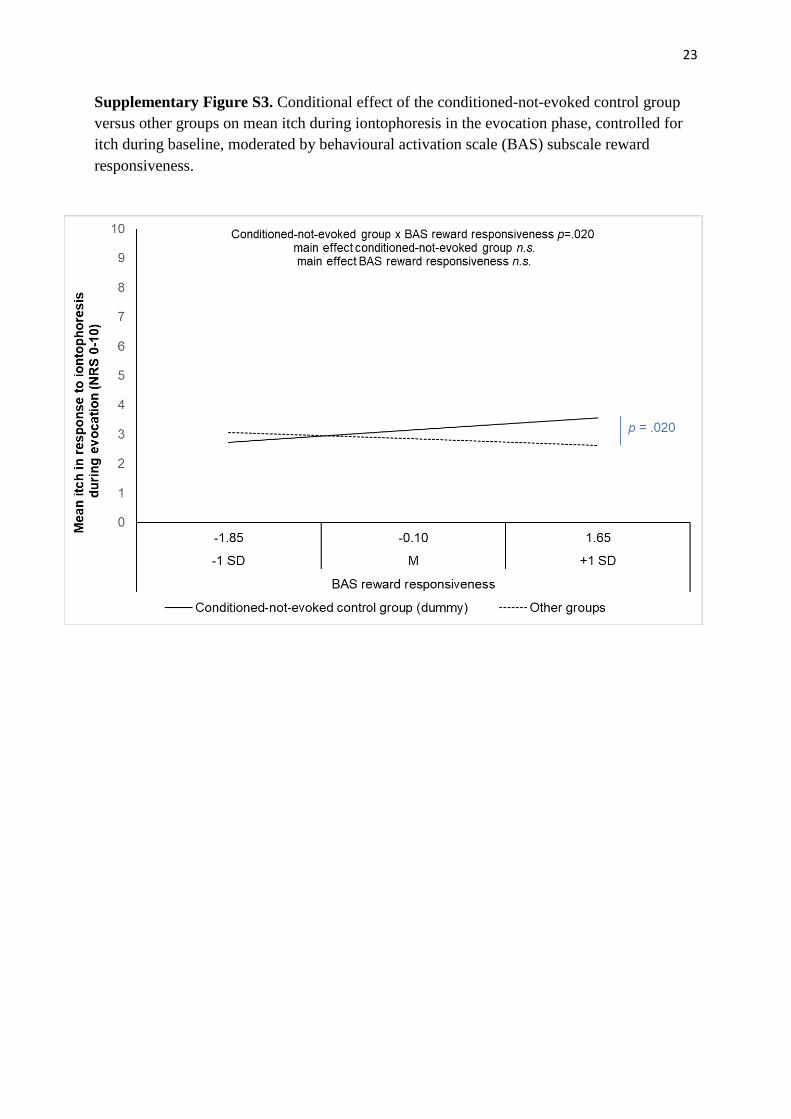
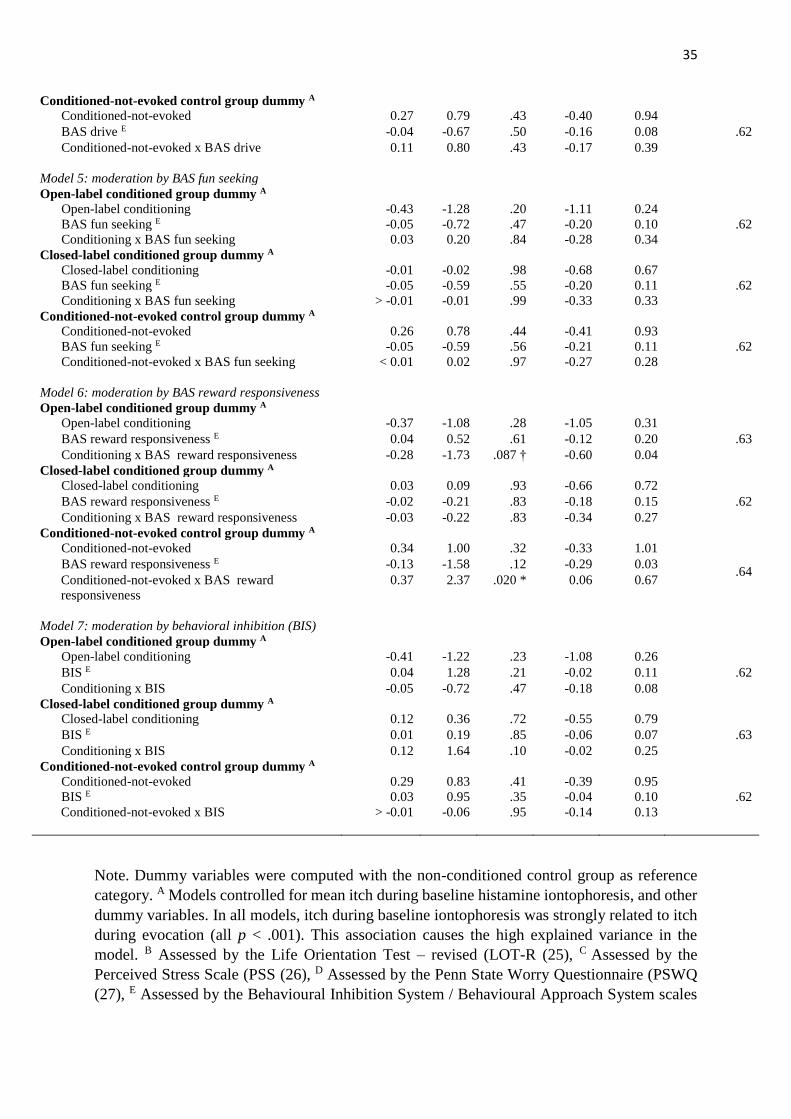
BAS reward responsiveness was found to significantly moderate the effect of the conditioned-
not-evoked group on mean itch in response to iontophoresis during evocation, compared to the
other groups (conditioned-not-evoked dummy variable x BAS reward responsiveness: p=.020).
Higher levels of reward responsiveness were significantly associated with higher levels of mean
itch in the conditioned-not-evoked group, compared to other groups (conditional effect at +1
SD of BAS reward responsiveness: t=2.18, p=.032; see Supplementary Figure S3). For the
other dummy group factors, no effects were found (all pinteraction≥ .087). Finally, group effects
were not significantly moderated by worrying, perceived stress, behavioural activation scales
(BAS) drive and fun seeking, or behavioural inhibition scale (BIS) (all group x factor
interactions: p≥.077; see Supplementary Table S8).
Concluding note on the moderating role of individual characteristics and personality in
conditioning the effects of antihistamine for itch
Some evidence was found for a moderating role for optimism in the closed-label conditioned
group compared to others, however, post-hoc conditional effects at various levels of optimism
were not significant, illustrating that such an effect may be limited. These results need to be
interpreted very cautiously, especially given that the groups differed in optimism at baseline.
Finally, a potential moderating effect of BAS reward responsiveness within one of the control
groups was shown, with higher reward responsiveness being related to higher itch compared to
other groups. This moderation is likely not related to the conditioning procedure, as this
moderation also encompassed differences compared to the other control group.
17
Supplementary material references
1. World Medical Association. Declaration of Helsinki: ethical principles for medical
research involving human subjects. Jama 2013; 310(20): 2191-4.
2. Albring A, Wendt L, Ober K, Engler H, Freundlieb C, Witzke O, . . . Schedlowski M.
Behavioral conditioning and cognitive expectation in placebo-induced
immunosuppression in humans. Neuroimmunomodulation 2011; 18(6): 361-.
3. Goebel MU, Meykadeh N, Kou W, Schedlowski M, Hengge UR. Behavioral
conditioning of antihistamine effects in patients with allergic rhinitis. Psychother
Psychosom 2008; 77(4): 227-34.
4. Goebel MU, Trebst AE, Steiner J, Xie YF, Exton MS, Frede S, . . . Schedlowski M.
Behavioral conditioning of immunosuppression is possible in humans. The FASEB
journal 2002; 16(14): 1869-73.
5. Grigoleit J-S, Kullmann JS, Winkelhaus A, Engler H, Wegner A, Hammes F, . . .
Schedlowski M. Single-trial conditioning in a human taste-endotoxin paradigm
induces conditioned odor aversion but not cytokine responses. Brain Behav Immun
2012; 26(2): 234-8.
6. Vits S, Cesko E, Benson S, Rueckert A, Hillen U, Schadendorf D, Schedlowski M.
Cognitive factors mediate placebo responses in patients with house dust mite allergy.
PLoS ONE 2013; 8(11): e79576.
7. Wirth T, Ober K, Prager G, Vogelsang M, Benson S, Witzke O, . . . Schedlowski M.
Repeated recall of learned immunosuppression: evidence from rats and men. Brain
Behav Immun 2011; 25(7): 1444-51.
8. Bartels DJP, van Laarhoven AIM, Haverkamp EA, Wilder-Smith OH, Donders ART,
van Middendorp H, . . . Evers AWM. Role of conditioning and verbal suggestion in
placebo and nocebo effects on itch. PLoS ONE 2014; 9(3): e91727.
18
9. Meeuwis SH, van Middendorp H, Veldhuijzen DS, van Laarhoven AIM, De Houwer
J, Lavrijsen APM, Evers AWM. Placebo effects of open-label verbal suggestions on
itch. Acta Derm Venereol 2018; 98(2): 268-74.
10. Skvortsova A, Veldhuijzen DS, Van Middendorp H, Van den Bergh O, Evers AWM.
Enhancing Placebo Effects in Somatic Symptoms Through Oxytocin. Psychosom Med
2018; 80(4): 353-60.
11. van Laarhoven AIM, Vogelaar ML, Wilder-Smith OH, van Riel PLCM, van de
Kerkhof PCM, Kraaimaat FW, Evers AWM. Induction of nocebo and placebo effects
on itch and pain by verbal suggestions. Pain 2011; 152(7): 1486-94.
12. Misery L, Jean-Decoster C, Mery S, Georgescu V, Sibaud V. A new ten-item
questionnaire for assessing sensitive skin: the sensitive scale-10. Acta Derm Venereol
2014; 94(6): 635-9.
13. Schneider CA, Rasband WS, Eliceiri KW. NIH Image to ImageJ: 25 years of image
analysis. Nature methods 2012; 9(7): 671-5.
14. Brusasco V, Crapo R, Viegi G. Coming together: the ATS/ERS consensus on clinical
pulmonary function testing. The European respiratory journal 2005; 26(1): 1-2.
15. Quanjer P, Stanojevic S, Cole T, Baur X, Hall G, Culver B, . . . Stocks. Multi-ethnic
reference values for spirometry for the 3-95-yr age range: The global lung function
2012 equations. Eur Respir J 2012; 40(6): 1324-43.
16. Peerdeman KJ, Van Laarhoven AIM, Donders ART, Hopman MTE, Peters ML, Evers
AWM. Inducing expectations for health: effects of verbal suggestion and imagery on
pain, itch, and fatigue as indicators of physical sensitivity. PLoS ONE 2015; 10(10):
e0139563.
17. Sjak-Shie EE. PhysioData Toolbox (Version 0.1). 2016.
19
18. Watson D, Clark LA, Tellegen A. Development and validation of brief measures of
positive and negative affect: the PANAS Scales. J Pers Soc Psychol 1988; 54(6):
1063-70.
19. Spielberger CD, Manual for the State-Trait Anxiety Inventory. Revised edition ed.
1983, Palo Alto, CA: Consulting Psychologists Press.
20. Siles RI, Hsieh FH. Allergy blood testing: A practical guide for clinicians. Cleveland
Clinic journal of medicine 2011; 78(9): 585-92.
21. Hays RD, Sherbourne CD, Mazel RM. The RAND 36-Item Health Survey 1.0. Health
Econ 1993; 2(3): 217-27.
22. Carver C, White TL. Behavioral inhibition, behavioral activation, and affective
responses to impending reward and punishment: The BIS/BAS Scales. J Pers Soc
Psychol 1994; 67(2): 319.
23. Eysenck HJ, Eysenck SBG. EPQ (Eysenck Personality Questionnaire). Educational
and Industrial Testing Service 1975.
24. Zigmond AS, Snaith RP. The Hospital Anxiety and Depression Scale. Acta Psychiatr
Scand 1983; 67: 361-70.
25. Scheier M, Carver C, Bridges M. Distinguishing optimism from neuroticism (and trait
anxiety, self-mastery, and self-esteem): A reevaluation of the Life Orientation Test. J
Pers Soc Psychol 1994; 67(6): 1063-78.
26. Cohen S, Kamarck T, Mermelstein R. A Global Measure of Perceived Stress. J Health
Soc Behav 1983; 24(4): 385-96.
27. Meyer TJ, Miller ML, Metzger RL, Borkovec T. Development and validation of the
penn state worry questionnaire. Behav Res Ther 1990; 28(6): 487-95.
28. Hayes AF, Introduction to mediation, moderation, and conditional process analysis: A
regression-based approach. 2017: Guilford Publications.
20
Supplementary Material
Tables and Figures
21
Supplementary figures
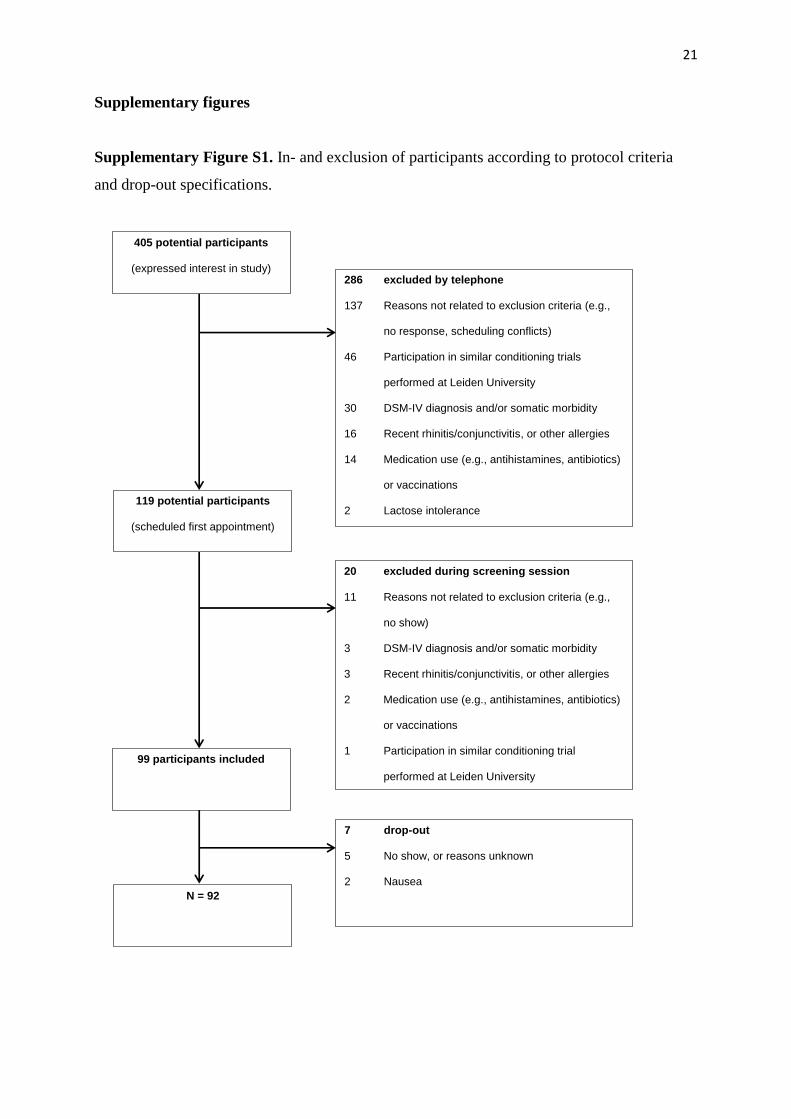
Supplementary Figure S1. In- and exclusion of participants according to protocol criteria
and drop-out specifications.
405 potential participants
(expressed interest in study) 286 excluded by telephone
137 Reasons not related to exclusion criteria (e.g.,
no response, scheduling conflicts)
46 Participation in similar conditioning trials
performed at Leiden University
30 DSM-IV diagnosis and/or somatic morbidity
16 Recent rhinitis/conjunctivitis, or other allergies
14 Medication use (e.g., antihistamines, antibiotics)
or vaccinations
2 Lactose intolerance 119 potential participants
(scheduled first appointment)
20 excluded during screening session
11 Reasons not related to exclusion criteria (e.g.,
no show)
3 DSM-IV diagnosis and/or somatic morbidity
3 Recent rhinitis/conjunctivitis, or other allergies
2 Medication use (e.g., antihistamines, antibiotics)
or vaccinations
1 Participation in similar conditioning trial
performed at Leiden University
99 participants included
N = 92
7 drop-out
5 No show, or reasons unknown
2 Nausea
22
Supplementary Figure S2. Conditional effect of the closed-label conditioned group versus
other groups on mean itch during iontophoresis in the evocation phase, controlled for itch
during baseline, moderated by optimism.
23
Supplementary Figure S3. Conditional effect of the conditioned-not-evoked control group
versus other groups on mean itch during iontophoresis in the evocation phase, controlled for
itch during baseline, moderated by behavioural activation scale (BAS) subscale reward
responsiveness.
24
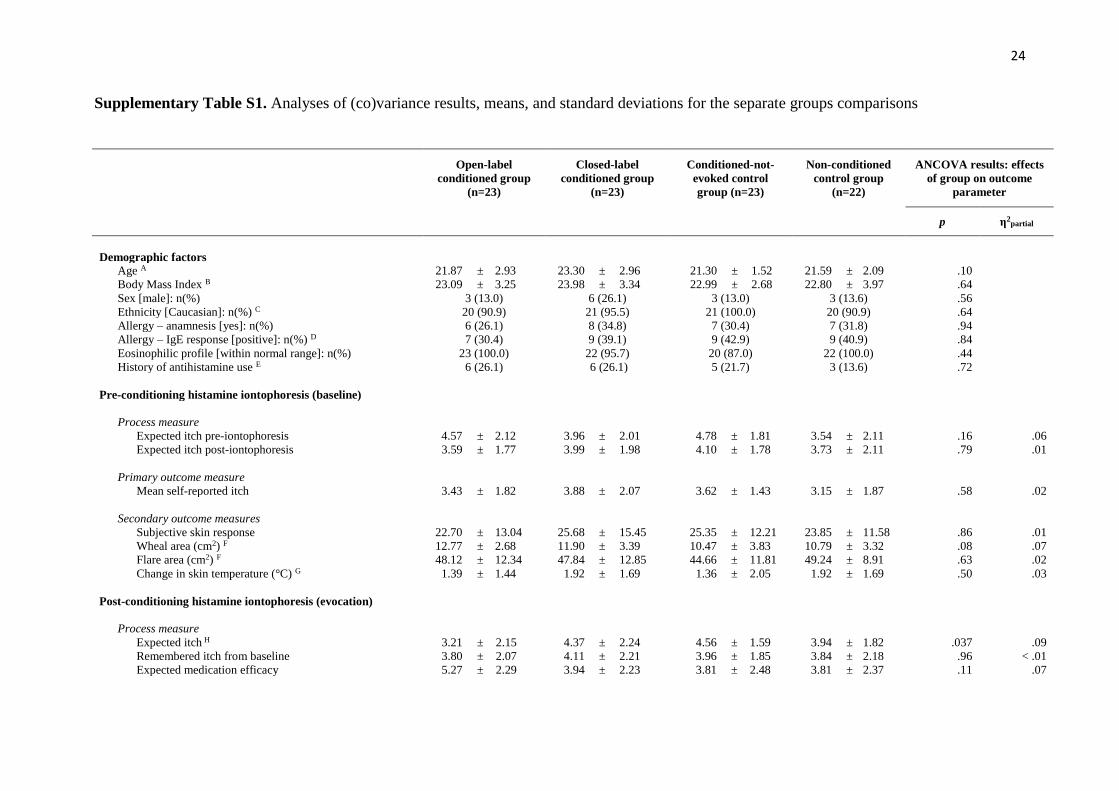
Supplementary Table S1. Analyses of (co)variance results, means, and standard deviations for the separate groups comparisons
Open-label
conditioned group
(n=23)
Closed-label
conditioned group
(n=23)
Conditioned-not-
evoked control
group (n=23)
Non-conditioned
control group
(n=22)
ANCOVA results: effects
of group on outcome
parameter
p η2
partial
Demographic factors
Age A 21.87 ± 2.93 23.30 ± 2.96 21.30 ± 1.52 21.59 ± 2.09 .10
Body Mass Index B 23.09 ± 3.25 23.98 ± 3.34 22.99 ± 2.68 22.80 ± 3.97 .64
Sex [male]: n(%) 3 (13.0) 6 (26.1) 3 (13.0) 3 (13.6) .56
Ethnicity [Caucasian]: n(%) C 20 (90.9) 21 (95.5) 21 (100.0) 20 (90.9) .64
Allergy – anamnesis [yes]: n(%) 6 (26.1) 8 (34.8) 7 (30.4) 7 (31.8) .94
Allergy – IgE response [positive]: n(%) D 7 (30.4) 9 (39.1) 9 (42.9) 9 (40.9) .84
Eosinophilic profile [within normal range]: n(%) 23 (100.0) 22 (95.7) 20 (87.0) 22 (100.0) .44
History of antihistamine use E 6 (26.1) 6 (26.1) 5 (21.7) 3 (13.6) .72
Pre-conditioning histamine iontophoresis (baseline)
Process measure
Expected itch pre-iontophoresis 4.57 ± 2.12 3.96 ± 2.01 4.78 ± 1.81 3.54 ± 2.11 .16 .06
Expected itch post-iontophoresis 3.59 ± 1.77 3.99 ± 1.98 4.10 ± 1.78 3.73 ± 2.11 .79 .01
Primary outcome measure
Mean self-reported itch 3.43 ± 1.82 3.88 ± 2.07 3.62 ± 1.43 3.15 ± 1.87 .58 .02
Secondary outcome measures
Subjective skin response 22.70 ± 13.04 25.68 ± 15.45 25.35 ± 12.21 23.85 ± 11.58 .86 .01
Wheal area (cm2) F 12.77 ± 2.68x 11.90 ± 3.39 10.47 ± 3.83 10.79 ± 3.32 .08 .07
Flare area (cm2) F 48.12 ± 12.34 47.84 ± 12.85 44.66 ± 11.81 49.24 ± 8.91 .63 .02
Change in skin temperature (°C) G 1.39 ± 1.44 1.92 ± 1.69 1.36 ± 2.05 1.92 ± 1.69 .50 .03
Post-conditioning histamine iontophoresis (evocation)
Process measure
Expected itch H 3.21 ± 2.15 4.37 ± 2.24 4.56 ± 1.59 3.94 ± 1.82 .037 .09
Remembered itch from baseline 3.80 ± 2.07 4.11 ± 2.21 3.96 ± 1.85 3.84 ± 2.18 .96 < .01
Expected medication efficacy 5.27 ± 2.29 3.94 ± 2.23 3.81 ± 2.48 3.81 ± 2.37 .11 .07
25
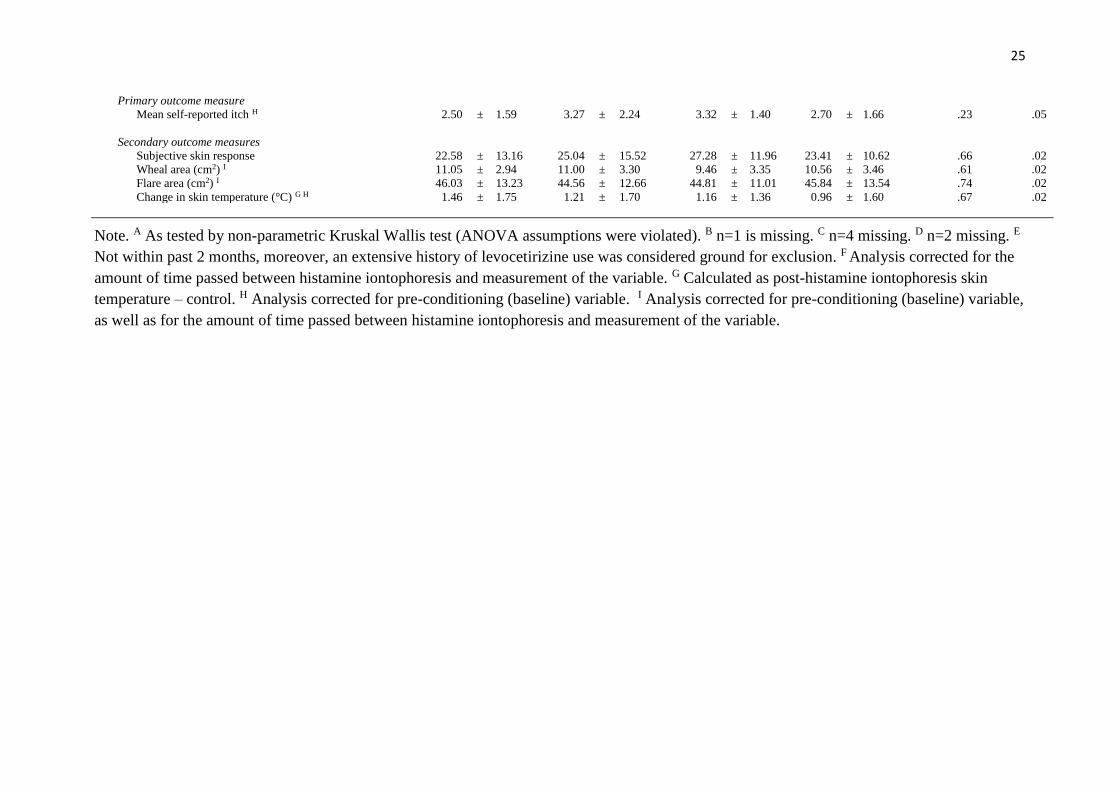
Primary outcome measure
Mean self-reported itch H 2.50 ± 1.59 3.27 ± 2.24 3.32 ± 1.40 2.70 ± 1.66 .23 .05
Secondary outcome measures
Subjective skin response 22.58 ± 13.16 25.04 ± 15.52 27.28 ± 11.96 23.41 ± 10.62 .66 .02
Wheal area (cm2) I 11.05 ± 2.94 11.00 ± 3.30 9.46 ± 3.35 10.56 ± 3.46 .61 .02
Flare area (cm2) I 46.03 ± 13.23 44.56 ± 12.66 44.81 ± 11.01 45.84 ± 13.54 .74 .02
Change in skin temperature (°C) G H 1.46 ± 1.75 1.21 ± 1.70 1.16 ± 1.36 0.96 ± 1.60 .67 .02
Note. A As tested by non-parametric Kruskal Wallis test (ANOVA assumptions were violated). B n=1 is missing. C n=4 missing. D n=2 missing. E
Not within past 2 months, moreover, an extensive history of levocetirizine use was considered ground for exclusion. F Analysis corrected for the
amount of time passed between histamine iontophoresis and measurement of the variable. G Calculated as post-histamine iontophoresis skin
temperature – control. H Analysis corrected for pre-conditioning (baseline) variable. I Analysis corrected for pre-conditioning (baseline) variable,
as well as for the amount of time passed between histamine iontophoresis and measurement of the variable.
26
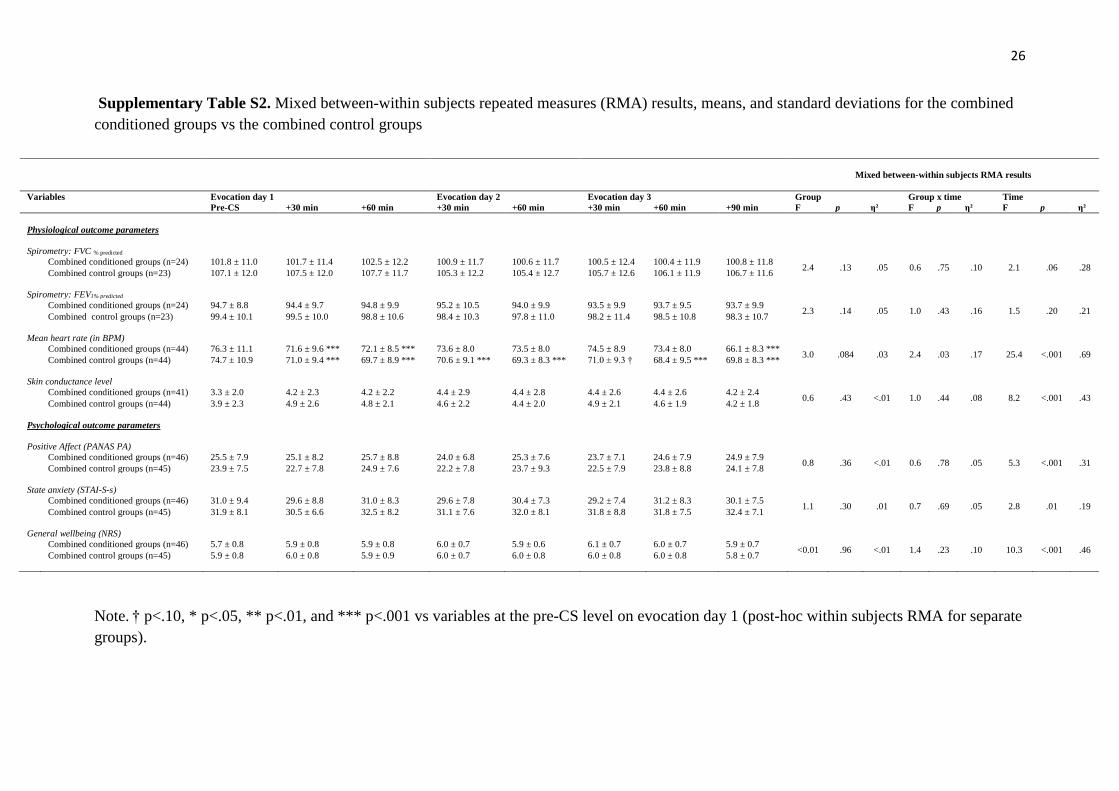
Supplementary Table S2. Mixed between-within subjects repeated measures (RMA) results, means, and standard deviations for the combined
conditioned groups vs the combined control groups
Note. † p<.10, * p<.05, ** p<.01, and *** p<.001 vs variables at the pre-CS level on evocation day 1 (post-hoc within subjects RMA for separate
groups).
Mixed between-within subjects RMA results
Variables Evocation day 1 Evocation day 2 Evocation day 3 Group Group x time Time
Pre-CS +30 min +60 min +30 min +60 min +30 min +60 min +90 min F p η² F p η² F p η²
Physiological outcome parameters
Spirometry: FVC % predicted
Combined conditioned groups (n=24) 101.8 ± 11.0 101.7 ± 11.4 102.5 ± 12.2 100.9 ± 11.7 100.6 ± 11.7 100.5 ± 12.4 100.4 ± 11.9 100.8 ± 11.8 2.4 .13 .05 0.6 .75 .10 2.1 .06 .28
Combined control groups (n=23) 107.1 ± 12.0 107.5 ± 12.0 107.7 ± 11.7 105.3 ± 12.2 105.4 ± 12.7 105.7 ± 12.6 106.1 ± 11.9 106.7 ± 11.6
Spirometry: FEV1% predicted
Combined conditioned groups (n=24) 94.7 ± 8.8 94.4 ± 9.7 94.8 ± 9.9 95.2 ± 10.5 94.0 ± 9.9 93.5 ± 9.9 93.7 ± 9.5 93.7 ± 9.9 2.3 .14 .05 1.0 .43 .16 1.5 .20 .21
Combined control groups (n=23) 99.4 ± 10.1 99.5 ± 10.0 98.8 ± 10.6 98.4 ± 10.3 97.8 ± 11.0 98.2 ± 11.4 98.5 ± 10.8 98.3 ± 10.7
Mean heart rate (in BPM)
Combined conditioned groups (n=44) 76.3 ± 11.1 71.6 ± 9.6 *** 72.1 ± 8.5 *** 73.6 ± 8.0 73.5 ± 8.0 74.5 ± 8.9 73.4 ± 8.0 66.1 ± 8.3 *** 3.0 .084 .03 2.4 .03 .17 25.4 <.001 .69
Combined control groups (n=44) 74.7 ± 10.9 71.0 ± 9.4 *** 69.7 ± 8.9 *** 70.6 ± 9.1 *** 69.3 ± 8.3 *** 71.0 ± 9.3 † 68.4 ± 9.5 *** 69.8 ± 8.3 ***
Skin conductance level
Combined conditioned groups (n=41) 3.3 ± 2.0 4.2 ± 2.3 4.2 ± 2.2 4.4 ± 2.9 4.4 ± 2.8 4.4 ± 2.6 4.4 ± 2.6 4.2 ± 2.4 0.6 .43 <.01 1.0 .44 .08 8.2 <.001 .43
Combined control groups (n=44) 3.9 ± 2.3 4.9 ± 2.6 4.8 ± 2.1 4.6 ± 2.2 4.4 ± 2.0 4.9 ± 2.1 4.6 ± 1.9 4.2 ± 1.8
Psychological outcome parameters
Positive Affect (PANAS PA)
Combined conditioned groups (n=46) 25.5 ± 7.9 25.1 ± 8.2 25.7 ± 8.8 24.0 ± 6.8 25.3 ± 7.6 23.7 ± 7.1 24.6 ± 7.9 24.9 ± 7.9 0.8 .36 <.01 0.6 .78 .05 5.3 <.001 .31
Combined control groups (n=45) 23.9 ± 7.5 22.7 ± 7.8 24.9 ± 7.6 22.2 ± 7.8 23.7 ± 9.3 22.5 ± 7.9 23.8 ± 8.8 24.1 ± 7.8
State anxiety (STAI-S-s)
Combined conditioned groups (n=46) 31.0 ± 9.4 29.6 ± 8.8 31.0 ± 8.3 29.6 ± 7.8 30.4 ± 7.3 29.2 ± 7.4 31.2 ± 8.3 30.1 ± 7.5 1.1 .30 .01 0.7 .69 .05 2.8 .01 .19
Combined control groups (n=45) 31.9 ± 8.1 30.5 ± 6.6 32.5 ± 8.2 31.1 ± 7.6 32.0 ± 8.1 31.8 ± 8.8 31.8 ± 7.5 32.4 ± 7.1
General wellbeing (NRS)
Combined conditioned groups (n=46) 5.7 ± 0.8 5.9 ± 0.8 5.9 ± 0.8 6.0 ± 0.7 5.9 ± 0.6 6.1 ± 0.7 6.0 ± 0.7 5.9 ± 0.7 <0.01 .96 <.01 1.4 .23 .10 10.3 <.001 .46
Combined control groups (n=45) 5.9 ± 0.8 6.0 ± 0.8 5.9 ± 0.9 6.0 ± 0.7 6.0 ± 0.8 6.0 ± 0.8 6.0 ± 0.8 5.8 ± 0.7
27
CS = conditioned stimulus, RMA=repeated measures analysis, FVC% predicted = forced volume capacity (as calculated percentage of predicted
values), FEV1 % predicted = forced expiratory volume in 1 second (as calculated percentage of predicted values), BPM = beats per minute, PANAS
PA = Positive Affect and Negative Affect Schedule – Positive Affect, STAI-S-s = State Trait Anxiety Index – State Anxiety, NRS = Numeric
Rating Scales
28
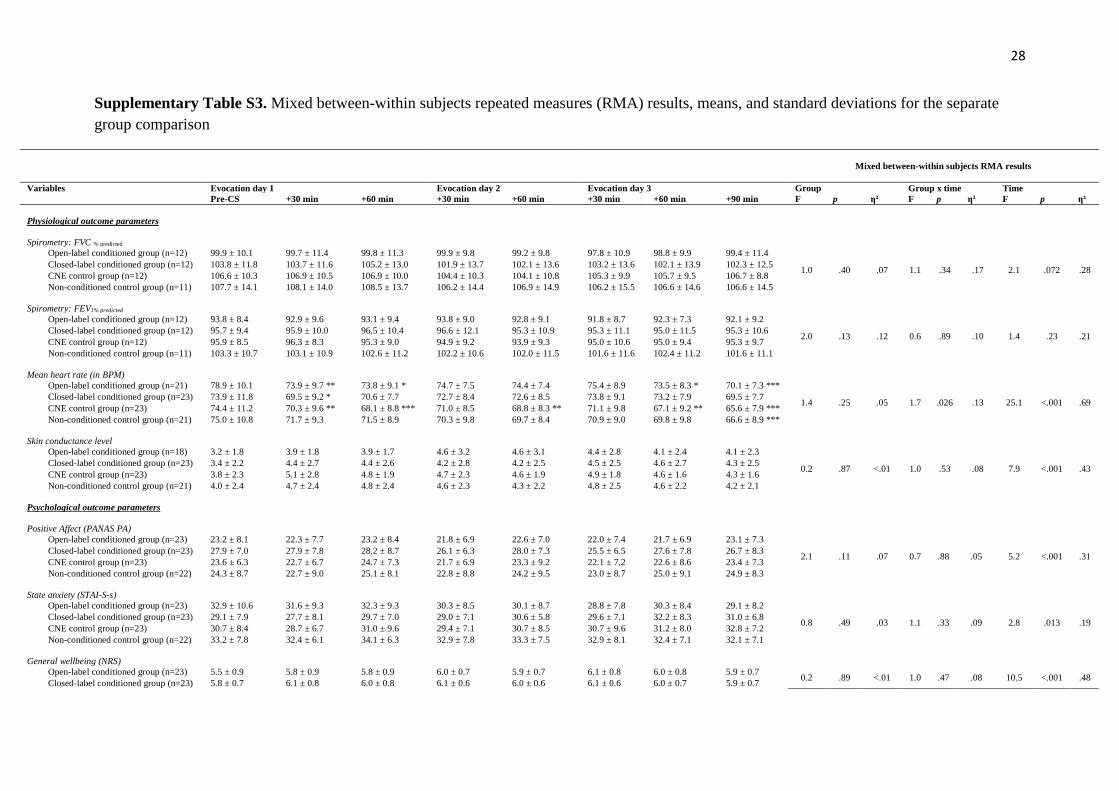
Supplementary Table S3. Mixed between-within subjects repeated measures (RMA) results, means, and standard deviations for the separate
group comparison
Mixed between-within subjects RMA results
Variables Evocation day 1 Evocation day 2 Evocation day 3 Group Group x time Time
Pre-CS +30 min +60 min +30 min +60 min +30 min +60 min +90 min F p η² F p η² F p η²
Physiological outcome parameters
Spirometry: FVC % predicted
Open-label conditioned group (n=12) 99.9 ± 10.1 99.7 ± 11.4 99.8 ± 11.3 99.9 ± 9.8 99.2 ± 9.8 97.8 ± 10.9 98.8 ± 9.9 99.4 ± 11.4
1.0 .40 .07 1.1 .34 .17 2.1 .072 .28 Closed-label conditioned group (n=12) 103.8 ± 11.8 103.7 ± 11.6 105.2 ± 13.0 101.9 ± 13.7 102.1 ± 13.6 103.2 ± 13.6 102.1 ± 13.9 102.3 ± 12.5
CNE control group (n=12) 106.6 ± 10.3 106.9 ± 10.5 106.9 ± 10.0 104.4 ± 10.3 104.1 ± 10.8 105.3 ± 9.9 105.7 ± 9.5 106.7 ± 8.8
Non-conditioned control group (n=11) 107.7 ± 14.1 108.1 ± 14.0 108.5 ± 13.7 106.2 ± 14.4 106.9 ± 14.9 106.2 ± 15.5 106.6 ± 14.6 106.6 ± 14.5
Spirometry: FEV1% predicted
Open-label conditioned group (n=12) 93.8 ± 8.4 92.9 ± 9.6 93.1 ± 9.4 93.8 ± 9.0 92.8 ± 9.1 91.8 ± 8.7 92.3 ± 7.3 92.1 ± 9.2
2.0 .13 .12 0.6 .89 .10 1.4 .23 .21 Closed-label conditioned group (n=12) 95.7 ± 9.4 95.9 ± 10.0 96.5 ± 10.4 96.6 ± 12.1 95.3 ± 10.9 95.3 ± 11.1 95.0 ± 11.5 95.3 ± 10.6
CNE control group (n=12) 95.9 ± 8.5 96.3 ± 8.3 95.3 ± 9.0 94.9 ± 9.2 93.9 ± 9.3 95.0 ± 10.6 95.0 ± 9.4 95.3 ± 9.7
Non-conditioned control group (n=11) 103.3 ± 10.7 103.1 ± 10.9 102.6 ± 11.2 102.2 ± 10.6 102.0 ± 11.5 101.6 ± 11.6 102.4 ± 11.2 101.6 ± 11.1
Mean heart rate (in BPM)
Open-label conditioned group (n=21) 78.9 ± 10.1 73.9 ± 9.7 ** 73.8 ± 9.1 * 74.7 ± 7.5 74.4 ± 7.4 75.4 ± 8.9 73.5 ± 8.3 * 70.1 ± 7.3 ***
1.4 .25 .05 1.7 .026 .13 25.1 <.001 .69 Closed-label conditioned group (n=23) 73.9 ± 11.8 69.5 ± 9.2 * 70.6 ± 7.7 72.7 ± 8.4 72.6 ± 8.5 73.8 ± 9.1 73.2 ± 7.9 69.5 ± 7.7
CNE control group (n=23) 74.4 ± 11.2 70.3 ± 9.6 ** 68.1 ± 8.8 *** 71.0 ± 8.5 68.8 ± 8.3 ** 71.1 ± 9.8 67.1 ± 9.2 ** 65.6 ± 7.9 ***
Non-conditioned control group (n=21) 75.0 ± 10.8 71.7 ± 9.3 71.5 ± 8.9 70.3 ± 9.8 69.7 ± 8.4 70.9 ± 9.0 69.8 ± 9.8 66.6 ± 8.9 ***
Skin conductance level
Open-label conditioned group (n=18) 3.2 ± 1.8 3.9 ± 1.8 3.9 ± 1.7 4.6 ± 3.2 4.6 ± 3.1 4.4 ± 2.8 4.1 ± 2.4 4.1 ± 2.3
0.2 .87 <.01 1.0 .53 .08 7.9 <.001 .43 Closed-label conditioned group (n=23) 3.4 ± 2.2 4.4 ± 2.7 4.4 ± 2.6 4.2 ± 2.8 4.2 ± 2.5 4.5 ± 2.5 4.6 ± 2.7 4.3 ± 2.5
CNE control group (n=23) 3.8 ± 2.3 5.1 ± 2.8 4.8 ± 1.9 4.7 ± 2.3 4.6 ± 1.9 4.9 ± 1.8 4.6 ± 1.6 4.3 ± 1.6
Non-conditioned control group (n=21) 4.0 ± 2.4 4.7 ± 2.4 4.8 ± 2.4 4.6 ± 2.3 4.3 ± 2.2 4.8 ± 2.5 4.6 ± 2.2 4.2 ± 2.1
Psychological outcome parameters
Positive Affect (PANAS PA)
Open-label conditioned group (n=23) 23.2 ± 8.1 22.3 ± 7.7 23.2 ± 8.4 21.8 ± 6.9 22.6 ± 7.0 22.0 ± 7.4 21.7 ± 6.9 23.1 ± 7.3
2.1 .11 .07 0.7 .88 .05 5.2 <.001 .31 Closed-label conditioned group (n=23) 27.9 ± 7.0 27.9 ± 7.8 28.2 ± 8.7 26.1 ± 6.3 28.0 ± 7.3 25.5 ± 6.5 27.6 ± 7.8 26.7 ± 8.3
CNE control group (n=23) 23.6 ± 6.3 22.7 ± 6.7 24.7 ± 7.3 21.7 ± 6.9 23.3 ± 9.2 22.1 ± 7.2 22.6 ± 8.6 23.4 ± 7.3
Non-conditioned control group (n=22) 24.3 ± 8.7 22.7 ± 9.0 25.1 ± 8.1 22.8 ± 8.8 24.2 ± 9.5 23.0 ± 8.7 25.0 ± 9.1 24.9 ± 8.3
State anxiety (STAI-S-s)
Open-label conditioned group (n=23) 32.9 ± 10.6 31.6 ± 9.3 32.3 ± 9.3 30.3 ± 8.5 30.1 ± 8.7 28.8 ± 7.8 30.3 ± 8.4 29.1 ± 8.2
0.8 .49 .03 1.1 .33 .09 2.8 .013 .19 Closed-label conditioned group (n=23) 29.1 ± 7.9 27.7 ± 8.1 29.7 ± 7.0 29.0 ± 7.1 30.6 ± 5.8 29.6 ± 7.1 32.2 ± 8.3 31.0 ± 6.8
CNE control group (n=23) 30.7 ± 8.4 28.7 ± 6.7 31.0 ± 9.6 29.4 ± 7.1 30.7 ± 8.5 30.7 ± 9.6 31.2 ± 8.0 32.8 ± 7.2
Non-conditioned control group (n=22) 33.2 ± 7.8 32.4 ± 6.1 34.1 ± 6.3 32.9 ± 7.8 33.3 ± 7.5 32.9 ± 8.1 32.4 ± 7.1 32.1 ± 7.1
General wellbeing (NRS)
Open-label conditioned group (n=23) 5.5 ± 0.9 5.8 ± 0.9 5.8 ± 0.9 6.0 ± 0.7 5.9 ± 0.7 6.1 ± 0.8 6.0 ± 0.8 5.9 ± 0.7 0.2 .89 <.01 1.0 .47 .08 10.5 <.001 .48
Closed-label conditioned group (n=23) 5.8 ± 0.7 6.1 ± 0.8 6.0 ± 0.8 6.1 ± 0.6 6.0 ± 0.6 6.1 ± 0.6 6.0 ± 0.7 5.9 ± 0.7
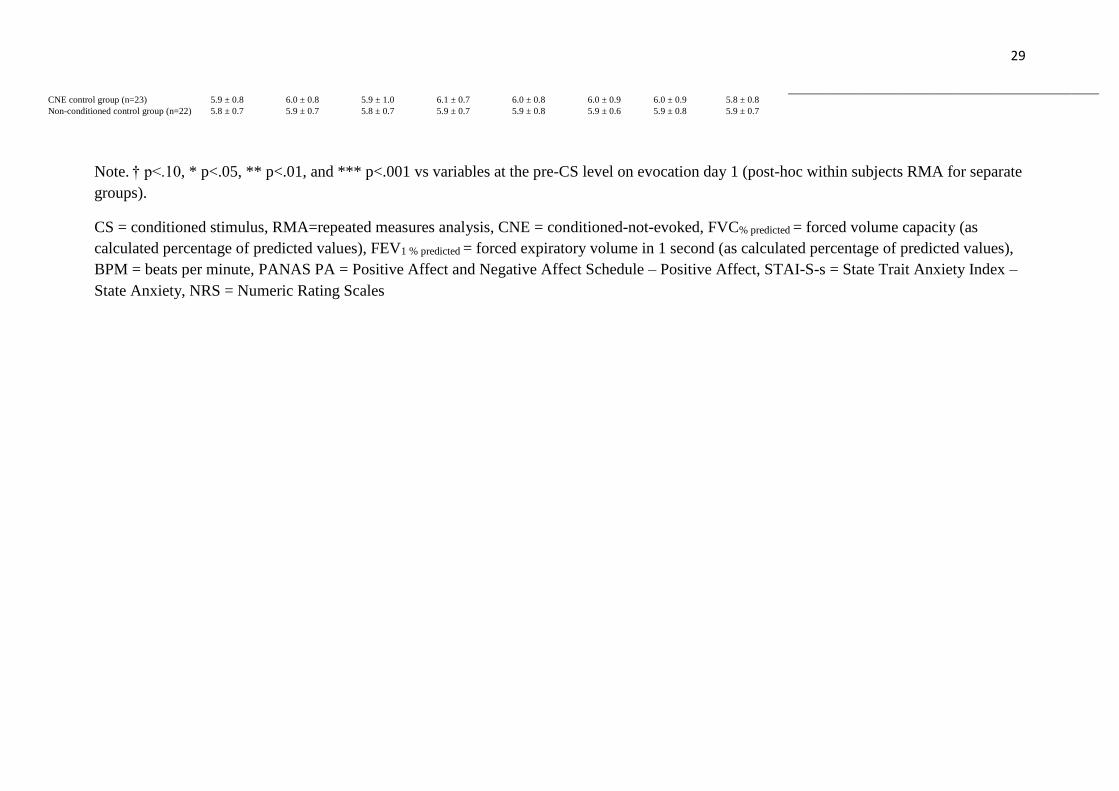
29
Note. † p<.10, * p<.05, ** p<.01, and *** p<.001 vs variables at the pre-CS level on evocation day 1 (post-hoc within subjects RMA for separate
groups).
CS = conditioned stimulus, RMA=repeated measures analysis, CNE = conditioned-not-evoked, FVC% predicted = forced volume capacity (as
calculated percentage of predicted values), FEV1 % predicted = forced expiratory volume in 1 second (as calculated percentage of predicted values),
BPM = beats per minute, PANAS PA = Positive Affect and Negative Affect Schedule – Positive Affect, STAI-S-s = State Trait Anxiety Index –
State Anxiety, NRS = Numeric Rating Scales
CNE control group (n=23) 5.9 ± 0.8 6.0 ± 0.8 5.9 ± 1.0 6.1 ± 0.7 6.0 ± 0.8 6.0 ± 0.9 6.0 ± 0.9 5.8 ± 0.8
Non-conditioned control group (n=22) 5.8 ± 0.7 5.9 ± 0.7 5.8 ± 0.7 5.9 ± 0.7 5.9 ± 0.8 5.9 ± 0.6 5.9 ± 0.8 5.9 ± 0.7
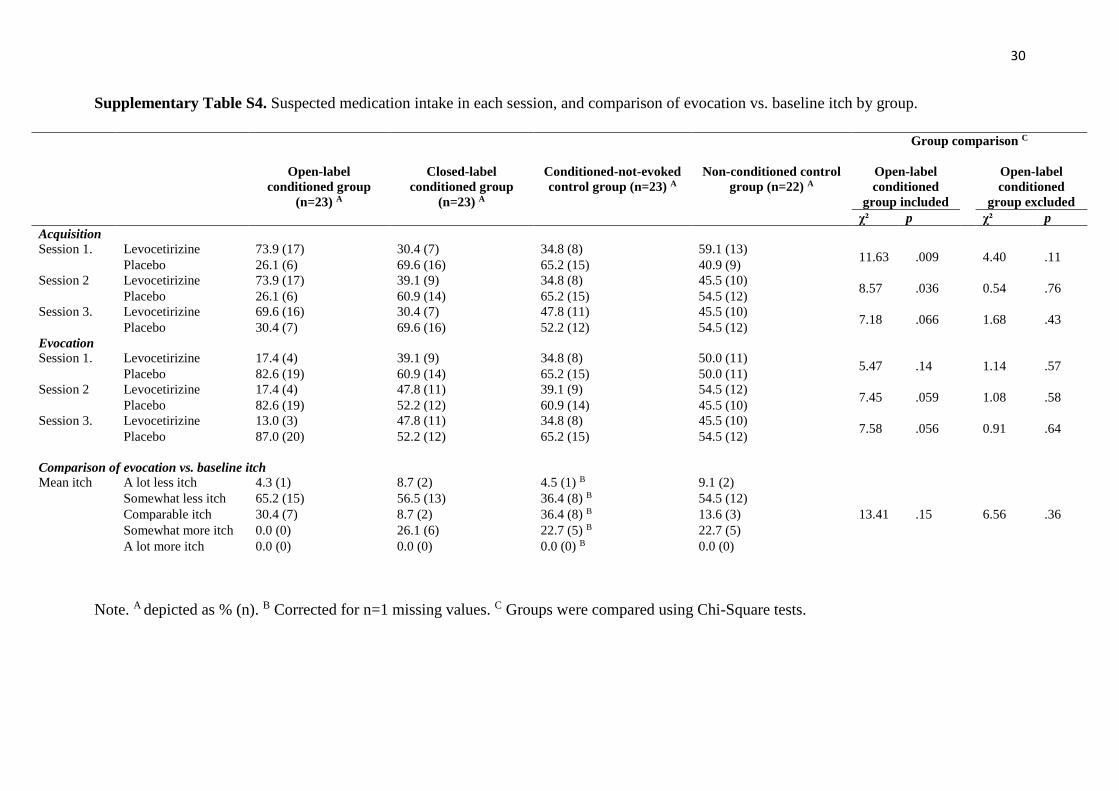
30
Supplementary Table S4. Suspected medication intake in each session, and comparison of evocation vs. baseline itch by group.
Note. A depicted as % (n). B Corrected for n=1 missing values. C Groups were compared using Chi-Square tests.
Group comparison C
Open-label
conditioned group
(n=23) A
Closed-label
conditioned group
(n=23) A
Conditioned-not-evoked
control group (n=23) A
Non-conditioned control
group (n=22) A
Open-label
conditioned
group included
Open-label
conditioned
group excluded
χ² p χ² p
Acquisition Session 1. Levocetirizine 73.9 (17) 30.4 (7) 34.8 (8) 59.1 (13)
11.63 .009
4.40 .11 Placebo 26.1 (6) 69.6 (16) 65.2 (15) 40.9 (9)
Session 2 Levocetirizine 73.9 (17) 39.1 (9) 34.8 (8) 45.5 (10) 8.57 .036
0.54 .76
Placebo 26.1 (6) 60.9 (14) 65.2 (15) 54.5 (12)
Session 3. Levocetirizine 69.6 (16) 30.4 (7) 47.8 (11) 45.5 (10) 7.18 .066
1.68 .43
Placebo 30.4 (7) 69.6 (16) 52.2 (12) 54.5 (12)
Evocation Session 1. Levocetirizine 17.4 (4) 39.1 (9) 34.8 (8) 50.0 (11)
5.47 .14
1.14 .57 Placebo 82.6 (19) 60.9 (14) 65.2 (15) 50.0 (11)
Session 2 Levocetirizine 17.4 (4) 47.8 (11) 39.1 (9) 54.5 (12) 7.45 .059
1.08 .58
Placebo 82.6 (19) 52.2 (12) 60.9 (14) 45.5 (10)
Session 3. Levocetirizine 13.0 (3) 47.8 (11) 34.8 (8) 45.5 (10) 7.58 .056
0.91 .64
Placebo 87.0 (20) 52.2 (12) 65.2 (15) 54.5 (12)
Comparison of evocation vs. baseline itch
Mean itch A lot less itch 4.3 (1) 8.7 (2) 4.5 (1) B 9.1 (2)
13.41 .15
6.56 .36
Somewhat less itch 65.2 (15) 56.5 (13) 36.4 (8) B 54.5 (12)
Comparable itch 30.4 (7) 8.7 (2) 36.4 (8) B 13.6 (3)
Somewhat more itch 0.0 (0) 26.1 (6) 22.7 (5) B 22.7 (5)
A lot more itch 0.0 (0) 0.0 (0) 0.0 (0) B 0.0 (0)
31
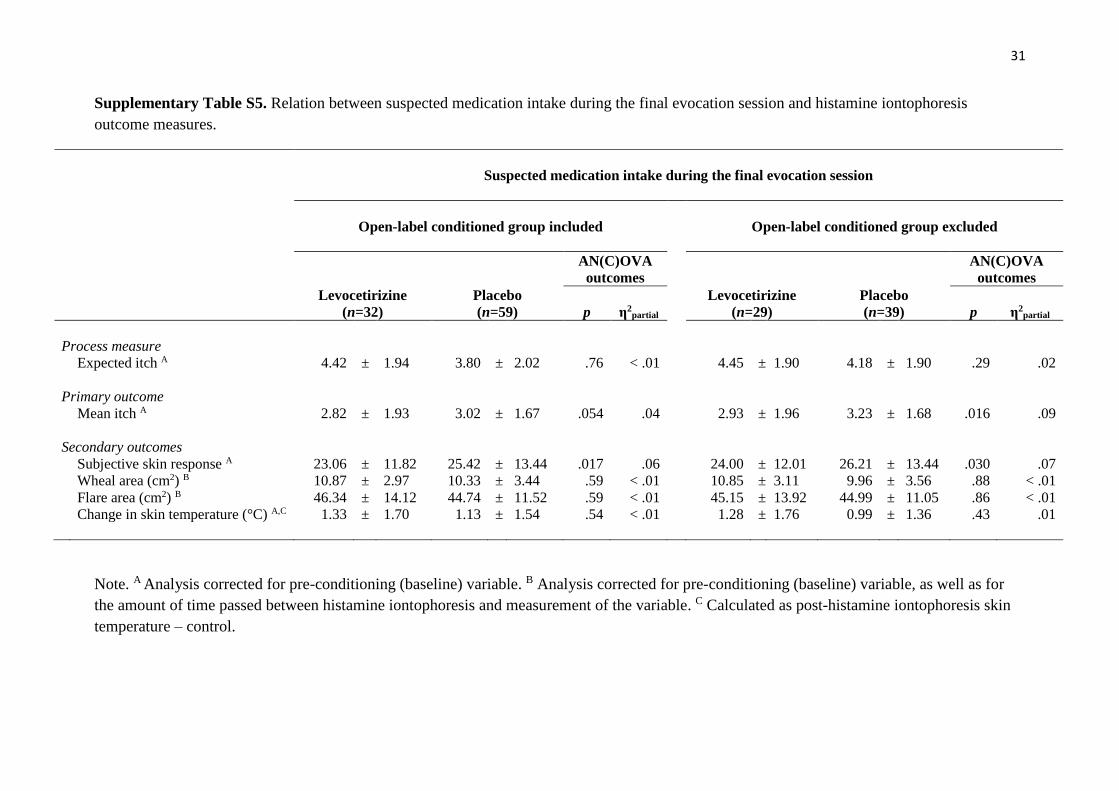
Supplementary Table S5. Relation between suspected medication intake during the final evocation session and histamine iontophoresis
outcome measures.
Suspected medication intake during the final evocation session
Open-label conditioned group included
Open-label conditioned group excluded
AN(C)OVA
outcomes
AN(C)OVA
outcomes
Levocetirizine
(n=32)
Placebo
(n=59) p η2partial
Levocetirizine
(n=29)
Placebo
(n=39) p η2partial
Process measure
Expected itch A 4.42 ± 1.94 3.80 ± 2.02 .76 < .01 4.45 ± 1.90 4.18 ± 1.90 .29 .02
Primary outcome
Mean itch A 2.82 ± 1.93 3.02 ± 1.67 .054 .04 2.93 ± 1.96 3.23 ± 1.68 .016 .09
Secondary outcomes
Subjective skin response A 23.06 ± 11.82 25.42 ± 13.44 .017 .06 24.00 ± 12.01 26.21 ± 13.44 .030 .07
Wheal area (cm2) B 10.87 ± 2.97 10.33 ± 3.44 .59 < .01 10.85 ± 3.11 9.96 ± 3.56 .88 < .01
Flare area (cm2) B 46.34 ± 14.12 44.74 ± 11.52 .59 < .01 45.15 ± 13.92 44.99 ± 11.05 .86 < .01
Change in skin temperature (°C) A,C 1.33 ± 1.70 1.13 ± 1.54 .54 < .01 1.28 ± 1.76 0.99 ± 1.36 .43 .01
Note. A Analysis corrected for pre-conditioning (baseline) variable. B Analysis corrected for pre-conditioning (baseline) variable, as well as for
the amount of time passed between histamine iontophoresis and measurement of the variable. C Calculated as post-histamine iontophoresis skin
temperature – control.

32
Supplementary Table S6. Means and standard deviations of the individual characteristics of the sample group, with analysis of variance
(ANOVA) outcome and calculated Cronbach’s alpha for the subscales.
Combined groups Separate groups
ANOVA ANOVA
Conditioned
groups (n=46)
Control groups
(n=45)
F p Open-label
conditioned
group (n=23)
Closed-label
conditioned
group (n=23)
Conditioned-
not-evoked
control group
(n=23)
Non-
conditioned
control group
(n=22)
F p Cronbach’s
α
scale
Optimism A 18.33 ± 2.72 16.93 ± 2.67 6.07 .016 18.17 ± 2.67 18.48 ± 2.81 16.65 ± 2.96 17.23 ± 2.37 2.21 .093 .68
Perceived stress B 8.83 ± 4.28 9.76 ± 4.26 1.08 .30 8.52 ± 4.09 9.13 ± 4.54 9.61 ± 4.08 9.91 ± 4.55 0.45 .72 .78
Worrying C 37.93 ± 10.14 38.84 ± 10.90 0.17 .68 38.39 ± 9.57 37.48 ± 10.88 37.87 ± 10.91 39.86 ± 11.05 0.22 .89 .92
Behavioral activation: drive D 10.30 ± 2.44 11.02 ± 1.94 2.40 .13 10.13 ± 2.77 10.48 ± 2.11 10.74 ± 1.91 11.32 ± 1.99 1.14 .34 .70
Behavioral activation: fun seeking D 10.50 ± 1.72 10.91 ± 1.92 1.16 .29 10.39 ± 1.73 10.61 ± 1.75 10.87 ± 2.18 10.95 ± 1.65 0.44 .73 .46
Behavioral activation: reward
responsiveness D
17.24 ± 1.77 16.76 ± 1.72 1.75 .19 17.43 ± 1.70 17.04 ± 1.85 17.30 ± 1.77 16.18 ± 1.50 2.42 .072 .53
Behavioral inhibition D 18.57 ± 4.03 18.44 ± 4.11 0.02 .89 19.35 ± 4.18 17.78 ± 3.80 18.35 ± 4.01 18.55 ± 4.31 0.58 .63 .83
A Assessed by the Life Orientation Test – revised (LOT-R (25), B Assessed by the Perceived Stress Scale (PSS (26), C Assessed by the Penn State
Worry Questionnaire (PSWQ (27), D Assessed by the Behavioural Inhibition System / Behavioural Approach System scales (BIS/BAS scales
(22)
33
Supplementary Table S7. Moderation by individual characteristics for the effects of the
combined conditioned groups on self-reported itch during iontophoresis in the evocation phase,
controlled for baseline, using the PROCESS moderation method.
Note. A Model controlled for mean itch during baseline histamine iontophoresis. In all models,
itch during baseline iontophoresis was strongly related to itch during evocation (all p < .001).
This association causes the high explained variance in the model. B Assessed by the Life
Orientation Test – revised (LOT-R (25), C Assessed by the Perceived Stress Scale (PSS (26), D
Assessed by the Penn State Worry Questionnaire (PSWQ (27), E Assessed by the Behavioural
Inhibition System / Behavioural Approach System scales (BIS/BAS scales (22). † p<.10. LLCI
= lower limit confidence interval. ULCI = upper limit confidence interval.
Bootstrap
Variable Coefficient t p LLCI ULCI R-square
model
Model 1: moderation by optimism A
Conditioning (group) -0.39 -1.67 .11 -0.88 0.09
.62 Optimism B 0.07 1.14 .26 -0.05 0.20
Conditioning x optimism -0.09 -1.01 .31 -0.27 0.09
Model 2: moderation by perceived stress A
Conditioning (group) -0.34 -1.41 .16 -0.81 0.14
.61 Perceived stress C 0.03 0.79 .43 -0.05 0.11
Conditioning x perceived stress -0.05 -0.90 .37 -0.16 0.06
Model 3: moderation by worrying A
Conditioning (group) -0.33 -1.40 .16 -0.80 0.14
.61 Worrying D -0.02 -1.16 .25 -0.05 0.01
Conditioning x worrying 0.03 1.15 .25 -0.02 0.07
Model 4: moderation by BAS drive A
Conditioning (group) -0.38 -1.59 .12 -0.85 0.10
.61 BAS drive E 0.07 0.85 .40 -0.10 0.25
Conditioning x BAS drive -0.15 -1.38 .17 -0.37 0.07
Model 5: moderation by BAS fun seeking A
Conditioning (group) -0.36 -1.51 .13 -0.84 0.11
.61 BAS fun seeking E -0.06 -0.70 .49 -0.25 0.12
Conditioning x BAS fun seeking 0.04 0.27 .78 -0.23 0.30
Model 6: moderation by BAS reward responsiveness A
Conditioning (group) -0.36 -1.52 .13 -0.82 0.11
.63 BAS reward responsiveness E 0.12 1.21 .23 -0.08 0.31
Conditioning x BAS reward responsiveness -0.27 -1.96 .053 † -0.54 0.003
Model 7: moderation by behavioral inhibition (BIS) A
Conditioning (group) -0.34 -1.44 .15 -0.81 0.13
.61 BIS E 0.01 0.24 .81 -0.07 0.09
Conditioning x BIS 0.03 0.50 .62 -0.09 0.15
34
Supplementary Table S8. Moderation by individual characteristics for the effects of the
separate groups on self-reported itch during iontophoresis in the evocation phase, controlled for
baseline, using the PROCESS moderation method.
Bootstrap
Variable Coefficient t p LLCI ULCI R-square
model
Model 1: moderation by optimism:
Open-label conditioned group dummy A
Open-label conditioning -0.46 -1.36 .18 -1.13 0.21
.62 Optimism B > -0.01 -0.01 .99 -0.10 0.10
Conditioning x optimism 0.11 1.06 .29 -0.10 0.31
Closed-label conditioned group dummy A
Closed-label conditioning 0.05 0.15 .88 -0.62 0.72
.64 Optimism B 0.09 1.75 .084 † -0.01 0.19
Conditioning x optimism -0.23 -2.35 .021 * -0.42 -0.04
Conditioned-not-evoked control group dummy A
Conditioned-not-evoked 0.35 1.00 .32 -0.35 1.04
.62 Optimism B < 0.01 0.09 .93 -0.10 0.11
Conditioned-not-evoked x optimism 0.07 0.73 .47 -0.12 0.26
Model 2: moderation by perceived stress
Open-label conditioned group dummy A
Open-label conditioning -0.47 -1.41 .16 -1.14 0.94
.63 Perceived stress C 0.03 1.01 .32 -0.03 0.09
Conditioning x perceived stress -0.12 -1.79 .077 † -0.25 0.01
Closed-label conditioned group dummy A
Closed-label conditioning 0.02 0.05 .96 -0.66 0.70
.62 Perceived stress C < 0.01 -0.13 .90 -0.07 0.06
Conditioning x perceived stress 0.04 0.54 .59 -0.09 0.16
Conditioned-not-evoked control group dummy A
Conditioned-not-evoked 0.27 0.80 .43 -0.40 0.94
.62 Perceived stress C < 0.01 0.10 .92 -0.06 0.07
Conditioned-not-evoked x perceived stress 0.01 0.16 .87 -0.12 0.14
Model 3: moderation by worrying
Open-label conditioned group dummy A
Open-label conditioning -0.42 -1.24 .22 -1.09 0.25
.62 Worrying D -0.01 -0.45 .65 -0.03 0.02
Conditioning x worrying 0.01 0.18 .86 -0.05 0.06
Closed-label conditioned group dummy A
Closed-label conditioning 0.02 0.07 .94 -0.65 0.70
.62 Worrying D -0.01 -0.94 .35 -0.04 0.01
Conditioning x worrying 0.03 1.13 .26 -0.02 0.08
Conditioned-not-evoked control group dummy A
Conditioned-not-evoked 0.25 0.75 .45 -0.42 0.92
.62 Worrying D > -0.01 -0.04 .97 -0.03 0.03
Conditioned-not-evoked x worrying -0.02 -0.61 .54 -0.07 0.04
Model 4: moderation by BAS drive
Open-label conditioned group dummy A
Open-label conditioning -0.46 -1.33 .19 -1.14 0.23
.62 BAS drive E 0.01 0.08 .94 -0.13 0.14
Conditioning x BAS drive -0.06 -0.57 .57 -0.28 0.16
Closed-label conditioned group dummy A
Closed-label conditioning -0.03 -0.09 .93 -0.71 0.65
.62 BAS drive E 0.01 0.22 .83 -0.11 0.14
Conditioning x BAS drive -0.15 -1.12 .26 -0.40 0.11
35
Conditioned-not-evoked control group dummy A
Conditioned-not-evoked 0.27 0.79 .43 -0.40 0.94
.62 BAS drive E -0.04 -0.67 .50 -0.16 0.08
Conditioned-not-evoked x BAS drive 0.11 0.80 .43 -0.17 0.39
Model 5: moderation by BAS fun seeking
Open-label conditioned group dummy A
Open-label conditioning -0.43 -1.28 .20 -1.11 0.24
.62 BAS fun seeking E -0.05 -0.72 .47 -0.20 0.10
Conditioning x BAS fun seeking 0.03 0.20 .84 -0.28 0.34
Closed-label conditioned group dummy A
Closed-label conditioning -0.01 -0.02 .98 -0.68 0.67
.62 BAS fun seeking E -0.05 -0.59 .55 -0.20 0.11
Conditioning x BAS fun seeking > -0.01 -0.01 .99 -0.33 0.33
Conditioned-not-evoked control group dummy A
Conditioned-not-evoked 0.26 0.78 .44 -0.41 0.93
.62 BAS fun seeking E -0.05 -0.59 .56 -0.21 0.11
Conditioned-not-evoked x BAS fun seeking < 0.01 0.02 .97 -0.27 0.28
Model 6: moderation by BAS reward responsiveness
Open-label conditioned group dummy A
Open-label conditioning -0.37 -1.08 .28 -1.05 0.31
.63 BAS reward responsiveness E 0.04 0.52 .61 -0.12 0.20
Conditioning x BAS reward responsiveness -0.28 -1.73 .087 † -0.60 0.04
Closed-label conditioned group dummy A
Closed-label conditioning 0.03 0.09 .93 -0.66 0.72
.62 BAS reward responsiveness E -0.02 -0.21 .83 -0.18 0.15
Conditioning x BAS reward responsiveness -0.03 -0.22 .83 -0.34 0.27
Conditioned-not-evoked control group dummy A
Conditioned-not-evoked 0.34 1.00 .32 -0.33 1.01
.64 BAS reward responsiveness E -0.13 -1.58 .12 -0.29 0.03
Conditioned-not-evoked x BAS reward
responsiveness
0.37 2.37 .020 * 0.06 0.67
Model 7: moderation by behavioral inhibition (BIS)
Open-label conditioned group dummy A
Open-label conditioning -0.41 -1.22 .23 -1.08 0.26
.62 BIS E 0.04 1.28 .21 -0.02 0.11
Conditioning x BIS -0.05 -0.72 .47 -0.18 0.08
Closed-label conditioned group dummy A
Closed-label conditioning 0.12 0.36 .72 -0.55 0.79
.63 BIS E 0.01 0.19 .85 -0.06 0.07
Conditioning x BIS 0.12 1.64 .10 -0.02 0.25
Conditioned-not-evoked control group dummy A
Conditioned-not-evoked 0.29 0.83 .41 -0.39 0.95
.62 BIS E 0.03 0.95 .35 -0.04 0.10
Conditioned-not-evoked x BIS > -0.01 -0.06 .95 -0.14 0.13
Note. Dummy variables were computed with the non-conditioned control group as reference
category. A Models controlled for mean itch during baseline histamine iontophoresis, and other
dummy variables. In all models, itch during baseline iontophoresis was strongly related to itch
during evocation (all p < .001). This association causes the high explained variance in the
model. B Assessed by the Life Orientation Test – revised (LOT-R (25), C Assessed by the
Perceived Stress Scale (PSS (26), D Assessed by the Penn State Worry Questionnaire (PSWQ
(27), E Assessed by the Behavioural Inhibition System / Behavioural Approach System scales
36
(BIS/BAS scales (22). † p<.10; * p<.05. LLCI = lower limit confidence interval. ULCI = upper
limit confidence interval.
Related Documents