SUPPLEMENTARY MATERIAL Title Associations between genetic risk, functional brain network organization and neuroticism Journal name Brain Imaging and Behavior Author names Michelle N. Servaas 1* , Linda Geerligs 2 , Jojanneke A. Bastiaansen 3 , Remco J. Renken 1 , Jan-Bernard C. Marsman 1 , Ilja M. Nolte 4 , Johan Ormel 3 , André Aleman 1,5 ; Harriëtte Riese 3 Corresponding author M.N. Servaas Neuroimaging Center, Department of Neuroscience University of Groningen, University Medical Center Groningen E-mail: [email protected]

Welcome message from author
This document is posted to help you gain knowledge. Please leave a comment to let me know what you think about it! Share it to your friends and learn new things together.
Transcript

SUPPLEMENTARY MATERIAL
Title Associations between genetic risk, functional brain network
organization and neuroticism
Journal name Brain Imaging and Behavior
Author names Michelle N. Servaas1*
, Linda Geerligs2, Jojanneke A.
Bastiaansen3, Remco J. Renken
1, Jan-Bernard C. Marsman
1, Ilja
M. Nolte4, Johan Ormel
3, André Aleman
1,5; Harriëtte Riese
3
Corresponding author M.N. Servaas
Neuroimaging Center, Department of Neuroscience
University of Groningen, University Medical Center
Groningen
E-mail: [email protected]

Supplement 1: Genotyping
For the SLC6A4, the 5-HTTLPR S/La/Lg variants were determined using PCR with Forward
primer FAM-5'TGAATGCCAGCACCTAACCC-3' and Reverse primer 5-
TTCTGGTGCCACCTAGACGC-3' (35 cycli of 30 seconds at 95°C, 30 seconds at 61°C and 1
minute at 72°C), and subsequent ingestion of the PCR product with the restriction enzyme Msp-I
for at least 3 hours at 37 °C. The resulting restriction fragments were separated using capillary
electrophoresis (ABI 3130 analyzer; Applied Biosystems, Nieuwerkerk a/d IJssel, the
Netherlands), and fragment lengths were estimated using the ABI Prism® GeneMapper™
software, version 3.0 (Applied Biosystems). The La, Lg and S variants were determined by the
detection of fragments of 325 base pairs (bp), 152 bp and 284 bp, respectively (validated in-
house method, (Doornbos et al. 2009) ).
Genotyping of the COMT rs4680 polymorphism (1947 G/A; Val158Met; GenBank Z26491)
was performed with the allelic discrimination technique following the protocol supplied by
Applied Biosystems. We used primers COMT-GAF (5'-CGAGATCAACCCCGACTGT-3') and
COMT-GAR (5'-CAGGCATGCACACCTTGTC-3'), and minor grove-binding probes VIC-5'-
TTTCGCTGGCGTGAAG-3'-NFQ (G) and FAM-5'-TCGCTGGCATGAAG-3'-NFQ (A). The
COMT rs165599 polymorphism was genotyped using the commercially available kit
C_2255335_10 (Applied Biosystems). All COMT reactions were carried out in TaqMan
universal PCR master mix using a 7500 Real-Time PCR System (Applied Biosystems).
Supplement 2: Overview of the full fMRI session
The full fMRI session consisted of four tasks, resting state and an anatomical scan. The
following tasks/scans were presented in consecutive order: emotional face matching task (Hariri
et al. 2002), mood (worry) induction paradigm (Paulesu et al. 2010), anatomical scan, resting

state, interoceptive sensitivity task (Pollatos et al. 2007) and Ultimatum Game (Sanfey et al.
2003). The total duration of the fMRI session was approximately 60 minutes. The order was
fixed and identical for all participants.
Supplement 3: Preprocessing steps
First, structural as well as functional images were reoriented parallel to the AC-PC plane.
Second, functional images were realigned to the first image using rigid body transformations and
the mean EPI image, created during this step, was coregistered to the anatomical T1 image.
Third, structural images were corrected for bias field inhomogeneities, registered using linear
transformations and segmented into grey matter (GM), white matter (WM) and cerebrospinal
fluid (CSF) (MNI template space). Fourth, we used DARTEL (diffeomorphic anatomical
registration through exponentiated lie algebra toolbox) (Ashburner 2007) to create a customized
group template to increase the accuracy of inter-subject alignment. Individual GM and WM
tissue segments were iteratively aligned to the group template in order to acquire individual
deformation flow fields. Fifth, the coregistered functional images were normalized to MNI space
using the customized group template and individual deformation flow fields. Furthermore,
images were resampled to 2 mm3 isotropic voxels and smoothed with an 8 mm full-width at half-
maximum (FWHM) Gaussian kernel.
Supplement 4: Scrubbing procedure
The indices framewise displacement (FD) and DVARS were calculated to indicate volumes
(i.e. frames) that may be affected by motion artifacts (Power et al. 2012). FD is calculated as the
root of the sum of the squared differentials per volume. Rotations were converted to translations
assuming a distance of 65 mm from the origin of rotation (ArtRepair toolbox,
http://cibsr.stanford.edu/tools/human-brain-project/artrepair-software.html). DVARS is
calculated as the root mean square (RMS) of the derivatives of the time series across voxels
included in the whole-brain mask per volume (Power et al. 2011, 2012). Volumes were removed
when FD>0.5 mm and DVARS>mean + 3*SD. Additionally, one backward and two forward
neighboring volumes were removed as well. The median of the number of scans that were
removed per subject was 11.0 (IQR: 14.2). Subjects were excluded when more than one third of
the volumes had to be removed. After scrubbing, neuroticism scores did not correlate with mean
head displacement, maximum head displacement, head rotation and the number of
micromovements (<0.1 mm) (p>0.17) (Van Dijk et al. 2010). Furthermore, neuroticism did not
correlate with the number of removed scans (p=0.63).
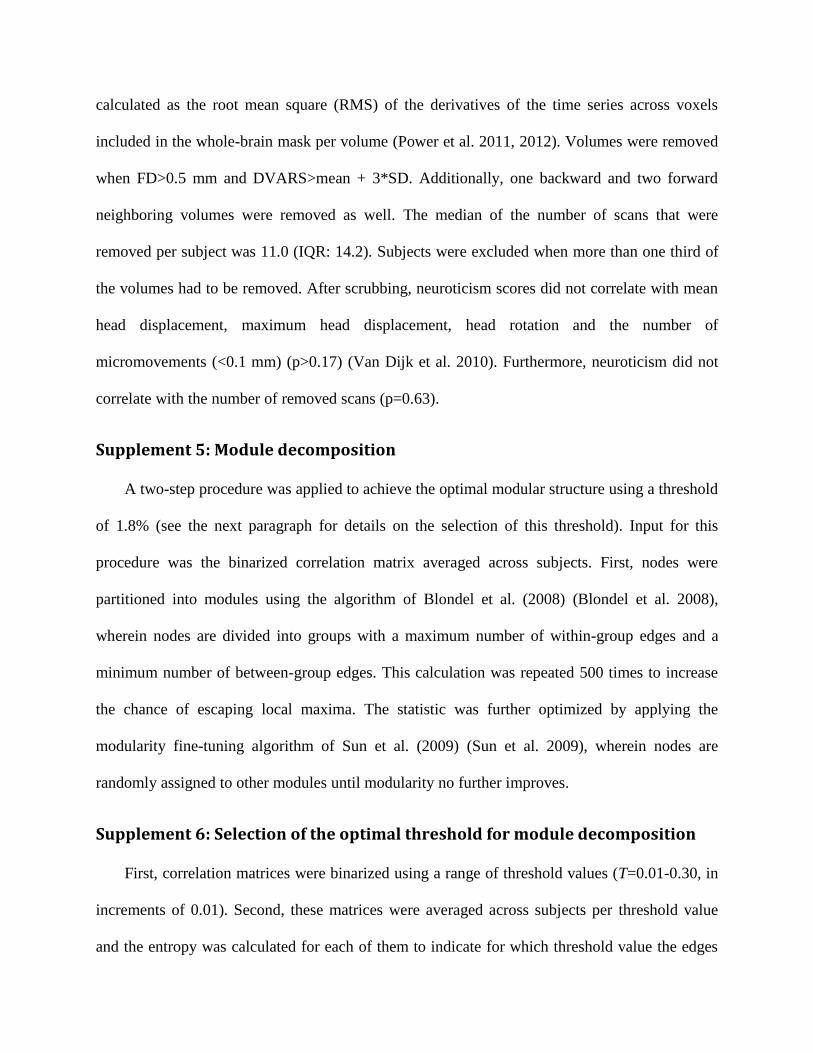
Supplement 5: Module decomposition
A two-step procedure was applied to achieve the optimal modular structure using a threshold
of 1.8% (see the next paragraph for details on the selection of this threshold). Input for this
procedure was the binarized correlation matrix averaged across subjects. First, nodes were
partitioned into modules using the algorithm of Blondel et al. (2008) (Blondel et al. 2008),
wherein nodes are divided into groups with a maximum number of within-group edges and a
minimum number of between-group edges. This calculation was repeated 500 times to increase
the chance of escaping local maxima. The statistic was further optimized by applying the
modularity fine-tuning algorithm of Sun et al. (2009) (Sun et al. 2009), wherein nodes are
randomly assigned to other modules until modularity no further improves.
Supplement 6: Selection of the optimal threshold for module decomposition
First, correlation matrices were binarized using a range of threshold values (T=0.01-0.30, in
increments of 0.01). Second, these matrices were averaged across subjects per threshold value
and the entropy was calculated for each of them to indicate for which threshold value the edges

showed the largest stability information-wise (lowest entropy). These results were compared to
results obtained via randomized matrices (for details, see (Geerligs et al. 2015) ). The optimal
threshold is the threshold where (i) the original matrix shows the largest stability across subjects
(low entropy) and (ii) the difference in entropy is the largest between the original matrix and
random matrix. The optimal threshold in the current study was 1.8%.
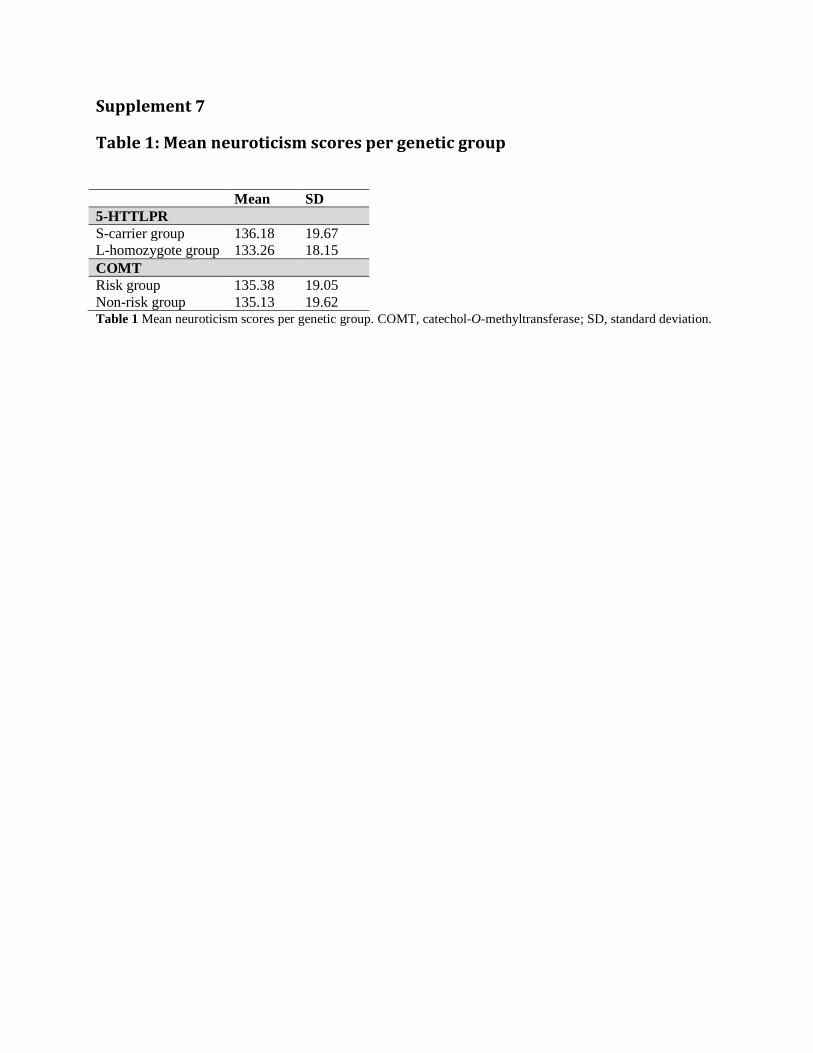
Supplement 7
Table 1: Mean neuroticism scores per genetic group
Mean SD
5-HTTLPR
S-carrier group 136.18 19.67
L-homozygote group 133.26 18.15
COMT
Risk group 135.38 19.05
Non-risk group 135.13 19.62 Table 1 Mean neuroticism scores per genetic group. COMT, catechol-O-methyltransferase; SD, standard deviation.

Supplement 8
Table 2: Statistic results on the network measures
Network measure P-values
AUC main
effect
Direction P-values
AUC
interaction
Direction
5-HTTLPR
Whole-brain
Global efficiency 0.128 0.264
Local efficiency 0.067* Risk>Non-risk 0.550
Modularity 0.077* Risk>Non-risk 0.967
Subnetworks: local efficiency
AS 0.589
COS 0.227
DMS 0.105 0.276
FPS 0.180 0.830
SMS 0.270 0.348
VS 0.055* Risk>Non-risk 0.817
Subnetworks: participation coefficient
AS 0.774
COS 0.480 0.285
DMS 0.034** Risk<Non-risk
FPS 0.015** Risk<Non-risk
SMS 0.309 0.201
VS 0.098* Risk<Non-risk
COMT
Whole-brain
Global efficiency 0.953 0.117
Local efficiency 0.879 0.061* Risk>Non-risk
Modularity 0.224 0.802
Subnetworks: local efficiency
AS 0.529
COS 0.361
DMS 0.690 0.146
FPS 0.820 0.423
SMS 0.220 0.050** Risk>Non-risk
VS 0.396 0.023** Risk>Non-risk
Subnetworks: participation coefficient
AS 0.378
COS 0.633 0.472
DMS 0.896
FPS 0.162
SMS 0.761 0.832
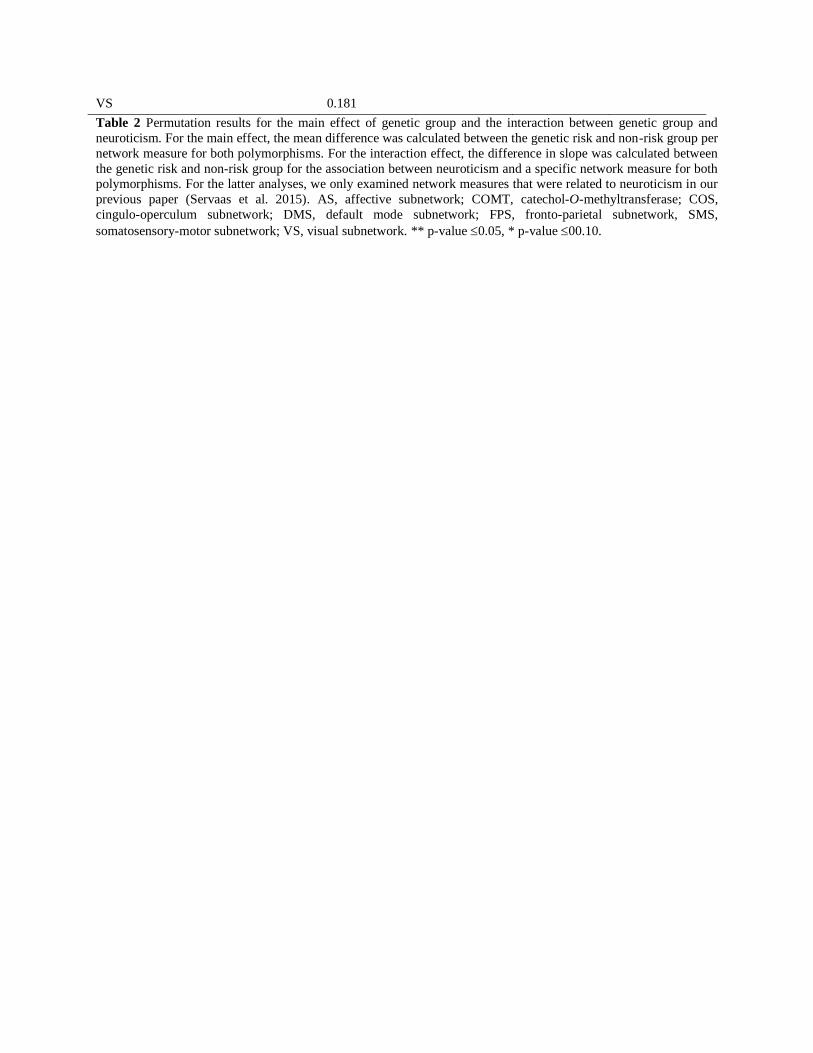
Table 2 Permutation results for the main effect of genetic group and the interaction between genetic group and
neuroticism. For the main effect, the mean difference was calculated between the genetic risk and non-risk group per
network measure for both polymorphisms. For the interaction effect, the difference in slope was calculated between
the genetic risk and non-risk group for the association between neuroticism and a specific network measure for both
polymorphisms. For the latter analyses, we only examined network measures that were related to neuroticism in our
previous paper (Servaas et al. 2015). AS, affective subnetwork; COMT, catechol-O-methyltransferase; COS,
cingulo-operculum subnetwork; DMS, default mode subnetwork; FPS, fronto-parietal subnetwork, SMS,
somatosensory-motor subnetwork; VS, visual subnetwork. ** p-value 0.05, * p-value 00.10.
VS 0.181

Supplement 9
Figure 1: Density plots and boxplots of the main effect of the 5-HTTLPR
polymorphism (participation coefficient of DMS)
Figure 1 For the main effect of the 5-HTTLPR polymorphism (participation coefficient DMS), density plots and
boxplots are presented for several proportional thresholds (5%, 10%, 15%, 20%, 25% and 30%). We observed that
differences were only pronounced for lower proportional thresholds (0.01-0.06). Note the different axes. DMS,
default mode subnetwork; prop. thres., proportional threshold.

Supplement 10
Figure 2: Density plots and boxplots for the main effect of the 5-HTTLPR
polymorphism (participation coefficient of FPS)
Figure 2 For the main effect of the 5-HTTLPR polymorphism (participation coefficient FPS), density plots and
boxplots are presented for several proportional thresholds (5%, 10%, 15%, 20%, 25% and 30%). Note the different
axes. FPS, frontal-parietal subnetwork; prop. thres., proportional threshold.

Supplement 11
Table 3: Correlation values for the association between the network measures and neuroticism per genetic group
Proportional threshold in %
1 2 3 4 5 6 7 8 9 10 11 12 13 14 15 16 17 18 19 20 21 22 23 24 25 26 27 28 29 30
COMT Local efficiency, SMS
Risk r -.15 -.24 -.33 -.36 -.47 -.44 -.46 -.46 -.47 -.47 -.49 -.48 -.49 -.50 -.49 -.49 -.50 -.50 -.50 -.50 -.50 -.50 -.50 -.50 -.50 -.50 -.50 -.50 -.50 -.50
Non-risk r -.11 -.13 -.05 -.01 -.01 -.04 -.13 -.12 -.11 -.13 -.15 -.15 -.14 -.14 -.12 -.13 -.13 -.13 -.13 -.14 -.14 -.14 -.15 -.15 -.15 -.14 -.15 -.15 -.15 -.15
COMT Local efficiency, VS
Risk r -.31 -.29 -.28 -.32 -.39 -.43 -.44 -.44 -.45 -.46 -.46 -.46 -.45 -.47 -.47 -.47 -.47 -.47 -.47 -.47 -.47 -.47 -.47 -.47 -.47 -.47 -.47 -.47 -.47 -.47
Non-risk r -.01 .01 .02 .04 .02 .00 -.01 -.02 -.03 -.03 -.03 -.04 -.05 -.05 -.07 -.08 -.08 -.09 -.09 -.09 -.09 -.09 -.09 -.10 -.10 -.10 -.11 -.11 -.11 -.11
Table 3 Correlation values for the association between the network measures and neuroticism per genetic group. Correlation values are given for each proportional threshold
value. COMT, catechol-O-methyltransferase; SMS, somatosensory-motor subnetwork; VS, visual subnetwork.

Supplement 12
Figure 3: Bootstrap results for the interaction between the COMT
polymorphism and neuroticism (local efficiency SMS)
Figure 3 Bootstrapping (n=5000) was performed for the interaction between the COMT polymorphism and
neuroticism for several proportional thresholds (5%, 10%, 15%, 20%, 25% and 30%). Note the different axes. N,
neuroticism; prop. thres., proportional threshold; SMS, somatosensory-motor subnetwork.
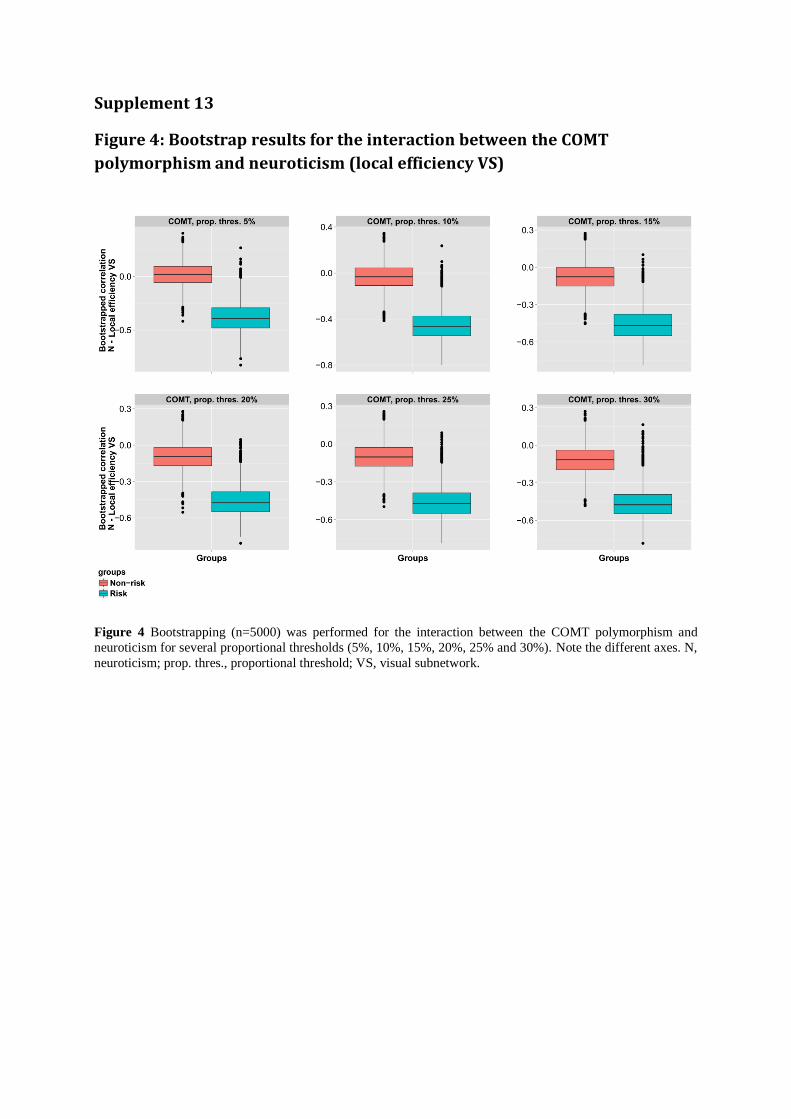
Supplement 13
Figure 4: Bootstrap results for the interaction between the COMT
polymorphism and neuroticism (local efficiency VS)
Figure 4 Bootstrapping (n=5000) was performed for the interaction between the COMT polymorphism and
neuroticism for several proportional thresholds (5%, 10%, 15%, 20%, 25% and 30%). Note the different axes. N,
neuroticism; prop. thres., proportional threshold; VS, visual subnetwork.

References
Ashburner, J. (2007). A fast diffeomorphic image registration algorithm. NeuroImage, 38(1),
95-113.
Blondel, V. D., Guillaume, J., Lambiotte, R., & Lefebvre, E. (2008). Fast unfolding of
communities in large networks. Journal of Statistical Mechanics, Theory and Experiment,
P10008.
Doornbos, B., Dijck-Brouwer, D. A., Kema, I. P., Tanke, M. A., van Goor, S. A., Muskiet, F.
A., et al. (2009). The development of peripartum depressive symptoms is associated with
gene polymorphisms of MAOA, 5-HTT and COMT. Progress in Neuro-
Psychopharmacology & Biological Psychiatry, 33(7), 1250-1254.
Geerligs, L., Renken, R. J., Saliasi, E., Maurits, N. M., & Lorist, M. M. (2015). A brain-wide
study of age-related changes in functional connectivity. Cerebral Cortex, 25(7), 1987-
1999.
Hariri, A. R., Mattay, V. S., Tessitore, A., Kolachana, B., Fera, F., Goldman, D., et al. (2002).
Serotonin transporter genetic variation and the response of the human amygdala. Science,
297(5580), 400-403.
Paulesu, E., Sambugaro, E., Torti, T., Danelli, L., Ferri, F., Scialfa, G., et al. (2010). Neural
correlates of worry in generalized anxiety disorder and in normal controls: A functional
MRI study. Psychological Medicine, 40(1), 117-124.
Pollatos, O., Herbert, B. M., Matthias, E., & Schandry, R. (2007). Heart rate response after
emotional picture presentation is modulated by interoceptive awareness. International
Journal of Psychophysiology, 63(1), 117-124.
Power, J. D., Barnes, K. A., Snyder, A. Z., Schlaggar, B. L., & Petersen, S. E. (2012).
Spurious but systematic correlations in functional connectivity MRI networks arise from
subject motion. NeuroImage, 59(3), 2142-2154.
Power, J. D., Cohen, A. L., Nelson, S. M., Wig, G. S., Barnes, K. A., Church, J. A., et al.
(2011). Functional network organization of the human brain. Neuron, 72(4), 665-678.
Sanfey, A. G., Rilling, J. K., Aronson, J. A., Nystrom, L. E., & Cohen, J. D. (2003). The
neural basis of economic decision-making in the ultimatum game. Science, 300(5626),
1755-1758.
Servaas, M. N., Geerligs, L., Renken, R. J., Marsman, J. B., Ormel, J., Riese, H., et al. (2015).
Connectomics and neuroticism: An altered functional network organization.
Neuropsychopharmacology, 40(2), 296-304.
Sun, Y., Danila, B., Josic, K., & Bassler, K. E. (2009). Improved community structure
detection using a modified fine-tuning strategy. Europhysics Letters, 86(2), 28004.
Van Dijk, K. R., Hedden, T., Venkataraman, A., Evans, K. C., Lazar, S. W., & Buckner, R. L.
(2010). Intrinsic functional connectivity as a tool for human connectomics: Theory,
properties, and optimization. Journal of Neurophysiology, 103(1), 297-321.
Related Documents