Australian Health Review 44, 590–600 © AHHA 2020 10.1071/AH19214_AC Supplementary Material for Evaluation of HealthPathways: an appraisal of usage, experiences and opinions of healthcare professionals in Australia and New Zealand Arran Goddard-Nash 1 BSc(Hons), Student Marshall Makate 1,5 PhD, Data Analytics Specialist Richard Varhol 1 MHIM, Research Fellow Frances Quirk 2 PhD, Director of Research, Professor Richard Larsen 3 BSc(Hons), Research Ethics Officer Graham McGeoch 4 MBChB, FRNZCGP, Clinical Leader Brett Shand 4 PhD, Clinical Writer and Analyst Suzanne Robinson 1 PhD, Theme Leader, Professor 1 Health Economics and Data Analytics, School of Public Health, Curtin University, GPO Box U1987, Perth, WA 6845, Australia. Email: [email protected]; [email protected]; [email protected] 2 New England Institute of Healthcare Research, Faculty of Medicine and Health, University of New England, Armidale, NSW 2351, Australia. Email: [email protected] 3 Barwon Health, University Hospital Geelong, Vic. 3220, Australia. Email: [email protected] 4 Canterbury Initiative, Canterbury District Health Board, 32 Oxford Terrace, Christchurch, New Zealand. Email: [email protected]; [email protected] 5 Corresponding author. Email: [email protected]

Welcome message from author
This document is posted to help you gain knowledge. Please leave a comment to let me know what you think about it! Share it to your friends and learn new things together.
Transcript

Australian Health Review 44, 590–600 © AHHA 2020 10.1071/AH19214_AC
Supplementary Material for
Evaluation of HealthPathways: an appraisal of usage, experiences and opinions of healthcare professionals in Australia and New Zealand Arran Goddard-Nash1 BSc(Hons), Student
Marshall Makate1,5 PhD, Data Analytics Specialist
Richard Varhol1 MHIM, Research Fellow
Frances Quirk2 PhD, Director of Research, Professor
Richard Larsen3 BSc(Hons), Research Ethics Officer
Graham McGeoch4 MBChB, FRNZCGP, Clinical Leader
Brett Shand4 PhD, Clinical Writer and Analyst
Suzanne Robinson1 PhD, Theme Leader, Professor
1Health Economics and Data Analytics, School of Public Health, Curtin University, GPO Box U1987, Perth, WA
6845, Australia. Email: [email protected]; [email protected]; [email protected]
2New England Institute of Healthcare Research, Faculty of Medicine and Health, University of New England,
Armidale, NSW 2351, Australia. Email: [email protected]
3Barwon Health, University Hospital Geelong, Vic. 3220, Australia. Email: [email protected]
4Canterbury Initiative, Canterbury District Health Board, 32 Oxford Terrace, Christchurch, New Zealand. Email:
[email protected]; [email protected]
5Corresponding author. Email: [email protected]

File S1. HealthPathways survey questionnaire


Table S1. How did you come across HealthPathways? Overall Australia New Zealand Reasons N % N % N % Primary Health Network recommendation 458 66.8 293 71.1 165 60.2 Colleague recommendation 158 23.0 82 19.9 76 27.7 Web-search 12 1.7 8 1.9 4 1.5 This is the first time I have heard about HealthPathways 123 17.9 68 16.5 55 20.1 Other 3 0.4 3 0.7 Observations 686 412 274
Note: Proportions are only calculated for health professionals who are aware or have used HealthPathways in the pasts.

Table S2. Unadjusted ordered logistic regression estimates of the frequency of usage of HealthPathways among general practitioners in New Zealand and Australia
Overall sample New Zealand Australia Specification Odds
ratio 95% CI Odds
ratio 95% CI Odds
ratio 95% CI
Years in clinical practice 1-5 years in practice 0.70 [0.42,1.16] 0.91 [0.29,2.82] 0.64 [0.36,1.15] 6-10 years in practice 0.69 [0.42,1.12] 0.75 [0.29,1.93] 0.62 [0.34,1.13] 11-20 years in practice 0.57* [0.35,0.92] 0.84 [0.33,2.16] 0.42** [0.23,0.75] 21-30 years in practice 1.00 [1.00,1.00] 1.00 [1.00,1.00] 1.00 [1.00,1.00] 31-40 years in practice 1.03 [0.60,1.78] 1.59 [0.51,4.93] 0.82 [0.44,1.52] 41+ years in practice 1.03 [0.52,2.04] 1.98 [0.76,5.19] 0.39 [0.14,1.06] General practitioner (GP) 4.98*** [3.01,8.24] 9.92*** [3.89,25.29] 2.88** [1.51,5.50] Years in clinical practice × HCP 1-5 years in practice × GP 2.47* [1.15,5.33] 1.71 [0.30,9.64] 5.49*** [2.14,14.10] 6-10 years in practice × GP 1.58 [0.71,3.51] 2.82 [0.42,18.93] 2.83* [1.06,7.55] 11-20 years in practice × GP 1.70 [0.84,3.43] 1.53 [0.38,6.16] 3.22** [1.33,7.79] 21-30 years in practice × GP 1.00 [1.00,1.00] 1.00 [1.00,1.00] 1.00 [1.00,1.00] 31-40 years in practice × GP 0.73 [0.34,1.54] 0.36 [0.09,1.49] 1.23 [0.48,3.14] 41+ years in practice × GP 0.57 [0.16,1.99] 0.46 [0.07,2.83] 1.48 [0.30,7.34] Observations 965 313 652
Notes: ***Significant at 1% level; **significant at 5% level; *significant at 10% level. The dependent variable in each instance is an ordered variable measuring the frequency of usage of HealthPathways (i.e. 1=never, 2=rarely(1-3 times), 3=sometimes(3-10 times), and 4=often(> 10 times)). Standard errors, robust to heteroscedasticity are assumed. Reference category: GPs with 21-30 years of experience in professional practice.

Table S3. Ordered logistic regression estimates of the frequency of usage of HealthPathways among general practitioners in New Zealand and Australia
Overall sample New Zealand Australia Specification Odds ratio 95% CI Odds ratio 95% CI Odds ratio 95% CI Years in clinical practice 1-5 years in practice 0.73 [0.42,1.26] 0.89 [0.29,2.75] 0.66 [0.36,1.18] 6-10 years in practice 0.64 [0.38,1.08] 0.77 [0.30,1.97] 0.62 [0.34,1.13] 11-20 years in practice 0.52* [0.31,0.87] 0.90 [0.35,2.31] 0.42** [0.23,0.76] 21-30 years in practice 1.00 [1.00,1.00] 1.00 [1.00,1.00] 1.00 [1.00,1.00] 31-40 years in practice 1.01 [0.57,1.78] 1.57 [0.51,4.82] 0.84 [0.45,1.56] 41+ years in practice 0.79 [0.41,1.51] 2.02 [0.78,5.25] 0.40 [0.14,1.12] General practitioner (GP) 4.69*** [2.75,7.99] 12.06*** [4.48,32.46] 3.10*** [1.61,5.99] Years in clinical practice × HCP 1-5 years in practice × GP 3.75** [1.63,8.63] 1.87 [0.34,10.14] 5.35*** [2.06,13.91] 6-10 years in practice × GP 2.36* [1.03,5.40] 2.65 [0.40,17.63] 2.80* [1.05,7.45] 11-20 years in practice × GP 2.26* [1.09,4.69] 1.31 [0.32,5.41] 3.13* [1.30,7.56] 21-30 years in practice × GP 1.00 [1.00,1.00] 1.00 [1.00,1.00] 1.00 [1.00,1.00] 31-40 years in practice × GP 0.82 [0.38,1.77] 0.37 [0.09,1.52] 1.22 [0.47,3.12] 41+ years in practice × GP 0.92 [0.30,2.81] 0.56 [0.10,3.15] 1.60 [0.32,7.91] Observations 965 313 652
Notes: ***Significant at 1% level; **significant at 5% level; *significant at 10% level. The dependent variable in each instance is an ordered response variable measuring the frequency of usage of HealthPathways (i.e. 1=never, 2=rarely (1-3 times), 3=sometimes (4-10 times), and 4=often (> 10 times)). Standard errors, robust to heteroskedasticity are assumed. All models include controls for gender (=1 if female), time of working week spent in professional practice (=1 if more than 0.5 Full Time Equivalent (FTE)), and location fixed effects (i.e. binary indicators for location), where applicable). Reference category: GPs with 21-30 years of experience in professional practice.
17
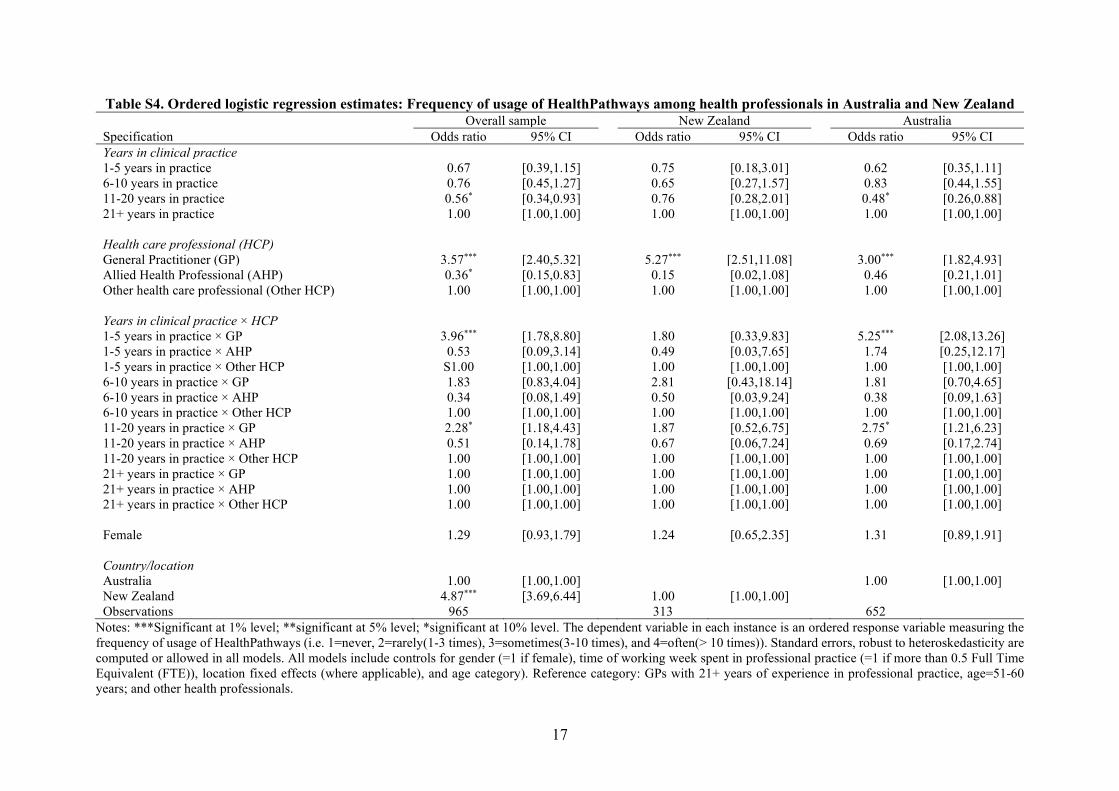
Table S4. Ordered logistic regression estimates: Frequency of usage of HealthPathways among health professionals in Australia and New Zealand Overall sample New Zealand Australia Specification Odds ratio 95% CI Odds ratio 95% CI Odds ratio 95% CI Years in clinical practice 1-5 years in practice 0.67 [0.39,1.15] 0.75 [0.18,3.01] 0.62 [0.35,1.11] 6-10 years in practice 0.76 [0.45,1.27] 0.65 [0.27,1.57] 0.83 [0.44,1.55] 11-20 years in practice 0.56* [0.34,0.93] 0.76 [0.28,2.01] 0.48* [0.26,0.88] 21+ years in practice 1.00 [1.00,1.00] 1.00 [1.00,1.00] 1.00 [1.00,1.00] Health care professional (HCP) General Practitioner (GP) 3.57*** [2.40,5.32] 5.27*** [2.51,11.08] 3.00*** [1.82,4.93] Allied Health Professional (AHP) 0.36* [0.15,0.83] 0.15 [0.02,1.08] 0.46 [0.21,1.01] Other health care professional (Other HCP) 1.00 [1.00,1.00] 1.00 [1.00,1.00] 1.00 [1.00,1.00] Years in clinical practice × HCP 1-5 years in practice × GP 3.96*** [1.78,8.80] 1.80 [0.33,9.83] 5.25*** [2.08,13.26] 1-5 years in practice × AHP 0.53 [0.09,3.14] 0.49 [0.03,7.65] 1.74 [0.25,12.17] 1-5 years in practice × Other HCP S1.00 [1.00,1.00] 1.00 [1.00,1.00] 1.00 [1.00,1.00] 6-10 years in practice × GP 1.83 [0.83,4.04] 2.81 [0.43,18.14] 1.81 [0.70,4.65] 6-10 years in practice × AHP 0.34 [0.08,1.49] 0.50 [0.03,9.24] 0.38 [0.09,1.63] 6-10 years in practice × Other HCP 1.00 [1.00,1.00] 1.00 [1.00,1.00] 1.00 [1.00,1.00] 11-20 years in practice × GP 2.28* [1.18,4.43] 1.87 [0.52,6.75] 2.75* [1.21,6.23] 11-20 years in practice × AHP 0.51 [0.14,1.78] 0.67 [0.06,7.24] 0.69 [0.17,2.74] 11-20 years in practice × Other HCP 1.00 [1.00,1.00] 1.00 [1.00,1.00] 1.00 [1.00,1.00] 21+ years in practice × GP 1.00 [1.00,1.00] 1.00 [1.00,1.00] 1.00 [1.00,1.00] 21+ years in practice × AHP 1.00 [1.00,1.00] 1.00 [1.00,1.00] 1.00 [1.00,1.00] 21+ years in practice × Other HCP 1.00 [1.00,1.00] 1.00 [1.00,1.00] 1.00 [1.00,1.00] Female 1.29 [0.93,1.79] 1.24 [0.65,2.35] 1.31 [0.89,1.91] Country/location Australia 1.00 [1.00,1.00] 1.00 [1.00,1.00] New Zealand 4.87*** [3.69,6.44] 1.00 [1.00,1.00] Observations 965 313 652
Notes: ***Significant at 1% level; **significant at 5% level; *significant at 10% level. The dependent variable in each instance is an ordered response variable measuring the frequency of usage of HealthPathways (i.e. 1=never, 2=rarely(1-3 times), 3=sometimes(3-10 times), and 4=often(> 10 times)). Standard errors, robust to heteroskedasticity are computed or allowed in all models. All models include controls for gender (=1 if female), time of working week spent in professional practice (=1 if more than 0.5 Full Time Equivalent (FTE)), location fixed effects (where applicable), and age category). Reference category: GPs with 21+ years of experience in professional practice, age=51-60 years; and other health professionals.
18
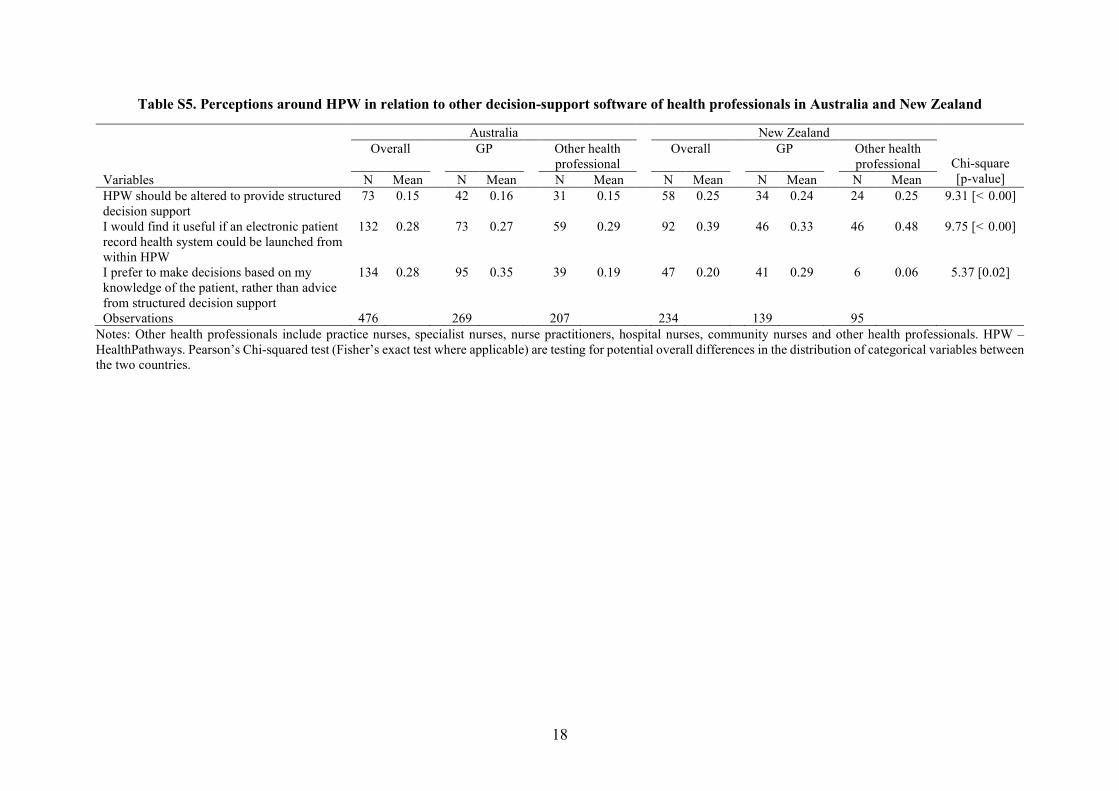
Table S5. Perceptions around HPW in relation to other decision-support software of health professionals in Australia and New Zealand
Australia New Zealand
Chi-square [p-value]
Overall GP Other health professional
Overall GP Other health professional
Variables N Mean N Mean N Mean N Mean N Mean N Mean HPW should be altered to provide structured decision support
73 0.15 42 0.16 31 0.15 58 0.25 34 0.24 24 0.25 9.31 [< 0.00]
I would find it useful if an electronic patient record health system could be launched from within HPW
132 0.28 73 0.27 59 0.29 92 0.39 46 0.33 46 0.48 9.75 [< 0.00]
I prefer to make decisions based on my knowledge of the patient, rather than advice from structured decision support
134 0.28 95 0.35 39 0.19 47 0.20 41 0.29 6 0.06 5.37 [0.02]
Observations 476 269 207 234 139 95 Notes: Other health professionals include practice nurses, specialist nurses, nurse practitioners, hospital nurses, community nurses and other health professionals. HPW – HealthPathways. Pearson’s Chi-squared test (Fisher’s exact test where applicable) are testing for potential overall differences in the distribution of categorical variables between the two countries.
Related Documents