SUPPLEMENTARY INFORMATION DOI: 10.1038/NMAT4369 NATURE MATERIALS | www.nature.com/naturematerials 1 Yan Wang 1 , William Davidson Richards 1 , Shyue Ping Ong 1,2 , Lincoln J. Miara 3 , Jae Chul Kim 1 , Yifei Mo 1,4 and Gerbrand Ceder 1,5,6 * 1 Department of Materials Science and Engineering, Massachusetts Institute of Technology, Cambridge, Massachusetts 02139, USA 2 Department of NanoEngineering, University of California, San Diego, La Jolla, California 92093, USA 3 Samsung Advanced Institute of Technology-USA, 1 Cambridge Center, Suite 702, Cambridge, Massachusetts 02142, USA 4 Department of Materials Science and Engineering, University of Maryland, College Park, Maryland 20742, USA 5 Department of Materials Science and Engineering, University of California, Berkeley, California 94720, USA 6 Materials Sciences Division, Lawrence Berkeley National Laboratory, Berkeley, California 94720, USA *E-mail: [email protected] Design principles for solid-state lithium superionic conductors © 2015 Macmillan Publishers Limited. All rights reserved

Welcome message from author
This document is posted to help you gain knowledge. Please leave a comment to let me know what you think about it! Share it to your friends and learn new things together.
Transcript
SUPPLEMENTARY INFORMATIONDOI: 10.1038/NMAT4369
NATURE MATERIALS | www.nature.com/naturematerials 1 S-‐1
Supplementary Information
Design Principles for Solid-state Lithium Superionic
Conductors
Yan Wang1, William Davidson Richards1, Shyue Ping Ong1,2,
Lincoln J. Miara3, Jae Chul Kim1, Yifei Mo1,4 and Gerbrand Ceder1,5,6*
1Department of Materials Science and Engineering, Massachusetts Institute of Technology, Cambridge, Massachusetts 02139, USA
2Department of NanoEngineering, University of California, San Diego, La Jolla, California 92093, USA
3Samsung Advanced Institute of Technology-USA, 1 Cambridge Center, Suite 702, Cambridge, Massachusetts 02142, USA
4Department of Materials Science and Engineering, University of Maryland, College Park, Maryland 20742, USA
5Department of Materials Science and Engineering, University of California, Berkeley, California 94720, USA
6Materials Sciences Division, Lawrence Berkeley National Laboratory, Berkeley, California 94720, USA
*E-mail: [email protected]
Design principles for solid-state lithium superionic conductors
© 2015 Macmillan Publishers Limited. All rights reserved

2 NATURE MATERIALS | www.nature.com/naturematerials
SUPPLEMENTARY INFORMATION DOI: 10.1038/NMAT4369
S-‐2
Figure S1. A flowchart of the structural matching algorithm for Li10GeP2S12 with its
anion sublattice closely matches to a bcc lattice. The algorithm finds the supercell and
affine transformation M mapping the input exact bcc lattice onto the lattice of the
Li10GeP2S12 that minimizes the root-mean-square (rms) distance from the S atoms in the
transformed (and slightly distorted) bcc-like supercell to the corresponding S atoms in the
Li10GeP2S12. Only affine transformations preserving bcc supercell lattice angles to within
3 degrees, and supercell lattice vector lengths to within 5% are considered in the
matching, and the maximum allowed rms is set to be 0.3(V/n)1/3 ≈ 1.0 (Å) for the
mapping, where V is the volume of Li10GeP2S12 and n is the number of S atoms in
Li10GeP2S12. The conventional unit-cell parameters (a, b, c, α, β, and γ) of the
transformed lattice are the results for the structural matching.
S-‐3
Table S1. The structural matching results for Li10GeP2S12, Li7P3S11, Li2S, Li4GeS4 and γ-
Li3PS4 (low temperature phase, space group Pmn21). The structures are obtained from the
Inorganic Crystal Structure Database (ICSD)1. a, b, c, α, β, and γ are the conventional
unit-cell parameters of the transformed lattice. R is the rms distance between the sulfur
sublattice of each structure and the transformed lattice.
Materials Anion lattice type
a (Å) b (Å) c (Å) α (°) β (°) γ (°) R (Å)
Li10GeP2S12 bcc 4.35 4.35 4.20 90.0 90.0 90.0 0.58
Li7P3S11 bcc 4.19 4.29 4.20 90.2 87.4 90.7 0.82
Li2S fcc 5.76 5.76 5.76 90.0 90.0 90.0 0.0
Li4GeS4 hcp 4.01 4.01 6.15 90.0 90.0 122.15 0.27
γ-Li3PS4 hcp 3.80 3.80 6.14 90.0 90.0 118.9 0.32
© 2015 Macmillan Publishers Limited. All rights reserved

NATURE MATERIALS | www.nature.com/naturematerials 3
SUPPLEMENTARY INFORMATIONDOI: 10.1038/NMAT4369
S-‐2
Figure S1. A flowchart of the structural matching algorithm for Li10GeP2S12 with its
anion sublattice closely matches to a bcc lattice. The algorithm finds the supercell and
affine transformation M mapping the input exact bcc lattice onto the lattice of the
Li10GeP2S12 that minimizes the root-mean-square (rms) distance from the S atoms in the
transformed (and slightly distorted) bcc-like supercell to the corresponding S atoms in the
Li10GeP2S12. Only affine transformations preserving bcc supercell lattice angles to within
3 degrees, and supercell lattice vector lengths to within 5% are considered in the
matching, and the maximum allowed rms is set to be 0.3(V/n)1/3 ≈ 1.0 (Å) for the
mapping, where V is the volume of Li10GeP2S12 and n is the number of S atoms in
Li10GeP2S12. The conventional unit-cell parameters (a, b, c, α, β, and γ) of the
transformed lattice are the results for the structural matching.
S-‐3
Table S1. The structural matching results for Li10GeP2S12, Li7P3S11, Li2S, Li4GeS4 and γ-
Li3PS4 (low temperature phase, space group Pmn21). The structures are obtained from the
Inorganic Crystal Structure Database (ICSD)1. a, b, c, α, β, and γ are the conventional
unit-cell parameters of the transformed lattice. R is the rms distance between the sulfur
sublattice of each structure and the transformed lattice.
Materials Anion lattice type
a (Å) b (Å) c (Å) α (°) β (°) γ (°) R (Å)
Li10GeP2S12 bcc 4.35 4.35 4.20 90.0 90.0 90.0 0.58
Li7P3S11 bcc 4.19 4.29 4.20 90.2 87.4 90.7 0.82
Li2S fcc 5.76 5.76 5.76 90.0 90.0 90.0 0.0
Li4GeS4 hcp 4.01 4.01 6.15 90.0 90.0 122.15 0.27
γ-Li3PS4 hcp 3.80 3.80 6.14 90.0 90.0 118.9 0.32
© 2015 Macmillan Publishers Limited. All rights reserved
4 NATURE MATERIALS | www.nature.com/naturematerials
SUPPLEMENTARY INFORMATION DOI: 10.1038/NMAT4369
S-‐4
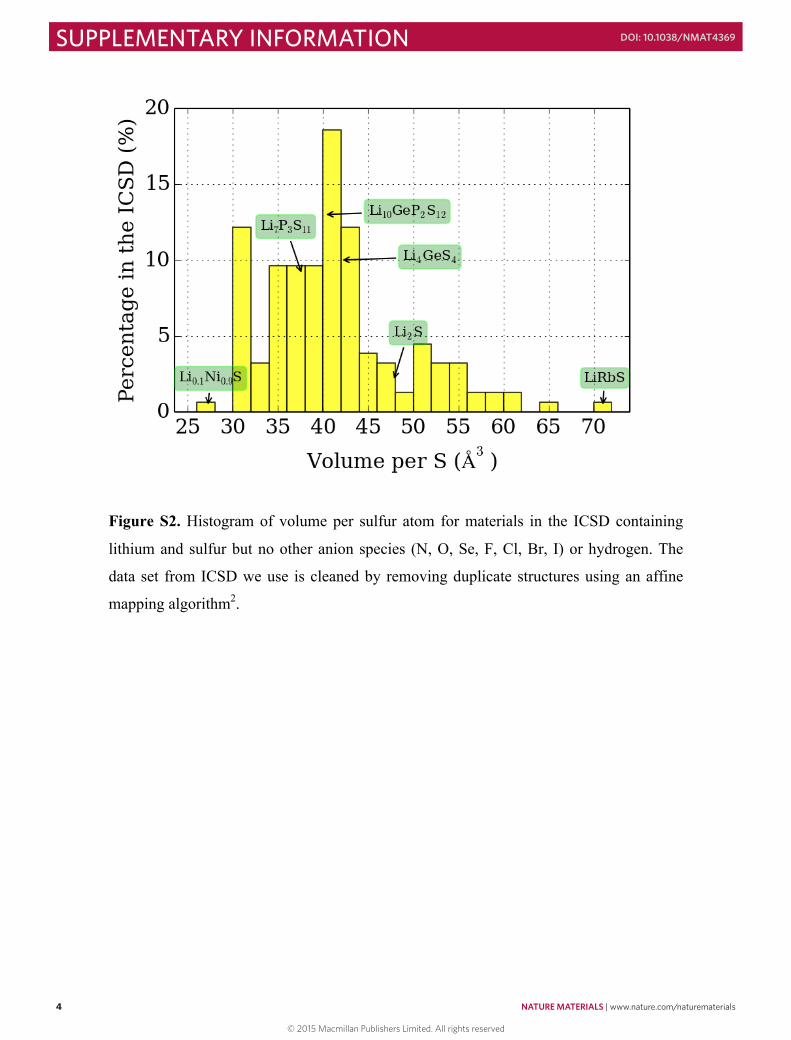
Figure S2. Histogram of volume per sulfur atom for materials in the ICSD containing
lithium and sulfur but no other anion species (N, O, Se, F, Cl, Br, I) or hydrogen. The
data set from ICSD we use is cleaned by removing duplicate structures using an affine
mapping algorithm2.
S-‐5
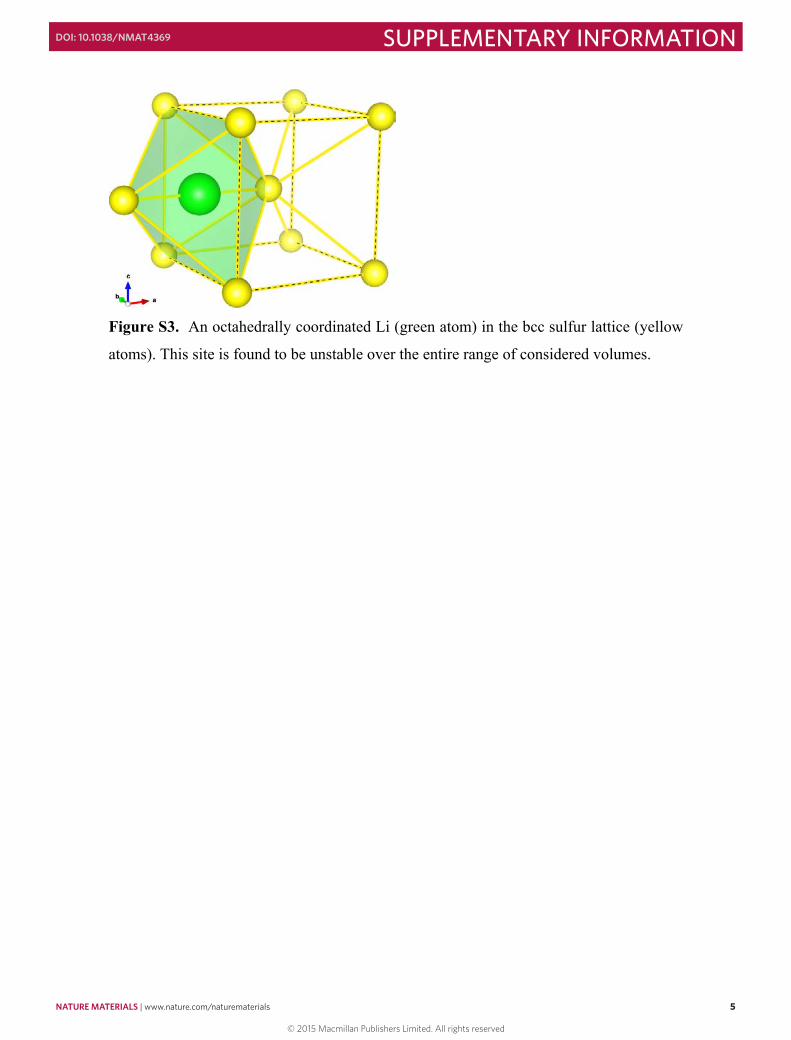
Figure S3. An octahedrally coordinated Li (green atom) in the bcc sulfur lattice (yellow
atoms). This site is found to be unstable over the entire range of considered volumes.
© 2015 Macmillan Publishers Limited. All rights reserved
NATURE MATERIALS | www.nature.com/naturematerials 5
SUPPLEMENTARY INFORMATIONDOI: 10.1038/NMAT4369
S-‐4
Figure S2. Histogram of volume per sulfur atom for materials in the ICSD containing
lithium and sulfur but no other anion species (N, O, Se, F, Cl, Br, I) or hydrogen. The
data set from ICSD we use is cleaned by removing duplicate structures using an affine
mapping algorithm2.
S-‐5
Figure S3. An octahedrally coordinated Li (green atom) in the bcc sulfur lattice (yellow
atoms). This site is found to be unstable over the entire range of considered volumes.
© 2015 Macmillan Publishers Limited. All rights reserved
6 NATURE MATERIALS | www.nature.com/naturematerials
SUPPLEMENTARY INFORMATION DOI: 10.1038/NMAT4369
S-‐6
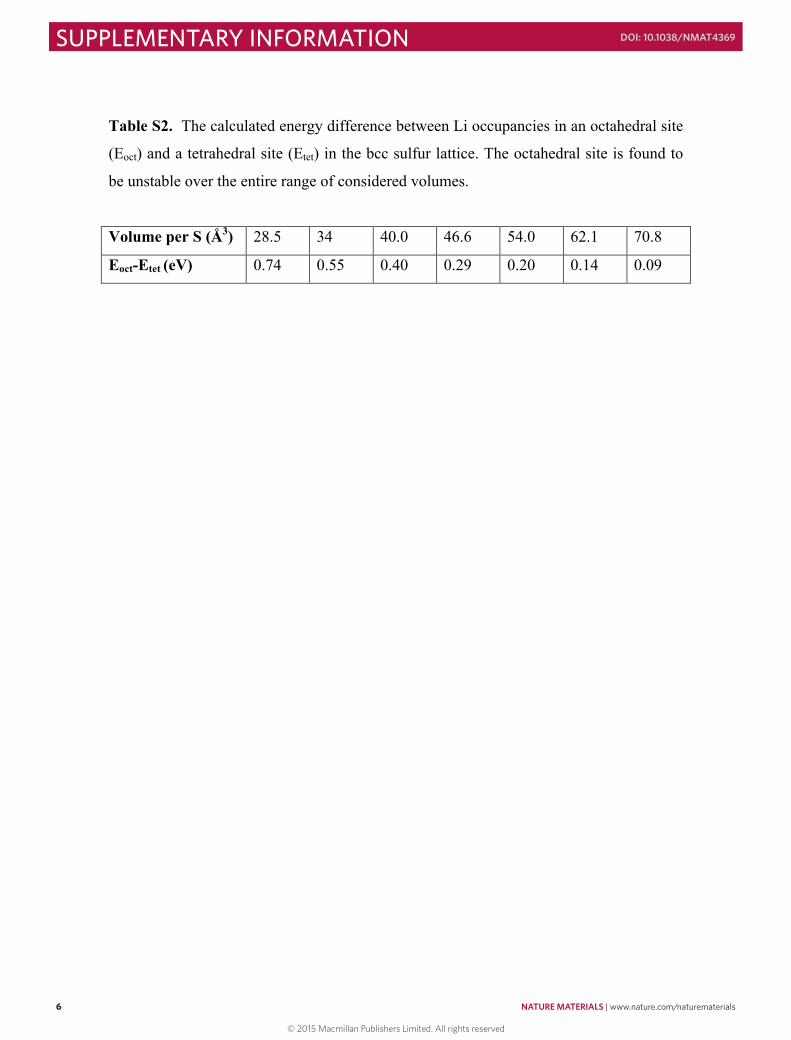
Table S2. The calculated energy difference between Li occupancies in an octahedral site
(Eoct) and a tetrahedral site (Etet) in the bcc sulfur lattice. The octahedral site is found to
be unstable over the entire range of considered volumes.
Volume per S (Å3) 28.5 34 40.0 46.6 54.0 62.1 70.8
Eoct-Etet (eV) 0.74 0.55 0.40 0.29 0.20 0.14 0.09
S-‐7
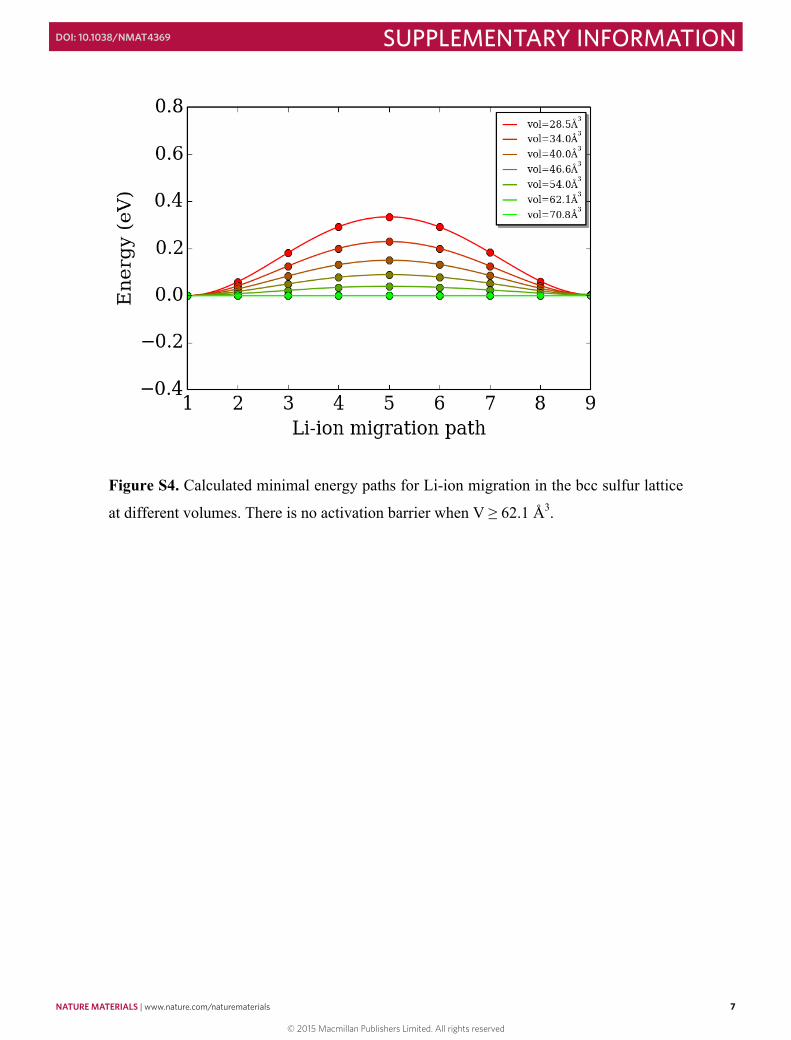
Figure S4. Calculated minimal energy paths for Li-ion migration in the bcc sulfur lattice
at different volumes. There is no activation barrier when V ≥ 62.1 Å3.
© 2015 Macmillan Publishers Limited. All rights reserved
NATURE MATERIALS | www.nature.com/naturematerials 7
SUPPLEMENTARY INFORMATIONDOI: 10.1038/NMAT4369
S-‐6
Table S2. The calculated energy difference between Li occupancies in an octahedral site
(Eoct) and a tetrahedral site (Etet) in the bcc sulfur lattice. The octahedral site is found to
be unstable over the entire range of considered volumes.
Volume per S (Å3) 28.5 34 40.0 46.6 54.0 62.1 70.8
Eoct-Etet (eV) 0.74 0.55 0.40 0.29 0.20 0.14 0.09
S-‐7
Figure S4. Calculated minimal energy paths for Li-ion migration in the bcc sulfur lattice
at different volumes. There is no activation barrier when V ≥ 62.1 Å3.
© 2015 Macmillan Publishers Limited. All rights reserved
8 NATURE MATERIALS | www.nature.com/naturematerials
SUPPLEMENTARY INFORMATION DOI: 10.1038/NMAT4369
S-‐8
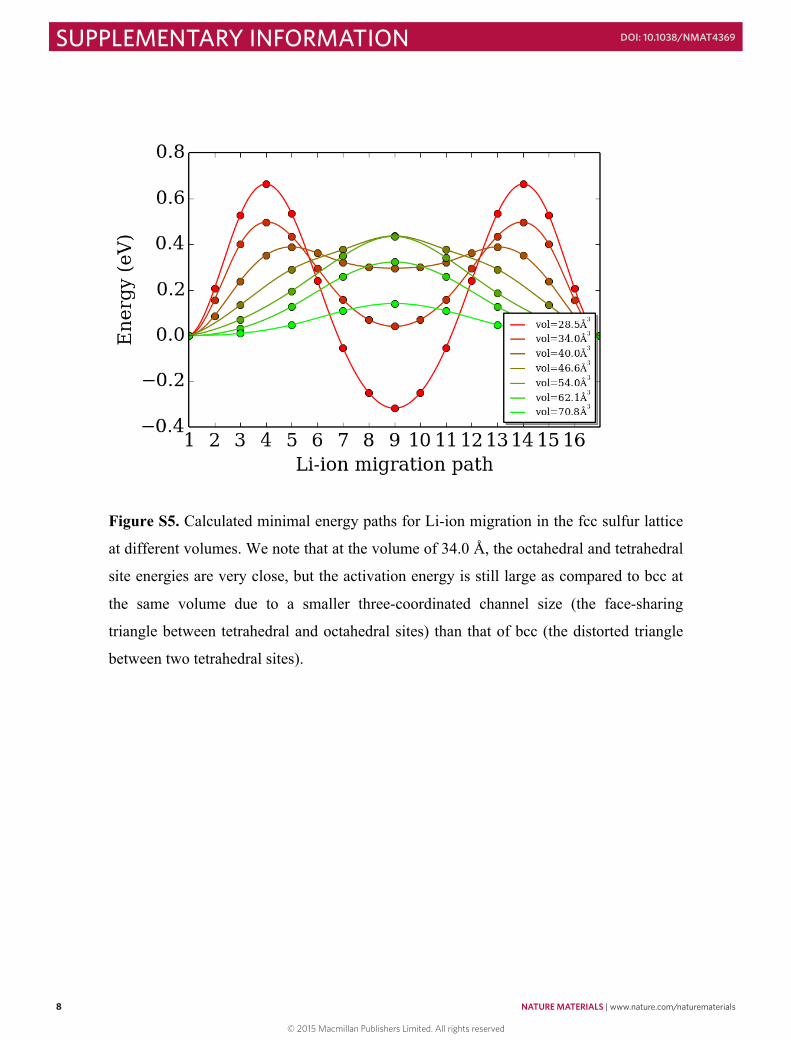
Figure S5. Calculated minimal energy paths for Li-ion migration in the fcc sulfur lattice
at different volumes. We note that at the volume of 34.0 Å, the octahedral and tetrahedral
site energies are very close, but the activation energy is still large as compared to bcc at
the same volume due to a smaller three-coordinated channel size (the face-sharing
triangle between tetrahedral and octahedral sites) than that of bcc (the distorted triangle
between two tetrahedral sites).
S-‐9
a
b
c
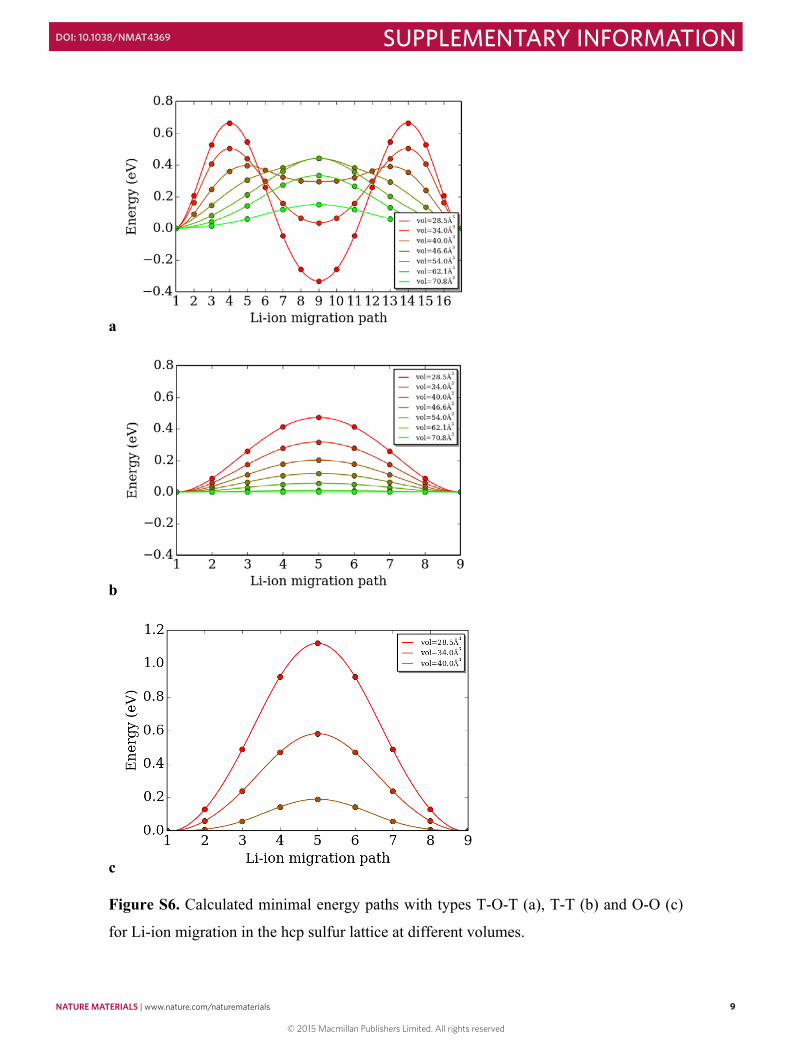
Figure S6. Calculated minimal energy paths with types T-O-T (a), T-T (b) and O-O (c)
for Li-ion migration in the hcp sulfur lattice at different volumes.
© 2015 Macmillan Publishers Limited. All rights reserved
NATURE MATERIALS | www.nature.com/naturematerials 9
SUPPLEMENTARY INFORMATIONDOI: 10.1038/NMAT4369
S-‐8
Figure S5. Calculated minimal energy paths for Li-ion migration in the fcc sulfur lattice
at different volumes. We note that at the volume of 34.0 Å, the octahedral and tetrahedral
site energies are very close, but the activation energy is still large as compared to bcc at
the same volume due to a smaller three-coordinated channel size (the face-sharing
triangle between tetrahedral and octahedral sites) than that of bcc (the distorted triangle
between two tetrahedral sites).
S-‐9
a
b
c
Figure S6. Calculated minimal energy paths with types T-O-T (a), T-T (b) and O-O (c)
for Li-ion migration in the hcp sulfur lattice at different volumes.
© 2015 Macmillan Publishers Limited. All rights reserved
10 NATURE MATERIALS | www.nature.com/naturematerials
SUPPLEMENTARY INFORMATION DOI: 10.1038/NMAT4369
S-‐10
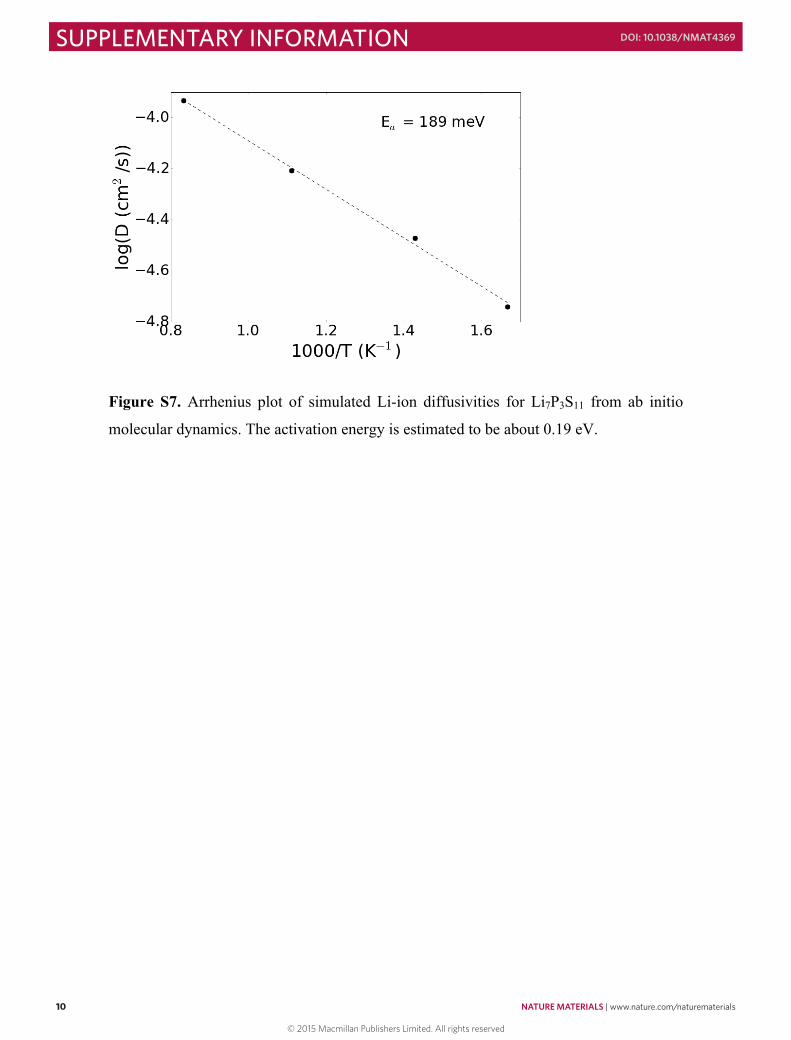
Figure S7. Arrhenius plot of simulated Li-ion diffusivities for Li7P3S11 from ab initio
molecular dynamics. The activation energy is estimated to be about 0.19 eV.
S-‐11
a
b
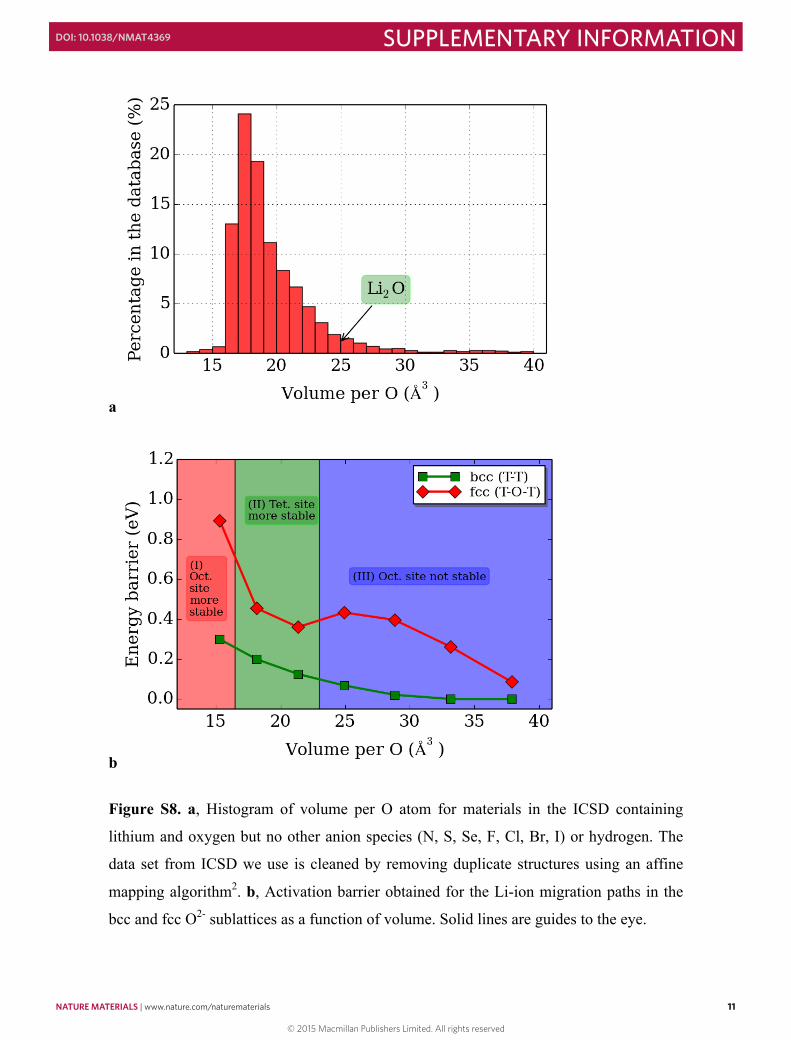
Figure S8. a, Histogram of volume per O atom for materials in the ICSD containing
lithium and oxygen but no other anion species (N, S, Se, F, Cl, Br, I) or hydrogen. The
data set from ICSD we use is cleaned by removing duplicate structures using an affine
mapping algorithm2. b, Activation barrier obtained for the Li-ion migration paths in the
bcc and fcc O2- sublattices as a function of volume. Solid lines are guides to the eye.
© 2015 Macmillan Publishers Limited. All rights reserved
NATURE MATERIALS | www.nature.com/naturematerials 11
SUPPLEMENTARY INFORMATIONDOI: 10.1038/NMAT4369
S-‐10
Figure S7. Arrhenius plot of simulated Li-ion diffusivities for Li7P3S11 from ab initio
molecular dynamics. The activation energy is estimated to be about 0.19 eV.
S-‐11
a
b
Figure S8. a, Histogram of volume per O atom for materials in the ICSD containing
lithium and oxygen but no other anion species (N, S, Se, F, Cl, Br, I) or hydrogen. The
data set from ICSD we use is cleaned by removing duplicate structures using an affine
mapping algorithm2. b, Activation barrier obtained for the Li-ion migration paths in the
bcc and fcc O2- sublattices as a function of volume. Solid lines are guides to the eye.
© 2015 Macmillan Publishers Limited. All rights reserved
12 NATURE MATERIALS | www.nature.com/naturematerials
SUPPLEMENTARY INFORMATION DOI: 10.1038/NMAT4369
S-‐12
a
b
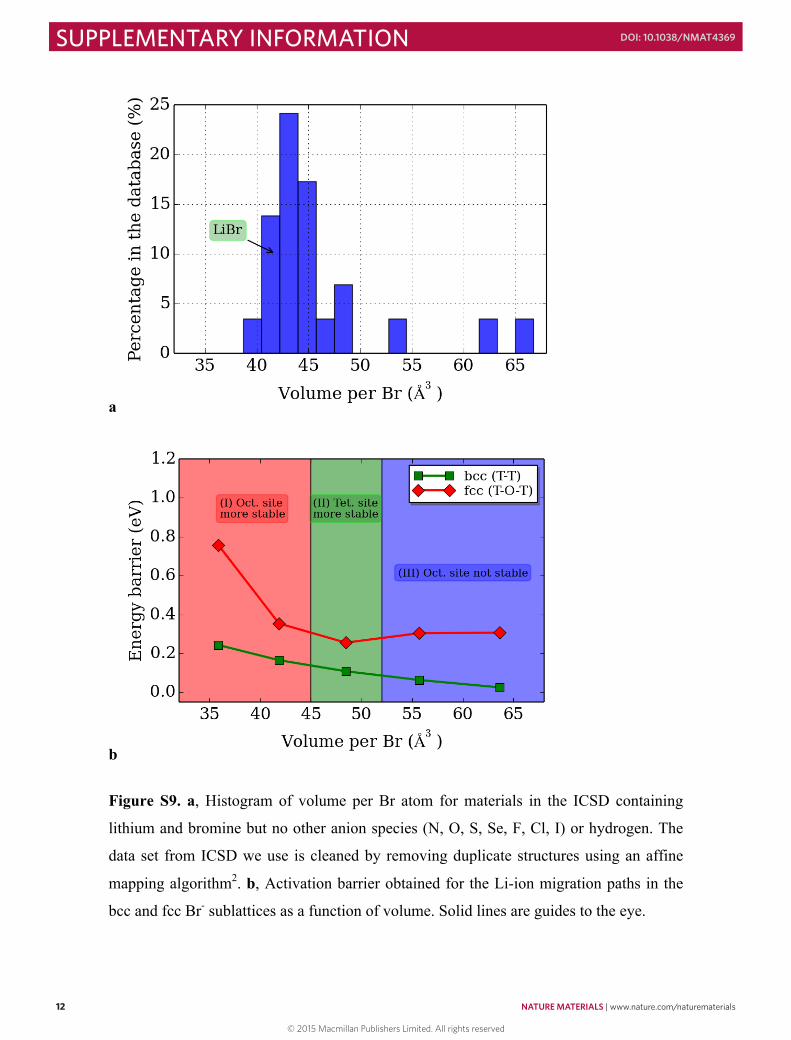
Figure S9. a, Histogram of volume per Br atom for materials in the ICSD containing
lithium and bromine but no other anion species (N, O, S, Se, F, Cl, I) or hydrogen. The
data set from ICSD we use is cleaned by removing duplicate structures using an affine
mapping algorithm2. b, Activation barrier obtained for the Li-ion migration paths in the
bcc and fcc Br- sublattices as a function of volume. Solid lines are guides to the eye.
S-‐13
a
b
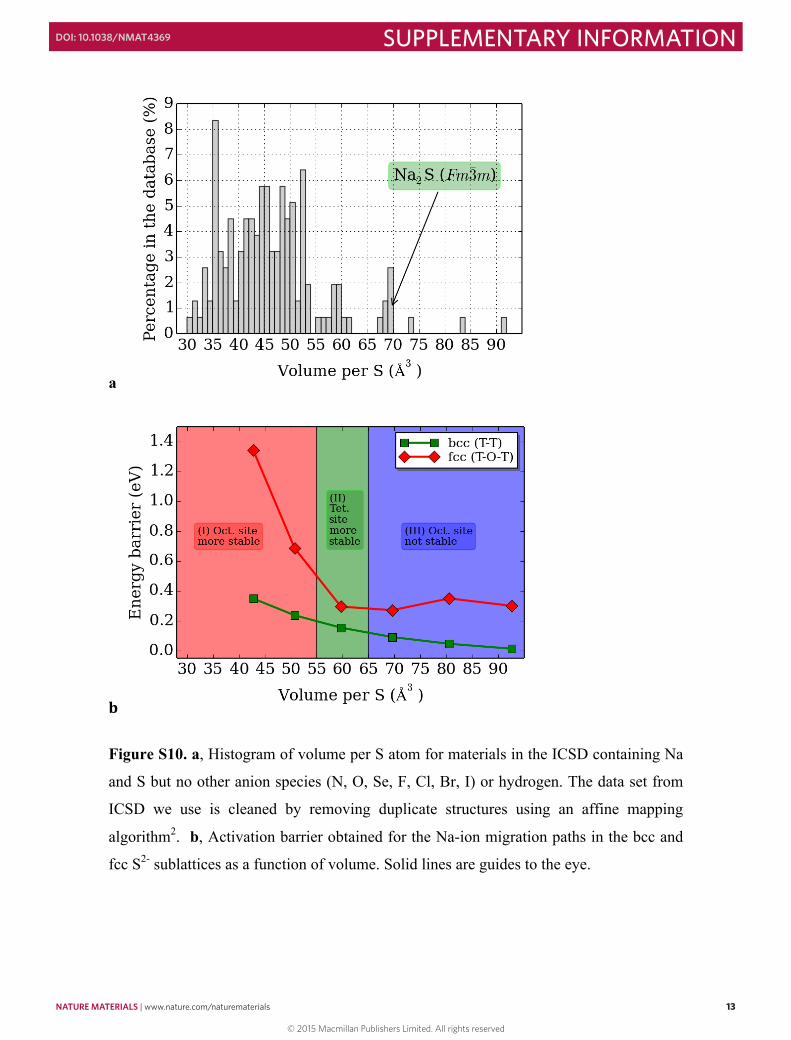
Figure S10. a, Histogram of volume per S atom for materials in the ICSD containing Na
and S but no other anion species (N, O, Se, F, Cl, Br, I) or hydrogen. The data set from
ICSD we use is cleaned by removing duplicate structures using an affine mapping
algorithm2. b, Activation barrier obtained for the Na-ion migration paths in the bcc and
fcc S2- sublattices as a function of volume. Solid lines are guides to the eye.
© 2015 Macmillan Publishers Limited. All rights reserved
NATURE MATERIALS | www.nature.com/naturematerials 13
SUPPLEMENTARY INFORMATIONDOI: 10.1038/NMAT4369
S-‐12
a
b
Figure S9. a, Histogram of volume per Br atom for materials in the ICSD containing
lithium and bromine but no other anion species (N, O, S, Se, F, Cl, I) or hydrogen. The
data set from ICSD we use is cleaned by removing duplicate structures using an affine
mapping algorithm2. b, Activation barrier obtained for the Li-ion migration paths in the
bcc and fcc Br- sublattices as a function of volume. Solid lines are guides to the eye.
S-‐13
a
b
Figure S10. a, Histogram of volume per S atom for materials in the ICSD containing Na
and S but no other anion species (N, O, Se, F, Cl, Br, I) or hydrogen. The data set from
ICSD we use is cleaned by removing duplicate structures using an affine mapping
algorithm2. b, Activation barrier obtained for the Na-ion migration paths in the bcc and
fcc S2- sublattices as a function of volume. Solid lines are guides to the eye.
© 2015 Macmillan Publishers Limited. All rights reserved
14 NATURE MATERIALS | www.nature.com/naturematerials
SUPPLEMENTARY INFORMATION DOI: 10.1038/NMAT4369
S-‐14
a
b
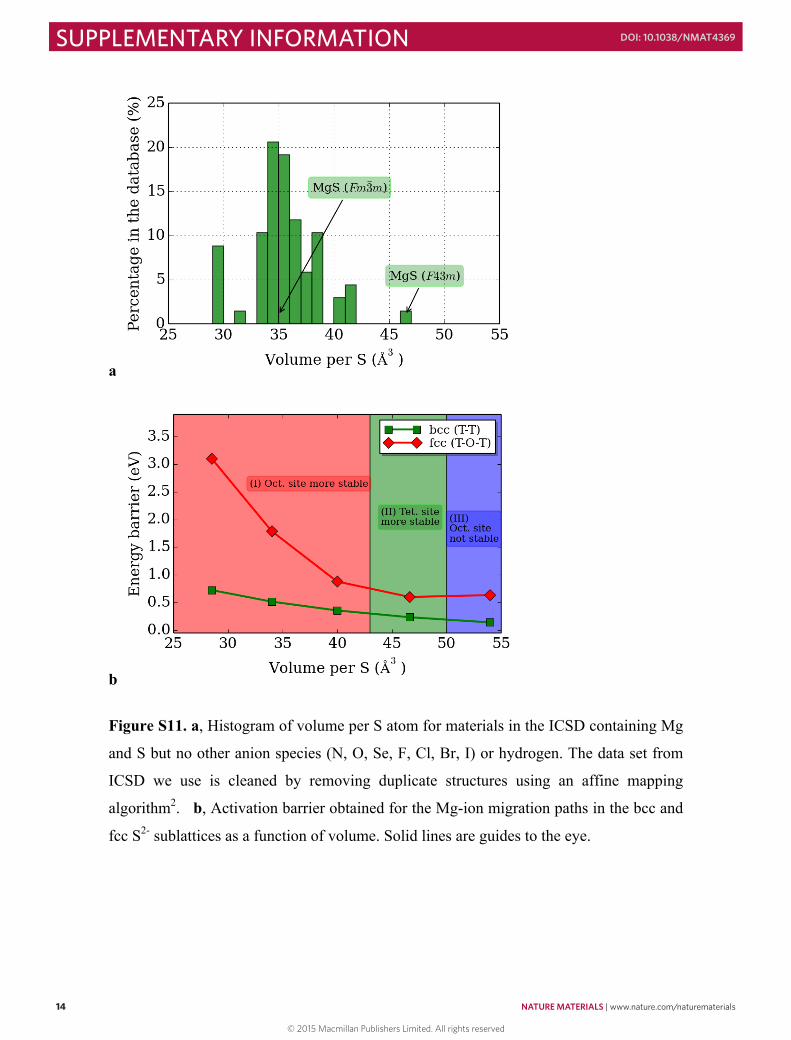
Figure S11. a, Histogram of volume per S atom for materials in the ICSD containing Mg
and S but no other anion species (N, O, Se, F, Cl, Br, I) or hydrogen. The data set from
ICSD we use is cleaned by removing duplicate structures using an affine mapping
algorithm2. b, Activation barrier obtained for the Mg-ion migration paths in the bcc and
fcc S2- sublattices as a function of volume. Solid lines are guides to the eye.
S-‐15
a
b
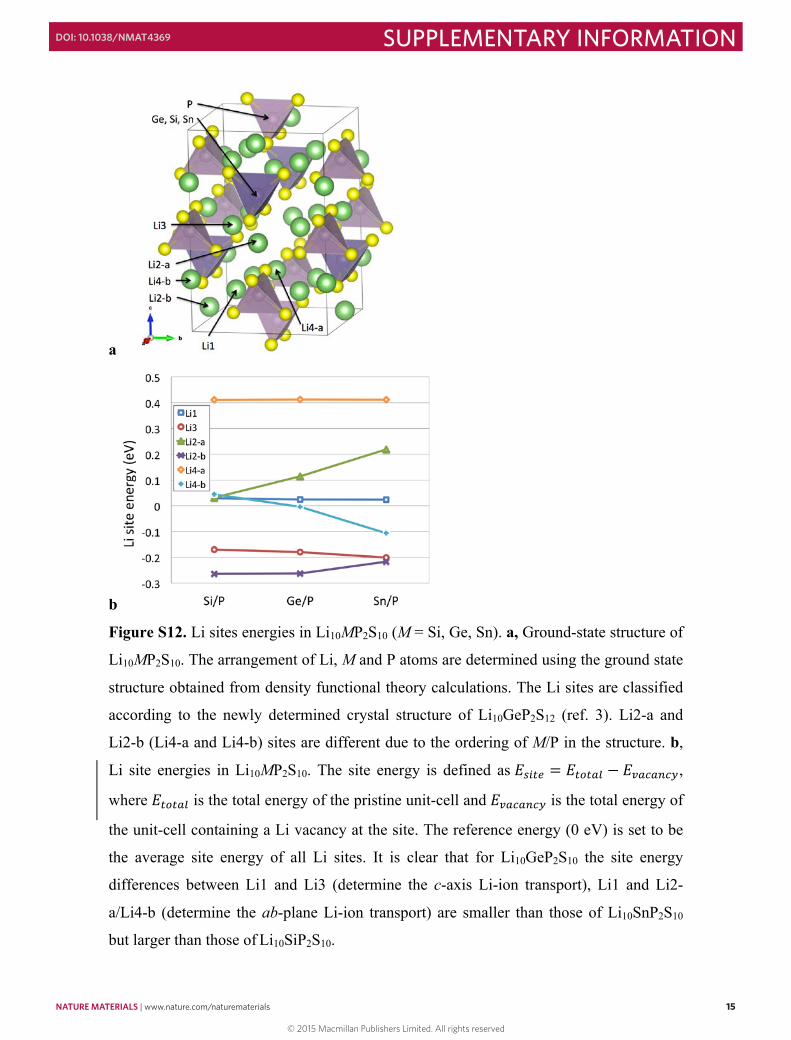
Figure S12. Li sites energies in Li10MP2S10 (M = Si, Ge, Sn). a, Ground-state structure of
Li10MP2S10. The arrangement of Li, M and P atoms are determined using the ground state
structure obtained from density functional theory calculations. The Li sites are classified
according to the newly determined crystal structure of Li10GeP2S12 (ref. 3). Li2-a and
Li2-b (Li4-a and Li4-b) sites are different due to the ordering of M/P in the structure. b,
Li site energies in Li10MP2S10. The site energy is defined as 𝐸𝐸!"#$ = 𝐸𝐸!"!#$ − 𝐸𝐸!"#"$#%,
where 𝐸𝐸!"!#$ is the total energy of the pristine unit-cell and 𝐸𝐸!"#"$#% is the total energy of
the unit-cell containing a Li vacancy at the site. The reference energy (0 eV) is set to be
the average site energy of all Li sites. It is clear that for Li10GeP2S10 the site energy
differences between Li1 and Li3 (determine the c-axis Li-ion transport), Li1 and Li2-
a/Li4-b (determine the ab-plane Li-ion transport) are smaller than those of Li10SnP2S10
but larger than those of Li10SiP2S10.
© 2015 Macmillan Publishers Limited. All rights reserved
NATURE MATERIALS | www.nature.com/naturematerials 15
SUPPLEMENTARY INFORMATIONDOI: 10.1038/NMAT4369
S-‐14
a
b
Figure S11. a, Histogram of volume per S atom for materials in the ICSD containing Mg
and S but no other anion species (N, O, Se, F, Cl, Br, I) or hydrogen. The data set from
ICSD we use is cleaned by removing duplicate structures using an affine mapping
algorithm2. b, Activation barrier obtained for the Mg-ion migration paths in the bcc and
fcc S2- sublattices as a function of volume. Solid lines are guides to the eye.
S-‐15
a
b
Figure S12. Li sites energies in Li10MP2S10 (M = Si, Ge, Sn). a, Ground-state structure of
Li10MP2S10. The arrangement of Li, M and P atoms are determined using the ground state
structure obtained from density functional theory calculations. The Li sites are classified
according to the newly determined crystal structure of Li10GeP2S12 (ref. 3). Li2-a and
Li2-b (Li4-a and Li4-b) sites are different due to the ordering of M/P in the structure. b,
Li site energies in Li10MP2S10. The site energy is defined as 𝐸𝐸!"#$ = 𝐸𝐸!"!#$ − 𝐸𝐸!"#"$#%,
where 𝐸𝐸!"!#$ is the total energy of the pristine unit-cell and 𝐸𝐸!"#"$#% is the total energy of
the unit-cell containing a Li vacancy at the site. The reference energy (0 eV) is set to be
the average site energy of all Li sites. It is clear that for Li10GeP2S10 the site energy
differences between Li1 and Li3 (determine the c-axis Li-ion transport), Li1 and Li2-
a/Li4-b (determine the ab-plane Li-ion transport) are smaller than those of Li10SnP2S10
but larger than those of Li10SiP2S10.
© 2015 Macmillan Publishers Limited. All rights reserved
16 NATURE MATERIALS | www.nature.com/naturematerials
SUPPLEMENTARY INFORMATION DOI: 10.1038/NMAT4369
S-‐16
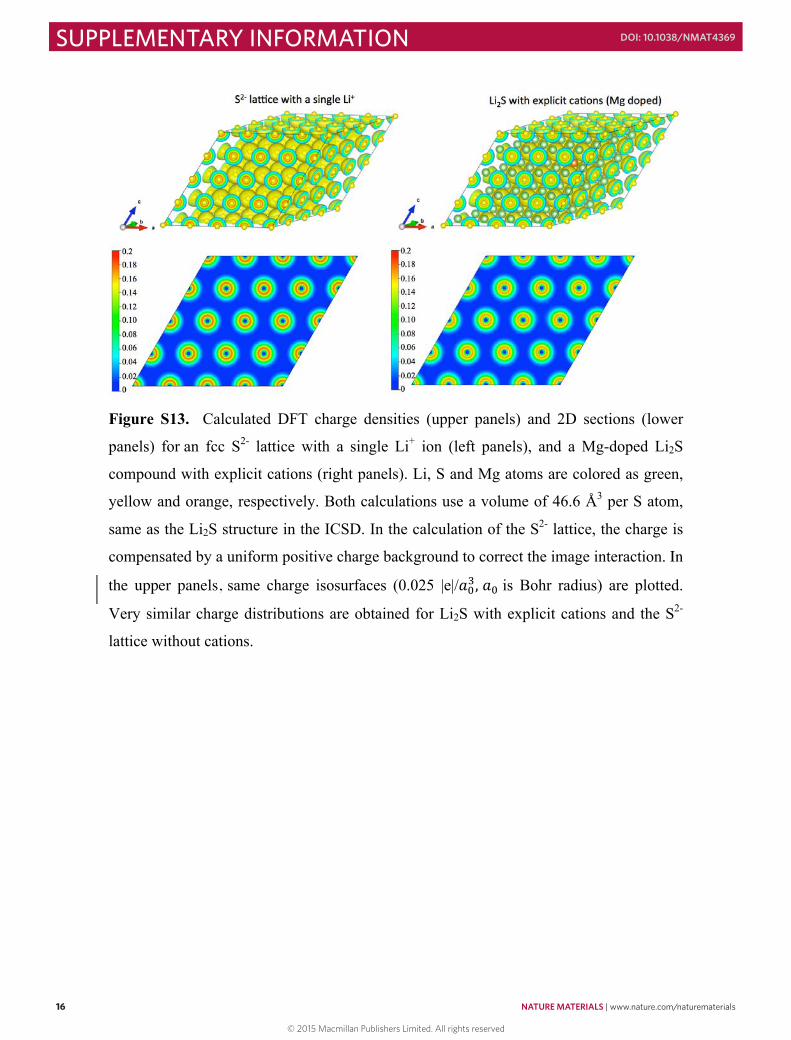
Figure S13. Calculated DFT charge densities (upper panels) and 2D sections (lower
panels) for an fcc S2- lattice with a single Li+ ion (left panels), and a Mg-doped Li2S
compound with explicit cations (right panels). Li, S and Mg atoms are colored as green,
yellow and orange, respectively. Both calculations use a volume of 46.6 Å3 per S atom,
same as the Li2S structure in the ICSD. In the calculation of the S2- lattice, the charge is
compensated by a uniform positive charge background to correct the image interaction. In
the upper panels, same charge isosurfaces (0.025 |e|/𝑎𝑎!!, 𝑎𝑎! is Bohr radius) are plotted.
Very similar charge distributions are obtained for Li2S with explicit cations and the S2-
lattice without cations.
S-‐17
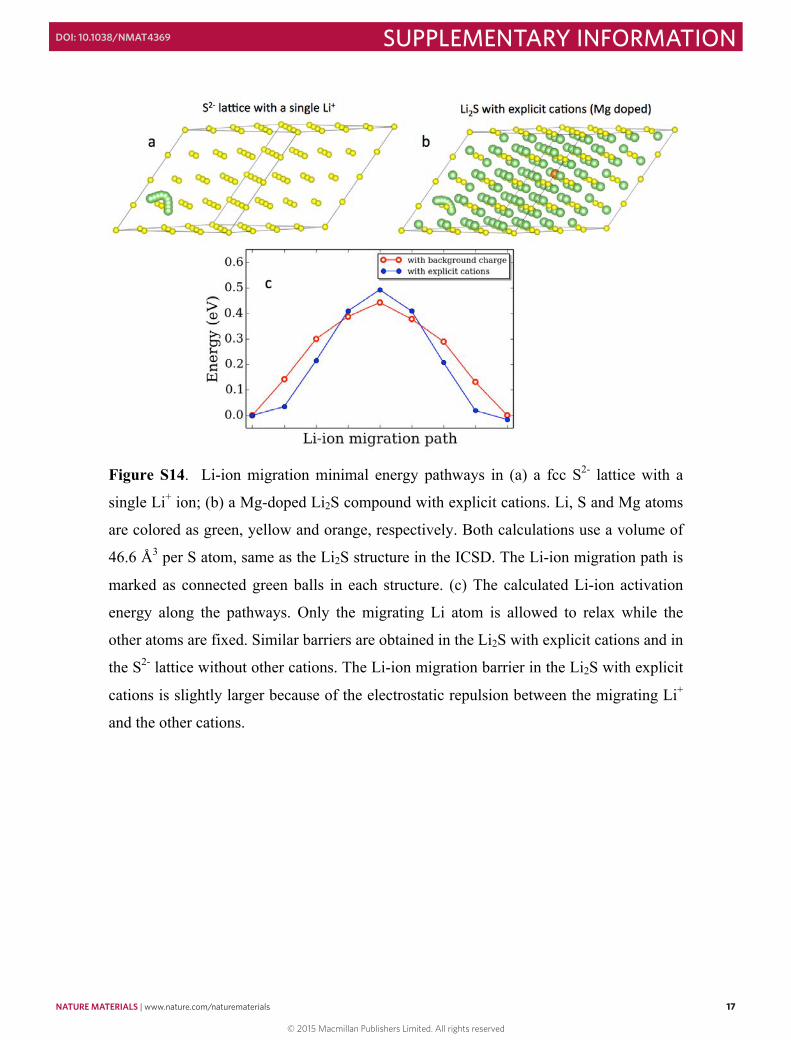
Figure S14. Li-ion migration minimal energy pathways in (a) a fcc S2- lattice with a
single Li+ ion; (b) a Mg-doped Li2S compound with explicit cations. Li, S and Mg atoms
are colored as green, yellow and orange, respectively. Both calculations use a volume of
46.6 Å3 per S atom, same as the Li2S structure in the ICSD. The Li-ion migration path is
marked as connected green balls in each structure. (c) The calculated Li-ion activation
energy along the pathways. Only the migrating Li atom is allowed to relax while the
other atoms are fixed. Similar barriers are obtained in the Li2S with explicit cations and in
the S2- lattice without other cations. The Li-ion migration barrier in the Li2S with explicit
cations is slightly larger because of the electrostatic repulsion between the migrating Li+
and the other cations.
© 2015 Macmillan Publishers Limited. All rights reserved
NATURE MATERIALS | www.nature.com/naturematerials 17
SUPPLEMENTARY INFORMATIONDOI: 10.1038/NMAT4369
S-‐16
Figure S13. Calculated DFT charge densities (upper panels) and 2D sections (lower
panels) for an fcc S2- lattice with a single Li+ ion (left panels), and a Mg-doped Li2S
compound with explicit cations (right panels). Li, S and Mg atoms are colored as green,
yellow and orange, respectively. Both calculations use a volume of 46.6 Å3 per S atom,
same as the Li2S structure in the ICSD. In the calculation of the S2- lattice, the charge is
compensated by a uniform positive charge background to correct the image interaction. In
the upper panels, same charge isosurfaces (0.025 |e|/𝑎𝑎!!, 𝑎𝑎! is Bohr radius) are plotted.
Very similar charge distributions are obtained for Li2S with explicit cations and the S2-
lattice without cations.
S-‐17
Figure S14. Li-ion migration minimal energy pathways in (a) a fcc S2- lattice with a
single Li+ ion; (b) a Mg-doped Li2S compound with explicit cations. Li, S and Mg atoms
are colored as green, yellow and orange, respectively. Both calculations use a volume of
46.6 Å3 per S atom, same as the Li2S structure in the ICSD. The Li-ion migration path is
marked as connected green balls in each structure. (c) The calculated Li-ion activation
energy along the pathways. Only the migrating Li atom is allowed to relax while the
other atoms are fixed. Similar barriers are obtained in the Li2S with explicit cations and in
the S2- lattice without other cations. The Li-ion migration barrier in the Li2S with explicit
cations is slightly larger because of the electrostatic repulsion between the migrating Li+
and the other cations.
© 2015 Macmillan Publishers Limited. All rights reserved

18 NATURE MATERIALS | www.nature.com/naturematerials
SUPPLEMENTARY INFORMATION DOI: 10.1038/NMAT4369
S-‐18
Figure S15. 2D sections of calculated DFT charge densities (units: |e|/𝑎𝑎!!, 𝑎𝑎! is Bohr
radius) along Li-ion diffusion channels for Li10GeP2S10 with explicit cations (left panels)
and its S2- lattice without cations. In the S2- lattice, the charge is compensated by a
uniform positive charge background to correct the image interaction. Li, S, Ge and P
atoms are colored as green, yellow, blue and purple, respectively. Very similar charge
distributions are obtained near the Li-ion diffusion channels for Li10GeP2S10 with explicit
cations and for the S2- lattice without cations.
S-‐19
References
1. Inorganic Crystal Structure Database. http://icsd.fiz-karlsruhe.de/icsd/
2. Ong, S. P. et al. Python Materials Genomics (pymatgen): A robust, open-source
python library for materials analysis. Comput. Mater. Sci. 68, 314–319 (2013).
3. Kuhn, A., Köhler, J. & Lotsch, B. V. Single-crystal X-ray structure analysis of the
superionic conductor Li10GeP2S12. Phys. Chem. Chem. Phys. 15, 11620–16622
(2013).
© 2015 Macmillan Publishers Limited. All rights reserved

NATURE MATERIALS | www.nature.com/naturematerials 19
SUPPLEMENTARY INFORMATIONDOI: 10.1038/NMAT4369
S-‐18
Figure S15. 2D sections of calculated DFT charge densities (units: |e|/𝑎𝑎!!, 𝑎𝑎! is Bohr
radius) along Li-ion diffusion channels for Li10GeP2S10 with explicit cations (left panels)
and its S2- lattice without cations. In the S2- lattice, the charge is compensated by a
uniform positive charge background to correct the image interaction. Li, S, Ge and P
atoms are colored as green, yellow, blue and purple, respectively. Very similar charge
distributions are obtained near the Li-ion diffusion channels for Li10GeP2S10 with explicit
cations and for the S2- lattice without cations.
S-‐19
References
1. Inorganic Crystal Structure Database. http://icsd.fiz-karlsruhe.de/icsd/
2. Ong, S. P. et al. Python Materials Genomics (pymatgen): A robust, open-source
python library for materials analysis. Comput. Mater. Sci. 68, 314–319 (2013).
3. Kuhn, A., Köhler, J. & Lotsch, B. V. Single-crystal X-ray structure analysis of the
superionic conductor Li10GeP2S12. Phys. Chem. Chem. Phys. 15, 11620–16622
(2013).
© 2015 Macmillan Publishers Limited. All rights reserved
Related Documents