Supplementary Information. The data provided in the Supplementary Materials excel spreadsheet are derived from EDS analyses. The column labeled “App Conc” lists the calculated elemental concentrations based on counting statistics; the column labeled “Intensity Corrn” is the correction factor applied to the “App Conc” values so as to have the final Wt% calculation sum to 100%. EDS Accuracy In addition to determining the chemical compositions of the inclusions, a large population of trinitite glass was also analyzed. Concentrations of Mg, Al, Si, Ca, Ti, and Fe measured in the glasses in this study (data provided in the spreadsheet) are compared to those from the literature (Fahey et al. 2010) in Supplementary Figure S1. The range in compositions is large, which is expected due to the large degree of heterogeneity in trinitite, but comparable to those provided in the literature.

Welcome message from author
This document is posted to help you gain knowledge. Please leave a comment to let me know what you think about it! Share it to your friends and learn new things together.
Transcript

Supplementary Information.
The data provided in the Supplementary Materials excel spreadsheet are derived
from EDS analyses. The column labeled “App Conc” lists the calculated elemental
concentrations based on counting statistics; the column labeled “Intensity Corrn” is the
correction factor applied to the “App Conc” values so as to have the final Wt%
calculation sum to 100%.
EDS Accuracy
In addition to determining the chemical compositions of the inclusions, a large
population of trinitite glass was also analyzed. Concentrations of Mg, Al, Si, Ca, Ti, and
Fe measured in the glasses in this study (data provided in the spreadsheet) are compared
to those from the literature (Fahey et al. 2010) in Supplementary Figure S1. The range in
compositions is large, which is expected due to the large degree of heterogeneity in
trinitite, but comparable to those provided in the literature.
!""#$%$&'()*+,('$)-(#. !"#$%&'('%)*%+*,-!*.+%.)).#&/'-)%)*%/.-01#("2)3%4'!!0##"%.-+%5"/*-'))"%6786%9:; %5022!'/'-).(<%=.)'(".!1>+*#%

Table 1. Trinitite Samples and Descriptions
Sample Description
1
2 Specimens with large gas pockets in the surface or around perimeter
3
4A Red inclusions- The red inclusions are due to the presence of copper.
4B Black inclusions- Due to the presence of iron.
4C
4D Blue inclusions-small, glassy, white to very light robin's egg blue color inclusions
4E
4F "Coke bottle" color inclusions.
5A
5B
5D
5E Lace-like specimens, always small, very delicate.
5F Specimens with unfused, iron blebs.
Specimens with glass-like fused top surface--this is the most common type of
surface feature seen on the trinitite specimens.
the bottom of each specimen in this group exhibits the rough texture of the sandy
desesrt surface, which remained untouched by the blast. The tops of the
specimens have lumpy, convoluted, sand included, or otherwise irregular surfaces.
Unusual protuberances or casts on the bases of these specimens.
Elongated, finger-like extrusions. Always small, very delicate probably rare
because they are fragile and easily broken.
Light colored glass, or light colored flow marks-the light colored glass, or light
colored flow marks seen on some specimens are typical of material found 100 to
700 feet from ground zero and were part of the lighter colroed rays seen in aerial
photographs taken shortly after the explosion
White inclusions-White inclusions consist of small masses of the partially to totally
fused white feldspar or quartz
Layered specimens have lighter colored trinitite glass bases, usually with darker
colored surfaces.
!""#$%$&'()*+,('$)-(#. !"#$%&'('%)*%+*,-!*.+%.)).#&/'-)%)*%/.-01#("2)3%4'!!0##"%.-+%5"/*-'))"%6786%9:; %5022!'/'-)<=!1%

Spectrum 13
Element App Intensity Weight% Weight% Atomic%
Conc. Corrn. Sigma
O 24.25 0.8591 41.24 2.48 60.94
Al 2.5 0.7575 4.81 0.6 4.22
Si 14.3 0.8096 25.81 1.25 21.73
K 1.04 1.0234 1.49 0.36 0.9
Ca 3.78 0.983 5.61 0.49 3.31
Fe 12.26 0.8521 21.03 1.25 8.9
Spectrum 15
Element App Intensity Weight% Weight% Atomic%
Conc. Corrn. Sigma
O 21.63 0.7789 46.44 2.52 60.77
Si 30.19 1.0034 50.37 2.38 37.55
K 0.73 0.943 1.3 0.39 0.7
Ca 1.04 0.9154 1.9 0.41 0.99

Spectrum 15

Spectrum 21
Element App Intensity Weight% Weight% Atomic%
Conc. Corrn. Sigma
O 70.05 1.3706 35.15 0.56 61.97
Mg 0.83 0.4605 1.25 0.17 1.45
Al 2.4 0.5782 2.85 0.16 2.98
Si 5.25 0.6842 5.27 0.17 5.3
Ca 1.6 1.0759 1.03 0.09 0.72
Ti 1.66 0.9517 1.2 0.12 0.71
Fe 69.03 0.9051 52.47 0.53 26.5


Spectrum 5
Element App Intensity Weight% Weight% Atomic%
Conc. Corrn. Sigma
O 33.99 0.812 30.01 0.78 57.48
Al 1.59 0.5846 1.95 0.16 2.21
Si 2.85 0.7001 2.92 0.17 3.19
Ti 20.57 0.962 15.33 0.3 9.81
Fe 62.81 0.9043 49.79 0.64 27.32


Spectrum 13
Element App Intensity Weight% Weight% Atomic%
Conc. Corrn. Sigma
O 33.99 0.812 31.3 0.78 57.48
Ti 64 0.962 65.43 3.2 39.5
Fe 1.89 0.9043 2.56 0.64 3.02

Spectrum 13

Spectrum 21
Element App Intensity Weight% Weight% Atomic%
Conc. Corrn. Sigma
O 11.46 0.7948 15.74 0.66 35.61
Al 0.77 0.5206 1.62 0.19 2.18
Si 2.28 0.6389 3.89 0.2 5.02
S 15.81 0.8159 21.15 0.36 23.88
Ca 1.16 0.9936 1.28 0.12 1.15
Fe 0.7 1.0391 0.74 0.14 0.48
Cu 46.03 0.9036 55.59 0.62 31.68


Spectrum 25
Element App Intensity Weight% Weight% Atomic%
Conc. Corrn. Sigma
O 6.84 0.7537 9.29 0.75 23.42
Al 0.56 0.508 1.12 0.23 1.68
Si 1.5 0.6305 2.44 0.24 3.5
S 20.37 0.8212 25.39 0.52 31.93
Ca 0.71 0.9907 0.73 0.14 0.73
Cu 54.74 0.9177 61.03 0.77 38.73


Spectrum 59
Element App Intensity Weight% Weight% Atomic%
Conc. Corrn. Sigma
O 20.28 0.7307 29.56 0.74 78.7
Al 0.45 0.8387 0.58 0.16 0.91
Si 4.22 0.9764 4.6 0.2 6.98
Pb 56.64 0.9242 65.26 0.73 13.41
Spectrum 60
Element App Intensity Weight% Weight% Atomic%
Conc. Corrn. Sigma
O 53.65 0.8487 51.23 0.67 65.53
Al 4.38 0.9147 3.89 0.21 2.95
Si 45.43 0.9249 39.81 0.58 29.01
K 4.57 0.9604 3.86 0.18 2.02
Ca 0.4 0.9174 0.36 0.11 0.18
Fe 0.87 0.8207 0.86 0.25 0.32

Spectrum 60

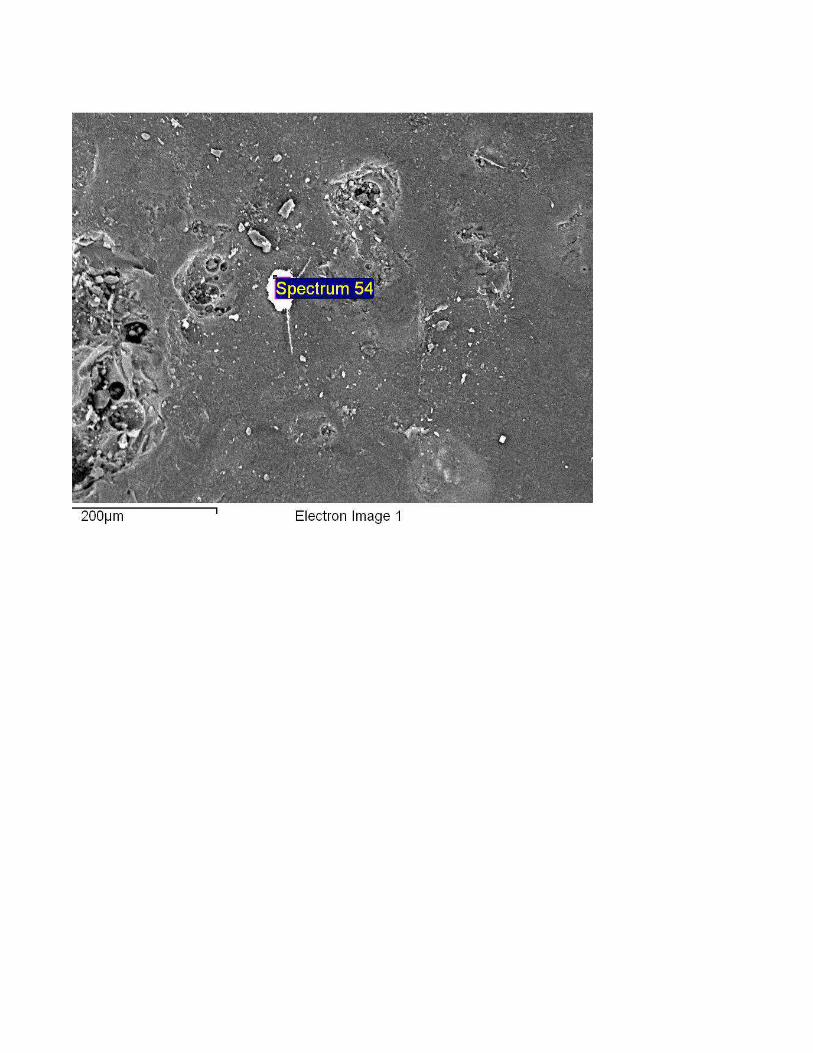
Spectrum 54
Element App Intensity Weight% Weight% Atomic%
Conc. Corrn. Sigma
O K 17.68 0.7103 27.37 0.86 75.18
Al K 0.82 0.8443 1.07 0.17 1.74
Si K 4.76 0.9764 5.35 0.22 8.38
Pb M 54.87 0.921 65.49 0.84 13.89

Spectrum 66
Element App Intensity Weight% Weight% Atomic%
Conc. Corrn. Sigma
O 22.92 0.638 33.96 1.12 65.49
Mg 10.97 0.8411 12.33 0.39 15.64
Ca 16.49 0.9601 16.23 0.42 12.49
Ga 0.22 0.9404 0.22 0.02 0.1
Ta 6.67 0.7406 8.52 0.7 1.45
W 22.75 0.7477 28.76 0.77 4.83


Spectrum 32
Element App Intensity Weight% Weight% Atomic%
Conc. Corrn. Sigma
O 6.84 0.7537 25.29 0.75 23.42
Si 1.5 0.6305 2.44 0.24 3.5
S 20.37 0.8212 25.39 0.52 31.93
Ba 54.74 0.9177 41.03 0.77 38.73

Spectrum 32

No. Source Na Mg Al Si
1 Fahey et al. 2010 0.77 0.7 8.45 24
2 Fahey et al. 2010 0.75 0.86 7.96 26.2
3 Fahey et al. 2010 0.99 0.66 5.97 30.3
4 Fahey et al. 2010 0.71 0.96 9.73 23.7
5 Fahey et al. 2010 1.27 0.97 6.55 29.8
6 Fahey et al. 2010 0 0 0 46.67
Sample 1 glass 0 0 21.75 66.1
Sample 1 glass 0 0 9.05 25.41
Sample 1 glass 0 0 6.32 49.93
Sample 1 glass 0 0 7.75 39.72
Sample 1 glass 0 0 6.47 39.45
Sample 1 glass 0 0 3.96 43.71
Sample 1 glass 0 0 3.07 26.13
Sample 1 glass 0 0 2.17 25.54
Sample 1 glass 0 0 5.61 41.09
Sample 1 glass 0 0 5.23 34.66
Sample 1 glass 0 0 0 50.37
Sample 1 glass 0 0 5.56 39.38
Sample 1 glass 0 0 7.59 42.8
Sample 1 glass 0 0 6.51 42.15
Sample 1 glass 0 0 4.32 42.01
Sample 1 glass 0 0 6.81 44.53
Sample 2 glass 1.35 0 2.09 38.09
Sample 2 glass 0 0 1.84 53.21
Sample 2 glass 0 0 1.63 52.39
Sample 2 glass 1.11 0 7.46 37.59
Sample 2 glass 0 0 3.89 39.81
Sample 4a glass 0 0.55 7.2 25.25
Sample 4a glass 1.15 0 4.92 30.44
Sample 4a glass 1.5 1.06 6.65 24.62
Sample 4a glass 1.22 1.11 6.16 22.79
Sample 4a glass 1.53 1.09 7.5 20.33
Sample 4a glass 1.69 1.25 9.69 21.65
Sample 4a glass 0 0 0 42.34
Sample 4a glass 0 0 0 38.92
Sample 4b glass 0.69 0.81 3.74 41.43
Sample 4b glass 0.61 0.78 3.16 42.15
Sample 4b glass 0 0 3.31 41.76
Sample 4b glass 0.66 0 3.01 41.69
Sample 4b glass 0.73 0.79 3.15 36.02
Sample 4b glass 0.61 0 1.23 41.1
Sample 4c glass 2.22 0 6.82 34.58
Sample 4c glass 1.55 0 6.56 35.41
Sample 4c glass 1.17 0 2.84 37.87
Sample 4c glass 0 0 3.78 38.76
Sample 4c glass 0 0 1.61 37.71
Sample 4c glass 0 0 1.36 37.4

Sample 4c glass 0 0 2.38 48.96
Sample 4c glass 0 0 2.07 51.18
Sample 4d glass 1.75 0 1.84 27.4
Sample 4d glass 1.65 0 1.97 29.28
Sample 4d glass 1.62 0 1.96 26.75
Sample 4e glass 3.74 1.28 9.3 23.43
Sample 4f glass 0 0 9.41 25.39
Sample 4f glass 1.96 1.3 7.91 22.75
Sample 4f glass 2.37 0.92 9.83 11.05
Sample 4f glass 0.69 0 6.03 37.13
Sample 4f glass 0.78 0 6.71 36.9
Sample 4f glass 1.25 0.84 8.48 26.76
Sample 4f glass 1.39 0 8.57 29.18
Sample 4f glass 1.64 0 8.58 30.35
Sample 4f glass 1.9 0 9.32 31.6
Sample 5b glass 0 0 3.98 41.44
Sample 5b glass 0 0 5.44 47.28
Sample 5d glass 0.86 0 3.85 32.02
Sample 5d glass 0 0 1.74 35.91
Sample 5d glass 4.19 0 11.22 30.62
Sample 5d glass 2.21 0 6.42 30.15
Sample 5e glass 0 0 0 50.46
Sample 5e glass 0 0 0 50.61
Sample 5e glass 0 0 0 69.82
Sample 5e glass 0 0 5.97 35.45
Sample 5e glass 0 0 4.61 35.01
Sample 5e glass 0 0 6.98 41.24
Sample 5f glass 0 0 8.03 34.57
Sample 5f glass 0 0 7.67 33.47


K Ca Ti Fe
1.23 18.8 0.29 1.78
1.1 15.6 0.33 2.13
1.77 11.8 0.26 1.87
0.72 17 0.3 2.46
2.3 10.1 0.35 2.47
0 0 0 0
0 12.15 0 0
0 11.12 0 0
4.33 7.84 0 0
3.1 8 0 3.92
2.48 4.9 0 3.26
2.05 2.92 0 0
0 19.57 0 4.06
0 18.96 0 3.75
3.22 3.8 0 0
2.48 4.43 0 0
1.3 1.9 0 0
2.59 4.43 0 0
3.62 6.19 0 0
4.32 6.41 0 0
3.15 3.01 0 0
5.34 0 0 0
1.54 1.13 0 2.2
0 2 0 1.69
1.54 0.91 0 1.47
5.18 2.64 0 3.33
3.86 0.36 0 0.86
2.95 4.76 0.38 0
2.47 4.19 0.51 0
1.67 8.5 0.52 2.97
1.54 8.74 0.71 3.16
1.66 4.34 1.16 2.09
1.97 4.58 0 0
0 0 0 0
0 0.25 0 0
2.91 1.73 0 0
1.19 1.07 0 0
2.67 1.11 0.78 2.05
2.87 1.65 0.44 0
2.56 1.39 0 0
1.44 0.43 0 4.33
3.91 2.27 0 0
3.86 1.8 0 0
2.65 1.94 0 1.8
2.78 1.87 0 0
1.31 0.98 0 1.64
1.29 0.85 0 1.64
0
1
2
3
4
5
6
5 15 25
K w
t %
0
5
10
15
20
25
5 15 25
Ca w
t %
4
5
6

2.23 1.84 0 2.33
1.81 1.5 0 0
0 12.05 0 1.43
0 12.93 0 1.67
0 11.77 0 1.23
1.8 2.52 0.28 2.12
0 0 0 0
1.41 1.39 0 4.21
0.84 15.54 0 1.76
0 7.61 0 0.44
0 8.58 0.53 0.53
4.93 2.39 0.37 1.91
5.64 2.31 0 1.89
4.46 2.93 0 1.56
4.86 2.67 0 1.18
4.12 8.25 0 0
4.68 2.91 0 0
2.3 1.85 0 1.39
1.03 0.54 0 0.96
1.34 3.42 0 0
2.1 4.57 0.71 2.3
0 1.51 0 0
0 0 0 0
0 0 0 0
2.78 2.37 0 3.63
2.35 4.47 0 3.23
5.16 6.29 0 4.98
2.16 6.11 0 3.39
1.66 6.01 0 0
0
1
2
3
4
5 15 25
Fe w
t %
0
0.5
1
1.5
2
2.5
3
3.5
4
4.5
5 15 25
Na w
t %
10
15
20
25
Al w
t %

0
5
5 15 25 35

35 45 55 65 75
Si wt %
Fahey et al. 2010
This study
35 45 55 65 75
Si wt %
Fahey et al. 2010
This study

35 45 55 65 75
Si wt %
Fahey et al. 2010
This study
35 45 55 65 75
Si wt %
Fahey et al. 2010
This study
Fahey et al. 2010
This study

35 45 55 65 75
Si wt %

0
0.5
1
1.5
2
2.5
3
3.5
4
4.5
5 15 25 35 45 55 65 75
Si wt %
Na w
t %
Fahey et al. 2010
This study
0
1
2
3
4
5
6
5 15 25 35 45 55 65 75
Si wt %
K w
t %
0
5
10
15
20
25
5 15 25 35 45 55 65 75
Si wt %
Ca w
t %
0
1
2
3
4
5
6
5 15 25 35 45 55 65 75
Si wt %
Fe w
t %
0
5
10
15
20
25
5 15 25 35 45 55 65 75
Si wt %
Al w
t %
!""#$%$&'()*+,-.!)$+/
!"#$%&'('%)*%+*,-!*.+%.)).#&/'-)%)*%/.-01#("2)3%4'!!0##"%.-+%5"/*-'))"%678 %9:;9<=">0('<5;?2+@%
Related Documents


![Gracians Handorakel Und Kunst Der Weltklugheit [1654]](https://static.cupdf.com/doc/110x72/5571f40649795947648ee6b2/gracians-handorakel-und-kunst-der-weltklugheit-1654.jpg)