Supplementary Financial Information Fourth Quarter 2017 February 14, 2018

Welcome message from author
This document is posted to help you gain knowledge. Please leave a comment to let me know what you think about it! Share it to your friends and learn new things together.
Transcript
Supplementary Financial InformationFourth Quarter 2017February 14, 2018

Table of ContentsPage Page
3 Notes to Users Credit Quality
18 Gross amount of impaired loans by product
4 Financial Highlights 18 Net amount of impaired loans by product
19 Change in allowance
Consolidated Results 20 Provision for credit losses and net write-offs as a percentage of gross loans on an annualized basis
5 Consolidated statements of income (loss) 21 Past due loans that are not impaired
6 Net interest margin
7 Net interest income (loss) by product and average rate Credit Risk
22 Credit risk: mortgage portfolio on balance sheet
Financial Position 23 Single-family residential loans by province
8 Average balance sheets for selected items 24 Insured and uninsured single-family residential mortgages by effective remaining amortization period
9 Consolidated balance sheets 24 Insured and uninsured single-family residential mortgages by contractual remaining amortization period
10 Gross loans by geographic region and type 25 Weighted-average loan to value ratios for uninsured single-family residential mortgages originated during the period
11 Gross loans by geographic region 26 Weighted-average loan to value ratios for uninsured residential mortgages
12 Allowance for credit losses by product
13 Mortgage advances Capital
13 Mortgage continuity 27 Basel III regulatory capital (all in basis)
14 Consumer lending continuity 28 Basel III regulatory capital (transitional basis)
15 Securitization income
15 Securitization sales and activities 29 Non-GAAP Measures
16 Deposits, line of credit facility, senior debt and securitzation liabilities 30 Glossary of Terms
17 Other assets 31 Acronyms
17 Other liabilities
Home Capital Group Inc. Supplementary Financial Information Fourth Quarter 2017
Notes to Users
Use of the documentThe supplemental financial information contained in this package has been provided to improve readers' understanding of the financial position and performance
of Home Capital Group Inc. (the Company). This information should be used in conjunction with the Company's 2017 Annual and Fourth Quarter
Consolidated Financial Report.
Accounting frameworkThe financial information in this document is in Canadian dollars and is based on the audited consolidated financial statements for the year ended December 31, 2017,
presented in compliance with International Financial Reporting Standards (IFRS or GAAP) unless otherwise noted.
Comparative consolidated financial statementsCertain comparative audited consolidated financial statement amounts have been reclassified from statements previously presented to conform to
the presentation of the 2017 audited consolidated financial statements.
Capital managementThe Company's subsidiary, Home Trust Company, is subject to the regulatory capital requirements stipulated by the Office of the Superintendent of Financial Institutions
Canada (OSFI). These requirements are consistent with international standards (Basel II and Basel III) set by the Bank for International Settlements.
Home Trust Company follows the Basel II Standardized Approach for calculating credit risk and the Basic Indicator Approach for operational risk.
Home Capital Group Inc. Supplementary Financial Information Fourth Quarter 2017

Financial Highlights
(000s, except Per Share and Percentage Amounts) 2017 2017 2017 2017 2016 2016 2016 2016 2017 2016
Q4 Q3 Q2 Q1 Q4 Q3 Q2 Q1 Fiscal Fiscal
OPERATING RESULTS
Net Income (Loss) $ 30,619 $ 29,983 $ (111,116) $ 58,041 $ 50,706 $ 66,190 $ 66,252 $ 64,248 $ 7,527 $ 247,396
Net Interest Income (Loss) 91,718 88,762 (3,407) 125,857 120,620 119,924 122,103 122,517 302,930 485,164
Total Revenue1 109,455 95,407 (61,293) 147,742 144,597 145,095 146,761 145,506 291,311 581,959
Diluted Earnings (Loss) per Share $ 0.38 $ 0.37 $ (1.73) $ 0.90 $ 0.79 $ 1.01 $ 0.99 $ 0.92 $ 0.10 $ 3.71
Return on Shareholders’ Equity 6.8% 6.8% (25.90)% 14.0% 12.6% 16.7% 16.3% 15.5% 0.4% 15.1%
Return on Average Assets 0.7% 0.6% (2.2)% 1.1% 1.0% 1.3% 1.3% 1.2% 0.0% 1.2%
Net Interest Margin (TEB)2 2.02% 1.85% (0.07)% 2.44% 2.38% 2.34% 2.38% 2.38% 1.55% 2.37%
Provision as a Percentage of Gross Uninsured Loans (annualized) 0.12% (0.14)% 0.07% 0.16% 0.07% 0.04% 0.08% 0.04% 0.07% 0.05%
Provision as a Percentage of Gross Loans (annualized) 0.09% (0.11)% 0.05% 0.13% 0.05% 0.03% 0.06% 0.03% 0.05% 0.04%
Efficiency Ratio (TEB)2 59.8% 62.7% (138.9)% 43.4% 48.8% 37.7% 37.2% 39.6% 94.0% 40.8%
BALANCE SHEET HIGHLIGHTS
Total Assets $ 17,591,143 $ 18,856,294 $ 20,077,150 $ 20,993,385 $ 20,528,777 $ 20,317,030 $ 20,763,147 $ 20,687,984 $ 17,591,143 $ 20,528,777
Total Assets Under Administration3 25,040,182 26,659,330 28,292,436 29,583,545 28,917,534 28,327,676 28,430,730 27,960,592 25,040,182 28,917,534
Total Loans4 15,064,424 15,429,650 17,648,114 18,573,476 18,035,317 18,002,238 18,065,074 17,949,915 15,064,424 18,035,317
Total Loans Under Administration3,4 22,513,463 23,232,686 25,863,400 27,163,636 26,424,074 26,012,884 25,732,657 25,222,523 22,513,463 26,424,074
Liquid Assets 1,654,718 2,657,055 1,737,417 2,098,192 2,067,981 1,878,082 2,391,225 2,459,859 1,654,718 2,067,981
Deposits 12,170,454 13,358,618 13,104,606 16,249,611 15,886,030 15,694,102 16,022,219 15,824,899 12,170,454 15,886,030
Line of Credit Facility - - 1,396,959 - - - - - - -
Shareholders’ Equity 1,813,505 1,781,741 1,751,087 1,680,898 1,632,587 1,594,873 1,571,288 1,677,154 1,813,505 1,632,587
FINANCIAL STRENGTH
Capital Measures5
Risk-Weighted Assets $ 6,532,130 $ 6,890,938 $ 8,328,024 $ 9,086,886 $ 8,643,267 $ 8,414,960 $ 8,310,406 $ 8,169,818 $ 6,532,130 $ 8,643,267
Common Equity Tier 1 Capital Ratio 23.17% 21.25% 17.06% 16.34% 16.55% 16.54% 16.38% 18.28% 23.17% 16.55%
Tier 1 Capital Ratio 23.17% 21.25% 17.06% 16.34% 16.54% 16.53% 16.38% 18.28% 23.17% 16.54%
Total Capital Ratio 23.68% 21.74% 17.54% 16.77% 16.97% 16.97% 16.82% 20.63% 23.68% 16.97%
Leverage Ratio 8.70% 7.89% 7.19% 7.29% 7.20% 7.08% 6.77% 7.46% 8.70% 7.20%
Credit Quality
Net Non-Performing Loans as a Percentage of Gross Loans 0.30% 0.28% 0.23% 0.24% 0.30% 0.31% 0.33% 0.34% 0.30% 0.30%
Allowance as a Percentage of Gross Non-Performing Loans 79.5% 82.6% 100.5% 91.8% 73.4% 69.3% 66.0% 62.9% 79.5% 73.4%
Share Information
Book Value per Common Share $ 22.60 $ 22.20 $ 21.82 $ 26.18 $ 25.36 $ 24.70 $ 23.90 $ 25.51 $ 22.60 $ 25.36
Common Share Price – Close $ 17.31 $ 13.89 $ 16.99 $ 26.03 $ 31.34 $ 27.00 $ 32.02 $ 35.06 $ 17.31 $ 31.34
Dividend paid during the period ended $ - $ - $ - $ 0.26 $ 0.26 $ 0.24 $ 0.24 $ 0.24 $ 0.26 $ 0.98
Market Capitalization $ 1,389,058 $ 1,114,617 $ 1,363,380 $ 1,671,230 $ 2,017,920 $ 1,743,093 $ 2,105,027 $ 2,453,008 $ 1,389,058 $ 2,017,920
Number of Common Shares Outstanding 80,246 80,246 80,246 64,204 64,388 64,559 65,741 69,966 80,246 64,388
Payout Ratio - - - 28.9% 32.9% 23.8% 24.2% 26.1% 260.0% 26.4%1 The Company has revised its definition of Total Revenue and restated amounts in prior periods accordingly. Please see the revised definition in the Non-GAAP Measures section of this supplementary financial information package.2 See definition of Taxable Equivalent Basis (TEB) under Non-GAAP Measures section of this supplementary financial information package.3 Total assets and loans under administration include both on and off-balance sheet amounts.4 Total loans include loans held for sale.5 These figures relate to the Company's operating subsidiary, Home Trust Company.
Home Capital Group Inc. Supplementary Financial Information Fourth Quarter 2017
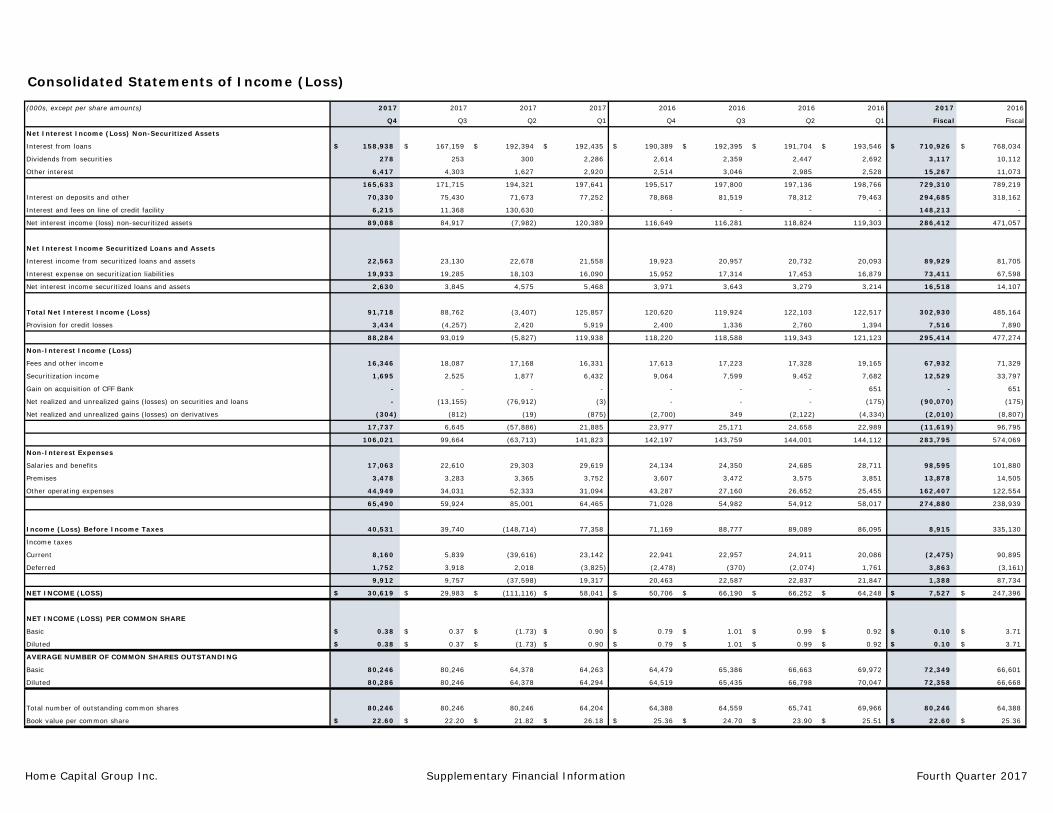
Consolidated Statements of Income (Loss)
(000s, except per share amounts) 2017 2017 2017 2017 2016 2016 2016 2016 2017 2016
Q4 Q3 Q2 Q1 Q4 Q3 Q2 Q1 Fiscal Fiscal
Net Interest Income (Loss) Non-Securitized Assets
Interest from loans $ 158,938 $ 167,159 $ 192,394 $ 192,435 $ 190,389 $ 192,395 $ 191,704 $ 193,546 $ 710,926 $ 768,034
Dividends from securities 278 253 300 2,286 2,614 2,359 2,447 2,692 3,117 10,112
Other interest 6,417 4,303 1,627 2,920 2,514 3,046 2,985 2,528 15,267 11,073
165,633 171,715 194,321 197,641 195,517 197,800 197,136 198,766 729,310 789,219
Interest on deposits and other 70,330 75,430 71,673 77,252 78,868 81,519 78,312 79,463 294,685 318,162
Interest and fees on line of credit facility 6,215 11,368 130,630 - - - - - 148,213 -
Net interest income (loss) non-securitized assets 89,088 84,917 (7,982) 120,389 116,649 116,281 118,824 119,303 286,412 471,057
Net Interest Income Securitized Loans and Assets
Interest income from securitized loans and assets 22,563 23,130 22,678 21,558 19,923 20,957 20,732 20,093 89,929 81,705
Interest expense on securitization liabilities 19,933 19,285 18,103 16,090 15,952 17,314 17,453 16,879 73,411 67,598
Net interest income securitized loans and assets 2,630 3,845 4,575 5,468 3,971 3,643 3,279 3,214 16,518 14,107
Total Net Interest Income (Loss) 91,718 88,762 (3,407) 125,857 120,620 119,924 122,103 122,517 302,930 485,164
Provision for credit losses 3,434 (4,257) 2,420 5,919 2,400 1,336 2,760 1,394 7,516 7,890
88,284 93,019 (5,827) 119,938 118,220 118,588 119,343 121,123 295,414 477,274
Non-Interest Income (Loss)
Fees and other income 16,346 18,087 17,168 16,331 17,613 17,223 17,328 19,165 67,932 71,329
Securitization income 1,695 2,525 1,877 6,432 9,064 7,599 9,452 7,682 12,529 33,797
Gain on acquisition of CFF Bank - - - - - - - 651 - 651
Net realized and unrealized gains (losses) on securities and loans - (13,155) (76,912) (3) - - - (175) (90,070) (175)
Net realized and unrealized gains (losses) on derivatives (304) (812) (19) (875) (2,700) 349 (2,122) (4,334) (2,010) (8,807)
17,737 6,645 (57,886) 21,885 23,977 25,171 24,658 22,989 (11,619) 96,795
106,021 99,664 (63,713) 141,823 142,197 143,759 144,001 144,112 283,795 574,069
Non-Interest Expenses
Salaries and benefits 17,063 22,610 29,303 29,619 24,134 24,350 24,685 28,711 98,595 101,880
Premises 3,478 3,283 3,365 3,752 3,607 3,472 3,575 3,851 13,878 14,505
Other operating expenses 44,949 34,031 52,333 31,094 43,287 27,160 26,652 25,455 162,407 122,554
65,490 59,924 85,001 64,465 71,028 54,982 54,912 58,017 274,880 238,939
Income (Loss) Before Income Taxes 40,531 39,740 (148,714) 77,358 71,169 88,777 89,089 86,095 8,915 335,130
Income taxes
Current 8,160 5,839 (39,616) 23,142 22,941 22,957 24,911 20,086 (2,475) 90,895
Deferred 1,752 3,918 2,018 (3,825) (2,478) (370) (2,074) 1,761 3,863 (3,161)
9,912 9,757 (37,598) 19,317 20,463 22,587 22,837 21,847 1,388 87,734
NET INCOME (LOSS) $ 30,619 $ 29,983 $ (111,116) $ 58,041 $ 50,706 $ 66,190 $ 66,252 $ 64,248 $ 7,527 $ 247,396
NET INCOME (LOSS) PER COMMON SHARE
Basic $ 0.38 $ 0.37 $ (1.73) $ 0.90 $ 0.79 $ 1.01 $ 0.99 $ 0.92 $ 0.10 $ 3.71
Diluted $ 0.38 $ 0.37 $ (1.73) $ 0.90 $ 0.79 $ 1.01 $ 0.99 $ 0.92 $ 0.10 $ 3.71
AVERAGE NUMBER OF COMMON SHARES OUTSTANDING
Basic 80,246 80,246 64,378 64,263 64,479 65,386 66,663 69,972 72,349 66,601
Diluted 80,286 80,246 64,378 64,294 64,519 65,435 66,798 70,047 72,358 66,668
Total number of outstanding common shares 80,246 80,246 80,246 64,204 64,388 64,559 65,741 69,966 80,246 64,388
Book value per common share $ 22.60 $ 22.20 $ 21.82 $ 26.18 $ 25.36 $ 24.70 $ 23.90 $ 25.51 $ 22.60 $ 25.36
Home Capital Group Inc. Supplementary Financial Information Fourth Quarter 2017

Net Interest Margin2017 2017 2017 2017 2016 2016 2016 2016 2017 2016
Q4 Q3 Q2 Q1 Q4 Q3 Q2 Q1 Fiscal Fiscal
Net interest margin non-securitized interest-earning assets (non-TEB) 2.46% 2.21% (0.19)% 2.74% 2.71% 2.68% 2.74% 2.72% 1.79% 2.71%
Net interest margin non-securitized interest-earning assets (TEB) 2.46% 2.21% (0.19)% 2.76% 2.73% 2.70% 2.76% 2.74% 1.80% 2.73%
Net interest margin CMHC-sponsored securitized assets 0.30% 0.43% 0.50% 0.75% 0.53% 0.45% 0.42% 0.47% 0.48% 0.47%
Net interest margin bank-sponsored securitization conduit assets 0.99% 1.17% 1.63% 1.58% 1.90% 1.85% 1.99% - 1.37% 1.90%
Total net interest margin (non-TEB) 2.02% 1.85% (0.07)% 2.42% 2.36% 2.33% 2.36% 2.36% 1.54% 2.35%
Total net interest margin (TEB) 2.02% 1.85% (0.07)% 2.44% 2.38% 2.34% 2.38% 2.38% 1.55% 2.37%
Spread of non-securitized loans over deposits ond credit facilities 2.84% 2.62% (0.41)% 2.93% 2.86% 2.89% 2.97% 2.91% 1.96% 2.91%
Home Capital Group Inc. Supplementary Financial Information Fourth Quarter 2017
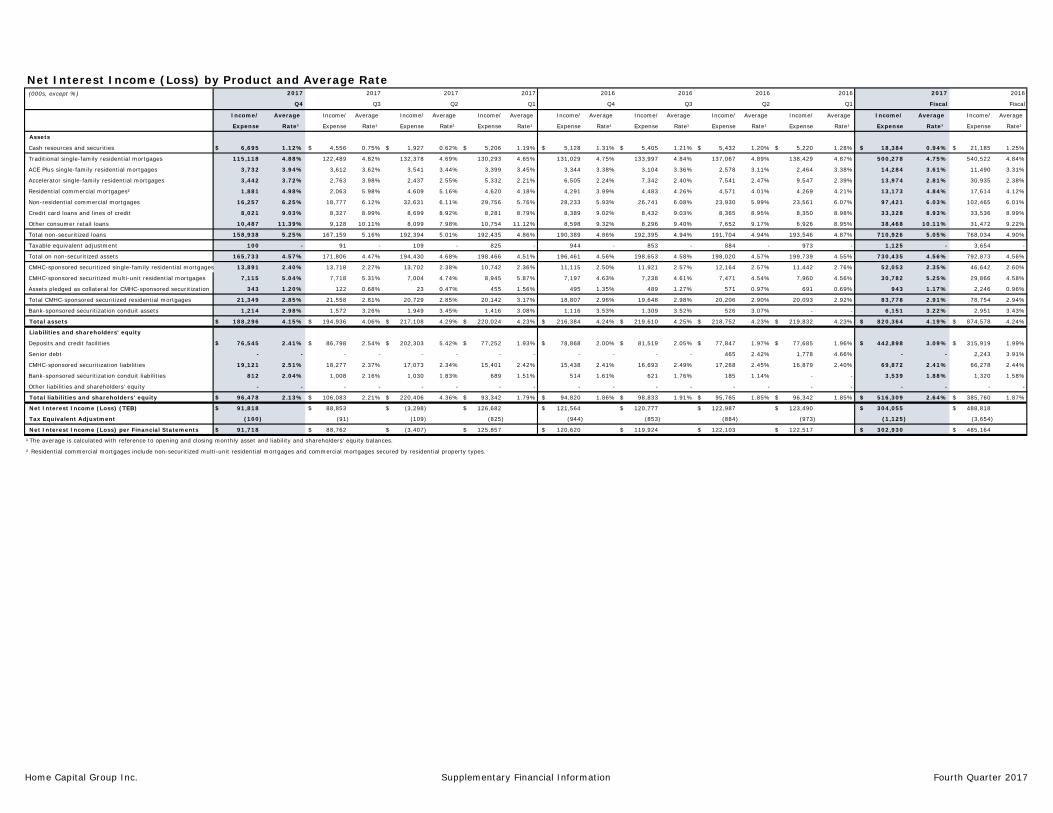
Net Interest Income (Loss) by Product and Average Rate(000s, except %)
Income/ Average Income/ Average Income/ Average Income/ Average Income/ Average Income/ Average Income/ Average Income/ Average Income/ Average Income/ Average
Expense Rate¹ Expense Rate¹ Expense Rate¹ Expense Rate¹ Expense Rate¹ Expense Rate¹ Expense Rate¹ Expense Rate¹ Expense Rate¹ Expense Rate¹
Assets
Cash resources and securities $ 6,695 1.12% $ 4,556 0.75% $ 1,927 0.62% $ 5,206 1.19% $ 5,128 1.31% $ 5,405 1.21% $ 5,432 1.20% $ 5,220 1.28% $ 18,384 0.94% $ 21,185 1.25%
Traditional single-family residential mortgages 115,118 4.88% 122,489 4.82% 132,378 4.69% 130,293 4.65% 131,029 4.75% 133,997 4.84% 137,067 4.89% 138,429 4.87% 500,278 4.75% 540,522 4.84%
ACE Plus single-family residential mortgages 3,732 3.94% 3,612 3.62% 3,541 3.44% 3,399 3.45% 3,344 3.38% 3,104 3.36% 2,578 3.11% 2,464 3.38% 14,284 3.61% 11,490 3.31%
Accelerator single-family residential mortgages 3,442 3.72% 2,763 3.98% 2,437 2.55% 5,332 2.21% 6,505 2.24% 7,342 2.40% 7,541 2.47% 9,547 2.39% 13,974 2.81% 30,935 2.38%
Residential commercial mortgages² 1,881 4.98% 2,063 5.98% 4,609 5.16% 4,620 4.18% 4,291 3.99% 4,483 4.26% 4,571 4.01% 4,269 4.21% 13,173 4.84% 17,614 4.12%
Non-residential commercial mortgages 16,257 6.25% 18,777 6.12% 32,631 6.11% 29,756 5.76% 28,233 5.93% 26,741 6.08% 23,930 5.99% 23,561 6.07% 97,421 6.03% 102,465 6.01%
Credit card loans and lines of credit 8,021 9.03% 8,327 8.99% 8,699 8.92% 8,281 8.79% 8,389 9.02% 8,432 9.03% 8,365 8.95% 8,350 8.98% 33,328 8.93% 33,536 8.99%
Other consumer retail loans 10,487 11.39% 9,128 10.11% 8,099 7.98% 10,754 11.12% 8,598 9.32% 8,296 9.40% 7,652 9.17% 6,926 8.95% 38,468 10.11% 31,472 9.22%
Total non-securitized loans 158,938 5.25% 167,159 5.16% 192,394 5.01% 192,435 4.86% 190,389 4.86% 192,395 4.94% 191,704 4.94% 193,546 4.87% 710,926 5.05% 768,034 4.90%
Taxable equivalent adjustment 100 - 91 - 109 - 825 - 944 - 853 - 884 - 973 - 1,125 - 3,654 -
Total on non-securitized assets 165,733 4.57% 171,806 4.47% 194,430 4.68% 198,466 4.51% 196,461 4.56% 198,653 4.58% 198,020 4.57% 199,739 4.55% 730,435 4.56% 792,873 4.56%
CMHC-sponsored securitized single-family residential mortgages 13,891 2.40% 13,718 2.27% 13,702 2.38% 10,742 2.36% 11,115 2.50% 11,921 2.57% 12,164 2.57% 11,442 2.76% 52,053 2.35% 46,642 2.60%
CMHC-sponsored securitized multi-unit residential mortgages 7,115 5.04% 7,718 5.31% 7,004 4.74% 8,945 5.87% 7,197 4.63% 7,238 4.61% 7,471 4.54% 7,960 4.56% 30,782 5.25% 29,866 4.58%
Assets pledged as collateral for CMHC-sponsored securitization 343 1.20% 122 0.68% 23 0.47% 455 1.56% 495 1.35% 489 1.27% 571 0.97% 691 0.69% 943 1.17% 2,246 0.96%
Total CMHC-sponsored securitized residential mortgages 21,349 2.85% 21,558 2.81% 20,729 2.85% 20,142 3.17% 18,807 2.96% 19,648 2.98% 20,206 2.90% 20,093 2.92% 83,778 2.91% 78,754 2.94%
Bank-sponsored securitization conduit assets 1,214 2.98% 1,572 3.26% 1,949 3.45% 1,416 3.08% 1,116 3.53% 1,309 3.52% 526 3.07% - - 6,151 3.22% 2,951 3.43%
Total assets $ 188,296 4.15% $ 194,936 4.06% $ 217,108 4.29% $ 220,024 4.23% $ 216,384 4.24% $ 219,610 4.25% $ 218,752 4.23% $ 219,832 4.23% $ 820,364 4.19% $ 874,578 4.24%
Liabilities and shareholders' equity
Deposits and credit facilities $ 76,545 2.41% $ 86,798 2.54% $ 202,303 5.42% $ 77,252 1.93% $ 78,868 2.00% $ 81,519 2.05% $ 77,847 1.97% $ 77,685 1.96% $ 442,898 3.09% $ 315,919 1.99%
Senior debt - - - - - - - - - - - - 465 2.42% 1,778 4.66% - - 2,243 3.91%
CMHC-sponsored securitization liabilities 19,121 2.51% 18,277 2.37% 17,073 2.34% 15,401 2.42% 15,438 2.41% 16,693 2.49% 17,268 2.45% 16,879 2.40% 69,872 2.41% 66,278 2.44%
Bank-sponsored securitization conduit liabilities 812 2.04% 1,008 2.16% 1,030 1.83% 689 1.51% 514 1.61% 621 1.76% 185 1.14% - - 3,539 1.88% 1,320 1.58%
Other liabilities and shareholders’ equity - - - - - - - - - - - - - - - - - - - -
Total liabilities and shareholders' equity $ 96,478 2.13% $ 106,083 2.21% $ 220,406 4.36% $ 93,342 1.79% $ 94,820 1.86% $ 98,833 1.91% $ 95,765 1.85% $ 96,342 1.85% $ 516,309 2.64% $ 385,760 1.87%
Net Interest Income (Loss) (TEB) $ 91,818 $ 88,853 $ (3,298) $ 126,682 $ 121,564 $ 120,777 $ 122,987 $ 123,490 $ 304,055 $ 488,818
Tax Equivalent Adjustment (100) (91) (109) (825) (944) (853) (884) (973) (1,125) (3,654)
Net Interest Income (Loss) per Financial Statements $ 91,718 $ 88,762 $ (3,407) $ 125,857 $ 120,620 $ 119,924 $ 122,103 $ 122,517 $ 302,930 $ 485,164
¹ The average is calculated with reference to opening and closing monthly asset and liability and shareholders' equity balances.
² Residential commercial mortgages include non-securitized multi-unit residential mortgages and commercial mortgages secured by residential property types.
2016
Fiscal
2016
Q4
2016
Q3
2016
Q2
2017
Q4
2016
Q1
2017
Fiscal
2017
Q3
2017
Q2
2017
Q1
Home Capital Group Inc. Supplementary Financial Information Fourth Quarter 2017

Average Balance Sheets for Selected Items¹(000s) 2017 2017 2017 2017 2016 2016 2016 2016 2017 2016
Q4 Q3 Q2 Q1 Q4 Q3 Q2 Q1 Fiscal Fiscal
Assets
Cash resources and securities $ 2,384,574 $ 2,441,025 $ 1,239,548 $ 1,745,794 $ 1,569,002 $ 1,785,161 $ 1,814,235 $ 1,631,159 $ 1,952,735 $ 1,699,889
Traditional single-family residential mortgages 9,443,558 10,175,199 11,283,411 11,213,929 11,039,113 11,079,745 11,218,031 11,379,100 10,529,024 11,178,997
ACE Plus single-family residential mortgages 379,194 398,963 411,745 394,353 395,910 369,436 331,731 291,860 396,064 347,234
Accelerator single-family residential mortgages 369,792 277,532 381,984 963,003 1,162,594 1,222,648 1,219,194 1,600,950 498,078 1,301,346
Residential commercial mortgages² 151,175 138,053 357,016 441,872 430,040 420,496 455,642 405,518 272,029 427,924
Non-residential commercial mortgages 1,040,128 1,227,408 2,135,247 2,064,604 1,904,058 1,760,491 1,596,749 1,552,991 1,616,847 1,703,572
Credit card loans and lines of credit 355,479 370,669 389,946 376,652 372,009 373,416 374,012 371,929 373,186 372,841
Other consumer retail loans 368,327 361,297 405,937 386,791 369,181 352,957 333,709 309,412 380,588 341,315
Total non-securitized loans 12,107,653 12,949,121 15,365,286 15,841,204 15,672,905 15,579,189 15,529,068 15,911,760 14,065,816 15,673,229
Taxable equivalent adjustment - - - - - - - - - -
Total on non-securitized assets 14,492,227 15,390,146 16,604,834 17,586,998 17,241,907 17,364,350 17,343,303 17,542,919 16,018,551 17,373,118
CMHC-sponsored securitized single-family residential mortgages 2,319,691 2,413,189 2,301,996 1,817,991 1,775,532 1,852,325 1,893,788 1,656,102 2,213,217 1,794,437
CMHC-sponsored securitized multi-unit residential mortgages 564,349 581,426 590,515 609,061 622,287 627,527 658,244 697,995 586,338 651,513
Assets pledged as collateral for CMHC-sponsored securitization 113,968 71,450 19,675 116,713 147,162 153,863 236,018 402,829 80,452 234,968
Total CMHC-sponsored securitized residential mortgages 2,998,008 3,066,065 2,912,186 2,543,765 2,544,981 2,633,715 2,788,050 2,756,926 2,880,007 2,680,918
Bank-sponsored securitization conduit assets 162,780 192,640 225,679 183,609 126,533 148,871 68,529 - 191,177 85,983
Other assets 493,436 534,538 478,477 487,769 512,259 503,910 501,811 476,585 498,554 498,643
Total Assets $ 18,146,451 $ 19,183,389 $ 20,221,176 $ 20,802,141 $ 20,425,680 $ 20,650,846 $ 20,701,693 $ 20,776,430 $ 19,588,289 $ 20,638,662
Liabilities and Shareholders’ Equity
Deposits and credit facilities $ 12,683,897 $ 13,652,078 $ 14,919,184 $ 16,034,871 $ 15,764,790 $ 15,889,870 $ 15,840,391 $ 15,884,889 $ 14,322,507 $ 15,844,985
Senior debt - - - - - - 76,858 152,530 - 57,347
CMHC-sponsored securitization liabilities 3,043,728 3,080,084 2,917,781 2,548,254 2,562,709 2,681,021 2,822,161 2,811,983 2,897,462 2,719,469
Bank-sponsored securitization conduit liabilities 159,406 187,056 225,406 182,131 127,485 141,244 64,697 - 188,500 83,357
Other liabilities and shareholders’ equity 2,259,420 2,264,171 2,158,805 2,036,885 1,970,696 1,938,711 1,897,586 1,927,028 2,179,820 1,933,504
Total Liabilities and Shareholders’ Equity $ 18,146,451 $ 19,183,389 $ 20,221,176 $ 20,802,141 $ 20,425,680 $ 20,650,846 $ 20,701,693 $ 20,776,430 $ 19,588,289 $ 20,638,662
¹ The average is calculated with reference to opening and closing monthly asset and liability and shareholders' equity balances.
² Residential commercial mortgages include non-securitized multi-unit residential mortgages and commercial mortgages secured by residential property types.
Home Capital Group Inc. Supplementary Financial Information Fourth Quarter 2017

Consolidated Balance Sheets(000s) 2017 2017 2017 2017 2016 2016 2016 2016 2017 2016
Q4 Q3 Q2 Q1 Q4 Q3 Q2 Q1 Fiscal Fiscal
ASSETS
Cash and Cash Equivalents $ 1,336,138 $ 2,337,760 $ 1,682,982 $ 1,251,190 $ 1,205,394 $ 1,058,940 $ 1,448,548 $ 1,454,752 $ 1,336,138 $ 1,205,394
Available for Sale Securities 332,468 331,544 31,495 549,456 534,924 523,482 519,067 488,211 332,468 534,924
Loans Held for Sale 165,947 40,320 - 40,721 77,918 74,207 117,691 70,187 165,947 77,918
Loans
Securitized mortgages 2,993,250 3,133,906 3,257,104 2,647,014 2,526,804 2,549,205 2,704,230 2,516,944 2,993,250 2,526,804
Non-securitized mortgages and loans 11,905,227 12,255,424 14,391,010 15,885,741 15,430,595 15,378,826 15,243,153 15,362,784 11,905,227 15,430,595
14,898,477 15,389,330 17,648,114 18,532,755 17,957,399 17,928,031 17,947,383 17,879,728 14,898,477 17,957,399
Collective allowance for credit losses (33,563) (33,563) (40,063) (39,063) (37,063) (37,063) (37,063) (36,463) (33,563) (37,063)
14,864,914 15,355,767 17,608,051 18,493,692 17,920,336 17,890,968 17,910,320 17,843,265 14,864,914 17,920,336
Other
Restricted assets 437,011 289,870 216,596 140,325 265,374 231,235 232,000 293,637 437,011 265,374
Derivative assets 7,325 10,177 21,804 33,480 37,524 52,178 58,086 63,931 7,325 37,524
Other assets 336,770 365,685 384,676 347,477 348,638 336,077 329,009 328,013 336,770 348,638
Deferred tax assets 9,577 15,873 19,510 18,048 16,914 16,362 15,798 15,562 9,577 16,914
Goodwill and intangible assets 100,993 109,298 112,036 118,996 121,755 133,581 132,628 130,426 100,993 121,755
891,676 790,903 754,622 658,326 790,205 769,433 767,521 831,569 891,676 790,205
$ 17,591,143 $ 18,856,294 $ 20,077,150 $ 20,993,385 $ 20,528,777 $ 20,317,030 $ 20,763,147 $ 20,687,984 $ 17,591,143 $ 20,528,777
LIABILITIES AND SHAREHOLDERS’ EQUITY
Liabilities
Deposits
Deposits payable on demand $ 539,364 $ 441,008 $ 372,912 $ 2,377,400 $ 2,531,803 $ 2,432,283 $ 2,274,577 $ 2,321,093 $ 539,364 $ 2,531,803
Deposits payable on a fixed date 11,631,090 12,917,610 12,731,694 13,872,211 13,354,227 13,261,819 13,747,642 13,503,806 11,631,090 13,354,227
12,170,454 13,358,618 13,104,606 16,249,611 15,886,030 15,694,102 16,022,219 15,824,899 12,170,454 15,886,030
Line of Credit Facility - - 1,396,959 - - - - - - -
Senior Debt - - - - - - - 153,283 - -
Securitization Liabilities
CMHC-sponsored mortgage-backed security liabilities 1,562,152 1,606,818 1,649,637 922,377 898,386 930,614 928,312 863,284 1,562,152 898,386
CMHC-sponsored Canada Mortgage Bond liabilities 1,473,318 1,473,350 1,474,001 1,474,539 1,637,117 1,610,482 1,766,143 1,870,548 1,473,318 1,637,117
Bank-sponsored securitization conduit liabilities 142,279 174,511 203,991 250,129 114,146 139,115 143,024 - 142,279 114,146
3,177,749 3,254,679 3,327,629 2,647,045 2,649,649 2,680,211 2,837,479 2,733,832 3,177,749 2,649,649
Other
Derivative liabilities 38,728 31,192 11,322 2,871 3,490 959 3,145 1,040 38,728 3,490
Other liabilities 360,477 395,291 450,925 379,367 320,737 308,675 291,000 257,922 360,477 320,737
Deferred tax liabilities 30,230 34,773 34,622 33,593 36,284 38,210 38,016 39,854 30,230 36,284
429,435 461,256 496,869 415,831 360,511 347,844 332,161 298,816 429,435 360,511
15,777,638 17,074,553 18,326,063 19,312,487 18,896,190 18,722,157 19,191,859 19,010,830 15,777,638 18,896,190
Shareholders’ Equity
Capital stock 231,156 231,156 231,618 85,194 84,910 83,975 85,513 90,283 231,156 84,910
Contributed surplus 4,978 5,096 4,922 4,725 4,562 4,588 4,255 4,230 4,978 4,562
Retained earnings 1,583,265 1,552,646 1,522,663 1,633,813 1,598,180 1,569,653 1,551,395 1,654,940 1,583,265 1,598,180
Accumulated other comprehensive loss (5,894) (7,157) (8,116) (42,834) (55,065) (63,343) (69,875) (72,299) (5,894) (55,065)
1,813,505 1,781,741 1,751,087 1,680,898 1,632,587 1,594,873 1,571,288 1,677,154 1,813,505 1,632,587
$ 17,591,143 $ 18,856,294 $ 20,077,150 $ 20,993,385 $ 20,528,777 $ 20,317,030 $ 20,763,147 $ 20,687,984 $ 17,591,143 $ 20,528,777
Home Capital Group Inc. Supplementary Financial Information Fourth Quarter 2017
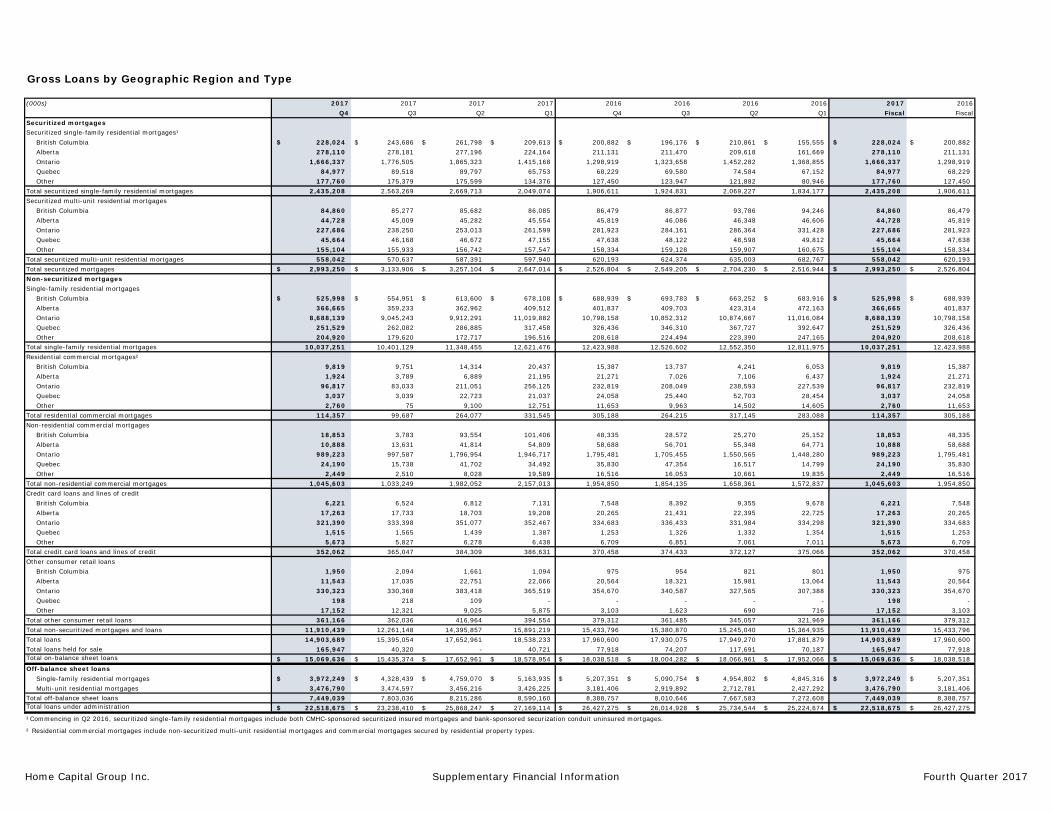
Gross Loans by Geographic Region and Type
(000s) 2017 2017 2017 2017 2016 2016 2016 2016 2017 2016Q4 Q3 Q2 Q1 Q4 Q3 Q2 Q1 Fiscal Fiscal
Securitized mortgagesSecuritized single-family residential mortgages¹
British Columbia $ 228,024 $ 243,686 $ 261,798 $ 209,613 $ 200,882 $ 196,176 $ 210,861 $ 155,555 $ 228,024 $ 200,882 Alberta 278,110 278,181 277,196 224,164 211,131 211,470 209,618 161,669 278,110 211,131 Ontario 1,666,337 1,776,505 1,865,323 1,415,168 1,298,919 1,323,658 1,452,282 1,368,855 1,666,337 1,298,919 Quebec 84,977 89,518 89,797 65,753 68,229 69,580 74,584 67,152 84,977 68,229 Other 177,760 175,379 175,599 134,376 127,450 123,947 121,882 80,946 177,760 127,450
Total securitized single-family residential mortgages 2,435,208 2,563,269 2,669,713 2,049,074 1,906,611 1,924,831 2,069,227 1,834,177 2,435,208 1,906,611 Securitized multi-unit residential mortgages
British Columbia 84,860 85,277 85,682 86,085 86,479 86,877 93,786 94,246 84,860 86,479 Alberta 44,728 45,009 45,282 45,554 45,819 46,086 46,348 46,606 44,728 45,819 Ontario 227,686 238,250 253,013 261,599 281,923 284,161 286,364 331,428 227,686 281,923 Quebec 45,664 46,168 46,672 47,155 47,638 48,122 48,598 49,812 45,664 47,638 Other 155,104 155,933 156,742 157,547 158,334 159,128 159,907 160,675 155,104 158,334
Total securitized multi-unit residential mortgages 558,042 570,637 587,391 597,940 620,193 624,374 635,003 682,767 558,042 620,193 Total securitized mortgages $ 2,993,250 $ 3,133,906 $ 3,257,104 $ 2,647,014 $ 2,526,804 $ 2,549,205 $ 2,704,230 $ 2,516,944 $ 2,993,250 $ 2,526,804 Non-securitized mortgagesSingle-family residential mortgages
British Columbia $ 525,998 $ 554,951 $ 613,600 $ 678,108 $ 688,939 $ 693,783 $ 663,252 $ 683,916 $ 525,998 $ 688,939 Alberta 366,665 359,233 362,962 409,512 401,837 409,703 423,314 472,163 366,665 401,837 Ontario 8,688,139 9,045,243 9,912,291 11,019,882 10,798,158 10,852,312 10,874,667 11,016,084 8,688,139 10,798,158 Quebec 251,529 262,082 286,885 317,458 326,436 346,310 367,727 392,647 251,529 326,436 Other 204,920 179,620 172,717 196,516 208,618 224,494 223,390 247,165 204,920 208,618
Total single-family residential mortgages 10,037,251 10,401,129 11,348,455 12,621,476 12,423,988 12,526,602 12,552,350 12,811,975 10,037,251 12,423,988 Residential commercial mortgages²
British Columbia 9,819 9,751 14,314 20,437 15,387 13,737 4,241 6,053 9,819 15,387 Alberta 1,924 3,789 6,889 21,195 21,271 7,026 7,106 6,437 1,924 21,271 Ontario 96,817 83,033 211,051 256,125 232,819 208,049 238,593 227,539 96,817 232,819 Quebec 3,037 3,039 22,723 21,037 24,058 25,440 52,703 28,454 3,037 24,058 Other 2,760 75 9,100 12,751 11,653 9,963 14,502 14,605 2,760 11,653
Total residential commercial mortgages 114,357 99,687 264,077 331,545 305,188 264,215 317,145 283,088 114,357 305,188 Non-residential commercial mortgages
British Columbia 18,853 3,783 93,554 101,406 48,335 28,572 25,270 25,152 18,853 48,335 Alberta 10,888 13,631 41,814 54,809 58,688 56,701 55,348 64,771 10,888 58,688 Ontario 989,223 997,587 1,796,954 1,946,717 1,795,481 1,705,455 1,550,565 1,448,280 989,223 1,795,481 Quebec 24,190 15,738 41,702 34,492 35,830 47,354 16,517 14,799 24,190 35,830 Other 2,449 2,510 8,028 19,589 16,516 16,053 10,661 19,835 2,449 16,516
Total non-residential commercial mortgages 1,045,603 1,033,249 1,982,052 2,157,013 1,954,850 1,854,135 1,658,361 1,572,837 1,045,603 1,954,850 Credit card loans and lines of credit
British Columbia 6,221 6,524 6,812 7,131 7,548 8,392 9,355 9,678 6,221 7,548 Alberta 17,263 17,733 18,703 19,208 20,265 21,431 22,395 22,725 17,263 20,265 Ontario 321,390 333,398 351,077 352,467 334,683 336,433 331,984 334,298 321,390 334,683 Quebec 1,515 1,565 1,439 1,387 1,253 1,326 1,332 1,354 1,515 1,253 Other 5,673 5,827 6,278 6,438 6,709 6,851 7,061 7,011 5,673 6,709
Total credit card loans and lines of credit 352,062 365,047 384,309 386,631 370,458 374,433 372,127 375,066 352,062 370,458 Other consumer retail loans
British Columbia 1,950 2,094 1,661 1,094 975 954 821 801 1,950 975 Alberta 11,543 17,035 22,751 22,066 20,564 18,321 15,981 13,064 11,543 20,564 Ontario 330,323 330,368 383,418 365,519 354,670 340,587 327,565 307,388 330,323 354,670 Quebec 198 218 109 - - - - - 198 - Other 17,152 12,321 9,025 5,875 3,103 1,623 690 716 17,152 3,103
Total other consumer retail loans 361,166 362,036 416,964 394,554 379,312 361,485 345,057 321,969 361,166 379,312 Total non-securitized mortgages and loans 11,910,439 12,261,148 14,395,857 15,891,219 15,433,796 15,380,870 15,245,040 15,364,935 11,910,439 15,433,796 Total loans 14,903,689 15,395,054 17,652,961 18,538,233 17,960,600 17,930,075 17,949,270 17,881,879 14,903,689 17,960,600 Total loans held for sale 165,947 40,320 - 40,721 77,918 74,207 117,691 70,187 165,947 77,918 Total on-balance sheet loans $ 15,069,636 $ 15,435,374 $ 17,652,961 $ 18,578,954 $ 18,038,518 $ 18,004,282 $ 18,066,961 $ 17,952,066 $ 15,069,636 $ 18,038,518 Off-balance sheet loans
Single-family residential mortgages $ 3,972,249 $ 4,328,439 $ 4,759,070 $ 5,163,935 $ 5,207,351 $ 5,090,754 $ 4,954,802 $ 4,845,316 $ 3,972,249 $ 5,207,351 Multi-unit residential mortgages 3,476,790 3,474,597 3,456,216 3,426,225 3,181,406 2,919,892 2,712,781 2,427,292 3,476,790 3,181,406
Total off-balance sheet loans 7,449,039 7,803,036 8,215,286 8,590,160 8,388,757 8,010,646 7,667,583 7,272,608 7,449,039 8,388,757 Total loans under administration $ 22,518,675 $ 23,238,410 $ 25,868,247 $ 27,169,114 $ 26,427,275 $ 26,014,928 $ 25,734,544 $ 25,224,674 $ 22,518,675 $ 26,427,275
¹ Commencing in Q2 2016, securitized single-family residential mortgages include both CMHC-sponsored securitized insured mortgages and bank-sponsored securization conduit uninsured mortgages.
² Residential commercial mortgages include non-securitized multi-unit residential mortgages and commercial mortgages secured by residential property types.
Home Capital Group Inc. Supplementary Financial Information Fourth Quarter 2017

Gross Loans by Geographic Region (excluding held for sale and off-balance sheet loans)(000s) 2017 2017 2017 2017 2016 2016 2016 2016 2017 2016
Q4 Q3 Q2 Q1 Q4 Q3 Q2 Q1 Fiscal Fiscal
British Columbia $ 875,725 $ 906,066 $ 1,045,848 $ 1,103,874 $ 1,048,545 $ 1,028,491 $ 1,007,586 $ 975,401 $ 875,725 $ 1,048,545
Alberta 731,121 734,611 801,336 796,508 779,575 770,738 780,110 787,435 731,121 779,575
Ontario 12,319,915 12,804,384 14,848,350 15,617,477 15,096,653 15,050,655 15,062,020 15,033,872 12,319,915 15,096,653
Quebec 411,110 418,328 526,004 487,282 503,444 538,132 561,461 554,218 411,110 503,444
Other 565,818 531,665 431,423 533,092 532,383 542,059 538,093 530,953 565,818 532,383
Total loans $ 14,903,689 $ 15,395,054 $ 17,652,961 $ 18,538,233 $ 17,960,600 $ 17,930,075 $ 17,949,270 $ 17,881,879 $ 14,903,689 $ 17,960,600
Home Capital Group Inc. Supplementary Financial Information Fourth Quarter 2017
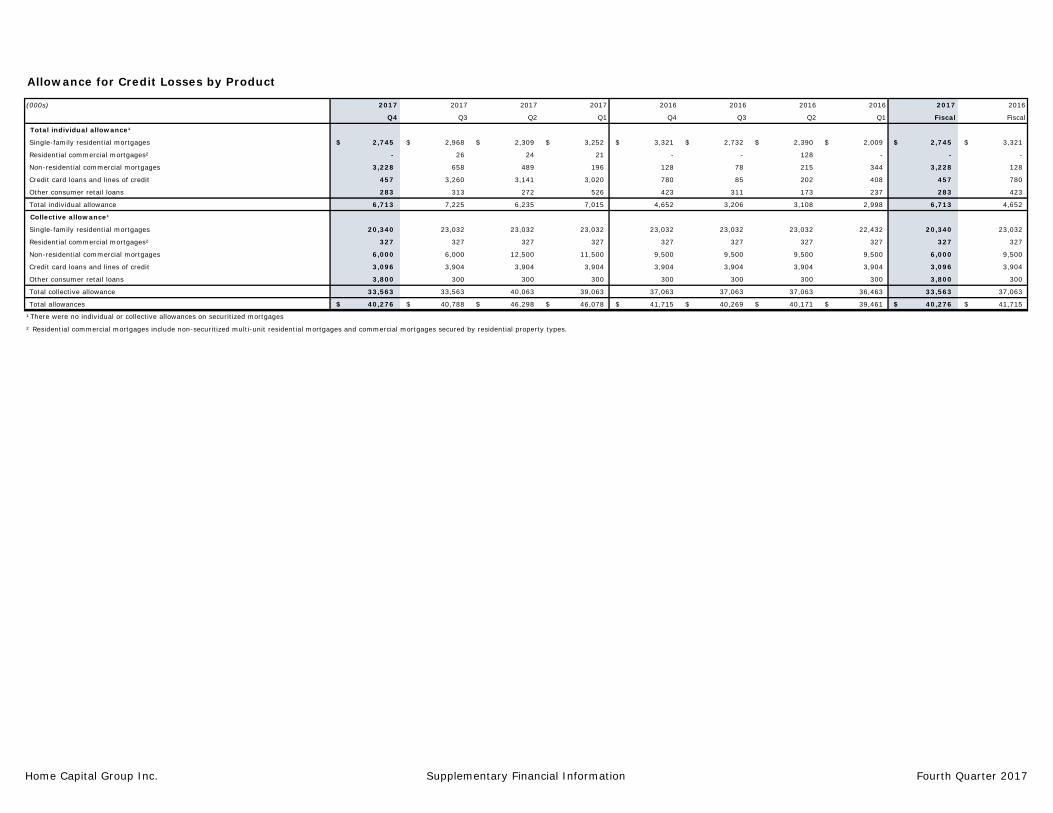
Allowance for Credit Losses by Product
(000s) 2017 2017 2017 2017 2016 2016 2016 2016 2017 2016
Q4 Q3 Q2 Q1 Q4 Q3 Q2 Q1 Fiscal Fiscal
Total individual allowance¹
Single-family residential mortgages $ 2,745 $ 2,968 $ 2,309 $ 3,252 $ 3,321 $ 2,732 $ 2,390 $ 2,009 $ 2,745 $ 3,321
Residential commercial mortgages² - 26 24 21 - - 128 - - -
Non-residential commercial mortgages 3,228 658 489 196 128 78 215 344 3,228 128
Credit card loans and lines of credit 457 3,260 3,141 3,020 780 85 202 408 457 780
Other consumer retail loans 283 313 272 526 423 311 173 237 283 423
Total individual allowance 6,713 7,225 6,235 7,015 4,652 3,206 3,108 2,998 6,713 4,652
Collective allowance¹
Single-family residential mortgages 20,340 23,032 23,032 23,032 23,032 23,032 23,032 22,432 20,340 23,032
Residential commercial mortgages² 327 327 327 327 327 327 327 327 327 327
Non-residential commercial mortgages 6,000 6,000 12,500 11,500 9,500 9,500 9,500 9,500 6,000 9,500
Credit card loans and lines of credit 3,096 3,904 3,904 3,904 3,904 3,904 3,904 3,904 3,096 3,904
Other consumer retail loans 3,800 300 300 300 300 300 300 300 3,800 300
Total collective allowance 33,563 33,563 40,063 39,063 37,063 37,063 37,063 36,463 33,563 37,063
Total allowances $ 40,276 $ 40,788 $ 46,298 $ 46,078 $ 41,715 $ 40,269 $ 40,171 $ 39,461 $ 40,276 $ 41,715
¹ There were no individual or collective allowances on securitized mortgages
² Residential commercial mortgages include non-securitized multi-unit residential mortgages and commercial mortgages secured by residential property types.
Home Capital Group Inc. Supplementary Financial Information Fourth Quarter 2017

Mortgage Advances(000s) 2017 2017 2017 2017 2016 2016 2016 2016 2017 2016
Q4 Q3 Q2 Q1 Q4 Q3 Q2 Q1 Fiscal Fiscal²
Single-family residential mortgages
$ 515,699 $ 201,131 $ 699,930 $ 1,458,775 $ 1,325,896 $ 1,416,842 $ 1,252,959 $ 995,354 $ 2,875,535 $ 4,991,051
21,713 1,541 56,079 105,950 106,477 116,666 115,426 69,198 185,283 407,767
28,635 21,292 84,201 147,645 346,690 446,734 464,767 363,812 281,773 1,622,003
Residential commercial mortgages
17,568 - 9,281 45,005 53,999 17,947 23,929 46,151 71,854 142,026
177,224 99,054 73,730 249,835 293,306 194,875 338,527 129,698 599,843 956,406
- - 6,815 - 24,179 - 19,570 7,023 6,815 50,772
Non-residential commercial mortgages
1,870 - 11,866 31,763 14,878 35,018 11,400 19,592 45,499 80,888
109,343 62,047 176,191 306,666 262,423 312,618 248,292 151,531 654,247 974,864
Total mortgage advances $ 872,052 $ 385,065 $ 1,118,093 $ 2,345,639 $ 2,427,848 $ 2,540,700 $ 2,474,870 $ 1,782,359 $ 4,720,849 $ 9,225,777
¹ Other residential commercial mortgages include mortgages such as builders' inventory.2 In the initial version of this document, the balances for Fiscal 2016 were erroneously populated with balances for the nine-months ended September 30, 2016. This current version of the document has now been correctly populated
with the balances for the full year 2016.
Mortgage Continuity(000s) 2017 2017 2017 2017 2016 2016 2016 2016 2017 2016
Q4 Q3 Q2 Q1 Q4 Q3 Q2 Q1 Fiscal Fiscal
Single-family residential mortgages
$ 12,962,538 $ 14,016,866 $ 14,668,688 $ 14,328,619 $ 14,449,796 $ 14,620,219 $ 14,644,966 $ 14,927,528 $ 14,328,619 $ 14,927,528
Advances 566,047 223,964 840,210 1,712,370 1,779,063 1,980,242 1,833,152 1,428,364 3,342,591 7,020,821
Renewal of mortgages previously derecognized¹ 136,408 149,440 138,625 122,705 38,430 12,646 3,360 8,112 547,178 62,548
Scheduled payments and prepayments² (81,316) (84,277) (86,552) (84,465) (88,355) (88,630) (85,708) (84,302) (336,610) (346,995)
Discharges (1,126,355) (1,324,943) (1,271,510) (1,127,144) (1,482,404) (1,677,574) (1,496,868) (1,218,657) (4,849,952) (5,875,503)
Capitalization and amortization of fees and other 13,408 (339) 26,511 5,061 24,387 3,657 18,631 (15,605) 44,641 31,070
Sales of mortgages and residual interests - (18,173) (299,106) (288,458) (392,298) (400,764) (297,314) (400,474) (605,737) (1,490,850)
$ 12,470,730 $ 12,962,538 $ 14,016,866 $ 14,668,688 $ 14,328,619 $ 14,449,796 $ 14,620,219 $ 14,644,966 $ 12,470,730 $ 14,328,619
Residential commercial mortgages
$ 710,644 $ 851,468 $ 970,118 $ 1,003,299 $ 962,796 $ 1,069,839 $ 1,036,042 $ 1,182,850 $ 1,003,299 $ 1,182,850
Advances 194,792 99,054 89,826 294,840 371,484 212,822 382,026 182,872 678,512 1,149,204
Renewal of mortgages previously derecognized¹ 10,922 - 7,900 377 14,457 - - - 19,199 14,457
Scheduled payments and prepayments² (5,816) (4,923) (4,206) (5,881) (5,174) (4,085) (5,782) (6,935) (20,826) (21,976)
Discharges (20,740) (52,994) (53,847) (35,195) (50,697) (71,271) (45,067) (104,390) (162,776) (271,425)
Capitalization and amortization of fees and other 413 (776) (317) (597) 25,418 (1,615) (5,270) (21,887) (1,277) (3,354)
Sales of mortgages and residual interests (51,869) (181,185) (158,006) (286,725) (314,985) (242,894) (292,110) (196,468) (677,785) (1,046,457)
$ 838,346 $ 710,644 $ 851,468 $ 970,118 $ 1,003,299 $ 962,796 $ 1,069,839 $ 1,036,042 $ 838,346 $ 1,003,299
Non-residential commercial mortgages
$ 1,032,949 $ 1,981,911 $ 2,157,013 $ 1,954,820 $ 1,854,115 $ 1,658,201 $ 1,572,512 $ 1,490,648 $ 1,954,820 $ 1,490,648
Advances 111,213 62,047 188,057 338,429 277,301 347,636 259,692 171,123 699,746 1,055,752
Renewal of mortgages previously derecognized¹ - - - - - - - - - -
Scheduled payments and prepayments² (7,193) (8,829) (16,976) (27,785) (11,498) (5,937) (2,509) (5,750) (60,783) (25,694)
Discharges (94,242) (145,516) (195,800) (106,048) (165,224) (143,576) (170,440) (87,955) (541,606) (567,195)
Capitalization and amortization of fees and other 126 6,181 (5,146) (2,403) 126 (2,209) (1,054) 4,446 (1,242) 1,309
Sales of mortgages and residual interests - (862,845) (145,237) - - - - - (1,008,082) -
$ 1,042,853 $ 1,032,949 $ 1,981,911 $ 2,157,013 $ 1,954,820 $ 1,854,115 $ 1,658,201 $ 1,572,512 $ 1,042,853 $ 1,954,820
$ 14,351,929 $ 14,706,131 $ 16,850,245 $ 17,795,819 $ 17,286,738 $ 17,266,707 $ 17,348,259 $ 17,253,520 $ 14,351,929 $ 17,286,738
¹Represents renewals of mortgages that were previously derecognized and included in the off-balance sheet portfolio. Upon renewal, the mortgages are recognized on the balance sheet.
²Includes regularly scheduled principal payments and unscheduled partial payments.
Other¹
Traditional
ACE Plus
Accelerator
Multi-unit uninsured residential mortgages
Multi-unit insured residential mortgages
Balance at the beginning of the period
Balance at the end of the period
Total Mortgage Lending
Store and apartments
Commercial
Balance at the beginning of the period
Balance at the end of the period
Balance at the beginning of the period
Balance at the end of the period
Home Capital Group Inc. Supplementary Financial Information Fourth Quarter 2017

Consumer Lending Continuity (000s) 2017 2017 2017 2017 2016 2016 2016 2016 2017 2016
Q4 Q3 Q2 Q1 Q4 Q3 Q2 Q1 Fiscal Fiscal
Credit Card Loans and Lines of Credit
$ 361,787 $ 381,169 $ 383,610 $ 369,678 $ 374,348 $ 371,925 $ 374,658 $ 370,825 $ 369,678 $ 370,825
Advances and draw-downs 50,135 50,378 64,236 53,628 55,506 56,892 57,151 49,413 218,377 218,962
Repayments (70,708) (79,534) (74,113) (50,389) (71,203) (66,008) (69,236) (56,017) (274,744) (262,464)
Capitalization of interest and fees, portfolio sales and other 10,391 9,774 7,436 10,693 11,027 11,539 9,352 10,437 38,294 42,355
$ 351,605 $ 361,787 $ 381,169 $ 383,610 $ 369,678 $ 374,348 $ 371,925 $ 374,658 $ 351,605 $ 369,678
Authorized limit on new credit card issurances $ 23,574 $ 13,050 $ 37,073 $ 55,200 $ 43,469 $ 47,977 $ 39,604 $ 37,037 $ 128,897 $ 168,087
Other Consumer Retail Loans
$ 361,732 $ 416,700 $ 394,047 $ 378,901 $ 361,183 $ 344,890 $ 321,737 $ 296,857 $ 378,901 $ 296,857
Advances and draw-downs 53,742 52,079 52,675 39,466 47,455 43,781 44,980 47,477 197,962 183,693
Repayments (68,962) (120,925) (45,132) (35,405) (43,243) (37,659) (33,981) (29,477) (270,424) (144,360)
Capitalization of interest and fees, portfolio sales and other 14,378 13,878 15,110 11,085 13,506 10,171 12,154 6,880 54,451 42,711
$ 360,890 $ 361,732 $ 416,700 $ 394,047 $ 378,901 $ 361,183 $ 344,890 $ 321,737 $ 360,890 $ 378,901
$ 712,495 $ 723,519 $ 797,869 $ 777,657 $ 748,579 $ 735,531 $ 716,815 $ 696,395 $ 712,495 $ 748,579
Balance at the beginning of the period
Balance at the end of the period
Balance at the beginning of the period
Balance at the end of the period
Total Consumer Lending
Home Capital Group Inc. Supplementary Financial Information Fourth Quarter 2017
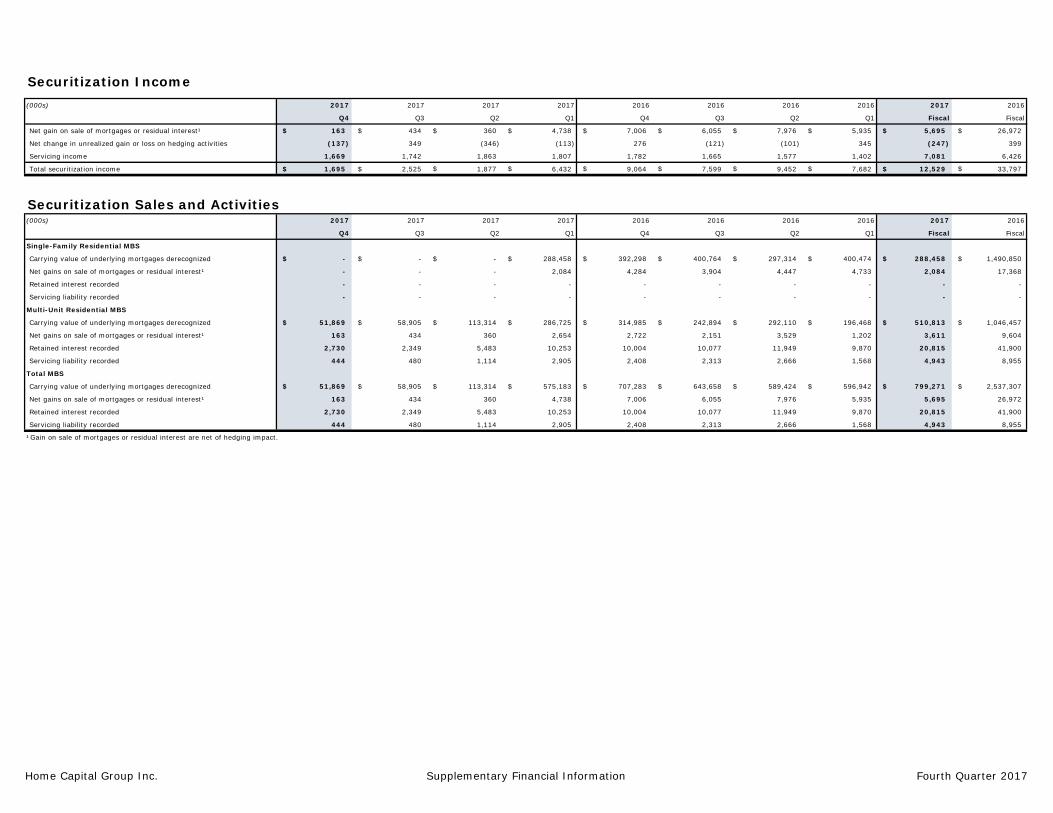
Securitization Income(000s) 2017 2017 2017 2017 2016 2016 2016 2016 2017 2016
Q4 Q3 Q2 Q1 Q4 Q3 Q2 Q1 Fiscal Fiscal
Net gain on sale of mortgages or residual interest¹ $ 163 $ 434 $ 360 $ 4,738 $ 7,006 $ 6,055 $ 7,976 $ 5,935 $ 5,695 $ 26,972
Net change in unrealized gain or loss on hedging activities (137) 349 (346) (113) 276 (121) (101) 345 (247) 399
Servicing income 1,669 1,742 1,863 1,807 1,782 1,665 1,577 1,402 7,081 6,426
Total securitization income $ 1,695 $ 2,525 $ 1,877 $ 6,432 $ 9,064 $ 7,599 $ 9,452 $ 7,682 $ 12,529 $ 33,797
Securitization Sales and Activities(000s) 2017 2017 2017 2017 2016 2016 2016 2016 2017 2016
Q4 Q3 Q2 Q1 Q4 Q3 Q2 Q1 Fiscal Fiscal
Single-Family Residential MBS
Carrying value of underlying mortgages derecognized $ - $ - $ - $ 288,458 $ 392,298 $ 400,764 $ 297,314 $ 400,474 $ 288,458 $ 1,490,850
Net gains on sale of mortgages or residual interest¹ - - - 2,084 4,284 3,904 4,447 4,733 2,084 17,368
Retained interest recorded - - - - - - - - - -
Servicing liability recorded - - - - - - - - - -
Multi-Unit Residential MBS
Carrying value of underlying mortgages derecognized $ 51,869 $ 58,905 $ 113,314 $ 286,725 $ 314,985 $ 242,894 $ 292,110 $ 196,468 $ 510,813 $ 1,046,457
Net gains on sale of mortgages or residual interest¹ 163 434 360 2,654 2,722 2,151 3,529 1,202 3,611 9,604
Retained interest recorded 2,730 2,349 5,483 10,253 10,004 10,077 11,949 9,870 20,815 41,900
Servicing liability recorded 444 480 1,114 2,905 2,408 2,313 2,666 1,568 4,943 8,955
Total MBS
Carrying value of underlying mortgages derecognized $ 51,869 $ 58,905 $ 113,314 $ 575,183 $ 707,283 $ 643,658 $ 589,424 $ 596,942 $ 799,271 $ 2,537,307
Net gains on sale of mortgages or residual interest¹ 163 434 360 4,738 7,006 6,055 7,976 5,935 5,695 26,972
Retained interest recorded 2,730 2,349 5,483 10,253 10,004 10,077 11,949 9,870 20,815 41,900
Servicing liability recorded 444 480 1,114 2,905 2,408 2,313 2,666 1,568 4,943 8,955
¹ Gain on sale of mortgages or residual interest are net of hedging impact.
Home Capital Group Inc. Supplementary Financial Information Fourth Quarter 2017

Deposits, Line of Credit Facility, Senior Debt and Securitization Liabilities(000s) 2017 2017 2017 2017 2016 2016 2016 2016 2017 2016
Q4 Q3 Q2 Q1 Q4 Q3 Q2 Q1 Fiscal Fiscal
Deposits payable on demand
High-interest savings accounts $ 138,948 $ 175,637 $ 114,346 $ 1,904,967 $ 2,016,881 $ 2,037,149 $ 1,901,981 $ 1,949,789 $ 138,948 $ 2,016,881
Oaken savings account 229,511 179,052 154,056 361,664 340,809 314,616 272,337 270,559 229,511 340,809
Other deposits payable on demand 170,905 86,319 104,510 110,769 174,113 80,518 100,259 100,745 170,905 174,113
539,364 441,008 372,912 2,377,400 2,531,803 2,432,283 2,274,577 2,321,093 539,364 2,531,803
Deposits payable on fixed dates
Brokered GICs 9,350,235 10,466,410 10,558,640 11,650,130 11,120,107 11,048,564 11,752,129 11,565,611 9,350,235 11,120,107
Oaken GICs 1,805,332 1,975,357 1,695,454 1,417,612 1,429,153 1,406,399 1,187,779 954,978 1,805,332 1,429,153
Institutional deposit notes 475,523 475,843 477,600 804,469 804,967 806,856 807,734 983,217 475,523 804,967
11,631,090 12,917,610 12,731,694 13,872,211 13,354,227 13,261,819 13,747,642 13,503,806 11,631,090 13,354,227
Total deposits $ 12,170,454 $ 13,358,618 $ 13,104,606 $ 16,249,611 $ 15,886,030 $ 15,694,102 $ 16,022,219 $ 15,824,899 $ 12,170,454 $ 15,886,030
Line of credit facility $ - $ - $ 1,396,959 $ - $ - $ - $ - $ - $ - $ -
Senior debt $ - $ - $ - $ - $ - $ - $ - $ 153,283 $ - $ -
Securitization liabilities
CMHC-sponsored mortgage-backed security liabilities $ 1,562,152 $ 1,606,818 $ 1,649,637 $ 922,377 $ 898,386 $ 930,614 $ 928,312 $ 863,284 $ 1,562,152 $ 898,386
CMHC-sponsored Canada Mortgage Bond liabilities 1,473,318 1,473,350 1,474,001 1,474,539 1,637,117 1,610,482 1,766,143 1,870,548 1,473,318 1,637,117
Bank-sponsored securitization conduit liabilities 142,279 174,511 203,991 250,129 114,146 139,115 143,024 - 142,279 114,146
Total securitization liabilities $ 3,177,749 $ 3,254,679 $ 3,327,629 $ 2,647,045 $ 2,649,649 $ 2,680,211 $ 2,837,479 $ 2,733,832 $ 3,177,749 $ 2,649,649
Home Capital Group Inc. Supplementary Financial Information Fourth Quarter 2017
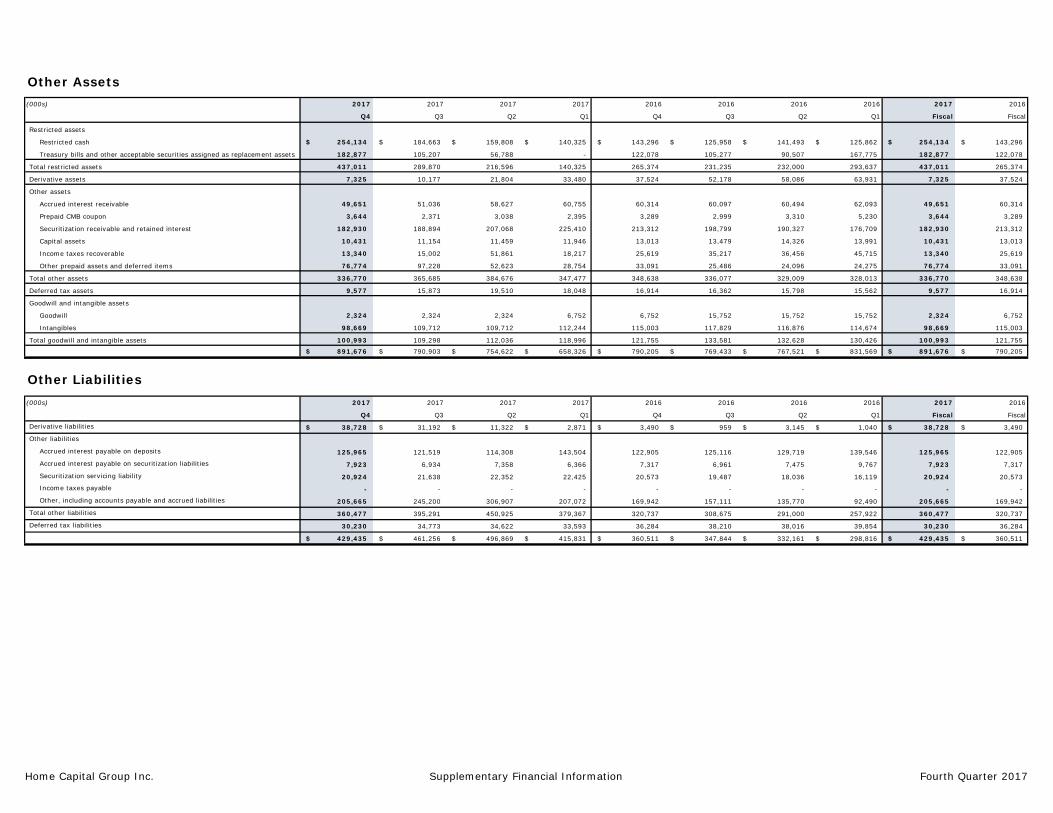
Other Assets(000s) 2017 2017 2017 2017 2016 2016 2016 2016 2017 2016
Q4 Q3 Q2 Q1 Q4 Q3 Q2 Q1 Fiscal Fiscal
Restricted assets
Restricted cash $ 254,134 $ 184,663 $ 159,808 $ 140,325 $ 143,296 $ 125,958 $ 141,493 $ 125,862 $ 254,134 $ 143,296
Treasury bills and other acceptable securities assigned as replacement assets 182,877 105,207 56,788 - 122,078 105,277 90,507 167,775 182,877 122,078
Total restricted assets 437,011 289,870 216,596 140,325 265,374 231,235 232,000 293,637 437,011 265,374
Derivative assets 7,325 10,177 21,804 33,480 37,524 52,178 58,086 63,931 7,325 37,524
Other assets
Accrued interest receivable 49,651 51,036 58,627 60,755 60,314 60,097 60,494 62,093 49,651 60,314
Prepaid CMB coupon 3,644 2,371 3,038 2,395 3,289 2,999 3,310 5,230 3,644 3,289
Securitization receivable and retained interest 182,930 188,894 207,068 225,410 213,312 198,799 190,327 176,709 182,930 213,312
Capital assets 10,431 11,154 11,459 11,946 13,013 13,479 14,326 13,991 10,431 13,013
Income taxes recoverable 13,340 15,002 51,861 18,217 25,619 35,217 36,456 45,715 13,340 25,619
Other prepaid assets and deferred items 76,774 97,228 52,623 28,754 33,091 25,486 24,096 24,275 76,774 33,091
Total other assets 336,770 365,685 384,676 347,477 348,638 336,077 329,009 328,013 336,770 348,638
Deferred tax assets 9,577 15,873 19,510 18,048 16,914 16,362 15,798 15,562 9,577 16,914
Goodwill and intangible assets
Goodwill 2,324 2,324 2,324 6,752 6,752 15,752 15,752 15,752 2,324 6,752
Intangibles 98,669 109,712 109,712 112,244 115,003 117,829 116,876 114,674 98,669 115,003
Total goodwill and intangible assets 100,993 109,298 112,036 118,996 121,755 133,581 132,628 130,426 100,993 121,755
$ 891,676 $ 790,903 $ 754,622 $ 658,326 $ 790,205 $ 769,433 $ 767,521 $ 831,569 $ 891,676 $ 790,205
Other Liabilities(000s) 2017 2017 2017 2017 2016 2016 2016 2016 2017 2016
Q4 Q3 Q2 Q1 Q4 Q3 Q2 Q1 Fiscal Fiscal
Derivative liabilities $ 38,728 $ 31,192 $ 11,322 $ 2,871 $ 3,490 $ 959 $ 3,145 $ 1,040 $ 38,728 $ 3,490
Other liabilities
Accrued interest payable on deposits 125,965 121,519 114,308 143,504 122,905 125,116 129,719 139,546 125,965 122,905
Accrued interest payable on securitization liabilities 7,923 6,934 7,358 6,366 7,317 6,961 7,475 9,767 7,923 7,317
Securitization servicing liability 20,924 21,638 22,352 22,425 20,573 19,487 18,036 16,119 20,924 20,573 Income taxes payable - - - - - - - - - -
Other, including accounts payable and accrued liabilities 205,665 245,200 306,907 207,072 169,942 157,111 135,770 92,490 205,665 169,942
Total other liabilities 360,477 395,291 450,925 379,367 320,737 308,675 291,000 257,922 360,477 320,737
Deferred tax liabilities 30,230 34,773 34,622 33,593 36,284 38,210 38,016 39,854 30,230 36,284
$ 429,435 $ 461,256 $ 496,869 $ 415,831 $ 360,511 $ 347,844 $ 332,161 $ 298,816 $ 429,435 $ 360,511
Home Capital Group Inc. Supplementary Financial Information Fourth Quarter 2017

Gross Amount of Impaired Loans by Product(000s) 2017 2017 2017 2017 2016 2016 2016 2016 2017 2016
Q4 Q3 Q2 Q1 Q4 Q3 Q2 Q1 Fiscal Fiscal
Single-family residential mortgages $ 31,836 $ 37,978 $ 33,623 $ 37,000 $ 49,834 $ 52,349 $ 51,106 $ 49,574 $ 31,836 $ 49,834
Residential commercial mortgages¹ - 337 337 337 - - 4,000 4,000 - -
Non-residential commercial mortgages 16,489 6,521 7,285 8,033 4,577 3,388 3,844 6,846 16,489 4,577
Credit card loans and lines of credit 2,038 4,230 4,561 4,315 2,049 2,091 1,749 2,117 2,038 2,049
Other consumer retail loans 276 304 264 508 411 302 167 232 276 411
Gross impaired loans $ 50,639 $ 49,370 $ 46,070 $ 50,193 $ 56,871 $ 58,130 $ 60,866 $ 62,769 $ 50,639 $ 56,871
Net Amount of Impaired Loans by Product(000s) 2017 2017 2017 2017 2016 2016 2016 2016 2017 2016
Q4 Q3 Q2 Q1 Q4 Q3 Q2 Q1 Fiscal Fiscal
Single-family residential mortgages $ 30,107 $ 36,118 $ 32,321 $ 35,123 $ 47,854 $ 50,712 $ 49,748 $ 48,388 $ 30,107 $ 47,854
Residential commercial mortgages¹ - 337 337 337 - - 4,000 4,000 - -
Non-residential commercial mortgages 13,739 6,221 7,144 7,945 4,547 3,368 3,684 6,521 13,739 4,547
Credit card loans and lines of credit 1,581 970 1,420 1,295 1,269 2,006 1,547 1,709 1,581 1,269
Other consumer retail loans - - - - - - - - - -
Net impaired loans $ 45,427 $ 43,646 $ 41,222 $ 44,700 $ 53,670 $ 56,086 $ 58,979 $ 60,618 $ 45,427 $ 53,670
¹ Residential commercial mortgages include non-securitized multi-unit residential mortgages and commercial mortgages secured by residential property types.
Home Capital Group Inc. Supplementary Financial Information Fourth Quarter 2017

Change in Allowance
(000s) 2017 2017 2017 2017 2016 2016 2016 2016 2017 2016
Q4 Q3 Q2 Q1 Q4 Q3 Q2 Q1 Fiscal Fiscal
Individual allowances
Allowance on loan principal
Balance at the beginning of the period $ 5,724 $ 4,848 $ 5,493 $ 3,201 $ 2,044 $ 1,887 $ 2,151 $ 2,482 $ 3,201 $ 2,482
Provision for credit losses 3,434 2,129 1,555 3,848 2,111 1,395 1,786 1,234 10,966 6,526
Write-offs (4,350) (1,529) (2,453) (1,727) (1,245) (1,396) (2,331) (1,811) (10,059) (6,783)
Recoveries 404 276 253 171 291 158 281 246 1,104 976
5,212 5,724 4,848 5,493 3,201 2,044 1,887 2,151 5,212 3,201
Allowance on accrued interest receivable
Balance at the beginning of the period 1,501 1,387 1,522 1,451 1,162 1,221 847 901 1,451 901
Provision for credit losses - 114 (135) 71 289 (59) 374 (54) 50 550
1,501 1,501 1,387 1,522 1,451 1,162 1,221 847 1,501 1,451
Total individual allowance 6,713 7,225 6,235 7,015 4,652 3,206 3,108 2,998 6,713 4,652
Collective allowance
Balance at the beginning of the period 33,563 40,063 39,063 37,063 37,063 37,063 36,463 36,249 37,063 36,249
Provision for credit losses - (6,500) 1,000 2,000 - - 600 214 (3,500) 814
33,563 33,563 40,063 39,063 37,063 37,063 37,063 36,463 33,563 37,063
Total allowance $ 40,276 $ 40,788 $ 46,298 $ 46,078 $ 41,715 $ 40,269 $ 40,171 $ 39,461 $ 40,276 $ 41,715
Total provision $ 3,434 $ (4,257) $ 2,420 $ 5,919 $ 2,400 $ 1,336 $ 2,760 $ 1,394 $ 7,516 $ 7,890
Home Capital Group Inc. Supplementary Financial Information Fourth Quarter 2017

(000s, except %)
% of Gross % of Gross % of Gross % of Gross % of Gross % of Gross % of Gross % of Gross % of Gross % of Gross
Loans¹ Loans¹ Amount Loans¹ Amount Loans¹ Amount Loans¹ Amount Loans¹ Amount Loans¹ Amount Loans¹ Loans¹ Amount Loans¹
Provision²Single-family residential mortgages $ 266 0.01% $ 1,165 0.04% $ 329 0.01% $ 131 0.00% $ 1,029 0.03% $ 1,006 0.03% $ 1,215 0.04% $ 667 0.02% $ 1,891 0.02% $ 3,917 0.03%Residential commercial mortgages³ (9) (0.03)% 6 0.02% (2) (0.00)% 21 0.03% 2 0.00% (128) (0.19)% 128 0.16% - - 16 0.01% 2 0.00%Non-residential commercial mortgages 2,584 0.99% 202 0.08% 341 0.07% 69 0.01% 45 0.01% (37) (0.01)% 293 0.07% (55) (0.01)% 3,196 0.31% 246 0.01%Credit card loans and lines of credit 485 0.55% 756 0.83% 773 0.80% 3,373 3.49% 1,164 1.26% 280 0.30% 519 0.56% 416 0.44% 5,387 1.53% 2,379 0.64%Other consumer retail loans 108 0.12% 114 0.13% (21) (0.02)% 325 0.33% 160 0.17% 215 0.24% 5 0.01% 152 0.19% 526 0.15% 532 0.14%Securitized single-family residential mortgages - - - - - - - - - - - - - - - - - - - -Securitized multi-unit residential mortgages - - - - - - - - - - - - - - - - - - - -Total individual provision 3,434 0.09% 2,243 0.06% 1,420 0.03% 3,919 0.08% 2,400 0.05% 1,336 0.03% 2,160 0.05% 1,180 0.03% 11,016 0.07% 7,076 0.04%Total collective provision - - (6,500) (0.17)% 1,000 0.02% 2,000 0.04% - - - - 600 0.01% 214 0.00% (3,500) (0.02)% 814 0.00%Total provision $ 3,434 0.09% $ (4,257) (0.11)% $ 2,420 0.05% $ 5,919 0.13% $ 2,400 0.05% $ 1,336 0.03% $ 2,760 0.06% $ 1,394 0.03% $ 7,516 0.05% $ 7,890 0.04%Net Write-Offs²Single-family residential mortgages $ 489 0.02% $ 506 0.02% $ 1,272 0.04% $ 200 0.01% $ 440 0.01% $ 664 0.02% $ 834 0.03% $ 1,149 0.04% $ 2,467 0.02% $ 3,087 0.02%Residential commercial mortgages³ 17 0.06% 4 0.02% (5) (0.01)% - - 2 0.00% - - - - - - 16 0.01% 2 0.00%Non-residential commercial mortgages 14 0.01% 33 0.01% 48 0.01% 1 0.00% (5) (0.00)% 100 0.02% 422 0.10% (2) (0.00)% 96 0.01% 515 0.03%Credit card loans and lines of credit 3,288 3.74% 637 0.70% 652 0.68% 1,133 1.17% 469 0.51% 397 0.42% 725 0.78% 337 0.36% 5,710 1.62% 1,928 0.52%Other consumer retail loans 138 0.15% 73 0.08% 233 0.22% 222 0.23% 48 0.05% 77 0.09% 69 0.08% 81 0.10% 666 0.18% 275 0.07%Securitized single-family residential mortgages - - - - - - - - - - - - - - - - - - - -Securitized multi-unit residential mortgages - - - - - - - - - - - - - - - - - - - -Net write-offs $ 3,946 0.11% $ 1,253 0.03% $ 2,200 0.05% $ 1,556 0.03% $ 954 0.02% $ 1,238 0.03% $ 2,050 0.05% $ 1,565 0.04% $ 8,955 0.06% $ 5,807 0.03%¹ Gross loans used in the calculation of total Company ratio includes securitized on-balance sheet loans.
² There were no individual provisions, allowances or net write-offs on securitized mortgages.
³ Residential commercial mortgages include non-securitized multi-unit residential mortgages and commercial mortgages secured by residential property types.
2016Q1 Fiscal Fiscal
Provision for Credit Losses and Net Write-Offs as a Percent of Gross Loans on an Annualized Basis2016
Q22016 20172017
Q4
Amount AmountAmount
2016Q4
2016Q3Q3 Q2 Q1
2017 2017 2017
Home Capital Group Inc. Supplementary Financial Information Fourth Quarter 2017
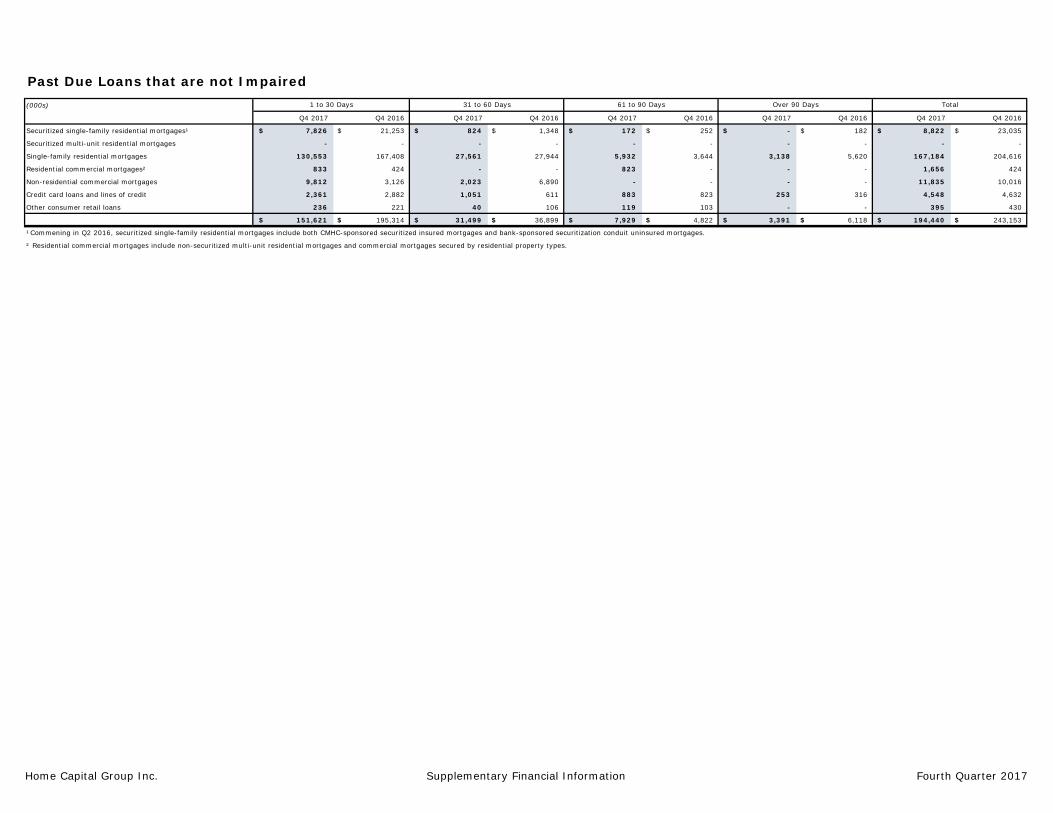
Past Due Loans that are not Impaired(000s)
Q4 2017 Q4 2016 Q4 2017 Q4 2016 Q4 2017 Q4 2016 Q4 2017 Q4 2016 Q4 2017 Q4 2016
Securitized single-family residential mortgages¹ $ 7,826 $ 21,253 $ 824 $ 1,348 $ 172 $ 252 $ - $ 182 $ 8,822 $ 23,035
Securitized multi-unit residential mortgages - - - - - - - - - -
Single-family residential mortgages 130,553 167,408 27,561 27,944 5,932 3,644 3,138 5,620 167,184 204,616
Residential commercial mortgages² 833 424 - - 823 - - - 1,656 424
Non-residential commercial mortgages 9,812 3,126 2,023 6,890 - - - - 11,835 10,016
Credit card loans and lines of credit 2,361 2,882 1,051 611 883 823 253 316 4,548 4,632
Other consumer retail loans 236 221 40 106 119 103 - - 395 430
$ 151,621 $ 195,314 $ 31,499 $ 36,899 $ 7,929 $ 4,822 $ 3,391 $ 6,118 $ 194,440 $ 243,153
¹ Commening in Q2 2016, securitized single-family residential mortgages include both CMHC-sponsored securitized insured mortgages and bank-sponsored securitization conduit uninsured mortgages.
² Residential commercial mortgages include non-securitized multi-unit residential mortgages and commercial mortgages secured by residential property types.
1 to 30 Days 31 to 60 Days 61 to 90 Days Over 90 Days Total
Home Capital Group Inc. Supplementary Financial Information Fourth Quarter 2017
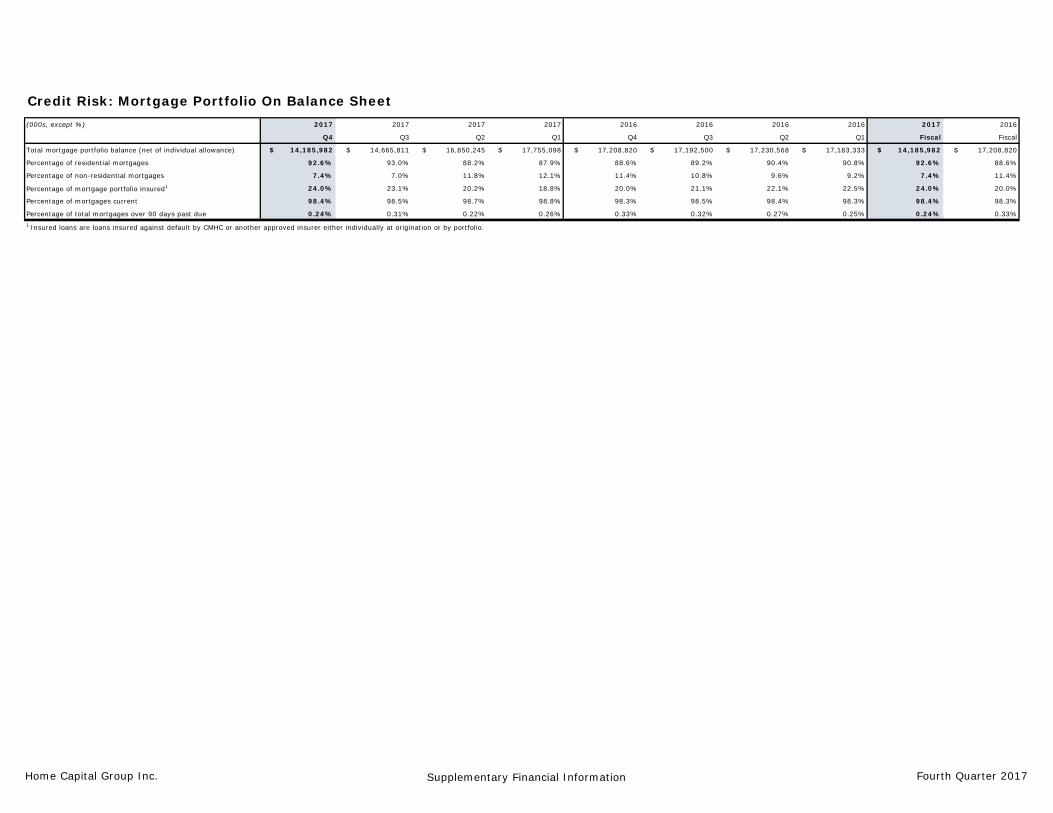
Credit Risk: Mortgage Portfolio On Balance Sheet(000s, except %) 2017 2017 2017 2017 2016 2016 2016 2016 2017 2016
Q4 Q3 Q2 Q1 Q4 Q3 Q2 Q1 Fiscal Fiscal
Total mortgage portfolio balance (net of individual allowance) $ 14,185,982 $ 14,665,811 $ 16,850,245 $ 17,755,098 $ 17,208,820 $ 17,192,500 $ 17,230,568 $ 17,183,333 $ 14,185,982 $ 17,208,820
Percentage of residential mortgages 92.6% 93.0% 88.2% 87.9% 88.6% 89.2% 90.4% 90.8% 92.6% 88.6%
Percentage of non-residential mortgages 7.4% 7.0% 11.8% 12.1% 11.4% 10.8% 9.6% 9.2% 7.4% 11.4%
Percentage of mortgage portfolio insured1 24.0% 23.1% 20.2% 18.8% 20.0% 21.1% 22.1% 22.5% 24.0% 20.0%
Percentage of mortgages current 98.4% 98.5% 98.7% 98.8% 98.3% 98.5% 98.4% 98.3% 98.4% 98.3%
Percentage of total mortgages over 90 days past due 0.24% 0.31% 0.22% 0.26% 0.33% 0.32% 0.27% 0.25% 0.24% 0.33%1 Insured loans are loans insured against default by CMHC or another approved insurer either individually at origination or by portfolio.
Home Capital Group Inc. Supplementary Financial Information Fourth Quarter 2017
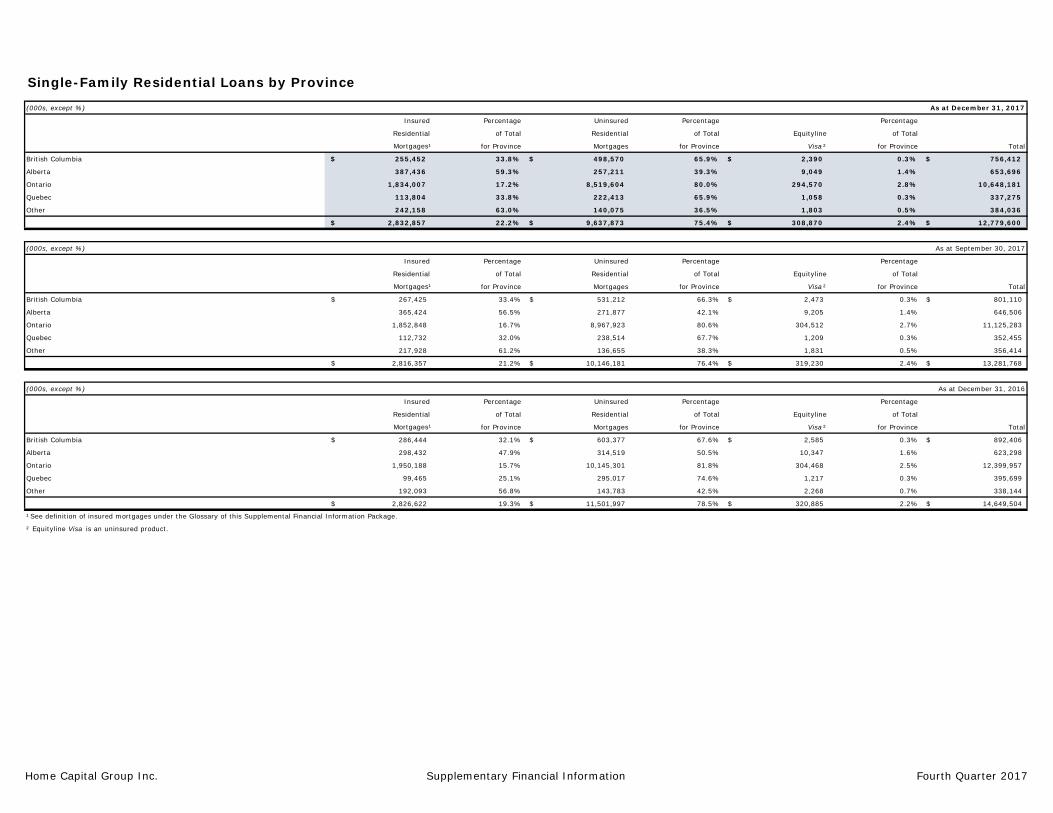
Single-Family Residential Loans by Province
(000s, except %) As at December 31, 2017
Insured Percentage Uninsured Percentage Percentage
Residential of Total Residential of Total Equityline of Total
Mortgages¹ for Province Mortgages for Province Visa ² for Province Total
British Columbia $ 255,452 33.8% $ 498,570 65.9% $ 2,390 0.3% $ 756,412
Alberta 387,436 59.3% 257,211 39.3% 9,049 1.4% 653,696
Ontario 1,834,007 17.2% 8,519,604 80.0% 294,570 2.8% 10,648,181
Quebec 113,804 33.8% 222,413 65.9% 1,058 0.3% 337,275
Other 242,158 63.0% 140,075 36.5% 1,803 0.5% 384,036
$ 2,832,857 22.2% $ 9,637,873 75.4% $ 308,870 2.4% $ 12,779,600
(000s, except %) As at September 30, 2017
Insured Percentage Uninsured Percentage Percentage
Residential of Total Residential of Total Equityline of Total
Mortgages¹ for Province Mortgages for Province Visa ² for Province Total
British Columbia $ 267,425 33.4% $ 531,212 66.3% $ 2,473 0.3% $ 801,110
Alberta 365,424 56.5% 271,877 42.1% 9,205 1.4% 646,506
Ontario 1,852,848 16.7% 8,967,923 80.6% 304,512 2.7% 11,125,283
Quebec 112,732 32.0% 238,514 67.7% 1,209 0.3% 352,455
Other 217,928 61.2% 136,655 38.3% 1,831 0.5% 356,414
$ 2,816,357 21.2% $ 10,146,181 76.4% $ 319,230 2.4% $ 13,281,768
(000s, except %) As at December 31, 2016
Insured Percentage Uninsured Percentage Percentage
Residential of Total Residential of Total Equityline of Total
Mortgages¹ for Province Mortgages for Province Visa ² for Province Total
British Columbia $ 286,444 32.1% $ 603,377 67.6% $ 2,585 0.3% $ 892,406
Alberta 298,432 47.9% 314,519 50.5% 10,347 1.6% 623,298
Ontario 1,950,188 15.7% 10,145,301 81.8% 304,468 2.5% 12,399,957
Quebec 99,465 25.1% 295,017 74.6% 1,217 0.3% 395,699
Other 192,093 56.8% 143,783 42.5% 2,268 0.7% 338,144
$ 2,826,622 19.3% $ 11,501,997 78.5% $ 320,885 2.2% $ 14,649,504
¹ See definition of insured mortgages under the Glossary of this Supplemental Financial Information Package.
² Equityline Visa is an uninsured product.
Home Capital Group Inc. Supplementary Financial Information Fourth Quarter 2017
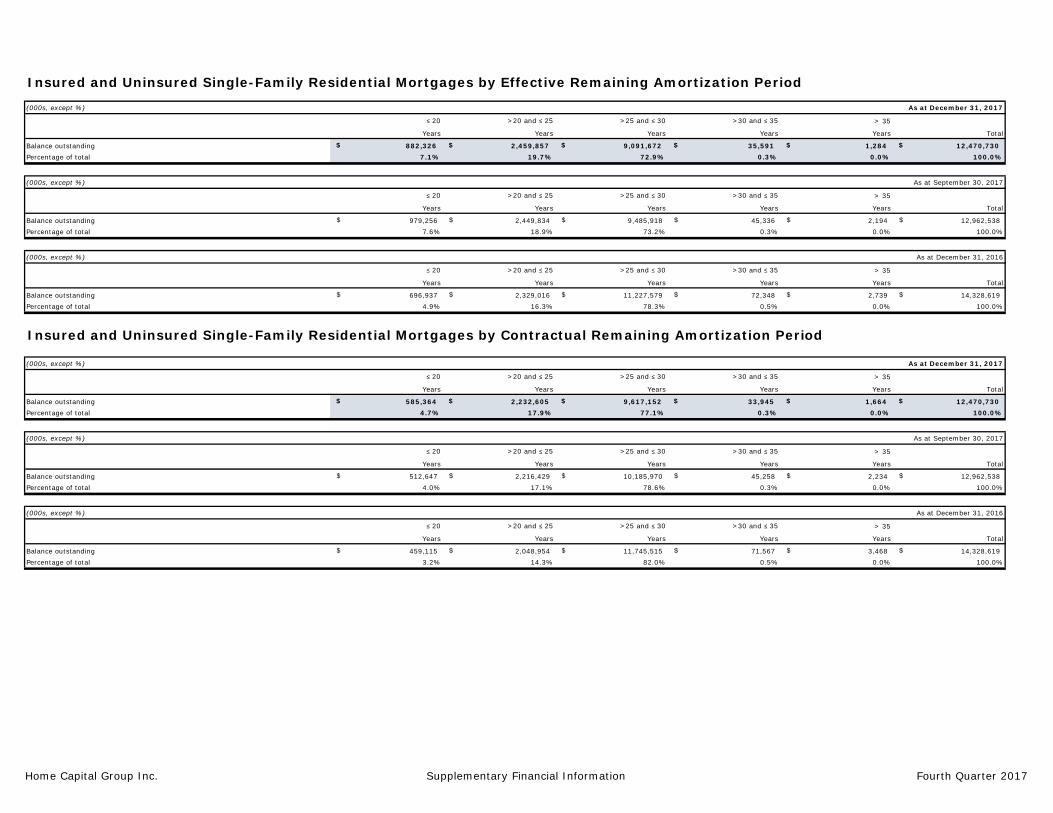
Insured and Uninsured Single-Family Residential Mortgages by Effective Remaining Amortization Period
(000s, except %) As at December 31, 2017
≤ 20 >20 and ≤ 25 >25 and ≤ 30 >30 and ≤ 35 > 35
Years Years Years Years Years Total
Balance outstanding $ 882,326 $ 2,459,857 $ 9,091,672 $ 35,591 $ 1,284 $ 12,470,730 Percentage of total 7.1% 19.7% 72.9% 0.3% 0.0% 100.0%
(000s, except %) As at September 30, 2017
≤ 20 >20 and ≤ 25 >25 and ≤ 30 >30 and ≤ 35 > 35
Years Years Years Years Years Total
Balance outstanding $ 979,256 $ 2,449,834 $ 9,485,918 $ 45,336 $ 2,194 $ 12,962,538 Percentage of total 7.6% 18.9% 73.2% 0.3% 0.0% 100.0%
(000s, except %) As at December 31, 2016
≤ 20 >20 and ≤ 25 >25 and ≤ 30 >30 and ≤ 35 > 35
Years Years Years Years Years Total
Balance outstanding $ 696,937 $ 2,329,016 $ 11,227,579 $ 72,348 $ 2,739 $ 14,328,619 Percentage of total 4.9% 16.3% 78.3% 0.5% 0.0% 100.0%
Insured and Uninsured Single-Family Residential Mortgages by Contractual Remaining Amortization Period
(000s, except %) As at December 31, 2017
≤ 20 >20 and ≤ 25 >25 and ≤ 30 >30 and ≤ 35 > 35
Years Years Years Years Years Total
Balance outstanding $ 585,364 $ 2,232,605 $ 9,617,152 $ 33,945 $ 1,664 $ 12,470,730 Percentage of total 4.7% 17.9% 77.1% 0.3% 0.0% 100.0%
(000s, except %) As at September 30, 2017
≤ 20 >20 and ≤ 25 >25 and ≤ 30 >30 and ≤ 35 > 35
Years Years Years Years Years Total
Balance outstanding $ 512,647 $ 2,216,429 $ 10,185,970 $ 45,258 $ 2,234 $ 12,962,538 Percentage of total 4.0% 17.1% 78.6% 0.3% 0.0% 100.0%
(000s, except %) As at December 31, 2016
≤ 20 >20 and ≤ 25 >25 and ≤ 30 >30 and ≤ 35 > 35
Years Years Years Years Years Total
Balance outstanding $ 459,115 $ 2,048,954 $ 11,745,515 $ 71,567 $ 3,468 $ 14,328,619 Percentage of total 3.2% 14.3% 82.0% 0.5% 0.0% 100.0%
Home Capital Group Inc. Supplementary Financial Information Fourth Quarter 2017

Weighted-Average Loan to Value Ratios for Uninsured Single-Family Residential Mortgages Originated During the Period
For the three months ended For the year ended
December 31 September 30 December 31 December 31 December 31
2017 2017 2016 2017 2016
Uninsured Residential Equityline Uninsured Residential Equityline Uninsured Residential Equityline Uninsured Residential Equityline Uninsured Residential Equityline
Mortgages¹ Visa ¹ Mortgages¹ Visa ¹ Mortgages¹ Visa ¹ Mortgages¹ Visa ¹ Mortgages¹ Visa ¹
LTV LTV LTV LTV LTV LTV LTV LTV LTV LTV
British Columbia 63.2% 51.0% 65.1% 42.3% 63.1% 56.8% 63.0% 47.1% 63.6% 52.4%
Alberta 65.7% 74.0% 64.1% - 67.4% 32.3% 68.8% 56.3% 69.4% 44.1%
Ontario 69.7% 57.3% 69.2% 55.2% 71.9% 63.3% 70.9% 56.6% 72.9% 63.9%
Quebec 69.4% - 72.8% - 70.3% 64.0% 69.2% 24.5% 69.3% 65.3%
Other 69.3% 49.6% 70.9% - 72.7% 67.6% 69.6% 58.6% 72.4% 58.9%
Total 69.2% 57.2% 68.9% 54.8% 71.4% 63.2% 70.3% 56.5% 72.2% 63.8%
¹ Weighted-average LTV is calculated by dividing the sum of the products of LTVs and loan balances by the sum of the loan balances. LTV's are calculated using appraised values at the time of origination.
Home Capital Group Inc. Supplementary Financial Information Fourth Quarter 2017

Weighted-Average Loan to Value Ratios for Uninsured Residential Mortgages
As at As at
December 31 December 31
2017 2016
Weighted-Average Weighted-Average
Current LTV¹ Current LTV¹
75% 65% 75% 65%
British Columbia 49.6% 99.5% 90.0% 52.0% 98.4% 89.1%
Alberta 63.9% 84.9% 51.3% 65.0% 81.1% 46.8%
Ontario 55.2% 96.2% 74.2% 61.2% 85.7% 59.0%
Quebec 61.4% 94.8% 60.9% 62.8% 92.1% 53.4%
Other 61.7% 87.7% 53.9% 62.1% 86.4% 54.5%
Total 55.3% 95.9% 73.8% 60.9% 86.4% 60.1%
¹ Weighted-average LTV is calculated by dividing the sum of the products of LTVs and loan balances by the sum of the loan balances.
Percentage of Total Value of Outstanding Mortgages with Current LTV less than or Equal to
Percentage of Total Value of Outstanding Mortgages with Current LTV less than or Equal to
Home Capital Group Inc. Supplementary Financial Information Fourth Quarter 2017
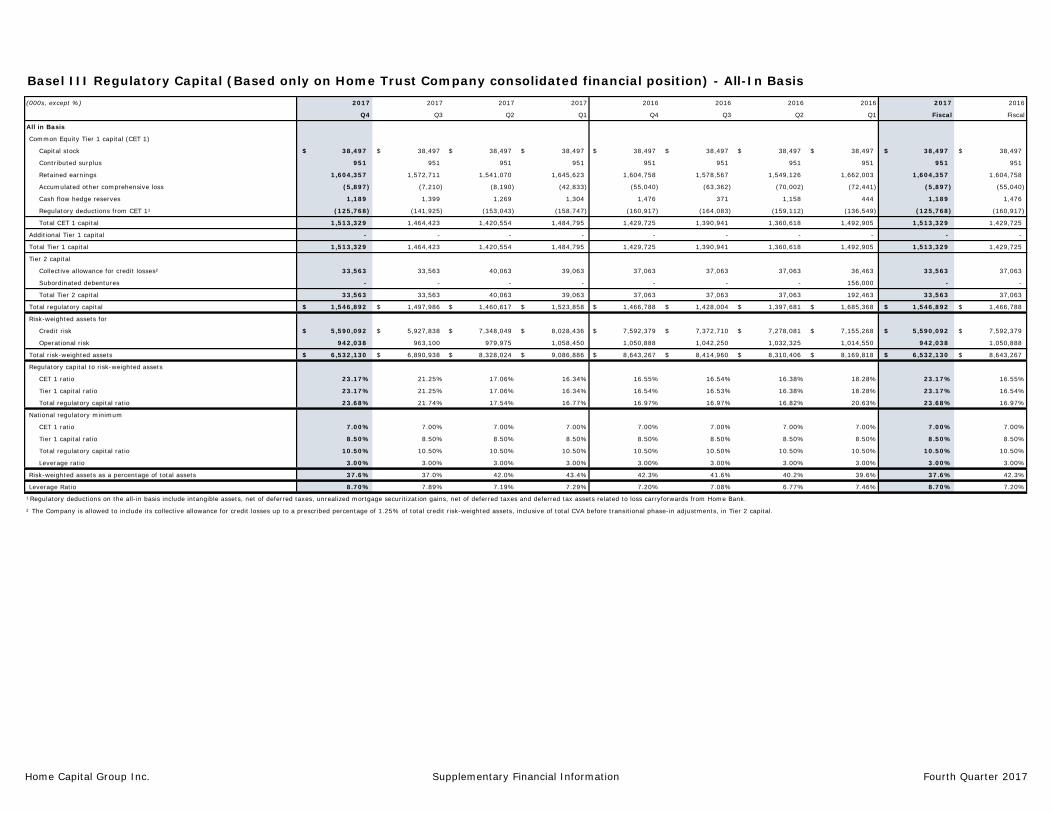
Basel III Regulatory Capital (Based only on Home Trust Company consolidated financial position) - All-In Basis(000s, except %) 2017 2017 2017 2017 2016 2016 2016 2016 2017 2016
Q4 Q3 Q2 Q1 Q4 Q3 Q2 Q1 Fiscal Fiscal
All in Basis
Common Equity Tier 1 capital (CET 1)
Capital stock $ 38,497 $ 38,497 $ 38,497 $ 38,497 $ 38,497 $ 38,497 $ 38,497 $ 38,497 $ 38,497 $ 38,497
Contributed surplus 951 951 951 951 951 951 951 951 951 951
Retained earnings 1,604,357 1,572,711 1,541,070 1,645,623 1,604,758 1,578,567 1,549,126 1,662,003 1,604,357 1,604,758
Accumulated other comprehensive loss (5,897) (7,210) (8,190) (42,833) (55,040) (63,362) (70,002) (72,441) (5,897) (55,040)
Cash flow hedge reserves 1,189 1,399 1,269 1,304 1,476 371 1,158 444 1,189 1,476
Regulatory deductions from CET 1¹ (125,768) (141,925) (153,043) (158,747) (160,917) (164,083) (159,112) (136,549) (125,768) (160,917)
Total CET 1 capital 1,513,329 1,464,423 1,420,554 1,484,795 1,429,725 1,390,941 1,360,618 1,492,905 1,513,329 1,429,725
Additional Tier 1 capital - - - - - - - - - -
Total Tier 1 capital 1,513,329 1,464,423 1,420,554 1,484,795 1,429,725 1,390,941 1,360,618 1,492,905 1,513,329 1,429,725
Tier 2 capital
Collective allowance for credit losses² 33,563 33,563 40,063 39,063 37,063 37,063 37,063 36,463 33,563 37,063
Subordinated debentures - - - - - - - 156,000 - -
Total Tier 2 capital 33,563 33,563 40,063 39,063 37,063 37,063 37,063 192,463 33,563 37,063
Total regulatory capital $ 1,546,892 $ 1,497,986 $ 1,460,617 $ 1,523,858 $ 1,466,788 $ 1,428,004 $ 1,397,681 $ 1,685,368 $ 1,546,892 $ 1,466,788
Risk-weighted assets for
Credit risk $ 5,590,092 $ 5,927,838 $ 7,348,049 $ 8,028,436 $ 7,592,379 $ 7,372,710 $ 7,278,081 $ 7,155,268 $ 5,590,092 $ 7,592,379
Operational risk 942,038 963,100 979,975 1,058,450 1,050,888 1,042,250 1,032,325 1,014,550 942,038 1,050,888
Total risk-weighted assets $ 6,532,130 $ 6,890,938 $ 8,328,024 $ 9,086,886 $ 8,643,267 $ 8,414,960 $ 8,310,406 $ 8,169,818 $ 6,532,130 $ 8,643,267
Regulatory capital to risk-weighted assets
CET 1 ratio 23.17% 21.25% 17.06% 16.34% 16.55% 16.54% 16.38% 18.28% 23.17% 16.55%
Tier 1 capital ratio 23.17% 21.25% 17.06% 16.34% 16.54% 16.53% 16.38% 18.28% 23.17% 16.54%
Total regulatory capital ratio 23.68% 21.74% 17.54% 16.77% 16.97% 16.97% 16.82% 20.63% 23.68% 16.97%
National regulatory minimum
CET 1 ratio 7.00% 7.00% 7.00% 7.00% 7.00% 7.00% 7.00% 7.00% 7.00% 7.00%
Tier 1 capital ratio 8.50% 8.50% 8.50% 8.50% 8.50% 8.50% 8.50% 8.50% 8.50% 8.50%
Total regulatory capital ratio 10.50% 10.50% 10.50% 10.50% 10.50% 10.50% 10.50% 10.50% 10.50% 10.50%
Leverage ratio 3.00% 3.00% 3.00% 3.00% 3.00% 3.00% 3.00% 3.00% 3.00% 3.00%
Risk-weighted assets as a percentage of total assets 37.6% 37.0% 42.0% 43.4% 42.3% 41.6% 40.2% 39.6% 37.6% 42.3%
Leverage Ratio 8.70% 7.89% 7.19% 7.29% 7.20% 7.08% 6.77% 7.46% 8.70% 7.20%
¹ Regulatory deductions on the all-in basis include intangible assets, net of deferred taxes, unrealized mortgage securitization gains, net of deferred taxes and deferred tax assets related to loss carryforwards from Home Bank.
² The Company is allowed to include its collective allowance for credit losses up to a prescribed percentage of 1.25% of total credit risk-weighted assets, inclusive of total CVA before transitional phase-in adjustments, in Tier 2 capital.
Home Capital Group Inc. Supplementary Financial Information Fourth Quarter 2017
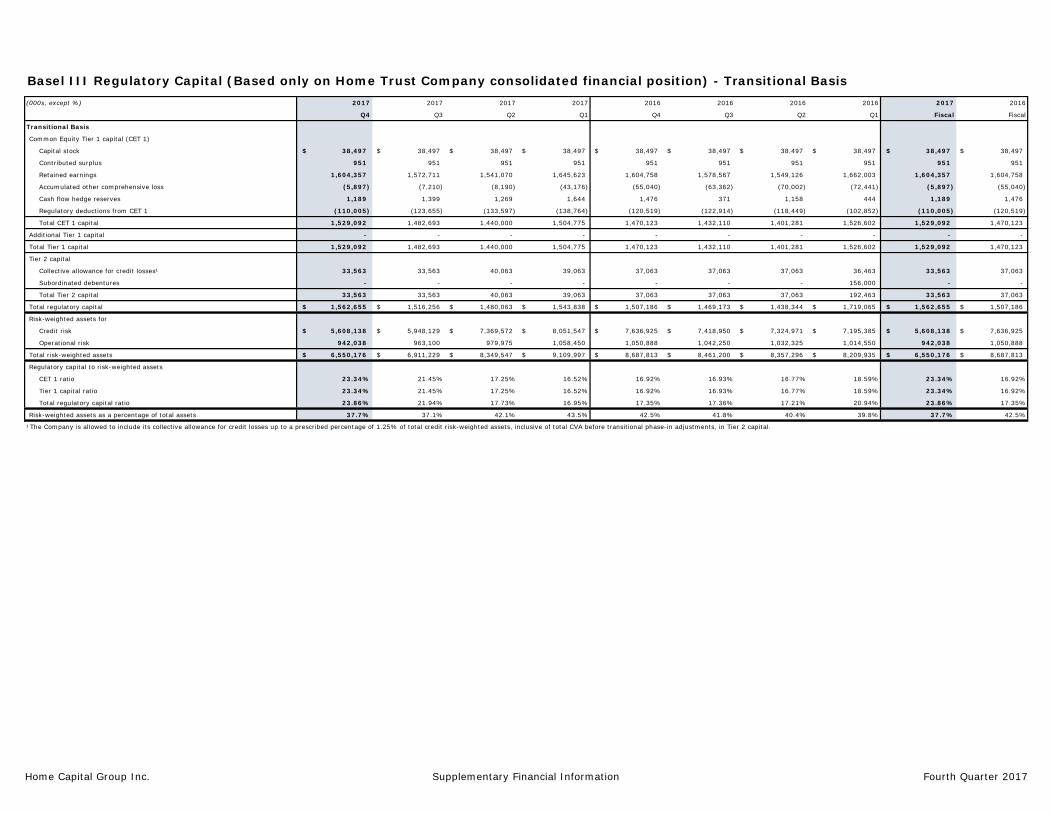
Basel III Regulatory Capital (Based only on Home Trust Company consolidated financial position) - Transitional Basis(000s, except %) 2017 2017 2017 2017 2016 2016 2016 2016 2017 2016
Q4 Q3 Q2 Q1 Q4 Q3 Q2 Q1 Fiscal Fiscal
Transitional Basis
Common Equity Tier 1 capital (CET 1)
Capital stock $ 38,497 $ 38,497 $ 38,497 $ 38,497 $ 38,497 $ 38,497 $ 38,497 $ 38,497 $ 38,497 $ 38,497
Contributed surplus 951 951 951 951 951 951 951 951 951 951
Retained earnings 1,604,357 1,572,711 1,541,070 1,645,623 1,604,758 1,578,567 1,549,126 1,662,003 1,604,357 1,604,758
Accumulated other comprehensive loss (5,897) (7,210) (8,190) (43,176) (55,040) (63,362) (70,002) (72,441) (5,897) (55,040)
Cash flow hedge reserves 1,189 1,399 1,269 1,644 1,476 371 1,158 444 1,189 1,476
Regulatory deductions from CET 1 (110,005) (123,655) (133,597) (138,764) (120,519) (122,914) (118,449) (102,852) (110,005) (120,519)
Total CET 1 capital 1,529,092 1,482,693 1,440,000 1,504,775 1,470,123 1,432,110 1,401,281 1,526,602 1,529,092 1,470,123
Additional Tier 1 capital - - - - - - - - - -
Total Tier 1 capital 1,529,092 1,482,693 1,440,000 1,504,775 1,470,123 1,432,110 1,401,281 1,526,602 1,529,092 1,470,123
Tier 2 capital
Collective allowance for credit losses¹ 33,563 33,563 40,063 39,063 37,063 37,063 37,063 36,463 33,563 37,063
Subordinated debentures - - - - - - - 156,000 - -
Total Tier 2 capital 33,563 33,563 40,063 39,063 37,063 37,063 37,063 192,463 33,563 37,063
Total regulatory capital $ 1,562,655 $ 1,516,256 $ 1,480,063 $ 1,543,838 $ 1,507,186 $ 1,469,173 $ 1,438,344 $ 1,719,065 $ 1,562,655 $ 1,507,186
Risk-weighted assets for
Credit risk $ 5,608,138 $ 5,948,129 $ 7,369,572 $ 8,051,547 $ 7,636,925 $ 7,418,950 $ 7,324,971 $ 7,195,385 $ 5,608,138 $ 7,636,925
Operational risk 942,038 963,100 979,975 1,058,450 1,050,888 1,042,250 1,032,325 1,014,550 942,038 1,050,888
Total risk-weighted assets $ 6,550,176 $ 6,911,229 $ 8,349,547 $ 9,109,997 $ 8,687,813 $ 8,461,200 $ 8,357,296 $ 8,209,935 $ 6,550,176 $ 8,687,813
Regulatory capital to risk-weighted assets
CET 1 ratio 23.34% 21.45% 17.25% 16.52% 16.92% 16.93% 16.77% 18.59% 23.34% 16.92%
Tier 1 capital ratio 23.34% 21.45% 17.25% 16.52% 16.92% 16.93% 16.77% 18.59% 23.34% 16.92%
Total regulatory capital ratio 23.86% 21.94% 17.73% 16.95% 17.35% 17.36% 17.21% 20.94% 23.86% 17.35%
Risk-weighted assets as a percentage of total assets 37.7% 37.1% 42.1% 43.5% 42.5% 41.8% 40.4% 39.8% 37.7% 42.5%
¹ The Company is allowed to include its collective allowance for credit losses up to a prescribed percentage of 1.25% of total credit risk-weighted assets, inclusive of total CVA before transitional phase-in adjustments, in Tier 2 capital.
Home Capital Group Inc. Supplementary Financial Information Fourth Quarter 2017
Non-GAAP Measures
Allowance as a Percentage of Gross Loans Provision as a Percentage of Gross Loans (PCL Ratio)
Allowance as a percentage of gross loans is calculated as the total allowance divided by the gross on-balance sheet loans outstanding, which includes all on-balance sheet loans, except for loans held for sale.
The PCL ratio is calculated as the total individual and collective provision expense divided by the gross on-balance sheet loans outstanding, which includes all on-balance sheet loans, except for loans held for sale.
Common Equity Tier 1, Tier 1 and Total Capital Ratios Provision as a Percentage of Gross Uninsured Loans
The capital ratios provided are those of the Company’s wholly owned subsidiary Home Trust Company. The calculations are in accordance with guidelines issued by OSFI.
The provision as a percentage of gross uninsured loans ratio is calculated as the total individual and collective provision expense divided by the gross on-balance sheet uninsured loans outstanding.
Dividend Payout Ratio Return on Assets (ROA)
Dividend payout ratio is a measure of the proportion of a Company’s earnings that is paid to shareholders in the form of dividends. The Company calculates its dividend payout ratio as the amount of dividends per share as a percentage of diluted earnings per share.
Return on assets is a profitability measure that presents the annualized net income as a percentage of the average total assets for the period deployed to earn the income.
Efficiency Ratio Return on Shareholders’ Equity (ROE)
Management uses the efficiency ratio as a measure of the Company’s efficiency in generating revenue. This ratio represents non-interest expenses as a percentage of total revenue, net of interest expense. The Company also looks at the same ratio on a taxable equivalent basis and will include this adjustment in arriving at the efficiency ratio, on a taxable equivalent basis. A lower ratio indicates better efficiency.
Return on equity is a profitability measure that presents the net income available to common shareholders as a percentage of the capital deployed to earn the income. The Company calculates its return on shareholders’ equity using average common shareholders’ equity, including all components of shareholders’ equity.
Leverage Ratio Risk-Weighted Assets (RWA)The leverage ratio provided is that of the Company’s wholly owned subsidiary Home Trust Company. The calculations are in accordance with guidelines issued by OSFI. The leverage ratio is defined as the Capital Measure divided by the Exposure Measure, with the ratio expressed as a percentage. The Capital Measure is the all-in Tier 1 capital of Home Trust. The Exposure Measure consists of on-balance sheet, derivative, securities financing transactions and off-balance sheet exposures.
The risk-weighted assets reported are those of the Company’s wholly owned subsidiary Home Trust Company. The calculations are in accordance with guidelines issued by OSFI.
Liquid Assets Taxable Equivalent Basis (TEB)Liquid assets are unencumbered high quality assets for which there is a broad and active secondary market available to the Company to sell these assets without incurring a substantial discount. Liquid assets are a dependable source of cash used by the Company when it experiences short-term funding shortfalls.
Most banks and trust companies analyze and discuss their financial results on a taxable equivalent basis (TEB) to provide uniform measurement and comparison of net interest income. Net interest income (as presented in the consolidated statements of income (loss)) includes tax-exempt income principally from preferred and common equity securities. The adjustment to TEB increases income and the provision for income taxes to what they would have been had the income from tax-exempt securities been taxed at the statutory tax rate.
Market Capitalization Total Assets under Administration (AUA)Market capitalization is calculated as the closing price of the Company’s common shares multiplied by the number of common shares of the Company outstanding.
Total assets under administration refers to all on-balance sheet assets plus all off-balance sheet loans that qualify for derecognition under IFRS.
Net Interest Margin (Non-TEB) Total Loans under Administration (LUA)Net interest margin is a measure of profitability of assets. Net interest margin is calculated by taking net interest income divided by average total assets.
Total loans under administration refers to all on-balance sheet loans plus all off-balance sheet loans that qualify for derecognition under IFRS.
Net Interest Margin (TEB) Total Revenue
Net interest margin is a measure of profitability of assets. Net interest margin (TEB) is calculated by taking net interest income, on a taxable equivalent basis, divided by average total assets.
Total revenue is a measure of the revenues, net of interest expense, earned by the Company before non-interest expenses, provision for credit losses and income taxes. Total revenue is the sum of interest and dividend income, net of interest expense, and non-interest income.
Net Non-Performing Loans as a Percentage of Gross Loans (NPL Ratio)
The NPL ratio is calculated as the total net non-performing loans divided by the gross on-balance sheet loans, which includes all on-balance sheet loans, except for loans held for sale.
The Company uses a number of financial measures to assess its performance. Some of these measures are not calculated in accordance with GAAP, are not defined by GAAP, and do not have standardized meanings that would ensure consistency and comparability between companies using these measures. The non-GAAP measures used are defined as follows:
Home Capital Group Inc. Supplementary Financial Information Fourth Quarter 2017

Glossary of Terms
Assets or Loans under Administration refer to assets or loans administered by a financial institution that are beneficially owned by clients and therefore not reported on the balance sheet of the administering financial institution, plus all assets or loans beneficially owned by the Company and carried on the balance sheets.
Individual Allowances (previously referred to as specific allowances) reduce the carrying value of individual credit assets to the amount expected to be recovered if there is evidence of deterioration in credit quality.
Average Earning Assets represents the monthly average balance of deposits with other banks and loans and securities over a relevant period.
Insured Loans are loans insured against default by CMHC or another approved insurer either individually at origination or by portfolio. The Company’s insured lending includes single-family homes and multi-unit residential properties.
Basis Point is one-hundredth of a percentage point. Net Interest Income is comprised of earnings on assets, such as loans and securities, including interest and dividend income, less interest expense paid on liabilities, such as deposits.
Canada Deposit Insurance Corporation (CDIC) is a Canadian federal Crown corporation created to protect qualifying deposits made with member financial institutions in case of their failure.
Notional Amount refers to the principal used to calculate interest and other payments under derivative contracts. The principal does not change hands under the terms of a derivative contract.
Collective Allowance (previously referred to as the General Allowance) is established for incurred losses inherent in the portfolio that are not presently identifiable on a loan-by-loan basis and reflects the relative risk of the various loan portfolios that the Company manages.
Office of the Superintendent of Financial Institutions Canada (OSFI) is the government agency responsible for regulation and supervision of banks, insurance companies, trust companies, loan companies and pension plans in Canada.
Derivatives are a contract between two parties, which requires little or no initial investment and where payments between the parties are dependent upon the movements in price of an underlying instrument, index or financial rate. Examples of derivatives include swaps, options, forward rate agreements and futures. The notional amount of the derivative is the contract amount used as a reference point to calculate the payments to be exchanged between the two parties, and the notional amount itself is generally not exchanged by the parties.
Provision for Credit Losses is a charge to income that represents an amount deemed adequate by management to fully provide for impairment in a portfolio of loans and other credit instruments, given the composition of the portfolio, the probability that default has occurred, the economic environment and the allowance for credit losses already established.
Forwards used by the Company are contractual agreements to either buy or sell a specified amount of an interest-rate-sensitive financial instrument or security at a specific price and date in the future. Forwards are customized contracts transacted in the over-the-counter market.
Securitization is the practice of selling pools of contractual debts, such as residential or commercial mortgages, to third parties.
Hedging is a risk management technique used by the Company to neutralize, manage or offset interest rate, equity, or credit exposures arising from normal banking activities.
Swaps are contractual agreements between two parties to exchange a series of cash flows. The Company uses interest rate swaps and total return swaps. An interest rate swap is an agreement where counterparties generally exchange fixed-rate and floating-rate interest payments based on a notional value in a single currency. A total return swap is an agreement in which one party makes payments based on a set rate, either fixed or variable, while the other party makes payments based on the return of an underlying asset, which includes both the income it generates and any capital gains.
Impaired or Non-performing Loans are loans for which there is no longer reasonable assurance of the timely collection of principal or interest.
Home Capital Group Inc. Supplementary Financial Information Fourth Quarter 2017
Acronyms
ALCO – Asset/Liability Committee
AOCI – Accumulated Other Comprehensive Income
CDIC – Canada Deposit Insurance Corporation
CMB – Canada Mortgage Bond
CMHC – Canada Mortgage and Housing Corporation
COSO – Committee of Sponsoring Organizations of the Treadway Commission
CVA - Credit Valuation Adjustment
ERM – Enterprise Risk Management
GAAP – Generally Accepted Accounting Principles
GIC – Guaranteed Investment Certificate
HELOC – Home Equity Line of Credit
IASB – International Accounting Standards Board
IFRS – International Financial Reporting Standards
LTV – Loan to Value (ratio expressed as a percentage)
MBS – Mortgage-Backed Security
MD&A – Management’s Discussion and Analysis
NCCF – Net Cumulative Cash Flow
NHA – National Housing Act
OCI – Other Comprehensive Income
OSFI – Office of the Superintendent of Financial Institutions Canada
TEB – Taxable Equivalent Basis
Home Capital Group Inc. Supplementary Financial Information Fourth Quarter 2017
Related Documents