Supplementary Figure 1. Sequencing depth (A) and nucleotide composition of the Opisthorchis viverrini genome (B) and coding domains (C). A. A k-mer (17-base pair) frequency analysis of O. viverrini genomic sequence data produced from the 170 bp, 500 bp, 800 bp or 170, 500 + 800 bp insert libraries highlighting the read depth and coverage homogeneity for genomic DNA libraries used for genome assembly. B. The GC content of trematode genomes. The GC content of O. viverrini, Clonorchis sinensis, Schistosoma haematobium, S. mansoni and S. japonicum in 10 kilobase, non-overlapping sliding windows across their genomes. The x-axis indicates GC content, and the y-axis shows the sequencing depth frequency. C. The GC content of predicted coding domains encoded in trematode genomes. The GC content of O. viverrini, C. sinensis, S. haematobium, S. mansoni and S. japonicum in 100 bp, non-overlapping sliding windows across their coding domains. The x-axis indicates GC content, and the y-axis shows the sequencing depth frequency.

Welcome message from author
This document is posted to help you gain knowledge. Please leave a comment to let me know what you think about it! Share it to your friends and learn new things together.
Transcript
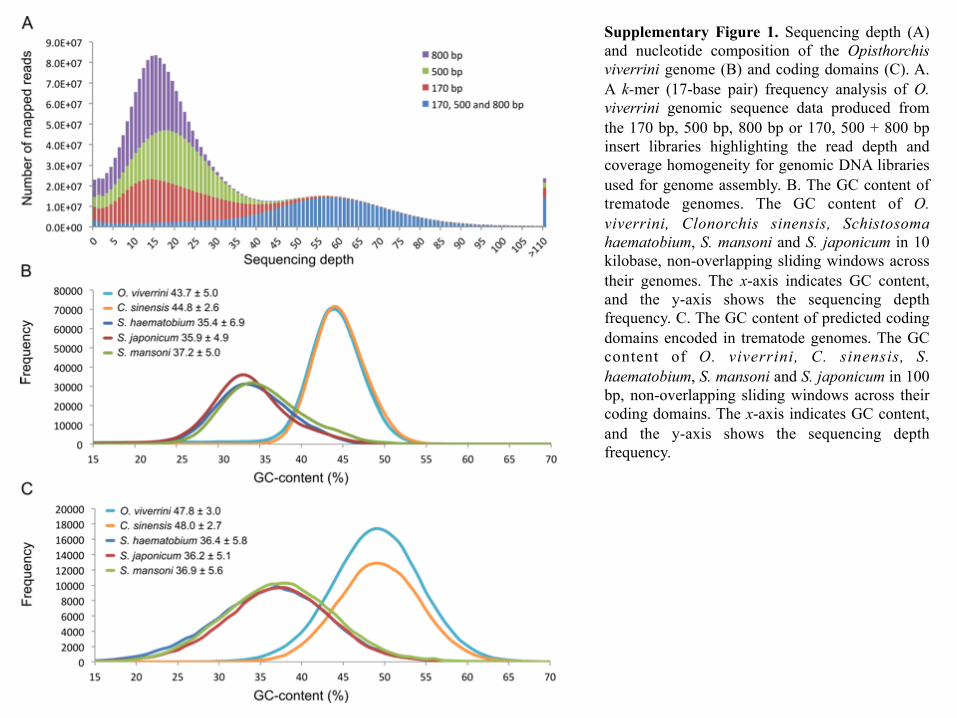
Supplementary Figure 1. Sequencing depth (A) and nucleotide composition of the Opisthorchis viverrini genome (B) and coding domains (C). A. A k-mer (17-base pair) frequency analysis of O. viverrini genomic sequence data produced from the 170 bp, 500 bp, 800 bp or 170, 500 + 800 bp insert libraries highlighting the read depth and coverage homogeneity for genomic DNA libraries used for genome assembly. B. The GC content of trematode genomes. The GC content of O. viverrini, Clonorchis sinensis, Schistosoma haematobium, S. mansoni and S. japonicum in 10 kilobase, non-overlapping sliding windows across their genomes. The x-axis indicates GC content, and the y-axis shows the sequencing depth frequency. C. The GC content of predicted coding domains encoded in trematode genomes. The GC content of O. viverrini, C. sinensis, S. haematobium, S. mansoni and S. japonicum in 100 bp, non-overlapping sliding windows across their coding domains. The x-axis indicates GC content, and the y-axis shows the sequencing depth frequency.
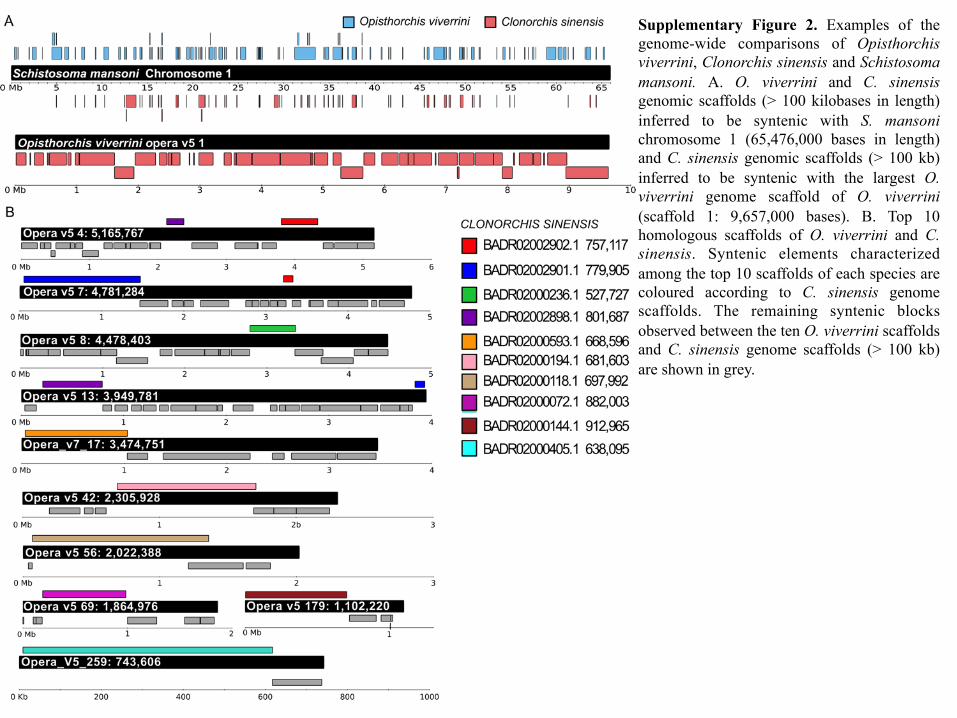
Supplementary Figure 2. Examples of the genome-wide comparisons of Opisthorchis viverrini, Clonorchis sinensis and Schistosoma mansoni. A. O. viverrini and C. sinensis genomic scaffolds (> 100 kilobases in length) inferred to be syntenic with S. mansoni chromosome 1 (65,476,000 bases in length) and C. sinensis genomic scaffolds (> 100 kb) inferred to be syntenic with the largest O. viverrini genome scaffold of O. viverrini (scaffold 1: 9,657,000 bases). B. Top 10 homologous scaffolds of O. viverrini and C. sinensis. Syntenic elements characterized among the top 10 scaffolds of each species are coloured according to C. sinensis genome scaffolds. The remaining syntenic blocks observed between the ten O. viverrini scaffolds and C. sinensis genome scaffolds (> 100 kb) are shown in grey.

Supplementary Figure 3. A. Correlation between the frequency of transfer RNA (tRNA) copies and predicted use of amino acid residues in the Opisthorchis viverrini and Clonorchis sinensis genomes. B. Evidence of amino acid usage in the genomes of flatworms. Amino acid residue frequency within the predicted proteomes of opisthorchiid (Clonorchis sinensis and Opisthorchis viverrini) and schistosomatid (Schistosoma haematobium, S. japonicum and S. mansoni) flukes and tapeworms (Echinococcus granulosus, E. multilocularis and Taenia solium).
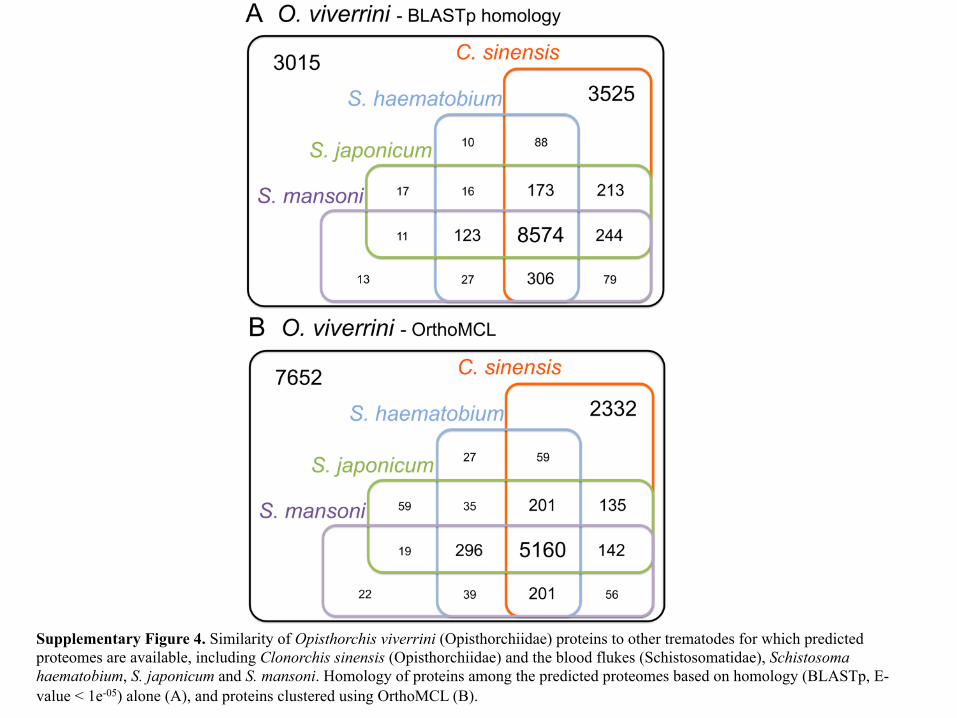
Supplementary Figure 4. Similarity of Opisthorchis viverrini (Opisthorchiidae) proteins to other trematodes for which predicted proteomes are available, including Clonorchis sinensis (Opisthorchiidae) and the blood flukes (Schistosomatidae), Schistosoma haematobium, S. japonicum and S. mansoni. Homology of proteins among the predicted proteomes based on homology (BLASTp, E-value < 1e-05) alone (A), and proteins clustered using OrthoMCL (B).

Supplementary Figure 5. Amino acid sequence homology (BLASTn, E-value ≤10-5) among representatives of parasitic flatworms affecting humans, including members of the families Opisthorchiidae (Clonorchis sinensis and Opisthorchis viverrini; Class Trematoda), Schistosomatidae (Schistosoma haematobium, S. japonicum and S. mansoni; Class Trematoda) and Taeniidae (Echinoccus granulosus, E. multilocularis and Taenia solium; Class Cestoda). Pairwise amino acid sequence homology of proteins predicted from the genomes of each parasitic flatworm, and compared relative to proteins predicted from O. viverrini (A), S. haematobium (B) and T. solium (C).
!
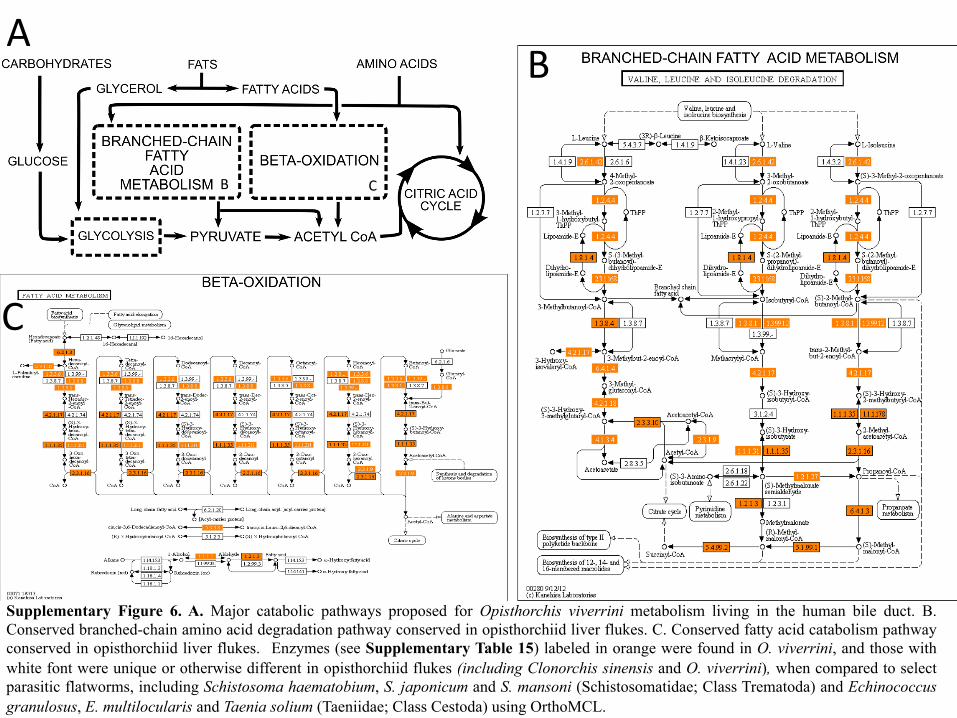
Supplementary Figure 6. A. Major catabolic pathways proposed for Opisthorchis viverrini metabolism living in the human bile duct. B. Conserved branched-chain amino acid degradation pathway conserved in opisthorchiid liver flukes. C. Conserved fatty acid catabolism pathway conserved in opisthorchiid liver flukes. Enzymes (see Supplementary Table 15) labeled in orange were found in O. viverrini, and those with white font were unique or otherwise different in opisthorchiid flukes (including Clonorchis sinensis and O. viverrini), when compared to select parasitic flatworms, including Schistosoma haematobium, S. japonicum and S. mansoni (Schistosomatidae; Class Trematoda) and Echinococcus granulosus, E. multilocularis and Taenia solium (Taeniidae; Class Cestoda) using OrthoMCL.
B
B
C
C
A

Supplementary Figure 7. Opisthorchis viverrini genes encoding proteins predicted to contain a novel MD-2-related lipid-recognition domain (Interproscan ID: IPR003172) and sharing amino acid sequence homology to human Niemann-Pick 2 protein (NPC2). A. Amino acid logos of frequently encoded aligned amino acid residues among 24 O. viverrini, 24 Clonorchis sinensis, 3 blood fluke (one each for Schistosoma haematobium, S. japonicum and S. mansoni) and 2 tapeworm (one each for Echinococcus granulosus and E. multilocularis) proteins. Logo is coloured based on amino acid chemistry, where amino acid residues are grouped by colour depending on their chemical characteristics, so that polar residues (G, S, T, Y & C) are green, neutral (Q & N) are purple, basic (K, R & H) are blue, acidic (D & E) are red and hydrophobic (A, V, L, I, P, W, F & M) are black. Conserved domains are highlighted in yellow. Residue height denotes the measure of uncertainty for each residue (in bits/symbol). B. Phylogenetic relationships of NPC2-like proteins among selected parasitic trematodes and cestodes. Values indicated on the branches represent Bayesian inference bootstrap support. O. viverrini and C. sinensis sequences are labeled in red and green respectively. O. viverrini proteins with transcriptional evidence of their expression in stages established in the bile duct are denoted with a black circle. For comparative purposes, tapeworms (Class Cestoda) are represented by E. granulosus and E. multilocularis and blood flukes are represented by S. haematobium (A_05301), S. japonicum (Sjc_0215260) and S. mansoni (Smp_194840). Gene sequences from a gastropod snail, Lottia gigantea (LGIGA) and human (HSAP) were included as an outgroup.
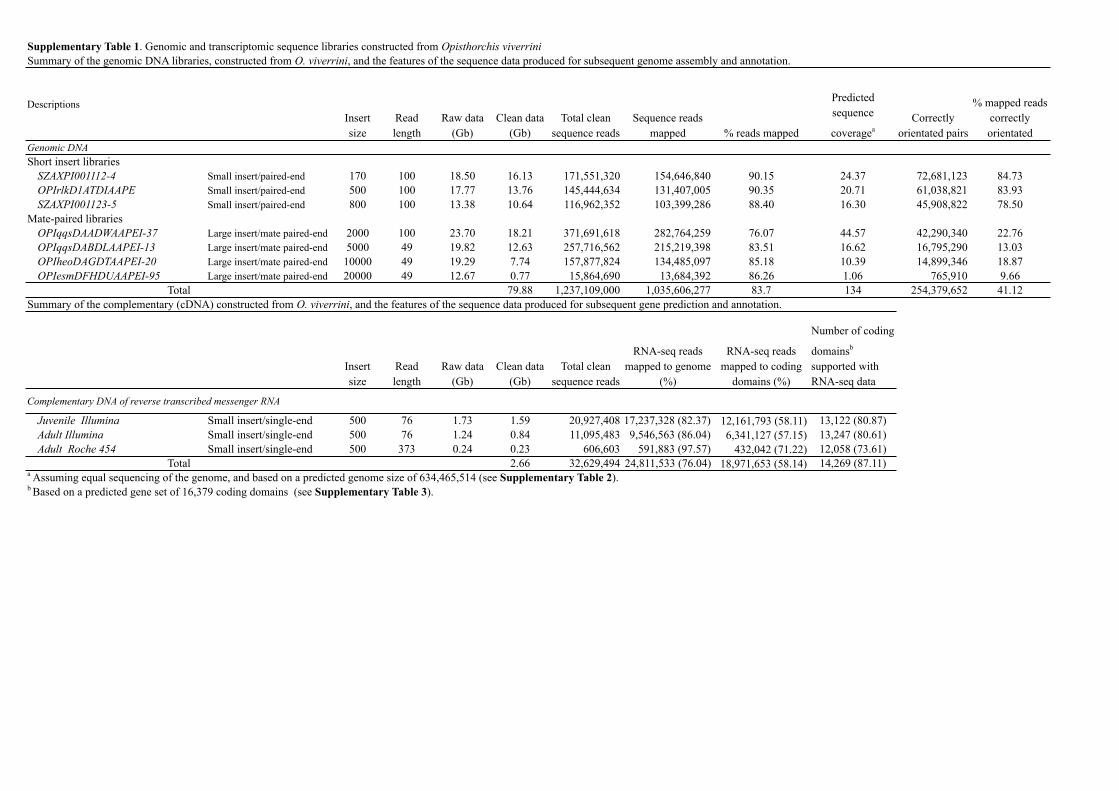
Supplementary Table 1. Genomic and transcriptomic sequence libraries constructed from Opisthorchis viverriniSummary of the genomic DNA libraries, constructed from O. viverrini, and the features of the sequence data produced for subsequent genome assembly and annotation.
DescriptionsInsert size
Read length
Raw data (Gb)
Clean data (Gb)
Total clean sequence reads
Sequence reads mapped % reads mapped
Predicted sequence
coverageaCorrectly
orientated pairs
% mapped reads correctly orientated
Genomic DNA Short insert libraries
SZAXPI001112-4 Small insert/paired-end 170 100 18.50 16.13 171,551,320 154,646,840 90.15 24.37 72,681,123 84.73OPIrlkD1ATDIAAPE Small insert/paired-end 500 100 17.77 13.76 145,444,634 131,407,005 90.35 20.71 61,038,821 83.93SZAXPI001123-5 Small insert/paired-end 800 100 13.38 10.64 116,962,352 103,399,286 88.40 16.30 45,908,822 78.50
Mate-paired librariesOPIqqsDAADWAAPEI-37 Large insert/mate paired-end 2000 100 23.70 18.21 371,691,618 282,764,259 76.07 44.57 42,290,340 22.76OPIqqsDABDLAAPEI-13 Large insert/mate paired-end 5000 49 19.82 12.63 257,716,562 215,219,398 83.51 16.62 16,795,290 13.03OPIheoDAGDTAAPEI-20 Large insert/mate paired-end 10000 49 19.29 7.74 157,877,824 134,485,097 85.18 10.39 14,899,346 18.87OPIesmDFHDUAAPEI-95 Large insert/mate paired-end 20000 49 12.67 0.77 15,864,690 13,684,392 86.26 1.06 765,910 9.66
Total 79.88 1,237,109,000 1,035,606,277 83.7 134 254,379,652 41.12Summary of the complementary (cDNA) constructed from O. viverrini, and the features of the sequence data produced for subsequent gene prediction and annotation.
Insert size
Read length
Raw data (Gb)
Clean data (Gb)
Total clean sequence reads
RNA-seq reads mapped to genome
(%)
RNA-seq reads mapped to coding
domains (%)
Number of coding
domainsb
supported with RNA-seq data
Complementary DNA of reverse transcribed messenger RNA
Juvenile Illumina Small insert/single-end 500 76 1.73 1.59 20,927,408 17,237,328 (82.37) 12,161,793 (58.11) 13,122 (80.87)Adult Illumina Small insert/single-end 500 76 1.24 0.84 11,095,483 9,546,563 (86.04) 6,341,127 (57.15) 13,247 (80.61)Adult Roche 454 Small insert/single-end 500 373 0.24 0.23 606,603 591,883 (97.57) 432,042 (71.22) 12,058 (73.61)
Total 2.66 32,629,494 24,811,533 (76.04) 18,971,653 (58.14) 14,269 (87.11)a Assuming equal sequencing of the genome, and based on a predicted genome size of 634,465,514 (see Supplementary Table 2).b Based on a predicted gene set of 16,379 coding domains (see Supplementary Table 3).
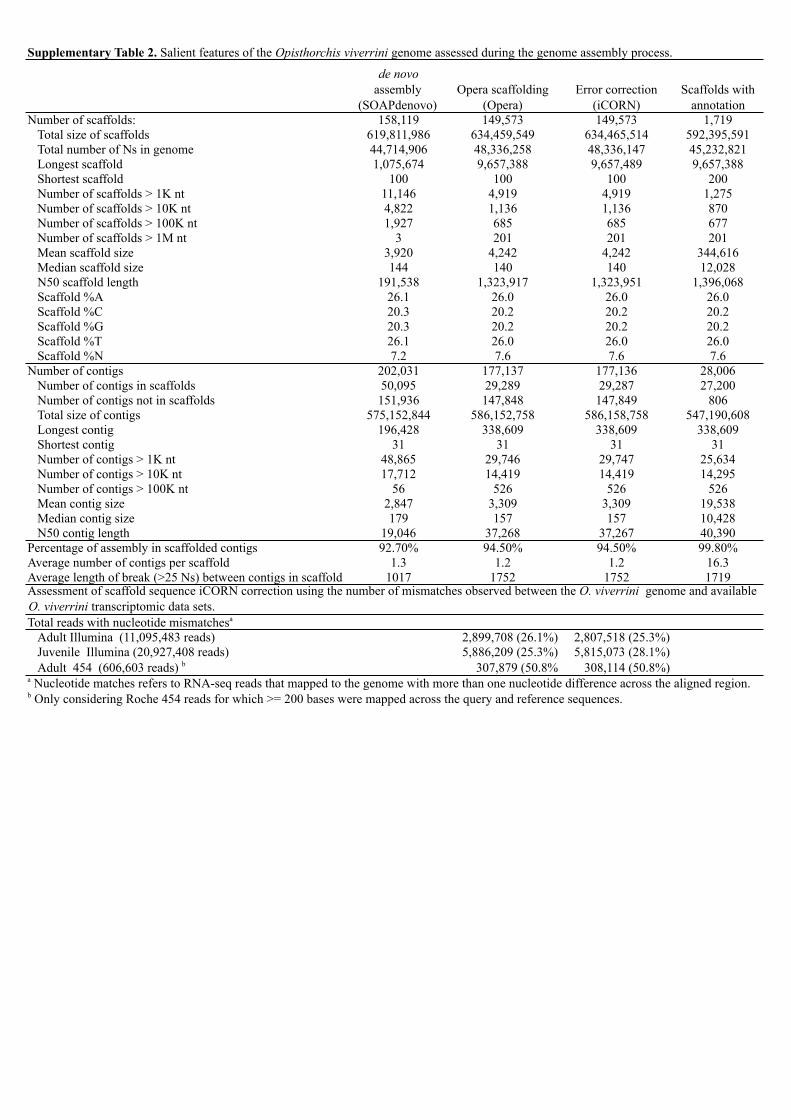
Supplementary Table 2. Salient features of the Opisthorchis viverrini genome assessed during the genome assembly process.
de novo assembly
(SOAPdenovo)Opera scaffolding
(Opera)Error correction
(iCORN)Scaffolds with
annotationNumber of scaffolds: 158,119 149,573 149,573 1,719
Total size of scaffolds 619,811,986 634,459,549 634,465,514 592,395,591Total number of Ns in genome 44,714,906 48,336,258 48,336,147 45,232,821Longest scaffold 1,075,674 9,657,388 9,657,489 9,657,388Shortest scaffold 100 100 100 200Number of scaffolds > 1K nt 11,146 4,919 4,919 1,275Number of scaffolds > 10K nt 4,822 1,136 1,136 870Number of scaffolds > 100K nt 1,927 685 685 677Number of scaffolds > 1M nt 3 201 201 201Mean scaffold size 3,920 4,242 4,242 344,616Median scaffold size 144 140 140 12,028N50 scaffold length 191,538 1,323,917 1,323,951 1,396,068Scaffold %A 26.1 26.0 26.0 26.0Scaffold %C 20.3 20.2 20.2 20.2Scaffold %G 20.3 20.2 20.2 20.2Scaffold %T 26.1 26.0 26.0 26.0Scaffold %N 7.2 7.6 7.6 7.6
Number of contigs 202,031 177,137 177,136 28,006Number of contigs in scaffolds 50,095 29,289 29,287 27,200Number of contigs not in scaffolds 151,936 147,848 147,849 806Total size of contigs 575,152,844 586,152,758 586,158,758 547,190,608Longest contig 196,428 338,609 338,609 338,609Shortest contig 31 31 31 31Number of contigs > 1K nt 48,865 29,746 29,747 25,634Number of contigs > 10K nt 17,712 14,419 14,419 14,295Number of contigs > 100K nt 56 526 526 526Mean contig size 2,847 3,309 3,309 19,538Median contig size 179 157 157 10,428N50 contig length 19,046 37,268 37,267 40,390
Percentage of assembly in scaffolded contigs 92.70% 94.50% 94.50% 99.80%Average number of contigs per scaffold 1.3 1.2 1.2 16.3Average length of break (>25 Ns) between contigs in scaffold 1017 1752 1752 1719
Total reads with nucleotide mismatchesa
Adult Illumina (11,095,483 reads) 2,899,708 (26.1%) 2,807,518 (25.3%)Juvenile Illumina (20,927,408 reads) 5,886,209 (25.3%) 5,815,073 (28.1%)Adult 454 (606,603 reads) b 307,879 (50.8% 308,114 (50.8%)
a Nucleotide matches refers to RNA-seq reads that mapped to the genome with more than one nucleotide difference across the aligned region.b Only considering Roche 454 reads for which >= 200 bases were mapped across the query and reference sequences.
Assessment of scaffold sequence iCORN correction using the number of mismatches observed between the O. viverrini genome and available O. viverrini transcriptomic data sets.

Gene sets Number of CEGs Completenessb
Total genes predicted Gene lengtha Coding domain length a
Average coding domain GC ratio
Average exons per gene Exon length (bases)a Intron length (bases)a
Trematoda
Opisthorchiidae
Opisthorchis viverrini 121/214c 48.8/86.3 16,379 18,231 ± 22,071; 99-228,146 1,298 ± 1,559; 90-32,823 47.8% 5.8 254 ± 324; 3-13,713 3,531 ± 5786; 1-186,537
Clonorchis sinensis 122/213 49.2/85.9 13,634 17,797 ± 18,657; 150-196,431 1,589 ± 1,569; 150-48,060 48.0% 6.9 232 ± 324; 3-13,736 2,761 ± 3745; 2-68,640
Schistosomatidae
Schistosoma haematobium 140/210 56.5/84.7 13,073 11,952 ± 16,273; 30–204,220 1,308 ± 1,498; 30 - 28,212 36.4% 5.4 246 ± 287; 1–9,737 2,442 ± 2,958; 1–68,754Schistosoma japonicum 132/213 53.2/85.9 13,469 10,003 ± 12,980;150–173,394 1,179 ± 1,201; 147–24,180 36.2% 4.4 216 ± 244; 6–6,326 2,058 ± 2,679; 15–59,770Schistosoma mansoni 136/198 54.8/79.8 13,191 12,509 ± 18,848; 3-233,688 1,340 ± 1,446; 60-22,980 36.9% 5.4 219 ± 267; 1-15,688 2,462 ± 3,545; 1-177,536
a Average nucleotide bases; Standard deviation; Minimum-maximuma Percentage of 248 ultra-conserved CEGs present.b Complete/partial matches.
Supplementary Table 3. Completeness of the Opisthorchis viverrini, Clonorchis sinensis, Schistosoma haematobium, S. japonicum and S. mansoni genomes (Class Trematoda) based on the identification of 248 ultra-conserved core eukaryotic genes (CEGs) within assembled scaffolds and general statistics of their predicted protein-coding gene sets
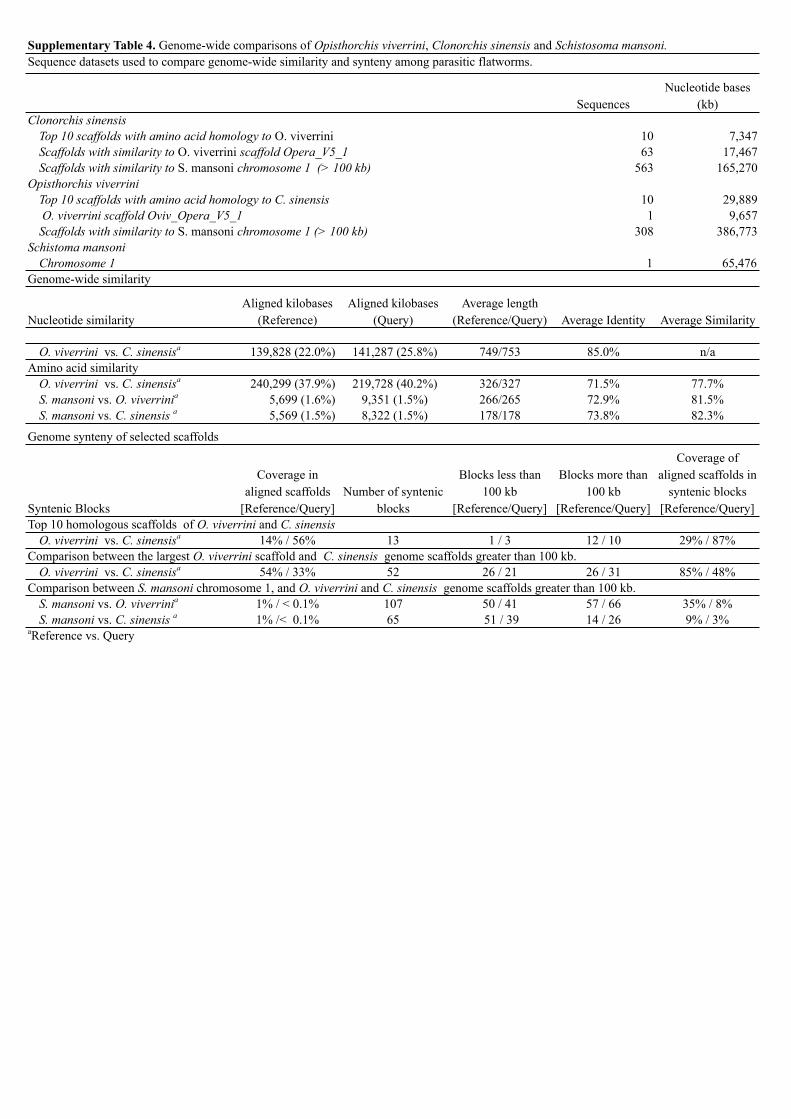
Supplementary Table 4. Genome-wide comparisons of Opisthorchis viverrini, Clonorchis sinensis and Schistosoma mansoni.
SequencesNucleotide bases
(kb)Clonorchis sinensis
Top 10 scaffolds with amino acid homology to O. viverrini 10 7,347Scaffolds with similarity to O. viverrini scaffold Opera_V5_1 63 17,467Scaffolds with similarity to S. mansoni chromosome 1 (> 100 kb) 563 165,270
Opisthorchis viverriniTop 10 scaffolds with amino acid homology to C. sinensis 10 29,889 O. viverrini scaffold Oviv_Opera_V5_1 1 9,657Scaffolds with similarity to S. mansoni chromosome 1 (> 100 kb) 308 386,773
Schistoma mansoniChromosome 1 1 65,476
Genome-wide similarity
Nucleotide similarityAligned kilobases
(Reference)Aligned kilobases
(Query)Average length
(Reference/Query) Average Identity Average Similarity
O. viverrini vs. C. sinensisa 139,828 (22.0%) 141,287 (25.8%) 749/753 85.0% n/aAmino acid similarity
O. viverrini vs. C. sinensisa 240,299 (37.9%) 219,728 (40.2%) 326/327 71.5% 77.7%S. mansoni vs. O. viverrinia 5,699 (1.6%) 9,351 (1.5%) 266/265 72.9% 81.5%S. mansoni vs. C. sinensis a 5,569 (1.5%) 8,322 (1.5%) 178/178 73.8% 82.3%
Genome synteny of selected scaffolds
Syntenic Blocks
Coverage in aligned scaffolds
[Reference/Query]Number of syntenic
blocks
Blocks less than 100 kb
[Reference/Query]
Blocks more than 100 kb
[Reference/Query]
Coverage of aligned scaffolds in
syntenic blocks [Reference/Query]
Top 10 homologous scaffolds of O. viverrini and C. sinensisO. viverrini vs. C. sinensisa 14% / 56% 13 1 / 3 12 / 10 29% / 87%
Comparison between the largest O. viverrini scaffold and C. sinensis genome scaffolds greater than 100 kb.O. viverrini vs. C. sinensisa 54% / 33% 52 26 / 21 26 / 31 85% / 48%
Comparison between S. mansoni chromosome 1, and O. viverrini and C. sinensis genome scaffolds greater than 100 kb.S. mansoni vs. O. viverrinia 1% / < 0.1% 107 50 / 41 57 / 66 35% / 8%S. mansoni vs. C. sinensis a 1% /< 0.1% 65 51 / 39 14 / 26 9% / 3%
aReference vs. Query
Sequence datasets used to compare genome-wide similarity and synteny among parasitic flatworms.
GenesProportion of
genes (%) Top level 5 GO terms (number of genes)
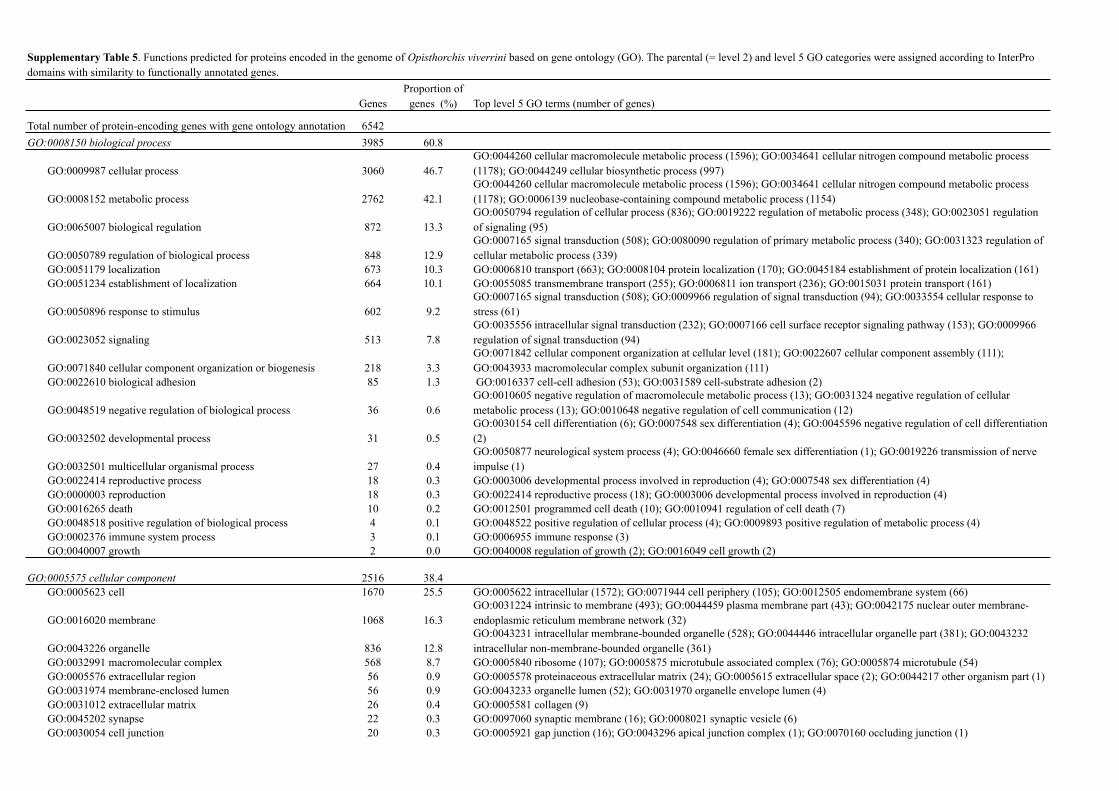
Total number of protein-encoding genes with gene ontology annotation 6542GO:0008150 biological process 3985 60.8
GO:0009987 cellular process 3060 46.7GO:0044260 cellular macromolecule metabolic process (1596); GO:0034641 cellular nitrogen compound metabolic process (1178); GO:0044249 cellular biosynthetic process (997)
GO:0008152 metabolic process 2762 42.1GO:0044260 cellular macromolecule metabolic process (1596); GO:0034641 cellular nitrogen compound metabolic process (1178); GO:0006139 nucleobase-containing compound metabolic process (1154)
GO:0065007 biological regulation 872 13.3GO:0050794 regulation of cellular process (836); GO:0019222 regulation of metabolic process (348); GO:0023051 regulation of signaling (95)
GO:0050789 regulation of biological process 848 12.9GO:0007165 signal transduction (508); GO:0080090 regulation of primary metabolic process (340); GO:0031323 regulation of cellular metabolic process (339)
GO:0051179 localization 673 10.3 GO:0006810 transport (663); GO:0008104 protein localization (170); GO:0045184 establishment of protein localization (161)GO:0051234 establishment of localization 664 10.1 GO:0055085 transmembrane transport (255); GO:0006811 ion transport (236); GO:0015031 protein transport (161)
GO:0050896 response to stimulus 602 9.2GO:0007165 signal transduction (508); GO:0009966 regulation of signal transduction (94); GO:0033554 cellular response to stress (61)
GO:0023052 signaling 513 7.8GO:0035556 intracellular signal transduction (232); GO:0007166 cell surface receptor signaling pathway (153); GO:0009966 regulation of signal transduction (94)
GO:0071840 cellular component organization or biogenesis 218 3.3GO:0071842 cellular component organization at cellular level (181); GO:0022607 cellular component assembly (111); GO:0043933 macromolecular complex subunit organization (111)
GO:0022610 biological adhesion 85 1.3 GO:0016337 cell-cell adhesion (53); GO:0031589 cell-substrate adhesion (2)
GO:0048519 negative regulation of biological process 36 0.6GO:0010605 negative regulation of macromolecule metabolic process (13); GO:0031324 negative regulation of cellular metabolic process (13); GO:0010648 negative regulation of cell communication (12)
GO:0032502 developmental process 31 0.5GO:0030154 cell differentiation (6); GO:0007548 sex differentiation (4); GO:0045596 negative regulation of cell differentiation (2)
GO:0032501 multicellular organismal process 27 0.4GO:0050877 neurological system process (4); GO:0046660 female sex differentiation (1); GO:0019226 transmission of nerve impulse (1)
GO:0022414 reproductive process 18 0.3 GO:0003006 developmental process involved in reproduction (4); GO:0007548 sex differentiation (4)GO:0000003 reproduction 18 0.3 GO:0022414 reproductive process (18); GO:0003006 developmental process involved in reproduction (4)GO:0016265 death 10 0.2 GO:0012501 programmed cell death (10); GO:0010941 regulation of cell death (7)GO:0048518 positive regulation of biological process 4 0.1 GO:0048522 positive regulation of cellular process (4); GO:0009893 positive regulation of metabolic process (4)GO:0002376 immune system process 3 0.1 GO:0006955 immune response (3)GO:0040007 growth 2 0.0 GO:0040008 regulation of growth (2); GO:0016049 cell growth (2)
GO:0005575 cellular component 2516 38.4GO:0005623 cell 1670 25.5 GO:0005622 intracellular (1572); GO:0071944 cell periphery (105); GO:0012505 endomembrane system (66)
GO:0016020 membrane 1068 16.3GO:0031224 intrinsic to membrane (493); GO:0044459 plasma membrane part (43); GO:0042175 nuclear outer membrane-endoplasmic reticulum membrane network (32)
GO:0043226 organelle 836 12.8GO:0043231 intracellular membrane-bounded organelle (528); GO:0044446 intracellular organelle part (381); GO:0043232 intracellular non-membrane-bounded organelle (361)
GO:0032991 macromolecular complex 568 8.7 GO:0005840 ribosome (107); GO:0005875 microtubule associated complex (76); GO:0005874 microtubule (54)GO:0005576 extracellular region 56 0.9 GO:0005578 proteinaceous extracellular matrix (24); GO:0005615 extracellular space (2); GO:0044217 other organism part (1)GO:0031974 membrane-enclosed lumen 56 0.9 GO:0043233 organelle lumen (52); GO:0031970 organelle envelope lumen (4)GO:0031012 extracellular matrix 26 0.4 GO:0005581 collagen (9)GO:0045202 synapse 22 0.3 GO:0097060 synaptic membrane (16); GO:0008021 synaptic vesicle (6)GO:0030054 cell junction 20 0.3 GO:0005921 gap junction (16); GO:0043296 apical junction complex (1); GO:0070160 occluding junction (1)
Supplementary Table 5. Functions predicted for proteins encoded in the genome of Opisthorchis viverrini based on gene ontology (GO). The parental (= level 2) and level 5 GO categories were assigned according to InterPro domains with similarity to functionally annotated genes.
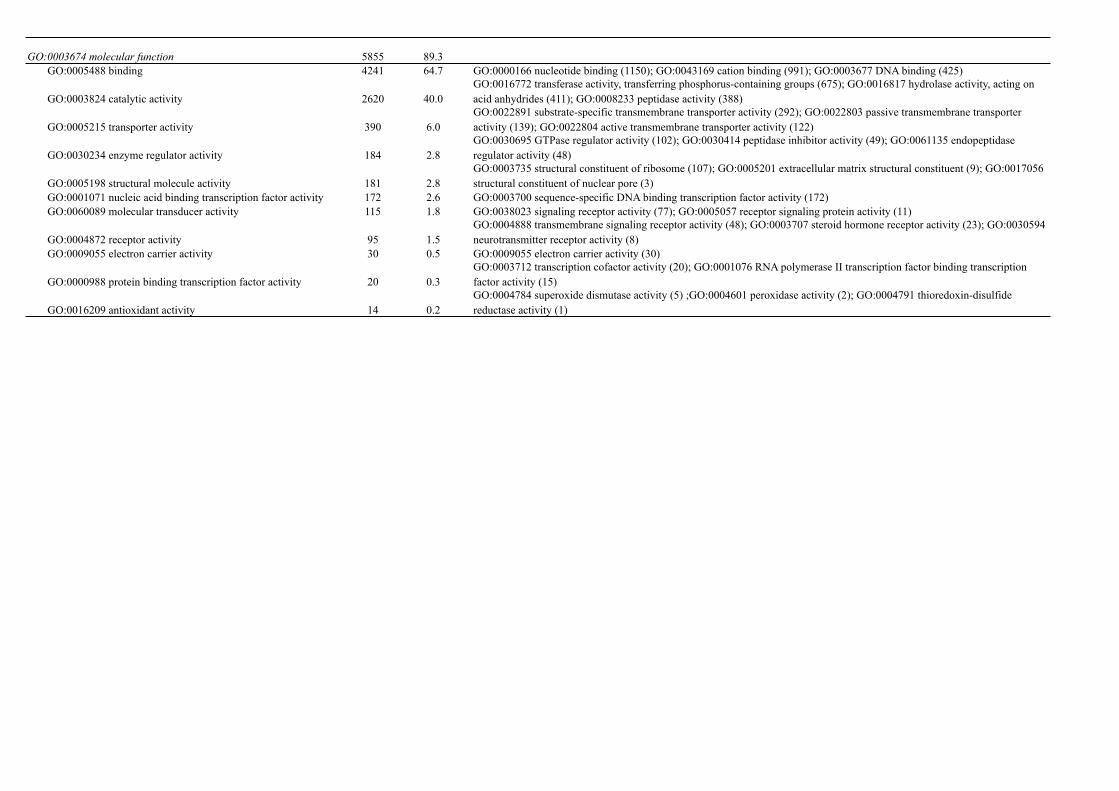
GO:0003674 molecular function 5855 89.3GO:0005488 binding 4241 64.7 GO:0000166 nucleotide binding (1150); GO:0043169 cation binding (991); GO:0003677 DNA binding (425)
GO:0003824 catalytic activity 2620 40.0GO:0016772 transferase activity, transferring phosphorus-containing groups (675); GO:0016817 hydrolase activity, acting on acid anhydrides (411); GO:0008233 peptidase activity (388)
GO:0005215 transporter activity 390 6.0GO:0022891 substrate-specific transmembrane transporter activity (292); GO:0022803 passive transmembrane transporter activity (139); GO:0022804 active transmembrane transporter activity (122)
GO:0030234 enzyme regulator activity 184 2.8GO:0030695 GTPase regulator activity (102); GO:0030414 peptidase inhibitor activity (49); GO:0061135 endopeptidase regulator activity (48)
GO:0005198 structural molecule activity 181 2.8GO:0003735 structural constituent of ribosome (107); GO:0005201 extracellular matrix structural constituent (9); GO:0017056 structural constituent of nuclear pore (3)
GO:0001071 nucleic acid binding transcription factor activity 172 2.6 GO:0003700 sequence-specific DNA binding transcription factor activity (172)GO:0060089 molecular transducer activity 115 1.8 GO:0038023 signaling receptor activity (77); GO:0005057 receptor signaling protein activity (11)
GO:0004872 receptor activity 95 1.5GO:0004888 transmembrane signaling receptor activity (48); GO:0003707 steroid hormone receptor activity (23); GO:0030594 neurotransmitter receptor activity (8)
GO:0009055 electron carrier activity 30 0.5 GO:0009055 electron carrier activity (30)
GO:0000988 protein binding transcription factor activity 20 0.3GO:0003712 transcription cofactor activity (20); GO:0001076 RNA polymerase II transcription factor binding transcription factor activity (15)
GO:0016209 antioxidant activity 14 0.2GO:0004784 superoxide dismutase activity (5) ;GO:0004601 peroxidase activity (2); GO:0004791 thioredoxin-disulfide reductase activity (1)
K termsa Genes K terms Genes% of total genes K terms Genes K terms Genes K terms Genes K terms Genes
KEGG protein classes
Cellular ProcessesCell Motility
Cytoskeleton proteins 72 213 14 37 17.4 69 169 12 20 75 221 23 55
Environmental Information ProcessingMembrane Transport
Solute carrier family 106 202 19 24 11.9 100 216 23 30 95 174 22 33Transporters 40 74 8 11 14.9 32 59 7 8 28 56 5 5Secretion system 10 13 1 1 7.7 12 13 7 7 15 15
Signaling Molecules and InteractionNuclear receptors 14 22 10 10 45.5 17 21 5 5 12 13 7 7Ion channels 62 128 13 18 14.1 62 111 10 10 68 170 20 30G protein-coupled receptors 33 59 7 13 22.0 29 63 9 11 25 49 8 10GTP-binding proteins 57 87 6 7 8.0 56 76 8 16 52 73 11 12Cellular antigens 40 74 8 9 12.2 32 65 6 9 33 89 12 19Cell adhesion molecules (CAMs) 22 34 4 4 11.8 20 35 3 3 21 30 2 2CAM ligands 16 31 4 5 16.1 15 32 3 4 16 42 6 10Cytokine receptors 24 31 6 6 19.4 15 27 2 2 17 25 4 4Enzyme-linked receptors 23 30 6 6 20.0 14 26 2 2 16 24 4 4Glycan bindng proteins 9 12 1 1 8.3 9 14 3 4 10 13 1 1
Genetic Information ProcessingFolding, Sorting and Degradation
Ubiquitin system 228 282 27 30 10.6 225 298 36 61 220 340 39 47Chaperones and folding catalysts 95 130 6 8 6.2 95 128 18 27 88 192 10 12Proteasome 46 59 1 2 3.4 50 56 13 14 50 125 3 4SNAREs 17 25 18 23 3 4 18 22 2 2
Replication and RepairChromosome 207 334 23 23 6.9 204 335 45 71 213 358 45 50DNA repair and recombination proteins 140 169 9 9 5.3 138 183 39 49 139 180 16 17DNA replication proteins 82 106 3 3 2.8 81 110 23 28 80 123 8 11
TranslationRibosome biogenesis 149 191 6 7 3.7 157 214 42 64 147 242 6 8Transfer RNA biogenesis 101 140 4 4 2.9 104 150 32 46 99 142 8 8Ribosome 69 77 70 84 24 29 78 85
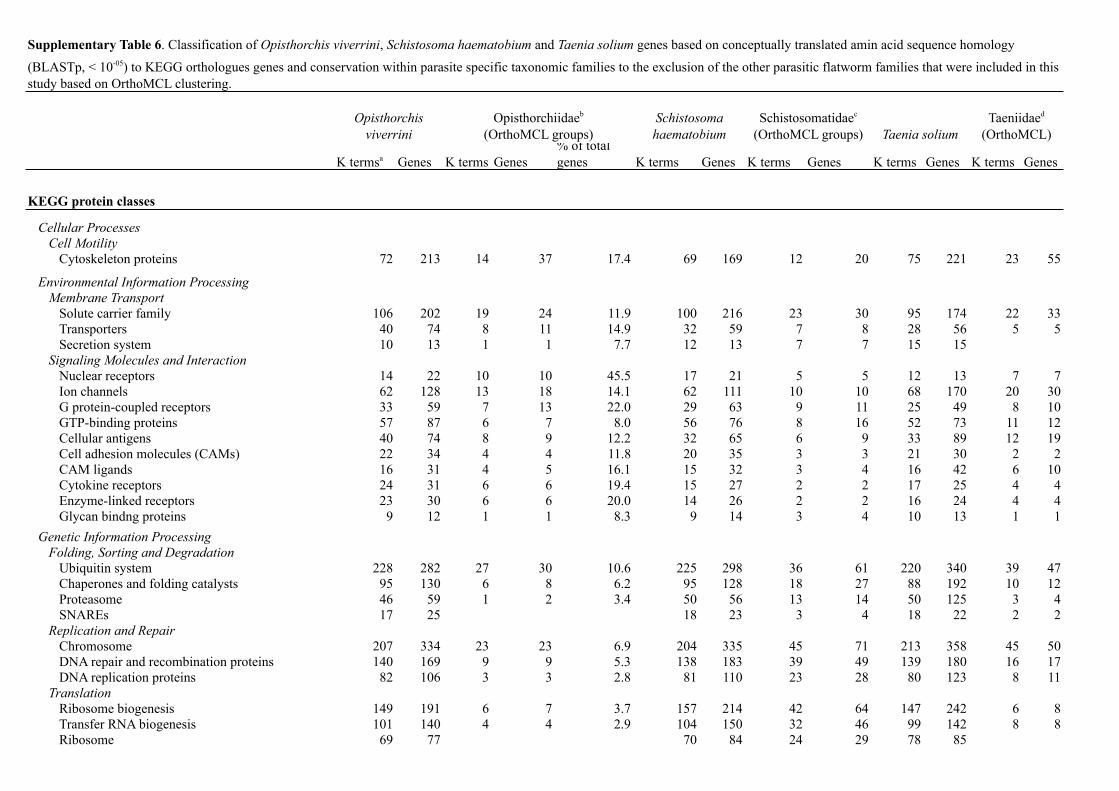
Supplementary Table 6. Classification of Opisthorchis viverrini, Schistosoma haematobium and Taenia solium genes based on conceptually translated amin acid sequence homology
(BLASTp, < 10-05) to KEGG orthologues genes and conservation within parasite specific taxonomic families to the exclusion of the other parasitic flatworm families that were included in this study based on OrthoMCL clustering.
Opisthorchiidaeb
(OrthoMCL groups)Opisthorchis
viverriniSchistosoma haematobium Taenia solium
Schistosomatidaec
(OrthoMCL groups)Taeniidaed
(OrthoMCL)

Translation factors 50 65 51 65 18 22 50 59Transcription
Transcription factors 155 226 93 120 53.1 166 226 82 92 166 252 106 130Spliceosome 210 328 16 22 6.7 209 293 40 70 216 350 30 37Transcription machinery 134 186 10 14 7.5 136 181 26 40 137 192 19 23
MetabolismAmino Acid Metabolism
Amino acid related enzymes 29 47 2 2 4.3 28 54 19 26 30 46 1 1Enzyme Families
Peptidases 143 343 20 43 12.5 141 216 22 31 131 201 12 14Protein kinases 169 265 22 27 10.2 159 281 33 48 163 291 36 45
Glycan Biosynthesis and MetabolismGlycosyltransferases 46 85 8 18 21.2 47 77 11 11 50 87 8 13Proteoglycans 8 8 1 1 12.5 10 10 2 2 8 10 3 3
Lipid MetabolismLipid biosynthesis proteins 25 40 2 3 7.5 23 36 4 5 22 35 3 5
a K terms represent sequence homology to specific KEGG orthologues gene groups/terms within the KEGG databaseb Opisthorchiidase includes gene sets from Clonorchis sinensis and Opisthorchis viverrinic Schistosomatida includes gene sets from Schistosoma haematobium, S. japonicum and S. mansonid Taeniidae includes gene sets from Echinococcus granulosis, E. multilocularis and Taenia solium

Protein familyNumber of genes Top KEGG protein family genesa
Genetic Information Processing; Transcription 119 KRAB domain-containing zinc finger protein (9); GATA-binding protein 1/2/3 (4); SOX1S; transcription factor SOX1/2/3/14/21 (SOX group B) (4)
Metabolism; Peptidases 43 Cathepsin D (11); Pepsin A (5); Leishmanolysin-like peptidase (4)
Cellular Processes; Cell Motility; Cytoskeleton proteins 37 Dyneins (23); Kinesins (6); Tubulins (2)
Genetic Information Processing;Folding, Sorting and Degradation; Ubiquitin system 29 Ubiquitin ligases (E3) multi subunit Ring-finger type E3 Cul3 complex target recognizing subunit (BTB) (6); Ubiquitin ligases (E3) multi subunit Ring-finger type E3 SCF complex target recognizing subunit (F-box) (4); Ubiquitins and Ubiquitin-like proteins Ubiquitin-like
Environmental Information Processing; Membrane Transport; Solute carrier family 23 Na+-independent, system-L-like amino acid transporter (3); Cationic amino acid transporter (2); Na+/H+ exchanger SLC9A3, NHE3 (2)
Environmental Information Processing; Signaling Molecules and Interaction; Ion channels 18 Transient receptor potential cation channel subfamily A member 1 (4); Glycine receptor alpha-3 (2); Glycerol uptake receptor (2)
Metabolism; Glycan Biosynthesis and Metabolism; Glycosyltransferases 14 Glycoprotein-N-acetylgalactosamine 3-beta-galactosyltransferase (4); N-acetyllactosaminide beta-1,6-N-acetylglucosaminyl-transferase (2); alpha-1,6-mannosyl-glycoprotein 6-beta-N-acetylglucosaminyltransferase (2)
Environmental Information Processing; Signaling Molecules and Interaction; G protein-coupled receptors
13 Dopamine D2-like receptor (2); 5-hydroxytryptamine receptor 1 (2)
Environmental Information Processing; Membrane Transport;Transporters 11 MFS transporter, LAT3 family, solute carrier family 43, member 3 (3); MFS transporter, OCT family, solute carrier family 22 (organic cation transporter), member 4/5 (2); ATP-binding cassette, subfamily A (ABC1), member 5 (1)
Environmental Information Processing; Signaling Molecules and Interaction; Nuclear receptors 10 Thyroid hormone like (4); Hepatocyte nuclear factor 4 like (5); Nerve growth factor IB like (1)
aThe three most frequently reported KEGG protein families within each protein family group are reported
Supplementary Table 7. Predicted Opisthorchis viverrini proteins with orthologues in Clonorchis sinensis and which diverged in amino acid sequence simialrity when compared to other trematode (S. haematobium, S. japonicum and S. mansoni) and cestodes (Echinococcus granulosus, E. multilocularis and Taenia solium) using OrthoMCL clustering.
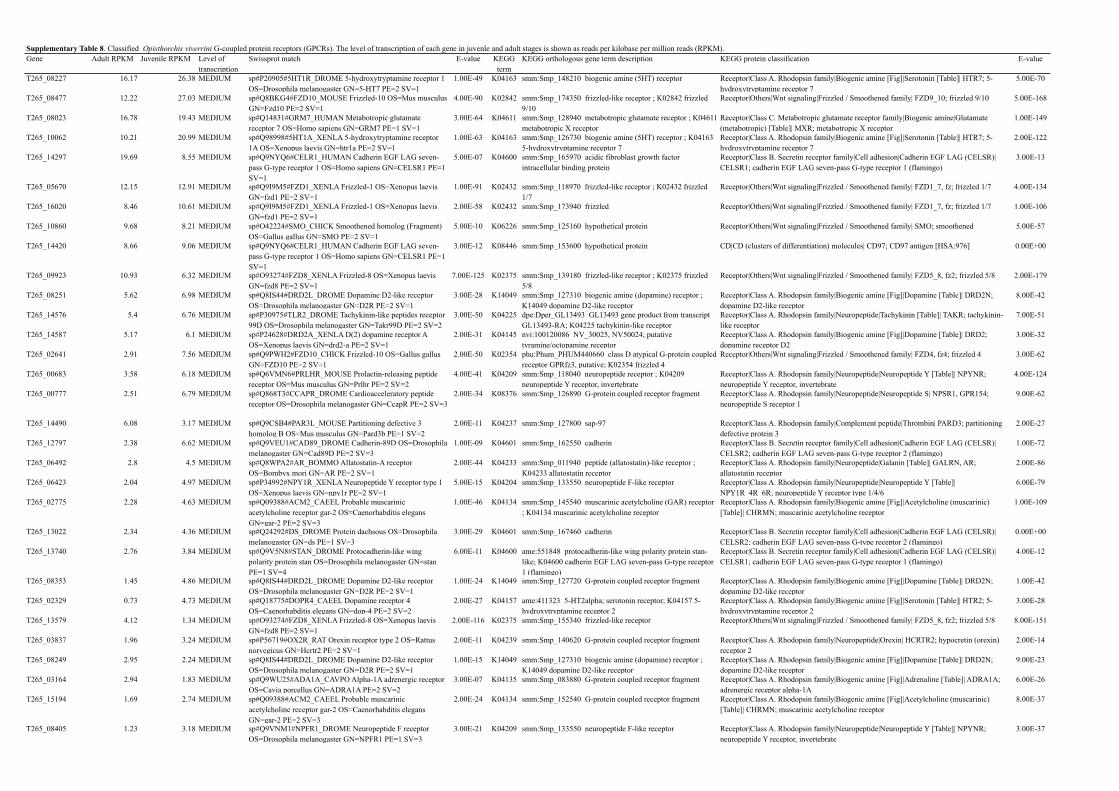
Supplementary Table 8. Classified Opisthorchis viverrini G-coupled protein receptors (GPCRs). The level of transcription of each gene in juvenle and adult stages is shown as reads per kilobase per million reads (RPKM).Gene Adult RPKM Juvenile RPKM Level of
transcriptionSwissprot match E-value KEGG
term KEGG orthologous gene term description KEGG protein classification E-value
T265_08227 16.17 26.38 MEDIUM sp#P20905#5HT1R_DROME 5-hydroxytryptamine receptor 1 OS=Drosophila melanogaster GN=5-HT7 PE=2 SV=1
1.00E-49 K04163 smm:Smp_148210 biogenic amine (5HT) receptor Receptor|Class A. Rhodopsin family|Biogenic amine [Fig]|Serotonin [Table]| HTR7; 5-hydroxytryptamine receptor 7
5.00E-70
T265_08477 12.22 27.03 MEDIUM sp#Q8BKG4#FZD10_MOUSE Frizzled-10 OS=Mus musculus GN=Fzd10 PE=2 SV=1
4.00E-90 K02842 smm:Smp_174350 frizzled-like receptor ; K02842 frizzled 9/10
Receptor|Others|Wnt signaling|Frizzled / Smoothened family| FZD9_10; frizzled 9/10 5.00E-168
T265_08023 16.78 19.43 MEDIUM sp#Q14831#GRM7_HUMAN Metabotropic glutamate receptor 7 OS=Homo sapiens GN=GRM7 PE=1 SV=1
3.00E-64 K04611 smm:Smp_128940 metabotropic glutamate receptor ; K04611 metabotropic X receptor
Receptor|Class C. Metabotropic glutamate receptor family|Biogenic amine|Glutamate (metabotropic) [Table]| MXR; metabotropic X receptor
1.00E-149
T265_10062 10.21 20.99 MEDIUM sp#Q98998#5HT1A_XENLA 5-hydroxytryptamine receptor 1A OS=Xenopus laevis GN=htr1a PE=2 SV=1
1.00E-63 K04163 smm:Smp_126730 biogenic amine (5HT) receptor ; K04163 5-hydroxytryptamine receptor 7
Receptor|Class A. Rhodopsin family|Biogenic amine [Fig]|Serotonin [Table]| HTR7; 5-hydroxytryptamine receptor 7
2.00E-122
T265_14297 19.69 8.55 MEDIUM sp#Q9NYQ6#CELR1_HUMAN Cadherin EGF LAG seven-pass G-type receptor 1 OS=Homo sapiens GN=CELSR1 PE=1 SV=1
5.00E-07 K04600 smm:Smp_165970 acidic fibroblast growth factor intracellular binding protein
Receptor|Class B. Secretin receptor family|Cell adhesion|Cadherin EGF LAG (CELSR)| CELSR1; cadherin EGF LAG seven-pass G-type receptor 1 (flamingo)
3.00E-13
T265_05670 12.15 12.91 MEDIUM sp#Q9I9M5#FZD1_XENLA Frizzled-1 OS=Xenopus laevis GN=fzd1 PE=2 SV=1
1.00E-91 K02432 smm:Smp_118970 frizzled-like receptor ; K02432 frizzled 1/7
Receptor|Others|Wnt signaling|Frizzled / Smoothened family| FZD1_7, fz; frizzled 1/7 4.00E-134
T265_16020 8.46 10.61 MEDIUM sp#Q9I9M5#FZD1_XENLA Frizzled-1 OS=Xenopus laevis GN=fzd1 PE=2 SV=1
2.00E-58 K02432 smm:Smp_173940 frizzled Receptor|Others|Wnt signaling|Frizzled / Smoothened family| FZD1_7, fz; frizzled 1/7 1.00E-106
T265_10860 9.68 8.21 MEDIUM sp#O42224#SMO_CHICK Smoothened homolog (Fragment) OS=Gallus gallus GN=SMO PE=2 SV=1
5.00E-10 K06226 smm:Smp_125160 hypothetical protein Receptor|Others|Wnt signaling|Frizzled / Smoothened family| SMO; smoothened 5.00E-57
T265_14420 8.66 9.06 MEDIUM sp#Q9NYQ6#CELR1_HUMAN Cadherin EGF LAG seven-pass G-type receptor 1 OS=Homo sapiens GN=CELSR1 PE=1 SV=1
3.00E-12 K08446 smm:Smp_153600 hypothetical protein CD|CD (clusters of differentiation) molecules| CD97; CD97 antigen [HSA:976] 0.00E+00
T265_09923 10.93 6.32 MEDIUM sp#O93274#FZD8_XENLA Frizzled-8 OS=Xenopus laevis GN=fzd8 PE=2 SV=1
7.00E-125 K02375 smm:Smp_139180 frizzled-like receptor ; K02375 frizzled 5/8
Receptor|Others|Wnt signaling|Frizzled / Smoothened family| FZD5_8, fz2; frizzled 5/8 2.00E-179
T265_08251 5.62 6.98 MEDIUM sp#Q8IS44#DRD2L_DROME Dopamine D2-like receptor OS=Drosophila melanogaster GN=D2R PE=2 SV=1
3.00E-28 K14049 smm:Smp_127310 biogenic amine (dopamine) receptor ; K14049 dopamine D2-like receptor
Receptor|Class A. Rhodopsin family|Biogenic amine [Fig]|Dopamine [Table]| DRD2N; dopamine D2-like receptor
8.00E-42
T265_14576 5.4 6.76 MEDIUM sp#P30975#TLR2_DROME Tachykinin-like peptides receptor 99D OS=Drosophila melanogaster GN=Takr99D PE=2 SV=2
3.00E-50 K04225 dpe:Dper_GL13493 GL13493 gene product from transcript GL13493-RA; K04225 tachykinin-like receptor
Receptor|Class A. Rhodopsin family|Neuropeptide|Tachykinin [Table]| TAKR; tachykinin-like receptor
7.00E-51
T265_14587 5.17 6.1 MEDIUM sp#P24628#DRD2A_XENLA D(2) dopamine receptor A OS=Xenopus laevis GN=drd2-a PE=2 SV=1
2.00E-31 K04145 nvi:100120086 NV_30025, NV50024; putative tyramine/octopamine receptor
Receptor|Class A. Rhodopsin family|Biogenic amine [Fig]|Dopamine [Table]| DRD2; dopamine receptor D2
3.00E-32
T265_02641 2.91 7.56 MEDIUM sp#Q9PWH2#FZD10_CHICK Frizzled-10 OS=Gallus gallus GN=FZD10 PE=2 SV=1
2.00E-50 K02354 phu:Phum_PHUM440660 class D atypical G-protein coupled receptor GPRfz3, putative; K02354 frizzled 4
Receptor|Others|Wnt signaling|Frizzled / Smoothened family| FZD4, fz4; frizzled 4 3.00E-62
T265_00683 3.58 6.18 MEDIUM sp#Q6VMN6#PRLHR_MOUSE Prolactin-releasing peptide receptor OS=Mus musculus GN=Prlhr PE=2 SV=2
4.00E-41 K04209 smm:Smp_118040 neuropeptide receptor ; K04209 neuropeptide Y receptor, invertebrate
Receptor|Class A. Rhodopsin family|Neuropeptide|Neuropeptide Y [Table]| NPYNR; neuropeptide Y receptor, invertebrate
4.00E-124
T265_00777 2.51 6.79 MEDIUM sp#Q868T3#CCAPR_DROME Cardioacceleratory peptide receptor OS=Drosophila melanogaster GN=CcapR PE=2 SV=3
2.00E-34 K08376 smm:Smp_126890 G-protein coupled receptor fragment Receptor|Class A. Rhodopsin family|Neuropeptide|Neuropeptide S| NPSR1, GPR154; neuropeptide S receptor 1
9.00E-62
T265_14490 6.08 3.17 MEDIUM sp#Q9CSB4#PAR3L_MOUSE Partitioning defective 3 homolog B OS=Mus musculus GN=Pard3b PE=1 SV=2
2.00E-11 K04237 smm:Smp_127800 sap-97 Receptor|Class A. Rhodopsin family|Complement peptide|Thrombin| PARD3; partitioning defective protein 3
2.00E-27
T265_12797 2.38 6.62 MEDIUM sp#Q9VEU1#CAD89_DROME Cadherin-89D OS=Drosophila melanogaster GN=Cad89D PE=2 SV=3
1.00E-09 K04601 smm:Smp_162550 cadherin Receptor|Class B. Secretin receptor family|Cell adhesion|Cadherin EGF LAG (CELSR)| CELSR2; cadherin EGF LAG seven-pass G-type receptor 2 (flamingo)
1.00E-72
T265_06492 2.8 4.5 MEDIUM sp#Q8WPA2#AR_BOMMO Allatostatin-A receptor OS=Bombyx mori GN=AR PE=2 SV=1
2.00E-44 K04233 smm:Smp_011940 peptide (allatostatin)-like receptor ; K04233 allatostatin receptor
Receptor|Class A. Rhodopsin family|Neuropeptide|Galanin [Table]| GALRN, AR; allatostatin receptor
2.00E-86
T265_06423 2.04 4.97 MEDIUM sp#P34992#NPY1R_XENLA Neuropeptide Y receptor type 1 OS=Xenopus laevis GN=npy1r PE=2 SV=1
5.00E-15 K04204 smm:Smp_133550 neuropeptide F-like receptor Receptor|Class A. Rhodopsin family|Neuropeptide|Neuropeptide Y [Table]| NPY1R_4R_6R; neuropeptide Y receptor type 1/4/6
6.00E-79
T265_02775 2.28 4.63 MEDIUM sp#Q09388#ACM2_CAEEL Probable muscarinic acetylcholine receptor gar-2 OS=Caenorhabditis elegans GN=gar-2 PE=2 SV=3
1.00E-46 K04134 smm:Smp_145540 muscarinic acetylcholine (GAR) receptor ; K04134 muscarinic acetylcholine receptor
Receptor|Class A. Rhodopsin family|Biogenic amine [Fig]|Acetylcholine (muscarinic) [Table]| CHRMN; muscarinic acetylcholine receptor
1.00E-109
T265_13022 2.34 4.36 MEDIUM sp#Q24292#DS_DROME Protein dachsous OS=Drosophila melanogaster GN=ds PE=1 SV=3
3.00E-29 K04601 smm:Smp_167460 cadherin Receptor|Class B. Secretin receptor family|Cell adhesion|Cadherin EGF LAG (CELSR)| CELSR2; cadherin EGF LAG seven-pass G-type receptor 2 (flamingo)
0.00E+00
T265_13740 2.76 3.84 MEDIUM sp#Q9V5N8#STAN_DROME Protocadherin-like wing polarity protein stan OS=Drosophila melanogaster GN=stan PE=1 SV=4
6.00E-11 K04600 ame:551848 protocadherin-like wing polarity protein stan-like; K04600 cadherin EGF LAG seven-pass G-type receptor 1 (flamingo)
Receptor|Class B. Secretin receptor family|Cell adhesion|Cadherin EGF LAG (CELSR)| CELSR1; cadherin EGF LAG seven-pass G-type receptor 1 (flamingo)
4.00E-12
T265_08353 1.45 4.86 MEDIUM sp#Q8IS44#DRD2L_DROME Dopamine D2-like receptor OS=Drosophila melanogaster GN=D2R PE=2 SV=1
1.00E-24 K14049 smm:Smp_127720 G-protein coupled receptor fragment Receptor|Class A. Rhodopsin family|Biogenic amine [Fig]|Dopamine [Table]| DRD2N; dopamine D2-like receptor
1.00E-42
T265_02329 0.73 4.73 MEDIUM sp#Q18775#DOPR4_CAEEL Dopamine receptor 4 OS=Caenorhabditis elegans GN=dop-4 PE=2 SV=2
2.00E-27 K04157 ame:411323 5-HT2alpha; serotonin receptor; K04157 5-hydroxytryptamine receptor 2
Receptor|Class A. Rhodopsin family|Biogenic amine [Fig]|Serotonin [Table]| HTR2; 5-hydroxytryptamine receptor 2
3.00E-28
T265_13579 4.12 1.34 MEDIUM sp#O93274#FZD8_XENLA Frizzled-8 OS=Xenopus laevis GN=fzd8 PE=2 SV=1
2.00E-116 K02375 smm:Smp_155340 frizzled-like receptor Receptor|Others|Wnt signaling|Frizzled / Smoothened family| FZD5_8, fz2; frizzled 5/8 8.00E-151
T265_03837 1.96 3.24 MEDIUM sp#P56719#OX2R_RAT Orexin receptor type 2 OS=Rattus norvegicus GN=Hcrtr2 PE=2 SV=1
2.00E-11 K04239 smm:Smp_140620 G-protein coupled receptor fragment Receptor|Class A. Rhodopsin family|Neuropeptide|Orexin| HCRTR2; hypocretin (orexin) receptor 2
2.00E-14
T265_08249 2.95 2.24 MEDIUM sp#Q8IS44#DRD2L_DROME Dopamine D2-like receptor OS=Drosophila melanogaster GN=D2R PE=2 SV=1
1.00E-15 K14049 smm:Smp_127310 biogenic amine (dopamine) receptor ; K14049 dopamine D2-like receptor
Receptor|Class A. Rhodopsin family|Biogenic amine [Fig]|Dopamine [Table]| DRD2N; dopamine D2-like receptor
9.00E-23
T265_03164 2.94 1.83 MEDIUM sp#Q9WU25#ADA1A_CAVPO Alpha-1A adrenergic receptor OS=Cavia porcellus GN=ADRA1A PE=2 SV=2
3.00E-07 K04135 smm:Smp_083880 G-protein coupled receptor fragment Receptor|Class A. Rhodopsin family|Biogenic amine [Fig]|Adrenaline [Table]| ADRA1A; adrenergic receptor alpha-1A
6.00E-26
T265_15194 1.69 2.74 MEDIUM sp#Q09388#ACM2_CAEEL Probable muscarinic acetylcholine receptor gar-2 OS=Caenorhabditis elegans GN=gar-2 PE=2 SV=3
2.00E-24 K04134 smm:Smp_152540 G-protein coupled receptor fragment Receptor|Class A. Rhodopsin family|Biogenic amine [Fig]|Acetylcholine (muscarinic) [Table]| CHRMN; muscarinic acetylcholine receptor
8.00E-37
T265_08405 1.23 3.18 MEDIUM sp#Q9VNM1#NPFR1_DROME Neuropeptide F receptor OS=Drosophila melanogaster GN=NPFR1 PE=1 SV=3
3.00E-21 K04209 smm:Smp_133550 neuropeptide F-like receptor Receptor|Class A. Rhodopsin family|Neuropeptide|Neuropeptide Y [Table]| NPYNR; neuropeptide Y receptor, invertebrate
3.00E-37

T265_08621 2.46 1.92 MEDIUM sp#Q9N298#5HT1A_PANTR 5-hydroxytryptamine receptor 1A OS=Pan troglodytes GN=HTR1A PE=3 SV=1
3.00E-36 K04163 smm:Smp_126730 biogenic amine (5HT) receptor ; K04163 5-hydroxytryptamine receptor 7
Receptor|Class A. Rhodopsin family|Biogenic amine [Fig]|Serotonin [Table]| HTR7; 5-hydroxytryptamine receptor 7
3.00E-48
T265_04058 1.77 2.54 MEDIUM sp#Q25414#5HTR_LYMST 5-hydroxytryptamine receptor OS=Lymnaea stagnalis PE=2 SV=1
7.00E-44 K04153 smm:Smp_149770 G-protein coupled receptor fragment Receptor|Class A. Rhodopsin family|Biogenic amine [Fig]|Serotonin [Table]| HTR1; 5-hydroxytryptamine receptor 1
3.00E-49
T265_14776 1.63 2.19 MEDIUM sp#Q9V5N8#STAN_DROME Protocadherin-like wing polarity protein stan OS=Drosophila melanogaster GN=stan PE=1 SV=4
1.00E-08 K04600 smm:Smp_055240 cadherin Receptor|Class B. Secretin receptor family|Cell adhesion|Cadherin EGF LAG (CELSR)| CELSR1; cadherin EGF LAG seven-pass G-type receptor 1 (flamingo)
2.00E-15
T265_09554 1.07 2.68 MEDIUM sp#P25931#NPYR_DROME Neuropeptide Y receptor OS=Drosophila melanogaster GN=NepYr PE=2 SV=2
1.00E-41 K14072 smm:Smp_058080 G-protein coupled receptor fragment Receptor|Class A. Rhodopsin family|Neuropeptide|Tachykinin [Table]| NEPYR; neuropeptide Y receptor
1.00E-79
T265_15635 1.15 1.5 LOW K04585 Receptor|Class B. Secretin receptor family|Calcium-regulating peptide|Parathyroid hormone| PTHR1; parathyroid hormone receptor 1
T265_09662 0.52 2.02 MEDIUM sp#Q93126#GPR9_BALAM Probable G-protein coupled receptor No9 OS=Balanus amphitrite PE=3 SV=1
3.00E-49 K04165 ame:406068 Oa1, Oar; octopamine receptor; K04165 Octopamine receptor
Receptor|Class A. Rhodopsin family|Biogenic amine [Fig]|Octopamine| Oamb; Octopamine receptor
3.00E-54
T265_01604 0.93 1.57 LOW sp#O08786#CCKAR_MOUSE Cholecystokinin receptor type A OS=Mus musculus GN=Cckar PE=2 SV=1
2.00E-07 K04196 smm:Smp_172810 rhodopsin-like orphan GPCR Receptor|Class A. Rhodopsin family|Gut peptide|Cholecystokinin| CCKLR; cholecystokinin-like receptor
2.00E-86
T265_13638 1.77 0.38 LOW sp#P09241#OPSD_ENTDO Rhodopsin OS=Enteroctopus dofleini GN=RHO PE=1 SV=1
1.00E-32 K04255 smm:Smp_180030 opsin-like receptor ; K04255 r-opsin Receptor|Class A. Rhodopsin family|Vision|Opsin [Table]| OPN4, Rh2_7; r-opsin 5.00E-31
T265_01811 0.77 1.28 LOW sp#Q25414#5HTR_LYMST 5-hydroxytryptamine receptor OS=Lymnaea stagnalis PE=2 SV=1
1.00E-26 K04153 api:100159225 5-hydroxytryptamine receptor-like; K04153 5-hydroxytryptamine receptor 1
Receptor|Class A. Rhodopsin family|Biogenic amine [Fig]|Serotonin [Table]| HTR1; 5-hydroxytryptamine receptor 1
6.00E-29
T265_12593 0.3 1.56 LOW sp#P09241#OPSD_ENTDO Rhodopsin OS=Enteroctopus dofleini GN=RHO PE=1 SV=1
5.00E-43 K04255 smm:Smp_180030 opsin-like receptor ; K04255 r-opsin Receptor|Class A. Rhodopsin family|Vision|Opsin [Table]| OPN4, Rh2_7; r-opsin 3.00E-40
T265_01409 0.76 1.09 LOW sp#O01670#OAR2_LYMST Octopamine receptor 2 OS=Lymnaea stagnalis PE=1 SV=1
5.00E-61 K04153 smm:Smp_134820 biogenic amine (octopamine/dopamine) receptor ; K04153 5-hydroxytryptamine receptor 1
Receptor|Class A. Rhodopsin family|Biogenic amine [Fig]|Serotonin [Table]| HTR1; 5-hydroxytryptamine receptor 1
1.00E-55
T265_01234 0.13 1.67 LOW sp#Q8WPA2#AR_BOMMO Allatostatin-A receptor OS=Bombyx mori GN=AR PE=2 SV=1
7.00E-10 K08374 smm:Smp_191150 hypothetical protein Receptor|Class A. Rhodopsin family|Hypothalamic hormone|Kisspeptin| KISS1R; KISS1 receptor
3.00E-21
T265_00799 0.68 0.88 LOW sp#Q17232#OAR_BOMMO Octopamine receptor OS=Bombyx mori PE=2 SV=1
3.00E-46 K04153 api:100163581 octopamine receptor beta-2R-like Receptor|Class A. Rhodopsin family|Biogenic amine [Fig]|Serotonin [Table]| HTR1; 5-hydroxytryptamine receptor 1
4.00E-48
T265_12603 1.17 0.35 LOW sp#Q9VNM1#NPFR1_DROME Neuropeptide F receptor OS=Drosophila melanogaster GN=NPFR1 PE=1 SV=3
2.00E-24 K04209 smm:Smp_126010 neuropeptide receptor Receptor|Class A. Rhodopsin family|Neuropeptide|Neuropeptide Y [Table]| NPYNR; neuropeptide Y receptor, invertebrate
2.00E-28
T265_04998 0.21 1.24 LOW sp#Q14832#GRM3_HUMAN Metabotropic glutamate receptor 3 OS=Homo sapiens GN=GRM3 PE=1 SV=2
2.00E-86 K04605 smm:Smp_052660 metabotropic glutamate receptor Receptor|Class C. Metabotropic glutamate receptor family|Biogenic amine|Glutamate (metabotropic) [Table]| GRM2_3; metabotropic glutamate receptor 2/3
4.00E-169
T265_15636 0.6 0.63 LOW sp#P23811#SCTR_RAT Secretin receptor OS=Rattus norvegicus GN=Sctr PE=2 SV=1
3.00E-09 K04585 Receptor|Class B. Secretin receptor family|Calcium-regulating peptide|Parathyroid hormone| PTHR1; parathyroid hormone receptor 1
T265_13658 0 1.02 LOW sp#P91685#GRM_DROME Metabotropic glutamate receptor OS=Drosophila melanogaster GN=mGluRA PE=1 SV=2
3.00E-88 K04605 smm:Smp_150370 metabotropic glutamate receptor 2 3 (mglur group 2)
Receptor|Class C. Metabotropic glutamate receptor family|Biogenic amine|Glutamate (metabotropic) [Table]| GRM2_3; metabotropic glutamate receptor 2/3
2.00E-150
T265_02545 0.44 0.46 LOW sp#Q9DDN6#NPY2R_CHICK Neuropeptide Y receptor type 2 OS=Gallus gallus GN=NPY2R PE=3 SV=1
1.00E-43 K04209 smm:Smp_118040 neuropeptide receptor ; K04209 neuropeptide Y receptor, invertebrate
Receptor|Class A. Rhodopsin family|Neuropeptide|Neuropeptide Y [Table]| NPYNR; neuropeptide Y receptor, invertebrate
2.00E-76
T265_04385 0.13 0.72 LOW sp#P25931#NPYR_DROME Neuropeptide Y receptor OS=Drosophila melanogaster GN=NepYr PE=2 SV=2
3.00E-18 K14072 smm:Smp_170020 neuropeptide receptor Receptor|Class A. Rhodopsin family|Neuropeptide|Tachykinin [Table]| NEPYR; neuropeptide Y receptor
2.00E-46
T265_08199 0.27 0.42 LOW K04149 bfo:BRAFLDRAFT_226966 hypothetical protein; K04149 histamine receptor H1
Receptor|Class A. Rhodopsin family|Biogenic amine [Fig]|Histamine [Table]| HRH1; histamine receptor H1
1.00E-05
T265_10363 0.44 0 LOW sp#P25931#NPYR_DROME Neuropeptide Y receptor OS=Drosophila melanogaster GN=NepYr PE=2 SV=2
8.00E-27 K14072 smm:Smp_172170 G-protein coupled receptor fragment Receptor|Class A. Rhodopsin family|Neuropeptide|Tachykinin [Table]| NEPYR; neuropeptide Y receptor
3.00E-51
T265_04947 0.39 0 LOW sp#P09241#OPSD_ENTDO Rhodopsin OS=Enteroctopus dofleini GN=RHO PE=1 SV=1
6.00E-33 K04255 smm:Smp_180030 opsin-like receptor ; K04255 r-opsin Receptor|Class A. Rhodopsin family|Vision|Opsin [Table]| OPN4, Rh2_7; r-opsin 2.00E-38
T265_02059 0.19 0.1 LOW K04010 smm:Smp_001070.1 G-protein coupled receptor fragment CD|CD (clusters of differentiation) molecules| CD88; complement component 5 receptor 1 [HSA:728]
3.00E-43
T265_05432 0.16 0.13 LOW sp#P16423#POLR_DROME Retrovirus-related Pol polyprotein from type-2 retrotransposable element R2DM OS=Drosophila melanogaster GN=pol PE=4 SV=1
3.00E-13 K04209 smm:Smp_007070 G-protein coupled receptor fragment Receptor|Class A. Rhodopsin family|Neuropeptide|Neuropeptide Y [Table]| NPYNR; neuropeptide Y receptor, invertebrate
4.00E-31
T265_01572 0 0.14 LOW sp#Q8ITC7#CAPAR_DROME Neuropeptides capa receptor OS=Drosophila melanogaster GN=capaR PE=2 SV=3
9.00E-11 K05052 smm:Smp_141880 neuropeptide receptor Receptor|Class A. Rhodopsin family|Neuropeptide|Neuromedin U| NMUR1; neuromedin U receptor 1
1.00E-16
T265_04946 0.13 0 LOW sp#P09241#OPSD_ENTDO Rhodopsin OS=Enteroctopus dofleini GN=RHO PE=1 SV=1
6.00E-83 K04255 smm:Smp_104210 opsin-like receptor ; K04255 r-opsin Receptor|Class A. Rhodopsin family|Vision|Opsin [Table]| OPN4, Rh2_7; r-opsin 5.00E-99
Related Documents