Supplementary Appendix S1 Additional image pairs used in the following study: Repeat photography as a tool for detecting and monitoring historical changes in South African coastal habitats B Reimers, CL Griffiths and MT Hoffman African Journal of Marine Science 2014, 36(3): 387–398 http://dx.doi.org/10.2989/1814232X.2014.95 4618 Following paired images are arranged in sequence from west (Saldanha Bay) to east (de Hoop)

Supplementary Appendix S1 Additional image pairs used in the following study: Repeat photography as a tool for detecting and monitoring historical changes.
Dec 17, 2015
Welcome message from author
This document is posted to help you gain knowledge. Please leave a comment to let me know what you think about it! Share it to your friends and learn new things together.
Transcript
Supplementary Appendix S1
Additional image pairs used in the following study:Repeat photography as a tool for detecting and monitoring
historical changes in South African coastal habitatsB Reimers, CL Griffiths and MT Hoffman
African Journal of Marine Science 2014, 36(3): 387–398http://dx.doi.org/10.2989/1814232X.2014.954618
Following paired images are arranged in sequence from west (Saldanha Bay) to east (de Hoop)

Langebaan Lagoon, Klein Oosterwal in 2002 (left) and in 2012 (right: both CL Griffiths).
Note disappearance of Zostera beds in recent image
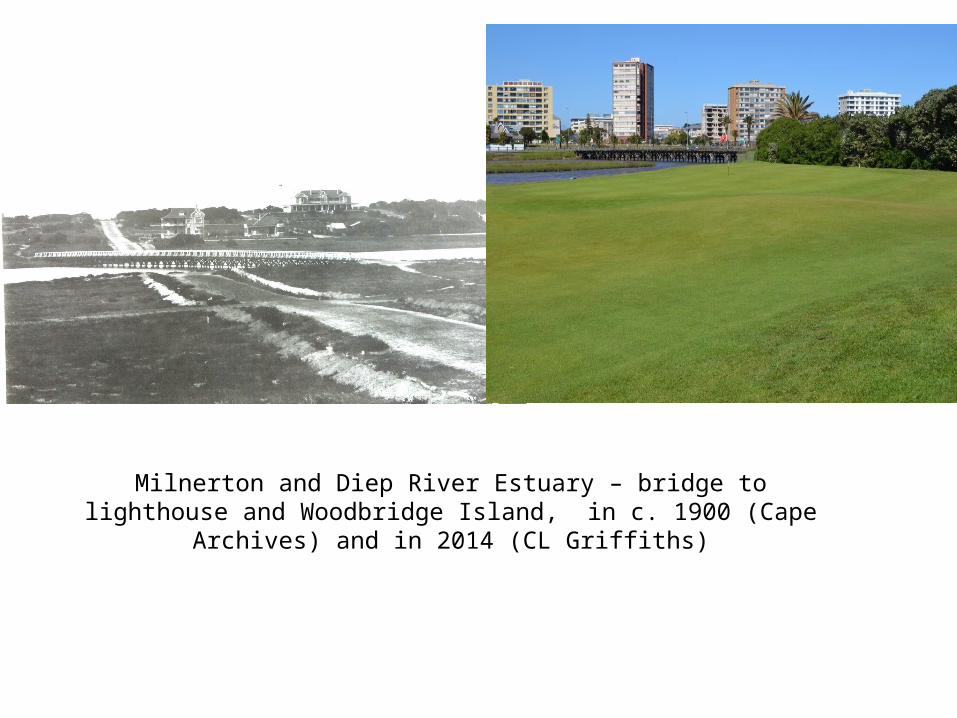
Milnerton and Diep River Estuary – bridge to lighthouse and Woodbridge Island, in c. 1900 (Cape Archives) and in 2014 (CL Griffiths)
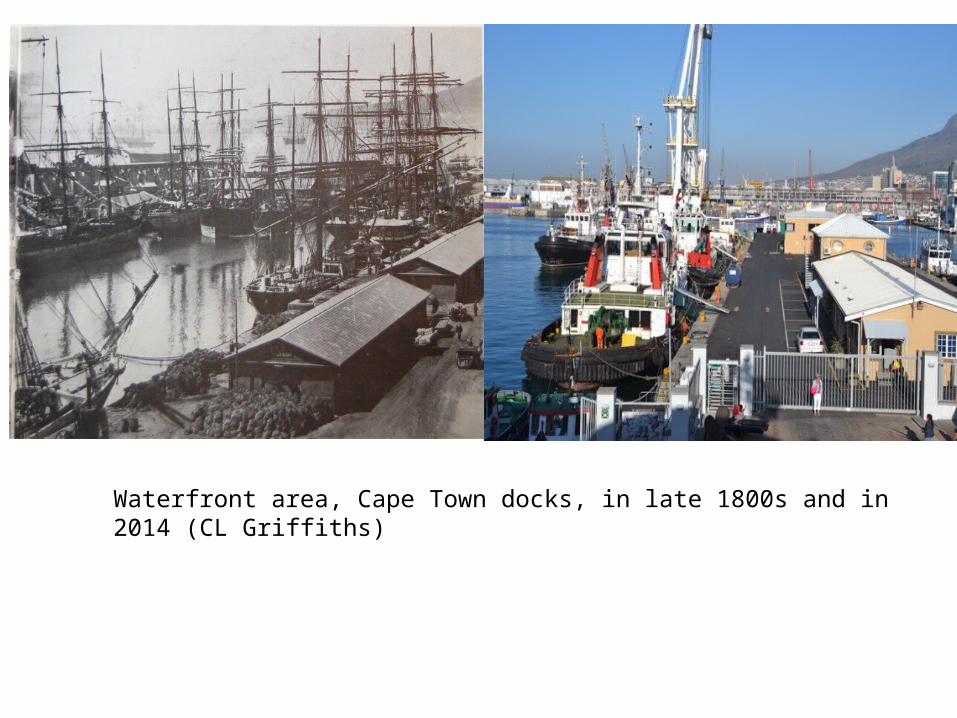
Waterfront area, Cape Town docks, in late 1800s and in 2014 (CL Griffiths)
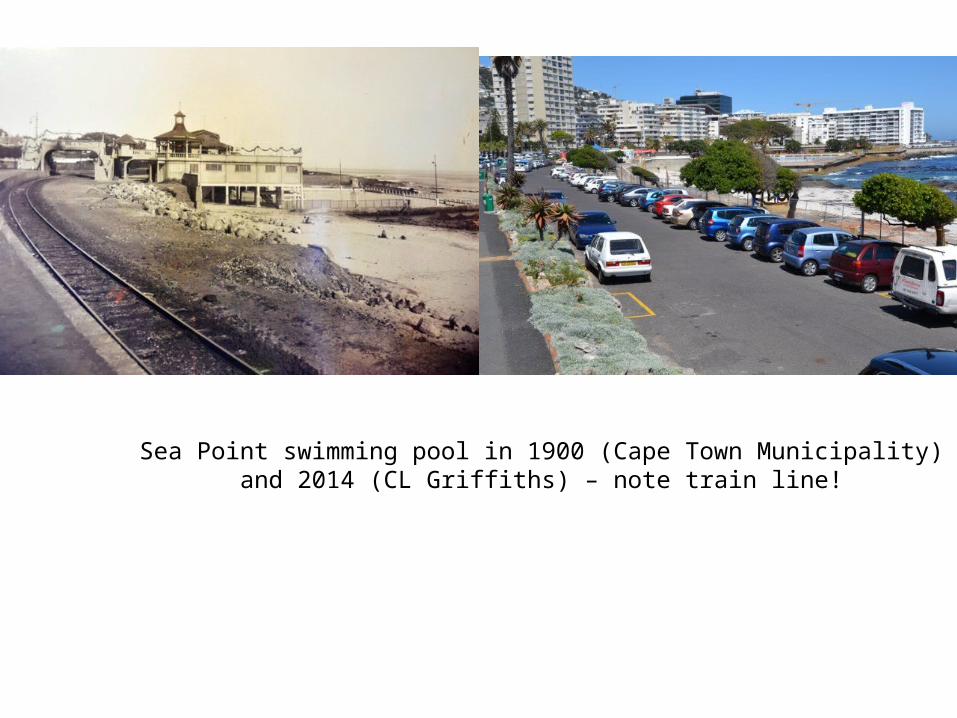
Sea Point swimming pool in 1900 (Cape Town Municipality) and 2014 (CL Griffiths) – note train line!
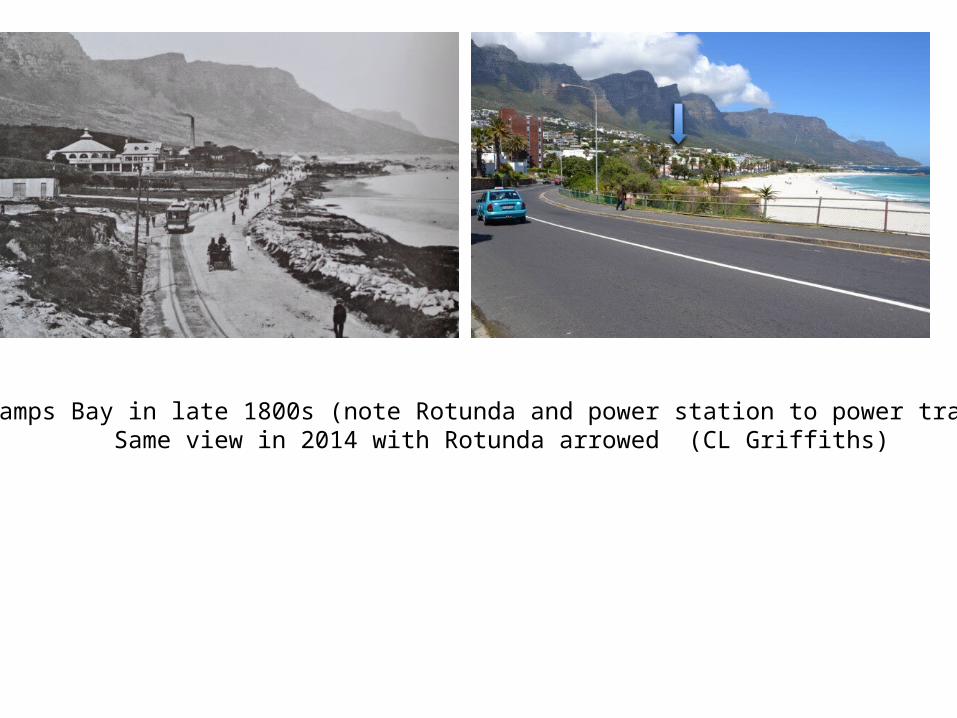
Camps Bay in late 1800s (note Rotunda and power station to power trams).Same view in 2014 with Rotunda arrowed (CL Griffiths)
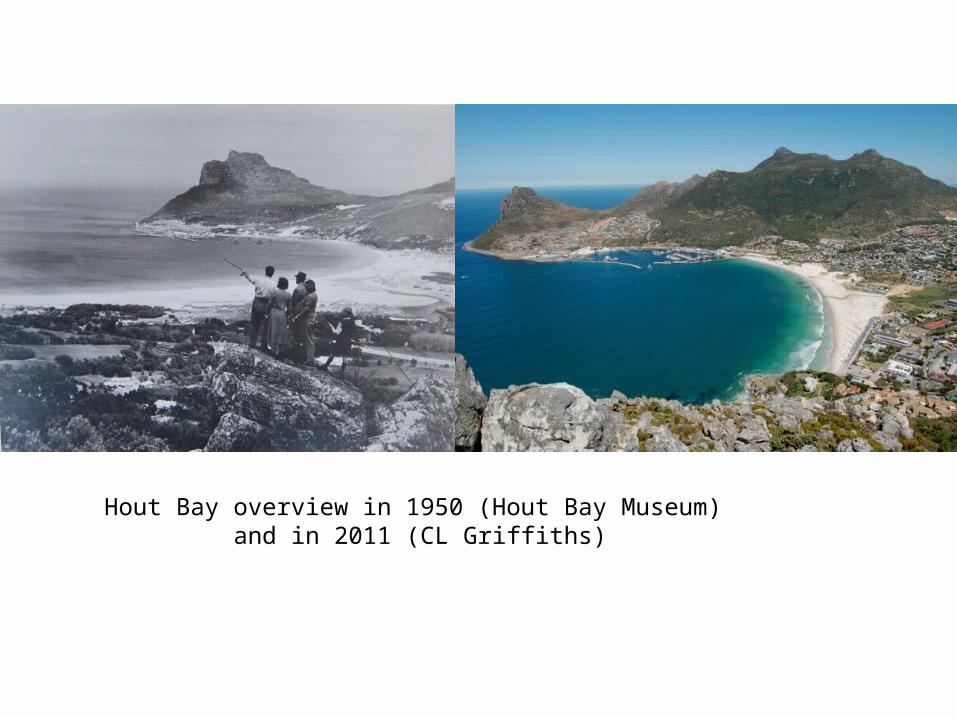
Hout Bay overview in 1950 (Hout Bay Museum) and in 2011 (CL Griffiths)
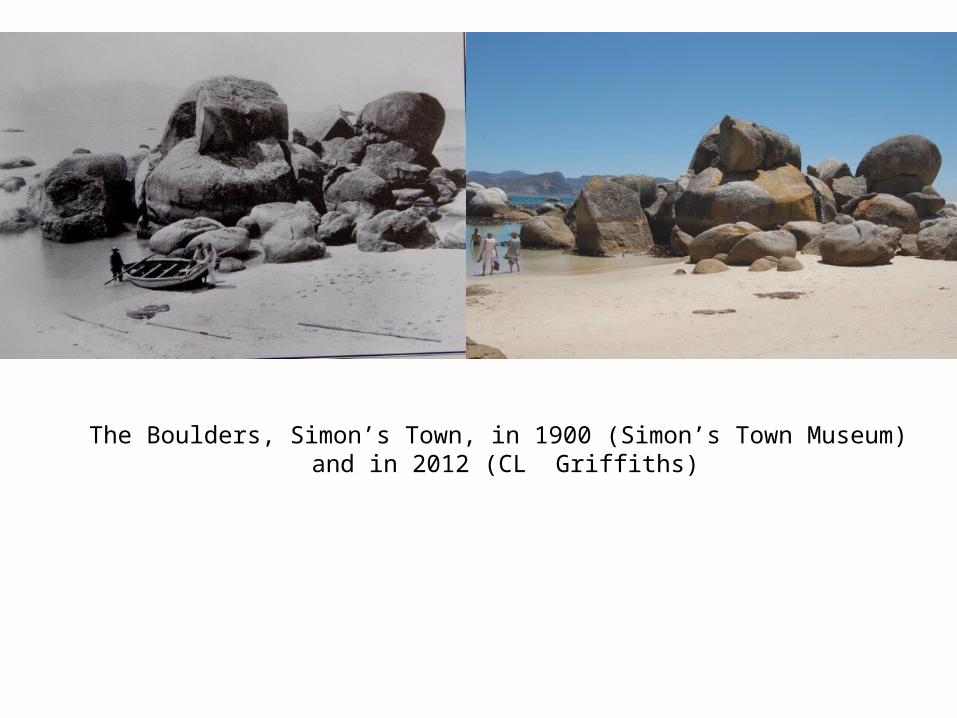
The Boulders, Simon’s Town, in 1900 (Simon’s Town Museum) and in 2012 (CL Griffiths)
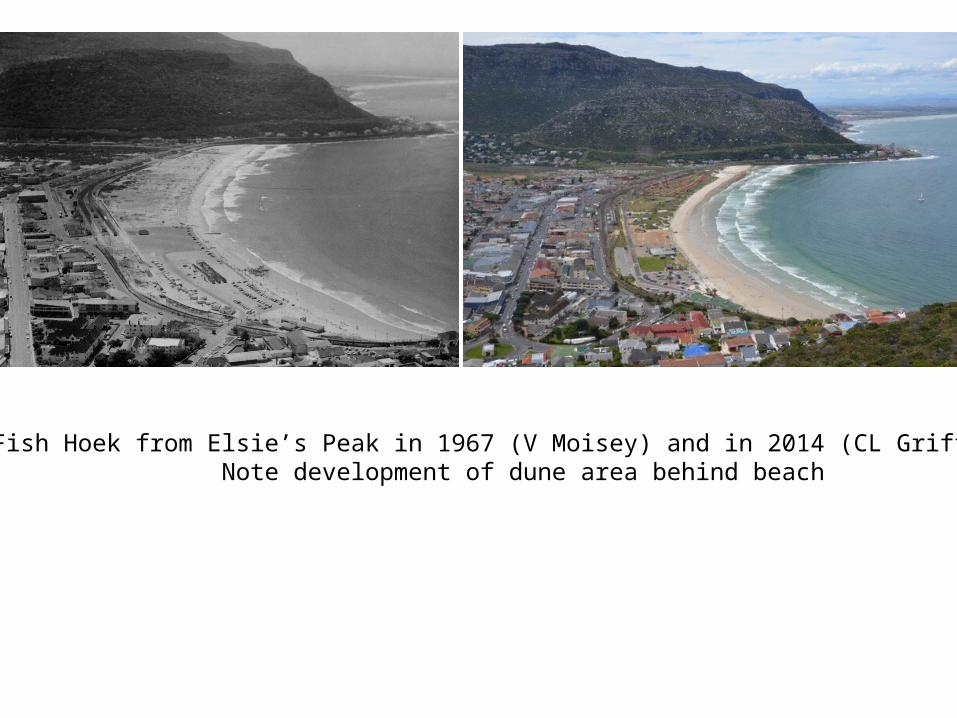
Fish Hoek from Elsie’s Peak in 1967 (V Moisey) and in 2014 (CL Griffiths).Note development of dune area behind beach
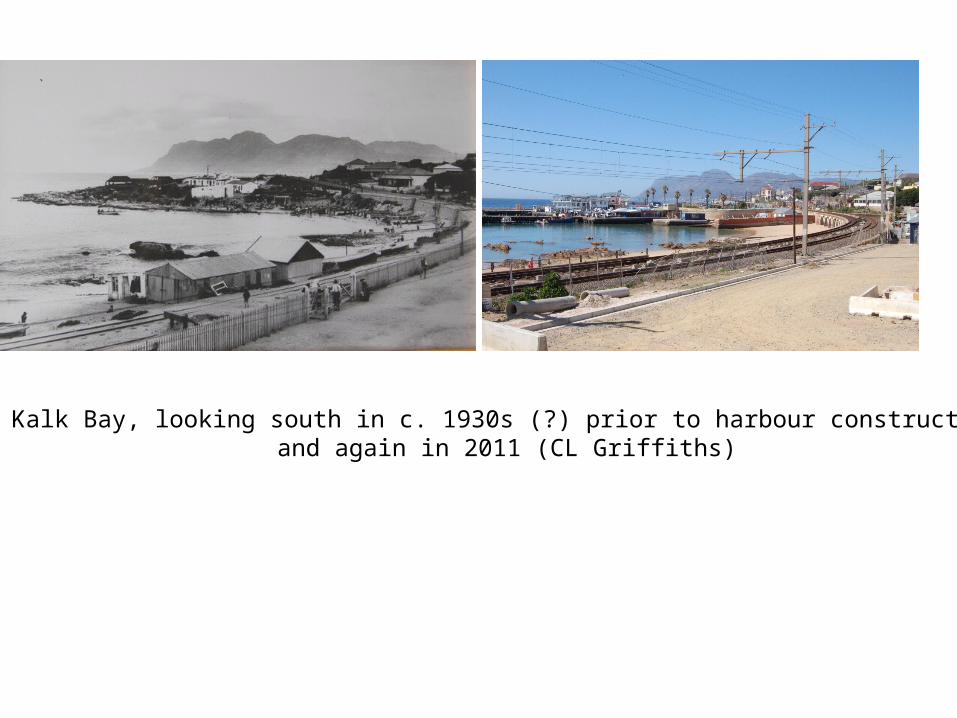
Kalk Bay, looking south in c. 1930s (?) prior to harbour construction and again in 2011 (CL Griffiths)
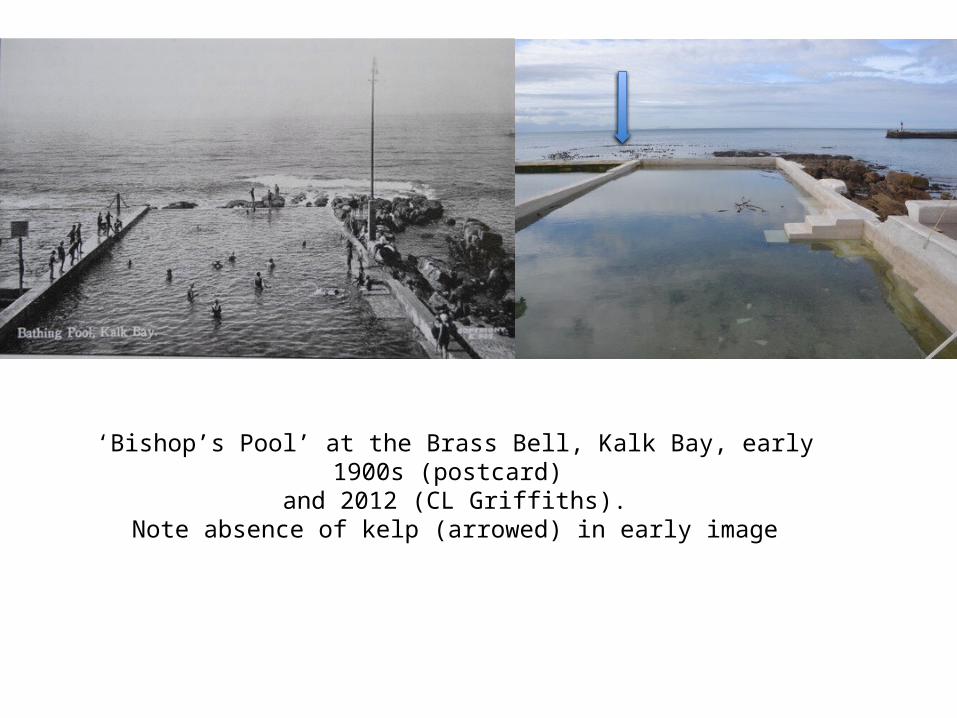
‘Bishop’s Pool’ at the Brass Bell, Kalk Bay, early 1900s (postcard) and 2012 (CL Griffiths).
Note absence of kelp (arrowed) in early image
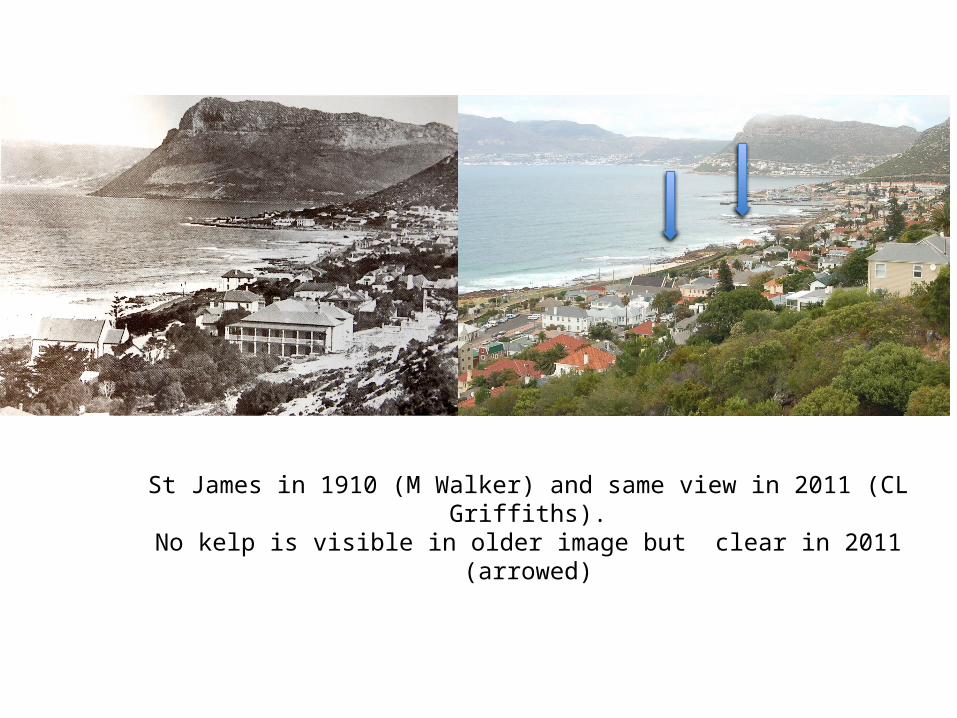
St James in 1910 (M Walker) and same view in 2011 (CL Griffiths).No kelp is visible in older image but clear in 2011 (arrowed)
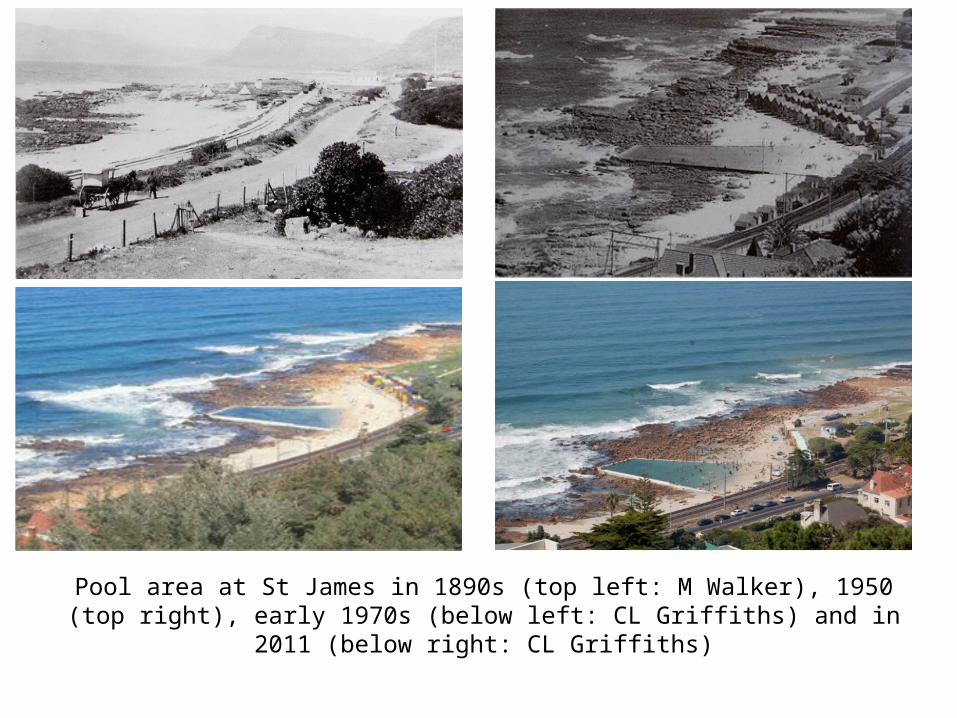
Pool area at St James in 1890s (top left: M Walker), 1950 (top right), early 1970s (below left: CL Griffiths) and in 2011 (below right: CL Griffiths)
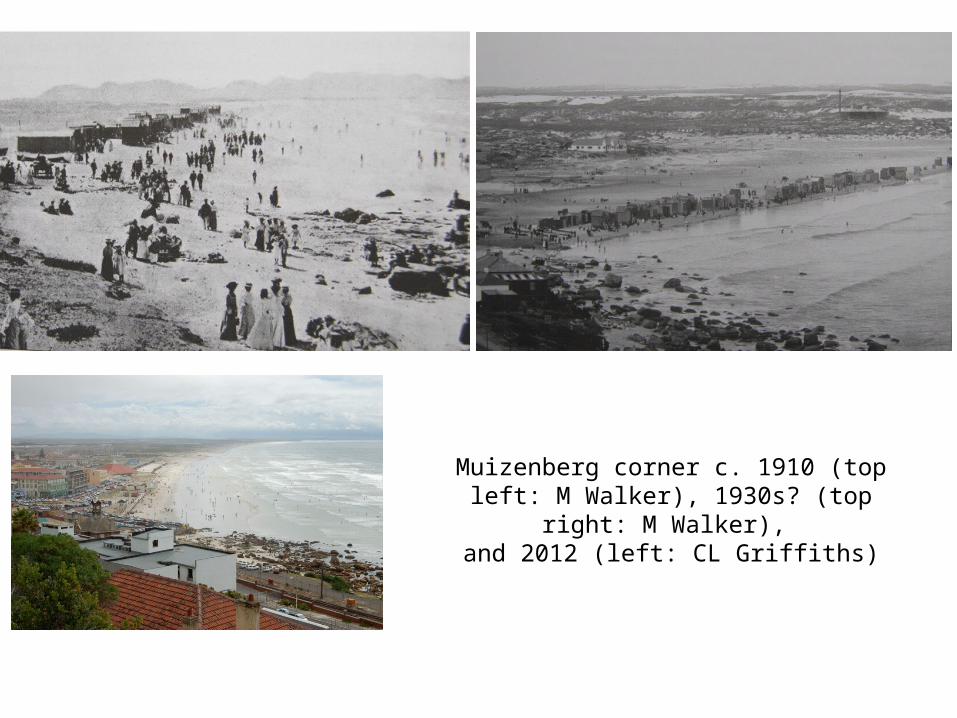
Muizenberg corner c. 1910 (top left: M Walker), 1930s? (top right: M Walker),
and 2012 (left: CL Griffiths)

Hermanus Old Harbour c. 1900 (Old Harbour Museum) and in 2012 (B Reimers). Note lack of kelp in historic image
(cf. dense beds above and around red roofs in 2012 as arrowed)

Gully at De Hoop in 1992 (left: CL Griffiths) and 2012 (right: B Reimers).Note arrival of kelps (arrow) during this interval
Related Documents


![Multiplying and detecting propagating microwave photons using … · such as of antibunched photons [34,35], nonclassical photon pairs [24,28,31,36], and multiphoton Fock states [40,41].](https://static.cupdf.com/doc/110x72/60fd33a14b0e0c4c127bf4e2/multiplying-and-detecting-propagating-microwave-photons-using-such-as-of-antibunched.jpg)


