Supplemental Methods, Figures and Tables Gene-expression profiling of CD8 T-cells predicts prognosis in Crohn’s disease and ulcerative colitis James C. Lee 1,2,3 , Paul A. Lyons 1,2 , Eoin F. McKinney 1,2 , John M. Sowerby 1,2 , Edward J. Carr 1,2 , Francesca Bredin 2,3 , Hannah M. Rickman 1,2 , Huzefa Ratlamwala 1,2 , Alexander Hatton 1,2 , Tim F. Rayner 1,2 , Miles Parkes 2,3 , Kenneth G.C. Smith 1,2* 1 Cambridge Institute for Medical Research and 2 Department of Medicine, University of Cambridge School of Clinical Medicine, Addenbrooke’s Hospital, Hills Rd, Cambridge, CB2 0XY, UK. 3 NHS Department of Gastroenterology, Addenbrooke’s Hospital, Hills Rd, Cambridge, CB2 0QQ, UK. Contents Supplemental Methods Supplemental Figures 1-10 Supplemental Tables 1-4

Welcome message from author
This document is posted to help you gain knowledge. Please leave a comment to let me know what you think about it! Share it to your friends and learn new things together.
Transcript

Supplemental Methods, Figures and Tables
Gene-expression profiling of CD8 T-cells predicts prognosis in Crohn’s disease and
ulcerative colitis
James C. Lee1,2,3, Paul A. Lyons1,2, Eoin F. McKinney1,2, John M. Sowerby1,2, Edward J.
Carr1,2, Francesca Bredin2,3, Hannah M. Rickman1,2, Huzefa Ratlamwala1,2, Alexander
Hatton1,2, Tim F. Rayner1,2, Miles Parkes2,3, Kenneth G.C. Smith1,2*
1 Cambridge Institute for Medical Research and 2 Department of Medicine, University of
Cambridge School of Clinical Medicine, Addenbrooke’s Hospital, Hills Rd, Cambridge, CB2
0XY, UK. 3 NHS Department of Gastroenterology, Addenbrooke’s Hospital, Hills Rd,
Cambridge, CB2 0QQ, UK.
Contents
Supplemental Methods
Supplemental Figures 1-10
Supplemental Tables 1-4

Supplementary Methods
Consensus clustering
Following independent quality control assessment, variance stabilisation normalisation and
correction of batch effects in R, we investigated whether any substructure was present in the
CD4 and CD8 T-cell gene expression data from both disease cohorts using an unsupervised
classification method. Unlike standard unsupervised classification procedures, which provide
no information as to whether clusters are stable and reproducible or simply reflect random
sampling variation, we used iterative consensus clustering (1). This is a generalised, model
independent, resampling methodology that can assess cluster stability by providing a
consensus classification output across multiple runs of a clustering algorithm using
subsampling of the data. Samples that consistently cluster together are, by definition, reliable
cluster members, whereas those whose co-clustering is dependent upon the presence of other
samples are less reliable. We performed 5000 iterations of consensus clustering using two
different clustering methods (k-means and hierarchical clustering) with an 80% subsampling
ratio. We also employed an extension of the standard consensus clustering methodology,
which enables visualisation of the merged consensus results between the different clustering
methodologies (2). This can improve the confidence in any apparent clusters by
demonstrating that similar results are produced using methodologically different clustering
algorithms. All clustering algorithms used a Euclidean distance metric and average-linkage
clustering.
Assessment of clustering significance
To further confirm that any clusters were real and not due to overfitting of the data, we used a
another independent method to evaluate the validity and statistical significance of these
results (3). This method, implemented using the sigclust package in R, tests the null
hypothesis that the entire data can be modelled as coming from a single, multivariate

Gaussian distribution. The rationale for this approach is that if a dataset can be appropriately
modelled by such a Gaussian distribution, then any clustering algorithm that would split this
data into distinct clusters is not significant. This method therefore enables direct
quantification of the significance of any given clustering.
Classifier generation
We investigated whether simple subgroup classifiers, consisting of smaller numbers of genes,
could be generated that would enable prediction of subgroup membership in either disease
cohort without the necessity and expense of whole-genome gene-expression analysis by
microarray. We used two different classification algorithms, weighted-voting (4) and random
forests (5) to generate classifiers of various sizes (between 4 and 100 genes). To do this we
partitioned our overall dataset into two independent cohorts, each containing both UC and
CD patients, with preservation of the ratio between IBD1 and IBD2 patients. Classifiers were
generated in one of the cohorts (training set) and tested upon the other cohort to
independently assess their performance. The performance of classifiers was found to be
relatively insensitive to their size and the method that was used to generate them.
PBMC gene-expression analysis
To assess whether the IBD1/2 subgroups were detectable in PBMC we initially performed a
principal component analysis (implemented in MEV (6)) to examine the distribution of the
samples. We then performed iterative consensus clustering to examine whether the subgroups
that might exist within the data bore any resemblance to the IBD1/2 subgroups (Supplemental
Figure 2). We also applied the classifier detailed in Supplemental Figure 4 to the PBMC data
to determine if this could ascribe subgroup designation – as it had in the CD8 T-cell datasets.

R code for analysis
The R code used for analyses following preprocessing is shown below, where “CD_analysis”
is CD dataset. Analysis of the UC dataset is not shown but was performed using identical
commands:
# Consensus clustering (packages = clusterCons, affy)
� cd_data.frame=data.frame(t(exprs(CD_analysis)))
� cd_consensus_clustering=cluscomp(cd_data.frame, algorithms=list(‘kmeans’, “hclust”), clmin=2, clmax=5, reps=5000, prop=0.8, merge=1)
# To assess optimal number of groups
� mergeAUC=aucs(cd_consensus_clustering)
� mergeDK=deltak(mergeAUC)
� dkplot(mergeDK) # To visualise results (shown for 2 groups) (package=heatmap.2)
� cd_kmeans=cd_consensus_clustering$e1_kmeans_k2
� cd_hclust=cd_consensus_clustering$e2_hclust_k2
� cd_merge=cd_consensus_clustering$merge_k2
� heatmap.2(cd_merge, col=bluered, key=F, trace=’none’, rowsep=c(1:35), colsep=c(1:35), sepcolor=”black”, sepwidth=c(0.03,0.03), labRow=””, labCol=CD_analysis$patient_number)
# Add column to phenoData of expression set indicating group designation
� CD_analysis$group=c(1,1,2,1,2,1,1,etc) # To compare distribution of data with multivariate Gaussian distribution (package=sigclust)
� cd_for_sigclust=t(exprs(CD_analysis))
� sigclust(cd_for_sigclust, nsim=500, nrep=1, labflag=1, label=CD_analysis$group, icovest=1)
# To determine differentially-expressed genes between subgroups (package=limma)
� CDdesign=model.matrix(~-1+factor(CD_analysis$group))
� colnames(CDdesign)=c(‘A’, ‘B’)
� CDfit=lmFit(CD_analysis, CDdesign)
� CDmatrix=makeContrasts(A-B, levels=CDdesign)
� CDfit2=contrasts.fit(CDfit, CDmatrix)
� CDfit3=eBayes(CDfit2)
� CD_results=decideTests(CDfit3, adjust.method=”holm”, p=0.05) # To subset this (or any other) expression set by this signature
� CD_diff.exprs.genes.only=CD_analysis[as.logical(CD_results),] # Classifier generation for object “All_Samples” (method shown using Random Forests; package=MLInterfaces)
� group=as.factor(All_samples$group)

� classifier=MLearn(group~., All_samples, randomForestI, 1:34, importance=T)
� confuMat(classifier)
� varImpPlot(All_samples(classifier))
References
1. Monti S, Tamayo P, Mesirov J, Golub T Consensus clustering: A resampling-based
method for class discovery and visualization of gene expression microarray data.
Machine Learning 2003; 52: 91-118.
2. Simpson TI, Armstrong JD, Jarman AP Merged consensus clustering to assess and
improve class discovery with microarray data. BMC Bioinformatics 2010; 11: 590.
3. Liu Y, Hayes DN, Nobel A, Marron JS Statistical Significance of Clustering for High-
Dimension, Low-Sample Data. J Am Stat Assoc 2008; 103: 1281-1293.
4. Golub TR, et al. Molecular classification of cancer: class discovery and class prediction by
gene expression monitoring. Science 1999; 286: 531-537.
5. Breiman L Random forests. Machine Learning 2001; 45: 5-32.
6. Saeed AI, et al. TM4: a free, open-source system for microarray data management and
analysis. Biotechniques 2003; 34: 374-378.

A
2 groups
2 groups
3 groups 4 groups
3 groups 4 groups
C
0.0 0.2 0.4 0.6 0.8 1.0
0.0
0.2
0.4
0.6
0.8
1.0
p
L(p)
2 clusters, Gini = 0.3813 clusters, Gini = 0.5774 clusters, Gini = 0.6375 clusters, Gini = 0.69
B
0.0 0.2 0.4 0.6 0.8 1.0
0.0
0.2
0.4
0.6
0.8
1.0
p
L(p)
2 clusters, Gini = 0.4013 clusters, Gini = 0.5364 clusters, Gini = 0.6055 clusters, Gini = 0.678
D
Supplemental Figure 1. The substructure within the CD8 T-cell gene-expression data from both UC and CD is best explained by the presence of two distinct subgroups. Consensus clustering heatmaps demonstrating the merged output of 5000 iterations of hierarchical and k-means clustering of (A) CD patients and (B) UC patients for the specified number of groups. Patient samples are arranged in the same order along the x and y axes. The colours of the intersecting squares represent the frequency with which samples cluster together both within individual consensus clustering analyses and also between analyses using different methods of clustering. The colour ranges from red (patients always cluster together) to blue (patients never cluster together). The optimal number of subgroups can be assessed by visual inspection of consensus heatmaps and by deriving the Gini coefficient from Lorenz plots relating to the respective number of clusters – shown for the (C) CD patients and (D) UC patients.

A B
IBD1
IBD2
IBD1
IBD2
C D
Supplemental Figure 2. The subgroups identified within CD8 T-cells cannot be detected within PBMC. Principal component analysis of PBMC gene expression data from CD (A) and UC (B). Colours indicate CD8 T-cell subgroup designation (red - IBD1, blue - IBD2). (B) The clusters of CD patients (C) and UC patients (D) that were produced by unsupervised k-means consensus clustering of the PBMC gene-expression data from the IBD cohorts. The coloured bar beneath each dendrogram corresponds to the original IBD1/2 subgroup membership. (E) Application of the 4 gene classifier generated and validated in CD8 T-cell expression datasets to PBMC gene-expression data. IBD1 and IBD2 patients are shown as blue and green dots respectively. Confidence of assignment is shown on the y axis from +1 (definitely IBD2) to -1 (definitely IBD1). Confidence threshold set at ±0.25. 2 samples were unclassified and 32 samples were misclassified. Genes used in this classifier: interleukin enhancer binding factor 2 (ILF2), GDP dissociation inhibitor 2 (GDI2), cluster of differentiation 44 (CD44) and interleukin-10 receptor, beta (IL10RB).
E
441
442
446
451
466
408
411
413
419
424
425
434
454
426
445
421
463
432
464
409
444
443
422
465
453
412
423
429
403
449
457
467
472
401
428
415
430
436
447
417
404
439
433
418
402
427
448
460
416
410
405
468
462
461
459
458
452
450
440
Sample
1.00
-1.00
0.75
- 0.75
0.50
- 0.50
- 0.25
0.25
0.00
Con
fiden
ce
P < 0.0001r = 0.562
P < 0.0001
P < 0.0001r = 0.442
P < 0.0001
15
10
5
01.2 1.4 1.6 1.8 2.0 2.2
1.6 1.8 2.0 2.2 2.40
10
8
6
4
2
A
qP
CR
exp
ress
ion
leve
l
Microarray expression level
B
qP
CR
exp
ress
ion
leve
l
Microarray expression level
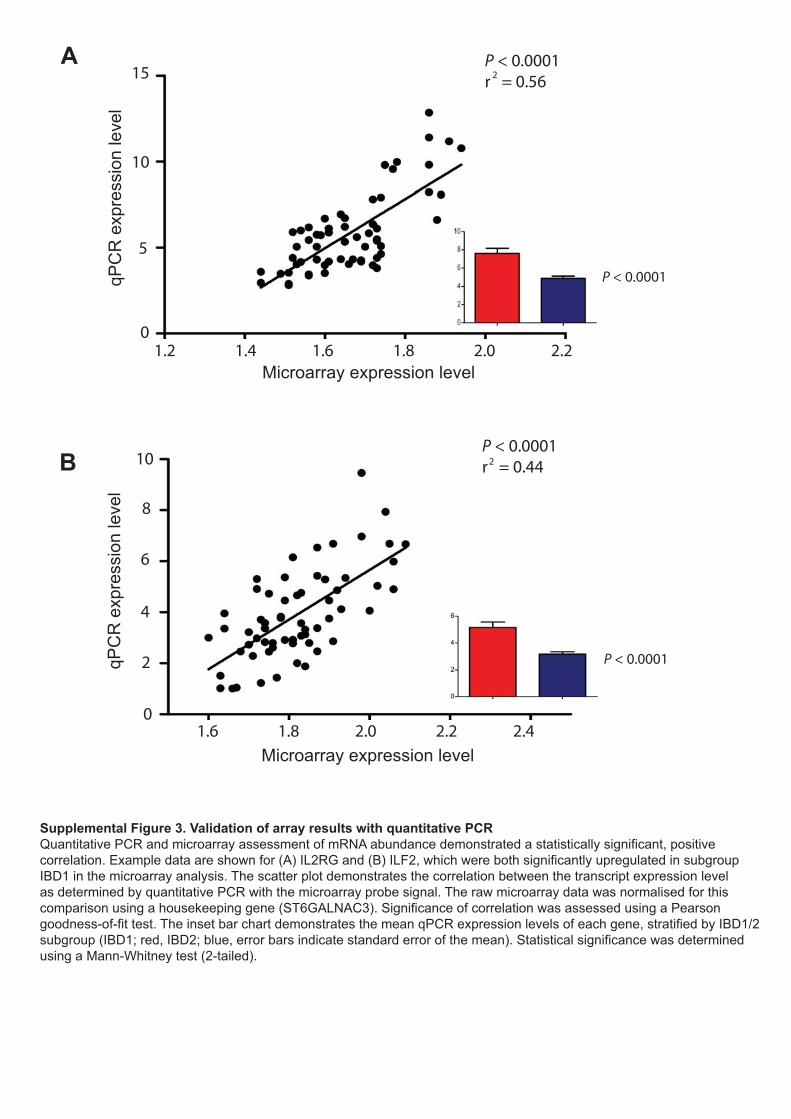
Supplemental Figure 3. Validation of array results with quantitative PCRQuantitative PCR and microarray assessment of mRNA abundance demonstrated a statistically significant, positive correlation. Example data are shown for (A) IL2RG and (B) ILF2, which were both significantly upregulated in subgroup IBD1 in the microarray analysis. The scatter plot demonstrates the correlation between the transcript expression level as determined by quantitative PCR with the microarray probe signal. The raw microarray data was normalised for this comparison using a housekeeping gene (ST6GALNAC3). Significance of correlation was assessed using a Pearson goodness-of-fit test. The inset bar chart demonstrates the mean qPCR expression levels of each gene, stratified by IBD1/2 subgroup (IBD1; red, IBD2; blue, error bars indicate standard error of the mean). Statistical significance was determined using a Mann-Whitney test (2-tailed).

406
413
425
451
419
428
441
444
448
472
410
468
482
446
426
453
470
465
463
462
457
450
449
434
430
422
405
401
460
456
439
433
423
1.00
-1.00
0.75
- 0.75
0.50
- 0.50
- 0.25
0.25
0.00
Con
fiden
ce
Sample
Supplemental Figure 4. Subgroup designation can be accurately ascribed using a smaller gene listClassifiers were generated in a training-set of patients using different prediction algorithms and were then tested in an independent test-set of patients to assess their performance. An example is shown of the performance of a four gene classifier, which was generated using a weighted-voting algorithm. IBD1 and IBD2 patients, defined using whole CD8 T-cell microarray data, are shown as blue and green dots respectively. Confidence of assignment is shown on the y axis from +1 (definitely IBD1) to -1 (definitely IBD2). Confidence threshold set at ±0.25. No samples were unclassified or misclassified. The genes used in this classifier were interleukin enhancer binding factor 2 (ILF2), GDP dissociation inhibitor 2 (GDI2), cluster of differentiation 44 (CD44) and interleukin-10 receptor, beta (IL10RB).

A B
C
P = 0.0004
IBD1 (positively correlated) IBD2 (positively correlated)
0.80.70.60.50.40.30.20.10.0E
nric
hmen
t sco
re
IBD1IBD2
DIBD1IBD2
P = 0.01-0.6-0.5-0.4-0.3-0.2-0.10.0
Enr
ichm
ent s
core
IBD1 (positively correlated) IBD2 (positively correlated)
Supplemental Figure 5. The IBD1/2 signature is analogous to the prognostic signature previously described in SLE and AAVGene-set enrichment profiles of the (A) upregulated and (B) downregulated SLE/AAV signature genes within the IBD1/2 signature. Genes are ranked in order (by signal-to-noise ratio) along the x axis from the most up-regulated in IBD1 to the most upregulated in IBD2 (downregulated in IBD1). The relative position of each of the SLE/AAV signature genes within the IBD1/2 signature is indicated by the vertical black lines along the x axis. The significance of the enrichment score is determined by comparison with a null distribution which is permuted from the data according to a standard method (Subramanian et al. (2005) Proc Natl Acad Sci U S A 102: 15545-15550). The clusters of (C) CD patients and (D) UC patients that were produced by k-means clustering of the IBD cohorts using the SLE/AAV signature. The coloured bar beneath each dendrogram corresponds to the original IBD1/2 subgroup membership.

Pro
porti
on w
ithou
t fur
ther
trea
tmen
t esc
alat
ion
(%)
()
Follow up (days)
10Number at risk
11
IBD1IBD2
P = 0.008
IBD1IBD2
811
69
38
27
05
05
00
Supplemental Figure 6. The subsequent disease course of CD patients following an initial treatment escalation. Kaplan-Meier survival curve demonstrating the proportion of CD patients who, having received one treatment escalation, subsequently required a second escalation (due to unremitting, persistent disease activity). All CD patients who required a treatment escalation at any time were included in this analysis. The patients are stratified according to IBD1/2 subgroup. Statistical significance was determined using Log-rank test (1df).

P = 0.004FDR q = 0.059
IBD1 (positively correlated) IBD2 (positively correlated)
0.80.70.60.50.40.30.20.10.0
Enr
ichm
ent s
core
A
P = 0.019FDR q = 0.100
IBD1 (positively correlated) IBD2 (positively correlated)
0.70.60.50.40.30.20.10.0E
nric
hmen
t sco
re
B
P = 0.002FDR q = 0.108
IBD1 (positively correlated) IBD2 (positively correlated)
0.70.60.50.40.30.20.10.0E
nric
hmen
t sco
re
C P = 0.014FDR q = 0.067
IBD1 (positively correlated) IBD2 (positively correlated)
0.70.60.50.40.30.20.10.0E
nric
hmen
t sco
re
D
Supplemental Figure 7. Gene-set enrichment profiles of pathways enriched within the IBD1/2 signature.Gene-set enrichment plots demonstrating the enrichment of (A) IL-7 signalling pathway, (B) T-cell receptor signalling pathway, (C) IL-2 signalling pathway and (D) CD28 co-stimulatory signalling, within the genes that are differentially expressed between subgroups IBD1 and IBD2. Genes are ranked in order (by signal-to-noise ratio) along the x axis from the most up-regulated in IBD1 to the most upregulated in IBD2 (downregulated in IBD1).The relative position of each gene within a pathway is indicated by the vertical black lines along the x axis. The significance of the enrichment score is determined by comparison with a null distribution, which is permuted from the data according to a standard method. The nominal P value and false-discovery rate (FDR) q value shown were calculated by assessing the enrichment of selected pathways in the IBD1/2 signature in half of the patients, where the pathways under investigation were pre-selected due to enrichment (P < 0.05) in an independent analysis using the other half. Standard significance cut-off P < 0.05, q < 0.25.

IBD1 (positively correlated) IBD2 (positively correlated)
0.6
0.5
0.4
0.3
0.2
0.1
0.0
Enr
ichm
ent s
core P = 0.048
Supplemental Figure 8. Gene-set enrichment profile demonstrating the enrichment of a CD8 T-cell activation signature within the IBD1/2 signature.Gene-set enrichment plot demonstrating the enrichment of a genes that are known to be differentially expressed upon CD8 T-cell activation by CD3/CD28 signalling, within the genes that are differentially expressed between subgroups IBD1 and IBD2in the entire dataset (n=67). 738 gene signature derived from Wang et al. (2008, BMC Genomics) by cross-platform mapping the list of genes that were significantly altered upon CD8 T-cell stimulation to Affymetrix probe annotations. 520 transcripts did not have an equivalent probe and were excluded as they could not be mapped (mostly unannotated ESTs). Genes are ranked in order (by signal-to-noise ratio) along the x axis from the most up-regulated in IBD1 to the most upregulated in IBD2 (downregulated in IBD1). The relative position of each gene within a pathway is indicated by the vertical black lines along the x axis. The significance of the enrichment score is determined by comparison with a null distribution, which is permuted from the data according to a standard method.

CD
62L
CD45RA
Per
cent
age
of C
D8
T-ce
lls
IL7R
Mea
n Fl
uore
scen
ce In
tens
ity
CD
25 M
ean
Fluo
resc
ence
Inte
nsity
Naive CentralMemory
EffectorMemory
EMRA
Naive CentralMemory
EffectorMemory
EMRA Naive CentralMemory
EffectorMemory
EMRA
NS
NS
NS
NS
NSNS
NS
NS
NS
NS
NS
NSA B
C D
Supplemental Figure 9. Contemporaneous immunophenotyping of CD8 T-cell memory compartments.(A) Representative FACS plot demonstrating CD8 T-cell memory compartments. Gated on CD3+CD8+ cells. Populations shown are naive (CD45RA+CD62L+), central memory (CD45RA-CD62L+), effector memory (CD45RA-CD62L-) and EMRA (CD45RA+CD62L-). (B) Relative sizes of CD8 T-cell memory compartments, expressed as a percentage of all CD8 T-cells. (C) IL7R mean fluorescence intensity. Geometric mean fluorescence intensity of interleukin-7 receptor (IL7R) on CD8 T-cell memory compartments. (D) IL2RA (CD25) mean fluorescence intensity. Geometric mean fluorescence intensity of interleukin-2 receptor alpha (IL2RA/CD25) on CD8 T-cell memory compartments. The ‘box’ and ‘whiskers’ of each ‘box and whiskers’ plot indicate the lower and upper quartiles and the range respectively. The colour of each ‘box’ refers to IBD1/2 subgroup (IBD1: red, IBD2; blue). Statistical significance (P<0.05) in panels b-d was determined using a Mann-Whitney test (2-tailed). NS; not significant. n=67.

A
CGroup 1 (20)Group 2 (12)
Group 1 (17)Group 2 (17)
Pro
porti
on w
ithou
ttre
atm
ent e
scal
atio
n (%
)
Follow up (days)Follow up (days) Follow up (days)Follow up (days)
P = 0.95 P = 0.88Pro
porti
on w
ithou
ttre
atm
ente
scal
atio
n(%
)tre
atm
ent e
scal
atio
n (%
)
B
D
17
Number at risk
17Group 1Group 2
1513
1012
79
67
36
33
10 12
Number at risk
20Group 1Group 2 9
168
14812
711
64
44
01
Supplemental Figure 10. Transcriptional differences in CD4 T-cells do not predict disease courseConsensus clustering heatmaps demonstrating the clustering of CD4 samples from (A) CD patients and (B) UC patients. Patients are arranged in the same order along the x and y axes. The colours of the intersecting squares represent the frequency with which patients cluster together. The colour ranges from red (always cluster together) to blue (never cluster together). The correlation between the resulting subgroups and subsequent disease course is shown by the Kaplan-Meier survival curves, which demonstrate the proportions of (C) CD and (D) UC patients who did not require a subsequent treatment escalation (immunomodulator or surgery) after enrolment. Statistical significance was determined using a Log-rank test (1df).

Supplemental Table 1. Crohn’s disease phenotype data
ID IBD1 or
IBD2
Age at
entry
Follow up
(days)
Previously diagnosed
Disease distribution
HBSI at
entry
Treatment at entry Response to initial treatment ASCA (at
entry)
Smoking Status
Subsequent disease course
411 IBD1 30
693 Yes L1 11 Prednisolone Partial response. Fully responded to InfliximabA (induction only)
Negative Never Flare (221 days). HBSI 11. - Treated with Prednisolone and commenced on regular InfliximabA. Fully responded.
416 IBD1 32 677 Yes L3 8 Budesonide Partial response. Fully responded to Prednisolone.
Positive Never Flare (180 days). HBSI 11. - Treated with Elemental diet and commenced Azathioprine (2mg/kg)A. Fully responded. Flare (284 days). HBSI 10. - Treated with Prednisolone. Azathioprine increased (2.5mg/kg). Fully responded. Flare (356 days). HBSI 25. - Admitted to hospital, treated with intravenous steroids and antibiotics. - Commenced InfliximabA. Fully responded.
419 IBD1 18 671 No L1 6 Budesonide Partial response. Fully responded to Prednisolone.
Negative Never Flare (134 days). HBSI 7. - Treated with Budesonide. Declined Azathioprine. Fully responded. (NOT counted as treatment escalation).
428 IBD1 40 639 Yes L3 14 Prednisolone
Partial response only Positive Current Chronic continuous symptoms. Ileocaecal resectionA (88 days). Fully responded. Flare (578 days). HBSI 12. - Treated with Prednisolone and commenced Azathioprine (2mg/kg)A. Fully responded.
441 IBD1 60 565 Yes L3 7 Budesonide Partial response. Fully responded to Prednisolone.
Negative Ex Flare (125 days). HBSI 7. - Treated with Prednisolone and commenced Azathioprine (2mg/kg)A. Fully responded. Flare (351 days). HBSI 22. - Admitted to hospital, treated with intravenous corticosteroids and antibiotics. Fully responded.
444 IBD1 26 539 Yes L3 19 Prednisolone 6-MercaptopurineA
Partial response only Positive Ex Chronic continuous symptoms initially, with significant deterioration (55 days). HBSI 14. - Commenced AdalimumabA. Fully responded. Flare (136 days). HBSI 14. - Treated with Prednisolone and Adalimumab interval shortened to weeklyA. - Chronic continuous symptoms thereafter. Elective panproctocolectomyA (510 days)
448 IBD1 22 512 No L2, perianal 8 InfliximabA Partial response only Positive Never Chronic continuous symptoms (predominantly perianal). - Required 2 operations for perianal disease (seton x2) - not counted as treatment escalations. - Infliximab dose doubled due to inadequate responseA (237 days).
451 IBD1 25 495 No L2 22 Prednisolone Complete remission Negative Current No subsequent disease activity necessitating treatment escalation (until end of follow up.)
454 IBD1 27 478 No L2 12 Intravenous steroids Complete remission Negative Current Flare (108 days). HBSI 10. - Treated with Prednisolone and commenced on Azathioprine (2mg/kg)A. Fully responded.
459 IBD1 35 470 No L3 10 Prednisolone Complete remission Negative Never Flare (287 days). HBSI 9. - Treated with Prednisolone and commenced on Azathioprine (2mg/kg)A. Fully responded.
467 IBD1 27 315 No L3 12 Budesonide Partial response only Responded fully to Prednisolone
Positive Current Flare (96 days). HBSI 12. - Treated with Prednisolone and commenced on Azathioprine (2mg/kg)A. Fully responded.

482 IBD1 28 161 No L2, perianal 9 Prednisolone Partial response only Responded fully to extended course
Negative Current Flare (110 days). HBSI 13. - Treated with Prednisolone and commenced on Azathioprine (2mg/kg)A. Fully responded.
401 IBD2 24 735 No L3 10 Budesonide Partial response. Fully responded to Prednisolone.
Negative Current Flare (98 days). HBSI 9. - Treated with Prednisolone and commenced on Azathioprine (2mg/kg)A. Fully responded.
405 IBD2 64 720 Yes L1, L4 7 Budesonide Complete remission Positive Ex No subsequent disease activity necessitating treatment escalation (until end of follow up.)
408 IBD2 37 714
Yes L1 9 Prednisolone Partial remission Positive Ex Chronic continuous obstructive symptoms. Ileocaecal resectionA (72 days). Fully responded.
409 IBD2 57 712 No L1 7 Elemental diet Complete remission Negative Current Flare (225 days). HBSI 7. - Persistent stricture in terminal ileum. Ileocaecal resectionA. Fully responded.
412 IBD2 48 687
Yes L3 14 Prednisolone Complete remission Positive Never Flare (64 days). HBSI 9. - Treated with Prednisolone and commenced on Azathioprine (2mg/kg)A. Fully responded.
421 IBD2 29 659 Yes L3, perianal 10 Budesonide AzathioprineA
Complete remission Positive Never Flare (325 days). HBSI 10. - Commenced on AdalimumabA. Fully responded.
422 IBD2 19 658 No L3 10 Budesonide Complete remission Positive Current No subsequent disease activity necessitating treatment escalation (until end of follow up.)
429 IBD2 22 638 No L2 12 Prednisolone Complete remission Positive Never No subsequent disease activity necessitating treatment escalation (until end of follow up.)
430 IBD2 47 636 Yes L1, L4 9 Prednisolone AzathioprineA
Complete remission Positive Current No subsequent disease activity necessitating treatment escalation (until end of follow up.)
434 IBD2 30 615 Yes L3 11 Prednisolone AzathioprineA
Complete remission Positive Ex No subsequent disease activity necessitating treatment escalation (until end of follow up.)
440 IBD2 30 566 No L3 18 Budesonide
Complete remission Negative Current No subsequent disease activity necessitating treatment escalation (until end of follow up.)
446 IBD2 40 531 No L2 9 Topical therapy
Complete remission Negative Never No subsequent disease activity necessitating treatment escalation (until end of follow up.)
447 IBD2 34 516 No L3 13 Prednisolone
Partial remission Fully responded with extended course
Negative Current No subsequent disease activity necessitating treatment escalation (until end of follow up.)
450 IBD2 40 497 Yes L1 12 SurgeryA (declined steroids)
Complete remission Positive Current No subsequent disease activity necessitating treatment escalation (until end of follow up.)
452 IBD2 27 482 No L2 9 Prednisolone
Complete remission Negative Never Flare (259 days). HBSI 10. - Treated with Prednisolone and commenced on Azathioprine (2mg/kg)A. Fully responded.
453 IBD2 23 481 No L3 8 Budesonide Complete remission Negative Ex No subsequent disease activity necessitating treatment escalation (until end of follow up.)
457 IBD2 55 475 No L3 20 Prednisolone Complete remission Negative Current No subsequent disease activity necessitating treatment escalation (until end of follow up.)
463 IBD2 31 380 No L3 10 Prednisolone Complete remission Positive Never No subsequent disease activity necessitating treatment escalation (until end of follow up.)
465 IBD2 68 343 No L2 7 Topical therapy Complete remission Negative Ex No subsequent disease activity necessitating treatment escalation (until end of follow up.)
470
IBD2 21 288 No
L3 9 Intravenous steroids Complete remission Positive Current Flare (94 days). HBSI 10. - Treated with Prednisolone and commenced on Azathioprine (2mg/kg)A. Fully responded.

476 IBD2 41 257 No L1 8 Prednisolone Partial remission Responded fully to extended course
Negative Current No subsequent disease activity necessitating treatment escalation (until end of follow up.)
480 IBD2 35 174 No L2, perianal 11 Prednisolone Complete remission Positive Never No subsequent disease activity necessitating treatment escalation (until end of follow up.)
481 IBD2 30 169 No L3 12 SurgeryA Complete remission Positive Current No subsequent disease activity necessitating treatment escalation (until end of follow up.)
(A) denotes treatment escalation. Abbreviations HBSI Harvey Bradshaw Severity Index ASCA anti-Saccharomyces cerevisiae antibodies L1 Ileal disease L2 Colonic disease L3 Ileocolonic disease L4 Upper GI disease

Supplemental Table 2. Ulcerative colitis phenotype data
ID IBD1 or
IBD2
Age at
entry
Follow up
(days)
Previously diagnosed
Disease distribution
SCCAI at entry
Treatment at entry Response to initial treatment Smoking Status
Subsequent disease course
403
IBD1
50
723
Yes
E2
10
Prednisolone
Complete remission
Never
Flare (212 days). SCCAI 11 - Treated with Prednisolone and commenced on Azathioprine (2mg/kg)†. Chronic continuous symptoms. Flare (463) - Treated with Prednisolone and switched to Methotrexate†. Fully responded.
406 IBD1 55 719 No E3 14 Intravenous steroids Partial response Complete remission with Cyclosporin
Ex Commenced Azathioprine (2mg/kg)A (60 days).
410 IBD1 51 707 Yes E1 11 Topical therapy Complete remission
Current Flare (124 days). SCCAI 8 - Failed to respond to Prednisolone. Completely responded to Acetarsol suppositories. Offered Azathioprine but declined – elected to use cyclical AcetarsolA. Flare (404 days). SCCAI 12 - Treated with Prednisolone and Acetarsol suppositories. Fully responded. commenced MethotrexateA.
413 IBD1 56 685 Yes E3 11 Intravenous steroids AzathioprineA
Complete remission
Ex No subsequent disease activity necessitating treatment escalation (until end of follow up.)
415 IBD1 50 678 Yes E3 8 Prednisolone Complete remission
Ex Flare (212 days). SCCAI 11 - Treated with Prednisolone and commenced on 6-Mercaptopurine (1mg/kg)A. Fully responded. Flare (284 days). SCCAI 7. - Treated with high dose 5-ASA. 6-Mercaptopurine increased (1.5mg/kg). Fully responded.
417 IBD1 36 674 Yes E2 11 Prednisolone Complete remission
Never No subsequent disease activity necessitating treatment escalation (until end of follow up.)
418 IBD1 43 673 Yes E1 10 Prednisolone No response Complete remission with intravenous steroids
Ex Flare (43 days). SCCAI 7 - Treated with increased Prednisolone dose and commenced MethotrexateA. Fully responded.
425 IBD1 27 646 Yes E3 8 Prednisolone Complete remission
Ex Flare (64 days). SCCAI 9 - Treated with Prednisolone and commenced Azathioprine (2mg/kg)A. Fully responded. Flare (238 days). SCCAI 10. - Treated with Prednisolone. Azathioprine increased (2.5mg/kg). Fully responded.
436 IBD1 45 594 Yes E2 8 Prednisolone Partial remission Complete remission with extended course
Ex Flare (403 days). SCCAI 12 - Treated with Prednisolone and commenced Azathioprine (2mg/kg)A. Fully responded.
461 IBD1 50 435 No E1 6 Topical therapy Complete remission Ex No subsequent disease activity necessitating treatment escalation (until end of follow up.)
464 IBD1 48 362 No E2 7 Prednisolone Partial response Complete remission with Cyclosporin (following partial response to intravenous steroids)
Ex Commenced Azathioprine (2mg/kg)A (55 days).

468 IBD1 26 307 No E3 6 Prednisolone Complete remission
Never Flare (78 days). SCCAI 12 - Treated with Prednisolone and commenced Azathioprine (2mg/kg)A. Fully responded.
472 IBD1 31 268 No E3 11 Intravenous steroids Complete response Never Flare (158). SCCAI 13 - Admitted to hospital and treated with intravenous steroids. Fully responded. Commenced Azathioprine (2mg/kg) A
402 IBD2 23 734 Yes E2 6 Topical therapy Complete remission
Never No subsequent disease activity necessitating treatment escalation (until end of follow up.)
404 IBD2 65 721 Yes E2 8 Prednisolone Complete remission
Ex Flare (96 days). SCCAI 8 - Treated with Prednisolone and commenced Azathioprine (2mg/kg)A. Fully responded.
423 IBD2 46 651 Yes E3 6 Prednisolone 6-MercaptopurineA
Complete remission
Never No subsequent disease activity necessitating treatment escalation (until end of follow up.)
424 IBD2 40 649 No E2 8 Budesonide Partial response Complete remission with Prednisolone
Ex No subsequent disease activity necessitating treatment escalation (until end of follow up.)
426 IBD2 18 643 No E3 7 Prednisolone Complete remission
Never No subsequent disease activity necessitating treatment escalation (until end of follow up.)
427 IBD2 40 642 Yes E1 11 Topical therapy Complete response Ex No subsequent disease activity necessitating treatment escalation (until end of follow up.)
432 IBD2 24 628 Yes E3 10 Budesonide AzathioprineA
Complete remission
Ex No subsequent disease activity necessitating treatment escalation (until end of follow up.)
433 IBD2 43 624 Yes E2 8 High dose 5-ASA Complete remission
Never Flare (373 days). SCCAI 8 - Treated with Prednisolone and commenced 6-Mercaptopurine (1mg/kg)A. Fully responded.
439 IBD2 70 566 Yes E2 11 Prednisolone Complete remission
Ex Flare (127 days). SCCAI 7 - Treated with Prednisolone and commenced Azathioprine (2mg/kg)A. Fully responded.
442 IBD2 22 562 No E2 9 High dose 5-ASA Complete remission
Never No subsequent disease activity necessitating treatment escalation (until end of follow up.)
443 IBD2 84 541 No E3 8 Prednisolone Complete remission
Ex No subsequent disease activity necessitating treatment escalation (until end of follow up.)
445 IBD2 22 538 No E3 9 Prednisolone Complete remission
Never No subsequent disease activity necessitating treatment escalation (until end of follow up.)
449 IBD2 64 498 Yes E2 13 High dose 5-ASA Complete remission
Ex No subsequent disease activity necessitating treatment escalation (until end of follow up.)
456 IBD2 41 476 No E2 7 High dose 5-ASA Complete remission
Never No subsequent disease activity necessitating treatment escalation (until end of follow up.)
458 IBD2 38 474 No E1 7 Topical therapy Complete remission
Never No subsequent disease activity necessitating treatment escalation (until end of follow up.)
460 IBD2 38 453 No E1 6 Topical therapy Complete remission
Never No subsequent disease activity necessitating treatment escalation (until end of follow up.)

462 IBD2 34 407 No E2 8 Topical therapy Complete remission
Never No subsequent disease activity necessitating treatment escalation (until end of follow up.)
466 IBD2 52 317 No E3 9 Prednisolone Complete remission
Ex No subsequent disease activity necessitating treatment escalation (until end of follow up.)
477 IBD2 43 218 No E3 8 Prednisolone Complete remission
Never No subsequent disease activity necessitating treatment escalation (until end of follow up.)
(A) denotes treatment escalation Abbreviations SCCAI Simple Clinical Colitis Activity Index E1 Proctitis E2 Left-sided disease E3 Extensive disease

Supplemental Table 3. Gene-set enrichment analysis results
Nominal P value – the statistical significance of the enrichment of a list of genes (pathway) within the IBD1/2 signature. FDR q value - the probability that the enrichment observed for a specific list of genes (pathway) represents a false positive based upon correction for multiple testing (standard significance cut-off; 0.25). The q value shown corresponds to the analysis of the replication cohort. Pathways were considered enriched (shown in bold) if the enrichment in the primary cohort (P<0.05) was reproduced in an independent replication cohort (P<0.05, FDR q<0.25). Abbreviations: FDR; False discovery rate IL-7; Interleukin-7 IL-2; Interleukin-2 CTCF; CCCTC-binding factor TNF; Tumour necrosis factor CCR3; C-C chemokine receptor type 3 EIF; Eukaryotic translation initiation factor RAC1; Ras-related C3 botulinum toxin substrate 1
Pathway Subgroup in
which pathway is enriched
Nominal P value
(Primary cohort)
Nominal P value
(Replication cohort)
FDR q value
IL-2 pathway IBD1 0.0267 0.0020 0.1078
IL-7 pathway IBD1 0.0102 0.0041 0.0586
CD28 co-stimulation pathway IBD1 0.0430 0.0142 0.0667
T-cell receptor pathway IBD1 0.0060 0.0185 0.1001
IL-2 receptor beta pathway IBD1 0.0183 0.0328 0.1654
Calcineurin pathway IBD1 0.0104 0.0522 0.0928
Fas pathway IBD1 0.0331 0.0541 0.1359
Gleevec pathway IBD1 0.0336 0.0547 0.1159
CTCF pathway IBD1 0.0143 0.0604 0.1205
Growth hormone pathway IBD1 0.0183 0.0890 0.1260
TNF receptor 1 pathway IBD1 0.0388 0.1129 0.1344
CCR3 pathway IBD1 0.0370 0.1237 0.1782
EIF pathway IBD1 0.0323 0.1461 0.1784
RAC1 pathway IBD1 0.0426 0.2134 0.2215
Complement pathway IBD2 0.0271 0.0586 0.1538

Supplemental Table 4. Significantly enriched gene-sets IL-7 Pathway (nominal P = 0.004, FDR q = 0.059)
Gene Symbol
Affymetrix Probe ID
Subgroup associated
with increased expression
Disease cohort
CD adjusted p value
UC adjusted p value
BCL2 8023646 IBD1 CD 8.15E-03 ns CREBBP 7999044 IBD1 CD and UC 4.33E-07 1.45E-05 EP300 8073345 IBD1 CD and UC 1.69E-06 4.21E-06
FYN 8128956 IBD1 CD and UC 9.42E-04 9.64E-05 IL2RG 8173444 IBD1 CD and UC 8.05E-07 6.78E-06
IL7 8104901 Neither na ns ns IL7R 8104901 IBD1 CD and UC 3.44E-04 3.98E-02 JAK1 7916747 IBD1 CD and UC 4.37E-07 2.44E-05 JAK3 8035351 IBD1 CD and UC 3.27E-05 4.65E-06 LCK 7899753 IBD1 CD and UC 3.47E-06 1.05E-04 NMI 8055702 IBD1 CD and UC 3.32E-04 1.38E-06
PIK3CA 8084016 IBD1 CD and UC 7.95E-05 8.12E-06 PIK3CG 8135363 IBD1 CD and UC 5.48E-05 1.33E-04 PIK3R1 8105778 IBD1 CD and UC 4.90E-05 1.71E-04 PTK2B 8145490 IBD1 CD and UC 1.34E-07 3.61E-05
STAT5A 8007212 IBD1 CD and UC 1.80E-05 7.63E-05 STAT5B 8015590 IBD1 CD and UC 3.96E-06 8.36E-07
TCR Pathway (nominal P = 0.019, FDR q = 0.100)
Gene Symbol
Affymetrix Probe ID
Subgroup associated
with increased expression
Disease cohort
CD adjusted p value
UC adjusted p value
CALM1 7976200 IBD1 CD and UC 7.23E-07 4.69E-07 CALM2 8052010 IBD1 CD and UC 2.54E-06 3.36E-07 CALM3 8029831 IBD1 CD and UC 2.74E-07 9.45E-07 CD247 7922040 IBD1 CD and UC 1.40E-04 1.29E-03 CD3D 7952056 IBD1 CD and UC 1.83E-05 4.93E-05 CD3E 7944179 IBD1 CD and UC 6.11E-06 7.08E-06 CD3G 7944185 IBD1 CD and UC 9.08E-06 8.17E-06
CYCSP35 U/A na na na na ELK1 8172345 Neither na ns ns FOS 7975779 Neither na ns ns FYN 8128956 IBD1 CD and UC 9.42E-04 9.64E-05
GRB2 8018364 IBD1 CD and UC 5.84E-07 1.08E-07 HRAS 7945436 Neither na ns ns JUN 7916609 Neither na ns ns LAT 7994541 IBD1 CD and UC 1.99E-05 3.44E-06 LCK 7899753 IBD1 CD and UC 3.47E-06 1.05E-04
MAP2K1 7984319 IBD1 CD and UC 1.03E-05 1.72E-06 MAP2K4 8005029 IBD1 CD and UC 5.61E-07 1.95E-06 MAP3K1 8105436 IBD1 CD and UC 9.48E-03 2.54E-04 MAPK3 8000811 IBD1 CD and UC 9.16E-03 1.57E-02 MAPK8 7927389 IBD1 CD and UC 1.58E-05 1.06E-04 NFATC1 8021866 Neither na ns ns NFATC2 8067040 IBD1 CD and UC 1.26E-03 4.11E-04 NFATC3 7996744 IBD1 CD and UC 1.86E-06 2.26E-06 NFATC4 7973709 Neither na ns ns NFKB1 8096635 IBD1 CD and UC 7.46E-05 8.78E-03 NFKBIA 7978644 IBD1 CD and UC 5.86E-05 1.93E-03 PIK3CA 8084016 IBD1 CD and UC 7.95E-05 8.12E-06 PIK3CG 8135363 IBD1 CD and UC 5.48E-05 1.33E-04 PIK3R1 8105778 IBD1 CD and UC 4.90E-05 1.71E-04 PLCG1 8062623 IBD1 CD and UC 1.35E-05 8.33E-03
PPP3CA 8101971 IBD1 CD and UC 9.94E-04 4.59E-07 PPP3CB 7934393 IBD1 CD and UC 2.79E-06 1.33E-07 PPP3CC 8145136 IBD1 CD and UC 2.45E-05 5.67E-07 PRKCA 8009301 Neither na ns ns PRKCB 7994131 IBD1 CD and UC 3.98E-05 2.75E-06 PTPN7 7923406 Neither na ns ns RAC1 8180343 IBD1 CD and UC 2.94E-07 1.59E-06 RAF1 8085374 IBD1 CD and UC 1.39E-07 7.79E-07
RASA1 8106784 IBD1 CD and UC 4.37E-04 4.64E-05 RELA 7949465 IBD1 CD and UC 3.42E-04 2.60E-05 SHC1 7920600 IBD1 CD and UC 1.93E-02 3.62E-02 SOS1 8051670 IBD1 CD and UC 7.12E-05 1.11E-07 TRA@ 7973303 IBD1 UC ns 3.20E-02 TRB@ 7973298 Neither na ns ns VAV1 8025076 IBD1 CD and UC 9.30E-08 3.87E-06 ZAP70 8043725 IBD1 CD and UC 5.56E-07 4.07E-06
IL-2 Pathway (nominal P = 0.002, FDR q = 0.108)
Gene Symbol
Affymetrix Probe ID
Subgroup associated
with increased expression
Disease cohort
CD adjusted p value
UC adjusted p value
CSNK2A1 8064351 IBD1 CD and UC 3.08E-07 1.37E-06 ELK1 8172345 Neither na ns ns FOS 7975779 Neither na ns ns GRB2 8018364 IBD1 CD and UC 5.84E-07 1.08E-07 HRAS 7945436 Neither na ns ns IL2 8102697 Neither na ns ns IL2RA 7931914 Neither na ns ns IL2RB 8075886 IBD1 UC ns 2.29E-03 IL2RG 8173444 IBD1 CD and UC 8.05E-07 6.78E-06 JAK1 7916747 IBD1 CD and UC 4.37E-07 2.44E-05 JAK3 8035351 IBD1 CD and UC 3.27E-05 4.65E-06 JUN 7916609 Neither na ns ns LCK 7899753 IBD1 CD and UC 3.47E-06 1.05E-04 MAP2K1 7984319 IBD1 CD and UC 1.03E-05 1.72E-06 MAPK3 8000811 IBD1 CD and UC 9.16E-03 1.57E-02 MAPK8 7927389 IBD1 CD and UC 1.58E-05 1.06E-04 RAF1 8085374 IBD1 CD and UC 1.39E-07 7.79E-07 SHC1 7920600 IBD1 CD and UC 1.93E-02 3.62E-02 SOS1 8051670 IBD1 CD and UC 7.12E-05 1.11E-07 STAT5A 8007212 IBD1 CD and UC 1.80E-05 7.63E-05 STAT5B 8015590 IBD1 CD and UC 3.96E-06 8.36E-07 SYK 8156321 Neither na ns ns
CD28 co-stimulation (nominal P = 0.014, FDR q = 0.067)
Gene Symbol
Affymetrix Probe ID
Subgroup associated
with increased expression
Disease cohort
CD adjusted p value
UC adjusted p value
CD247 7922040 IBD1 CD and UC 1.40E-04 1.29E-03 CD28 8047677 IBD1 CD and UC 3.72E-03 1.88E-03 CD3D 7952056 IBD1 CD and UC 1.83E-05 4.93E-05 CD3E 7944179 IBD1 CD and UC 6.11E-06 7.08E-06 CD3G 7944185 IBD1 CD and UC 9.08E-06 8.17E-06 CD80 8089771 Neither na ns ns CD86 8082035 Neither na ns ns CTLA4 8047692 Neither na ns ns GRB2 8018364 IBD1 CD and UC 5.84E-07 1.08E-07 HLA-DRA 8178193 IBD1 CD and UC 2.98E-02 2.43E-02 HLA-DRB1 U/A na na na na ICOS 8047702 IBD1 CD and UC 3.36E-03 2.15E-03 ICOSLG 8070720 Neither na ns ns IL2 8102697 Neither na ns ns ITK 8109507 IBD1 CD and UC 9.51E-05 2.41E-03 LCK 7899753 IBD1 CD and UC 3.47E-06 1.05E-04 PIK3CA 8084016 IBD1 CD and UC 7.95E-05 8.12E-06 PIK3R1 8105778 IBD1 CD and UC 4.90E-05 1.71E-04 PTPN11 7958846 IBD1 CD and UC 2.71E-07 2.25E-06 TRA@ 7973303 IBD1 UC ns 3.20E-02 TRB@ 7973298 Neither na ns ns
Gene-set enrichment of publically-available pathways curated from BioCarta by the Molecular Signatures database. The significance of each pathway’s enrichment is shown, together with the significance of each gene annotated within that pathway. P values were adjusted where indicated using false-discovery rate (FDR) as is the standard for GSEA. Nominal P values and FDR q values are as described in Supplementary Figure 5. Abbreviations: FDR; False-discovery rate, TCR; T-cell receptor, IL-7; Interleukin-7, IL-2; Interleukin-2, na; Not appropriate, ns; Not significant, U/A; Unannotated
Related Documents