1 SUPPLEMENTAL FIGURE LEGENDS Supplemental Fig. 1. Sequence analysis of the zebrafish ATX. (A) Amino acid sequences of human, mouse and zebrafish ATXs. The catalytic center is indicated by the red triangle. (B) Phylogenic analysis of NPP family in human, mouse and zebrafish. Zebrafish ATX (zgc:63550) is localized in the cluster of atx/npp2. Supplemental Fig. 2. ATX expression was attenuated by morpholino antisense oligonucleotides (MOs). (A) Schematic representation of zebrafish ATX gene with exons represented as black boxes. The positions of the morpholinos employed in this study are indicated by gray bars above exons 2 and 4, and the position of primers used for the RT-PCR analysis are indicated by arrows. (B) ATX MO1 caused the deletion of exon 2 and resulted in a 160-bp PCR fragment compared to the intact 263-bp fragment in ATX MO1 5-mis MO-injected embryos. (C) ATX MO2 caused the partial deletion of exon 4 and resulted in a 500-bp PCR fragment compared to the intact 514-bp fragment in untreated embryos. Supplemental Fig. 3. Sequence analysis of the zebrafish LPA receptors. (A) Amino acid sequences of human, mouse and zebrafish LPA 2-6 receptors. (B) Phylogenic analysis of LPA receptors in human, mouse and zebrafish. Supplemental Fig. 4. Each LPA receptor expression was attenuated by MOs. (A-D) Blocking of splicing by MOs was confirmed by RT-PCR. (A) LPA 1 MO caused the deletion of exon 2 and resulted in a 453-bp PCR fragment compared to the intact 1208-bp fragment in untreated embryos as shown previously (28). (B) LPA 2 a MO caused the deletion of exon 2 and resulted in a 456-bp PCR fragment compared to the intact 1382-bp fragment in untreated embryos. (C) LPA 2 b MO caused the deletion of exon 2 and resulted in a 476-bp PCR fragment compared to the intact 897-bp fragment in untreated embryos. (D) LPA 3 MO caused the partial deletion of exon 2 and resulted in a 819-bp PCR fragment compared to the intact 937-bp fragment in untreated embryos. (E-I) Translation blocking induced by MOs. Each MO against LPA 4 , LPA 5 a, LPA 5 b, LPA 6 a or LPA 6 b inhibited the translation of the egfp gene cloned downstream of the 5’-UTR of LPA 4 , LPA 5 a, LPA 5 b, LPA 6 a or LPA 6 b containing the target sequence of each MO respectively. Scale bar: 200 μm. Supplemental Fig. 5. Effects of LPA 1 /LPA 4 double MOs on vascular formation. Confocal images of fli1:EGFP embryos injected with LPA 4 MO2 alone (A) and LPA 1 MO with LPA 4 MO2 (B) at 48 hpf. Lateral views, anterior to the left. Embryos injected with LPA 4 MO2 did not show vascular defects, whereas embryos injected with both LPA 1 MO and LPA 4 MO2 showed severe vascular defects such as stalling (asterisk) and abnormal connection around horizontal myoseptum of SA (arrowhead) that were identical to those in ATX morphant embryos. Scale bar: 50 μm.

Welcome message from author
This document is posted to help you gain knowledge. Please leave a comment to let me know what you think about it! Share it to your friends and learn new things together.
Transcript

1
SUPPLEMENTAL FIGURE LEGENDS Supplemental Fig. 1. Sequence analysis of the zebrafish ATX. (A) Amino acid sequences of human, mouse and zebrafish ATXs. The catalytic center is indicated by the red triangle. (B) Phylogenic analysis of NPP family in human, mouse and zebrafish. Zebrafish ATX (zgc:63550) is localized in the cluster of atx/npp2. Supplemental Fig. 2. ATX expression was attenuated by morpholino antisense oligonucleotides (MOs). (A) Schematic representation of zebrafish ATX gene with exons represented as black boxes. The positions of the morpholinos employed in this study are indicated by gray bars above exons 2 and 4, and the position of primers used for the RT-PCR analysis are indicated by arrows. (B) ATX MO1 caused the deletion of exon 2 and resulted in a 160-bp PCR fragment compared to the intact 263-bp fragment in ATX MO1 5-mis MO-injected embryos. (C) ATX MO2 caused the partial deletion of exon 4 and resulted in a 500-bp PCR fragment compared to the intact 514-bp fragment in untreated embryos. Supplemental Fig. 3. Sequence analysis of the zebrafish LPA receptors. (A) Amino acid sequences of human, mouse and zebrafish LPA2-6 receptors. (B) Phylogenic analysis of LPA receptors in human, mouse and zebrafish. Supplemental Fig. 4. Each LPA receptor expression was attenuated by MOs. (A-D) Blocking of splicing by MOs was confirmed by RT-PCR. (A) LPA1 MO caused the deletion of exon 2 and resulted in a 453-bp PCR fragment compared to the intact 1208-bp fragment in untreated embryos as shown previously (28). (B) LPA2a MO caused the deletion of exon 2 and resulted in a 456-bp PCR fragment compared to the intact 1382-bp fragment in untreated embryos. (C) LPA2b MO caused the deletion of exon 2 and resulted in a 476-bp PCR fragment compared to the intact 897-bp fragment in untreated embryos. (D) LPA3 MO caused the partial deletion of exon 2 and resulted in a 819-bp PCR fragment compared to the intact 937-bp fragment in untreated embryos. (E-I) Translation blocking induced by MOs. Each MO against LPA4, LPA5a, LPA5b, LPA6a or LPA6b inhibited the translation of the egfp gene cloned downstream of the 5’-UTR of LPA4, LPA5a, LPA5b, LPA6a or LPA6b containing the target sequence of each MO respectively. Scale bar: 200 µm. Supplemental Fig. 5. Effects of LPA1/LPA4 double MOs on vascular formation. Confocal images of fli1:EGFP embryos injected with LPA4 MO2 alone (A) and LPA1 MO with LPA4 MO2 (B) at 48 hpf. Lateral views, anterior to the left. Embryos injected with LPA4 MO2 did not show vascular defects, whereas embryos injected with both LPA1 MO and LPA4 MO2 showed severe vascular defects such as stalling (asterisk) and abnormal connection around horizontal myoseptum of SA (arrowhead) that were identical to those in ATX morphant embryos. Scale bar: 50 µm.

Supplemental Fig. 1
C
mN
pp4
mNpp6
mN
pp7
hNPP
4
zNpp2/zATX
(zgc:63550)
zNpp5
zNpp
7b
hNPP1
mNpp1
A
Human Mouse
Zebrafish (zgc:63550)
60 59 55
120 119 115
180 179 175
240 240 235
300 300 295
360 360 355
420 420 415
480 480 474
540 540 534
600 600 588
660 660 648
720 720 708
780 780 767
840 839 827
863 862 850
B

Supplemental Fig. 2
514bp 263bp fw1-rv1
GAPDH
160bp fw2-rv2
GAPDH
A MO1 MO2
fw1 primer (exon1)
fw2 primer (exon2) rv2 primer (exon6)
rv1 primer (exon3)
1 2 4 5 6 25 3
1 kb
500bp
B C

A human LPA2 mouse LPA2 zebrafish LPA2a zebrafish LPA2b
human LPA5 mouse LPA5 zebrafish LPA5a zebrafish LPA5b
human LPA3 mouse LPA3 zebrafish LPA3
human LPA4 mouse LPA4 zebrafish LPA4
human LPA6 mouse LPA6 zebrafish LPA6a zebrafish LPA6b
mLPA4
hLPA4
zLPA3 mLPA1
hLPA1
zLPA5b
mLPA
6
zLPA
2b
zLPA
6a B
Supplemental Fig. 3

Exon 1 Exon 2 Exon 3
E 1 E 2 E 3 Normal :
Exon 1 Exon 2 Exon 3
E 1 E 2 E 3 Normal :
E 1 E 7
Normal :
E1 E2 E3
E1 E 2 E 3 Normal :
897bp
1208bp
937bp
E 1 E 3 MO treated :
GAPDH
453bp
E 2 E 3
476bp
E 4 E 5 E 6
E1 E 2 E 3 MO treated :
819bp
E 1 E 3 MO treated :
MO treated :
fw primer rv primer fw primer rv primer
fw primer rv primer fw primer rv primer
GAPDH
E 1 E 7 E 2 E 3 E 4 E 5 E 6
E 1 E 7 E 3 E 4 E 5 E 6
GAPDH GAPDH
1382bp
456bp
LPA2b MO LPA3 MO
LPA1 MO LPA2a MO
A B
C D
Supplemental Fig. 4

Phenol red LPA4 MO1
LPA4-EGFP mRNA (24 hpf)
Phenol red LPA6a MO Phenol red LPA6b MO
LPA4 MO2
LPA6a-EGFP mRNA (24 hpf) LPA6b-EGFP mRNA (24 hpf)
E
H I
Supplemental Fig. 4
Phenol red LPA5a MO Phenol red LPA5b MO
LPA5a-EGFP mRNA (24 hpf) LPA5b-EGFP mRNA (24 hpf) F G

LPA1 MO + LPA4 MO2
LPA4 MO2
* B
A
Supplemental Fig. 5
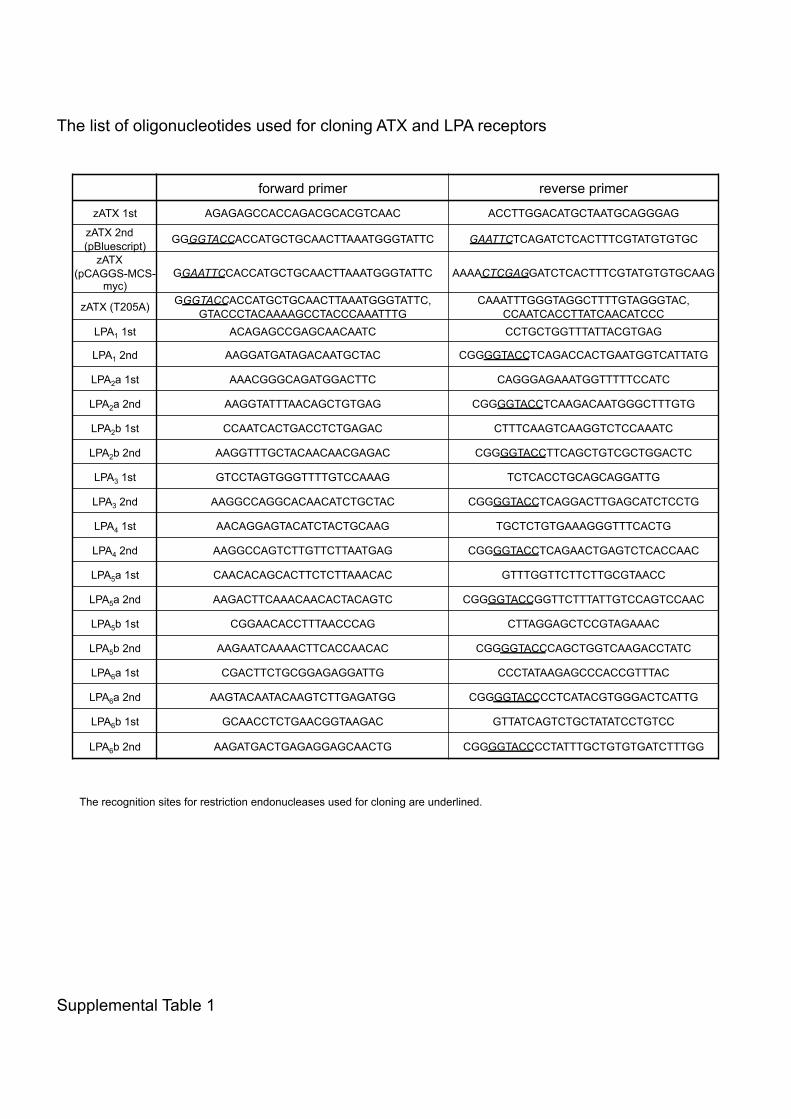
Supplemental Table 1
The list of oligonucleotides used for cloning ATX and LPA receptors
forward primer reverse primer
zATX 1st AGAGAGCCACCAGACGCACGTCAAC ACCTTGGACATGCTAATGCAGGGAG
zATX 2nd (pBluescript) GGGGTACCACCATGCTGCAACTTAAATGGGTATTC GAATTCTCAGATCTCACTTTCGTATGTGTGC
zATX (pCAGGS-MCS-
myc) GGAATTCCACCATGCTGCAACTTAAATGGGTATTC AAAACTCGAGGATCTCACTTTCGTATGTGTGCAAG
zATX (T205A) GGGTACCACCATGCTGCAACTTAAATGGGTATTC, GTACCCTACAAAAGCCTACCCAAATTTG
CAAATTTGGGTAGGCTTTTGTAGGGTAC, CCAATCACCTTATCAACATCCC
LPA1 1st ACAGAGCCGAGCAACAATC CCTGCTGGTTTATTACGTGAG
LPA1 2nd AAGGATGATAGACAATGCTAC CGGGGTACCTCAGACCACTGAATGGTCATTATG
LPA2a 1st AAACGGGCAGATGGACTTC CAGGGAGAAATGGTTTTTCCATC
LPA2a 2nd AAGGTATTTAACAGCTGTGAG CGGGGTACCTCAAGACAATGGGCTTTGTG
LPA2b 1st CCAATCACTGACCTCTGAGAC CTTTCAAGTCAAGGTCTCCAAATC
LPA2b 2nd AAGGTTTGCTACAACAACGAGAC CGGGGTACCTTCAGCTGTCGCTGGACTC
LPA3 1st GTCCTAGTGGGTTTTGTCCAAAG TCTCACCTGCAGCAGGATTG
LPA3 2nd AAGGCCAGGCACAACATCTGCTAC CGGGGTACCTCAGGACTTGAGCATCTCCTG
LPA4 1st AACAGGAGTACATCTACTGCAAG TGCTCTGTGAAAGGGTTTCACTG
LPA4 2nd AAGGCCAGTCTTGTTCTTAATGAG CGGGGTACCTCAGAACTGAGTCTCACCAAC
LPA5a 1st CAACACAGCACTTCTCTTAAACAC GTTTGGTTCTTCTTGCGTAACC
LPA5a 2nd AAGACTTCAAACAACACTACAGTC CGGGGTACCGGTTCTTTATTGTCCAGTCCAAC
LPA5b 1st CGGAACACCTTTAACCCAG CTTAGGAGCTCCGTAGAAAC
LPA5b 2nd AAGAATCAAAACTTCACCAACAC CGGGGTACCCAGCTGGTCAAGACCTATC
LPA6a 1st CGACTTCTGCGGAGAGGATTG CCCTATAAGAGCCCACCGTTTAC
LPA6a 2nd AAGTACAATACAAGTCTTGAGATGG CGGGGTACCCCTCATACGTGGGACTCATTG
LPA6b 1st GCAACCTCTGAACGGTAAGAC GTTATCAGTCTGCTATATCCTGTCC
LPA6b 2nd AAGATGACTGAGAGGAGCAACTG CGGGGTACCCCTATTTGCTGTGTGATCTTTGG
The recognition sites for restriction endonucleases used for cloning are underlined.

Supplemental Table 2
forward primer forward primer
LPA1 MO GCGAGTGATTTCTGGACCTTTCAGC GCCTTTTTCACAGTCTCTTCTTGCG
LPA2a MO CCAGATGAAGAGCGTTTCC CAGGGAGAAATGGTTTTTCCATC
LPA2b MO TGAGACTCGATTCCCTGAG GACGACGGTCTTCATCAG
LPA3 MO 1st ATGGAGAGTGAACCGAGAAC CGGGGTACCTCAGGACTTGAGCATCT
LPA3 MO 2nd ATGGAGAGTGAACCGAGAAC ATGGGGTTCATGACGGAGTTG
ATX MO 1 1st GTGCCGAGGTTTGAGTAG ACAGTGGTCATCAAAGTCTG
ATX MO 1 2nd TCGTTCAGTGTGGAAGAGAG ACAGGTTGTCACAGCGAC
ATX MO 2 1st AGTAGTCGTTCAGTGTGGAAGAGAG TCAGGATAAAGCCCCGTTG
ATX MO 2 2nd TCCGTTATGTGGCTTTTCTCA ACCGTGCCTCCTCTTTTCA
Related Documents