Supervisors: Dr. Leo Timokhov (AARI) Andrej Rubchenia Long-period variability of thermohaline structure and circulation of water in Fram Strait and Euro-Arctic Seas

Supervisors: Dr. Leo Timokhov (AARI) Andrej Rubchenia Dr. Vladimir Pavlov (NPI) Long-period variability of thermohaline structure and circulation of water.
Dec 17, 2015
Welcome message from author
This document is posted to help you gain knowledge. Please leave a comment to let me know what you think about it! Share it to your friends and learn new things together.
Transcript

Supervisors:
Dr. Leo Timokhov (AARI)
Andrej Rubchenia Dr. Vladimir Pavlov (NPI)
Long-period variability of thermohaline structure
and circulation of water in Fram Strait and Euro-Arctic Seas
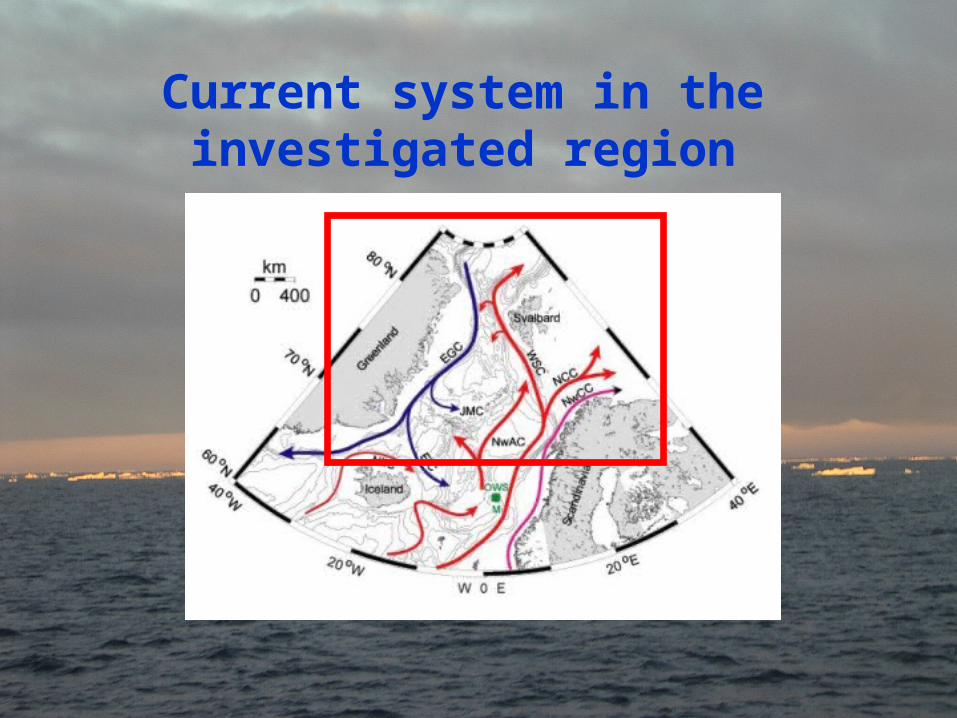
Current system in the investigated region

ODC VNIIGMI-W CD Database60426
Atlas BarKode Database82781
Atlas MMBI29761
AARI Database95650
Data from Norway11992
N um ber of S tations by Sources in the W ork D ataBase
T otal Am ount: 280610 stat ionsf or 35 stat ions ( f r om 95650)the d ate is obscur e
f or 7 stat ions ( f r om 60426)the d ate is obscur e
f or 42 stat ions ( f r om 280610)the d ate is obscur e
Database
1890 1895 1900 1905 1910 1915 1920 1925 1930 1935 1940 1945 1950 1955 1960 1965 1970 1975 1980 1985 1990 1995 2000 2005
Years
0
1000
2000
3000
4000
5000
6000
7000
8000
9000
10000
11000
12000
13000
14000
15000
16000
17000
18000
19000
20000
21000N
um
ber
of
sta
tion
s
T ota l A m ount : 280568 stat ions
N um ber of S tations by Years in the W ork D ataBase
f or 42 stat ions ( f r om 280610) the d ate is obscur e
Years

Temporal data distribution
1890 1895 1900 1905 1910 1915 1920 1925 1930 1935 1940 1945 1950 1955 1960 1965 1970 1975 1980 1985 1990 1995 2000 2005
Years
0
1000
2000
3000
4000
5000
6000
7000
8000
9000
10000
11000
12000
13000
14000
15000
16000
17000
18000
19000
20000
21000
Nu
mb
er o
f st
atio
ns
T ota l A m ount : 280568 stat ions
N um ber of S tations by Years in the W ork D ataBase
f or 42 stat ions ( f r om 280610) the d ate is obscur e
By Years
1 2 3 4 5 6 7 8 9 10 11 12
M onths
0
2000
4000
6000
8000
10000
12000
14000
16000
18000
20000
22000
24000
26000
28000
30000
32000
34000
36000
38000
Num
ber
of
stat
ion
s
T otal A m ount : 280568 stat ions
N um ber of S tations by M onths in the W ork D ataBase
f or 42 stat ions ( f r om 280610) the d ate is obscur e
By Months
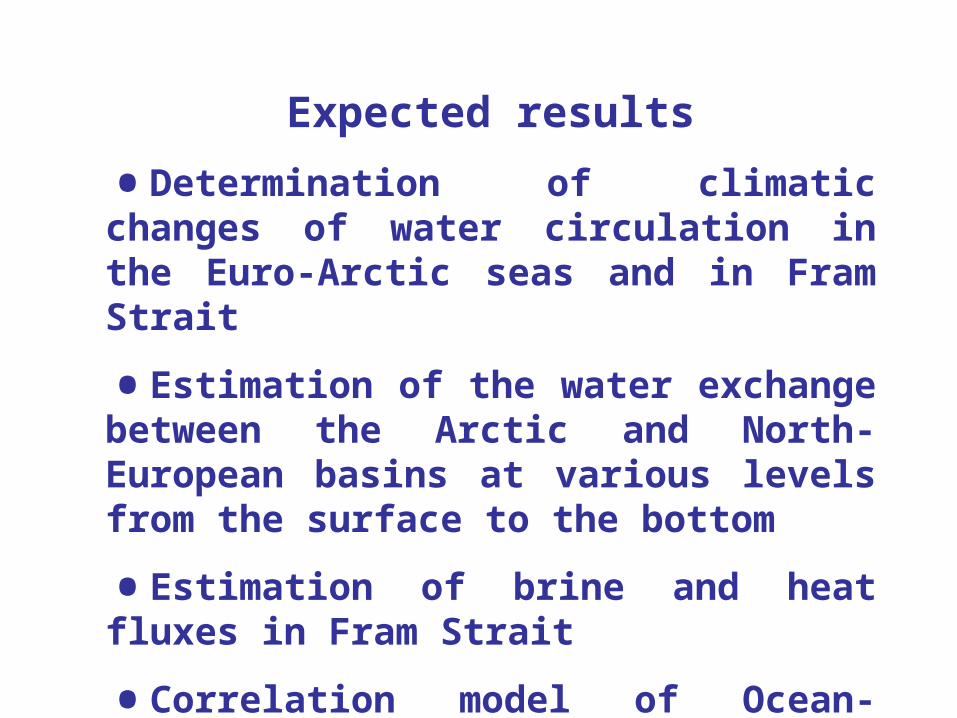
Expected results
•Determination of climatic changes of water circulation in the Euro-Arctic seas and in Fram Strait
•Estimation of the water exchange between the Arctic and North-European basins at various levels from the surface to the bottom
•Estimation of brine and heat fluxes in Fram Strait
•Correlation model of Ocean-Atmosphere relation

Spatial-temporal section in Fram Strait (winter season, temperature)
1951
1952
1953
1954
1955
1956
1957
1958
1959
1960
1961
1962
1963
1964
1965
1966
1967
1968
1969
1970
1971
1972
1973
1974
1975
1976
1977
1978
1979
1980
1981
1982
1983
1984
1985
1986
1987
1988
1989
1990
1991
1992
1993
1994
1995
1996
1997
1998
1999
1951
1952
1953
1954
1955
1956
1957
1958
1959
1960
1961
1962
1963
1964
1965
1966
1967
1968
1969
1970
1971
1972
1973
1974
1975
1976
1977
1978
1979
1980
1981
1982
1983
1984
1985
1986
1987
1988
1989
1990
1991
1992
1993
1994
1995
1996
1997
1998
1999
2 0 0
1 5 0
1 0 0
5 0
0
Dep
th [
m]
- 2
- 1 . 7 5
- 1 . 5
- 1 . 2 5
- 1
- 0 . 7 5
- 0 . 5
- 0 . 2 5
0
0 . 2 5
0 . 5
0 . 7 5
1
1 . 5
2
2 . 5
3
3 . 5
4
1951
1952
1953
1954
1955
1956
1957
1958
1959
1960
1961
1962
1963
1964
1965
1966
1967
1968
1969
1970
1971
1972
1973
1974
1975
1976
1977
1978
1979
1980
1981
1982
1983
1984
1985
1986
1987
1988
1989
1990
1991
1992
1993
1994
1995
1996
1997
1998
1999
Years
1951
1952
1953
1954
1955
1956
1957
1958
1959
1960
1961
1962
1963
1964
1965
1966
1967
1968
1969
1970
1971
1972
1973
1974
1975
1976
1977
1978
1979
1980
1981
1982
1983
1984
1985
1986
1987
1988
1989
1990
1991
1992
1993
1994
1995
1996
1997
1998
1999
2 0 0 0
1 8 0 0
1 6 0 0
1 4 0 0
1 2 0 0
1 0 0 0
8 0 0
6 0 0
4 0 0
2 0 0
Dep
th [
m]

Spatial-temporal section in Fram Strait (winter season, salinity)1951
1952
1953
1954
1955
1956
1957
1958
1959
1960
1961
1962
1963
1964
1965
1966
1967
1968
1969
1970
1971
1972
1973
1974
1975
1976
1977
1978
1979
1980
1981
1982
1983
1984
1985
1986
1987
1988
1989
1990
1991
1992
1993
1994
1995
1996
1997
1998
1999
1951
1952
1953
1954
1955
1956
1957
1958
1959
1960
1961
1962
1963
1964
1965
1966
1967
1968
1969
1970
1971
1972
1973
1974
1975
1976
1977
1978
1979
1980
1981
1982
1983
1984
1985
1986
1987
1988
1989
1990
1991
1992
1993
1994
1995
1996
1997
1998
1999
2 0 0
1 5 0
1 0 0
5 0
0
Dep
th [m
]
33 .75
34
34.5
34.75
34.8
34.85
34.9
34.95
35
35.05
35.1
35.15
35.2
35.25
1951
1952
1953
1954
1955
1956
1957
1958
1959
1960
1961
1962
1963
1964
1965
1966
1967
1968
1969
1970
1971
1972
1973
1974
1975
1976
1977
1978
1979
1980
1981
1982
1983
1984
1985
1986
1987
1988
1989
1990
1991
1992
1993
1994
1995
1996
1997
1998
1999
Years
1951
1952
1953
1954
1955
1956
1957
1958
1959
1960
1961
1962
1963
1964
1965
1966
1967
1968
1969
1970
1971
1972
1973
1974
1975
1976
1977
1978
1979
1980
1981
1982
1983
1984
1985
1986
1987
1988
1989
1990
1991
1992
1993
1994
1995
1996
1997
1998
1999
2 0 0 0
1 8 0 0
1 6 0 0
1 4 0 0
1 2 0 0
1 0 0 0
8 0 0
6 0 0
4 0 0
2 0 0
Dep
th [
m]
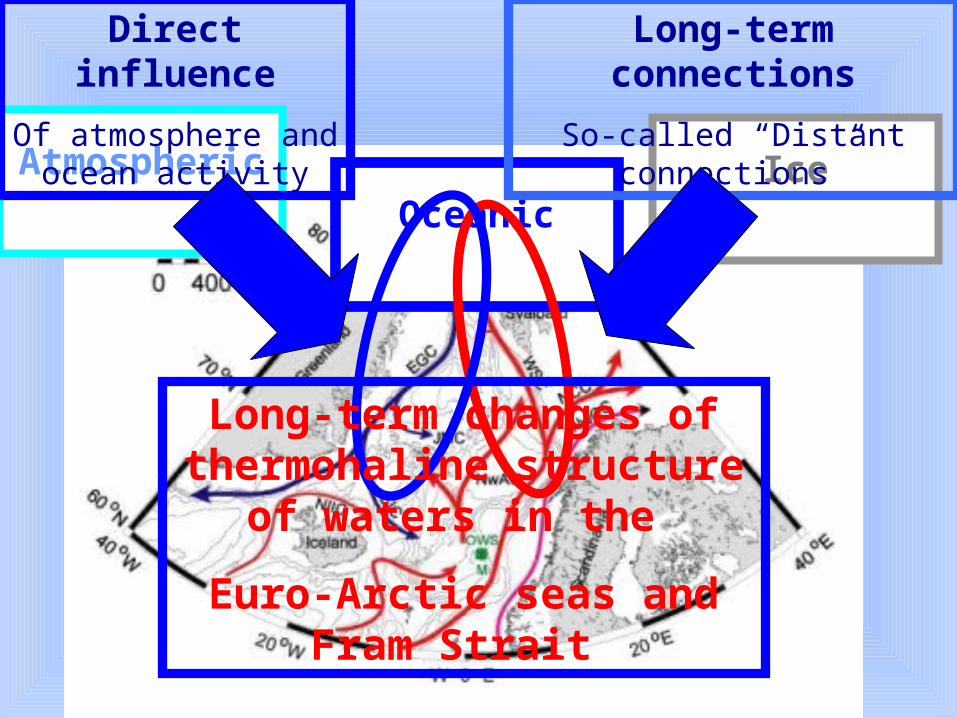
Atmospheric IceOceanic
Direct influence
Of atmosphere and ocean activity
Long-term connections
So-called “Distant connections”
Long-term changes of thermohaline structure
of waters in the
Euro-Arctic seas and Fram Strait
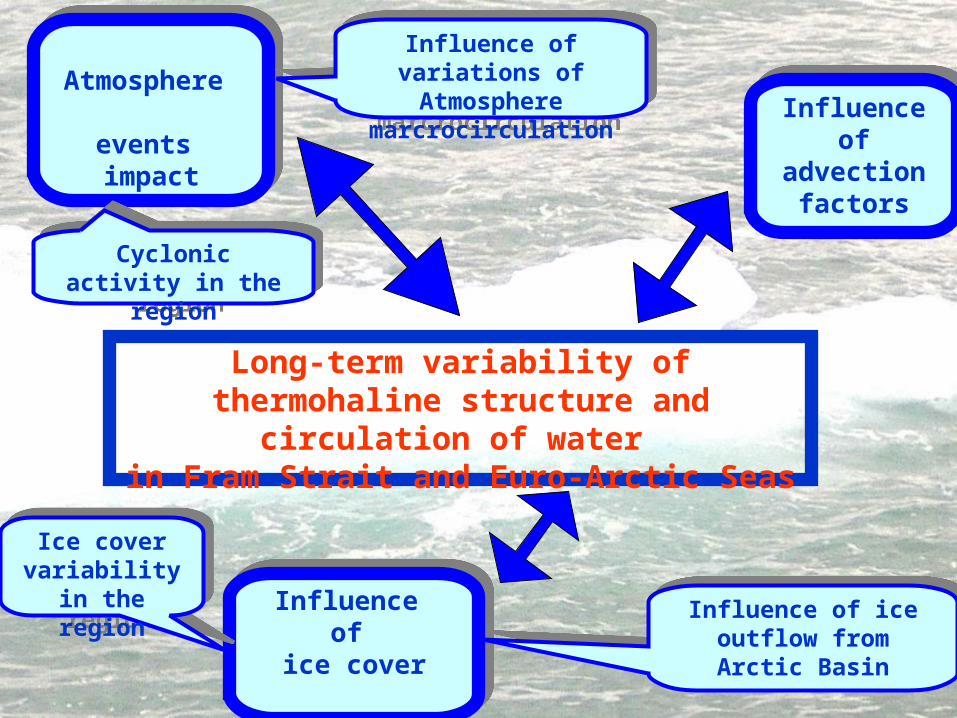
Atmosphere
events impact
Atmosphere
events impact
Influence of
ice cover
Influence of
ice cover
Influence of advection
factors
Influence of advection
factors
Long-term variability of thermohaline structure and circulation of water
in Fram Strait and Euro-Arctic Seas
Influence of variations of Atmosphere
marcrocirculation
Influence of variations of Atmosphere
marcrocirculation
Cyclonic activity in the region
Cyclonic activity in the region
Ice cover variability in the region
Ice cover variability in the region Influence of ice outflow
from Arctic BasinInfluence of ice outflow
from Arctic Basin

Atmosphere events impact
Long ScaleLong ScaleSynoptic ScaleSynoptic Scale
Cyclone activity in the region
Atmosphere circulation indexes – AO, NAO
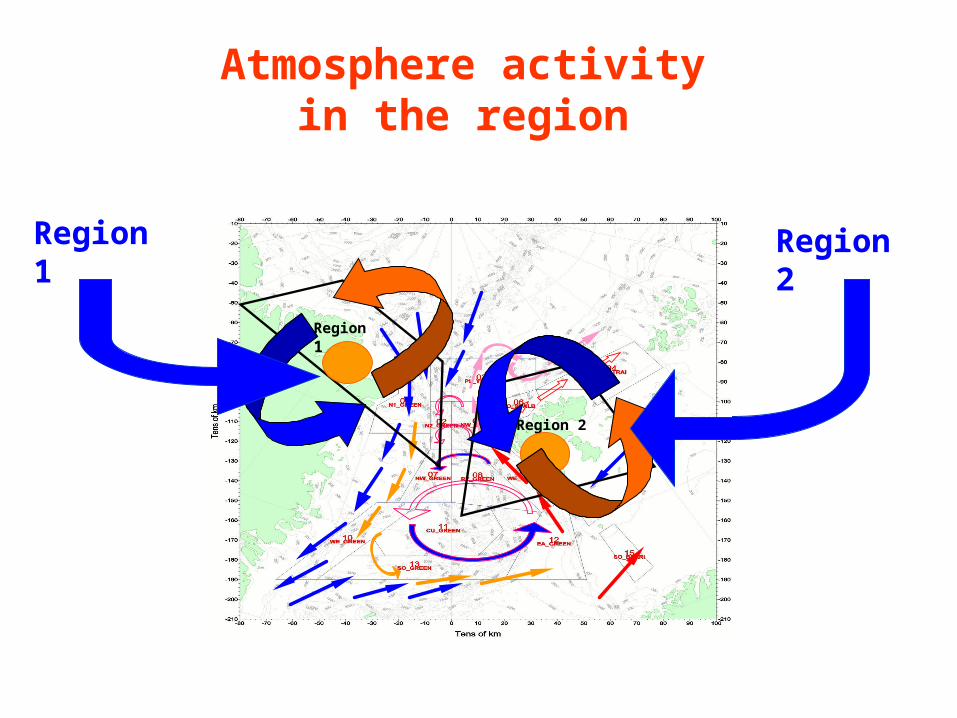
Region 1
Region 2
Atmosphere activity in the region
Region 1 Region 2
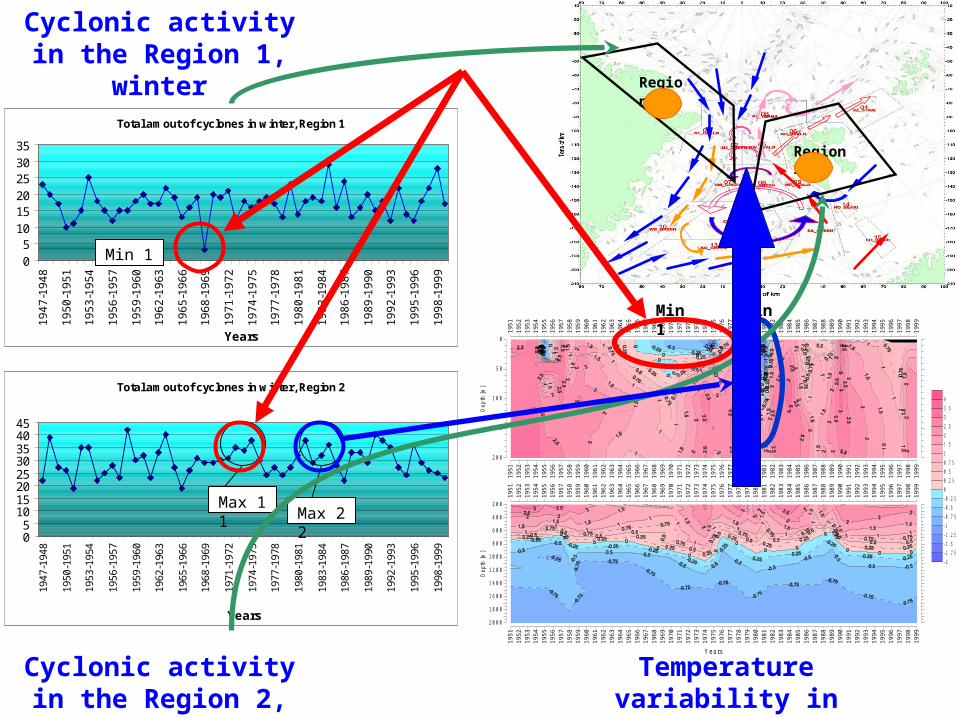
Total amout of cyclones in winter, Region 1
05
101520253035
19
47
-19
48
19
50
-19
51
19
53
-19
54
19
56
-19
57
19
59
-19
60
19
62
-19
63
19
65
-19
66
19
68
-19
69
19
71
-19
72
19
74
-19
75
19
77
-19
78
19
80
-19
81
19
83
-19
84
19
86
-19
87
19
89
-19
90
19
92
-19
93
19
95
-19
96
19
98
-19
99
Years
Min 1
Total amout of cyclones in winter, Region 2
05
1015202530354045
1947
-194
8
1950
-195
1
1953
-195
4
1956
-195
7
1959
-196
0
1962
-196
3
1965
-196
6
1968
-196
9
1971
-197
2
1974
-197
5
1977
-197
8
1980
-198
1
1983
-198
4
1986
-198
7
1989
-199
0
1992
-199
3
1995
-199
6
1998
-199
9
Years
Max 1 1 Max 2
2
Region 1
Region 2
Cyclonic activity in the Region 1, winter
Temperature variability in Fram Strait, winter
1951
1952
1953
1954
1955
1956
1957
1958
1959
1960
1961
1962
1963
1964
1965
1966
1967
1968
1969
1970
1971
1972
1973
1974
1975
1976
1977
1978
1979
1980
1981
1982
1983
1984
1985
1986
1987
1988
1989
1990
1991
1992
1993
1994
1995
1996
1997
1998
1999
1951
1952
1953
1954
1955
1956
1957
1958
1959
1960
1961
1962
1963
1964
1965
1966
1967
1968
1969
1970
1971
1972
1973
1974
1975
1976
1977
1978
1979
1980
1981
1982
1983
1984
1985
1986
1987
1988
1989
1990
1991
1992
1993
1994
1995
1996
1997
1998
1999
2 0 0
1 5 0
1 0 0
5 0
0
Dep
th [
m]
- 2
- 1 . 7 5
- 1 . 5
- 1 . 2 5
- 1
- 0 . 7 5
- 0 . 5
- 0 . 2 5
0
0 . 2 5
0 . 5
0 . 7 5
1
1 . 5
2
2 . 5
3
3 . 5
4
1951
1952
1953
1954
1955
1956
1957
1958
1959
1960
1961
1962
1963
1964
1965
1966
1967
1968
1969
1970
1971
1972
1973
1974
1975
1976
1977
1978
1979
1980
1981
1982
1983
1984
1985
1986
1987
1988
1989
1990
1991
1992
1993
1994
1995
1996
1997
1998
1999
Years
1951
1952
1953
1954
1955
1956
1957
1958
1959
1960
1961
1962
1963
1964
1965
1966
1967
1968
1969
1970
1971
1972
1973
1974
1975
1976
1977
1978
1979
1980
1981
1982
1983
1984
1985
1986
1987
1988
1989
1990
1991
1992
1993
1994
1995
1996
1997
1998
1999
2 0 0 0
1 8 0 0
1 6 0 0
1 4 0 0
1 2 0 0
1 0 0 0
8 0 0
6 0 0
4 0 0
2 0 0
Dep
th [
m]
Min 1 Min 2
Cyclonic activity in the Region 2, winter

1945 1950 1955 1960 1965 1970 1975 1980 1985 1990 1995Year
-6
-4
-2
0
2
4
NA
O
NAO winter index (1945-1993)19
46
1947
1948
1949
1950
1951
1952
1953
1954
1955
1956
1957
1958
1959
1960
1961
1962
1963
1964
1965
1966
1967
1968
1969
1970
1971
1972
1973
1974
1975
1976
1977
1978
1979
1980
1981
1982
1983
1984
1985
1986
1987
1988
1989
1990
1991
1992
1993
1994
1995
1996
1997
1998
1999
2000
-0.134
0.366
0.866
1.366
1.866
2.366
2.866
3.366
3.866
4.366
4.866
5.366
-0.134
0.366
0.866
1.366
1.866
2.366
2.866
3.366
3.866
4.366
4.866
5.366
1946
1947
1948
1949
1950
1951
1952
1953
1954
1955
1956
1957
1958
1959
1960
1961
1962
1963
1964
1965
1966
1967
1968
1969
1970
1971
1972
1973
1974
1975
1976
1977
1978
1979
1980
1981
1982
1983
1984
1985
1986
1987
1988
1989
1990
1991
1992
1993
1994
1995
1996
1997
1998
1999
2000
T em perature [°C ] by Y ear s,W inter : N ov em ber -D ecem ber (P rev ious Y ear ) - J anuary -M ay , R egion 15 (SO _ B E A R I), H or izon 0005 m
M ean tem p era tu re [°C ] R u n n in g av e rag e (w in d o w w id th : 5 ) o f m ean tem p era tu re [°C ] L in ear eq u a tio n o f reg re ss io n : Y = 0 .0 2 3 5 6 * X -4 4 .4 9 8 9 4
1946
1947
1948
1949
1950
1951
1952
1953
1954
1955
1956
1957
1958
1959
1960
1961
1962
1963
1964
1965
1966
1967
1968
1969
1970
1971
1972
1973
1974
1975
1976
1977
1978
1979
1980
1981
1982
1983
1984
1985
1986
1987
1988
1989
1990
1991
1992
1993
1994
1995
1996
1997
1998
1999
2000
0
100
200
300
0
100
200
300
Temperature
(Winter, Box 15, 1945-2000)
Long Scale
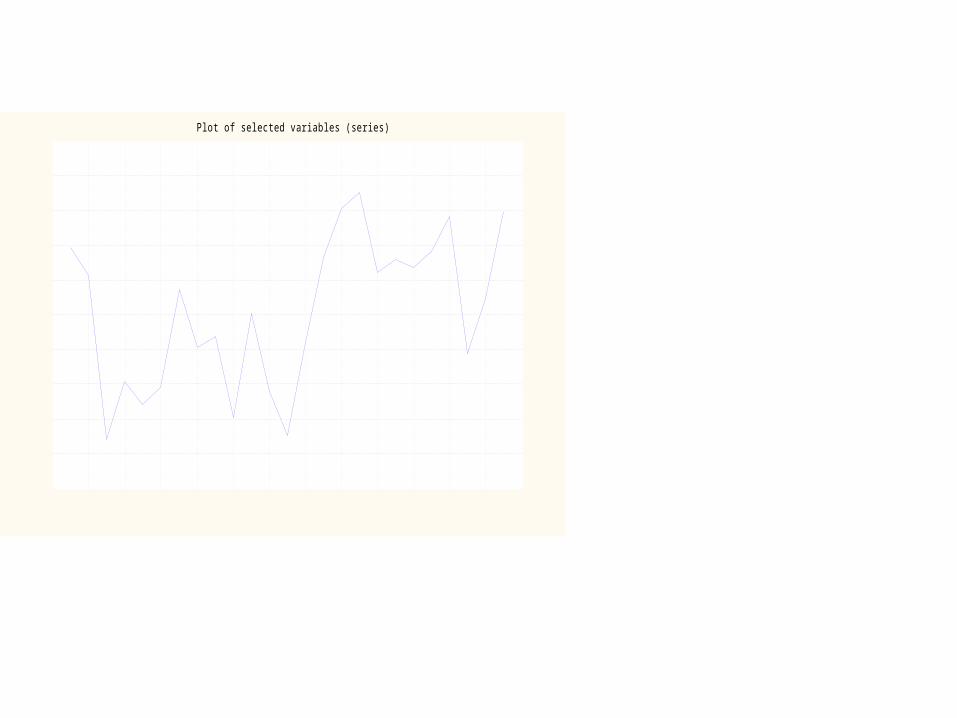
Plot of selected variables (series)
26 28 30 32 34 36 38 40 42 44 46 48 50 52
T5_50_M (L) AO2 (R)
1,0
1,5
2,0
2,5
3,0
3,5
4,0
4,5
5,0
5,5
6,0
T5
_5
0_
M:
-3
-2
-1
0
1
2
3
4
5
AO
2:
Long Scale
Arctic Oscillation
CrossCorrelation Function
First : T5_50_MLagged: AO2
Conf. Limit-1,0 -0,5 0,0 0,5 1,00
15 -,079 ,4472 14 ,0104 ,4082 13 -,090 ,3780 12 -,095 ,3536 11 -,164 ,3333 10 -,245 ,3162 9 -,179 ,3015 8 -,167 ,2887 7 -,042 ,2774 6 ,0121 ,2673 5 -,145 ,2582 4 -,015 ,2500 3 ,2013 ,2425 2 ,2724 ,2357 1 ,7047 ,2294 0 ,4589 ,2236 -1 ,3826 ,2294 -2 ,0544 ,2357 -3 -,040 ,2425 -4 ,1016 ,2500 -5 -,034 ,2582 -6 ,0795 ,2673 -7 ,2478 ,2774 -8 ,0190 ,2887 -9 -,187 ,3015-10 -,324 ,3162-11 -,216 ,3333-12 -,017 ,3536-13 -,195 ,3780-14 -,003 ,4082-15 -,028 ,4472Lag Corr. S.E.
+1 year, r=0.71
Temperature
AO index

Plot of selected variables (series)
0 5 10 15 20 25 30 35 40 45 50 55
NOA (L) T9_200_M (R)
-6
-4
-2
0
2
4
6
8
NO
A:
1,5
2,0
2,5
3,0
3,5
4,0
4,5
5,0
5,5
T9_
200_
M:
Long Scale
North Atlantic OscillationHorizon Time shift Мах.
Correl-ation,
- (years) rParameter
AO 0m-T -1 0,64
Center of Fram Strait
AO 50m-T -1 0,7
AO 200m-T -1 0,62
AO 200m-S -1 0,56
NOA 50m-T -1 0,49
NOA 200m-T -1 0,56
NOA 200m-S -1 0,57
AO-2 50m-T -1 0,55
AO-2 200m-T -1 0,53
AO-5 1000m-T -2 0,64
NOA 200m-T -1 0,72NOA 50m-T -1 0,52
NOA 200m-T 0 0,53
AO 50m-T 0 0,69
AO 200m-T 0 0,61
-0,56
Region northwards to
Svalbard
Region of Norwegian
current
NOA 1000m-S -5
Region Macro-circulation Index
Region of WSC
Region of branching of
WSC
NOA index
Temperature

Influence of ice cover
Seasonal time scale
Seasonal time scale
Long-term time Scale
Long-term time Scale
Local ChangesLocal Changes Distant Climatic connections
Distant Climatic connections
IN SPACE
IN TIME
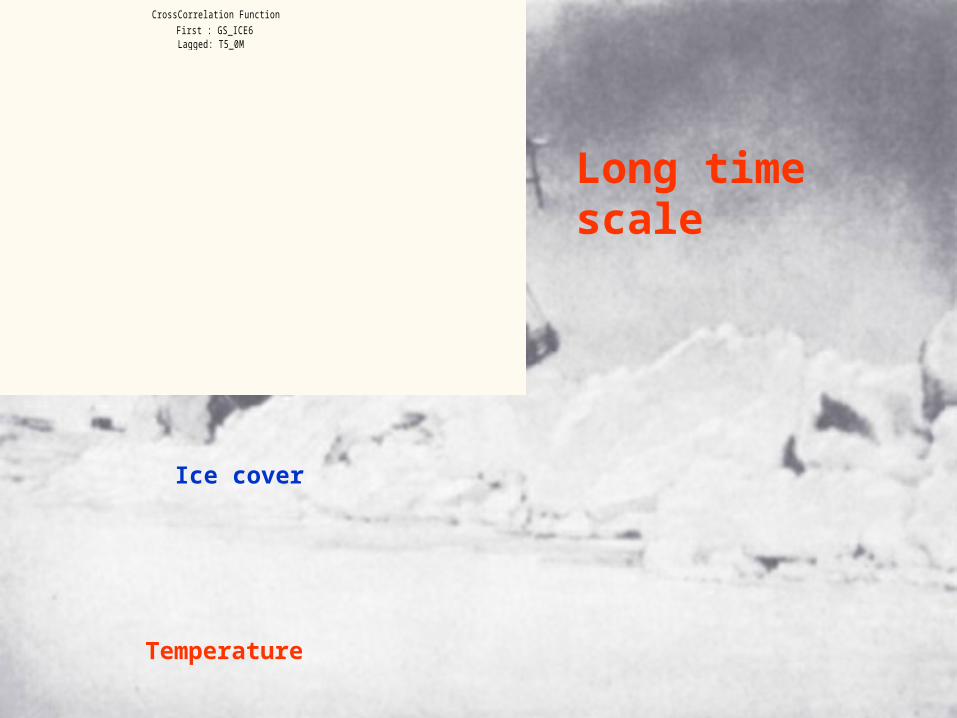
Long time scale
Ice cover
Temperature
FRAM
CrossCorrelation Function
First : GS_ICE6Lagged: T5_0M
Conf. Limit-1,0 -0,5 0,0 0,5 1,00
15 -- -- 14 ,0011 1,000 13 ,0135 ,7071 12 ,0066 ,5774 11 ,0241 ,5000 10 -,108 ,4472 9 -,174 ,4082 8 -,270 ,3780 7 -,124 ,3536 6 ,0487 ,3333 5 ,3424 ,3162 4 ,2444 ,3015 3 ,1622 ,2887 2 ,2240 ,2774 1 ,3806 ,2673 0 ,4104 ,2582 -1 ,3596 ,2673 -2 ,4396 ,2774 -3 ,8415 ,2887 -4 ,4184 ,3015 -5 ,0787 ,3162 -6 ,0483 ,3333 -7 ,3869 ,3536 -8 ,0208 ,3780 -9 -,019 ,4082-10 ,3290 ,4472-11 -,016 ,5000-12 -,156 ,5774-13 -,156 ,7071-14 -,209 1,000
-15 -- --Lag Corr. S.E.
Plot of selected variables (series)
10 15 20 25 30 35 40 45 50 55
GS_ICE6 (L) 5Т_0M (R)
25
30
35
40
45
50
55
60
65
70
GS
_IC
E6
:
0
1
2
3
4
5
6
5Т
_0
M:
r=0.65..0.95;
Time shift: 0..5 years
Distant Climatic Connections

-250-200
-150-100
-500
50100
150200
250
-200
-150
-100
-50 0 50
100
150
200
250
300
3 years
Polynya
SVALBARD
CrossCorre lation Function
Firs t : V ice_inSNZPLagged: G S_9_in1000T
C onf. L im it-1 ,0 -0,5 0,0 0,5 1,00
15 -,177 ,3780 14 -,235 ,3536 13 -,289 ,3333 12 -,315 ,3162 11 -,374 ,3015 10 -,419 ,2887 9 -,439 ,2774 8 -,422 ,2673 7 -,384 ,2582 6 -,302 ,2500 5 -,167 ,2425 4 ,0082 ,2357 3 ,1844 ,2294 2 ,3339 ,2236 1 ,5496 ,2182 0 ,7215 ,2132 -1 ,8951 ,2182 -2 ,9613 ,2236 -3 ,9330 ,2294 -4 ,8840 ,2357 -5 ,8059 ,2425 -6 ,6922 ,2500 -7 ,5452 ,2582 -8 ,2988 ,2673 -9 ,0567 ,2774-10 -,155 ,2887-11 -,376 ,3015-12 -,503 ,3162-13 -,594 ,3333-14 -,586 ,3536-15 -,548 ,3780Lag Corr. S.E.
11 years

-250-200
-150-1
00-50
050
100
150
200250
-200
-150
-100
-50 0 50
100
150
200
250
300
SVALBARD
Greenland
Area of Polynya activity
~ 3 years
0,001,002,003,00
4,005,006,007,008,00
Vol
ume
(100
0 km
3.)
1978
-197
9
1980
-198
1
1982
-198
3
1984
-198
5
1986
-198
7
1988
-198
9
1990
-199
1
1992
-199
3
1994
-199
5
1996
-199
7
1998
-199
9
Years
Time distribution of new ice voluems produced in Kara Sea (Nov-May)
Time distribution of new ice voluems produced in Kara Sea
(Nov-May)
Plot of selected variables (series)
4 6 8 10 12 14 16 18 20 22 24 26 28 30 32 34 36 38
Vice_inSNZP (L) GS_9_in1000T (R)
-1500
-1000
-500
0
500
1000
Vic
e_
inS
NZ
P:
-3,5
-3,0
-2,5
-2,0
-1,5
-1,0
-0,5
0,0
0,5
1,0
1,5
GS
_9
_in
10
00
T:
Time variability of ice production and temperature in Fram Strait (1000m)
New Ice formed in polynya
Temperature in Fram Strait
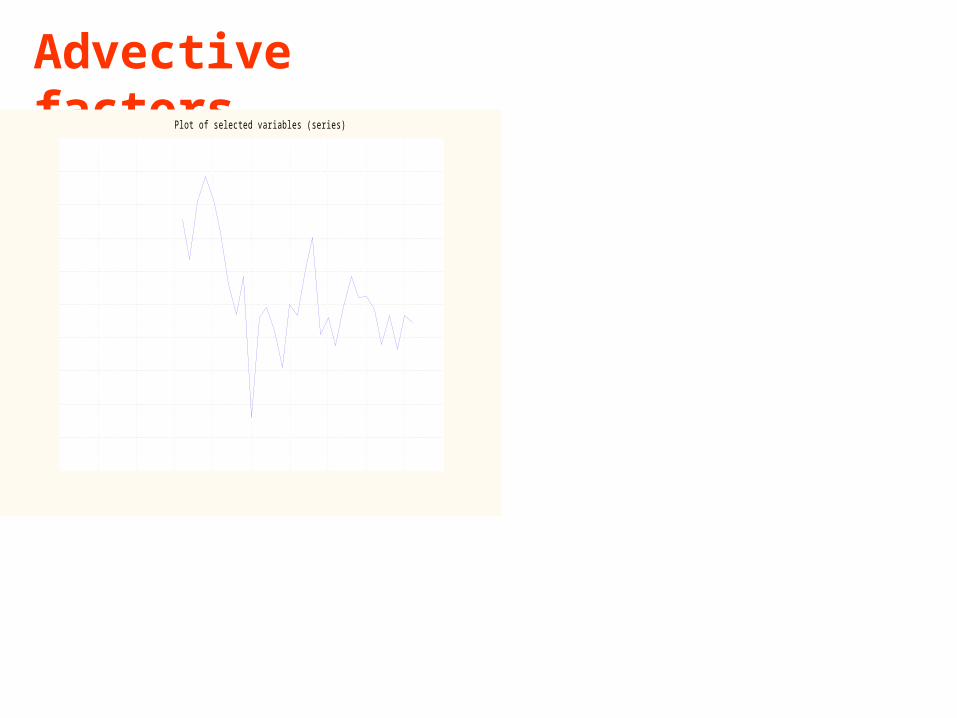
Advective factorsPlot of selected variables (series)
5 10 15 20 25 30 35 40 45 50 55
S9_1000M (L) S_AW_FSP (R)
34,86
34,88
34,90
34,92
34,94
34,96
34,98
35,00
35,02
35,04
35,06
S9_
1000
M:
34,90
34,92
34,94
34,96
34,98
35,00
35,02
35,04
35,06
35,08
35,10
S_A
W_F
SP
:
CrossCorrelation Function
First : S_AW_FSPLagged: S9_1000M
Conf. Limit-1,0 -0,5 0,0 0,5 1,00
15 -,297 ,3162 14 -,237 ,3015 13 -,263 ,2887 12 -,280 ,2774 11 -,105 ,2673 10 -,124 ,2582 9 -,093 ,2500 8 ,0637 ,2425 7 ,0237 ,2357 6 ,3101 ,2294 5 ,3690 ,2236 4 ,6490 ,2182 3 ,6873 ,2132 2 ,7042 ,2085 1 ,7013 ,2041 0 ,5360 ,2000 -1 ,3518 ,2041 -2 ,1658 ,2085 -3 -,026 ,2132 -4 -,074 ,2182 -5 -,085 ,2236 -6 -,190 ,2294 -7 -,224 ,2357 -8 -,122 ,2425 -9 -,235 ,2500-10 -,038 ,2582-11 ,0516 ,2673-12 -,063 ,2774-13 -,055 ,2887-14 -,111 ,3015-15 -,123 ,3162Lag Corr. S.E.
Salinity in Farore-Scotland Straits
Salinity in Fram Strait
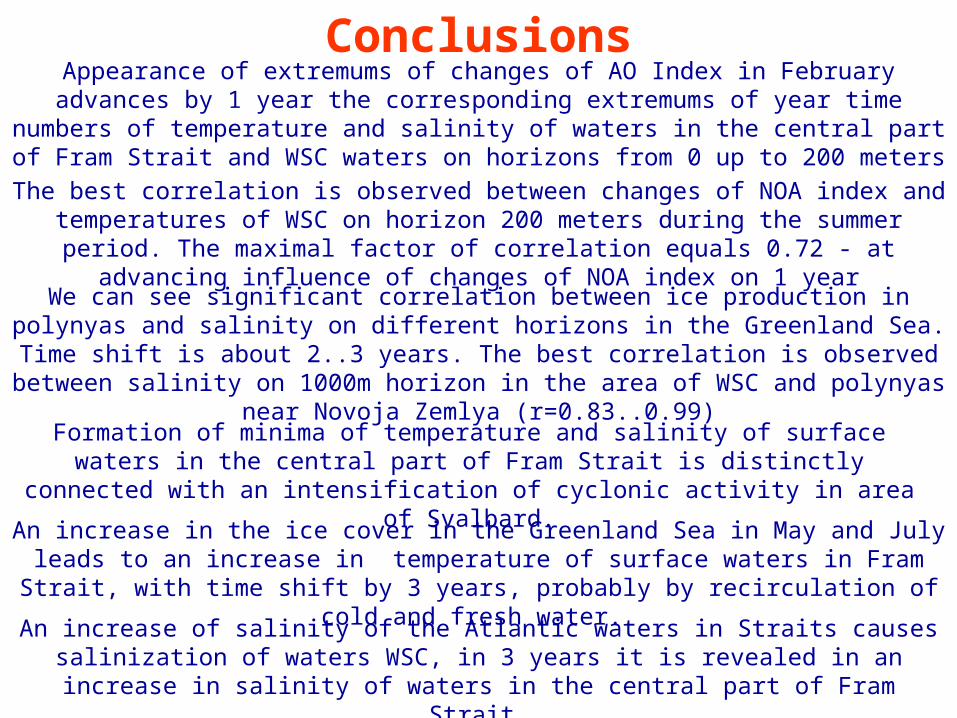
ConclusionsAppearance of extremums of changes of AO Index in February advances by 1 year the corresponding extremums of year time numbers of temperature and salinity of waters in
the central part of Fram Strait and WSC waters on horizons from 0 up to 200 meters
The best correlation is observed between changes of NOA index and temperatures of WSC on horizon 200 meters during the summer period. The maximal factor of
correlation equals 0.72 - at advancing influence of changes of NOA index on 1 year
We can see significant correlation between ice production in polynyas and salinity on different horizons in the Greenland Sea. Time shift is about 2..3 years. The best
correlation is observed between salinity on 1000m horizon in the area of WSC and polynyas near Novoja Zemlya (r=0.83..0.99)
Formation of minima of temperature and salinity of surface waters in the central part of Fram Strait is distinctly connected with an intensification of cyclonic activity in area of
Svalbard.
An increase in the ice cover in the Greenland Sea in May and July leads to an increase in temperature of surface waters in Fram Strait, with time shift by 3 years, probably by
recirculation of cold and fresh water.
An increase of salinity of the Atlantic waters in Straits causes salinization of waters WSC, in 3 years it is revealed in an increase in salinity of waters in the central part of
Fram Strait.
Related Documents


