Supervised neural network classification of pre-sliced cooked pork ham images using quaternionic singular values Nektarios A. Valous a , Fernando Mendoza a , Da-Wen Sun a, * , Paul Allen b a FRCFT Group, Biosystems Engineering, Agriculture and Food Science Centre, School of Agriculture Food Science and Veterinary Medicine, University College Dublin, Belfield, Dublin 4, Ireland b Ashtown Food Research Centre, Teagasc, Dublin 15, Ireland article info Article history: Received 27 April 2009 Received in revised form 14 September 2009 Accepted 17 September 2009 Keywords: Computer vision Pork ham slice Supervised classification Quaternionic singular value decomposition Quaternionic singular values Mahalanobis distance Artificial neural network Multilayer perceptron abstract The quaternionic singular value decomposition is a technique to decompose a quaternion matrix (repre- sentation of a colour image) into quaternion singular vector and singular value component matrices exposing useful properties. The objective of this study was to use a small portion of uncorrelated singular values, as robust features for the classification of sliced pork ham images, using a supervised artificial neural network classifier. Images were acquired from four qualities of sliced cooked pork ham typically consumed in Ireland (90 slices per quality), having similar appearances. Mahalanobis distances and Pear- son product moment correlations were used for feature selection. Six highly discriminating features were used as input to train the neural network. An adaptive feedforward multilayer perceptron classifier was employed to obtain a suitable mapping from the input dataset. The overall correct classification perfor- mance for the training, validation and test set were 90.3%, 94.4%, and 86.1%, respectively. The results con- firm that the classification performance was satisfactory. Extracting the most informative features led to the recognition of a set of different but visually quite similar textural patterns based on quaternionic sin- gular values. Ó 2009 Elsevier Ltd. All rights reserved. 1. Introduction Computer vision has been implemented for quality assessment in meats and meat products, overcoming most of the drawbacks of traditional methods, e.g. human inspection and instrumental techniques (Kumar & Mittal, 2009; Quevedo & Aguilera, 2009; Quevedo, Aguilera, & Pedreschi, 2009). For quality grading purposes, image analysis techniques need to take into account the high variability in colour and visual texture of pork hams. Although gray level images can be quite satisfactory from the pat- tern recognition perspective, colour images alternatively do seem to be perceptually richer. There is no doubt that colour contains very useful information that can help to improve the accuracy of pattern recognition systems (Villegas & Paredes, 2007). Different from gray level images, colour data representations are usually ternary, e.g. ham slice colour image data from a digital camera in the RGB colour space. Over the last decade, growth has been witnessed in both the diversity of techniques and the range of applications regarding col- our image analysis (Sangwine & Horne, 1998; Kaya, Ko, & Gunasek- aran, 2008; Fathi, Mohebbi, & Razavis, 2009). There are operations in image processing which have been known and understood for many years; however they have not been generalized considerably to colour images (Sangwine & Ell, 1999). Several approaches have been followed to deal with colour images. One of the typical is to process each colour channel separately (Mendoza et al., 2009; Va- lous, Mendoza, Sun, & Allen, 2009a). A quite recent approach is to encode the three channel components on the three imaginary parts of a quaternion (Denis, Carre, & Fernandez-Maloigne, 2007). There is a growing interest in the applications of quaternion numbers to colour image processing (Smolka & Venetsanopoulos, 2006; Tré- meau, Tominaga, & Plataniotis, 2008). Many problems in the area of quaternion-based image processing are still open (Cai & Mitra, 2000). In general, quaternions are an extension of complex num- bers to four dimensions and play an important role in colour image processing. They are considered as complex numbers with a vector imaginary part consisting of three mutually orthogonal compo- nents. In Cartesian form, quaternion numbers can be represented as follows: q ¼ a þ ib þ jc þ kd; ð1Þ where a, b, c and d are real numbers, and i, j and k are orthogonal imaginary operators. A pure quaternion has a zero real part and a full quaternion has a non-zero real part. Thus, a quaternion number 0309-1740/$ - see front matter Ó 2009 Elsevier Ltd. All rights reserved. doi:10.1016/j.meatsci.2009.09.011 * Corresponding author. Tel.: +353 17167342; fax: +353 17167493. E-mail address: [email protected] (D.-W. Sun). URLs: http://www.ucd.ie/refrig, http://www.ucd.ie/sun (D.-W. Sun). Meat Science 84 (2010) 422–430 Contents lists available at ScienceDirect Meat Science journal homepage: www.elsevier.com/locate/meatsci

Welcome message from author
This document is posted to help you gain knowledge. Please leave a comment to let me know what you think about it! Share it to your friends and learn new things together.
Transcript
Meat Science 84 (2010) 422–430
Contents lists available at ScienceDirect
Meat Science
journal homepage: www.elsevier .com/ locate/meatsc i
Supervised neural network classification of pre-sliced cooked pork ham imagesusing quaternionic singular values
Nektarios A. Valous a, Fernando Mendoza a, Da-Wen Sun a,*, Paul Allen b
a FRCFT Group, Biosystems Engineering, Agriculture and Food Science Centre, School of Agriculture Food Science and Veterinary Medicine, University College Dublin,Belfield, Dublin 4, Irelandb Ashtown Food Research Centre, Teagasc, Dublin 15, Ireland
a r t i c l e i n f o a b s t r a c t
Article history:Received 27 April 2009Received in revised form 14 September2009Accepted 17 September 2009
Keywords:Computer visionPork ham sliceSupervised classificationQuaternionic singular value decompositionQuaternionic singular valuesMahalanobis distanceArtificial neural networkMultilayer perceptron
0309-1740/$ - see front matter � 2009 Elsevier Ltd. Adoi:10.1016/j.meatsci.2009.09.011
* Corresponding author. Tel.: +353 17167342; fax:E-mail address: [email protected] (D.-W. Sun).URLs: http://www.ucd.ie/refrig, http://www.ucd.ie
The quaternionic singular value decomposition is a technique to decompose a quaternion matrix (repre-sentation of a colour image) into quaternion singular vector and singular value component matricesexposing useful properties. The objective of this study was to use a small portion of uncorrelated singularvalues, as robust features for the classification of sliced pork ham images, using a supervised artificialneural network classifier. Images were acquired from four qualities of sliced cooked pork ham typicallyconsumed in Ireland (90 slices per quality), having similar appearances. Mahalanobis distances and Pear-son product moment correlations were used for feature selection. Six highly discriminating features wereused as input to train the neural network. An adaptive feedforward multilayer perceptron classifier wasemployed to obtain a suitable mapping from the input dataset. The overall correct classification perfor-mance for the training, validation and test set were 90.3%, 94.4%, and 86.1%, respectively. The results con-firm that the classification performance was satisfactory. Extracting the most informative features led tothe recognition of a set of different but visually quite similar textural patterns based on quaternionic sin-gular values.
� 2009 Elsevier Ltd. All rights reserved.
1. Introduction
Computer vision has been implemented for quality assessmentin meats and meat products, overcoming most of the drawbacks oftraditional methods, e.g. human inspection and instrumentaltechniques (Kumar & Mittal, 2009; Quevedo & Aguilera, 2009;Quevedo, Aguilera, & Pedreschi, 2009). For quality gradingpurposes, image analysis techniques need to take into accountthe high variability in colour and visual texture of pork hams.Although gray level images can be quite satisfactory from the pat-tern recognition perspective, colour images alternatively do seemto be perceptually richer. There is no doubt that colour containsvery useful information that can help to improve the accuracy ofpattern recognition systems (Villegas & Paredes, 2007). Differentfrom gray level images, colour data representations are usuallyternary, e.g. ham slice colour image data from a digital camera inthe RGB colour space.
Over the last decade, growth has been witnessed in both thediversity of techniques and the range of applications regarding col-our image analysis (Sangwine & Horne, 1998; Kaya, Ko, & Gunasek-
ll rights reserved.
+353 17167493.
/sun (D.-W. Sun).
aran, 2008; Fathi, Mohebbi, & Razavis, 2009). There are operationsin image processing which have been known and understood formany years; however they have not been generalized considerablyto colour images (Sangwine & Ell, 1999). Several approaches havebeen followed to deal with colour images. One of the typical is toprocess each colour channel separately (Mendoza et al., 2009; Va-lous, Mendoza, Sun, & Allen, 2009a). A quite recent approach is toencode the three channel components on the three imaginary partsof a quaternion (Denis, Carre, & Fernandez-Maloigne, 2007). Thereis a growing interest in the applications of quaternion numbers tocolour image processing (Smolka & Venetsanopoulos, 2006; Tré-meau, Tominaga, & Plataniotis, 2008). Many problems in the areaof quaternion-based image processing are still open (Cai & Mitra,2000). In general, quaternions are an extension of complex num-bers to four dimensions and play an important role in colour imageprocessing. They are considered as complex numbers with a vectorimaginary part consisting of three mutually orthogonal compo-nents. In Cartesian form, quaternion numbers can be representedas follows:
q ¼ aþ ibþ jc þ kd; ð1Þ
where a, b, c and d are real numbers, and i, j and k are orthogonalimaginary operators. A pure quaternion has a zero real part and afull quaternion has a non-zero real part. Thus, a quaternion number
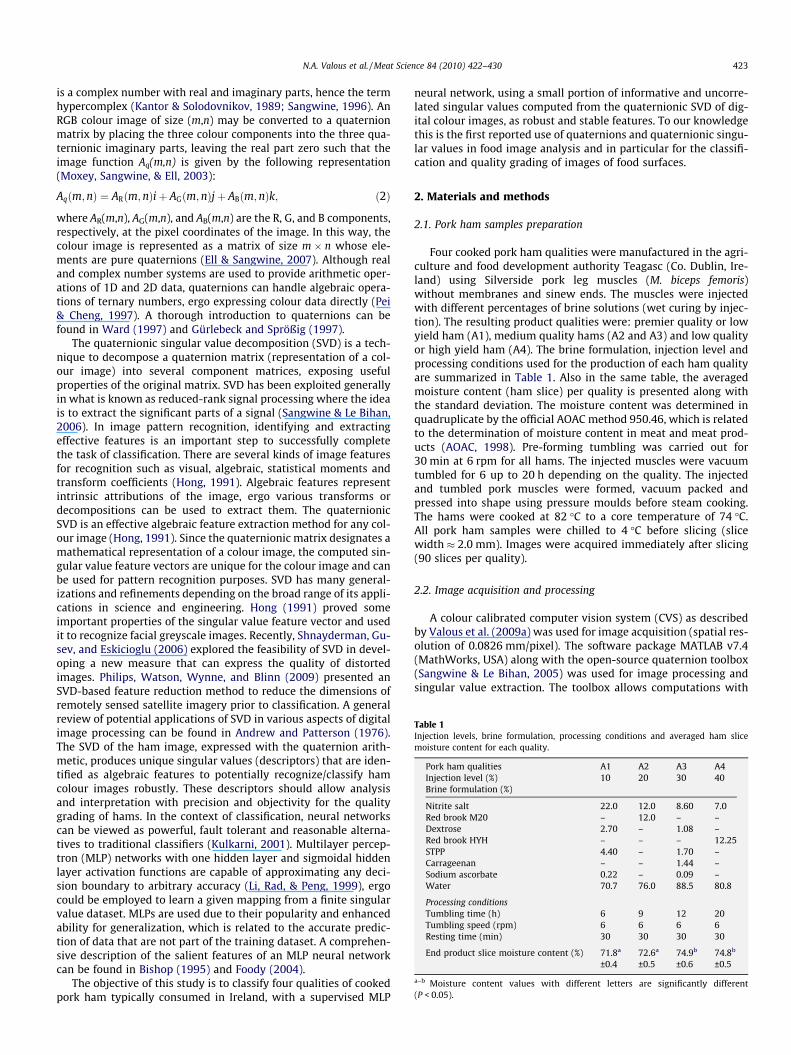
Table 1Injection levels, brine formulation, processing conditions and averaged ham slicemoisture content for each quality.
Pork ham qualities A1 A2 A3 A4Injection level (%) 10 20 30 40Brine formulation (%)
Nitrite salt 22.0 12.0 8.60 7.0Red brook M20 – 12.0 – –Dextrose 2.70 – 1.08 –Red brook HYH – – – 12.25STPP 4.40 – 1.70 –Carrageenan – – 1.44 –Sodium ascorbate 0.22 – 0.09 –Water 70.7 76.0 88.5 80.8
Processing conditionsTumbling time (h) 6 9 12 20Tumbling speed (rpm) 6 6 6 6Resting time (min) 30 30 30 30
End product slice moisture content (%) 71.8a 72.6a 74.9b 74.8b
±0.4 ±0.5 ±0.6 ±0.5
a–b Moisture content values with different letters are significantly different(P < 0.05).
N.A. Valous et al. / Meat Science 84 (2010) 422–430 423
is a complex number with real and imaginary parts, hence the termhypercomplex (Kantor & Solodovnikov, 1989; Sangwine, 1996). AnRGB colour image of size (m,n) may be converted to a quaternionmatrix by placing the three colour components into the three qua-ternionic imaginary parts, leaving the real part zero such that theimage function Aq(m,n) is given by the following representation(Moxey, Sangwine, & Ell, 2003):
Aqðm;nÞ ¼ ARðm; nÞiþ AGðm; nÞjþ ABðm; nÞk; ð2Þ
where AR(m,n), AG(m,n), and AB(m,n) are the R, G, and B components,respectively, at the pixel coordinates of the image. In this way, thecolour image is represented as a matrix of size m � n whose ele-ments are pure quaternions (Ell & Sangwine, 2007). Although realand complex number systems are used to provide arithmetic oper-ations of 1D and 2D data, quaternions can handle algebraic opera-tions of ternary numbers, ergo expressing colour data directly (Pei& Cheng, 1997). A thorough introduction to quaternions can befound in Ward (1997) and Gürlebeck and Sprößig (1997).
The quaternionic singular value decomposition (SVD) is a tech-nique to decompose a quaternion matrix (representation of a col-our image) into several component matrices, exposing usefulproperties of the original matrix. SVD has been exploited generallyin what is known as reduced-rank signal processing where the ideais to extract the significant parts of a signal (Sangwine & Le Bihan,2006). In image pattern recognition, identifying and extractingeffective features is an important step to successfully completethe task of classification. There are several kinds of image featuresfor recognition such as visual, algebraic, statistical moments andtransform coefficients (Hong, 1991). Algebraic features representintrinsic attributions of the image, ergo various transforms ordecompositions can be used to extract them. The quaternionicSVD is an effective algebraic feature extraction method for any col-our image (Hong, 1991). Since the quaternionic matrix designates amathematical representation of a colour image, the computed sin-gular value feature vectors are unique for the colour image and canbe used for pattern recognition purposes. SVD has many general-izations and refinements depending on the broad range of its appli-cations in science and engineering. Hong (1991) proved someimportant properties of the singular value feature vector and usedit to recognize facial greyscale images. Recently, Shnayderman, Gu-sev, and Eskicioglu (2006) explored the feasibility of SVD in devel-oping a new measure that can express the quality of distortedimages. Philips, Watson, Wynne, and Blinn (2009) presented anSVD-based feature reduction method to reduce the dimensions ofremotely sensed satellite imagery prior to classification. A generalreview of potential applications of SVD in various aspects of digitalimage processing can be found in Andrew and Patterson (1976).The SVD of the ham image, expressed with the quaternion arith-metic, produces unique singular values (descriptors) that are iden-tified as algebraic features to potentially recognize/classify hamcolour images robustly. These descriptors should allow analysisand interpretation with precision and objectivity for the qualitygrading of hams. In the context of classification, neural networkscan be viewed as powerful, fault tolerant and reasonable alterna-tives to traditional classifiers (Kulkarni, 2001). Multilayer percep-tron (MLP) networks with one hidden layer and sigmoidal hiddenlayer activation functions are capable of approximating any deci-sion boundary to arbitrary accuracy (Li, Rad, & Peng, 1999), ergocould be employed to learn a given mapping from a finite singularvalue dataset. MLPs are used due to their popularity and enhancedability for generalization, which is related to the accurate predic-tion of data that are not part of the training dataset. A comprehen-sive description of the salient features of an MLP neural networkcan be found in Bishop (1995) and Foody (2004).
The objective of this study is to classify four qualities of cookedpork ham typically consumed in Ireland, with a supervised MLP
neural network, using a small portion of informative and uncorre-lated singular values computed from the quaternionic SVD of dig-ital colour images, as robust and stable features. To our knowledgethis is the first reported use of quaternions and quaternionic singu-lar values in food image analysis and in particular for the classifi-cation and quality grading of images of food surfaces.
2. Materials and methods
2.1. Pork ham samples preparation
Four cooked pork ham qualities were manufactured in the agri-culture and food development authority Teagasc (Co. Dublin, Ire-land) using Silverside pork leg muscles (M. biceps femoris)without membranes and sinew ends. The muscles were injectedwith different percentages of brine solutions (wet curing by injec-tion). The resulting product qualities were: premier quality or lowyield ham (A1), medium quality hams (A2 and A3) and low qualityor high yield ham (A4). The brine formulation, injection level andprocessing conditions used for the production of each ham qualityare summarized in Table 1. Also in the same table, the averagedmoisture content (ham slice) per quality is presented along withthe standard deviation. The moisture content was determined inquadruplicate by the official AOAC method 950.46, which is relatedto the determination of moisture content in meat and meat prod-ucts (AOAC, 1998). Pre-forming tumbling was carried out for30 min at 6 rpm for all hams. The injected muscles were vacuumtumbled for 6 up to 20 h depending on the quality. The injectedand tumbled pork muscles were formed, vacuum packed andpressed into shape using pressure moulds before steam cooking.The hams were cooked at 82 �C to a core temperature of 74 �C.All pork ham samples were chilled to 4 �C before slicing (slicewidth � 2.0 mm). Images were acquired immediately after slicing(90 slices per quality).
2.2. Image acquisition and processing
A colour calibrated computer vision system (CVS) as describedby Valous et al. (2009a) was used for image acquisition (spatial res-olution of 0.0826 mm/pixel). The software package MATLAB v7.4(MathWorks, USA) along with the open-source quaternion toolbox(Sangwine & Le Bihan, 2005) was used for image processing andsingular value extraction. The toolbox allows computations with

424 N.A. Valous et al. / Meat Science 84 (2010) 422–430
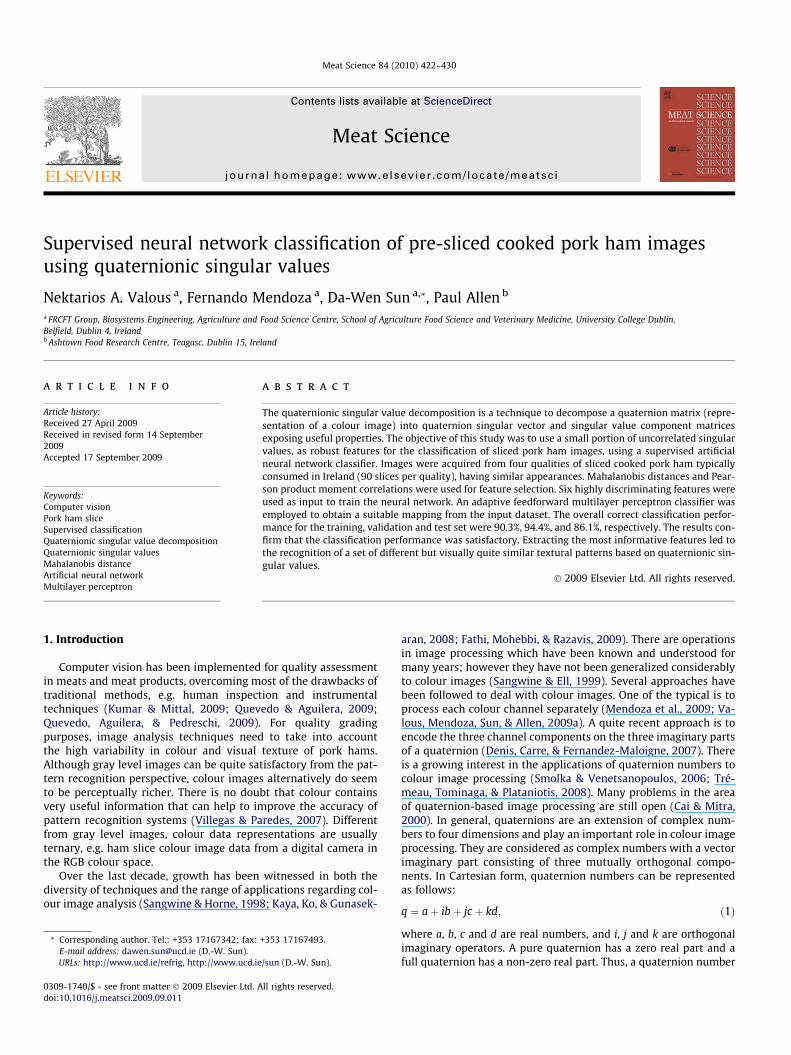
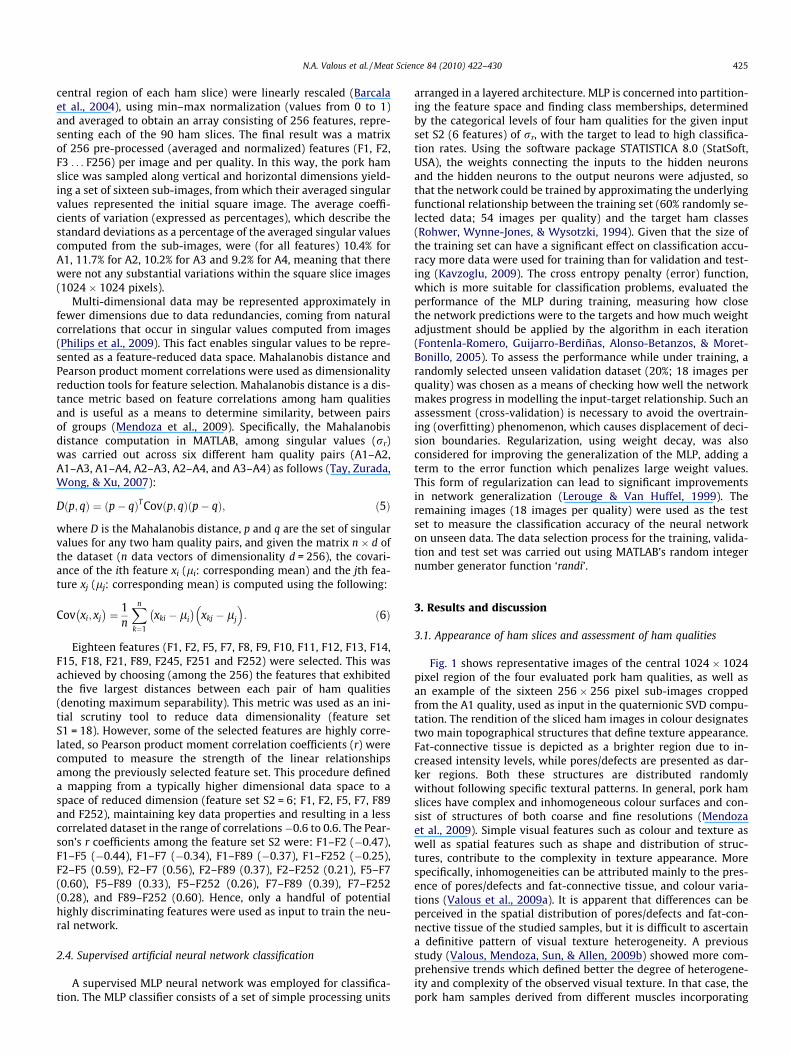
quaternion matrices in almost the same way as with matrices ofcomplex numbers. A polynomial transform for calibrating coloursignals (Valous et al., 2009a) was used to map the RGB primariesto sRGB (IEC, 1999), ensuring reproducible colour images. Due tothe differences in size and shape among the four qualities andthe considerable computational delays associated with the qua-ternionic SVD, the acquired colour images were subsequentlycropped in the central region (1024 � 1024 pixels; equivalent to7154.1 mm2) to produce sixteen 256 � 256 pixel sub-images(equivalent to 447.1 mm2) per ham slice image and per quality(Fig. 1). Cropping allowed better scrutiny and interpretation (allanalyzed images had the same spatial pixel dimensions) and alsokept computation times manageable. The use of SVD on largeimages is not practical due to memory requirements and becauseof the long time required to perform the computation (Fish, Groch-malicki, & Pike, 1996; Shnayderman et al., 2006). Thus, the colourcalibrated sub-images, expressed as quaternion matrices, were thedirect input to the quaternionic SVD algorithm for the extraction ofsingular values.
2.3. Singular value extraction from quaternionic SVD
In general, SVD is related to the diagonalization of a matrix andis a well-used tool in the theory of linear algebra. Without separat-ing the image into three separate colour channel images, it hasbeen demonstrated that this colour image decomposition existbased on quaternion matrix algebra (Zhang, 1997). Specifically, inquaternionic SVD, for any arbitrary m � n quaternion matrix Aq,there exist two quaternion unitary matrices U and V and a diagonalR such that the following factorization exists in the following form(Le Bihan & Mars, 2004):
Aq ¼ URVT ; with R ¼Rr 00 0
� �; ð3Þ
where U denotes an m �m unitary quaternion matrix, R is an m � ndiagonal matrix with non-negative real numbers on the diagonal,and VT is the conjugate transpose of an m � n unitary quaternion
Fig. 1. Representative images of the evaluated pork ham qualities: (a) RGB images of thcropped from A1 and used for the SVD computation.
matrix V. The diagonal entries of R, called singular values Rr, canbe arranged in order of decreasing magnitude and the columns ofU and V are called left and right quaternion singular vectors forAq, respectively. The quaternionic SVD can be rewritten as singularvalue spectrum decomposition; the matrix Aq with rank r has a Fou-rier expansion, in terms of the singular values and outer products ofthe columns of the U and V matrices, of the following form (Gentle,2007):
Aq ¼Xr
n¼1
unvTnrn; ð4Þ
where un are the left singular vectors (columns of U), mTn the right
singular vectors (columns of V), and rr are the real singular values.Eq. (4) shows that this quaternionic factorization, decomposes thematrix into a sum of r rank-1 quaternion matrices, ergo it is saidto be rank revealing; the number of non-null singular values equalsthe rank of the matrix (Le Bihan & Sangwine, 2007). The method forobtaining the SVD in colour images expressed as quaternion matri-ces can be found in Le Bihan and Mars (2004). From the algorithmicdevelopment perspective, deriving the SVD using the Jacobi algo-rithm produces more accurate results than any other known algo-rithm (Le Bihan & Sangwine, 2007). A much faster algorithmbased on the transformation of a quaternion matrix to bidiagonalform using quaternionic Householder transformations has beendeveloped in a previous study (Sangwine & Le Bihan, 2006). Thisalgorithm is less accurate than the Jacobi algorithm, but has signif-icant computational speed advantages. Moreover, it is the defaultquaternionic SVD algorithm that has been implemented in the qua-ternion MATLAB toolbox used in this study.
2.4. Feature space reduction
An operation such as a classification that would have been per-formed on the colour image can now be equivalently performed onthe real non-negative diagonal elements rr. Thus, the 256 singularvalues computed for each of the sixteen sub-images (forming the
e central region (1024 � 1024 pixels), and (b) sixteen 256 � 256 pixel sub-images
N.A. Valous et al. / Meat Science 84 (2010) 422–430 425
central region of each ham slice) were linearly rescaled (Barcalaet al., 2004), using min–max normalization (values from 0 to 1)and averaged to obtain an array consisting of 256 features, repre-senting each of the 90 ham slices. The final result was a matrixof 256 pre-processed (averaged and normalized) features (F1, F2,F3 . . . F256) per image and per quality. In this way, the pork hamslice was sampled along vertical and horizontal dimensions yield-ing a set of sixteen sub-images, from which their averaged singularvalues represented the initial square image. The average coeffi-cients of variation (expressed as percentages), which describe thestandard deviations as a percentage of the averaged singular valuescomputed from the sub-images, were (for all features) 10.4% forA1, 11.7% for A2, 10.2% for A3 and 9.2% for A4, meaning that therewere not any substantial variations within the square slice images(1024 � 1024 pixels).
Multi-dimensional data may be represented approximately infewer dimensions due to data redundancies, coming from naturalcorrelations that occur in singular values computed from images(Philips et al., 2009). This fact enables singular values to be repre-sented as a feature-reduced data space. Mahalanobis distance andPearson product moment correlations were used as dimensionalityreduction tools for feature selection. Mahalanobis distance is a dis-tance metric based on feature correlations among ham qualitiesand is useful as a means to determine similarity, between pairsof groups (Mendoza et al., 2009). Specifically, the Mahalanobisdistance computation in MATLAB, among singular values (rr)was carried out across six different ham quality pairs (A1–A2,A1–A3, A1–A4, A2–A3, A2–A4, and A3–A4) as follows (Tay, Zurada,Wong, & Xu, 2007):
Dðp; qÞ ¼ ðp� qÞT Covðp; qÞðp� qÞ; ð5Þ
where D is the Mahalanobis distance, p and q are the set of singularvalues for any two ham quality pairs, and given the matrix n � d ofthe dataset (n data vectors of dimensionality d = 256), the covari-ance of the ith feature xi (li: corresponding mean) and the jth fea-ture xj (lj: corresponding mean) is computed using the following:
Cov xi; xj� �
¼ 1n
Xn
k¼1
xki � li
� �xkj � lj
� �: ð6Þ
Eighteen features (F1, F2, F5, F7, F8, F9, F10, F11, F12, F13, F14,F15, F18, F21, F89, F245, F251 and F252) were selected. This wasachieved by choosing (among the 256) the features that exhibitedthe five largest distances between each pair of ham qualities(denoting maximum separability). This metric was used as an ini-tial scrutiny tool to reduce data dimensionality (feature setS1 = 18). However, some of the selected features are highly corre-lated, so Pearson product moment correlation coefficients (r) werecomputed to measure the strength of the linear relationshipsamong the previously selected feature set. This procedure defineda mapping from a typically higher dimensional data space to aspace of reduced dimension (feature set S2 = 6; F1, F2, F5, F7, F89and F252), maintaining key data properties and resulting in a lesscorrelated dataset in the range of correlations�0.6 to 0.6. The Pear-son’s r coefficients among the feature set S2 were: F1–F2 (�0.47),F1–F5 (�0.44), F1–F7 (�0.34), F1–F89 (�0.37), F1–F252 (�0.25),F2–F5 (0.59), F2–F7 (0.56), F2–F89 (0.37), F2–F252 (0.21), F5–F7(0.60), F5–F89 (0.33), F5–F252 (0.26), F7–F89 (0.39), F7–F252(0.28), and F89–F252 (0.60). Hence, only a handful of potentialhighly discriminating features were used as input to train the neu-ral network.
2.4. Supervised artificial neural network classification
A supervised MLP neural network was employed for classifica-tion. The MLP classifier consists of a set of simple processing units
arranged in a layered architecture. MLP is concerned into partition-ing the feature space and finding class memberships, determinedby the categorical levels of four ham qualities for the given inputset S2 (6 features) of rr, with the target to lead to high classifica-tion rates. Using the software package STATISTICA 8.0 (StatSoft,USA), the weights connecting the inputs to the hidden neuronsand the hidden neurons to the output neurons were adjusted, sothat the network could be trained by approximating the underlyingfunctional relationship between the training set (60% randomly se-lected data; 54 images per quality) and the target ham classes(Rohwer, Wynne-Jones, & Wysotzki, 1994). Given that the size ofthe training set can have a significant effect on classification accu-racy more data were used for training than for validation and test-ing (Kavzoglu, 2009). The cross entropy penalty (error) function,which is more suitable for classification problems, evaluated theperformance of the MLP during training, measuring how closethe network predictions were to the targets and how much weightadjustment should be applied by the algorithm in each iteration(Fontenla-Romero, Guijarro-Berdiñas, Alonso-Betanzos, & Moret-Bonillo, 2005). To assess the performance while under training, arandomly selected unseen validation dataset (20%; 18 images perquality) was chosen as a means of checking how well the networkmakes progress in modelling the input-target relationship. Such anassessment (cross-validation) is necessary to avoid the overtrain-ing (overfitting) phenomenon, which causes displacement of deci-sion boundaries. Regularization, using weight decay, was alsoconsidered for improving the generalization of the MLP, adding aterm to the error function which penalizes large weight values.This form of regularization can lead to significant improvementsin network generalization (Lerouge & Van Huffel, 1999). Theremaining images (18 images per quality) were used as the testset to measure the classification accuracy of the neural networkon unseen data. The data selection process for the training, valida-tion and test set was carried out using MATLAB’s random integernumber generator function ‘randi’.
3. Results and discussion
3.1. Appearance of ham slices and assessment of ham qualities
Fig. 1 shows representative images of the central 1024 � 1024pixel region of the four evaluated pork ham qualities, as well asan example of the sixteen 256 � 256 pixel sub-images croppedfrom the A1 quality, used as input in the quaternionic SVD compu-tation. The rendition of the sliced ham images in colour designatestwo main topographical structures that define texture appearance.Fat-connective tissue is depicted as a brighter region due to in-creased intensity levels, while pores/defects are presented as dar-ker regions. Both these structures are distributed randomlywithout following specific textural patterns. In general, pork hamslices have complex and inhomogeneous colour surfaces and con-sist of structures of both coarse and fine resolutions (Mendozaet al., 2009). Simple visual features such as colour and texture aswell as spatial features such as shape and distribution of struc-tures, contribute to the complexity in texture appearance. Morespecifically, inhomogeneities can be attributed mainly to the pres-ence of pores/defects and fat-connective tissue, and colour varia-tions (Valous et al., 2009a). It is apparent that differences can beperceived in the spatial distribution of pores/defects and fat-con-nective tissue of the studied samples, but it is difficult to ascertaina definitive pattern of visual texture heterogeneity. A previousstudy (Valous, Mendoza, Sun, & Allen, 2009b) showed more com-prehensive trends which defined better the degree of heterogene-ity and complexity of the observed visual texture. In that case, thepork ham samples derived from different muscles incorporating
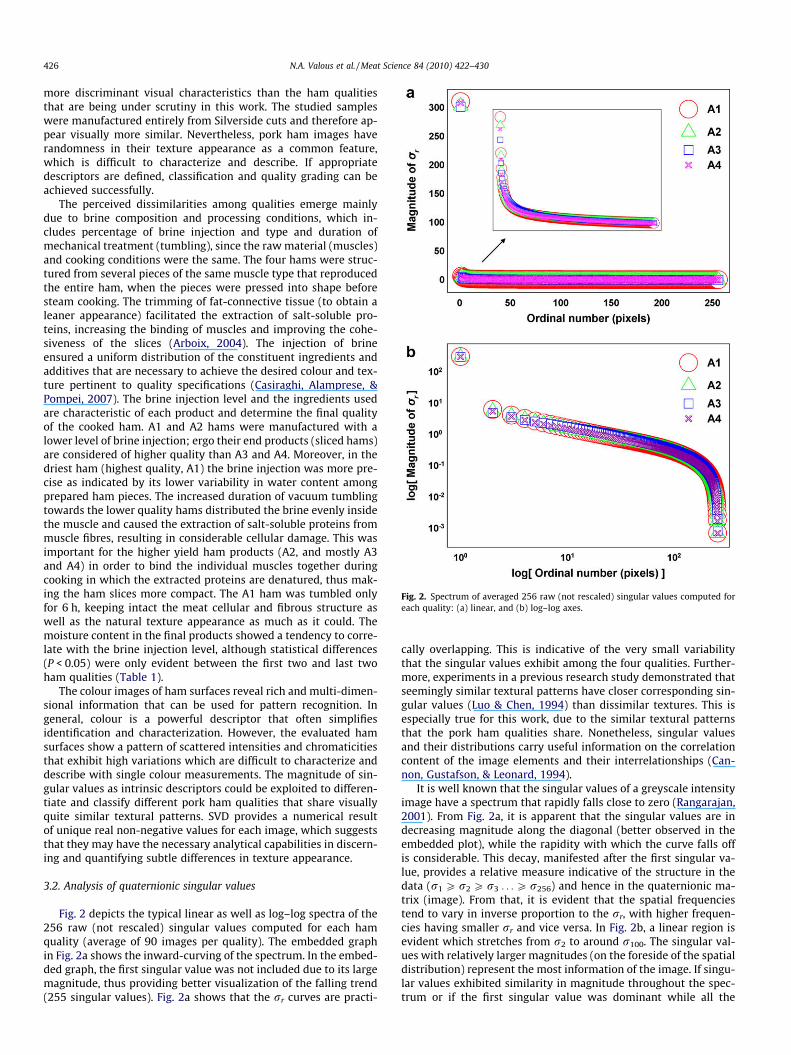
Fig. 2. Spectrum of averaged 256 raw (not rescaled) singular values computed foreach quality: (a) linear, and (b) log–log axes.
426 N.A. Valous et al. / Meat Science 84 (2010) 422–430
more discriminant visual characteristics than the ham qualitiesthat are being under scrutiny in this work. The studied sampleswere manufactured entirely from Silverside cuts and therefore ap-pear visually more similar. Nevertheless, pork ham images haverandomness in their texture appearance as a common feature,which is difficult to characterize and describe. If appropriatedescriptors are defined, classification and quality grading can beachieved successfully.
The perceived dissimilarities among qualities emerge mainlydue to brine composition and processing conditions, which in-cludes percentage of brine injection and type and duration ofmechanical treatment (tumbling), since the raw material (muscles)and cooking conditions were the same. The four hams were struc-tured from several pieces of the same muscle type that reproducedthe entire ham, when the pieces were pressed into shape beforesteam cooking. The trimming of fat-connective tissue (to obtain aleaner appearance) facilitated the extraction of salt-soluble pro-teins, increasing the binding of muscles and improving the cohe-siveness of the slices (Arboix, 2004). The injection of brineensured a uniform distribution of the constituent ingredients andadditives that are necessary to achieve the desired colour and tex-ture pertinent to quality specifications (Casiraghi, Alamprese, &Pompei, 2007). The brine injection level and the ingredients usedare characteristic of each product and determine the final qualityof the cooked ham. A1 and A2 hams were manufactured with alower level of brine injection; ergo their end products (sliced hams)are considered of higher quality than A3 and A4. Moreover, in thedriest ham (highest quality, A1) the brine injection was more pre-cise as indicated by its lower variability in water content amongprepared ham pieces. The increased duration of vacuum tumblingtowards the lower quality hams distributed the brine evenly insidethe muscle and caused the extraction of salt-soluble proteins frommuscle fibres, resulting in considerable cellular damage. This wasimportant for the higher yield ham products (A2, and mostly A3and A4) in order to bind the individual muscles together duringcooking in which the extracted proteins are denatured, thus mak-ing the ham slices more compact. The A1 ham was tumbled onlyfor 6 h, keeping intact the meat cellular and fibrous structure aswell as the natural texture appearance as much as it could. Themoisture content in the final products showed a tendency to corre-late with the brine injection level, although statistical differences(P < 0.05) were only evident between the first two and last twoham qualities (Table 1).
The colour images of ham surfaces reveal rich and multi-dimen-sional information that can be used for pattern recognition. Ingeneral, colour is a powerful descriptor that often simplifiesidentification and characterization. However, the evaluated hamsurfaces show a pattern of scattered intensities and chromaticitiesthat exhibit high variations which are difficult to characterize anddescribe with single colour measurements. The magnitude of sin-gular values as intrinsic descriptors could be exploited to differen-tiate and classify different pork ham qualities that share visuallyquite similar textural patterns. SVD provides a numerical resultof unique real non-negative values for each image, which suggeststhat they may have the necessary analytical capabilities in discern-ing and quantifying subtle differences in texture appearance.
3.2. Analysis of quaternionic singular values
Fig. 2 depicts the typical linear as well as log–log spectra of the256 raw (not rescaled) singular values computed for each hamquality (average of 90 images per quality). The embedded graphin Fig. 2a shows the inward-curving of the spectrum. In the embed-ded graph, the first singular value was not included due to its largemagnitude, thus providing better visualization of the falling trend(255 singular values). Fig. 2a shows that the rr curves are practi-
cally overlapping. This is indicative of the very small variabilitythat the singular values exhibit among the four qualities. Further-more, experiments in a previous research study demonstrated thatseemingly similar textural patterns have closer corresponding sin-gular values (Luo & Chen, 1994) than dissimilar textures. This isespecially true for this work, due to the similar textural patternsthat the pork ham qualities share. Nonetheless, singular valuesand their distributions carry useful information on the correlationcontent of the image elements and their interrelationships (Can-non, Gustafson, & Leonard, 1994).
It is well known that the singular values of a greyscale intensityimage have a spectrum that rapidly falls close to zero (Rangarajan,2001). From Fig. 2a, it is apparent that the singular values are indecreasing magnitude along the diagonal (better observed in theembedded plot), while the rapidity with which the curve falls offis considerable. This decay, manifested after the first singular va-lue, provides a relative measure indicative of the structure in thedata (r1 P r2 P r3 . . . P r256) and hence in the quaternionic ma-trix (image). From that, it is evident that the spatial frequenciestend to vary in inverse proportion to the rr, with higher frequen-cies having smaller rr and vice versa. In Fig. 2b, a linear region isevident which stretches from r2 to around r100. The singular val-ues with relatively larger magnitudes (on the foreside of the spatialdistribution) represent the most information of the image. If singu-lar values exhibited similarity in magnitude throughout the spec-trum or if the first singular value was dominant while all the
N.A. Valous et al. / Meat Science 84 (2010) 422–430 427
others were almost zero, the significance of the decompositionwould be lower, since the images would have been isotropic andsmoother with no textural variations (Mees, Rapp, & Jennings,1987). The magnitude of the first singular value is significantly lar-ger compared to subsequent values, i.e., r1 varied among qualitiesfrom 301.6 to 310.2, while the magnitude of r2 varied from 4.9 to6.3, and r3 from 3.6 to 4.2. The r1 roughly corresponds to an aver-age representation of the image and thus is closely related to thespectral features, while all the other singular values provide de-tailed information about the spatial content of the image which re-lates to the textural features. More specifically, singular values oflarger magnitude encapsulate most of the colour and texturalinformation (Ramakrishnan & Selvan, 2006). In this sense, theinformation carried by singular values is explicit with the biggerones having larger information capacity, whereas the rest justbring about smaller variation terms. This deduction is importantalso for the ensuing classification, since the identification of suit-able metrics has a performance effect on image recognition. Thefour features (F1, F2, F5 and F7) that were selected to train the neu-ral network were among the largest singular values. These singularvalues, which are a latent data structure representation (in seman-tic terms) of the original ham image, were masked by noisierdimensions, but were revealed by the quaternionic SVD. Thereforethese latent features carry important structural and colour fre-quencies (Li & Park, 2007). The remaining two features (F89 andF252) have magnitudes significantly smaller in comparison, andmay appear insignificant or the result of a noisy perturbation ofthe reduced-rank matrix (Konstantinides & Yao, 1988). Theseremaining features correspond to the non-deterministic intrinsiccomponents of the image carrying a much smaller informationload (Todoriki, Nagayoshi, & Suzuki, 2005). Nevertheless, they ap-pear important as stable, uncorrelated, and discriminating featurespertinent to the recognition of the ham images.
An additional observation is that the singular value matrix isfull rank, meaning that there is no rr equal to zero, even whenthe noisy dimensions have small values which occurs in most prac-tical situations (Le Bihan & Sangwine, 2003). The fact that the im-age is full rank signifies that the energy of ham images, describedas having random textural content, spreads over nearly all singularvalues or at least over those selected that can successfully recog-nize the different qualities. In general, since the pork ham imageand its quaternionic SVD have a unique corresponding relation-ship, the extracted singular values can be regarded as robust fea-tures of these images, as they are measures of their energy. Inthis way, singular values provide the energy information of the im-age as well as the knowledge of how the energy is distributed. Aprevious study (Hong, 1991) demonstrated the robustness of theSVD feature vectors regarding the invariance in algebraic and geo-metric transforms such as orthogonal transforms, rotation, transla-tion and mirror transforms. These properties are very useful fordescribing and recognizing images. According to the theoreticalbackground in image recognition, singular values extracted fromimages have very good stability and are more or less not invariantto systemic distortions (scaling, lightness variations, etc.) but pro-portionally sensitive to them (Pan, Zhang, Zhou, Cheng, & Zhang,2003).
3.3. Supervised pattern recognition
Due to the lack of a concrete rule for choosing the optimumnumber of neurons for the hidden layer, preliminary trial and errortests were carried out to determine the number of hidden neuronsin order to build the neural classifier. In general, the more neuronsthe hidden layer contains the more flexible it becomes, increasingthe classification accuracy for the training data but decreasing theaccuracy for the test set (Bishop, 1995). More specifically, after a
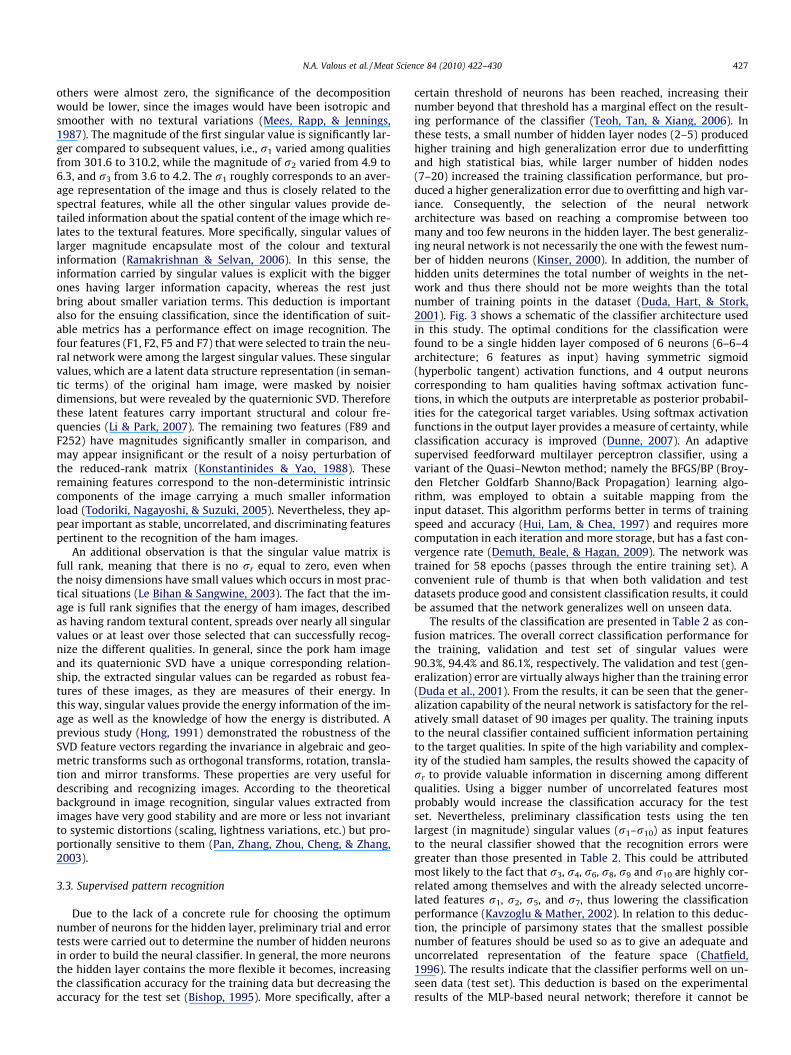
certain threshold of neurons has been reached, increasing theirnumber beyond that threshold has a marginal effect on the result-ing performance of the classifier (Teoh, Tan, & Xiang, 2006). Inthese tests, a small number of hidden layer nodes (2–5) producedhigher training and high generalization error due to underfittingand high statistical bias, while larger number of hidden nodes(7–20) increased the training classification performance, but pro-duced a higher generalization error due to overfitting and high var-iance. Consequently, the selection of the neural networkarchitecture was based on reaching a compromise between toomany and too few neurons in the hidden layer. The best generaliz-ing neural network is not necessarily the one with the fewest num-ber of hidden neurons (Kinser, 2000). In addition, the number ofhidden units determines the total number of weights in the net-work and thus there should not be more weights than the totalnumber of training points in the dataset (Duda, Hart, & Stork,2001). Fig. 3 shows a schematic of the classifier architecture usedin this study. The optimal conditions for the classification werefound to be a single hidden layer composed of 6 neurons (6–6–4architecture; 6 features as input) having symmetric sigmoid(hyperbolic tangent) activation functions, and 4 output neuronscorresponding to ham qualities having softmax activation func-tions, in which the outputs are interpretable as posterior probabil-ities for the categorical target variables. Using softmax activationfunctions in the output layer provides a measure of certainty, whileclassification accuracy is improved (Dunne, 2007). An adaptivesupervised feedforward multilayer perceptron classifier, using avariant of the Quasi–Newton method; namely the BFGS/BP (Broy-den Fletcher Goldfarb Shanno/Back Propagation) learning algo-rithm, was employed to obtain a suitable mapping from theinput dataset. This algorithm performs better in terms of trainingspeed and accuracy (Hui, Lam, & Chea, 1997) and requires morecomputation in each iteration and more storage, but has a fast con-vergence rate (Demuth, Beale, & Hagan, 2009). The network wastrained for 58 epochs (passes through the entire training set). Aconvenient rule of thumb is that when both validation and testdatasets produce good and consistent classification results, it couldbe assumed that the network generalizes well on unseen data.
The results of the classification are presented in Table 2 as con-fusion matrices. The overall correct classification performance forthe training, validation and test set of singular values were90.3%, 94.4% and 86.1%, respectively. The validation and test (gen-eralization) error are virtually always higher than the training error(Duda et al., 2001). From the results, it can be seen that the gener-alization capability of the neural network is satisfactory for the rel-atively small dataset of 90 images per quality. The training inputsto the neural classifier contained sufficient information pertainingto the target qualities. In spite of the high variability and complex-ity of the studied ham samples, the results showed the capacity ofrr to provide valuable information in discerning among differentqualities. Using a bigger number of uncorrelated features mostprobably would increase the classification accuracy for the testset. Nevertheless, preliminary classification tests using the tenlargest (in magnitude) singular values (r1–r10) as input featuresto the neural classifier showed that the recognition errors weregreater than those presented in Table 2. This could be attributedmost likely to the fact that r3, r4, r6, r8, r9 and r10 are highly cor-related among themselves and with the already selected uncorre-lated features r1, r2, r5, and r7, thus lowering the classificationperformance (Kavzoglu & Mather, 2002). In relation to this deduc-tion, the principle of parsimony states that the smallest possiblenumber of features should be used so as to give an adequate anduncorrelated representation of the feature space (Chatfield,1996). The results indicate that the classifier performs well on un-seen data (test set). This deduction is based on the experimentalresults of the MLP-based neural network; therefore it cannot be

Fig. 3. Schematic of the MLP neural network classifier architecture (6–6–4) used for pattern recognition (W are weights and b are biases).
Table 2Neural classifier output in the form of confusion matrices for the training, validationand test set of quaternionic singular values.
Training set
Predicted A1 A2 A3 A4
A1 50a 3 8 4 Overall classification performanceA2 1 50a 0 0A3 3 1 46 1A4 0 0 0 49a
Image set 54 54 54 54 90.3%
Validation setA1 17a 0 1 1 Overall classification performanceA2 0 18a 0 0A3 1 0 17a 1A4 0 0 0 16
Image set 18 18 18 18 94.4%
Test setA1 14 0 1 0 Overall classification performanceA2 0 16 0 0A3 4 2 15 1A4 0 0 2 17a
Image set 18 18 18 18 86.1%
a Denotes classification errors less than 610%.
428 N.A. Valous et al. / Meat Science 84 (2010) 422–430
generalized to other classification techniques. While Fig. 2illustrated that there are no clear differences in the spatial distribu-tion of rr among the four qualities, results demonstrated that theneural network classifier was capable of handling overlapping rr
distributions, using a small definitive set of features as descriptorsof discrimination for hams that share visually quite similar texturalpatterns. Neural networks are considered powerful classificationtools because of their non-linear properties and the fact that theymake no priori assumptions about the distribution of the data. Asa consequence, better results could be expected with neural net-works when no simple model exists to accurately describe theunderlying process that determines the data distribution (Subra-manian, Gat, Sheffield, Barhen, & Toomarian, 1997; Venugopal &Baets, 1994).
The analysis of confusion matrices for the test set yields inter-esting insights into the differences in texture appearance and theglobal properties of the neural classifier. Due to the fact that porkhams are coming from muscles that exhibit normal biological vari-ations and are subject to industrial processing/storage conditionsthat are not exactly replicated, it is unrealistic to expect 100% accu-rate classification at all times. Therefore, it will be necessary to seta cut-off for acceptance of a correctly classified ham slice. Morethan 80–85% consistent classification rate responding to new sam-ples can be such a threshold, given that a good artificial neural net-work model has accuracy of more than 80% (Hanif, Lan, Daud, &Ahmad, 2009; Ott, Araníbar, Singh, & Stockton, 2003). The ten-dency of the misclassification rate is to decrease towards the lowerquality ham, with the exception of an increase in A3. Results alsoshow that the A1 ham, in the test set, had the worse classification
performance (classification error; 22%) comparing with the error inthe other qualities (616%). This erroneous assignment to a classmembership (A3) other than the correct one could be probablyattributed to the lack of a sufficiently diverse training set of singu-lar values for this ham quality. Another interesting deduction isthat the driest samples (A1) were more difficult to classify. Evenwhen the generalization for this quality was weak (less than80%), there is still a significant dependency between rr and neuralnetwork output due to the results in the training and validationset. A3 apparently shared some of the underlying visual texturecharacteristics of the A1 quality and the reduced generalizationperformance of the classification, for this case, seems to suggestthe hypothesis that singular values preserve important topologicalproperties of the input images. On the other hand, the lowest qual-ity A4 ham produced singular values that had optimal discriminat-ing properties, with only one misclassified image. The A4 pork hamwas manufactured with the highest level of brine injection and anincreased duration of tumbling, which resulted in wetter surfaceappearance and an intermediate degree of visual roughness(Valous et al., 2009b). Regardless of this textural complexity, singu-lar values captured relevant information that provided a good levelof differentiation.
The overall satisfactory classification results derive as well bythe representation of the input data in the smaller dimension fea-ture space in a stepwise process. Correlated variables are trulyredundant in the sense that no additional information is gainedby adding them to the feature space (Guyon & Elisseeff, 2003). Inaddition, data rescaling has a positive effect in the classification,because it preserves all data relationships exactly, compressesthe normal range if any outliers exist, reduces the estimation errorsand the computation time needed in the training process (Sola &Sevilla, 1997). Classification errors could be reduced further if thenumber of images used for training was increased (Kavzoglu,2009). Nevertheless, given that the the problem is readily classifi-able, the amount of training samples used was enough in order toprovide acceptable performance levels at a reasonable computa-tional cost (Crowther & Cox, 2006).
Singular values, as algebraic features, have revealed a good dealof information about the different qualities of pork hams. The dif-ferences among ham qualities are encapsulated as spatial varia-tions in geometry and spectral characteristics that occur on asmaller scale. More specifically, these variations could be due tospatial dissimilarities in directional or spectral scattering charac-teristics and due to distributions of structures such as pores/de-fects and fat-connective tissue. The magnitude and spatiallocation of singular values are considered, since they play impor-tant roles in classifying image contents and conveying semanticmeanings. The accuracy of the classification is a good measurefor the reliability of the features. The results have demonstratedthat singular values extracted from quaternionic SVD bear the dis-tinction between different ham qualities and can be used as robust,reliable and stable features for classification and quality grading.The procedure seems that it is better suited in establishing a pat-tern of textural appearance heterogeneity from visually non-dis-criminating food colour images. The quaternionic singular values
N.A. Valous et al. / Meat Science 84 (2010) 422–430 429
capture important information regarding the appearance of hamimages and could be used in combination with other image fea-tures to improve the classification accuracy. Moreover, singularvalues could be used to provide in the context of classification, aquantitative measure of the level of brine injection and type andduration of mechanical treatment (tumbling) in pork hams, quiterobustly. For applications related to other foods, either fresh pro-duce or processed, the robustness of the quaternionic SVD tech-nique needs to be explored further.
4. Conclusions
Simple visual features such as colour and texture, as well asspatial features such as shape and distribution of structures (fat-connective tissue and pores/defects) contribute to the complexityof texture appearance. The quaternionic representation of hamimages, treating RGB colour components as a single unit insteadof as separate components, is very effective. The advantage of usingquaternion arithmetic is that colour images, which are perceptu-ally richer, can be represented and analyzed as a single entity,improving the accuracy of pattern recognition models. Algebraicfeatures represent intrinsic attributions of an image. The quatern-ionic SVD is an effective method of extracting algebraic featuresfrom ham images. Singular values describe completely and univo-cally the intrinsic information of a quaternionic matrix, ergo theycan be used as features for the classification of cooked pork hamslices. An adaptive MLP classifier was successfully employed forthe classification of four ham qualities with similar appearances,using a reduced feature space of singular values. The dimensional-ity reduction procedure excluded atypical features and discardedthe redundant information. The overall correct classification per-formance for the test set was 86.1%. The results confirm that theclassification performance was satisfactory. Considering the com-plexity of texture appearance, it is difficult to get perfect classifica-tion rates using neural networks based on certain selected features.Nonetheless, accurately extracting and selecting the most informa-tive features as inputs to the MLP classifier, led to the recognitionof a set of different but visually quite similar textural patternsbased on quaternionic singular values.
Acknowledgements
The authors gratefully acknowledge the Food Institutional Re-search Measure (FIRM) strategic research initiative, as adminis-tered by the Irish Department of Agriculture, Fisheries and Food,for the financial support.
References
Andrew, H. C., & Patterson, C. L. (1976). Singular value decompositions and digitalimage processing. IEEE Transactions on Acoustics, Speech and Signal Processing,24(1), 26–53.
AOAC (1998) (16th ed.). Official methods of analysis of AOAC international (Vol. 2).Gaithersburg, MD: Association of Official Analytical Chemists [39.1.02].
Arboix, A. A. (2004). Ham production: Cooked ham. In W. Jensen, C. Devine, & M.Dikeman (Eds.), Encyclopedia of meat sciences (pp. 562–567). Oxford: Elsevier.
Barcala, J. M., Fernández, J. L., Alberdi, J., Jiménez, J., Lázaro, J. C., Navarrete, J. J., et al.(2004). Identification of plastics using wavelets and quaternion numbers.Measurement Science and Technology, 15, 371–376.
Bishop, C. M. (1995). Neural networks for pattern recognition. Oxford: ClarendonPress [pp. 116–164].
Cai, C., & Mitra, S. K. (2000). A normalized color difference edge detector based onquaternion representation. In Proceedings of the IEEE international conference onimage processing (pp. 816–819), 10–13 September 2000, Vancouver, Canada.
Cannon, D. M., Gustafson, S. C., & Leonard, J. D. (1994). Natural scene featureextraction using singular value decomposition. In Proceedings of SPIE visualinformation processing III (Vol. 2239, pp. 80–91), 4–5 April 1994, Orlando, USA.
Casiraghi, E., Alamprese, C., & Pompei, C. (2007). Cooked ham classification on thebasis of brine injection level and pork breeding country. LWT – Food Science andTechnology, 40, 164–169.
Chatfield, C. (1996). Model uncertainty and forecast accuracy. Journal of Forecasting,15(7), 495–508.
Crowther, P. S., & Cox, R. J. (2006). Accuracy of neural network classifiers as aproperty of the size of the data set. In Proceedings of the tenth internationalconference on knowledge-based intelligent information and engineering systems(Part III, pp. 1143–1149), 9–11 October 2006, Bournemouth, UK.
Demuth, H., Beale, M., & Hagan, M. (2009). Neural network MATLAB toolbox 6: User’sguide. Natick: The Math Works Inc.
Denis, P., Carre, P., & Fernandez-Maloigne, C. (2007). Spatial and spectralquaternionic approaches for colour images. Computer Vision and ImageUnderstanding, 107, 74–87.
Duda, R. O., Hart, P. E., & Stork, D. G. (2001). Pattern classification (2nd ed.). NewYork: John Wiley and Sons [pp. 282–349].
Dunne, R. A. (2007). A statistical approach to neural networks for pattern recognition.New Jersey: John Wiley and Sons [pp. 35–51].
Ell, T. A., & Sangwine, S. J. (2007). Hypercomplex Fourier transforms of color images.IEEE Transactions on Image Processing, 16(1), 22–35.
Fathi, M., Mohebbi, M., & Razavi, S. M. A. (2009). Application of image analysis andartificial neural network to predict mass transfer kinetics and color changes ofosmotically dehydrated kiwifruit. Food and Bioprocess Technology. doi:10.1007/s11947-009-0222-y.
Fish, D. A., Grochmalicki, J., & Pike, E. R. (1996). Scanning singular-value-decomposition method for restoration of images with space-variant blur.Journal of the Optical Society of America A, 13(3), 464–469.
Fontenla-Romero, O., Guijarro-Berdiñas, B., Alonso-Betanzos, A., & Moret-Bonillo, V.(2005). A new method for sleep apnea classification using wavelets and feedforward neural networks. Artificial Intelligence in Medicine, 34(1), 65–76.
Foody, G. M. (2004). Supervised image classification by MLP and RBF neuralnetworks with and without an exhaustively defined set of classes. InternationalJournal of Remote Sensing, 25(15), 3091–3104.
Gentle, J. E. (2007). Matrix algebra: Theory, computations, and applications in statistics.New York: Springer [pp. 41–144].
Gürlebeck, K., & Sprößig, W. (1997). Quaternionic and Clifford calculus for physicistsand engineers. Chichester: John Wiley and Sons [pp. 1–371].
Guyon, I., & Elisseeff, A. (2003). An introduction to variable and feature selection.Journal of Machine Learning Research, 3, 1157–1182.
Hanif, N. H. H. M., Lan, W. H., Daud, H. B., & Ahmad, J. (2009). Classification ofcontrol measures for asthma using artificial neural networks. In Proceedings ofthe ninth IASTED international conference on artificial intelligence and applications(pp. 639–069), 17–18 February, Innsbruck, Austria.
Hong, Z.-Q. (1991). Algebraic features extraction of image for recognition. PatternRecognition, 24(3), 211–219.
Hui, L. C. K., Lam, K.-Y., & Chea, C. W. (1997). Global optimisation in neural networktraining. Neural Computing and Applications, 5, 58–64.
IEC, (1999). In IEC 61966-2-1: Multimedia systems and equipment – Colourmeasurements and management – Part 2-1: Colour management – Default RGBcolor space – sRGB. International Electrotechnical Commission (IEC), Geneva,Switzerland.
Kantor, I. L., & Solodovnikov, A. S. (1989). Hypercomplex numbers: An elementaryintroduction to algebras. New York: Springer-Verlag [pp. 15–24].
Kavzoglu, T. (2009). Increasing the accuracy of neural network classification usingrefined training data. Environmental Modelling and Software, 24(7), 850–858.
Kavzoglu, T., & Mather, P. M. (2002). The role of feature selection in artificial neuralnetwork applications. International Journal of Remote Sensing, 23(15),2919–2937.
Kaya, A., Ko, S., & Gunasekaran, S. (2008). Viscosity and color change during in situsolidification of grape pekmez. Food and Bioprocess Technology. doi:10.1007/s11947-008-0169-4.
Kinser, J. M. (2000). The minimum number of hidden neurons does not necessarilyprovide the best generalization. In Proceedings of SPIE applications and science ofcomputational intelligence III (Vol. 4055, pp. 11–17), 24–27 April 2000, Orlando,USA.
Konstantinides, K., & Yao, K. (1988). Statistical analysis of effective singular valuesin matrix rank determination. IEEE Transactions on Acoustics, Speech and SignalProcessing, 36(5), 757–763.
Kulkarni, A. D. (2001). Computer vision and fuzzy-neural systems. New Jersey:Prentice-Hall PTR [pp. 227–280].
Kumar, S., & Mittal, G. S. (2009). Rapid detection of microorganisms using imageprocessing parameters and neural network. Food and Bioprocess Technology.doi:10.1007/s11947-008-0122-6.
Le Bihan, N., & Sangwine, S. J. (2003). Color image decomposition using quaternionsingular value decomposition. In Proceedings of the international conference onvisual information engineering (pp. 113–116), 7–9 July 2003, Saint Martind’Heres, France.
Le Bihan, N., & Mars, J. (2004). Singular value decomposition of quaternion matrices:A new tool for vector-sensor signal processing. Signal Processing, 84, 1177–1199.
Le Bihan, N., & Sangwine, S. J. (2007). Jacobi method for quaternion matrix singularvalue decomposition. Applied Mathematics and Computation, 187, 1265–1271.
Lerouge, E., & Van Huffel, S. (1999). Generalization capacity of neural networks forthe classification of ovarium tumours. In Proceedings of the twentieth symposiumon information theory in the Benelux (pp. 149–156), 27–28 May 1999, Haasrode,Belgium.
Li, C. H., & Park, S. C. (2007). Neural network for text classification based on singularvalue decomposition. In Proceedings of the seventh international conference oncomputer and information technology (pp. 47–52), 16–19 October 2007,Fukushima, Japan.
430 N.A. Valous et al. / Meat Science 84 (2010) 422–430
Li, Y., Rad, A. B., & Peng, W. (1999). An enhanced training algorithm for multilayerneural networks based on reference output of hidden layer. Neural Computingand Applications, 8, 218–225.
Luo, J. -H., & Chen, C. -C. (1994). Singular value decomposition for texture analysis.In Proceedings of SPIE applications of digital image processing XVII (Vol. 2298, pp.407–418), 26–29 July 1994, San Diego, USA.
Mees, A. I., Rapp, P. E., & Jennings, L. S. (1987). Singular value decomposition andembedding dimension. Physical Review A, 36(1), 340–346.
Mendoza, F., Valous, N. A., Allen, P., Kenny, T. A., Ward, P., & Sun, D.-W. (2009).Analysis and classification of commercial ham slice images using directionalfractal dimension features. Meat Science, 81(2), 313–320.
Moxey, C. E., Sangwine, S. J., & Ell, T. A. (2003). Hypercomplex correlation techniquesfor vector images. IEEE Transactions on Signal Processing, 51(7), 1941–1953.
Ott, K.-H., Araníbar, N., Singh, B., & Stockton, G. W. (2003). Metabonomics classifiespathways affected by bioactive compounds: Artificial neural networkclassification of NMR spectra of plant extracts. Phytochemistry, 62(6), 971–985.
Pan, Q., Zhang, M.-G., Zhou, D.-L., Cheng, Y.-M., & Zhang, H.-C. (2003). Facerecognition based on singular-value feature vectors. Optical Engineering, 42(8),2368–2374.
Pei, S.-C., & Cheng, C.-M. (1997). A novel block truncation coding of color imagesusing a quaternion-moment-preserving principle. IEEE Transactions onCommunications, 45(5), 583–595.
Philips, R. D., Watson, L. T., Wynne, R. H., & Blinn, C. E. (2009). Feature reductionusing a singular value decomposition for the iterative guided spectral classrejection hybrid classifier. ISPRS Journal of Photogrammetry and Remote Sensing,64, 107–116.
Quevedo, R. A., & Aguilera, J. M. (2009). Computer vision and stereoscopy forestimating firmness in the salmon (Salmon salar) fillets. Food and BioprocessTechnology. doi:10.1007/s11947-008-0097-3.
Quevedo, R. A., Aguilera, J. M., & Pedreschi, F. (2009). Color of salmon fillets bycomputer vision and sensory panel. Food and Bioprocess Technology.doi:10.1007/s11947-008-0106-6.
Ramakrishnan, S., & Selvan, S. (2006). Image texture classification using exponentialcurve fitting of wavelet domain singular values. In Proceedings of the IETinternational conference on visual information engineering (pp. 505–510), 26–28September 2006, Bangalore, India.
Rangarajan, A. (2001). Learning matrix space image representations. In Proceedingsof the third international workshop on energy minimization methods in computervision and pattern recognition (pp. 153–168), 3–5 September 2001, SophiaAntipolis, France.
Rohwer, R., Wynne-Jones, M., & Wysotzki, F. (1994). Neural networks. In D. Michie,D. J. Spiegelhalter, & C. Taylor (Eds.), Machine learning, neural and statisticalclassification (pp. 84–106). Hertfordshire: Ellis Horwood.
Sangwine, S. J. (1996). Fourier transforms of colour images using quaternion orhypercomplex, numbers. Electronic Letters, 32(21), 1979–1980.
Sangwine, S. J., & Ell, T. A. (1999). Hypercomplex auto- and cross-correlation of colorimages. In Proceedings of the IEEE international conference on image processing(pp. 319–322), 24–28 October 1999, Kobe, Japan.
Sangwine, S. J., & Le Bihan, N. (2005). Quaternion toolbox for MATLAB. Softwarelibrary, licensed under the GNU General Public License. <http://qtfm.sourceforge.net/>. Accessed 13.02.09.
Sangwine, S. J., & Horne, R. E. N. (1998). The present state and the future of colourimage processing. In S. J. Sangwine & R. E. N. Horne (Eds.), The colour imageprocessing handbook (pp. 1–3). London: Chapman and Hall.
Sangwine, S. J., & Le Bihan, N. (2006). Quaternion singular value decompositionbased on bidiagonalization to a real or complex matrix using quaternionHouseholder transformations. Applied Mathematics and Computation, 182,727–738.
Shnayderman, A., Gusev, A., & Eskicioglu, A. M. (2006). An SVD-based greyscaleimage quality measure for local and global assessment. IEEE transactions onImage Processing, 15(2), 422–429.
Smolka, B., & Venetsanopoulos, A. N. (2006). Noise reduction and edge detection incolor images. In R. Lukac & K. N. Plataniotis (Eds.), Color image processing:Methods and applications (pp. 75–102). Boca Raton, FL: CRC Press/Taylor andFrancis.
Sola, J., & Sevilla, J. (1997). Importance of input data normalization for theapplication of neural networks to complex industrial problems. IEEETransactions on Nuclear Science, 44(3), 1464–1468.
Subramanian, S., Gat, N., Sheffield, S., Barhen, J., & Toomarian, N. (1997).Methodology for hyperspectral image classification using novel neuralnetwork. In Proceedings of SPIE Algorithms for multispectral and hyperspectralimagery III (Vol. 3071, pp. 128–137), 22–23 April 1997, Orlando, USA.
Tay, A. L. P., Zurada, J. M., Wong, L.-P., & Xu, J. (2007). The hierarchical fast learningartificial neural network (HieFLANN) – An autonomous platform forhierarchical neural network construction. IEEE Transactions on NeuralNetworks, 18(6), 1645–1657.
Teoh, E. J., Tan, K. C., & Xiang, C. (2006). Estimating the number of hidden neurons ina feed forward network using the singular value decomposition. IEEETransactions on Neural Networks, 17(6), 1623–1629.
Todoriki, M., Nagayoshi, H., & Suzuki, A. (2005). Temporal fluctuation of singularvalues caused by dynamical noise in chaos. Physical Review E, 72, 036207.
Trémeau, A., Tominaga, S., & Plataniotis, K. N. (2008). Color in image and videoprocessing: Most recent trends and future research directions. EURASIP Journalon Image and Video Processing, 581371. doi:10.1155/2008/581371.
Valous, N. A., Mendoza, F., Sun, D.-W., & Allen, P. (2009a). Colour calibration of alaboratory computer vision system for quality evaluation of pre-sliced hams.Meat Science, 81(1), 132–141.
Valous, N. A., Mendoza, F., Sun, D.-W., & Allen, P. (2009b). Texture appearancecharacterization of pre-sliced pork ham images using fractal metrics: Fourieranalysis dimension and lacunarity. Food Research International, 42(3),353–362.
Venugopal, V., & Baets, W. (1994). Neural networks and statistical techniques inmarketing research: A conceptual comparison. Marketing Intelligence &Planning, 12(7), 30–38.
Villegas, M., & Paredes, R. (2007). Face recognition in color using complex andhypercomplex representations. In Proceedings of the third iberian conference onpattern recognition and image analysis, part I (pp. 217–224), 6–8 June 2007,Girona, Spain.
Ward, J. P. (1997). Quaternions and cayley numbers: Algebra and applications.Dordrecht: Kluwer Academic [pp. 1–163].
Zhang, F. (1997). Quaternions and matrices of quaternions. Linear Algebra and ItsApplications, 251, 21–57.
Related Documents