C. R. Biologies 332 (2009) 832–847 Evolution / Évolution SuperTRI: A new approach based on branch support analyses of multiple independent data sets for assessing reliability of phylogenetic inferences Anne Ropiquet a,b , Blaise Li c , Alexandre Hassanin a,∗ a UMR 7205 - Origine, structure et évolution de la biodiversité, Muséum national d’histoire naturelle, case postale 51, 55, rue Buffon, 75005 Paris, France b Evolutionary Genomics Group, Department of Botany and Zoology, University of Stellenbosch, Private Bag X1, Matieland, 7602 South Africa c UMR 7138 CNRS, Muséum national d’histoire naturelle, 43, rue Cuvier, 75005 Paris, France Received 13 October 2008; accepted after revision 8 May 2009 Available online 18 June 2009 Presented by Pierre Buser Abstract Supermatrix and supertree are two methods for constructing a phylogenetic tree by using multiple data sets. However, these methods are not a panacea, as conflicting signals between data sets can lead to misinterpret the evolutionary history of taxa. In particular, the supermatrix approach is expected to be misleading if the species-tree signal is not dominant after the combination of the data sets. Moreover, most current supertree methods suffer from two limitations: (i) they ignore or misinterpret secondary (non-dominant) phylogenetic signals of the different data sets; and (ii) the logical basis of node robustness measures is unclear. To overcome these limitations, we propose a new approach, called SuperTRI, which is based on the branch support analyses of the independent data sets, and where the reliability of the nodes is assessed using three measures: the supertree Bootstrap percentage and two other values calculated from the separate analyses: the mean branch support (mean Bootstrap percentage or mean posterior probability) and the reproducibility index. The SuperTRI approach is tested on a data matrix including seven genes for 82 taxa of the family Bovidae (Mammalia, Rumi- nantia), and the results are compared to those found with the supermatrix approach. The phylogenetic analyses of the supermatrix and independent data sets were done using four methods of tree reconstruction: Bayesian inference, maximum likelihood, and un- weighted and weighted maximum parsimony. The results indicate, firstly, that the SuperTRI approach shows less sensitivity to the four phylogenetic methods, secondly, that it is more accurate to interpret the relationships among taxa, and thirdly, that interesting conclusions on introgression and radiation can be drawn from the comparisons between SuperTRI and supermatrix analyses. To cite this article: A. Ropiquet et al., C. R. Biologies 332 (2009). © 2009 Published by Elsevier Masson SAS on behalf of Académie des sciences. Résumé SuperTRI : une nouvelle approche reposant sur l’analyse de plusieurs jeux de données indépendants pour évaluer la fiabilité des inférences phylogénétiques. Deux méthodes sont couramment utilisées pour construire un arbre phylogénétique à partir de plusieurs jeux de données : l’analyse combinée (ou supermatrice) et l’approche des superabres. Dans les cas où les * Corresponding author. E-mail addresses: [email protected] (A. Ropiquet), [email protected] (A. Hassanin). 1631-0691/$ – see front matter © 2009 Published by Elsevier Masson SAS on behalf of Académie des sciences. doi:10.1016/j.crvi.2009.05.001

Welcome message from author
This document is posted to help you gain knowledge. Please leave a comment to let me know what you think about it! Share it to your friends and learn new things together.
Transcript

C. R. Biologies 332 (2009) 832–847
Evolution / Évolution
SuperTRI: A new approach based on branch support analysesof multiple independent data sets for assessing reliability
of phylogenetic inferences
Anne Ropiquet a,b, Blaise Li c, Alexandre Hassanin a,∗
a UMR 7205 - Origine, structure et évolution de la biodiversité, Muséum national d’histoire naturelle, case postale 51, 55, rue Buffon,75005 Paris, France
b Evolutionary Genomics Group, Department of Botany and Zoology, University of Stellenbosch, Private Bag X1, Matieland, 7602 South Africac UMR 7138 CNRS, Muséum national d’histoire naturelle, 43, rue Cuvier, 75005 Paris, France
Received 13 October 2008; accepted after revision 8 May 2009
Available online 18 June 2009
Presented by Pierre Buser
Abstract
Supermatrix and supertree are two methods for constructing a phylogenetic tree by using multiple data sets. However, thesemethods are not a panacea, as conflicting signals between data sets can lead to misinterpret the evolutionary history of taxa. Inparticular, the supermatrix approach is expected to be misleading if the species-tree signal is not dominant after the combinationof the data sets. Moreover, most current supertree methods suffer from two limitations: (i) they ignore or misinterpret secondary(non-dominant) phylogenetic signals of the different data sets; and (ii) the logical basis of node robustness measures is unclear.
To overcome these limitations, we propose a new approach, called SuperTRI, which is based on the branch support analyses ofthe independent data sets, and where the reliability of the nodes is assessed using three measures: the supertree Bootstrap percentageand two other values calculated from the separate analyses: the mean branch support (mean Bootstrap percentage or mean posteriorprobability) and the reproducibility index.
The SuperTRI approach is tested on a data matrix including seven genes for 82 taxa of the family Bovidae (Mammalia, Rumi-nantia), and the results are compared to those found with the supermatrix approach. The phylogenetic analyses of the supermatrixand independent data sets were done using four methods of tree reconstruction: Bayesian inference, maximum likelihood, and un-weighted and weighted maximum parsimony. The results indicate, firstly, that the SuperTRI approach shows less sensitivity to thefour phylogenetic methods, secondly, that it is more accurate to interpret the relationships among taxa, and thirdly, that interestingconclusions on introgression and radiation can be drawn from the comparisons between SuperTRI and supermatrix analyses. Tocite this article: A. Ropiquet et al., C. R. Biologies 332 (2009).© 2009 Published by Elsevier Masson SAS on behalf of Académie des sciences.
Résumé
SuperTRI : une nouvelle approche reposant sur l’analyse de plusieurs jeux de données indépendants pour évaluer lafiabilité des inférences phylogénétiques. Deux méthodes sont couramment utilisées pour construire un arbre phylogénétiqueà partir de plusieurs jeux de données : l’analyse combinée (ou supermatrice) et l’approche des superabres. Dans les cas où les
* Corresponding author.E-mail addresses: [email protected] (A. Ropiquet), [email protected] (A. Hassanin).
1631-0691/$ – see front matter © 2009 Published by Elsevier Masson SAS on behalf of Académie des sciences.doi:10.1016/j.crvi.2009.05.001

A. Ropiquet et al. / C. R. Biologies 332 (2009) 832–847 833
différents jeux de données portent des messages conflictuels, ces deux méthodes peuvent conduire à une mauvaise interprétationde l’histoire évolutive des taxons. En particulier, l’approche supermatrice peut entraîner des erreurs systématiques lorsque le signalphylogénétique de l’arbre des espèces n’est pas dominant après concaténation des données. Par ailleurs, la plupart des méthodes desuperarbres souffrent de deux types de limitations : (i) elles ignorent ou interprètent de façon erronée les signaux phylogénétiquessecondaires (non dominants) contenus dans les différents jeux de données ; et (ii) la logique des indices de robustesse des nœudsn’est pas claire.
Afin de pallier à ces problèmes, nous proposons ici une nouvelle approche, appelée « SuperTRI », reposant sur une analyse dela robustesse des hypothèses phylogénétiques reconstruites à partir de plusieurs jeux de données indépendants, et pour laquellela fiabilité des nœuds est estimée à l’aide de trois mesures : le pourcentage de Bootstrap du superarbre, ainsi que deux valeurscalculées à partir des analyses séparées : le soutien moyen des nœuds (moyenne des valeurs de Bootstrap ou des probabilitéspostérieures) et l’indice de reproductibilité.
L’approche SuperTRI a été appliquée à l’étude de la famille des Bovidae (Mammalia, Ruminantia) en analysant une matricecontenant sept gènes et 82 taxons. Les résultats ont été comparés à ceux de l’approche supermatrice. Les analyses phylogénétiquesde la supermatrice et des jeux de données indépendants ont été réalisées avec quatre méthodes de reconstruction d’arbres : l’in-férence Bayésienne, le maximum de vraisemblance, et deux approches de parcimonie (pondérée et non pondérée). Les résultatsindiquent que l’approche SuperTRI est moins sensible aux quatre méthodes phylogénétiques. Par ailleurs, elle se révèle plus fiablepour interpréter les relations de parenté. Enfin, il apparaît que la comparaison des analyses SuperTRI et supermatrice permet detirer des conclusions intéressantes sur les phénomènes d’introgression et de radiation. Pour citer cet article : A. Ropiquet et al.,C. R. Biologies 332 (2009).© 2009 Published by Elsevier Masson SAS on behalf of Académie des sciences.
Keywords: Phylogeny; Supertree; Supermatrix; Reliability; Branch support; Reproducibility; Topological conflicts
Mots-clés : Phylogénie ; Superarbre ; Supermatrice ; Fiabilité ; Soutien des branches ; Reproductibilité ; Conflits topologiques
1. Introduction
Since a few years, most molecular phylogenetic stud-ies routinely make use of multiple DNA markers on alarge number of species [1–3]. This trend was drivenby the development of more efficient experimental tech-niques in molecular biology (DNA extraction, PCR am-plification and sequencing), and by the resulting expo-nential growth of DNA sequences in databases, suchas GenBank/EMBL/DDBJ. This approach has great ad-vantages, as more complete gene and taxon samplingsoften increase the accuracy in the estimated phylogeny[4,5].
There are two main methods for constructing a phy-logenetic tree by using multiple data sets: (1) in thesupermatrix approach, all characters of the diverse datasets are combined into a single matrix, and then an-alyzed simultaneously; this method is also known as“simultaneous”, “combined” or “total evidence” anal-yses [6]; (2) in the supertree approach, the different datasets are analyzed separately, and then the topologies de-rived from these analyses are used as “source trees” toconstruct a “supertree” summarizing the phylogeneticinformation [7]. A potential effect of these approachesis that hidden phylogenetic signals can be revealed. Inother words, novel clades that are not found by separateanalyses of the data sets can emerge from the super-matrix and supertree analyses. In addition, clades that
are weakly supported by separate analyses can be foundwith a strong support in the supermatrix analyses, be-cause common phylogenetic signals from different datasets can be added and therefore enhanced. Another po-tential advantage of both supermatrix and supertree ap-proaches is that other types of characters, such as thoseof morphology, physiology or behaviour, can be easilyincorporated in the analyses [7].
Both supermatrix and supertree methods implicitlyassume that all characters have experienced the samebranching history. However, this assumption is not al-ways valid, and conflicting phylogenetic signals be-tween data sets may result in robust topological in-congruence that can be misleading for understandingthe real evolutionary history of taxa. In molecular phy-logeny, there are eight main sources of incongruencebetween DNA markers: (i) errors in phylogenetic re-construction caused by the use of inappropriate meth-ods or models; (ii) sequencing and alignment errors;(iii) taxonomic misidentification; (iv) DNA contamina-tion by other organisms; (v) endogenous contamina-tion, i.e. paralogous sequences, including pseudogenes;(vi) strong selection pressure, (vii) horizontal trans-fer events, including introgression; and (viii) incom-plete lineage sorting. The two last sources of incongru-ence can result in real conflicts between gene trees andspecies trees, whereas all others sources produce appar-ent conflicts, which are due to errors during the data pro-

834 A. Ropiquet et al. / C. R. Biologies 332 (2009) 832–847
duction process, or misassumptions in the phylogeneticanalyses. When the markers bring conflicting phyloge-netic signals, the supermatrix and supertree methodscan result in different interpretations of the evolutionaryhistory of taxa. The supermatrix approach is expectedto be misleading if the species-tree signal is not dom-inant after combination of the data sets. For instance,the analysis of data originating from a mitochondrial in-trogression can lead to erroneous phylogenetic conclu-sions, when the mitochondrial genes contain most of theinformation in the supermatrix. In such a case, the su-pertree approach could be more reliable than the super-matrix approach to uncover the true relationships amongspecies. However, its application suffers from two lim-itations: (1) most methods of supertree construction ig-nore or misinterpret hidden support in different datasets; and (2) the logical basis of phylogenetic robust-ness measures in supertree analysis is unclear [8–11].
The most commonly used supertree method, namedMatrix Representation with Parsimony (MRP) [12,13],is based on the combined analysis of a set of trees,where the different source trees are used to constructa binary matrix for parsimony analysis, each binarycharacter representing a node of a source tree. Baum[12] first proposed to weight the characters of the MRPmatrix using bootstrap percentages of the majority-rule consensus tree. Weighting individual binary char-acters in proportion to the support for the correspondinggroupings in the original analyses is a good way of im-proving the fit between the binary matrix and the orig-inal data [14]. In principle, bootstrap-weighted MRPshould arbitrate conflicts among the set of source treessuch that the supertree topology is resolved in favor ofthe most strongly supported source-tree nodes. How-ever, this approach does not allow nodal support in thesupertree to be evaluated [15]. More recently, Moore etal. [15] have proposed two additional approaches usingnonparametric bootstrapping, in which a set of sourcetrees is compiled by randomly and repeatedly drawing(with replacement) either from the original set of esti-mated source trees (source-tree bootstrapping) or fromtheir respective bootstrap profiles (hierarchical boot-strapping). Then, a MRP matrix is constructed from thisset of source trees, and finally used to estimate the su-pertree. The procedure is repeated an arbitrary numberof times to generate a bootstrap profile of supertrees,which is then summarized by majority-rule consensus.The limitation of these two methods is that only a ran-dom population of source trees is used for the analyses.
Here we propose and implement a new approach,named SuperTRI, in which the supertree is constructedby using the branch support values (Bootstrap percent-
ages or posterior probabilities) of all phylogenetic hy-potheses produced during the Bootstrap or Bayesiananalyses of the independent data sets. The reliabilityof the nodes is estimated by three different measures:the “Supertree Bootstrap Percentage” (SBP); the meanbranch support, which corresponds to the “Mean Pos-terior Probability” (MPP) for the Bayesian method, orto the “Mean Bootstrap Percentage” (MBP) for Maxi-mum Likelihood (ML) and Maximum Parsimony (MP)methods; and an index of reproducibility (Rep). Our su-pertree approach is tested by analyzing a data matrixincluding seven genes for 82 taxa of the family Bovidae(Mammalia, Ruminantia) and the results are comparedto those found with the supermatrix approach.
2. Material and methods
2.1. Sampled genes
Seven genes were analyzed for 82 taxa including79 species and representing all the 52 genera currentlyrecognized in the family Bovidae [16] (see online Ap-pendix 1). Three genes belong to the mitochondrialgenome: the complete cytochrome b gene (Cyb), thecomplete 12S rRNA gene (12S), and the subunit II ofthe cytochrome c oxydase gene (CO2). The four nu-clear markers are unlinked DNA fragments located ondifferent chromosomes in the genome of Bos taurus:the intron 1 of the protein kinase C iota gene (PRKCI)in the chromosome 1 (1q34-q36), the exon 4 of thekappa-casein gene (κCas) in the chromosome 6 (6q32),the intron 1 of the β-spectrin nonerythrocytic 1 gene(SPTBN1) in the chromosome 11, and intron and exonregions of the thyroglobulin gene (TG) in the chromo-some 14 (14q13).
2.2. DNA alignment
The nucleotide sequences were aligned manuallywith Sequence Alignment Editor Version 2.0 alpha11 [17]. The protein-coding genes (CO2, Cyb and κCas)were aligned using the amino-acid sequences. All re-gions with ambiguity for the position of the gaps in12S, PRKCI, SPTBN1 and TG genes were excludedfrom the analyses to avoid erroneous hypotheses ofprimary homology. The gap placement was consid-ered unambiguous when only one local sequence align-ment was possible due to the conservation of both gaplength and nucleotide motifs adjacent to the 5′ and3′ boundaries of the gap. Unambiguous indels (inser-tions/deletions) were coded as additional characters by
A. Ropiquet et al. / C. R. Biologies 332 (2009) 832–847 835
using 1 and 0 symbols for insertion and deletion, re-spectively [18].
The matrix of 82 taxa was composed of the follow-ing genes and characters: 12S: 860 nt and one indel;CO2: 582 nt; Cyb: 1140 nt; κCas: 487 nt and one in-del; PRKCI: 487 nt and four indels; SPTBN1: 575 ntand eight indels; and TG: 797 nt and seven indels. Thetotal matrix represents therefore 4949 characters (4928nucleotides and 21 indels). It is available upon requestto the authors.
2.3. Phylogenetic analyses
Four methods of tree reconstruction were used forphylogenetic analyses: Bayesian inference (BI), Maxi-mum Likelihood (ML), and Unweighted and WeightedMaximum Parsimony (UMP and WMP). The geneswere analyzed separately or in combination to benefitfrom the maximum number of molecular characters (su-permatrix approach).
Bayesian analyses were performed with Mr.Bayes3.1.2 [19]. The Bayesian approach evaluates the pos-terior probability (PP) of a tree, i.e., the probabilitythat the tree is correct given the character matrix. Foreach gene, MrModeltest 2.2 [20] was used for choos-ing the model of DNA substitution that best fits thedata. Using the Akaike information criterion, the se-lected models were GTR + I + G for all mitochondrialgenes, GTR + G for PRKCI, kCas, and SPTBN1, andHKY + G for TG. Unambiguous indels were analyzedas an additional partition and treated as morphologicalcharacters. Separate analyses of the seven genes wererun with the model selected by MrModeltest 2.2. Par-titioned Bayesian analyses were conducted to accountfor the combination of markers with contrasted molec-ular properties: the mitochondrial matrix was run withthe GTR + I + G model for each gene; the nuclear ma-trix was run with the GTR + G model for each gene;and the supermatrix (combining all the seven genes) wasrun using the selected model for each partition. Unpar-titioned Bayesian analyses were also performed using aGTR + I + G model for the whole matrix. All analyseswere conducted with five independent Markov chainsrun for 2 000 000 Metropolis-coupled MCMC genera-tions, with tree sampling every 100 generations, and aburn-in period of 2000 trees.
ML analyses were performed with PHYML (ver-sion 2.4) [21], and Bootstrap percentages (BPML) werecomputed after 100 replicates.
UMP analyses were run in PAUP 4.0b10 [22], andBootstrap percentages (BPUMP) were calculated af-
ter 100 replicates of the closest stepwise addition op-tion.
WMP analyses were conducted in PAUP 3.1.1 [18]with differential weighting of the character-state trans-formations using the product CIex. S (CIex, consistencyindex excluding uninformative characters; S, slope ofsaturation) as detailed in Hassanin et al. [23,24] (see on-line Appendix 2). For each partition, the amount of ho-moplasy was measured for each substitution-type (i.e.,A–G, C–T, A–C, A–T, C–G, G–T, and indels) throughthe CIex, and the saturation was assessed graphicallyby plotting the pairwise number of observed differ-ences against the corresponding pairwise number of in-ferred substitutions calculated by PAUP (the slope ofthe linear regression [S] was used to evaluate the levelof saturation). Unpartitioned WMP analyses were alsoperformed. Bootstrap percentages (BPWMP) were com-puted after 100 replicates of the closest stepwise addi-tion option.
2.4. Supertree construction
The results obtained from the independent analysesof five data sets, i.e., the four nuclear genes and thematrix including the three mitochondrial genes, wereused to construct supertrees with a new approach basedon the Matrix Representation with Parsimony (MRP)method. In the original MRP method of Baum [12] andRagan [13], each clade of the source trees is representedby a matrix element, where members of the clade arescored as “1”, non-members are scored as “0”, and taxanot present in the source tree are scored as “?”. In theSuperTRI method (SuperTree with Reliability Indices),the source used to construct the matrix is not a tree,but the lists of all bipartitions resulting from either theBayesian or Bootstrap analyses, with their frequency ofoccurrence (steps 1 to 2, Fig. 1). All lists of bipartitionsobtained from separate analyses were transformed into abinary matrix (step 3, Fig. 1) for supertree construction.Each binary character corresponds to a node, which wasweighted according to its frequency of occurrence in theBayesian or Bootstrap separate analyses (for ML andMP methods). In that way, the procedure specificallyallows the expression of hidden information. The su-pertree was then constructed using a parsimony heuris-tic search under PAUP (step 4, Fig. 1). In total, foursupertrees were constructed: a Bayesian supertree wasconstructed using the five lists of bipartitions result-ing from separate Bayesian analyses of the five datasets (κCas, PRKCI, SPTBN1, TG, and mtDNA); and,similarly, three supertrees were built with either ML,UMP, or WMP methods, using the lists of bipartitions

836 A. Ropiquet et al. / C. R. Biologies 332 (2009) 832–847
Fig. 1. The five steps of the SuperTRI method.

A. Ropiquet et al. / C. R. Biologies 332 (2009) 832–847 837
resulting from separate BP analyses of the five datasets.
2.5. Reliability indices of the supertree
The node reliability of the supertree was assessedusing three different measures: the first value is the Su-pertree Bootstrap Percentage (SBP), which is calculatedby Bootstrap analysis of the weighted binary matrixused to construct the supertree; the second value is themean branch support in the different data sets: it corre-sponds to the “Mean Posterior Probability” (MPP) forthe Bayesian method, or to the “Mean Bootstrap Per-centage” (MBP) for ML and MP methods; the thirdvalue is an index of reproducibility (Rep), which issimply the ratio of the number of data sets support-ing the node of interest to the total number of datasets. A python script called “SuperTRI” was written toconstruct automatically a matrix representation, whichcan be used directly for supertree reconstruction inPAUP* [22]. This script is available upon request tothe authors. For each node of the supertree, “SuperTRI”also computes the mean branch support values (MBP orMPP) and the index of reproducibility (Rep). All thesevalues may be reported on the branches directly using“SuperTRI”.
2.6. Tree comparisons
The trees produced during this study were comparedto each other using a global similarity approach. First,each tree was compared to the 50% majority rules con-sensus tree reconstructed on the basis of all supertreesand supermatrix trees obtained with the four methodsof tree reconstruction (BI, ML, UMP, and WMP). Forthat comparison, each node of a given tree was codedas a binary character, the character-state “1” indicat-ing that the node is present in the 50% majority-ruleconsensus tree, and the character-state “0” indicatingthat the node is absent. Second, the trees recoded assets of binary characters were used as “taxa” to con-struct a nexus matrix on PAUP*. Third, the differenttree topologies were then compared to each other us-ing the Neighbour-Joining method on PAUP* [22]. TheNJ network is a good way to visualize the global simi-larity between the different topologies obtained duringthis study, and the length of patristic distances gives agood idea of the number of topological differences be-tween trees.
3. Results
3.1. Independent analyses of the seven markers andcomparisons with mitochondrial and nuclearsupermatrix analyses
Nine data matrices were analysed using four meth-ods of tree reconstruction (BI, ML, UMP, and WMP):the seven molecular markers (Cyb, CO2, 12S, κCas,PRKCI, SPTBN1, and TG), the matrix combining thethree mitochondrial markers (mtDNA), and the matrixcombining the four nuclear markers (nucDNA). The 36topologies obtained from Bayesian or BP analyses werethen compared by the Neighbour-Joining method aftertransformation into binary matrices. For each of the ninedata matrices, the four methods of tree reconstructionproduced similar topologies, as revealed by the presenceof nine clusters in the NJ tree of Fig. 2. All the mito-chondrial topologies obtained from the four data matri-ces (Cyb, CO2, 12S, mtDNA) are grouped into a cluster,which means that they are more similar among themthan to the nuclear topologies (κCas, PRKCI, SPTBN1,TG, nucDNA). This result was expected, as mitochon-drial genes are linked markers evolving together in thesame circular genome. Moreover, the mtDNA topologyis more closely related to the Cyb topology. This rela-tionship indicates that the signal of the mtDNA matrixis more influenced by the marker containing the high-est number of informative sites. Indeed, the Cyb generepresents 508 informative sites, whereas CO2 and 12Sinclude only 236 and 229 sites, respectively. The sametrend is observed with nuclear markers, as the nucDNAtopology is more closely related to the TG topology, i.e.,the nuclear gene containing the largest amount of phy-logenetic information (TG: 197; SPTBN1: 138; κCas:106; PRKCI: 93).
By comparing pairwise distances between genetopologies, the lowest mean distances were logicallyfound between mitochondrial trees: 22% between CO2and 12S, 24% between Cyb and CO2, and 26% betweenCyb and 12S. The distances were more important be-tween nuclear trees: 49% between TG and PRKCI, 43%between PRKCI and SPTBN1, 40% between PRKCIand κCas, 39% between TG and κCas, 38% betweenTG and SPTBN1, but only 28% between SPTBN1 andκCas. Similar differences were found by comparing thetopologies of mitochondrial genes with those of nucleargenes: 36% with SPTBN1, 39% with κCas, 44% withPRKCI, and 45% with TG.

838 A. Ropiquet et al. / C. R. Biologies 332 (2009) 832–847
Fig. 2. Distance tree comparing the topologies constructed with the seven markers. The topologies constructed in this study were compared usingthe Neighbour Joining method after transformation into binary matrices (see Material and Methods for details). Abbreviations used: BI: BayesianInferences; ML: Maximum Likelihood; UMP: Unweighted Maximum Parsimony; WMP: Weighted Maximum Parsimony.
3.2. Method and model sensitivity: SuperTRI versusSupermatrix analyses
Supertrees were reconstructed with the SuperTRImethod and then compared with trees resulting from su-permatrix analyses. Only five data sets were used forsupertree reconstruction: the four nuclear genes wereanalysed separately, because they are physically un-linked markers located on different chromosomes; andthe three mitochondrial genes were concatenated in thesame data matrix, because they are linked markers lo-cated in the same molecule.
Distance topological comparisons (Fig. 3) show thatthe four supertrees constructed using different meth-ods of tree reconstruction (BI, ML, UMP, and WMP)are more similar to each other than are the supermatrixtopologies. For supertrees, the maximal distance wasfound between ML and WMP topologies (12%), andthe minimal distance between UMP and WMP topolo-gies (6%). For supermatrix trees, the maximal distancewas found between UMP and partitioned WMP topolo-gies (19%), and the minimal distance between unparti-tioned and partitioned BI topologies (3%). In the analy-sis of the bovid dataset, these results suggest that the
supermatrix approach is more sensitive to the differ-ent methods of tree reconstruction than is the SuperTRImethod. In agreement with that, the results indicate thatthe more the evolutionary model used for the super-matrix analysis is simple, the more the phylogenetictree is similar to the mtDNA topologies (Fig. 3). In-deed, the tree generated from the UMP method, whichconsiders only a single substitution rate, differs fromthe mtDNA topologies by only 12% (mean distance),whereas the trees produced from the methods consider-ing six substitution rates are more divergent: 15% forML and unpartitioned WMP, and 18% for unpartitionedBI. The trees constructed using the partitioned modelsare more distantly related to the mtDNA topologies:27% for the partitioned WMP, and 21% for the parti-tioned BI.
3.3. Measures of node reliability and robustness
Three measures were calculated for each node of thesupertrees. Two values were determined using the sepa-rate analyses of the data sets: the reproducibility index(Rep), which corresponds to the proportion of data setssupporting the node, and the mean branch support value,

A. Ropiquet et al. / C. R. Biologies 332 (2009) 832–847 839
Fig. 3. Distance tree comparing the topologies constructed with SuperTRI and Supermatrix methods. The topologies constructed in this study werecompared using the Neighbour Joining method after transformation into binary matrices (see Material and Methods for details). Abbreviationsused: BI: Bayesian Inferences; ML: Maximum Likelihood; UMP: Unweighted Maximum Parsimony; WMP: Weighted Maximum Parsimony.
which corresponds to the mean PP for the Bayesianmethod or to the mean BP for other methods (UMP,WMP, or ML). The third value, named SBP (SupertreeBootstrap Percentage), was obtained from the Bootstrapanalysis of the weighted binary matrix used to constructthe supertree.
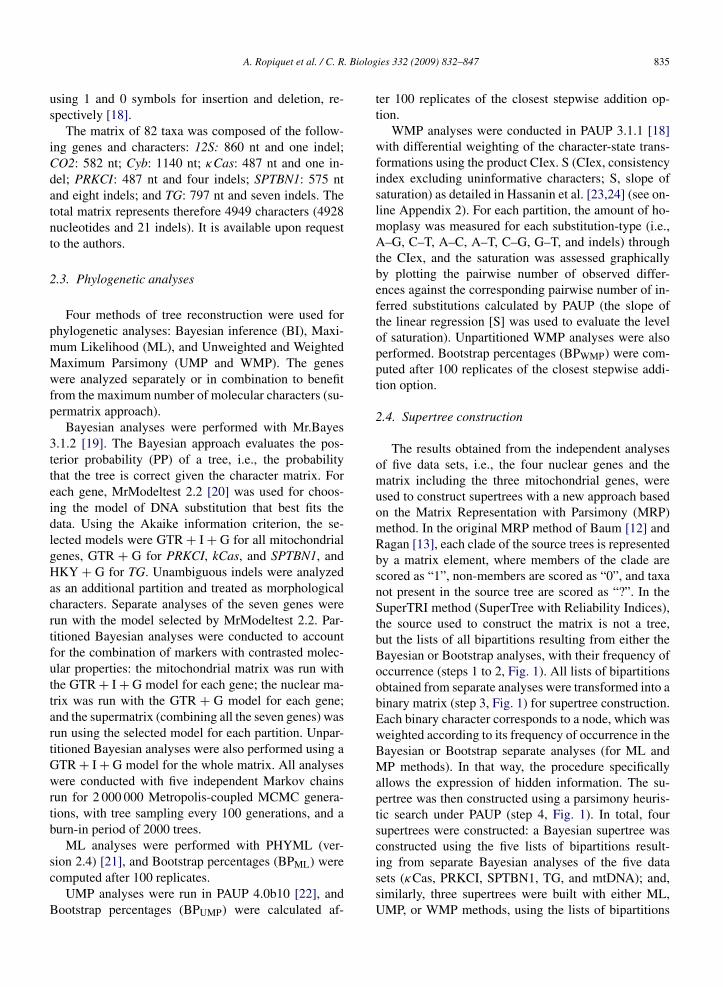
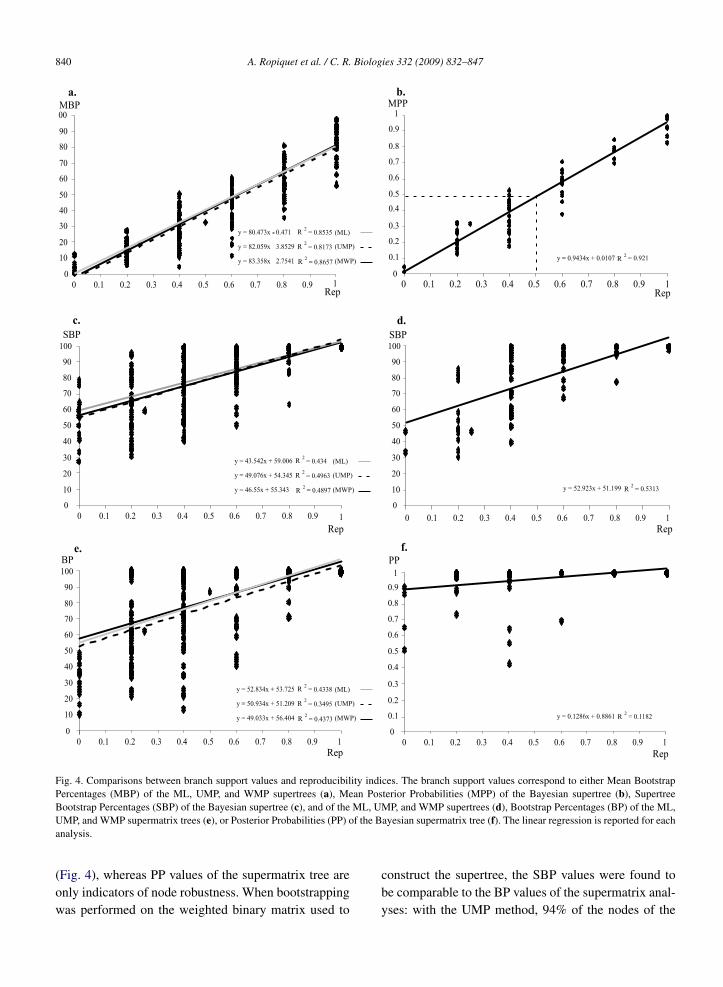
There is a linear relationship between the repro-ducibility index and mean branch support values (Figs.4a and 4b). The slope of the regression straight lineis very close to 1 for the Bayesian method (0.94). Itis weaker, but similar for all other methods of treereconstruction (0.83/0.82/0.80 for WMP/UMP/ML su-pertrees). These differences between MPP and MBPvalues may be correlated with previous studies showingthat Bayesian posterior probabilities are significantlyhigher than corresponding nonparametric Bootstrap fre-quencies for true clades [25,26].
The comparison between the reproducibility indicesand SBP values (Figs. 4c and 4d) shows little corre-lation between these two values. For instance, severalnodes that were observed in topologies inferred fromtwo markers (Rep = 0.4) receive here a maximum sup-port (SBP = 100). In addition, novel clades, i.e., thatwere not detected in any separate analyses (Rep = 0),are here supported by SBP values ranging from 28to 79.
The reproducibility indices were also calculated forall nodes of the supermatrix trees (BI, ML, UMP,and WMP) and then compared to their correspond-ing branch support values (PP or BP). The resultsfound with BP values (Fig. 4e) are very similar tothose obtained with SBP values. However, the nodes
that were not detected in any of the separate analy-ses of the data sets (Rep = 0) are never supported byBP > 50. The results found with PP values (Fig. 4f)show that they are not correlated to the reproducibil-ity indices, as most nodes receive high support values(PP > 0.9).
Since the supertrees produced from the four methodsof tree reconstruction (BI, ML, UMP, and WMP) gavesimilar topologies, we show here only the Bayesian su-pertree (Fig. 5). Indeed, 77% of the nodes evidencedin the Bayesian supertree were also recovered in othersupertrees (highlighted in grey in Fig. 5). By compari-son, only 68% of the nodes evidenced in the Bayesiantree of the supermatrix analysis (not shown) were alsorecovered with other methods. This lower percentage in-dicates that the supermatrix approach is more sensitiveto the methods of tree reconstruction than the SuperTRIapproach.
Eighty-one percent of the nodes of the Bayesian su-pertree were also found in the Bayesian supermatrixanalyses (Fig. 5). The branch support values of the Su-perTRI analyses, expressed in MPP, are lower than thoseof the supermatrix analyses, here expressed in posteriorprobabilities (PPp and PPu for partitioned and unparti-tioned BI, respectively). Indeed, only 48% of the nodesof the Bayesian supertree are supported by MPP � 0.5,whereas 99% of the nodes in the trees of supermatrixanalyses are supported by PP > 0.5. At first sight, thisresult suggests that the SuperTRI method produces lessrobust trees than the supermatrix approach. However,MPP values of the supertree are indicators of node relia-bility, i.e. the reproducibility of the phylogenetic results
840 A. Ropiquet et al. / C. R. Biologies 332 (2009) 832–847
Fig. 4. Comparisons between branch support values and reproducibility indices. The branch support values correspond to either Mean BootstrapPercentages (MBP) of the ML, UMP, and WMP supertrees (a), Mean Posterior Probabilities (MPP) of the Bayesian supertree (b), SupertreeBootstrap Percentages (SBP) of the Bayesian supertree (c), and of the ML, UMP, and WMP supertrees (d), Bootstrap Percentages (BP) of the ML,UMP, and WMP supermatrix trees (e), or Posterior Probabilities (PP) of the Bayesian supermatrix tree (f). The linear regression is reported for eachanalysis.
(Fig. 4), whereas PP values of the supermatrix tree areonly indicators of node robustness. When bootstrappingwas performed on the weighted binary matrix used to
construct the supertree, the SBP values were found tobe comparable to the BP values of the supermatrix anal-yses: with the UMP method, 94% of the nodes of the

A. Ropiquet et al. / C. R. Biologies 332 (2009) 832–847 841
Fig. 5.

842 A. Ropiquet et al. / C. R. Biologies 332 (2009) 832–847
supertree are supported by SBP � 50%, whereas 78% ofthe nodes of the supermatrix tree are supported by BP >
50%; with the WMP method, 91% of the nodes of thesupertree are supported by SBP � 50%, whereas 90%of the nodes of the supermatrix tree (reconstructed usinga partitioned model) are supported by BP > 50%; withthe ML method, 90% of the nodes of the supertree aresupported by SBP � 50%, whereas 86% of the nodesof the supermatrix tree are supported by BP > 50%.Our results show therefore that the SuperTRI methoddoes not produce less robust trees than the supermatrixapproach, and that there is no simple relation betweennode robustness (indicated by PP, BP or SBP values)and node reliability (indicated by Rep, MPP or MBPvalues).
3.4. Topological conflicts between SuperTRI andSupermatrix analyses
Particularly relevant is the fact that all highly reli-able nodes of the Bayesian supertree (Fig. 5), i.e. withMPP � 0.5, were recovered in the supermatrix anal-yses with maximum Bayesian support (PP = 1), butalso with high BP values (BPML � 93; BPWMP � 89;BPUMP � 41). There is, however, one exception to therule. Within the tribe Caprini, the genus Hemitragus isallied to Pseudois, Ammotragus and Arabitragus in allsupertrees (MPP = 0.6; MBP = 44–48; SBP = 81–97),as well as in the trees of the partitioned supermatrixanalyses (PPp = 0.7; BPWMP = 97). By contrast, othersupermatrix methods suggest close affinities of Hemi-tragus with Capra (PPu = 1; BPML/UMP = 97/94). Thisrobust conflict is due to divergent signals in the datasets: three independent nuclear genes are in favour ofthe clade uniting Hemitragus with Pseudois, Ammotra-gus and Arabitragus (PP = 1 for κCas, SPTBN1 andTG); there is no robust signal in PRKCI (PP < 0.5); andthe mitochondrial genes support the grouping of Hemi-tragus with Capra species (PP = 1).
Three nodes that were unreliable in the supertrees(Rep = 0.2) were strongly supported in all supermatrixanalyses: (1) within Bovini, the grouping of Bison bisonwith Bos grunniens (SuperTRI: MPP = 0.33; MBP =20–28; SBP = 79–83; supermatrix: PP = 0.97–1; BP =
98–100); (2) within Antilopini, the monophyly of thegenus Gazella (SuperTRI: MPP = 0.2; MBP = 20–21;SBP = 64–65, not found with BI; supermatrix: PP = 1;BP = 79–100); and (3) within Caprini, the clade unit-ing Capricornis, Naemorhedus and Ovibos (SuperTRI:MPP = 0.27; MBP = 20–23; SBP = 79–96; superma-trix: PP = 1; BP = 99–100). All these relationships areonly supported by the mitochondrial data set, but withhigh support (PP = 1; BP = 98–100).
Five nodes that were found in all or most supermatrixanalyses were not recovered in the Bayesian supertree:
(1) Aepycerotini and Neotragini are found to be sis-ter tribes in all supermatrix analyses (PPp/u = 0.99/0.98;BPML/UMP/WMP = 56/47/81). This relationship is essen-tially supported by the mtDNA data (PP = 1;BPUMP/WMP = 31/70), but significant secondary sig-nals are present in nuclear data, as revealed by the factthat the node was recovered in several analyses of threeindependent genes: PRKCI (BPWMP = 32), SPTBN1(BPUMP/WMP = 36/26), and TG (BPML/UMP/WMP =31/30/36). The four supertree analyses show conflict-ing results: the WMP supertree agrees with superma-trix analyses, as Aepyceros and Neotragus are foundto be sister-genera (MBP = 36; Rep = 0.8; SBP =64); the three other supertrees suggest that Neotragusfirst diverged from the rest of the subfamily Antilop-inae (MPP = 0.28; MBPML/UMP = 18/17; Rep = 0.4;SBPBI/ML/UMP = 58/52/54), but the grouping of Neo-tragus with Aepyceros is also supported by the data(SBPBI/ML/UMP = 40/47/45).
(2) The tribes Bovini and Tragelaphini are groupedtogether in all supermatrix analyses (PPp/u = 0.97/1;BPML/UMP/WMP = 71/71/65) and in most supertrees(MBPML/UMP/WMP = 44/50/44; SBPML/UMP/WMP =81/91/73). This relationship is supported by most sep-arate analyses of the data sets: SPTBN1 (PP = 0.96;BPML/UMP/WMP = 96/83/92), κCas (PP = 0.99;BPML/UMP/WMP = 61/67/63), TG (BPML/UMP/WMP =29/56/48), and the UMP analysis of the mtDNA data(BP = 45). However, the Bayesian supertree suggestsa link between Tragelaphini and Boselaphini (MPP =0.37; Rep = 0.4; SBP = 56), a phylogenetic signal pro-vided by the PRKCI gene (PP = 0.9; BPML/UMP/WMP =71/72/68), and also present in the mtDNA genes (PP =
Fig. 5. Supertree constructed from the Bayesian analyses of five independent data sets. The supertree was constructed with the SuperTRI methodusing the posterior probabilities obtained from the Bayesian analyses of five independent data sets: the four nuclear genes (κCas, PRKCI, SPTBN1and TG) and the mitochondrial matrix combining Cyb, CO2, and 12S genes. The two values indicated above the branches are the Supertree BootstrapPercentage (SBP) followed by the Mean Posterior Probability (MPP). The two values indicated below the branches are the posterior probabilitiesobtained with partitioned and unpartitioned Bayesian analyses of the supermatrix. Using the Reproducibility index (Rep), three categories of nodesare defined in the supertree: (1) nodes supported by at least three independent data sets (Rep � 0.6) are indicated by thick lines; (2) nodes supportedby two independent data sets (Rep = 0.4) are indicated by thin lines; and (3) unreliable nodes, i.e., with Rep < 0.4 are indicated by dotted lines.The nodes that were also found in other supertrees (ML, UMP, and WMP) are highlighted in grey.

A. Ropiquet et al. / C. R. Biologies 332 (2009) 832–847 843
0.93; BPML/WMP = 47/57). The conflict between theBayesian and other supertrees is explained by the factthat the Bayesian method failed in recovering Boviniand Tragelaphini together with the TG gene.
(3) Within Caprini, Oreamnos is grouped with Capri-cornis, Naemorhedus, and Ovibos in most supermatrixanalyses (PPp/u = 0.99/0.98; BPML/UMP = 42/37). Thisclade was also found in the WMP supertree with veryweak support (MBP = 8; Rep = 0.2; SBP = 57), but notin other supertrees, which show variable positions forthe genus Oreamnos. This node was recovered with themtDNA data alone (PP = 0.65; BPML/WMP = 40/34),and a weak signal was detected in the UMP analysis ofthe κCas (BP = 11).
Within the tribe Bovini, two relationships were foundin most supermatrix analyses: (4) the clade unitingBos frontalis, Bison bison and Bos grunniens (PPp/u =0.90/0.97; BPML/UMP = 63/68), and (5) the connec-tion between Bison bonasus and Bos taurus (PPp/u =0.97/0.99; BPML = 74). Both these signals come fromthe mtDNA data alone, which clearly support the groupcomposed of Bos frontalis, Bison bison and Bos grun-niens (PP = 0.96; BPML/UMP/WMP = 84/65/49), as wellas the sister-group relationship between Bison bona-sus and Bos taurus (PP = 0.94; BPML/UMP/WMP =89/36/76). These nodes are not found in the supertrees,which show a weakly supported clade composed of Bostaurus, Bison bison and Bos grunniens (MPP = 0.26;MBP = 17–26; SBP = 46–50).
The clade uniting the tribes Antilopini and Redunciniwas evidenced in all the supertrees (MPP = 0.46;MBPML/UMP/WMP = 18/19/23; SBPBI/ML/UMP/WMP =91/98/79/51), and also in the ML and UMP supermatrixtrees (BP = 52/59), whereas BI and WMP superma-trix analyses suggested that Antilopini are related toCephalophini and Oreotragini (PPp/u = 1/0.98; BP =36), and that Reduncini are linked to the clade contain-ing Alcelaphini, Caprini and Hippotragini (PPp/u = 1;BP = 58). These contradictions are the consequencesof conflicting signals in the data. The PRKCI genecontains a robust signal to cluster Reduncini with Al-celaphini, Caprini and Hippotragini (PP = 1;BPML/UMP/WMP = 82/89/88). This node is also foundin MP analyses of the SPTBN1 gene (BPUMP/WMP =34/44). In addition, this gene contains a weak sig-nal to group Antilopini with Cephalophini (PP = 0.24;BPML/MP/WMP = 28/16/14). By contrast, three data setsshow a moderate support for a sister-group relation-ship between Reduncini and Antilopini: TG (PP =0.79; BPML/MP/WMP = 25/31/36), κCas (PP = 0.75;BPML/UMP/WMP = 27/30/44), and mtDNA (PP = 0.51;BPUMP/WMP = 26/33). In addition, the mtDNA sup-
ports that Cephalophini and Oreotragini are relatedto Alcelaphini, Caprini, and Hippotragini (PP = 0.63;BPML/UMP/WMP = 37/17/14).
4. Discussion
4.1. Assumptions of the SuperTRI method
4.1.1. Independence of the data setsThe SuperTRI approach, as all other supertree meth-
ods, implies to make a choice on the data sets usedto construct the supertree. Unfortunately, many authorshave published supertrees without defining the crite-ria for selection of the data sets. Gatesy et al. [27]pointed out that the incorporation of source trees basedon dubious data makes these published supertrees weakphylogenetic statements. Moreover, some published su-pertrees have included redundant sampling of the samecharacters for the same taxa [28]. These problems of re-dundancy do not concern the SuperTRI method, whichimplies to build and then analyse the different data setsused for supertree construction.
The most important criterion of the SuperTRI methodassumes that the data sets used for separate phyloge-netic analyses have evolved independently from eachother. In molecular phylogeny, the hypothesis of in-dependency of the data sets can be however rejectedwhen several mitochondrial genes are included in theanalyses. As the mitochondrial genome is maternallytransmitted as a whole to the descendants, mitochon-drial genes are supposed to share the same evolutionaryhistory. Therefore, if different mitochondrial genes aredefined as being different data sets, the contribution ofthe mitochondrial signal will be overweighted in thesupertree construction, because of the addition of re-dundant signals. This unwarranted overweighting canlead to incorrect phylogenetic conclusions when the mi-tochondrial signal differs significantly from that of nu-clear genes. For instance, ancient mitochondrial intro-gression, as those previously hypothesized in the familyBovidae [29,30], could be particularly misleading forphylogeny. To avoid such errors in supertree construc-tion, the mitochondrial genes must be concatenated andconsidered as a single data set. Similarly, nuclear genesthat are physically linked to each other should be alsogrouped into a single data set. For that reason, all thefour nuclear markers selected for our study are locatedon different chromosomes. Note that the hypothesis ofindependence of the data sets could be however ques-tioned if chromosomal rearrangements occurred duringthe evolution of the studied taxon.

844 A. Ropiquet et al. / C. R. Biologies 332 (2009) 832–847
4.1.2. Reproducibility of the resultsA phylogenetic hypothesis could be described as re-
liable if it has a high probability to be supported overtime (reproducibility criterion). Thus, the congruenceof phylogenetic results obtained from multiple indepen-dent data sets is considered as a strong indicator of re-liability, even if the statistical branch support for eachindividual result is weak [31–33]. By contrast, a phylo-genetic hypothesis that is highly supported by only onedata set and never found by others could not be consid-ered as reliable.
The SuperTRI method exploits the advantages ofbranch support analyses and reproducibility criterionto evidence the most reliable phylogenetic hypotheses.The independent data sets are analysed separately, andthe branch support value (BP or PP) of each phyloge-netic hypothesis is used to apply a weight for the MRPanalysis. As a consequence, the supertree constructedwith the SuperTRI method can be interpreted as a con-sensus tree of all branch support analyses. In Fig. 4,we have plotted the reproducibility indices of all nodesof the supertrees against the mean branch supports (ex-pressed in MPP and MBP, respectively) or SBP values.The results show that the reproducibility index is lin-early correlated with the mean branch support, but notwith the SBP value. This means that only MPP andMBP values can be used as indicators of node reliabil-ity.
4.1.3. Principal and secondary signalsThe principal phylogenetic signal of a data set is
the one that gives the optimal tree under several se-lected criteria of tree reconstruction, including align-ment, method and model. Secondary signals correspondto subsignals of the data set that support phylogenetichypotheses that are not found in the optimal tree. A pre-sumed advantage of the supermatrix approach is thatnovel relationships, which are contradicted by all sep-arate analyses of the data sets, can emerge from the si-multaneous analysis by summing the subsignals comingfrom different data sets [6]. In our supermatrix analyses,only one novel relationship was found with a signifi-cant support: within the tribe Caprini, the grouping ofthe genera Ovis, Nilgiritragus, Rupicapra and Budorcasin the Bayesian tree (PP = 0.91). Since this clade wasnot recovered in any other supermatrix analyses (MLand MP), and has never been proposed in the litera-ture, we conclude however that no accurate novel cladeemerged from the combination of the data sets. A moreinteresting and real effect of the supermatrix approachis that principal signal(s) can be enhanced by subsignalsof other data sets, which can result in a significant in-
crease of the branch support relative to that indicated byseparate analyses of the individual data sets [34].
As pointed out by several authors, the phenomenonof signal enhancement cannot exist with current meth-ods of supertree, because source trees correspond onlyto principal signals [7,8]. By contrast, the SuperTRImethod takes into account both principal and secondarysignals, because all phylogenetic hypotheses found dur-ing branch support analyses of the independent data setsare represented in the matrix used for supertree con-struction.
4.2. The misleading effects of the mtDNA in theSupermatrix approach
4.2.1. Model partitioningCombining multiple molecular data sets into a sin-
gle one can be problematic for phylogenetic reconstruc-tion. Indeed, DNA markers may differ in evolution-ary modalities (differences in mutational rates, selectiveconstraints, and base composition), and in phylogeneticsignal, concerning both quantity (number of informativesites) and quality (topological conflicts between mark-ers). The best example concerns the differences classi-cally observed between mt and nuclear markers. Sincethe mt genome typically evolves much more rapidlythan the nuclear genome [35,36], and with asymmetricmutational constraints [37,38], mt genes always containgreater percentages of informative sites than nucleargenes, and their estimated model parameters are gener-ally divergent from those calculated for nuclear genes.In our analyses, the mt genes exhibit significant differ-ences in the parameters estimated for the GTR + I + Gmodel (Appendix 2): the probabilities for transversionsare lower; the probability for C/T transition is higher;the base composition is A + C rich, and poor in G nu-cleotides; and the proportion of invariable sites is animportant parameter, whereas it is negligible for nucleargenes. These differences can be problematic when thesupermatrix is analysed by using a single model for phy-logenetic reconstruction (unpartitioned BI, MP, and MLmethods). Indeed, as mt genes represent 52.4% of ourdata, and contain 65% of the total number of informativesites, the model parameters estimated for the superma-trix are more similar to those calculated for the mtDNAdata alone (Appendix 2). Since this model exhibits inad-equate fit to the nuclear data, the phylogenetic signal ofnuclear markers is expected to be misanalysed. To over-come this problem, one solution is to divide the datainto several partitions that have evolved under differentevolutionary constraints, and then to conduct the phylo-genetic analyses by applying a specific model for each

A. Ropiquet et al. / C. R. Biologies 332 (2009) 832–847 845
partition. Partitions may correspond to sequences fromdifferent genomes, different genes, or different regionsof the same gene, such as the three codon-positionsin protein-coding genes, stems and loops of secondarystructure in rRNA genes, introns and exons of genes.Model partitioning improves fit of the parameters tosubsets of the data evolving under different mutationaland selective constraints [39–42]. Our results show thatpartitioned methods are less biased by the dominant sig-nal of the mtDNA than unpartitioned methods (Fig. 3).Our supermatrix analyses confirm therefore previousstudies that have shown the importance of model par-titioning for improving the accuracy of phylogeneticinferences [43–45].
4.2.2. Misinterpretations due to mtDNA introgressionMany robust topological conflicts between superma-
trix and supertree results concern recent divergencesthat occurred during the Pliocene and Pleistocene epochs.They are systematically due to differences in phyloge-netic signals between mt and nuclear data. For inferringrelationships among closely related species or genera, itis well known that mtDNA genes bring more informa-tion than nuclear genes, which may be invariable at thislevel of the tree. As no strong competing signal exists inthe data, the mtDNA genes often impose their own sig-nal in the supermatrix analyses. Differences in geneticvariation may therefore explain why several nodes arestrongly supported in the supermatrix analyses, but notin the supertrees. A good example concerns the relation-ships between species of Bos and Bison within the tribeBovini (Fig. 5). All supermatrix analyses highly supportthat the genus Bison is polyphyletic, while supertrees donot reveal robust relationships between Bos and Bisonspecies. Actually, the nuclear genes analyzed here donot contain any structured signal at this level of the tree.However, the genus Bison was found monophyletic withthe SRY gene, suggesting that the mt signal is mislead-ing [46].
A more striking example of conflicts between mt andnuclear data concerns the position of the genus Hemitra-gus within the tribe Caprini: it appears related to Pseu-dois, Ammotragus and Arabitragus with three indepen-dent nuclear genes (κCas, SPTBN1 and TG), whereas itis robustly allied to Capra with the mtDNA data. Thereason of this conflict was developed in Ropiquet andHassanin [29]: the species tree is in fact given by thenuclear genes, while the mitochondrial genes are mis-leading, because the mitochondrial genome of proto-Hemitragus was transferred into the common ancestorof Capra species during the Pliocene epoch (ancient mi-tochondrial introgression). As another ancient event of
mitochondrial introgression has been also identified be-tween two other bovid species (i.e. from kouprey, Bossauveli, to banteng, Bos javanicus, in Cambodia; [30]),we consider that relationships only supported by themtDNA signal are of doubtful accuracy. As the signalof the mtDNA data is dominant over nuclear genes, thesupermatrix analyses can result in dramatic misinterpre-tations. In such cases, the supertree method is expectedto be more proper.
4.3. Robustness and accuracy of the phylogenetichypotheses
In the supermatrix approach, all molecular data avail-able for a chosen taxonomic sample are concatenatedinto a single data matrix, which contains therefore alarge number of characters for phylogenetic reconstruc-tion. The main advantage of supermatrix is that phylo-genetic signals from different DNA markers, includingweak signals, can be combined and thereby enhanced[8,47]. For that reason, the supermatrix tree is oftenmore resolved and robust than the trees coming fromseparate analyses of DNA markers. The statement thattrees obtained from supermatrix analyses tend to bemore resolved than the corresponding supertrees [11]might also reflect the greater information content ofsupermatrices and the associated emergence of hiddensupport [6]. With the SuperTRI method, however, ouranalyses do not confirm that the supermatrix trees aremore resolved and robust than the supertrees. In ad-dition, two arguments suggest that many of the robustnodes evidenced in the supermatrix analyses cannot beconsidered as accurate for interpreting phylogenetic re-lationships: (1) as developed previously, the compar-isons with the supertrees and separate analyses of datasets have emphasized several cases in which the super-matrix approach is biased by the dominant signal of themtDNA; and (2) there is no evident correlation betweennode robustness of the supermatrix analyses and repro-ducibility of the results in the independent analyses ofthe five datasets (Figs. 4e and 4f). In other words, ro-bust nodes in the supermatrix trees are not necessarilyreliable. In such conditions, we can question the useful-ness of robustness analyses when mitochondrial genesare overrepresented in the supermatrices.
The SuperTRI method is expected to be more accu-rate than the supermatrix approach because it minimizesthe misleading effect of loci with histories involvinghorizontal transfers, such as mitochondrial introgres-sion. Indeed, if the problem affects a taxon in only onedata set, the node corresponding to the misplaced taxonin one tree should be concealed in the supertree by other

846 A. Ropiquet et al. / C. R. Biologies 332 (2009) 832–847
data sets placing the taxon at the “correct” place. Inaddition, the mean branch support values are easily in-terpreted in the case of the SuperTRI method. Sincethere is here a clear correlation between robustness ofthe nodes and their reproducibility by different data sets,all well supported relationships could be considered asaccurate.
In deep contrast with the tree obtained from the su-permatrix analyses, many nodes of the supertrees arehowever poorly supported when the mean branch sup-port values are considered. In theory, four main hy-potheses can be advanced to interpret this weak support.(1) For taxa that have recently diverged, unsupportedrelationships can be explained by the lack of phyloge-netic signal in nuclear genes. (2) For ancient divergenceevents, the accumulation of multiple substitutions at thesame positions over time can lead to many convergencesand reversions (homoplasies), which may completelyerase the genuine phylogenetic signal. In such cases,most deep nodes of the tree will be unresolved. (3) Ro-bust disagreements between the data sets may also resultin low branch support values. In such cases, the origin ofthe conflict is often explained by the incorporation of er-roneous sequences: taxonomic misidentification, DNAcontamination, paralogous copies, and sequencing er-rors. (4) In some cases, the weak branch support may bethe result of a radiation, i.e. a rapid succession of spe-ciation events in a time period too brief to allow the ac-cumulation of substitutions. The hypothesis of radiationcan be accepted with high confidence level when twoconditions are satisfied. First, the presence of well sup-ported nodes both after and before the putative event ofradiation is a strong argument for rejecting the hypothe-ses that the data do not contain enough phylogeneticinformation or, on the contrary, that they are saturatedwith homoplasy. Second, the lack of resolution shouldbe observed in both SuperTRI and supermatrix anal-yses. Using these two criteria, we detected four casesof radiation in the family Bovidae: (1) inter-tribal rela-tionships within Antilopinae; (2) the diversification ofseveral lineages within the tribe Caprini; (3) the basalradiation among genera of Antilopini, and (4) the diver-gence between three genera of gazelles: Gazella, Eudor-cas and Nanger. The two first radiations were detectedin previous studies [48,49], whereas the two others arenew molecular evidence.
5. Conclusions
The originality of the SuperTRI method is that ittakes into account both principal and secondary phylo-genetic signals for supertree reconstruction.
Our analyses have shown that the dominant signalof the mtDNA data is particularly misleading for super-matrix analyses, whereas its effect is voided or stronglylimited in the SuperTRI analyses, suggesting that thelatter are more reliable to determine the true relation-ships among taxa. However, we consider that the com-parison between SuperTRI and supermatrix results ispertinent to evidence either horizontal transfers or ra-diation events.
Note
Appendixes 1 and 2 are available with the electronicversion of this article at doi:10.1016/j.crvi.2009.05.001.
Acknowledgements
A.R. and A.H. are very grateful to Professor Guil-laume Lecointre for encouraging collaboration withB.L.
References
[1] W.J. Murphy, E. Eizirik, S.J. O’Brien, O. Madsen, M. Scally,C.J. Douady, E. Teeling, O.A. Ryder, M.J. Stanhope, W.W. deJong, M.S. Springer, Resolution of the early placental mam-mal radiation using Bayesian phylogenetics, Science 294 (2001)2348–2351.
[2] W.J. Murphy, E. Elzirik, W.E. Johnson, Y.P. Zhang, O.A. Ryder,S.J. O’Brien, Molecular phylogenetics and the origins of placen-tal mammals, Nature 409 (2001) 614–618.
[3] A.C. Driskell, C. Ané, J.G. Burleigh, M. McMahon, B.C.O’meara, M.J. Sanderson, Prospects for building the tree of lifefrom large sequence databases, Science 306 (2004) 1172–1174.
[4] B. Rannala, J.P. Huelsenbeck, Z. Yang, R. Nielsen, Taxon sam-pling and the accuracy of large phylogenies, Syst. Biol. 47 (1998)702–710.
[5] A. Rokas, B.L. Williams, N. King, S.B. Carroll, Genome-scaleapproaches to resolving incongruence in molecular phylogenies,Nature 425 (2003) 798–804.
[6] A. de Queiroz, J. Gatesy, The supermatrix approach to systemat-ics, Trends Ecol. Evol. 22 (2007) 34–41.
[7] O.R.P. Bininda-Emond, Trees versus characters and the su-pertree/supermatrix “paradox”, Syst. Biol. 53 (2004) 356–359.
[8] D. Pisani, M. Wilkinson, Matrix representation with parsimony,taxonomic congruence, and total evidence, Syst. Biol. 51 (2002)151–155.
[9] G.K. Philip, C.J. Creevey, J.O. McInerney, The Opisthokontaand the Ecdysozoa may not be clades: stronger support for thegrouping of plant and animal than for animal and fungi andstronger support for the Coelomata than Ecdysozoa, Mol. Biol.Evol. 22 (2005) 1175–1184.
[10] M. Wilkinson, D. Pisani, J.A. Cotton, I. Corfe, Measuring sup-port and finding unsupported relationships in supertrees, Syst.Biol. 54 (2005) 823–831.
[11] J.G. Burleigh, A.C. Driskell, M.J. Sanderson, Supertree boot-strapping methods for assessing phylogenetic variation amonggenes in genome-scale data sets, Syst. Biol. 55 (2006) 426–440.

A. Ropiquet et al. / C. R. Biologies 332 (2009) 832–847 847
[12] B.R. Baum, Combining trees as a way of combining datasets forphylogenetic inference, and the desirability of combining genetrees, Taxon 41 (1992) 3–10.
[13] M.A. Ragan, Phylogenetic inference based on matrix represen-tation of trees, Mol. Phylogenet. Evol. 1 (1992) 53–58.
[14] F. Ronquist, Matrix representation of trees, redundancy, andweighting, Syst. Biol. 45 (1996) 247–253.
[15] B.R. Moore, S.A. Smith, M.J. Donoghue, Increasing data trans-parency and estimating phylogenetic uncertainty in supertrees:Approaches using nonparametric bootstrapping, Syst. Biol. 55(2006) 662–676.
[16] D.E. Wilson, D.M. Reeder (Eds.), Mammal Species of the World,Johns Hopkins University Press, 2005.
[17] A. Rambaut, Se–Al: Sequence Alignment Editor, http://evolve.zoo.ox.ac.uk, 1996.
[18] D.L. Swofford, PAUP: Phylogenetic Analysis Using Parsimony,Version 3.1.1, Computer program distributed by the Illinois Nat-ural History Survey, Champaign, IL, 1993.
[19] J.P. Huelsenbeck, F. Ronquist, MrBayes inference of phyloge-netic trees, Bioinformatics 17 (2001) 754–755.
[20] J.A.A. Nylander, MrModeltest 2.2 (Program distributed by theauthor), Evolutionary Biology Centre, Uppsala University, 2004.
[21] S. Guindon, O. Gascuel, A simple, fast, and accurate algorithmto estimate large phylogenies by maximum likelihood, Syst.Biol. 52 (2003) 696–704.
[22] D.L. Swofford, PAUP*. Phylogenetic analysis using parsimony(*and other methods). Version 4, Sinauer Associates, Sunder-land, Massachusetts, 2003.
[23] A. Hassanin, G. Lecointre, S. Tillier, The ‘evolutionary signal’of homoplasy in protein-coding gene sequences and its phyloge-netic consequences for weighting in phylogeny, C. R. Acad. Sci.III, Sci. Vie 321 (1998) 611–620.
[24] A. Hassanin, E. Pasquet, J.D. Vigne, Molecular systematics ofthe subfamily Caprinae (Artiodactyla, Bovidae) as determinedfrom cytochrome b sequences, J. Mammal. Evol. 5 (1998) 217–236.
[25] C.J. Douady, F. Delsuc, Y. Boucher, W.F. Doolittle, E.J.P.Douzery, Comparison of Bayesian and maximum likelihoodbootstrap measures of phylogenetic reliability, Mol. Biol.Evol. 20 (2003) 248–254.
[26] P. Erixon, B. Svennblad, T. Britton, B. Oxelman, Reliabilityof Bayesian posterior probabilities and bootstrap frequencies inphylogenetics, Syst. Biol. 52 (2003) 665–673.
[27] J. Gatesy, C. Matthee, R. DeSalle, C. Hayashi, Resolution of asupertree/supermatrix paradox, Syst. Biol. 51 (2002) 652–664.
[28] M.S. Springer, W.W. de Jong, Which mammalian supertree tobark up?, Science 291 (2001) 1709–1711.
[29] A. Ropiquet, A. Hassanin, Hybrid origin of the Pliocene ancestorof wild goats, Mol. Phylogenet. Evol. 41 (2006) 395–404.
[30] A. Hassanin, A. Ropiquet, Resolving a zoological mystery: thekouprey is a real species, Proc. R. Soc. B. 274 (2007) 2849–2855.
[31] M.M. Miyamoto, W.M. Fitch, Testing the covarion hypothesis ofmolecular evolution, Mol. Biol. Evol. 12 (1995) 503–513.
[32] W. Chen, C. Bonillo, G. Lecointre, Repeatability of clades asa criterion of reliability: a case study for molecular phylogenyof Acanthomorpha (Teleostei) with larger number of taxa, Mol.Phylogenet. Evol. 26 (2003) 262–288.
[33] G. Lecointre, P. Deleporte, Total evidence requires exclusion ofphylogenetically misleading data, Zool. Scr. 34 (2005) 101–117.
[34] J. Gatesy, P. O’Grady, R.H. Baker, Corroboration among datasets in simultaneous analysis: hidden support for phylogeneticrelationships among higher level artiodactyl taxa, Cladistics 15(1999) 271–313.
[35] G. Burger, M.W. Gray, B. Lang, Mitochondrial genomes: any-thing goes, Trends Genet. 19 (2003) 709–716.
[36] R.L. Parr, J. Maki, B. Reguly, G.D. Dakubo, A. Aguirre, R.Wittock, K. Robinson, J.P. Jakupciak, R.E. Thayer, The pseudo-mitochondrial genome influences mistakes in heteroplasmy in-terpretation, BMC Genomics 7 (2006) 185.
[37] A. Hassanin, N. Léger, J. Deutsch, Evidence for multiple rever-sals of asymmetric mutational constraints during the evolutionof the mitochondrial genome of metazoa, and consequences forphylogenetic inferences, Syst. Biol. 54 (2005) 277–298.
[38] A. Hassanin, Phylogeny of Arthropoda inferred from mitochon-drial sequences: strategies for limiting the misleading effects ofmultiple changes in pattern and rates of substitution, Mol. Phy-logenet. Evol. 38 (2006) 100–116.
[39] T. Pupko, D. Huchon, Y. Cao, N. Okada, M. Hasegawa, Combin-ing multiple data sets in a likelihood analysis: which models arethe best?, Mol. Biol. Evol. 19 (2002) 2294–2307.
[40] J.A.A. Nylander, F. Ronquist, J.P. Huelsenbeck, J.L. Nieves-Aldrey, Bayesian phylogenetic analysis of combined data, Syst.Biol. 53 (2004) 47–67.
[41] T. Seo, H. Kishino, J.L. Thorne, Incorporating gene-specific vari-ation when inferring and evaluating optimal evolutionary treetopologies from multilocus sequence data, Proc. Natl. Acad. Sci.USA 102 (2005) 4436–4441.
[42] M.S.Y. Lee, A.F. Hugall, Model type, implicit data weight-ing, and model averaging in phylogenetics, Mol. Phylogenet.Evol. 38 (2006) 848–857.
[43] T.C. Castoe, T.M. Doan, C.L. Parkinson, Data partitionsand complex models in Bayesian analysis: the phylogeny ofgymnophthalmid lizards, Syst. Biol. 53 (2004) 448–469.
[44] M.C. Brandley, A. Schmitz, T.W. Reeder, Partitioned Bayesiananalyses, partition choice, and the phylogenetic relationships ofscincid lizards, Syst. Biol. 54 (2005) 373–390.
[45] T.C. Castoe, C.L. Parkinson, Bayesian mixed models and thephylogeny of pitvipers (Viperidae: Serpentes), Mol. Phylogenet.Evol. 39 (2006) 91–110.
[46] E.L. Verkaar, I.J. Nijman, M. Beeke, E. Hanekamp, J.A. Lenstra,Maternal and paternal lineages in cross-breeding bovine species.Has wisent a hybrid origin?, Mol. Biol. Evol. 21 (2004) 1165–1170.
[47] P.J. Waddell, S. Shelley, Evaluating placental inter-ordinalphylogenies with novel sequences including RAG1, gamma-fibrinogen, ND6, and mt-tRNA, plus MCMC-driven nucleotide,amino acid, and codon models, Mol. Phylogenet. Evol. 28 (2003)197–224.
[48] A. Hassanin, E.J.P. Douzery, The tribal radiation of the familyBovidae (Artiodactyla) and the evolution of the mitochondrialcytochrome b gene, Mol. Phylogenet. Evol. 13 (1999) 227–243.
[49] A. Ropiquet, A. Hassanin, Molecular phylogeny of caprines(Bovidae, Antilopinae): the question of their origin and diversifi-cation during the Miocene, J. Zoolog. Syst. Evol. Res. 43 (2005)49–60.
Related Documents