© 2011 Wiley-VCH Verlag GmbH & Co. KGaA, Weinheim 1037 Biotechnol. J. 2011, 6, 1037–1051 DOI 10.1002/biot.201100031 www.biotechnology-journal.com 1 Introduction In conventional far-field light microscopy [1, 2], the optical resolution is limited by diffraction to R = 0.61 · λ/NA, where R is the smallest resolvable dis- tance, λ the emission wavelength and NA the nu- merical aperture. The resolution limit according to Rayleigh is shown in Fig. 1. Review Superresolution imaging of biological nanostructures by spectral precision distance microscopy Christoph Cremer 1,2,3,8,9 , Rainer Kaufmann 2 , Manuel Gunkel 2,3 , Sebastian Pres 2 , Yanina Weiland 2 , Patrick Müller 2 , Thomas Ruckelshausen 2 , Paul Lemmer 2 , Fania Geiger 4 , Sven Degenhard 5 , Christina Wege 5 , Niels A. W. Lemmermann 6 , Rafaela Holtappels 6 , Hilmar Strickfaden 7 and Michael Hausmann 2 1 Institute of Molecular Biology, Mainz, Germany 2 Kirchhoff Institute for Physics, Heidelberg University, Heidelberg, Germany 3 BioQuant Center, Heidelberg University, Heidelberg, Germany 4 Max Planck Institute for Intelligent Systems, Stuttgart, Germany 5 Institute of Biology, University of Stuttgart, Stuttgart, Germany 6 Institute of Virology, University Medical Center, University of Mainz, Mainz, Germany 7 Biocenter, Ludwig Maximilian University of Munich, Munich, Germany 8 Institute for Pharmacy and Molecular Biotechnology, Heidelberg University, Heidelberg, Germany 9 Institute for Molecular Biophysics/The Jackson Laboratory, Bar Harbor, ME, USA For the improved understanding of biological systems on the nanoscale, it is necessary to enhance the resolution of light microscopy in the visible wavelength range beyond the limits of conventional epifluorescence microscopy (optical resolution of about 200 nm laterally, 600 nm axially). Recent- ly, various far-field methods have been developed allowing a substantial increase of resolution (“superresolution microscopy”, or “lightoptical nanoscopy”). This opens an avenue to ‘nano-im- age’ intact and even living cells, as well as other biostructures like viruses, down to the molecular detail. Thus, it is possible to combine light optical spatial nanoscale information with ultrastruc- ture analyses and the molecular interaction information provided by molecular cell biology. In this review, we describe the principles of spectrally assigned localization microscopy (SALM) of bio- logical nanostructures, focusing on a special SALM approach, spectral precision distance/position determination microscopy (SPDM) with physically modified fluorochromes (SPDM Phymod ). Gen- erally, this SPDM method is based on high-precision localization of fluorescent molecules, which can be discriminated using reversibly bleached states of the fluorophores for their optical isola- tion. A variety of application examples is presented, ranging from superresolution microscopy of membrane and cytoplasmic protein distribution to dual-color SPDM of nuclear proteins. At pres- ent, we can achieve an optical resolution of cellular structures down to the 20-nm range, with best values around 5 nm (~1/100 of the exciting wavelength). Keywords: Localization microscopy · Microscopy · SALM · SPDM · Super-resolution imaging Correspondence: Prof. Christoph Cremer, Institute of Molecular Biology, Ackermannweg 4, 55128 Mainz, Germany E-mails: [email protected]; [email protected] Abbreviations: CLSM, confocal laser scanning fluorescence microscopy; SALM, spectrally assigned localization microscopy; SMI, spatially modulat- ed illumination; SPDM, spectral precision distance microscopy; YFP, yellow fluorescent protein Received 28 April 2011 Revised 13 July 2011 Accepted 2 August 2011

Welcome message from author
This document is posted to help you gain knowledge. Please leave a comment to let me know what you think about it! Share it to your friends and learn new things together.
Transcript
© 2011 Wiley-VCH Verlag GmbH & Co. KGaA, Weinheim 1037
Biotechnol. J. 2011, 6, 1037–1051 DOI 10.1002/biot.201100031 www.biotechnology-journal.com
1 Introduction
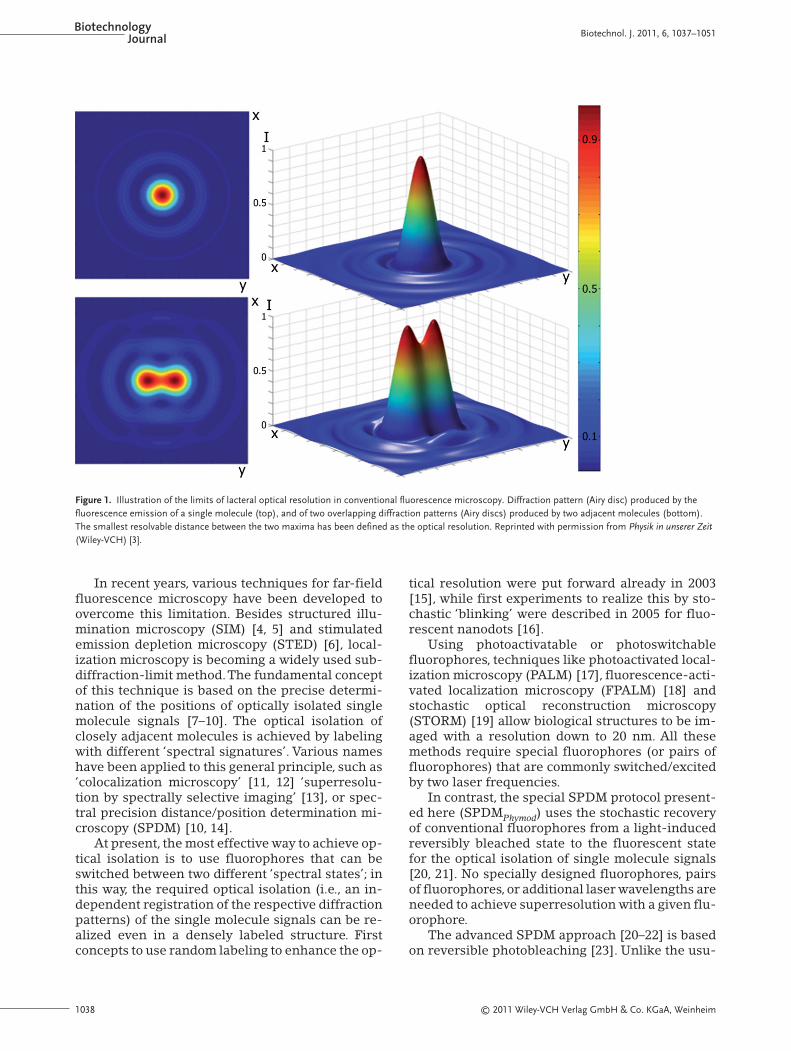
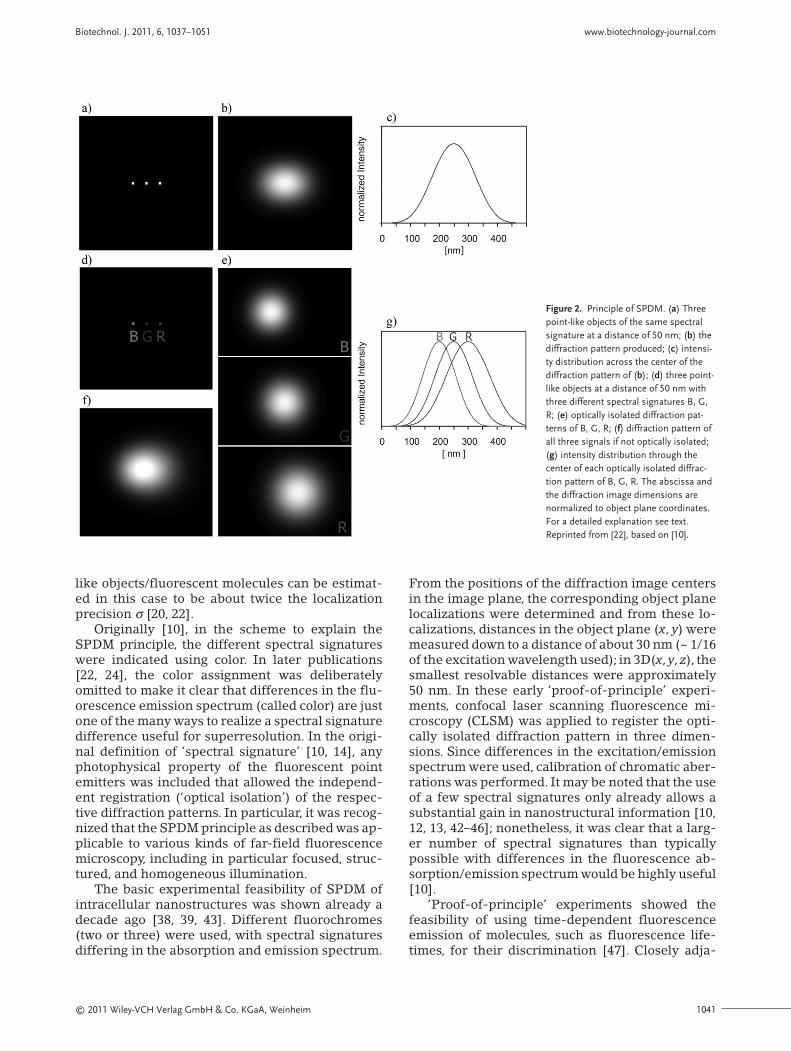
In conventional far-field light microscopy [1, 2], theoptical resolution is limited by diffraction to R =0.61 · λ/NA, where R is the smallest resolvable dis-tance, λ the emission wavelength and NA the nu-merical aperture. The resolution limit according toRayleigh is shown in Fig. 1.
Review
Superresolution imaging of biological nanostructures by spectralprecision distance microscopy
Christoph Cremer1,2,3,8,9, Rainer Kaufmann2, Manuel Gunkel2,3, Sebastian Pres2, Yanina Weiland2,Patrick Müller2, Thomas Ruckelshausen2, Paul Lemmer2, Fania Geiger4, Sven Degenhard5, Christina Wege5,Niels A. W. Lemmermann6, Rafaela Holtappels6, Hilmar Strickfaden7 and Michael Hausmann2
1 Institute of Molecular Biology, Mainz, Germany2 Kirchhoff Institute for Physics, Heidelberg University, Heidelberg, Germany3 BioQuant Center, Heidelberg University, Heidelberg, Germany4 Max Planck Institute for Intelligent Systems, Stuttgart, Germany5 Institute of Biology, University of Stuttgart, Stuttgart, Germany6 Institute of Virology, University Medical Center, University of Mainz, Mainz, Germany7 Biocenter, Ludwig Maximilian University of Munich, Munich, Germany8 Institute for Pharmacy and Molecular Biotechnology, Heidelberg University, Heidelberg, Germany9 Institute for Molecular Biophysics/The Jackson Laboratory, Bar Harbor, ME, USA
For the improved understanding of biological systems on the nanoscale, it is necessary to enhancethe resolution of light microscopy in the visible wavelength range beyond the limits of conventionalepifluorescence microscopy (optical resolution of about 200 nm laterally, 600 nm axially). Recent-ly, various far-field methods have been developed allowing a substantial increase of resolution(“superresolution microscopy”, or “lightoptical nanoscopy”). This opens an avenue to ‘nano-im-age’ intact and even living cells, as well as other biostructures like viruses, down to the moleculardetail. Thus, it is possible to combine light optical spatial nanoscale information with ultrastruc-ture analyses and the molecular interaction information provided by molecular cell biology. In thisreview, we describe the principles of spectrally assigned localization microscopy (SALM) of bio-logical nanostructures, focusing on a special SALM approach, spectral precision distance/positiondetermination microscopy (SPDM) with physically modified fluorochromes (SPDMPhymod). Gen-erally, this SPDM method is based on high-precision localization of fluorescent molecules, whichcan be discriminated using reversibly bleached states of the fluorophores for their optical isola-tion. A variety of application examples is presented, ranging from superresolution microscopy ofmembrane and cytoplasmic protein distribution to dual-color SPDM of nuclear proteins. At pres-ent, we can achieve an optical resolution of cellular structures down to the 20-nm range, with bestvalues around 5 nm (~1/100 of the exciting wavelength).
Keywords: Localization microscopy · Microscopy · SALM · SPDM · Super-resolution imaging
Correspondence: Prof. Christoph Cremer, Institute of Molecular Biology,Ackermannweg 4, 55128 Mainz, GermanyE-mails: [email protected]; [email protected]
Abbreviations: CLSM, confocal laser scanning fluorescence microscopy;SALM, spectrally assigned localization microscopy; SMI, spatially modulat-ed illumination; SPDM, spectral precision distance microscopy; YFP, yellowfluorescent protein
Received 28 April 2011Revised 13 July 2011Accepted 2 August 2011
BiotechnologyJournal Biotechnol. J. 2011, 6, 1037–1051
1038 © 2011 Wiley-VCH Verlag GmbH & Co. KGaA, Weinheim
In recent years, various techniques for far-fieldfluorescence microscopy have been developed toovercome this limitation. Besides structured illu-mination microscopy (SIM) [4, 5] and stimulatedemission depletion microscopy (STED) [6], local-ization microscopy is becoming a widely used sub-diffraction-limit method.The fundamental conceptof this technique is based on the precise determi-nation of the positions of optically isolated singlemolecule signals [7–10]. The optical isolation ofclosely adjacent molecules is achieved by labelingwith different ‘spectral signatures’. Various nameshave been applied to this general principle, such as‘colocalization microscopy’ [11, 12] ‘superresolu-tion by spectrally selective imaging’ [13], or spec-tral precision distance/position determination mi-croscopy (SPDM) [10, 14].
At present, the most effective way to achieve op-tical isolation is to use fluorophores that can beswitched between two different ‘spectral states’; inthis way, the required optical isolation (i.e., an in-dependent registration of the respective diffractionpatterns) of the single molecule signals can be re-alized even in a densely labeled structure. Firstconcepts to use random labeling to enhance the op-
tical resolution were put forward already in 2003[15], while first experiments to realize this by sto-chastic ‘blinking’ were described in 2005 for fluo-rescent nanodots [16].
Using photoactivatable or photoswitchablefluorophores, techniques like photoactivated local-ization microscopy (PALM) [17], fluorescence-acti-vated localization microscopy (FPALM) [18] andstochastic optical reconstruction microscopy(STORM) [19] allow biological structures to be im-aged with a resolution down to 20 nm. All thesemethods require special fluorophores (or pairs offluorophores) that are commonly switched/excitedby two laser frequencies.
In contrast, the special SPDM protocol present-ed here (SPDMPhymod) uses the stochastic recoveryof conventional fluorophores from a light-inducedreversibly bleached state to the fluorescent statefor the optical isolation of single molecule signals[20, 21]. No specially designed fluorophores, pairsof fluorophores, or additional laser wavelengths areneeded to achieve superresolution with a given flu-orophore.
The advanced SPDM approach [20–22] is basedon reversible photobleaching [23]. Unlike the usu-
Figure 1. Illustration of the limits of lacteral optical resolution in conventional fluorescence microscopy. Diffraction pattern (Airy disc) produced by thefluorescence emission of a single molecule (top), and of two overlapping diffraction patterns (Airy discs) produced by two adjacent molecules (bottom).The smallest resolvable distance between the two maxima has been defined as the optical resolution. Reprinted with permission from Physik in unserer Zeit(Wiley-VCH) [3].
© 2011 Wiley-VCH Verlag GmbH & Co. KGaA, Weinheim 1039
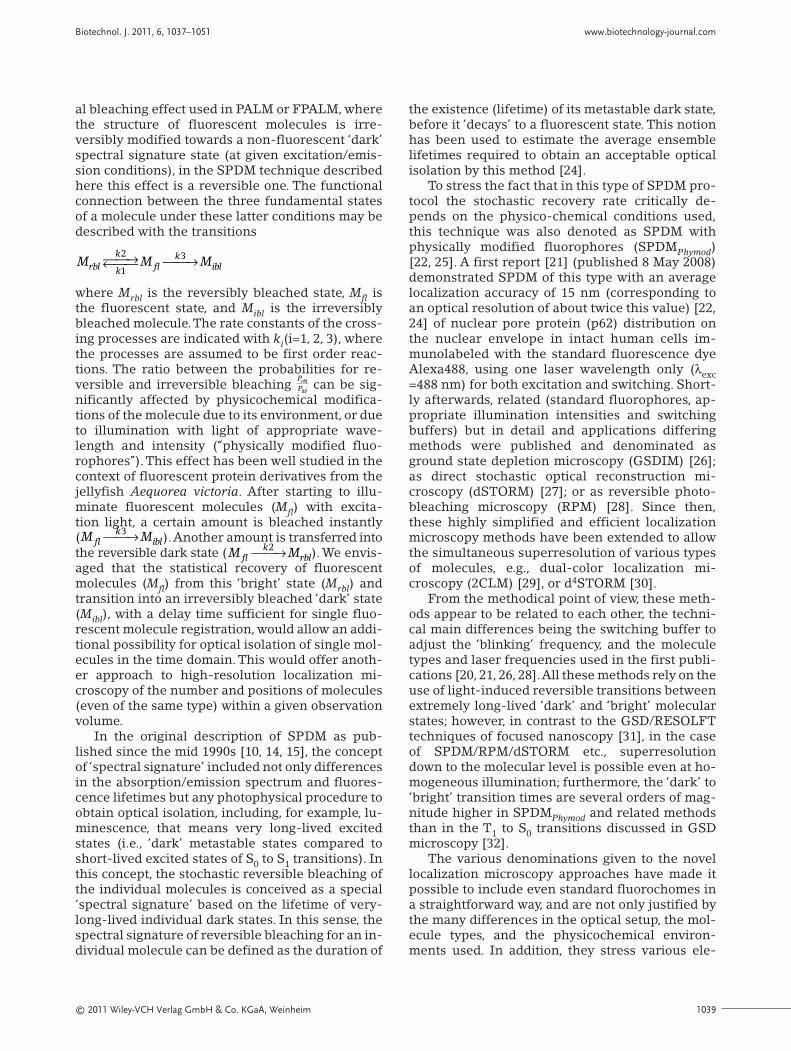
al bleaching effect used in PALM or FPALM, wherethe structure of fluorescent molecules is irre-versibly modified towards a non-fluorescent ‘dark’spectral signature state (at given excitation/emis-sion conditions), in the SPDM technique describedhere this effect is a reversible one. The functionalconnection between the three fundamental statesof a molecule under these latter conditions may bedescribed with the transitions
where Mrbl is the reversibly bleached state, Mfl isthe fluorescent state, and Mibl is the irreversiblybleached molecule.The rate constants of the cross-ing processes are indicated with ki(i=1, 2, 3), wherethe processes are assumed to be first order reac-tions. The ratio between the probabilities for re-versible and irreversible bleaching can be sig-nificantly affected by physicochemical modifica-tions of the molecule due to its environment, or dueto illumination with light of appropriate wave-length and intensity (“physically modified fluo-rophores”).This effect has been well studied in thecontext of fluorescent protein derivatives from thejellyfish Aequorea victoria. After starting to illu-minate fluorescent molecules (Mfl) with excita-tion light, a certain amount is bleached instantly( ).Another amount is transferred intothe reversible dark state ( ).We envis-aged that the statistical recovery of fluorescentmolecules (Mfl) from this ‘bright’ state (Mrbl) andtransition into an irreversibly bleached ‘dark’ state(Mibl), with a delay time sufficient for single fluo-rescent molecule registration, would allow an addi-tional possibility for optical isolation of single mol-ecules in the time domain. This would offer anoth-er approach to high-resolution localization mi-croscopy of the number and positions of molecules(even of the same type) within a given observationvolume.
In the original description of SPDM as pub-lished since the mid 1990s [10, 14, 15], the conceptof ‘spectral signature’ included not only differencesin the absorption/emission spectrum and fluores-cence lifetimes but any photophysical procedure toobtain optical isolation, including, for example, lu-minescence, that means very long-lived excitedstates (i.e., ‘dark’ metastable states compared toshort-lived excited states of S0 to S1 transitions). Inthis concept, the stochastic reversible bleaching ofthe individual molecules is conceived as a special‘spectral signature’ based on the lifetime of very-long-lived individual dark states. In this sense, thespectral signature of reversible bleaching for an in-dividual molecule can be defined as the duration of
M Mflk
rbl2⎯ →⎯
M Mflk
ibl3⎯ →⎯
PP
rbl
ibl
M M Mrblk
k flk
ibl2
1
3⎯ →⎯← ⎯⎯ ⎯ →⎯
the existence (lifetime) of its metastable dark state,before it ‘decays’ to a fluorescent state. This notionhas been used to estimate the average ensemblelifetimes required to obtain an acceptable opticalisolation by this method [24].
To stress the fact that in this type of SPDM pro-tocol the stochastic recovery rate critically de-pends on the physico-chemical conditions used,this technique was also denoted as SPDM withphysically modified fluorophores (SPDMPhymod)[22, 25]. A first report [21] (published 8 May 2008)demonstrated SPDM of this type with an averagelocalization accuracy of 15 nm (corresponding toan optical resolution of about twice this value) [22,24] of nuclear pore protein (p62) distribution onthe nuclear envelope in intact human cells im-munolabeled with the standard fluorescence dyeAlexa488, using one laser wavelength only (λexc=488 nm) for both excitation and switching. Short-ly afterwards, related (standard fluorophores, ap-propriate illumination intensities and switchingbuffers) but in detail and applications differingmethods were published and denominated asground state depletion microscopy (GSDIM) [26];as direct stochastic optical reconstruction mi-croscopy (dSTORM) [27]; or as reversible photo-bleaching microscopy (RPM) [28]. Since then,these highly simplified and efficient localizationmicroscopy methods have been extended to allowthe simultaneous superresolution of various typesof molecules, e.g., dual-color localization mi-croscopy (2CLM) [29], or d4STORM [30].
From the methodical point of view, these meth-ods appear to be related to each other, the techni-cal main differences being the switching buffer toadjust the ‘blinking’ frequency, and the moleculetypes and laser frequencies used in the first publi-cations [20, 21, 26, 28].All these methods rely on theuse of light-induced reversible transitions betweenextremely long-lived ‘dark’ and ‘bright’ molecularstates; however, in contrast to the GSD/RESOLFTtechniques of focused nanoscopy [31], in the caseof SPDM/RPM/dSTORM etc., superresolutiondown to the molecular level is possible even at ho-mogeneous illumination; furthermore, the ‘dark’ to‘bright’ transition times are several orders of mag-nitude higher in SPDMPhymod and related methodsthan in the T1 to S0 transitions discussed in GSDmicroscopy [32].
The various denominations given to the novellocalization microscopy approaches have made itpossible to include even standard fluorochomes ina straightforward way, and are not only justified bythe many differences in the optical setup, the mol-ecule types, and the physicochemical environ-ments used. In addition, they stress various ele-
Biotechnol. J. 2011, 6, 1037–1051 www.biotechnology-journal.com
BiotechnologyJournal Biotechnol. J. 2011, 6, 1037–1051
1040 © 2011 Wiley-VCH Verlag GmbH & Co. KGaA, Weinheim
ments of the general concept of “spectrally as-signed localization microscopy” (SALM) [20, 22, 24,33]. This name is proposed as a joint ‘family’ namefor the various approaches (PALM/FPALM,STORM/dSTORM, GSDIM, SPDM, etc.) achievingsuperresolution by precision localization of opticalisolated point emitters, using as an assignment-ap-propriate ‘spectral signatures’ (including absorp-tion/emission spectral, lifetimes, luminescence,dark-bright transitions, etc.).
For example, in PALM and FPALM the impor-tance of using photoswitchable molecules is putforward; in STORM, dSTORM and d4STORM theoptical isolation by stochastic differences betweenspectral signatures is highlighted; in GSDIM the fo-cus is put on the quantum physical necessity to re-alize very long-lived excited states for S0 depletion;in “RPM” the effect of reversible photobleaching isdenoted; in 2CLM the possibility of extendingSALM to the simultaneous superresolution ofmultiple molecule types is envisaged; and inSPDMPhymod performing highly precise position/distance measurements of single molecules underspecific physicochemical conditions (e.g., illumina-tion intensity, chemical environment) is highlight-ed.
The exact photophysical mechanisms underly-ing the ‘blinking’ effects used in 2CLM, GSDIM,RPM, SPDMPhymod, dSTORM/d4STORM etc. are stillwidely unknown. From the formal point of energyterms, they might include a transition through a T1state as assumed in GSDIM [26] but the molecularmechanisms to proceed from there to the requiredvery-long dark states are most probably highlycomplex [23]. They are expected to constitute apromising field for future photophysics of organicmolecules.
The visualization of localization microscopydata is based on the rendering of all detected sin-gle molecule positions in one image, such that themean effective optical resolution of this image isdetermined by the localization accuracy and thedensity of detected molecules. This is commonlydone by blurring the position of each molecule witha Gaussian function with a standard deviation cor-responding to the individual localization accuracy.However, there are other rendering methods for animproved visualization of localization microscopydata [34].
Recently, the wide scope of SPDM for the inves-tigation of biological nanostructures has beenshown. 2-D single-color imaging [20, 22, 25], multi-color imaging and 3-D spatial resolution in the50-nm range has been realized [20, 29, 35].The sin-gle molecule information provided by SPDM can beused for statistical analyses of protein distributions
[29, 35, 36]. It was even possible to perform SPDMon completely label-free cells, and gather structur-al information of autofluorescent molecules withinthese cells with a resolution far below the Abbelimit [37].
2 Basic principles of SPDM
SPDM [9, 10, 14, 15, 38, 39] is based on precision po-sition measurements of small (‘point like’) objectsof appropriate spectral signatures.
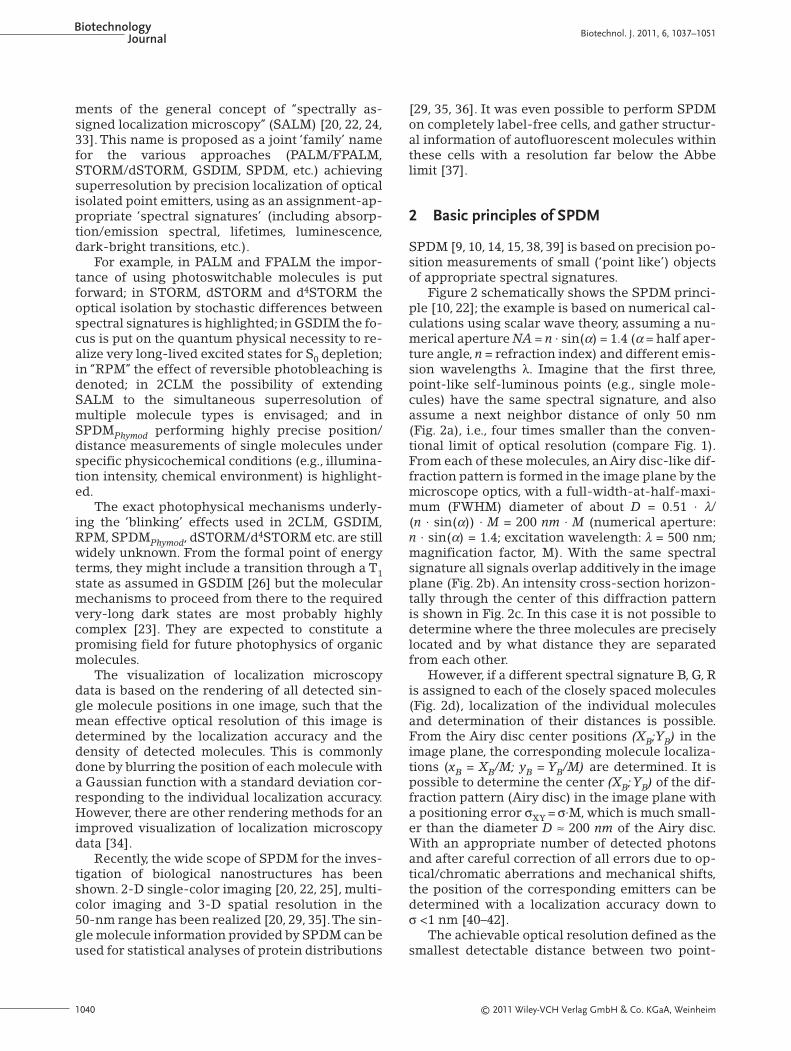
Figure 2 schematically shows the SPDM princi-ple [10, 22]; the example is based on numerical cal-culations using scalar wave theory, assuming a nu-merical aperture NA = n · sin(α) = 1.4 (α = half aper-ture angle, n = refraction index) and different emis-sion wavelengths λ. Imagine that the first three,point-like self-luminous points (e.g., single mole-cules) have the same spectral signature, and alsoassume a next neighbor distance of only 50 nm(Fig. 2a), i.e., four times smaller than the conven-tional limit of optical resolution (compare Fig. 1).From each of these molecules, an Airy disc-like dif-fraction pattern is formed in the image plane by themicroscope optics, with a full-width-at-half-maxi-mum (FWHM) diameter of about D = 0.51 · λ/(n · sin(α)) · M = 200 nm · M (numerical aperture:n · sin(α) = 1.4; excitation wavelength: λ = 500 nm;magnification factor, M). With the same spectralsignature all signals overlap additively in the imageplane (Fig. 2b). An intensity cross-section horizon-tally through the center of this diffraction patternis shown in Fig. 2c. In this case it is not possible todetermine where the three molecules are preciselylocated and by what distance they are separatedfrom each other.
However, if a different spectral signature B, G, Ris assigned to each of the closely spaced molecules(Fig. 2d), localization of the individual moleculesand determination of their distances is possible.From the Airy disc center positions (XB;YB) in theimage plane, the corresponding molecule localiza-tions (xB = XB/M; yB = YB/M) are determined. It ispossible to determine the center (XB; YB) of the dif-fraction pattern (Airy disc) in the image plane witha positioning error σXY = σ·M, which is much small-er than the diameter D ≈ 200 nm of the Airy disc.With an appropriate number of detected photonsand after careful correction of all errors due to op-tical/chromatic aberrations and mechanical shifts,the position of the corresponding emitters can bedetermined with a localization accuracy down to σ <1 nm [40–42].
The achievable optical resolution defined as thesmallest detectable distance between two point-
© 2011 Wiley-VCH Verlag GmbH & Co. KGaA, Weinheim 1041
like objects/fluorescent molecules can be estimat-ed in this case to be about twice the localizationprecision σ [20, 22].
Originally [10], in the scheme to explain theSPDM principle, the different spectral signatureswere indicated using color. In later publications[22, 24], the color assignment was deliberatelyomitted to make it clear that differences in the flu-orescence emission spectrum (called color) are justone of the many ways to realize a spectral signaturedifference useful for superresolution. In the origi-nal definition of ‘spectral signature’ [10, 14], anyphotophysical property of the fluorescent pointemitters was included that allowed the independ-ent registration (‘optical isolation’) of the respec-tive diffraction patterns. In particular, it was recog-nized that the SPDM principle as described was ap-plicable to various kinds of far-field fluorescencemicroscopy, including in particular focused, struc-tured, and homogeneous illumination.
The basic experimental feasibility of SPDM ofintracellular nanostructures was shown already adecade ago [38, 39, 43]. Different fluorochromes(two or three) were used, with spectral signaturesdiffering in the absorption and emission spectrum.
From the positions of the diffraction image centersin the image plane, the corresponding object planelocalizations were determined and from these lo-calizations, distances in the object plane (x, y) weremeasured down to a distance of about 30 nm (~ 1/16of the excitation wavelength used); in 3D(x, y, z), thesmallest resolvable distances were approximately50 nm. In these early ‘proof-of-principle’ experi-ments, confocal laser scanning fluorescence mi-croscopy (CLSM) was applied to register the opti-cally isolated diffraction pattern in three dimen-sions. Since differences in the excitation/emissionspectrum were used, calibration of chromatic aber-rations was performed. It may be noted that the useof a few spectral signatures only already allows asubstantial gain in nanostructural information [10,12, 13, 42–46]; nonetheless, it was clear that a larg-er number of spectral signatures than typicallypossible with differences in the fluorescence ab-sorption/emission spectrum would be highly useful[10].
‘Proof-of-principle’ experiments showed thefeasibility of using time-dependent fluorescenceemission of molecules, such as fluorescence life-times, for their discrimination [47]. Closely adja-
Biotechnol. J. 2011, 6, 1037–1051 www.biotechnology-journal.com
Figure 2. Principle of SPDM. (a) Threepoint-like objects of the same spectralsignature at a distance of 50 nm; (b) thediffraction pattern produced; (c) intensi-ty distribution across the center of thediffraction pattern of (b); (d) three point-like objects at a distance of 50 nm withthree different spectral signatures B, G,R; (e) optically isolated diffraction pat-terns of B, G, R; (f) diffraction pattern ofall three signals if not optically isolated;(g) intensity distribution through thecenter of each optically isolated diffrac-tion pattern of B, G, R. The abscissa andthe diffraction image dimensions arenormalized to object plane coordinates.For a detailed explanation see text.Reprinted from [22], based on [10].
BiotechnologyJournal Biotechnol. J. 2011, 6, 1037–1051
1042 © 2011 Wiley-VCH Verlag GmbH & Co. KGaA, Weinheim
cent single molecules (distances <<0.61 λ/n sinα)can be localized separately from each other evenwhen they differ neither in the absorption nor inthe emission spectrum from each other but are dis-tinguished by time-dependent features. Here, thefluorescence lifetime of excited states of singlemolecules (nanosecond range) was used as thespectral signature.The fluorescence excitation life-times of single molecules were determined bytime-correlated single-photon counting using alaser scanning device. This was a first example ofhow temporal variations in the fluorescence emis-sion following simultaneous excitation can be usedto determine the Airy discs produced by each indi-vidual molecule, and thus to isolate them optically.
Recently, various additional localization mi-croscopy approaches using time-dependent opticalisolation of the detected molecules have been de-veloped.They currently allow the localization of upto several thousand individual molecules/µm2, cor-responding to ' 60 molecules in an area as small asan individual Airy disc [17–20, 22, 26–29, 34–37].
One method is to induce photoactivation/photo-switching of organic fluorochromes between a‘dark’ state and a ‘bright’ state by the application ofappropriate illumination sources (e.g., one wave-length for photoactivation/photoswitching and an-other for fluorescence excitation of the molecules).‘Dark’ and ‘bright’ in this case do not necessarilymean emission/non-emission of photons but mayrefer to the registration status of the detector for aparticular spectral signature. Various methods us-ing this principle have been realized over the lastfew years [11, 17–21, 24, 27, 30, 33, 48–55]. For ex-ample, using a UV laser beam, conformationalchanges can be induced in photoactivatable greenfluorescent proteins (PA-GFPs), leading to achange in the fluorescence emission spectrum (‘ac-tivation’) and producing a ‘bright’ state. The idea isto realize the required optical isolation by activat-ing only very few of the fluorophores, to have notmore than one of these per diffraction volume. AUV laser is used to excite the ‘activated’ fluo-rophores at very low illumination intensities.Theirfluorescence is registered until they are bleached(converted into an irreversibly ‘dark’ state). Afterthis first cycle all fluorophores are again in the‘dark’ state.A new subset of the PA-GFP moleculesis then activated, detected and bleached. This pro-cedure is repeated many times to detect a largenumber of single molecules.
Another way to realize the appropriate conver-sions between ‘dark’ and ‘bright’ states withoutneeding molecules that have to be photoactivatedor photoswitched at two different wavelengths is totake advantage of the fact that, under certain pho-
tophysical and physicochemical conditions, twotypes of ‘dark’ states may be induced in many typesof fluorescent molecules (see above): One irre-versibly bleached state Mirb and one reversiblybleached state Mrbl [23].After excitation with a suit-able single wavelength and illumination intensity,they can either pass to the irreversibly bleached‘dark’ state Mirb or they can pass to the reversiblybleached ‘dark’ stateMrbl. From this state they canstochastically re-enter the fluorescent state Mfl inwhich they emit in a few tens of milliseconds a flashof thousands of photons before they pass into ei-ther the irreversibly bleached ‘dark’ state Mirb orare again transferred to the reversibly bleachedstate Mrbl. At appropriate time constants for the re-covery of the fluorophores from the reversiblybleached state Mrbl to the fluorescent state Mfl, thedistances between the diffraction images of themolecules are large enough to allow the desired op-tical isolation. Thus, the positions of the individualdetected fluorophores can be determined accord-ing to the basic principles of SPDM outlined above.This can be achieved using only a single laserwavelength for both the induction of reversiblebleaching and fluorescence registration. Subse-quent experiments showed that this approach alsoallowed superresolution imaging of biologicalstructures for a variety of other standard fluores-cent molecules and a variety of biological nanos-tructures, including conventional fluorescent pro-teins [20, 22, 26–29, 49, 50]. Since this superresolu-tion technique is based on the general principles ofSPDM using molecular states modified by appro-priate illumination intensities and environmentalconditions, we have denominated this method asSPDM with physically modifiable fluorophores(SPDMPhymod). Typically, a few thousand framesregistered at a frame rate of 20 frames/s (fps) ormore are sufficient to render an image with a struc-tural resolution down to the range of few tens of nmproviding positional information for individualmolecules up to 106 per cell.
The combination of the SPDM approachwith confocal microscopy/structured illuminationschemes may be highly advantageous to obtainsuch a superresolution not only in the lateral di-rection but also in three dimensions. For example,the combination of SPDM/localization microscopywith CLSM allowed 3-D distance measurementsdown to the 50-nm range [38], while the combina-tion with 4Pi microscopy [44] permitted 3-D dis-tance measurements with a localization accuracyaround 10 nm, corresponding to an optical resolu-tion around 20 nm; the combination of SPDM andspatially modulated illumination (SMI) microscopypresently allows images of biological structures
© 2011 Wiley-VCH Verlag GmbH & Co. KGaA, Weinheim 1043
with a 3-D effective optical resolution in the 30–50-nm range [20, 35]. Numerical simulations [56]suggested that in the case of detected photoncounts (per molecule) in the 104 range, even a 3-Doptical resolution in the 1-nm range might eventu-ally become feasible for localization microscopySPDM.
3 Optical resolution conditions inlocalization microscopy
In localization microscopy (SPDM/SALM) the ef-fective optical (structural) resolution depends onthe localization accuracy and the density of the de-tected positions. Figures 3 and 4 show numerical‘virtual SPDM’ calculations assuming various dis-tributions of point-like objects on distinct struc-tures that have been simulated to visualize the ef-fects of these parameters for the rendering of theunderlying structure from the localization mi-croscopy data.
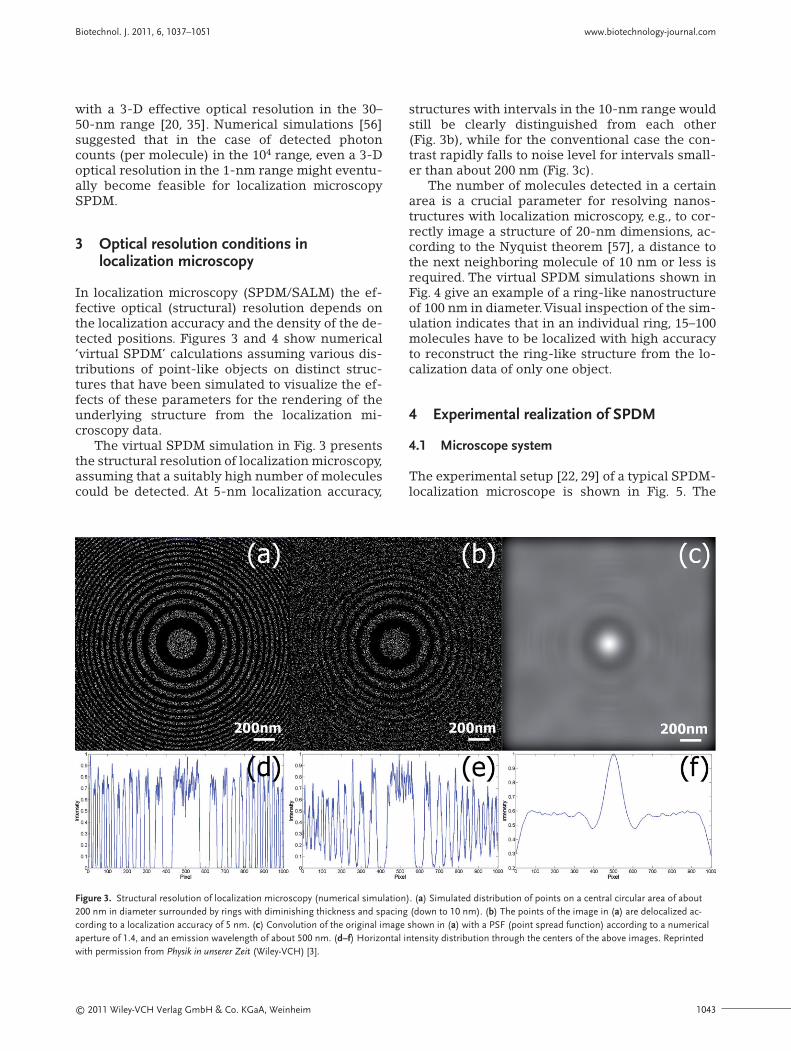
The virtual SPDM simulation in Fig. 3 presentsthe structural resolution of localization microscopy,assuming that a suitably high number of moleculescould be detected. At 5-nm localization accuracy,
structures with intervals in the 10-nm range wouldstill be clearly distinguished from each other(Fig. 3b), while for the conventional case the con-trast rapidly falls to noise level for intervals small-er than about 200 nm (Fig. 3c).
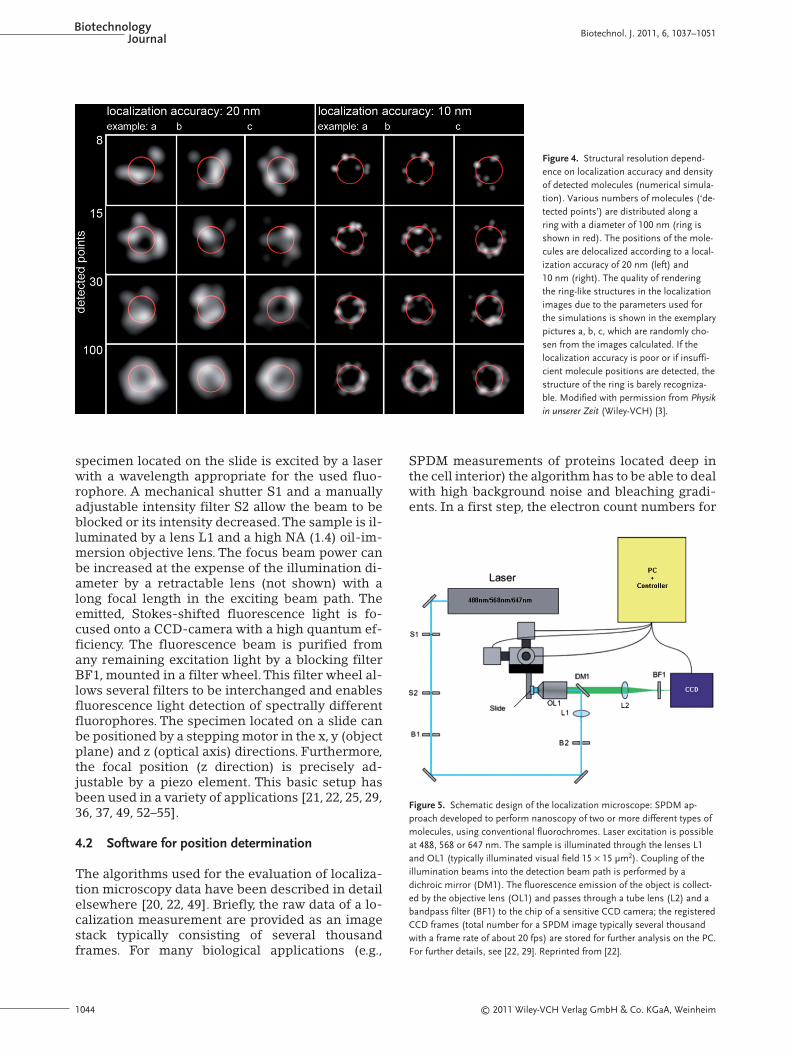
The number of molecules detected in a certainarea is a crucial parameter for resolving nanos-tructures with localization microscopy, e.g., to cor-rectly image a structure of 20-nm dimensions, ac-cording to the Nyquist theorem [57], a distance tothe next neighboring molecule of 10 nm or less isrequired. The virtual SPDM simulations shown inFig. 4 give an example of a ring-like nanostructureof 100 nm in diameter.Visual inspection of the sim-ulation indicates that in an individual ring, 15–100molecules have to be localized with high accuracyto reconstruct the ring-like structure from the lo-calization data of only one object.
4 Experimental realization of SPDM
4.1 Microscope system
The experimental setup [22, 29] of a typical SPDM-localization microscope is shown in Fig. 5. The
Biotechnol. J. 2011, 6, 1037–1051 www.biotechnology-journal.com
Figure 3. Structural resolution of localization microscopy (numerical simulation). (a) Simulated distribution of points on a central circular area of about200 nm in diameter surrounded by rings with diminishing thickness and spacing (down to 10 nm). (b) The points of the image in (a) are delocalized ac-cording to a localization accuracy of 5 nm. (c) Convolution of the original image shown in (a) with a PSF (point spread function) according to a numericalaperture of 1.4, and an emission wavelength of about 500 nm. (d–f) Horizontal intensity distribution through the centers of the above images. Reprintedwith permission from Physik in unserer Zeit (Wiley-VCH) [3].
BiotechnologyJournal Biotechnol. J. 2011, 6, 1037–1051
1044 © 2011 Wiley-VCH Verlag GmbH & Co. KGaA, Weinheim
specimen located on the slide is excited by a laserwith a wavelength appropriate for the used fluo-rophore. A mechanical shutter S1 and a manuallyadjustable intensity filter S2 allow the beam to beblocked or its intensity decreased.The sample is il-luminated by a lens L1 and a high NA (1.4) oil-im-mersion objective lens. The focus beam power canbe increased at the expense of the illumination di-ameter by a retractable lens (not shown) with along focal length in the exciting beam path. Theemitted, Stokes-shifted fluorescence light is fo-cused onto a CCD-camera with a high quantum ef-ficiency. The fluorescence beam is purified fromany remaining excitation light by a blocking filterBF1, mounted in a filter wheel.This filter wheel al-lows several filters to be interchanged and enablesfluorescence light detection of spectrally differentfluorophores. The specimen located on a slide canbe positioned by a stepping motor in the x, y (objectplane) and z (optical axis) directions. Furthermore,the focal position (z direction) is precisely ad-justable by a piezo element. This basic setup hasbeen used in a variety of applications [21, 22, 25, 29,36, 37, 49, 52–55].
4.2 Software for position determination
The algorithms used for the evaluation of localiza-tion microscopy data have been described in detailelsewhere [20, 22, 49]. Briefly, the raw data of a lo-calization measurement are provided as an imagestack typically consisting of several thousandframes. For many biological applications (e.g.,
SPDM measurements of proteins located deep inthe cell interior) the algorithm has to be able to dealwith high background noise and bleaching gradi-ents. In a first step, the electron count numbers for
Figure 4. Structural resolution depend-ence on localization accuracy and densityof detected molecules (numerical simula-tion). Various numbers of molecules (‘de-tected points’) are distributed along aring with a diameter of 100 nm (ring isshown in red). The positions of the mole-cules are delocalized according to a local-ization accuracy of 20 nm (left) and10 nm (right). The quality of renderingthe ring-like structures in the localizationimages due to the parameters used forthe simulations is shown in the exemplarypictures a, b, c, which are randomly cho-sen from the images calculated. If thelocalization accuracy is poor or if insuffi-cient molecule positions are detected, thestructure of the ring is barely recogniza-ble. Modified with permission from Physikin unserer Zeit (Wiley-VCH) [3].
Figure 5. Schematic design of the localization microscope: SPDM ap-proach developed to perform nanoscopy of two or more different types ofmolecules, using conventional fluorochromes. Laser excitation is possibleat 488, 568 or 647 nm. The sample is illuminated through the lenses L1and OL1 (typically illuminated visual field 15 × 15 μm2). Coupling of theillumination beams into the detection beam path is performed by adichroic mirror (DM1). The fluorescence emission of the object is collect-ed by the objective lens (OL1) and passes through a tube lens (L2) and abandpass filter (BF1) to the chip of a sensitive CCD camera; the registeredCCD frames (total number for a SPDM image typically several thousandwith a frame rate of about 20 fps) are stored for further analysis on the PC.For further details, see [22, 29]. Reprinted from [22].
© 2011 Wiley-VCH Verlag GmbH & Co. KGaA, Weinheim 1045
each pixel in each image of the data stack are con-verted into the corresponding photon numbers. Fordata providing a high background noise, a differen-tial image stack is calculated by subtracting thesucceeding from the preceding frame. After thistransformation, only signals changing between twoframes remain in the image stack. This offers thepossibility to select only signals (short flashes offluorescent light) from individual molecules. Underthe experimental conditions used in the SPDMmeasurements reported here (SPDMPhymod type),the signals originating from the fluorescent pro-teins or the organic dyes used were well separatedin time and hence the overlap of the diffraction pat-terns of single molecules was low. In the case of or-ganic dyes, a larger amount of “repetitive blinking”[28] occurred. For geometrical reasons, overlap ofsignals originating from two different adjacentmolecules results in an intermediate position as-signment; repetitive blinking of the same moleculemay result in multiple position assignmentsaround an average position [19]. Both effects maycontribute to a deterioration of the structural reso-lution. The SPDM examples presented below indi-cate that, in spite of these effects, a nanostructuralresolution many times beyond the conventionallimits can be obtained.
Noise was reduced by bandpass filtering of thedata, and each image frame was deconvolved by aCLEAN algorithm to estimate the individual mole-cule positions [58].
The lateral positions of the detected moleculeswere determined by fitting a model function to thesegmented signals. We applied a 2-D Gaussianfunction with a linear estimation of the backgroundnoise:
where p1, p2 and p3 denote the peak intensity (p1)and x,y position (p2,p3), respectively, and p1, p4–p8are appropriate adaptation parameters. Optimiza-tion was obtained by a Levenberg-Marquardt fit-ting algorithm.
The output file of this fitting procedure containsthe position and localization accuracy of each de-tected molecule and additional information, e.g.,anisotropy of the signal. By an appropriate param-eter setting, signals deriving from molecules aboveor below the object plane (± 300 nm) can be elimi-nated, resulting in an ‘optical section’ of about600-nm thickness [53].
f x y px p
py p
p( , ) exp
( ) ( )= ⋅ − − + −⎛⎝⎜
⎞⎠⎟1
22
42
32
522 2
⎡⎡
⎣⎢⎢
⎤
⎦⎥⎥
+ + ⋅ − + ⋅ −p p x p p y p6 7 2 8 3( ) ( )
5 Application examples
In Figs. 6–8, some typical experimental results forthe application of localization microscopy (SPDM)with physically modified fluorophores to elucidatebiological nanostructures are presented. All the2-D SPDM images were obtained with a localiza-tion microscope of the type shown in Fig. 5; in onecase, 2-D SPDM was combined with structured il-lumination using an SPDM-type system extendedto allow spatially modulated illumination as de-scribed in detail elsewhere [20, 24, 35, 49]. In ourexperience, the fluorophores cited and the speci-mens used can now be applied on a routine basis.At present, new fluorophores for this SPDMmethod are selected by trial and error, and the illu-mination conditions are determined experimental-ly. Typically, it only takes a limited time to solvethese problems sufficiently to start SPDM experi-ments. Typically, the standard embedding mediumProLong® Gold [25] was used as a buffer to en-hance stochastic ‘blinking’.
5.1 SPDM of nuclear nanostructures
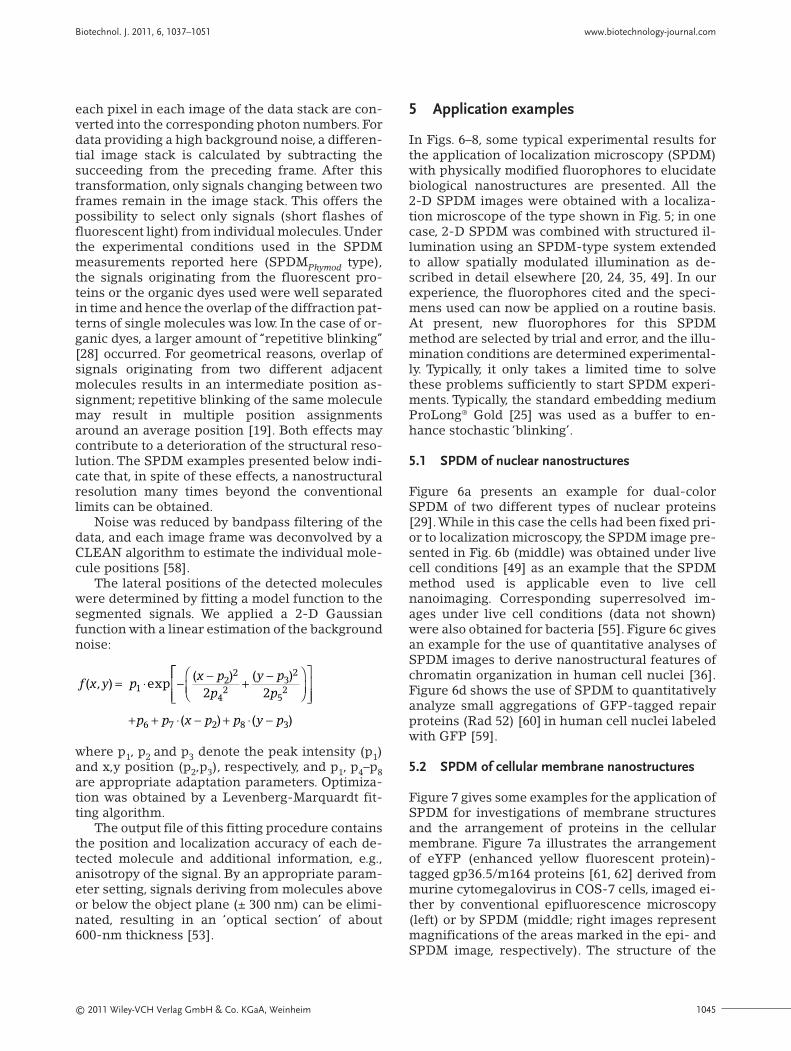
Figure 6a presents an example for dual-colorSPDM of two different types of nuclear proteins[29].While in this case the cells had been fixed pri-or to localization microscopy, the SPDM image pre-sented in Fig. 6b (middle) was obtained under livecell conditions [49] as an example that the SPDMmethod used is applicable even to live cellnanoimaging. Corresponding superresolved im-ages under live cell conditions (data not shown)were also obtained for bacteria [55]. Figure 6c givesan example for the use of quantitative analyses ofSPDM images to derive nanostructural features ofchromatin organization in human cell nuclei [36].Figure 6d shows the use of SPDM to quantitativelyanalyze small aggregations of GFP-tagged repairproteins (Rad 52) [60] in human cell nuclei labeledwith GFP [59].
5.2 SPDM of cellular membrane nanostructures
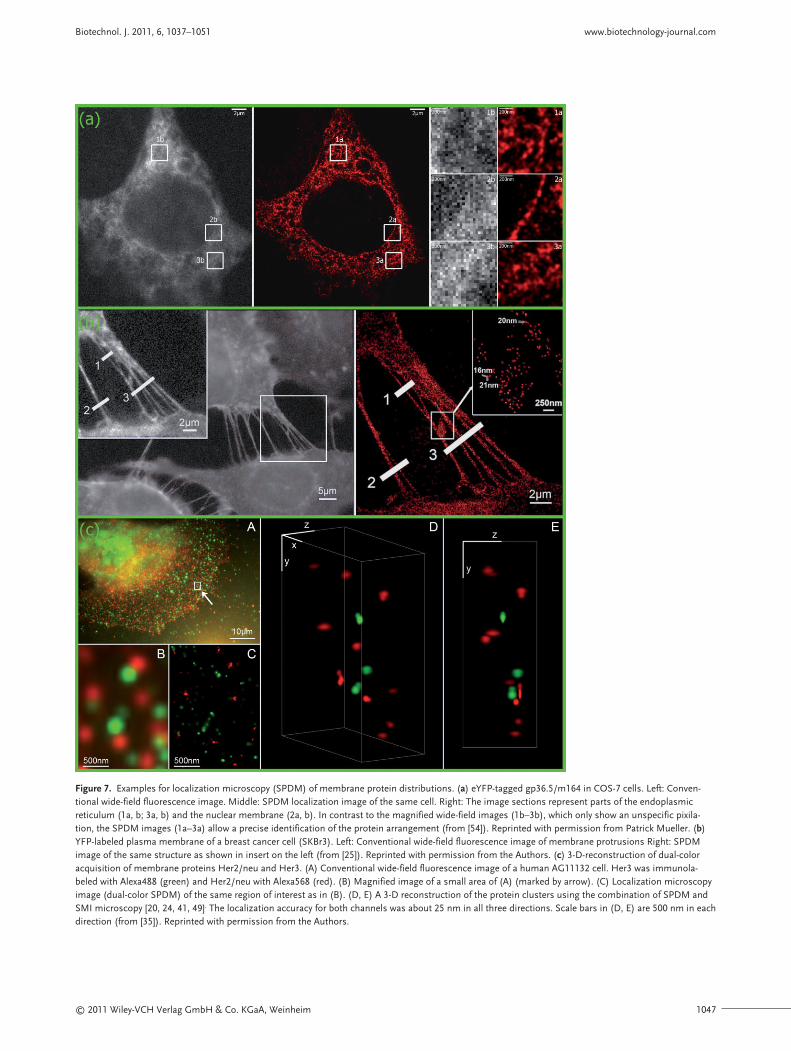
Figure 7 gives some examples for the application ofSPDM for investigations of membrane structuresand the arrangement of proteins in the cellularmembrane. Figure 7a illustrates the arrangementof eYFP (enhanced yellow fluorescent protein)-tagged gp36.5/m164 proteins [61, 62] derived frommurine cytomegalovirus in COS-7 cells, imaged ei-ther by conventional epifluorescence microscopy(left) or by SPDM (middle; right images representmagnifications of the areas marked in the epi- andSPDM image, respectively). The structure of the
Biotechnol. J. 2011, 6, 1037–1051 www.biotechnology-journal.com
BiotechnologyJournal Biotechnol. J. 2011, 6, 1037–1051
1046 © 2011 Wiley-VCH Verlag GmbH & Co. KGaA, Weinheim
Figure 6. SPDM/localization microscopy of nanostructures in human cell nuclei. (a) Dual-color localization microscopy of histones and chromatin remod-eling proteins. Left: Conventional wide-field fluorescence image of H2A proteins (red) and Snf2H proteins (green) in a human U2OS nucleus. Right: Local-ization microscopy (SPDM) of the same nucleus; about 120 000 proteins were counted and localized in an optical section of ~600-nm axial thickness (from[29]). (b) Localization microscopy of histones H2B labeled with GFP in HeLa cell nuclei. Left: Conventional wide-field fluorescence image of a nucleusunder live cell conditions. Middle: Localization microscopy (SPDM) of the same cell under live cell conditions. About 11 000 individual GFP moleculeswere localized in this region [49] Right: SPDM image of histones H2B in a nucleus of a fixed cell. About 16 000 GFP molecules were detected (from [49]).Reprinted with permission from Paul Lemmer. (c) Statistical analyses of the distribution of GFP-labeled histone H2B in human fibroblast cells and two dif-ferent strains I, II of HeLa cells [36]. Visualized local densities of H2B from SPDM measurements for a fibroblast cell (A) and a HeLa cell of strain I (B).Shown are the densities of blocks of linear dimension b = 500 nm. They display strong deviations from a random distribution, indicating that structure inthe histone distribution exists on that scale. (C) Block density distributions, for different values of block size b = 200 nm (squares), b = 500 nm (circles),and b = 1000 nm (triangles). Data are scaled with the average density, to make the distribution independent of labeling efficiency. (D) The cumulants Ub ofthe density distribution. For a thermodynamically equilibrated system, cumulants should display a value of zero (dashed line) above a block size b largerthan the scale of density fluctuations. (E) Nanostructure of nuclear histone distribution. The g(r) values calculated reveal distinct differences from a ran-dom distribution [i.e., g(r) = 1], highlighting the existence of distinct structures on the scale below 100 nm. Structural hallmarks are found for HeLa as wellas fibroblasts independent of labeling methods, but quantitative differences exist. The gray horizontal line corresponds to the (normalized) average densi-ty, i.e., a random spatial distribution of histones. Reprinted with permission from Elsevier [36]. (d) Localization microscopy (SPDM) of double-strandbreak-repair complex proteins Rad 52 labeled with GFP in a retina pigment epithelium cell (RPE1). Left: Conventional wide-field fluorescence image.Middle: SPDM image. Right: Line scans through conventional wide-field image (blue, FWHM ~310 nm) and through SPDM localization microscopy image(red, FWHM ~100 nm).For methodological details of labeling and specimen preparation see [59]. Reprinted with permission from Helmut Strickfaden.
© 2011 Wiley-VCH Verlag GmbH & Co. KGaA, Weinheim 1047
Biotechnol. J. 2011, 6, 1037–1051 www.biotechnology-journal.com
Figure 7. Examples for localization microscopy (SPDM) of membrane protein distributions. (a) eYFP-tagged gp36.5/m164 in COS-7 cells. Left: Conven-tional wide-field fluorescence image. Middle: SPDM localization image of the same cell. Right: The image sections represent parts of the endoplasmicreticulum (1a, b; 3a, b) and the nuclear membrane (2a, b). In contrast to the magnified wide-field images (1b–3b), which only show an unspecific pixila-tion, the SPDM images (1a–3a) allow a precise identification of the protein arrangement (from [54]). Reprinted with permission from Patrick Mueller. (b)YFP-labeled plasma membrane of a breast cancer cell (SKBr3). Left: Conventional wide-field fluorescence image of membrane protrusions Right: SPDMimage of the same structure as shown in insert on the left (from [25]). Reprinted with permission from the Authors. (c) 3-D-reconstruction of dual-coloracquisition of membrane proteins Her2/neu and Her3. (A) Conventional wide-field fluorescence image of a human AG11132 cell. Her3 was immunola-beled with Alexa488 (green) and Her2/neu with Alexa568 (red). (B) Magnified image of a small area of (A) (marked by arrow). (C) Localization microscopyimage (dual-color SPDM) of the same region of interest as in (B). (D, E) A 3-D reconstruction of the protein clusters using the combination of SPDM andSMI microscopy [20, 24, 41, 49]. The localization accuracy for both channels was about 25 nm in all three directions. Scale bars in (D, E) are 500 nm in eachdirection (from [35]). Reprinted with permission from the Authors.
BiotechnologyJournal Biotechnol. J. 2011, 6, 1037–1051
1048 © 2011 Wiley-VCH Verlag GmbH & Co. KGaA, Weinheim
plasma membrane of breast cancer cells was stud-ied by SPDM using YFP as a membrane marker(Fig. 7b). Individual YFP-tagged membrane pro-teins in a distance down to the 15–20-nm range arehighlighted. Figure 7c shows a 2-D (x,y, left, D) anda 3-D (x,y,z) dual-color SPDM image (D, E) of thespatial distribution of two different membrane pro-teins (Her2/neu and Her3) immunolabeled withfluorophores Alexa568 and Alexa488. To allow a 3-D reconstruction of the protein clusters, a combi-nation [20, 24, 35, 49]of SPDM and a special methodof structured illumination, SMI microscopy [41],was used.
5.3 SPDM of viruses
A further example for the use of localization mi-croscopy/SPDM is an analysis of Tobacco mosaicvirus (TMV) particles. TMV particles are not onlyimportant in plant research but are also an exam-ple for a class of most promising biomolecule com-plexes exhibiting a high potential for nanotechnol-ogy applications.
The TMV is a robust, self-assembling tube-shaped plant virus of 300-nm natural length and
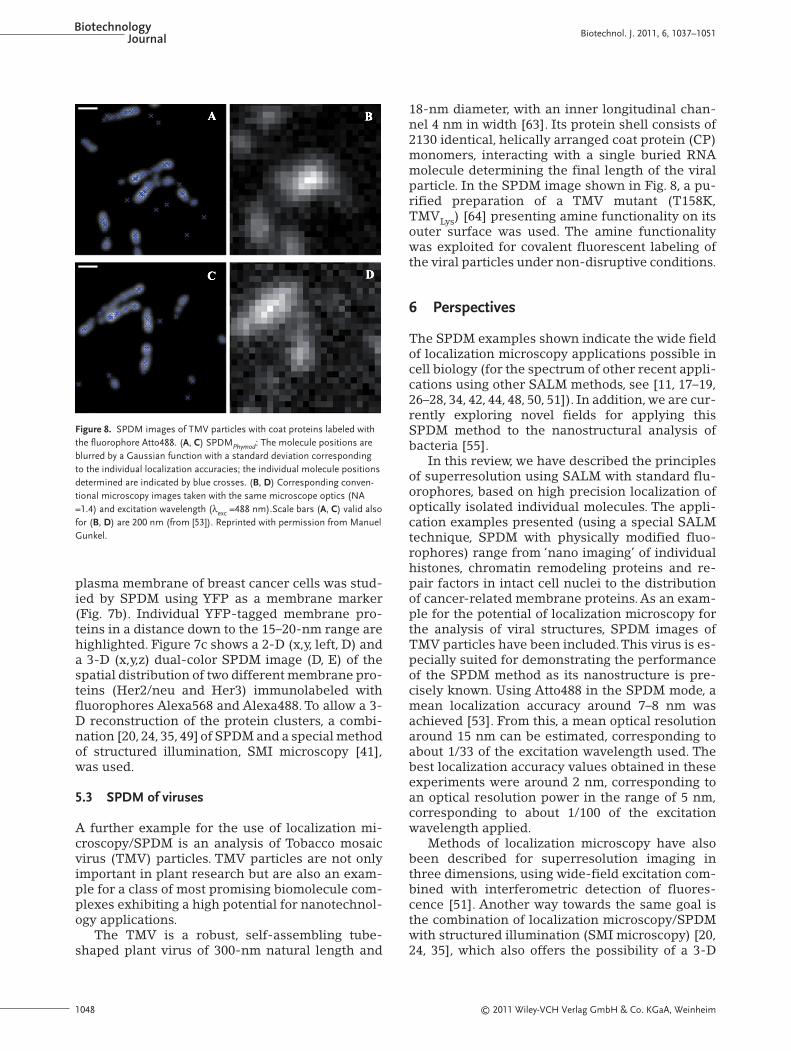
18-nm diameter, with an inner longitudinal chan-nel 4 nm in width [63]. Its protein shell consists of2130 identical, helically arranged coat protein (CP)monomers, interacting with a single buried RNAmolecule determining the final length of the viralparticle. In the SPDM image shown in Fig. 8, a pu-rified preparation of a TMV mutant (T158K,TMVLys) [64] presenting amine functionality on itsouter surface was used. The amine functionalitywas exploited for covalent fluorescent labeling ofthe viral particles under non-disruptive conditions.
6 Perspectives
The SPDM examples shown indicate the wide fieldof localization microscopy applications possible incell biology (for the spectrum of other recent appli-cations using other SALM methods, see [11, 17–19,26–28, 34, 42, 44, 48, 50, 51]). In addition, we are cur-rently exploring novel fields for applying thisSPDM method to the nanostructural analysis ofbacteria [55].
In this review, we have described the principlesof superresolution using SALM with standard flu-orophores, based on high precision localization ofoptically isolated individual molecules. The appli-cation examples presented (using a special SALMtechnique, SPDM with physically modified fluo-rophores) range from ‘nano imaging’ of individualhistones, chromatin remodeling proteins and re-pair factors in intact cell nuclei to the distributionof cancer-related membrane proteins. As an exam-ple for the potential of localization microscopy forthe analysis of viral structures, SPDM images ofTMV particles have been included.This virus is es-pecially suited for demonstrating the performanceof the SPDM method as its nanostructure is pre-cisely known. Using Atto488 in the SPDM mode, amean localization accuracy around 7–8 nm wasachieved [53]. From this, a mean optical resolutionaround 15 nm can be estimated, corresponding toabout 1/33 of the excitation wavelength used. Thebest localization accuracy values obtained in theseexperiments were around 2 nm, corresponding toan optical resolution power in the range of 5 nm,corresponding to about 1/100 of the excitationwavelength applied.
Methods of localization microscopy have alsobeen described for superresolution imaging inthree dimensions, using wide-field excitation com-bined with interferometric detection of fluores-cence [51]. Another way towards the same goal isthe combination of localization microscopy/SPDMwith structured illumination (SMI microscopy) [20,24, 35], which also offers the possibility of a 3-D
Figure 8. SPDM images of TMV particles with coat proteins labeled withthe fluorophore Atto488. (A, C) SPDMPhymod: The molecule positions areblurred by a Gaussian function with a standard deviation correspondingto the individual localization accuracies; the individual molecule positionsdetermined are indicated by blue crosses. (B, D) Corresponding conven-tional microscopy images taken with the same microscope optics (NA=1.4) and excitation wavelength (λexc =488 nm).Scale bars (A, C) valid alsofor (B, D) are 200 nm (from [53]). Reprinted with permission from ManuelGunkel.
© 2011 Wiley-VCH Verlag GmbH & Co. KGaA, Weinheim 1049
resolution far beyond the conventional resolutionlimit. To summarize, light-optical nanoscopy tech-niques like the SALM approaches described hereopen an avenue towards a highly improved under-standing of biological nanostructures even on the3-D scale, from viruses and bacteria to the highlyorganized system of life processes on the singlecell/single intracellular nanostructure level withprofound implications also for medical applica-tions and drug development, as well as for tech-niques using nanostructured biomaterials.
The potential of localization microscopy for sin-gle molecule or molecule complex analysis enablesnovel perspectives for many biophotonic applica-tions on the single-cell level, e.g., analyses of pro-tein distributions in different types of cells (e.g.,cancerous vs. normal cells) and the combination of3-D superresolution and single-molecule statistics[35]; high precision monitoring of specific gene ex-pression [63, 64]; counting and even structuralanalysis of virus particles inside and outside cells;counting of drug molecules present, e.g., in specif-ic regions across the cellular membrane, or in oth-er cellular compartments; or nanostructure analy-sis of epigenetically relevant small chromatin re-gions in cell nuclei identified by fluorescence insitu hybridization (FISH) [46, 52]. The spectrum offluorophores suitable for SPDM and related meth-ods of localization microscopy is very broad. It in-cludes fluorescent proteins, like GFP (both stan-dard and photoactivatable),YFP, mRFP, etc. [20, 29],fluorochromes like Cy3/Cy5 [19, 27], and also Alexa[21, 25, 27, 52] and Atto dyes [26, 27]. It even hasbeen shown that SPDM can be used for imagingautofluorescent structures below the conventionalresolution limit of label-free cells [30, 37].
In recent localization microscopy experimentsunder optimal optical conditions, it has been shownthat single molecules can be localized by far-fieldlight microscopy down to the sub-nanometer level,and that even molecules within a distance in the1-nm range can be optically isolated from each oth-er [42]. This suggests that eventually an effectiveoptical resolution even of cellular nanostructuresin the 1-nm region will become feasible, offeringlight microscopical nanostructural analysis of indi-vidual large biomolecules and biocomplexes in theintact cell.
To summarize, it is anticipated that SPDM/lo-calization microscopy and other novel develop-ments in laser optical nanoscopy will eventuallybridge the gap in resolution between ultrastructur-al methods (nm resolution) and conventional lightmicroscopy (resolution of about 200 nm) in such away that the same cellular structure can be imagedand quantitatively analyzed at molecular resolu-
tion[65].This will provide an essential contributionto a direct insight into the spatial basis of the fun-damental mechanisms of life on the individual celllevel.
In the development of the localization light mi-croscopy/SPDM approaches outlined above at theKirchhoff Institute for Physics numerous graduates,postgraduates, research staff, and other partnershave contributed, who are warmly thanked here (seewww.kip.uni-heidelberg.de). Most of the researchwas supported by grants of the University Heidelberg(Frontier Projects); the Land Baden-Württemberg /Landesstiftung Baden-Württemberg; the DeutscheForschungsgemeinschaft (DFG); and the EuropeanUnion to Christoph Cremer; some of the biologicalapplications were also supported by the Federal Ger-man Ministry for Education and Science (BMBF)(Services@MediGRID) to Michael Hausmann. Wethank Prof. Holger Jeske for generous support of theTMV-based experiments.
The authors have declared no conflict of interest.
7 References
[1] Abbe, E., Beiträge zur Theorie des Mikroskops und dermikroskopischen Wahrnehmung. Arch. Mikrosk. Anat. 1873,9, 413–418.
[2] Rayleigh, L., On the theory of optical images, with specialreference to the microscope. Philos. Magazine 1896, 42,167–195.
[3] Cremer, C., Lichtmikroskopie unterhalb des Abbe-Limits(Light microscopy beyond the Abbe Limit). Physik in Un-serer Zeit 2011, 42, 21–29.
[4] Heintzmann, R., Cremer, C., Laterally modulated excitationmicroscopy: improvement of resolution by using a diffrac-tion grating. Proc SPIE 1999, 3568.
[5] Gustafsson, M. G. L., Surpassing the lateral resolution limitby a factor of two using structured illumination microscopy.J. Microsc. 2000, 198, 82–87.
[6] Hell, S.W.,Wichmann, J., Breaking the diffraction resolutionlimit by stimulated emission: Stimulated-emission-deple-tion fluorescence microscopy. Opt. Lett. 1994, 19, 780–782.
[7] Burns, D., Callis, J., Christian, G., Davidson, E., Strategies forattaining superresolution using spectroscopic data as con-straints. Appl. Opt. 1985, 24, 154–161.
[8] Betzig, E., Proposed method for molecular optical imaging.Opt. Lett. 1995, 20, 237–239.
[9] Bornfleth, H., Sätzler, Eils, C., Cremer, C., High-precisiondistance measurements and volume-conserving segmenta-tion of objects near and below the resolution limit in three-dimensional confocal fluorescence microscopy. J. Microsc.1998, 189, 118–136.
[10] Cremer, C., Edelmann, P., Bornfleth, H., Kreth, G. et al., Prin-ciples of spectral precision distance confocal microscopy forthe analysis of molecular nuclear structure, in: Jähne, B.,Haußecker, H., Geissler, P. (Eds.), Handbook of Computer Vi-
Biotechnol. J. 2011, 6, 1037–1051 www.biotechnology-journal.com
BiotechnologyJournal Biotechnol. J. 2011, 6, 1037–1051
1050 © 2011 Wiley-VCH Verlag GmbH & Co. KGaA, Weinheim
sion and Applications, Academic Press, San Diego 1999, pp.839–857.
[11] Egner, A., Geisler, C., von Middendorff, C., Bock, H. et al.,Fluorescence nanoscopy in whole cells by asynchronous lo-calization of photoswitching emitters. Biophys. J. 2007, 93,3285–3290.
[12] Lacoste,T. D., Michalet, X., Pinaud, F., Chemla, D. S. et al., Ul-trahigh-resolution multicolor colocalization of single fluo-rescent probes. Proc. Natl. Acad. Sci. USA 2000, 97,9461–9466.
[13] Van Oijen, A., Köhler, J., Schmidt, J., Müller, M., 3-Dimen-sional super-resolution by spectrally selective imaging.Chem. Phys. Lett. 1998, 292, 183–187.
[14] Cremer, C., Hausmann, M., Bradl, J., Rinke, B.,Verfahren zurmultispektralen Präzisionsdistanzmessung in biologischenMikroobjekten (Method for multispectral precision dis-tance measurements in biological microobjects). GermanPatent application No. 196.54. 824.1/DE, submitted Dec 23,1996. US Patent 6,424,421, 20.12.1997.
[15] Cremer, C., Failla, A., Albrecht, B., Far field light microscop-ical method, system and computer product for analysing atleast one object having a subwavelength size. US Patent7,298,461 B2, 20.11.2007 (filed Oct 9, 2001).
[16] Lidke, K. A., Rieger, B., Jovin, T. M., Heintzmann, R., Super-resolution by localization of quantum dots using blinkingstatistics. Opt. Express 2005, 13, 7052–7062.
[17] Betzig, E., Patterson, G. H., Sougrat, R., Lindwasser, O. W. etal., Imaging intracellular fluorescent proteins at nanometerresolution. Science 2006, 313, 1642–1645.
[18] Hess, S. T., Girirajan, T. P. K., Mason, M. D., Ultra-high reso-lution imaging by fluorescence photoactivation localizationmicroscopy. Biophys. J. 2006, 91, 4258–4272.
[19] Rust, M. J., Bates, M., Zhuang, X., Sub-diffraction-limit im-aging by stochastic optical reconstruction microscopy(STORM). Nat. Methods 2006, 3, 793–795.
[20] Lemmer, P., Gunkel, M., Baddeley, D., Kaufmann, R. et al.,SPDM: light microscopy with single-molecule resolution atthe nanoscale. Appl. Phys. B 2008, 93, 1–12.
[21] Reymann, J., Baddeley, D., Gunkel, M., Lemmer, P. et al.,High-precision structural analysis of subnuclear complex-es in fixed and live cells via spatially modulated illumina-tion (SMI) microscopy. Chromosome Res. 2008, 16, 367–382.
[22] Kaufmann, R., Lemmer, P., Gunkel, M., Weiland, Y. et al.,SPDM: single molecule superresolution of cellular nanos-tructures. Proc. SPIE 2009, 7185, 71850J.
[23] Sinnecker, D., Voigt, P., Hellwig, N., Schaefer, M., Reversiblephotobleaching of enhanced green fluorescent proteins.Biochemistry 2005, 44, 7085–7094.
[24] Cremer, C., Ketteler,A. v., Lemmer, P., Kaufmann, R. et al., Farfield fluorescence microscopy of cellular structures at mo-lecular resolution, in: Diaspro, A. (Ed.), MultidimensionalOptical Fluorescence Microscopy and Nanoscopy, Taylor &Francis, London 2010, pp. 3/1–3/35.
[25] Lemmer, P., Gunkel, M., Weiland, Y., Müller, P. et al., Usingconventional fluorescent markers for far-field fluorescencelocalization nanoscopy allows resolution in the 10-nmrange. J. Microsc. 2009, 235, 163–171.
[26] Fölling, J., Bossi, M. L., Bock, H., Medda, R. et al., Fluores-cence nanoscopy by ground-state depletion and single-molecule return. Nat. Methods 2008, 5, 943–945.
[27] Heilemann, M., van de Linde, S., Schüttpelz, M., Kasper, R.et al., Subdiffraction-resolution fluorescence imaging withconventional fluorescent probes. Angew. Chem. Int. Ed. Engl.2008, 47, 6172–6176.
[28] Baddeley, D., Jayasinghe, I. D., Cremer, C., Cannell, M. B.,Soeller, C., Light-induced dark states of organic flu-ochromes enable 30 nm resolution imaging in standard me-dia. Biophys. J. 2009, 96, L22–24.
[29] Gunkel, M., Erdel, F., Rippe, K., Lemmer, P. et al., Dual colorlocalization microscopy of cellular nanostructures. Biotech-nol. J. 2009, 4, 927–938.
[30] Baddeley, D., Crossman, D., Rossberger, S., Cheyne, J. E. et al.,4D Super-resolution microscopy with conventional fluo-rophores and single wavelength excitation in optically thickcells and tissues,. PLoS ONE 2011, 6.
[31] Hell, S. W., Microscopy and its focal switch. Nat. Methods2009, 6, 24–32.
[32] Hell, S. W., Kroug, M., Ground-state depletion fluorescencemicroscopy, a concept for breaking the diffraction resolu-tion limit. Appl. Phys. B 1995, 60, 495–497.
[33] Markaki, Y., Gunkel, M., Schermelleh, L., Beichmanis, S. etal., Functional nuclear organization of transcription andDNA replication: A topographical marriage between chro-matin domains and the interchromatin compartment. ColdSpring Harbor Symp. Quant. Biol. 2011, 75, 1–18.
[34] Baddeley, D., Cannell, M. B., Soeller, C., Visualization of lo-calization microscopy data. Microsc. Microanal. 2010, 16,64–72.
[35] Kaufmann, R., Müller, P., Hildenbrand, G., Hausmann, M.,Cremer, C., Analysis of Her2/neu membrane protein clus-ters in different types of breast cancer cells using localiza-tion microscopy. J. Microsc. 2011, 242, 46–54.
[36] Bohn, M., Diesinger, P., Kaufmann, R., Weiland, Y. et al., Lo-calization microscopy reveals expression-dependent pa-rameters of chromatin nanostructure. Biophys. J. 2010, 99,1358–1367.
Christoph Cremer studied Physics and
Biophysics/Genetics at the University
of Freiburg and Munich, Germany. He
performed research at the University of
Freiburg (Institute of Human Genet-
ics), and Lawrence Livermore National
Laboratory, California (Biomedical Sci-
ences Division). Since 1983 Christoph
Cremer is Professor for Applied Optics
and Information Processing at the
Kirchhoff-Institute of Physics, and since 2004 Director of Biophysics of
Genome Structure, Institute of Pharmacy and Molecular Biotechnolo-
gy, Heidelberg University, Germany; from 2006–2009 he was Second
Speaker of the Senate of Heidelberg University. Since 2002 he has
been an Adjunct Senior Staff Scientist, at the Jackson Laboratory, Bar
Harbor,Maine and as of 1 August 2011, Head of Lightoptical
Nanoscopy, Institute of Molecular Biology in Mainz, Germany. His re-
search ranges from establishment of chromosome-specific DNA li-
braries, to the development of laser-UV-microirradiation methods, as
well as contributions to the development of CLSM and other types of
advanced light microscopy, i.e., 4Pi microscopy, structured illumina-
tion, localization microscopy, and their applications in cell biology, in
particular to the biophysics of genome structure and functional nu-
clear organization; radiation biophysics; biocomputing of nuclear
genome structures.
© 2011 Wiley-VCH Verlag GmbH & Co. KGaA, Weinheim 1051
[37] Kaufmann, R., Müller, P., Hausmann, M., Cremer, C., Imag-ing label-free intracellular structures by localisation mi-croscopy. Micron 2011, 42, 348–352.
[38] Esa, A., Edelmann, P., Kreth, G., Trakhtenbrot, L. et al., 3D-spectral precision distance microscopy (SPDM) of chro-matin nanostructures after triple-colour labeling: a study ofthe BCR region on chromosome 22 and the Philadelphiachromosome. J. Microsc. 2000, 199, 96–105.
[39] Esa, A., Coleman, A. E., Edelmann, P., Silva, S. et al., Confor-mational differences in the 3-D nanostructure of the im-munoglobulin heavy-chain locus, a hotspot of chromosomaltranslocations in B lymphocytes. Cancer Genet. Cytogenet.2001, 127, 168–173.
[40] Heintzmann, R., Münch, H., Crermer, C., High-precision dis-tance measurements in epifluorescent microscopy – Simu-lation and experiment. Cell Vision 1997, 4, 352–353.
[41] Baddeley, D., Batram, C., Weiland, Y., Cremer, C., Birk, U. J.,Nanostructure analysis using spatially modulated illumina-tion microscopy. Nat. Protoc. 2007, 2, 2640–2646.
[42] Pertsinidis,A., Zhang,Y., Chu, S., Subnanometre single-mol-ecule localization, registration and distance measurements.Nature 2010, 466, 647–651.
[43] Rauch, J., Hausmann, M., Solovei, I., Horsthemke, B. et al.,Measurement of local chromatin compaction by spectralprecision distance microscopy. Proc. SPIE 2000, 4164, 1–9.
[44] Hüve, J., Wesselmann, R., Kahms, M., Peters, R., 4Pi mi-croscopy of the nuclear pore complex. Biophys. J. 2008, 95,877–885.
[45] Rauch, J., Knoch, T. A., Solovei, I., Teller, K. et al., Light opti-cal precision measurements of the active and inactive Prad-er-Willi syndrome imprinted regions in human cell nuclei.Differentiation 2008, 76, 66–82.
[46] Tykocinski, L.-O., Sinemus, A., Rezavandy, E., Weiland, Y. etal., Epigenetic regulation of promiscuous gene expressionin thymic medullary epithelial cells. Proc. Natl. Acad. Sci.USA 2010, 107, 19426–19431.
[47] Heilemann, M., Herten, D. P., Heintzmann, R., Cremer, C. etal., High-resolution colocalization of single dye moleculesby fluorescence lifetime imaging microscopy. Anal. Chem.2002, 74, 3511–3517.
[48] Geisler, C., Schönle, A., von Middendorff, C., Bock, H. et al.,Resolution of λ/10 in fluorescence microscopy using fastsingle molecule photo-switching. Appl. Phys. A 2007, 88,223–226.
[49] Lemmer, P., Lichtmikroskopische Untersuchungen konven-tionell markierter Präparate weit unterhalb der Beugungs-grenze. PhD-Thesis, Universität Heidelberg 2009.
[50] Steinhauer, C., Forthmann, C., Vogelsang, J., Tinnefeld, P.,Superresolution microscopy on the basis of engineereddark states. J. Am. Chem. Soc. 2008, 130, 16840–16841.
[51] Shtengel, G., Galbraith, J. A., Galbraith, C. G., Lippincott-Schwartz, J. et al., Interferometric fluorescent super-resolu-
tion microscopy resolves 3D cellular ultrastructure. Proc.Natl. Acad. Sci. USA 2009, 106, 3125–3130
[52] Weiland, Y., P.Lemmer, C.Cremer, Combining FISH with lo-calisation microscopy: Superresolution imaging of nucleargenome nanostructures. Chromosome Res. 2011, 19, 5–23.
[53] Gunkel, M., Lokalisationsmikroskopie mit mehreren Far-ben und ihre Anwendung in biologischen Präparaten. PhD-Thesis, Universität Bielefeld 2011.
[54] Müller, P., Molekularbiologische Analyse von Her2/neu-Nanostrukturen in unterschiedlichen Brustkrebszelllinienauf Gen- und Proteinebene basierend auf hochaufgelöstenfluoreszenzmikroskopischen Darstellungen. PhD-Thesis,Universität Heidelberg 2010.
[55] Ruckelshausen,T., Lichtoptische Nanoskopie von Biostruk-turen mit fokussierter, strukturierter und homogenerBeleuchtung. PhD-Thesis, Universität Heidelberg 2011.
[56] Albrecht, B., Failla, A.V., Schweitzer, A., Cremer, C., Spatial-ly modulated illumination microscopy allows axial distanceresolution in the nanometer range. Appl. Opt. 2002, 41,80–87.
[57] Shannon, C. E., Communication in the presence of noise.Proc. Inst. Radio. Eng. 1949, 37, 10–21.
[58] Högbom, J.,Aperture synthesis with a non-regular distribu-tion of interferometer baselines. Astron. Astrophys. Suppl.Ser. 1974, 15, 417–426.
[59] Strickfaden, H., Nuclear architecture explored by live-cellfluorescence microscopy using laser and ion microbeam ir-radiation. PhD-Thesis, Universität München 2010.
[60] Lisby, M., Rothstein, R., Mortensen, U., Rad52 forms DNArepair and recombination centers during S-phase.x. Proc.Natl. Acad. Sci. USA 2001, 98, 8276–8281.
[61] Däubner,T., Fink,A., Seitz,A.,Tenzer, S. et al.,A novel trans-membrane domain mediating retention of a highly motileherpesvirus glycoprotein in the endoplasmic reticulum. J.Gen.Virol. 2010, 91, 1524–1534.
[62] Holtappels, R.,Thomas, D., Podlech, J., Reddehase, M. J.,Twoantigenic peptides from genes m123 and m164 of murinecytomegalovirus quantitatively dominate CD8 T-cell memo-ry in the H-2d haplotype. J.Virol. 2002, 76, 151–164.
[63] Lewandowski, D., Genus Tobamovirus, in: Fauquet, C. M.,Mayo, M. A., Maniloff, J., Desselberger, U., Ball, L. A. (Eds.),Virus Taxonomy.VIIIth Report of the International Committeeon Taxonomy of Viruses, Elsevier/Academic Press, London2005, pp. 1009–1014.
[64] Geiger, F., Tabakmosaikvirus-Hüllproteinvarianten alsBausteine für die Nano- und Arraytechnologie. PhD-The-sis, Universität Stuttgart 2010.
[65] Rouquette, J., Cremer, C., Cremer, T., Fakan, S., Functionalnuclear architecture studied by microscopy. Int. Rev. CellMol. Biol. 2010, 282, 1–90.
Biotechnol. J. 2011, 6, 1037–1051 www.biotechnology-journal.com
Related Documents