Mon. Not. R. Astron. Soc. 000, 1–10 (2007) Printed 5 June 2007 (MN L A T E X style file v2.2) Superorbital variability of X-ray and radio emission of Cyg X-1. I. Emission anisotropy of precessing sources Askar Ibragimov, 1,2 Andrzej A. Zdziarski 3 and Juri Poutanen 1 1 Astronomy Division, PO Box 3000, FIN-90014 University of Oulu, Finland 2 Kazan State University, Astronomy Department, Kremlyovskaya 18, 420008 Kazan, Russia 3 Centrum Astronomiczne im. M. Kopernika, Bartycka 18, 00-716 Warszawa, Poland 5 June 2007 ABSTRACT We study theoretical interpretations of the ∼ 150-d (superorbital) modulation observed in X- ray and radio emission of Cyg X-1 in the framework of models connecting this phenomenon to precession. Precession changes the orientation of the emission source (either disc or jet) relative to the observer. This leads to emission modulation due to an anisotropic emission pattern of the source or orientation-dependent amount of absorbing medium along the line of sight or both. We consider, in particular, anisotropy patterns of blackbody-type emission, ther- mal Comptonization in slab geometry, jet/outflow beaming, and absorption in a coronal-type medium above the disc. We then fit these models to the data from the RXTE All Sky Monitor, CGRO BATSE, and the Ryle and Green Bank radio telescopes, and find relatively small best- fit angles between the precession and orbital planes, ∼ 10 ◦ –20 ◦ . The thermal Comptonization model for the X-ray emission explains well the observed decrease of the variability amplitude from 1 to 300 keV as a result of a reduced anisotropy of the emission due to multiple scat- terings. Our modeling also yield the jet bulk velocity of ∼ (0.3–0.5)c, which is in agreement with the previous constraint from the lack of an observed counterjet and lack of short-term X-ray/radio correlations. Key words: accretion, accretion discs – radiation mechanisms: thermal –radio continuum: stars – stars: individual: Cyg X-1 – X-rays: binaries – X-rays: stars. 1 INTRODUCTION Periodic variability of emission from Cyg X-1 flux at various fre- quencies at the period of ∼150 d has been reported by, e.g., Brock- sopp et al. (1999a), Pooley, Fender & Brocksopp (1999), ¨ Ozdemir & Demircan (2001), Benlloch et al. (2001, 2004), Karitskaya et al. (2001) and Lachowicz et al. (2006, hereafter L06). This pe- riod is much longer than the 5.6-d orbital period (Brocksopp et al. 1999b), and this type of periodicity (or quasi-periodicity) in bina- ries is called superorbital. The generally accepted interpretation of the underlying cause of superorbital periodicity in X-ray binaries is precession of the accretion disc and/or jet (e.g. Katz 1973, 1980; Larwood 1998; Wijers & Pringle 1999; Ogilvie & Dubus 2001; Torres et al. 2005; Caproni et al. 2006; L06; but with the exception of 4U 1820–303, e.g., Zdziarski, Wen & Gierli´ nski 2007). How- ever, the question arises in which way the precession causes the modulation of the observed flux. There appears to be a number of possibilities. Considering the X-ray modulation first, the outer edge of the optically thick disc may partially cover the X-ray source. This, E-mail: [email protected] (AI), [email protected] (AAZ) however, would require extreme fine-tuning. Namely, the X-ray source has the size ∼ 10 2 Rg (where Rg ≡ GM/c 2 ), as indicated by the X-ray power spectrum and agreement with theoretical pre- diction on the range of radii where most of the accretion power is released, while the disc size is generally much larger, up to the or- der of the size of the Roche lobe (∼ 10 6 Rg in Cyg X-1). Another possibility is that the outer part of the disc fully obscures the X-ray source, but we see the X-rays scattered in a large corona above the disc (this appears to take place, e.g., in Her X-1, Leahy 2002). This, however, would dramatically affect the X-ray power spectrum, re- moving oscillations at all frequencies above 1 Hz, which effect is clearly not seen, and thus this scenario can be ruled out. The bound- free absorption in a spatially extended medium of moderate optical depth associated with the outer regions of the disc appears to be ruled out as there are a rather weak or no energy dependencies of the modulation, see L06 and Section 3 below. (Bound-free absorp- tion in the wind from the companion is responsible for the orbital modulation of the X-rays in Cyg X-1, Wen et al. 1999). On the other hand, a viable scenario is the wind/corona around the outer disc being almost fully ionized, with scattering away from the line of sight being responsible for the X-ray superorbital modulation. Yet another possibility is that the X-ray emission is intrinsi- c 2007 RAS

Welcome message from author
This document is posted to help you gain knowledge. Please leave a comment to let me know what you think about it! Share it to your friends and learn new things together.
Transcript
Mon. Not. R. Astron. Soc.000, 1–10 (2007) Printed 5 June 2007 (MN LATEX style file v2.2)
Superorbital variability of X-ray and radio emission of Cyg X-1.I. Emission anisotropy of precessing sources
Askar Ibragimov,1,2? Andrzej A. Zdziarski3? and Juri Poutanen11Astronomy Division, PO Box 3000, FIN-90014 University of Oulu, Finland2Kazan State University, Astronomy Department, Kremlyovskaya 18, 420008 Kazan, Russia3Centrum Astronomiczne im. M. Kopernika, Bartycka 18, 00-716 Warszawa, Poland
5 June 2007
ABSTRACTWe study theoretical interpretations of the∼150-d (superorbital) modulation observed in X-ray and radio emission of Cyg X-1 in the framework of models connecting this phenomenonto precession. Precession changes the orientation of the emission source (either disc or jet)relative to the observer. This leads to emission modulationdue to an anisotropic emissionpattern of the source or orientation-dependent amount of absorbing medium along the line ofsight or both. We consider, in particular, anisotropy patterns of blackbody-type emission, ther-mal Comptonization in slab geometry, jet/outflow beaming, and absorption in a coronal-typemedium above the disc. We then fit these models to the data fromtheRXTE All Sky Monitor,CGRO BATSE, and the Ryle and Green Bank radio telescopes, and find relatively small best-fit angles between the precession and orbital planes,∼10–20. The thermal Comptonizationmodel for the X-ray emission explains well the observed decrease of the variability amplitudefrom 1 to 300 keV as a result of a reduced anisotropy of the emission due to multiple scat-terings. Our modeling also yield the jet bulk velocity of∼ (0.3–0.5)c, which is in agreementwith the previous constraint from the lack of an observed counterjet and lack of short-termX-ray/radio correlations.
Key words: accretion, accretion discs – radiation mechanisms: thermal –radio continuum:stars – stars: individual: Cyg X-1 – X-rays: binaries – X-rays: stars.
1 INTRODUCTION
Periodic variability of emission from Cyg X-1 flux at variousfre-quencies at the period of∼150 d has been reported by, e.g., Brock-sopp et al. (1999a), Pooley, Fender & Brocksopp (1999),Ozdemir& Demircan (2001), Benlloch et al. (2001, 2004), Karitskayaetal. (2001) and Lachowicz et al. (2006, hereafter L06). This pe-riod is much longer than the 5.6-d orbital period (Brocksoppet al.1999b), and this type of periodicity (or quasi-periodicity) in bina-ries is called superorbital. The generally accepted interpretation ofthe underlying cause of superorbital periodicity in X-ray binariesis precession of the accretion disc and/or jet (e.g. Katz 1973, 1980;Larwood 1998; Wijers & Pringle 1999; Ogilvie & Dubus 2001;Torres et al. 2005; Caproni et al. 2006; L06; but with the exceptionof 4U 1820–303, e.g., Zdziarski, Wen & Gierlinski 2007). How-ever, the question arises in which way the precession causesthemodulation of the observed flux. There appears to be a number ofpossibilities.
Considering the X-ray modulation first, the outer edge of theoptically thick disc may partially cover the X-ray source. This,
? E-mail: [email protected] (AI), [email protected] (AAZ)
however, would require extreme fine-tuning. Namely, the X-raysource has the size∼ 102Rg (whereRg ≡ GM/c2), as indicatedby the X-ray power spectrum and agreement with theoretical pre-diction on the range of radii where most of the accretion power isreleased, while the disc size is generally much larger, up tothe or-der of the size of the Roche lobe (∼ 106Rg in Cyg X-1). Anotherpossibility is that the outer part of the disc fully obscuresthe X-raysource, but we see the X-rays scattered in a large corona above thedisc (this appears to take place, e.g., in Her X-1, Leahy 2002). This,however, would dramatically affect the X-ray power spectrum, re-moving oscillations at all frequencies above 1 Hz, which effect isclearly not seen, and thus this scenario can be ruled out. Thebound-free absorption in a spatially extended medium of moderate opticaldepth associated with the outer regions of the disc appears to beruled out as there are a rather weak or no energy dependenciesofthe modulation, see L06 and Section 3 below. (Bound-free absorp-tion in the wind from the companion is responsible for theorbitalmodulation of the X-rays in Cyg X-1, Wen et al. 1999). On theother hand, a viable scenario is the wind/corona around the outerdisc being almost fully ionized, with scattering away from the lineof sight being responsible for the X-ray superorbital modulation.
Yet another possibility is that the X-ray emission is intrinsi-
c© 2007 RAS
2 A. Ibragimov, A. A. Zdziarski and J. Poutanen
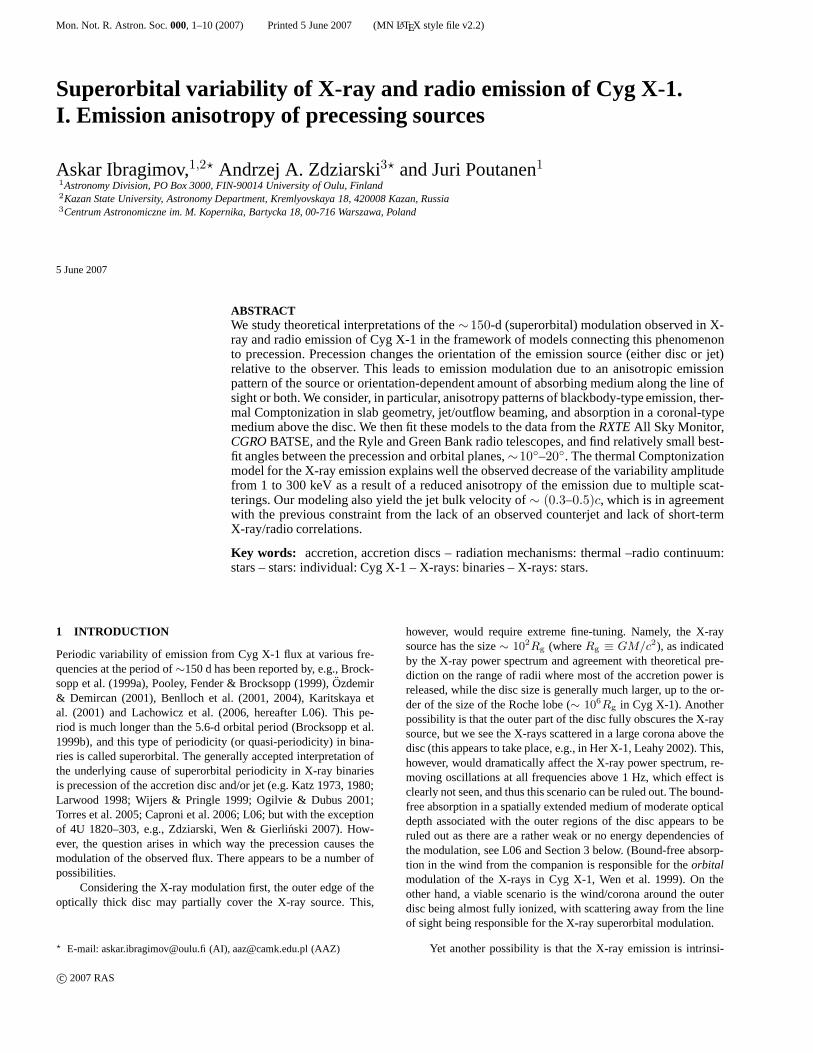
Figure 1. The (a) 1.5–3, 3–5 and 5–12 keV (red, greed and blue, respectively) RXTE/ASM, (b) Ryle, (c) 2.25 and 8.30 GHz (red and green, respectively) GBIlight curves for the available span of the data. The shaded areas show the data not taken into account in our analysis.
cally anisotropic. Such a possibility was considered by Brocksoppet al. (1999b) who have relied on the blackbody-type anisotropy,where the flux is proportional to the projected area. However, thereis overwhelming evidence that the dominant radiative process pro-ducing X-rays in the hard state of Cyg X-1 (and other black-holebinaries) is thermal Comptonization (e.g. Poutanen 1998; Zdziarski& Gierlinski 2004). Therefore, it is of interest to study models ofthe anisotropy of the Comptonized emission to see whether theycan reproduce the observed superorbital variability.
We note that the hot Comptonizing plasma most likely alsoforms the base of the jet, which is present in the hard state andradiates, at larger distances from the black hole, nonthermal syn-chrotron radio emission correlated with the X-rays (e.g. Gallo,Fender & Pooley 2003). However, the radiative process givingrise to the X-rays is still thermal Comptonization. Early modelsaccounting for the radio-X-ray correlation postulated that the ob-served X-ray emission is due to nonthermal synchrotron emis-sion of very energetic power-law electrons with a fine-tunedhigh-energy cutoff. However, that process cannot account, e.g.,for thesharpness of the observed cutoffs (Zdziarski et al. 2003). Then,recent X-ray jet models turned to thermal Comptonization toac-count for the high-energy cutoff. However, the electron tempera-ture in that model is very high,kT ∼ 3–4 MeV (Markoff, Nowak& Wilms 2005), yet still fitted to the cutoff observed at∼100 keV.Those authors do not explain how it is done; if it is due to the 1storder scattering by the thermal electrons, very strong fine tuning inall hard-states of black-hole binaries is obviously required. Gener-ally, assuming the jet X-ray origin also leads to a number of other
conflicts with the observations (e.g. Poutanen & Zdziarski 2003;Zdziarski et al. 2003, 2004; Maccarone 2005; Yuan et al. 2007).
The synchrotron, radio, emission of the jet may be isotropicinthe comoving frame (in the presence of a tangled magnetic field).However, if the jet bulk motion is at least mildly relativistic, the ob-served flux will depend on the jet angle, and will thus change withthe jet precession. Indeed, Stirling et al. (2001) find that the ab-sence of an observable counter jet requires such a velocity for theextended part of the jet. This constraint combined with one fromthe lack of radio–X-ray correlations on short time scales (Gleissneret al. 2004) leads to the estimate on the jet velocity of∼ (0.5–0.7)c.If the jet precesses together with the disc, the radio emission will bemodulated with the precession period. On the other hand, we haveno information on the velocity in the core of the jet, which can bein principle much lower. In that case, the process responsible forthe radio superorbital modulation may be free-free absorption inthe wind from the companion star, which will depend on the di-rection the jet is inclined. This may provide an alternativeexplana-tion of the superorbital modulation of the radio emission (Szostek& Zdziarski 2007). Furthermore, both the Doppler beaming andprecession-dependent absorption may take place in Cyg X-1.
Here, we study the precession physical scenarios leading tosuperorbital modulations in a systematic way. In general, any emis-sion anisotropic (in the rest frame of the system) with respect to thedisc/jet axis will be observed to be modulated when the directionof that axis changes.
c© 2007 RAS, MNRAS000, 1–10
Superorbital variability of X-ray and radio emission of Cyg X-1 3
2 THE DATA
We use the X-ray dwell data from the All-Sky Monitor (ASM)aboardRossi X-ray Timing Explorer (RXTE; Bradt, Rothschild &Swank 1993; Levine et al. 1996). We also useCompton GammaRay Observatory BATSE data in the 20–100 keV and 100–300keV energy ranges, the 15-GHz radio data from the Ryle Telescopeof the Mullard Radio Astronomy Observatory, and the 2.25 and8.30 GHz data from the Green Bank Interferometer (GBI) of theNational Radio Astronomy Observatory, Green Bank, WV, USA.See L06 for a detailed description of those data sets. Compared tothe analysis of L06, we also include more recent ASM and Ryledata. We study theRXTE/ASM data for MJD 50087–53789 (1995May 1–2006 February 23), the BATSE data for MJD 48371–51686(1991 April 25–2000 May 22), the 15 GHz Ryle data for MJD50377–53791 (1996 October 10–2006 February 25), and the GBIdata for MJD 50409–51823 (1996 November 22–2000 October 6).Hereafter, we refer to theRXTE/ASM channels of 1.5–3, 3–5 and5–12 keV as the ASM A, B and C, respectively, and the BATSE20–100 keV and 100–300 keV data as the BATSE A and B, respec-tively.
Cyg X-1 is a highly variable source. Therefore, in order toaccurately analyze its superorbital variability it is preferable touse observations affected in the least way by its aperiodic vari-ability. Thus, we study only the hard state, in which Cyg X-1 isfor majority of the time. We define it following Zdziarski et al.(2002), requiring the average photon spectral index derived fromthe RXTE/ASM fluxes to be< 2.1. In addition, we exclude hard-state intervals with high X-ray variability, following thecriterionused by L06. Namely, we define MJD 50660–50990 as our ref-erence interval. We then include only those 30-d intervals of theASM data where< 40 per cent of points exceed by4σ the av-erage flux in the reference interval. This has resulted in removal ofthe following time intervals: MJD< 50350, 50590–50660, 50995–51025, 51400–51640, 51840–51960, 52100–52565, 52770–52880,52975–53115, 53174–53554,> 53690. We apply the above selec-tion to RXTE/ASM and Ryle data sets, as shown in Fig. 1.
On the other hand, the GBI data cover a relatively short timeinterval, also shown in Fig. 1. That interval is entirely in the hardstate. Therefore, we have not applied any additional screening cri-teria to those data except the removal of the data marked as bad.Then, for the BATSE data, we exclude the periods of the soft stateof 1994 and 1996, i.e., MJD 49250–49440 and MJD 50230–50307(as in L06).
3 PERIODIC MODULATIONS IN THE DATA
The currently most comprehensive analysis of the orbital and super-orbital modulations of Cyg X-1 has been done by L06. In particular,they found the superorbital period of∼150 d consistent with con-stant in all the available data since∼1976. Furthermore, they foundthe phase of the superorbital also compatible with constant(see fig.7 and table 3 in L06).
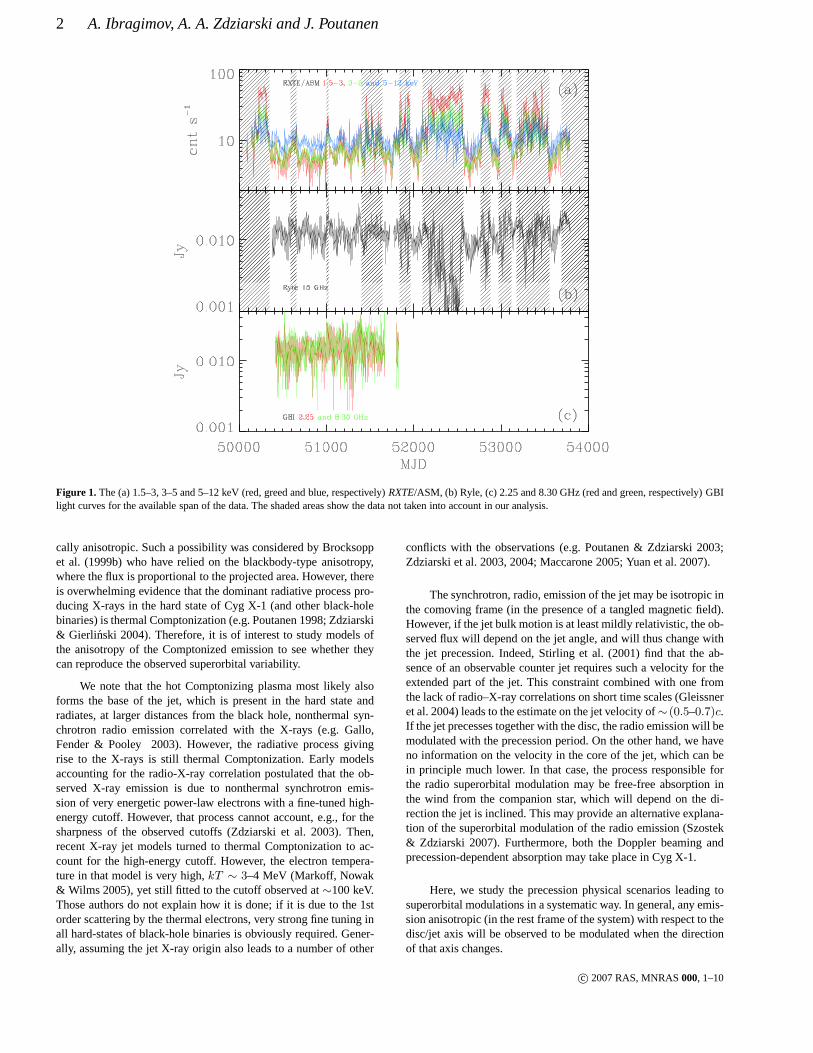
Here, we use the Lomb-Scargle method (Lomb 1976; Scargle1982) to characterize the periodicities in the data analyzed by us.The periodograms for the ASM C and Ryle data are shown on Fig.2. We clearly see the peaks corresponding to 5.6 d and∼150 d forboth data sets. In addition, we see strong peaks corresponding toperiods longer than 150 d for the Ryle data. Their origin remainsunclear though they are likely to be artefacts, see L06 for discus-sion.
Figure 2. The Lomb-Scargle periodograms for (a) the ASM C and (b)the Ryle data (before prewhitening; corresponding periodograms afterprewhitening are shown by L06).
We first consider the orbital modulation (caused by absorptionin the wind, Wen et al. 1999; Brocksopp, Fender & Pooley 2002;Szostek & Zdziarski 2007; see the latter paper for corrections toBrocksopp et al. 2002). For it, we use the spectroscopic ephemeris(Brocksopp et al. 1999a; LaSala et al. 1998)
min[MJD] = 50234.79 + 5.599829E, (1)
whereE is an integer. At those times, the companion star is infront of the X-ray source. We then fit the light curves folded overthe orbital period and averaged within each of 20 phase bins.Weuse then logarithm,G = lnF , of the photon or energy fluxes orcount rates,F , for fitting with the sum of harmonics,
Gmod(φ) = 〈G〉 −N
X
k=1
Gk cos[2πk(φ− φk)], (2)
whereφ is the 0–1 phase,〈G〉 is the (fitted) average value of thelogarithm of the flux, andGk andφk are the amplitude and the off-set phase, respectively, for thek-th harmonic. We adopt the conven-tion thatGk > 0 and−0.5 < kφk ≤ 0.5. The obtained parametersfor N = 3 for the RXTE/ASM and Ryle data andN = 1 for theGBI data (see L06) are given in Table 1. We do not consider herethe orbital modulation for the BATSE data since it is very weak,<∼ 3 per cent (L06).
We note that assigning errors to the folded and averaged fluxesis not a unique procedure. Here, we first divide the light curveinto time bins of the 1/20 of the period (orbital or superorbital)and obtain the average of the flux,Fij , where i is the numberof the phase bin andj is the number of the time bin contribut-ing to thei-th phase bin, weighted by the inverse squares of theirmeasurement error. In this way, we avoid any contribution toour
c© 2007 RAS, MNRAS000, 1–10
4 A. Ibragimov, A. A. Zdziarski and J. Poutanen
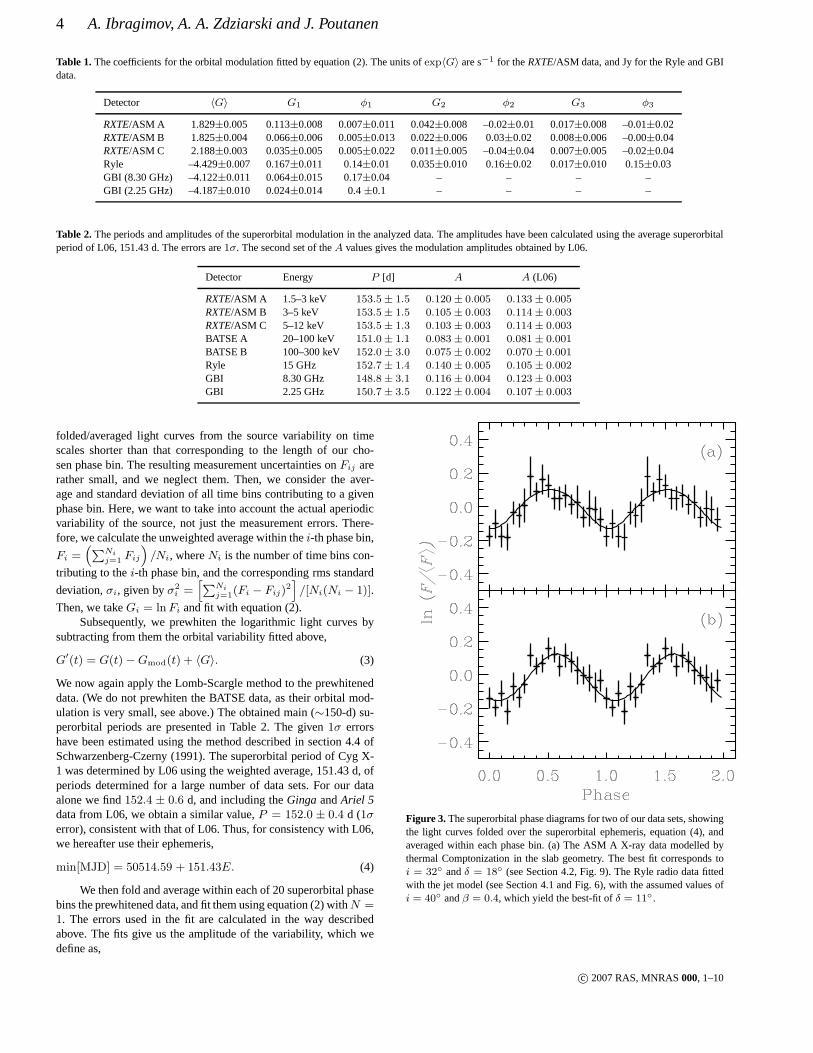
Table 1. The coefficients for the orbital modulation fitted by equation (2). The units ofexp〈G〉 are s−1 for theRXTE/ASM data, and Jy for the Ryle and GBIdata.
Detector 〈G〉 G1 φ1 G2 φ2 G3 φ3
RXTE/ASM A 1.829±0.005 0.113±0.008 0.007±0.011 0.042±0.008 –0.02±0.01 0.017±0.008 –0.01±0.02RXTE/ASM B 1.825±0.004 0.066±0.006 0.005±0.013 0.022±0.006 0.03±0.02 0.008±0.006 –0.00±0.04RXTE/ASM C 2.188±0.003 0.035±0.005 0.005±0.022 0.011±0.005 –0.04±0.04 0.007±0.005 –0.02±0.04Ryle –4.429±0.007 0.167±0.011 0.14±0.01 0.035±0.010 0.16±0.02 0.017±0.010 0.15±0.03GBI (8.30 GHz) –4.122±0.011 0.064±0.015 0.17±0.04 – – – –GBI (2.25 GHz) –4.187±0.010 0.024±0.014 0.4±0.1 – – – –
Table 2. The periods and amplitudes of the superorbital modulation in the analyzed data. The amplitudes have been calculated using the average superorbitalperiod of L06, 151.43 d. The errors are1σ. The second set of theA values gives the modulation amplitudes obtained by L06.
Detector Energy P [d] A A (L06)
RXTE/ASM A 1.5–3 keV 153.5 ± 1.5 0.120 ± 0.005 0.133 ± 0.005RXTE/ASM B 3–5 keV 153.5 ± 1.5 0.105 ± 0.003 0.114 ± 0.003RXTE/ASM C 5–12 keV 153.5 ± 1.3 0.103 ± 0.003 0.114 ± 0.003BATSE A 20–100 keV 151.0 ± 1.1 0.083 ± 0.001 0.081 ± 0.001BATSE B 100–300 keV 152.0 ± 3.0 0.075 ± 0.002 0.070 ± 0.001Ryle 15 GHz 152.7 ± 1.4 0.140 ± 0.005 0.105 ± 0.002GBI 8.30 GHz 148.8 ± 3.1 0.116 ± 0.004 0.123 ± 0.003GBI 2.25 GHz 150.7 ± 3.5 0.122 ± 0.004 0.107 ± 0.003
folded/averaged light curves from the source variability on timescales shorter than that corresponding to the length of our cho-sen phase bin. The resulting measurement uncertainties onFij arerather small, and we neglect them. Then, we consider the aver-age and standard deviation of all time bins contributing to agivenphase bin. Here, we want to take into account the actual aperiodicvariability of the source, not just the measurement errors.There-fore, we calculate the unweighted average within thei-th phase bin,
Fi =“
PNi
j=1 Fij”
/Ni, whereNi is the number of time bins con-
tributing to thei-th phase bin, and the corresponding rms standard
deviation,σi, given byσ2i =
h
PNi
j=1(Fi − Fij)2i
/[Ni(Ni − 1)].
Then, we takeGi = lnFi and fit with equation (2).Subsequently, we prewhiten the logarithmic light curves by
subtracting from them the orbital variability fitted above,
G′(t) = G(t) −Gmod(t) + 〈G〉. (3)
We now again apply the Lomb-Scargle method to the prewhiteneddata. (We do not prewhiten the BATSE data, as their orbital mod-ulation is very small, see above.) The obtained main (∼150-d) su-perorbital periods are presented in Table 2. The given1σ errorshave been estimated using the method described in section 4.4 ofSchwarzenberg-Czerny (1991). The superorbital period of Cyg X-1 was determined by L06 using the weighted average, 151.43 d,ofperiods determined for a large number of data sets. For our dataalone we find152.4 ± 0.6 d, and including theGinga andAriel 5data from L06, we obtain a similar value,P = 152.0 ± 0.4 d (1σerror), consistent with that of L06. Thus, for consistency with L06,we hereafter use their ephemeris,
min[MJD] = 50514.59 + 151.43E. (4)
We then fold and average within each of 20 superorbital phasebins the prewhitened data, and fit them using equation (2) withN =1. The errors used in the fit are calculated in the way describedabove. The fits give us the amplitude of the variability, which wedefine as,
Figure 3. The superorbital phase diagrams for two of our data sets, showingthe light curves folded over the superorbital ephemeris, equation (4), andaveraged within each phase bin. (a) The ASM A X-ray data modelled bythermal Comptonization in the slab geometry. The best fit corresponds toi = 32 andδ = 18 (see Section 4.2, Fig. 9). The Ryle radio data fittedwith the jet model (see Section 4.1 and Fig. 6), with the assumed values ofi = 40 andβ = 0.4, which yield the best-fit ofδ = 11.
c© 2007 RAS, MNRAS000, 1–10
Superorbital variability of X-ray and radio emission of Cyg X-1 5
iδ
observer
HDE 226868
precession cone
accretion disc
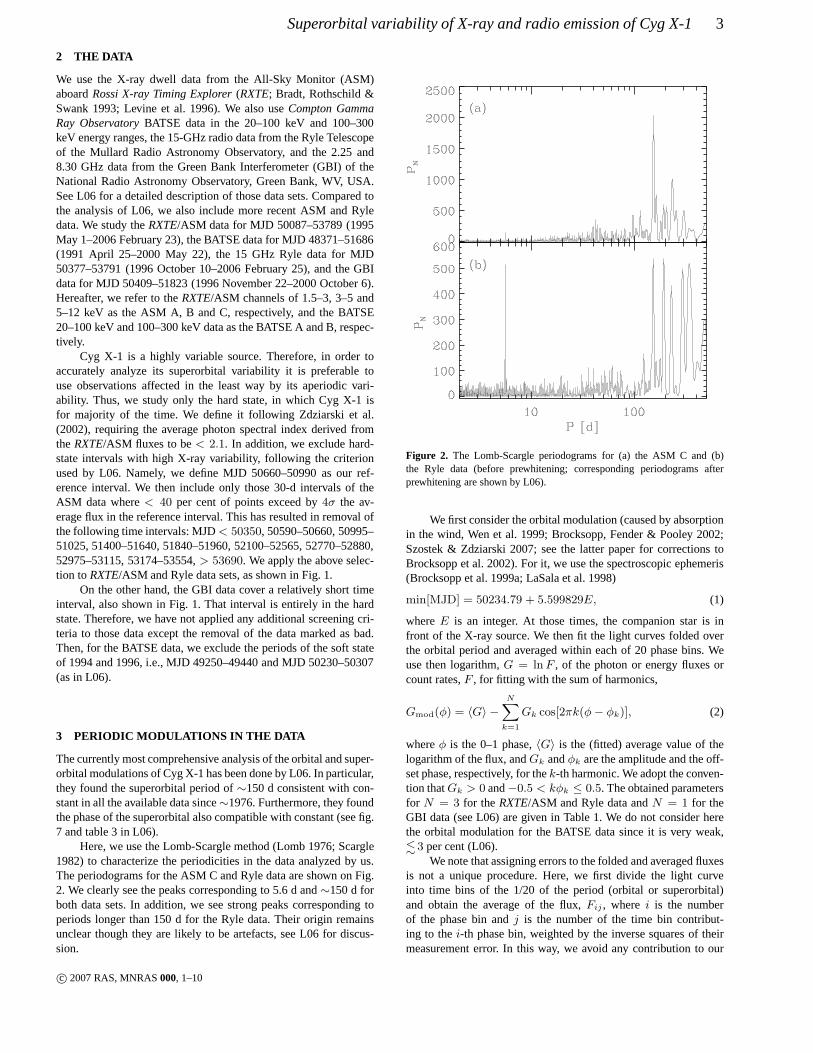
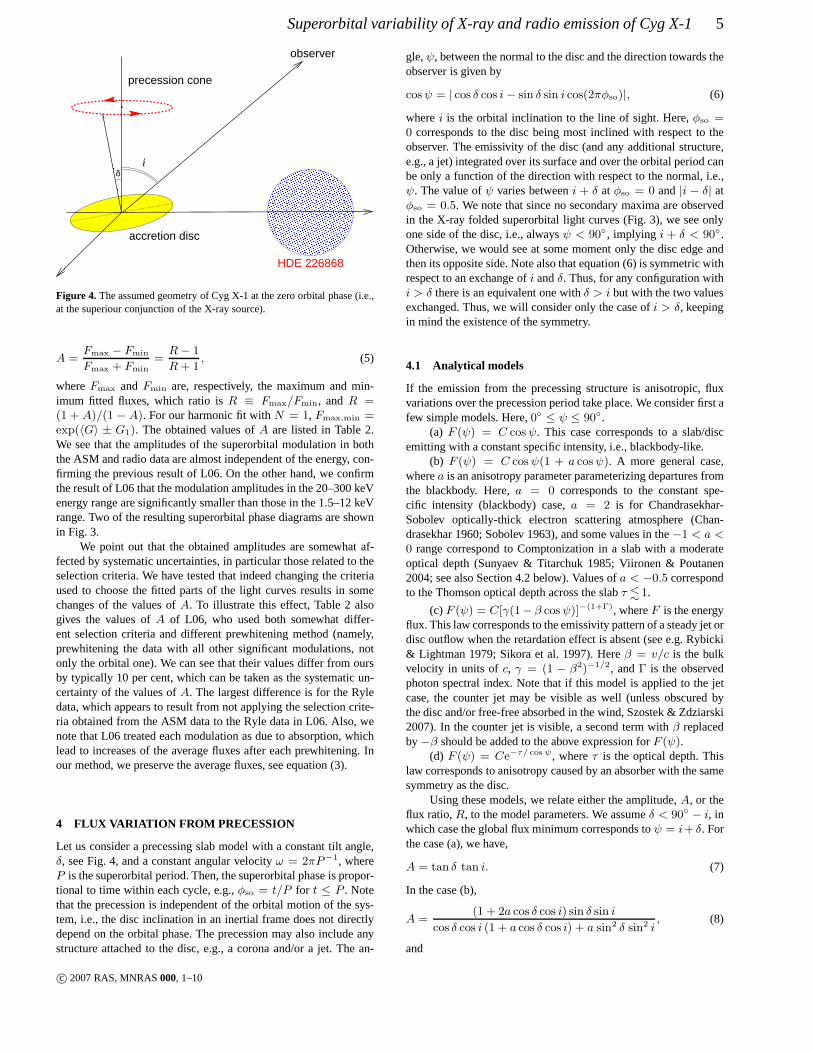
Figure 4. The assumed geometry of Cyg X-1 at the zero orbital phase (i.e.,at the superiour conjunction of the X-ray source).
A =Fmax − Fmin
Fmax + Fmin=R− 1
R+ 1, (5)
whereFmax andFmin are, respectively, the maximum and min-imum fitted fluxes, which ratio isR ≡ Fmax/Fmin, andR =(1 + A)/(1 − A). For our harmonic fit withN = 1, Fmax,min =exp(〈G〉 ± G1). The obtained values ofA are listed in Table 2.We see that the amplitudes of the superorbital modulation inboththe ASM and radio data are almost independent of the energy, con-firming the previous result of L06. On the other hand, we confirmthe result of L06 that the modulation amplitudes in the 20–300 keVenergy range are significantly smaller than those in the 1.5–12 keVrange. Two of the resulting superorbital phase diagrams areshownin Fig. 3.
We point out that the obtained amplitudes are somewhat af-fected by systematic uncertainties, in particular those related to theselection criteria. We have tested that indeed changing thecriteriaused to choose the fitted parts of the light curves results in somechanges of the values ofA. To illustrate this effect, Table 2 alsogives the values ofA of L06, who used both somewhat differ-ent selection criteria and different prewhitening method (namely,prewhitening the data with all other significant modulations, notonly the orbital one). We can see that their values differ from oursby typically 10 per cent, which can be taken as the systematicun-certainty of the values ofA. The largest difference is for the Ryledata, which appears to result from not applying the selection crite-ria obtained from the ASM data to the Ryle data in L06. Also, wenote that L06 treated each modulation as due to absorption, whichlead to increases of the average fluxes after each prewhitening. Inour method, we preserve the average fluxes, see equation (3).
4 FLUX VARIATION FROM PRECESSION
Let us consider a precessing slab model with a constant tilt angle,δ, see Fig. 4, and a constant angular velocityω = 2πP−1, whereP is the superorbital period. Then, the superorbital phase ispropor-tional to time within each cycle, e.g.,φso = t/P for t ≤ P . Notethat the precession is independent of the orbital motion of the sys-tem, i.e., the disc inclination in an inertial frame does notdirectlydepend on the orbital phase. The precession may also includeanystructure attached to the disc, e.g., a corona and/or a jet. The an-
gle,ψ, between the normal to the disc and the direction towards theobserver is given by
cosψ = | cos δ cos i− sin δ sin i cos(2πφso)|, (6)
wherei is the orbital inclination to the line of sight. Here,φso =0 corresponds to the disc being most inclined with respect to theobserver. The emissivity of the disc (and any additional structure,e.g., a jet) integrated over its surface and over the orbitalperiod canbe only a function of the direction with respect to the normal, i.e.,ψ. The value ofψ varies betweeni + δ at φso = 0 and|i − δ| atφso = 0.5. We note that since no secondary maxima are observedin the X-ray folded superorbital light curves (Fig. 3), we see onlyone side of the disc, i.e., alwaysψ < 90, implying i + δ < 90.Otherwise, we would see at some moment only the disc edge andthen its opposite side. Note also that equation (6) is symmetric withrespect to an exchange ofi andδ. Thus, for any configuration withi > δ there is an equivalent one withδ > i but with the two valuesexchanged. Thus, we will consider only the case ofi > δ, keepingin mind the existence of the symmetry.
4.1 Analytical models
If the emission from the precessing structure is anisotropic, fluxvariations over the precession period take place. We consider first afew simple models. Here,0 ≤ ψ ≤ 90.
(a) F (ψ) = C cosψ. This case corresponds to a slab/discemitting with a constant specific intensity, i.e., blackbody-like.
(b) F (ψ) = C cosψ(1 + a cosψ). A more general case,wherea is an anisotropy parameter parameterizing departures fromthe blackbody. Here,a = 0 corresponds to the constant spe-cific intensity (blackbody) case,a = 2 is for Chandrasekhar-Sobolev optically-thick electron scattering atmosphere (Chan-drasekhar 1960; Sobolev 1963), and some values in the−1 < a <0 range correspond to Comptonization in a slab with a moderateoptical depth (Sunyaev & Titarchuk 1985; Viironen & Poutanen2004; see also Section 4.2 below). Values ofa < −0.5 correspondto the Thomson optical depth across the slabτ <∼ 1.
(c)F (ψ) = C[γ(1− β cosψ)]−(1+Γ), whereF is the energyflux. This law corresponds to the emissivity pattern of a steady jet ordisc outflow when the retardation effect is absent (see e.g. Rybicki& Lightman 1979; Sikora et al. 1997). Hereβ = v/c is the bulkvelocity in units ofc, γ = (1 − β2)−1/2, andΓ is the observedphoton spectral index. Note that if this model is applied to the jetcase, the counter jet may be visible as well (unless obscuredbythe disc and/or free-free absorbed in the wind, Szostek & Zdziarski2007). In the counter jet is visible, a second term withβ replacedby−β should be added to the above expression forF (ψ).
(d) F (ψ) = Ce−τ/ cosψ, whereτ is the optical depth. Thislaw corresponds to anisotropy caused by an absorber with thesamesymmetry as the disc.
Using these models, we relate either the amplitude,A, or theflux ratio,R, to the model parameters. We assumeδ < 90 − i, inwhich case the global flux minimum corresponds toψ = i+ δ. Forthe case (a), we have,
A = tan δ tan i. (7)
In the case (b),
A =(1 + 2a cos δ cos i) sin δ sin i
cos δ cos i (1 + a cos δ cos i) + a sin2 δ sin2 i, (8)
and
c© 2007 RAS, MNRAS000, 1–10
6 A. Ibragimov, A. A. Zdziarski and J. Poutanen
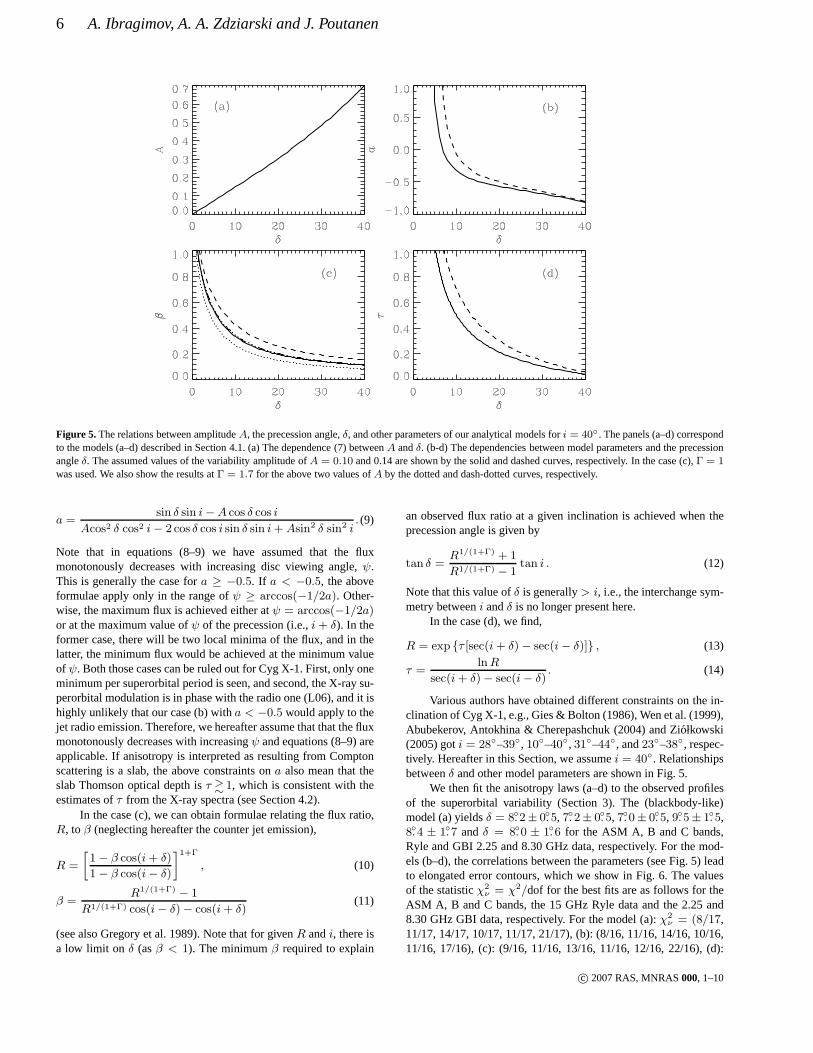
Figure 5. The relations between amplitudeA, the precession angle,δ, and other parameters of our analytical models fori = 40. The panels (a–d) correspondto the models (a–d) described in Section 4.1. (a) The dependence (7) betweenA andδ. (b-d) The dependencies between model parameters and the precessionangleδ. The assumed values of the variability amplitude ofA = 0.10 and 0.14 are shown by the solid and dashed curves, respectively. In the case (c),Γ = 1was used. We also show the results atΓ = 1.7 for the above two values ofA by the dotted and dash-dotted curves, respectively.
a =sin δ sin i− A cos δ cos i
Acos2 δ cos2 i− 2 cos δ cos i sin δ sin i+ Asin2 δ sin2 i. (9)
Note that in equations (8–9) we have assumed that the fluxmonotonously decreases with increasing disc viewing angle, ψ.This is generally the case fora ≥ −0.5. If a < −0.5, the aboveformulae apply only in the range ofψ ≥ arccos(−1/2a). Other-wise, the maximum flux is achieved either atψ = arccos(−1/2a)or at the maximum value ofψ of the precession (i.e.,i+ δ). In theformer case, there will be two local minima of the flux, and in thelatter, the minimum flux would be achieved at the minimum valueof ψ. Both those cases can be ruled out for Cyg X-1. First, only oneminimum per superorbital period is seen, and second, the X-ray su-perorbital modulation is in phase with the radio one (L06), and it ishighly unlikely that our case (b) witha < −0.5 would apply to thejet radio emission. Therefore, we hereafter assume that that the fluxmonotonously decreases with increasingψ and equations (8–9) areapplicable. If anisotropy is interpreted as resulting fromComptonscattering is a slab, the above constraints ona also mean that theslab Thomson optical depth isτ >∼ 1, which is consistent with theestimates ofτ from the X-ray spectra (see Section 4.2).
In the case (c), we can obtain formulae relating the flux ratio,R, toβ (neglecting hereafter the counter jet emission),
R =
»
1 − β cos(i+ δ)
1 − β cos(i− δ)
–1+Γ
, (10)
β =R1/(1+Γ) − 1
R1/(1+Γ) cos(i− δ) − cos(i+ δ)(11)
(see also Gregory et al. 1989). Note that for givenR andi, there isa low limit on δ (asβ < 1). The minimumβ required to explain
an observed flux ratio at a given inclination is achieved whentheprecession angle is given by
tan δ =R1/(1+Γ) + 1
R1/(1+Γ) − 1tan i . (12)
Note that this value ofδ is generally> i, i.e., the interchange sym-metry betweeni andδ is no longer present here.
In the case (d), we find,
R = exp τ [sec(i+ δ) − sec(i− δ)] , (13)
τ =lnR
sec(i+ δ) − sec(i− δ). (14)
Various authors have obtained different constraints on thein-clination of Cyg X-1, e.g., Gies & Bolton (1986), Wen et al. (1999),Abubekerov, Antokhina & Cherepashchuk (2004) and Ziołkowski(2005) goti = 28–39, 10–40, 31–44, and23–38, respec-tively. Hereafter in this Section, we assumei = 40. Relationshipsbetweenδ and other model parameters are shown in Fig. 5.
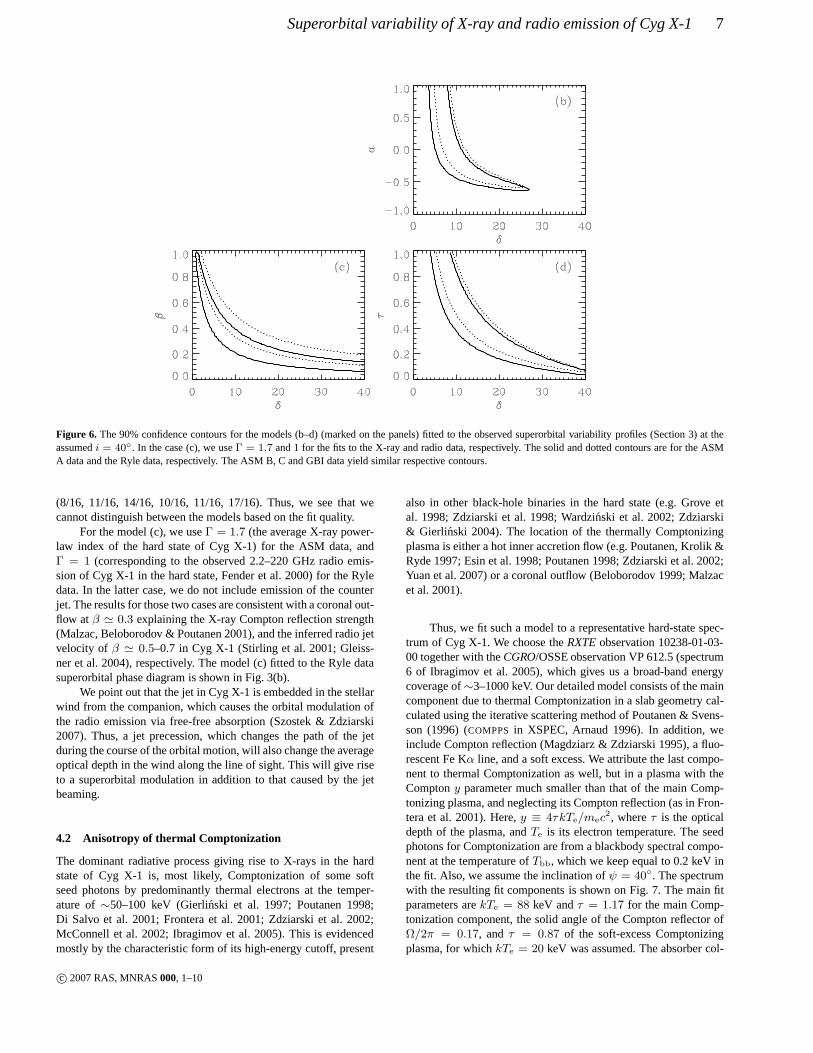
We then fit the anisotropy laws (a–d) to the observed profilesof the superorbital variability (Section 3). The (blackbody-like)model (a) yieldsδ = 8.2± 0.5, 7.2± 0.5, 7.0± 0.5, 9.5± 1.5,8.4 ± 1.7 andδ = 8.0 ± 1.6 for the ASM A, B and C bands,Ryle and GBI 2.25 and 8.30 GHz data, respectively. For the mod-els (b–d), the correlations between the parameters (see Fig. 5) leadto elongated error contours, which we show in Fig. 6. The valuesof the statisticχ2
ν = χ2/dof for the best fits are as follows for theASM A, B and C bands, the 15 GHz Ryle data and the 2.25 and8.30 GHz GBI data, respectively. For the model (a):χ2
ν = (8/17,11/17, 14/17, 10/17, 11/17, 21/17), (b): (8/16, 11/16, 14/16, 10/16,11/16, 17/16), (c): (9/16, 11/16, 13/16, 11/16, 12/16, 22/16), (d):
c© 2007 RAS, MNRAS000, 1–10
Superorbital variability of X-ray and radio emission of Cyg X-1 7
Figure 6. The 90% confidence contours for the models (b–d) (marked on the panels) fitted to the observed superorbital variability profiles (Section 3) at theassumedi = 40. In the case (c), we useΓ = 1.7 and 1 for the fits to the X-ray and radio data, respectively. The solid and dotted contours are for the ASMA data and the Ryle data, respectively. The ASM B, C and GBI data yield similar respective contours.
(8/16, 11/16, 14/16, 10/16, 11/16, 17/16). Thus, we see thatwecannot distinguish between the models based on the fit quality.
For the model (c), we useΓ = 1.7 (the average X-ray power-law index of the hard state of Cyg X-1) for the ASM data, andΓ = 1 (corresponding to the observed 2.2–220 GHz radio emis-sion of Cyg X-1 in the hard state, Fender et al. 2000) for the Ryledata. In the latter case, we do not include emission of the counterjet. The results for those two cases are consistent with a coronal out-flow atβ ' 0.3 explaining the X-ray Compton reflection strength(Malzac, Beloborodov & Poutanen 2001), and the inferred radio jetvelocity of β ' 0.5–0.7 in Cyg X-1 (Stirling et al. 2001; Gleiss-ner et al. 2004), respectively. The model (c) fitted to the Ryle datasuperorbital phase diagram is shown in Fig. 3(b).
We point out that the jet in Cyg X-1 is embedded in the stellarwind from the companion, which causes the orbital modulation ofthe radio emission via free-free absorption (Szostek & Zdziarski2007). Thus, a jet precession, which changes the path of the jetduring the course of the orbital motion, will also change theaverageoptical depth in the wind along the line of sight. This will give riseto a superorbital modulation in addition to that caused by the jetbeaming.
4.2 Anisotropy of thermal Comptonization
The dominant radiative process giving rise to X-rays in the hardstate of Cyg X-1 is, most likely, Comptonization of some softseed photons by predominantly thermal electrons at the temper-ature of∼50–100 keV (Gierlinski et al. 1997; Poutanen 1998;Di Salvo et al. 2001; Frontera et al. 2001; Zdziarski et al. 2002;McConnell et al. 2002; Ibragimov et al. 2005). This is evidencedmostly by the characteristic form of its high-energy cutoff, present
also in other black-hole binaries in the hard state (e.g. Grove etal. 1998; Zdziarski et al. 1998; Wardzinski et al. 2002; Zdziarski& Gierlinski 2004). The location of the thermally Comptonizingplasma is either a hot inner accretion flow (e.g. Poutanen, Krolik &Ryde 1997; Esin et al. 1998; Poutanen 1998; Zdziarski et al. 2002;Yuan et al. 2007) or a coronal outflow (Beloborodov 1999; Malzacet al. 2001).
Thus, we fit such a model to a representative hard-state spec-trum of Cyg X-1. We choose theRXTE observation 10238-01-03-00 together with theCGRO/OSSE observation VP 612.5 (spectrum6 of Ibragimov et al. 2005), which gives us a broad-band energycoverage of∼3–1000 keV. Our detailed model consists of the maincomponent due to thermal Comptonization in a slab geometry cal-culated using the iterative scattering method of Poutanen &Svens-son (1996) (COMPPS in XSPEC, Arnaud 1996). In addition, weinclude Compton reflection (Magdziarz & Zdziarski 1995), a fluo-rescent Fe Kα line, and a soft excess. We attribute the last compo-nent to thermal Comptonization as well, but in a plasma with theComptony parameter much smaller than that of the main Comp-tonizing plasma, and neglecting its Compton reflection (as in Fron-tera et al. 2001). Here,y ≡ 4τkTe/mec
2, whereτ is the opticaldepth of the plasma, andTe is its electron temperature. The seedphotons for Comptonization are from a blackbody spectral compo-nent at the temperature ofTbb, which we keep equal to 0.2 keV inthe fit. Also, we assume the inclination ofψ = 40. The spectrumwith the resulting fit components is shown on Fig. 7. The main fitparameters arekTe = 88 keV andτ = 1.17 for the main Comp-tonization component, the solid angle of the Compton reflector ofΩ/2π = 0.17, and τ = 0.87 of the soft-excess Comptonizingplasma, for whichkTe = 20 keV was assumed. The absorber col-
c© 2007 RAS, MNRAS000, 1–10
8 A. Ibragimov, A. A. Zdziarski and J. Poutanen
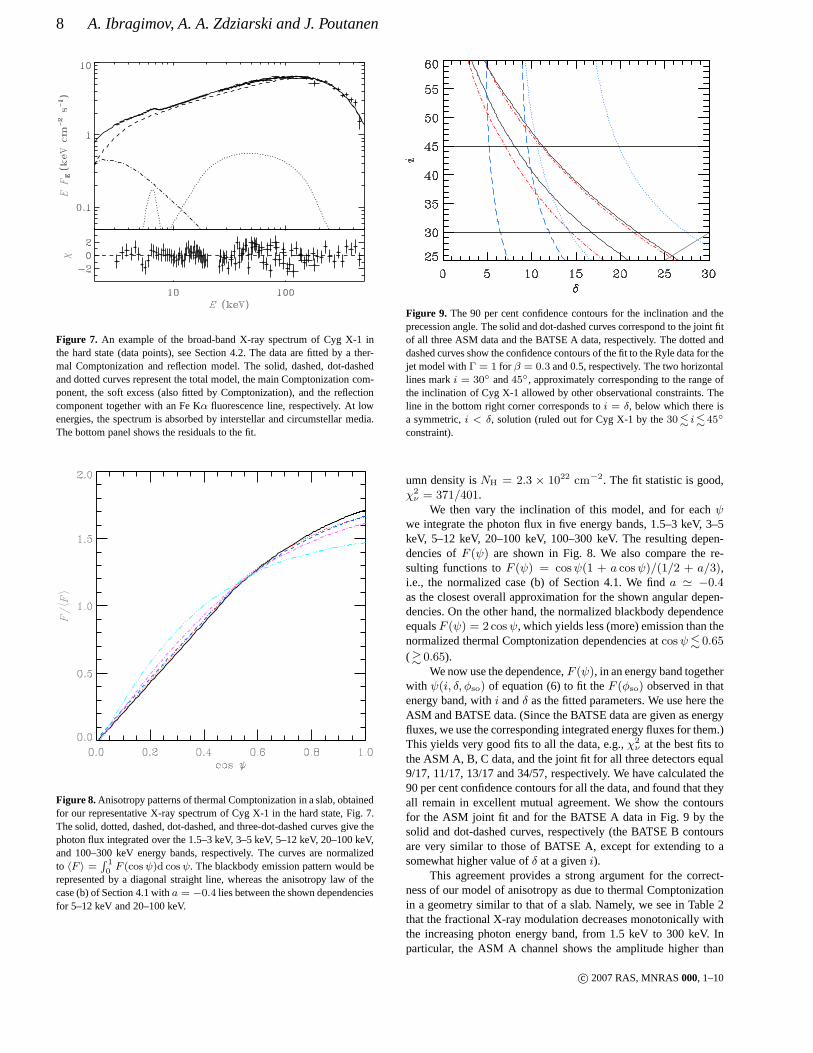
Figure 7. An example of the broad-band X-ray spectrum of Cyg X-1 inthe hard state (data points), see Section 4.2. The data are fitted by a ther-mal Comptonization and reflection model. The solid, dashed,dot-dashedand dotted curves represent the total model, the main Comptonization com-ponent, the soft excess (also fitted by Comptonization), andthe reflectioncomponent together with an Fe Kα fluorescence line, respectively. At lowenergies, the spectrum is absorbed by interstellar and circumstellar media.The bottom panel shows the residuals to the fit.
Figure 8. Anisotropy patterns of thermal Comptonization in a slab, obtainedfor our representative X-ray spectrum of Cyg X-1 in the hard state, Fig. 7.The solid, dotted, dashed, dot-dashed, and three-dot-dashed curves give thephoton flux integrated over the 1.5–3 keV, 3–5 keV, 5–12 keV, 20–100 keV,and 100–300 keV energy bands, respectively. The curves are normalizedto 〈F 〉 =
R 10F (cosψ)d cosψ. The blackbody emission pattern would be
represented by a diagonal straight line, whereas the anisotropy law of thecase (b) of Section 4.1 witha = −0.4 lies between the shown dependenciesfor 5–12 keV and 20–100 keV.
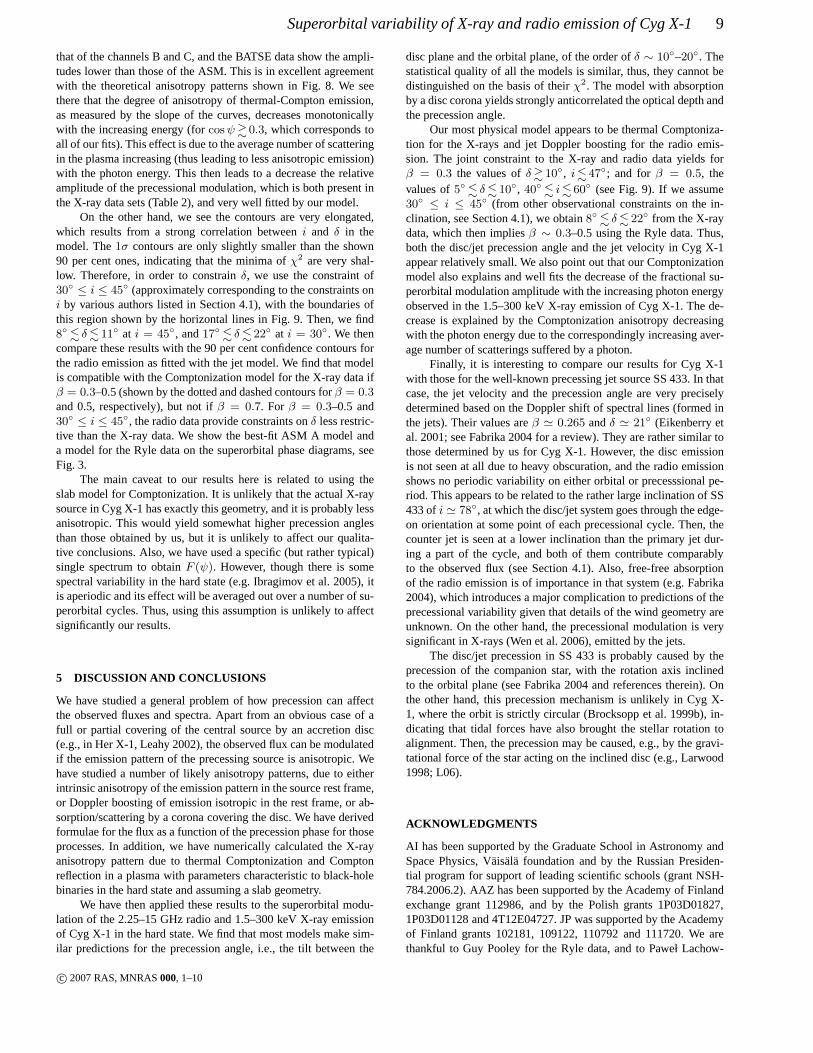
Figure 9. The 90 per cent confidence contours for the inclination and theprecession angle. The solid and dot-dashed curves correspond to the joint fitof all three ASM data and the BATSE A data, respectively. The dotted anddashed curves show the confidence contours of the fit to the Ryle data for thejet model withΓ = 1 for β = 0.3 and 0.5, respectively. The two horizontallines marki = 30 and45, approximately corresponding to the range ofthe inclination of Cyg X-1 allowed by other observational constraints. Theline in the bottom right corner corresponds toi = δ, below which there isa symmetric,i < δ, solution (ruled out for Cyg X-1 by the30<∼ i <∼ 45
constraint).
umn density isNH = 2.3 × 1022 cm−2. The fit statistic is good,χ2ν = 371/401.
We then vary the inclination of this model, and for eachψwe integrate the photon flux in five energy bands, 1.5–3 keV, 3–5keV, 5–12 keV, 20–100 keV, 100–300 keV. The resulting depen-dencies ofF (ψ) are shown in Fig. 8. We also compare the re-sulting functions toF (ψ) = cosψ(1 + a cosψ)/(1/2 + a/3),i.e., the normalized case (b) of Section 4.1. We finda ' −0.4as the closest overall approximation for the shown angular depen-dencies. On the other hand, the normalized blackbody dependenceequalsF (ψ) = 2 cosψ, which yields less (more) emission than thenormalized thermal Comptonization dependencies atcosψ<∼ 0.65
(>∼ 0.65).We now use the dependence,F (ψ), in an energy band together
with ψ(i, δ, φso) of equation (6) to fit theF (φso) observed in thatenergy band, withi andδ as the fitted parameters. We use here theASM and BATSE data. (Since the BATSE data are given as energyfluxes, we use the corresponding integrated energy fluxes forthem.)This yields very good fits to all the data, e.g.,χ2
ν at the best fits tothe ASM A, B, C data, and the joint fit for all three detectors equal9/17, 11/17, 13/17 and 34/57, respectively. We have calculated the90 per cent confidence contours for all the data, and found that theyall remain in excellent mutual agreement. We show the contoursfor the ASM joint fit and for the BATSE A data in Fig. 9 by thesolid and dot-dashed curves, respectively (the BATSE B contoursare very similar to those of BATSE A, except for extending to asomewhat higher value ofδ at a giveni).
This agreement provides a strong argument for the correct-ness of our model of anisotropy as due to thermal Comptonizationin a geometry similar to that of a slab. Namely, we see in Table2that the fractional X-ray modulation decreases monotonically withthe increasing photon energy band, from 1.5 keV to 300 keV. Inparticular, the ASM A channel shows the amplitude higher than
c© 2007 RAS, MNRAS000, 1–10
Superorbital variability of X-ray and radio emission of Cyg X-1 9
that of the channels B and C, and the BATSE data show the ampli-tudes lower than those of the ASM. This is in excellent agreementwith the theoretical anisotropy patterns shown in Fig. 8. Weseethere that the degree of anisotropy of thermal-Compton emission,as measured by the slope of the curves, decreases monotonicallywith the increasing energy (forcosψ>∼ 0.3, which corresponds toall of our fits). This effect is due to the average number of scatteringin the plasma increasing (thus leading to less anisotropic emission)with the photon energy. This then leads to a decrease the relativeamplitude of the precessional modulation, which is both present inthe X-ray data sets (Table 2), and very well fitted by our model.
On the other hand, we see the contours are very elongated,which results from a strong correlation betweeni and δ in themodel. The1σ contours are only slightly smaller than the shown90 per cent ones, indicating that the minima ofχ2 are very shal-low. Therefore, in order to constrainδ, we use the constraint of30 ≤ i ≤ 45 (approximately corresponding to the constraints oni by various authors listed in Section 4.1), with the boundaries ofthis region shown by the horizontal lines in Fig. 9. Then, we find8<
∼ δ <∼ 11 at i = 45, and17<∼ δ <∼ 22 at i = 30. We then
compare these results with the 90 per cent confidence contours forthe radio emission as fitted with the jet model. We find that modelis compatible with the Comptonization model for the X-ray data ifβ = 0.3–0.5 (shown by the dotted and dashed contours forβ = 0.3and 0.5, respectively), but not ifβ = 0.7. For β = 0.3–0.5 and30 ≤ i ≤ 45, the radio data provide constraints onδ less restric-tive than the X-ray data. We show the best-fit ASM A model anda model for the Ryle data on the superorbital phase diagrams,seeFig. 3.
The main caveat to our results here is related to using theslab model for Comptonization. It is unlikely that the actual X-raysource in Cyg X-1 has exactly this geometry, and it is probably lessanisotropic. This would yield somewhat higher precession anglesthan those obtained by us, but it is unlikely to affect our qualita-tive conclusions. Also, we have used a specific (but rather typical)single spectrum to obtainF (ψ). However, though there is somespectral variability in the hard state (e.g. Ibragimov et al. 2005), itis aperiodic and its effect will be averaged out over a numberof su-perorbital cycles. Thus, using this assumption is unlikelyto affectsignificantly our results.
5 DISCUSSION AND CONCLUSIONS
We have studied a general problem of how precession can affectthe observed fluxes and spectra. Apart from an obvious case ofafull or partial covering of the central source by an accretion disc(e.g., in Her X-1, Leahy 2002), the observed flux can be modulatedif the emission pattern of the precessing source is anisotropic. Wehave studied a number of likely anisotropy patterns, due to eitherintrinsic anisotropy of the emission pattern in the source rest frame,or Doppler boosting of emission isotropic in the rest frame,or ab-sorption/scattering by a corona covering the disc. We have derivedformulae for the flux as a function of the precession phase forthoseprocesses. In addition, we have numerically calculated theX-rayanisotropy pattern due to thermal Comptonization and Comptonreflection in a plasma with parameters characteristic to black-holebinaries in the hard state and assuming a slab geometry.
We have then applied these results to the superorbital modu-lation of the 2.25–15 GHz radio and 1.5–300 keV X-ray emissionof Cyg X-1 in the hard state. We find that most models make sim-ilar predictions for the precession angle, i.e., the tilt between the
disc plane and the orbital plane, of the order ofδ ∼ 10–20. Thestatistical quality of all the models is similar, thus, theycannot bedistinguished on the basis of theirχ2. The model with absorptionby a disc corona yields strongly anticorrelated the opticaldepth andthe precession angle.
Our most physical model appears to be thermal Comptoniza-tion for the X-rays and jet Doppler boosting for the radio emis-sion. The joint constraint to the X-ray and radio data yieldsforβ = 0.3 the values ofδ >∼ 10, i<∼ 47; and for β = 0.5, thevalues of5<
∼ δ <∼ 10, 40<∼ i<∼ 60 (see Fig. 9). If we assume
30 ≤ i ≤ 45 (from other observational constraints on the in-clination, see Section 4.1), we obtain8<
∼ δ <∼ 22 from the X-raydata, which then impliesβ ∼ 0.3–0.5 using the Ryle data. Thus,both the disc/jet precession angle and the jet velocity in Cyg X-1appear relatively small. We also point out that our Comptonizationmodel also explains and well fits the decrease of the fractional su-perorbital modulation amplitude with the increasing photon energyobserved in the 1.5–300 keV X-ray emission of Cyg X-1. The de-crease is explained by the Comptonization anisotropy decreasingwith the photon energy due to the correspondingly increasing aver-age number of scatterings suffered by a photon.
Finally, it is interesting to compare our results for Cyg X-1with those for the well-known precessing jet source SS 433. In thatcase, the jet velocity and the precession angle are very preciselydetermined based on the Doppler shift of spectral lines (formed inthe jets). Their values areβ ' 0.265 andδ ' 21 (Eikenberry etal. 2001; see Fabrika 2004 for a review). They are rather similar tothose determined by us for Cyg X-1. However, the disc emissionis not seen at all due to heavy obscuration, and the radio emissionshows no periodic variability on either orbital or precesssional pe-riod. This appears to be related to the rather large inclination of SS433 ofi ' 78, at which the disc/jet system goes through the edge-on orientation at some point of each precessional cycle. Then, thecounter jet is seen at a lower inclination than the primary jet dur-ing a part of the cycle, and both of them contribute comparablyto the observed flux (see Section 4.1). Also, free-free absorptionof the radio emission is of importance in that system (e.g. Fabrika2004), which introduces a major complication to predictions of theprecessional variability given that details of the wind geometry areunknown. On the other hand, the precessional modulation is verysignificant in X-rays (Wen et al. 2006), emitted by the jets.
The disc/jet precession in SS 433 is probably caused by theprecession of the companion star, with the rotation axis inclinedto the orbital plane (see Fabrika 2004 and references therein). Onthe other hand, this precession mechanism is unlikely in CygX-1, where the orbit is strictly circular (Brocksopp et al. 1999b), in-dicating that tidal forces have also brought the stellar rotation toalignment. Then, the precession may be caused, e.g., by the gravi-tational force of the star acting on the inclined disc (e.g.,Larwood1998; L06).
ACKNOWLEDGMENTS
AI has been supported by the Graduate School in Astronomy andSpace Physics, Vaisala foundation and by the Russian Presiden-tial program for support of leading scientific schools (grant NSH-784.2006.2). AAZ has been supported by the Academy of Finlandexchange grant 112986, and by the Polish grants 1P03D01827,1P03D01128 and 4T12E04727. JP was supported by the Academyof Finland grants 102181, 109122, 110792 and 111720. We arethankful to Guy Pooley for the Ryle data, and to Paweł Lachow-
c© 2007 RAS, MNRAS000, 1–10
10 A. Ibragimov, A. A. Zdziarski and J. Poutanen
icz for helpful discussions. The Ryle Telescope is supported byPPARC. The Green Bank Interferometer is a facility of the NationalScience Foundation operated by the NRAO in support of NASAHigh Energy Astrophysics programs. We acknowledge the use ofdata obtained through the HEASARC online service provided byNASA/GSFC.
REFERENCES
Abubekerov M. K., Antokhina E. A., Cherepashchuk A. M., 2004,Astron. Rep., 48, 550
Arnaud K. A., 1996, in Jakoby G. H., Barnes J., eds, ASP Conf.Ser. Vol. 101, Astronomical Data Analysis Software and SystemsV. Astron. Soc. Pac., San Francisco, p. 17
Beloborodov A. M., 1999, ApJ, 510, L123Benlloch S., Wilms J., Staubert R., Nowak M. A., 2001, inGimenez A., Reglero A., Winkler C., eds., ESA SP-459, Explor-ing the gamma-ray universe. ESA, Noordwijk, p. 263
Benlloch S., Pottschmidt K., Wilms J., Nowak M. A., GleissnerT., Pooley G. G., 2004, AIPC, 714, 61
Bradt H. V., Rothschild R. E., Swank J. H., 1993, A&AS, 97, 355Brocksopp C., Fender R. P., Larionov V., Lyuty V. M., TarasovA.E., Pooley G. G., Paciesas W. S., Roche P., 1999a, MNRAS, 309,1063
Brocksopp C., Tarasov A. E., Lyuty V. M., Roche O., 1999b,A&A, 343, 861
Brocksopp C., Fender R. P., Pooley G. G., 2002, MNRAS, 336,699
Caproni A., Livio M., Abraham Z., Mosquera Cuesta H. J., 2006,ApJ, 653, 112
Chandrasekhar S., 1960, Radiative Transfer. Dover, New YorkDi Salvo T., Done C.,Zycki P. T., Burderi L., Robba N. R., 2001,ApJ, 547, 1024
Eikenberry S. S., Cameron P. B., Fierce B. W., Kull D. M., DrorD. H., Houck J. R., Margon B., 2001, ApJ, 561, 1027
Esin A. A., Narayan R., Cui W., Grove J. E., Zhang S., 1998, ApJ,505, 854
Fabrika S., 2004, Astrophys. Space Phys. Rev., 12, 1Fender R. P., Pooley G. G., Durouchoux P., Tilanus R. P. J., Brock-sopp C., 2000, MNRAS, 312, 853
Frontera F. et al., 2001, ApJ, 546, 1027Gallo E., Fender R. P., Pooley G. G., 2003, MNRAS, 344, 60Gierlinski M., Zdziarski A. A., Done C., Johnson W. N., EbisawaK., Ueda Y., Haardt F., Phlips B. F., 1997, MNRAS, 288, 958
Gies D. R., Bolton C. T., 1986, ApJ, 304, 371Gleissner T. et al., 2004, A&A, 425, 1061Gregory P. C., Xu H.-J., Backhouse C. J., Reid A., 1989, ApJ, 339,1054
Grove J. E., Johnson W. N., Kroeger R. A., McNaron-Brown K.,Skibo J. G., 1998, ApJ, 500, 899
Ibragimov A., Poutanen J., Gilfanov M., Zdziarski A. A., ShraderC. R., 2005, MNRAS, 362, 1435
Karitskaya E. A., et al., 2001, Astron. Rep., 45, 350Katz J. I., 1973, Nat. Phys. Sci., 246, 87Katz J. I., 1980, ApJ, 236, L127Lachowicz P., Zdziarski A. A., Schwarzenberg-Czerny A., PooleyG. G., Kitamoto S., 2006, MNRAS, 368, 1025 (L06)
Larwood J., 1998, MNRAS, 299, L32LaSala J., Charles P.A., Sith R. A. D., Bałucinska-Church M.,Church M. J., 1998, MNRAS, 301, 285
Leahy D. A., 2002, 334, 847
Levine A. M., Bradt H., Cui W., Jernigan J. G., Morgan E. H.,Remillard R., Shirey R. E., Smith D. A., 1996, ApJ, 469, L33
Lomb N. R., 1976, Ap&SS, 39, 447Maccarone T. J., 2005, MNRAS, 360, L68Magdziarz P., Zdziarski A. A., 1995, MNRAS, 273, 837Malzac J., Beloborodov A., Poutanen J., 2001, MNRAS, 326, 417Markoff S., Nowak M. A., Wilms J., 2005, ApJ, 635, 1203McConnell M. L. et al., 2002, ApJ, 572, 984Ogilvie G. I., Dubus G., 2001, MNRAS, 320, 485Ozdemir S., Demircan O., 2001, Ap&SS, 278, 319Pooley G. G., Fender R. P., Brocksopp C., 1999, MNRAS, 302,L1
Poutanen J., 1998, in Abramowicz M. A., Bjornsson G., PringleJ. E., eds, Theory of Black Hole Accretion Discs. CambridgeUniv. Press, Cambridge, p. 100
Poutanen J., Svensson R., 1996, ApJ, 470, 249Poutanen J., Zdziarski A. A., 2003, in Durouchoux Ph., FuchsY.,Rodriguez J., eds, New Views on Microquasars. Center for SpacePhysics, Kolkata, p. 87
Poutanen J., Krolik J. H., Ryde F., 1997, MNRAS, 292, L21Rybicki G. B., Lightman A. P., 1979, Radiative Processes in As-trophysics. Wiley, New York
Scargle J. D., 1982, ApJ, 263, 835Schwarzenberg-Czerny A., 1991, MNRAS, 253, 198Sikora M., Madejski G., Moderski R., Poutanen J., 1997, ApJ,484, 108
Sobolev V. V., 1963, A Treatise on Radiative Transfer. Van Nos-trand, Princeton
Stirling A. M., Spencer R. E., de la Force C. J., Garrett M. A.,Fender R. P., Ogley R. N., 2001, MNRAS, 327, 1273
Sunyaev R. A., Titarchuk L. G., 1985, A&A, 143, 374Szostek A., Zdziarski A. A., 2007, MNRAS, 375, 793Torres D. F., Romero G. E., Barcons X., Lu Y., 2005, ApJ, 626,1015
Viironen K., Poutanen J., 2004, A&A, 426, 985Wardzinski G., Zdziarski A. A., Gierlinski M., Grove J. E., JahodaK., Johnson W. N., 2002, MNRAS, 337, 829
Wen L., Cui W., Levine A. M., Bradt H. V., 1999, ApJ, 525, 968Wen L., Levine A. M., Corbet R. H. D., Bradt H. V., 2006, ApJS,163, 372
Wijers R. A. M. J., Pringle J. E., 1999, MNRAS, 308, 207Yuan F., Zdziarski A. A., Xue Y., Wu X.-B., 2007, ApJ, 659, 541Zdziarski A. A., Gierlinski M., 2004, Progr. Theor. Phys. Suppl.,155, 99
Zdziarski A. A., Poutanen J., Mikołajewska J., GierlinskiM., Ebi-sawa K., Johnson W. N., 1998, MNRAS, 301, 435
Zdziarski A. A., Poutanen J., Paciesas W. S., Wen L., 2002, ApJ,578, 357
Zdziarski A. A., Lubinski P., Gilfanov M., Revnivtsev M., 2003,MNRAS, 342, 355
Zdziarski A. A., Gierlinski M., Mikołajewska J., Wardzinski G.,Smith D. M., Harmon B. A., Kitamoto S., 2004, MNRAS, 351,791
Zdziarski A. A., Wen L., Gierlinski M., 2007, MNRAS, 377, 1006Ziołkowski J., 2005, MNRAS, 358, 851
c© 2007 RAS, MNRAS000, 1–10
Related Documents