Economic Information Bulletin Number 44 March 2009 United States Department of Agriculture Economic Research Service Jean C. Buzby, Hodan Farah Wells, Bruce Axtman, and Jana Mickey Supermarket Loss Estimates for Fresh Fruit, Vegetables, Meat, Poultry, and Seafood and Their Use in the ERS Loss-Adjusted Food Availability Data

Welcome message from author
This document is posted to help you gain knowledge. Please leave a comment to let me know what you think about it! Share it to your friends and learn new things together.
Transcript
Economic InformationBulletinNumber 44
March 2009
United States Department of Agriculture
Economic Research Service
Jean C. Buzby, Hodan Farah Wells, Bruce Axtman, and Jana Mickey
Supermarket Loss Estimates for Fresh Fruit, Vegetables, Meat, Poultry, and Seafood and Their Use in the ERS Loss-Adjusted Food Availability Data

ww
w.er
s.usda.gov
Find additional information about the ERS Loss-Adjusted Food Availability data at:
Visit Our Website To Learn More!
National Agricultural LibraryCataloging Record:
The U.S. Department of Agriculture (USDA) prohibits discrimination in all its programs and activities on the basis of race, color, national origin, age, disability, and, where applicable, sex, marital status, familial status, parental status, religion, sexual orientation, genetic information, political beliefs, reprisal, or because all or a part of an individual's income is derived from any public assistance program. (Not all prohibited bases apply to all programs.) Persons with disabilities who require alternative means for communication of program information (Braille, large print, audiotape, etc.) should contact USDA's TARGET Center at (202) 720-2600 (voice and TDD).
To file a complaint of discrimination write to USDA, Director, Office of Civil Rights, 1400 Independence Avenue, S.W., Washington, D.C. 20250-9410 or call (800) 795-3272 (voice) or (202) 720-6382 (TDD). USDA is an equal opportunity provider and employer.
Supermarket loss estimates for fresh fruit, vegetables, meat, poul-try, and seafood and their use in the ERS loss-adjusted food avail-ability data.
(Economic information bulletin ; no. 44)
1. Food supply—United States. 2. Supermarkets—United States. 3. Food spoilage—Estimates—United States—Statistics.
4. Fruit—Losses—United States. 5. Vegetables—Losses—United States. 6. Meat—Losses—United States.
7. Poultry—Losses—United States. 8. Seafood—Losses—United States. I. Buzby, Jean C.
II. United States. Dept. of Agriculture. Economic Research Service. III. Title.
HD9004
www.ers.usda.gov/
Photo credit: Shutterstock
Data/FoodConsumption
United StatesDepartmentof Agriculture
www.ers.usda.gov
A Report from the Economic Research Service
AbstractA certain amount of food in supermarkets is deemed unusable (“food loss”) because of moisture loss, spoilage, and other causes. This study analyzed updated food loss esti-mates for fresh fruit, vegetables, meat, poultry, and seafood obtained through a competi-tive grant with the Perishables Group, Inc. This independent consulting fi rm compared supplier shipment data with point-of-sale data from six large national and regional super-market retailers to identify loss in 2005 and 2006. The new estimates, when incorporated into the ERS Loss-Adjusted Food Availability data, had little impact on aggregate per capita food loss estimates in 2006 because the new estimates were, on average, close to the previous loss assumptions. The new estimates increased annual per capita estimates of fresh fruit available at the retail level by 0.7 pounds (0.6 percent), 4.2 pounds (2.7 percent) for fresh vegetables, and 4.8 pounds (2.7 percent) for fresh meat, poultry, and seafood. The commodity-specifi c food loss estimates are more accurate than in previous years.
Keywords: Conversion factor, food loss, fruit, meat, poultry, seafood, supermarket, vegetables
About the Authors
Buzby and Wells are with USDA’s Economic Research Service; Axtman and Mickey are with the Perishables Group, Inc.
Acknowledgments
The authors wish to thank ERS colleagues Mark Denbaly and Ephraim Leibtag, as well as Gayle Kaneaster of USDA’s Agricultural Research Service (ARS) for their assistance with the competitive grants process. The authors also wish to thank Priscilla Smith and Cynthia A. Ray for their help with editing and production of this report.
Jean C. Buzby, Hodan Farah Wells, Bruce Axtman, and Jana Mickey
Supermarket Loss Estimates for Fresh Fruit, Vegetables, Meat, Poultry, and Seafood and Their Use in the ERS Loss-Adjusted Food Availability Data
EconomicInformationBulletinNumber 44
March 2009

iiSupermarket Loss Estimates for Fresh Fruit, Vegetables, Meat, Poultry, and Seafood... / EIB-44
Economic Research Service/USDA
Contents
Summary. . . . . . . . . . . . . . . . . . . . . . . . . . . . . . . . . . . . . . . . . . . . . . . . . . . iii
Introduction . . . . . . . . . . . . . . . . . . . . . . . . . . . . . . . . . . . . . . . . . . . . . . . . . 1
Data Collection and Analysis . . . . . . . . . . . . . . . . . . . . . . . . . . . . . . . . . . . 4
Results . . . . . . . . . . . . . . . . . . . . . . . . . . . . . . . . . . . . . . . . . . . . . . . . . . . . . . 7
Fresh Fruit . . . . . . . . . . . . . . . . . . . . . . . . . . . . . . . . . . . . . . . . . . . . . . . . . 7
Fresh Vegetables . . . . . . . . . . . . . . . . . . . . . . . . . . . . . . . . . . . . . . . . . . . 11
Fresh Meat, Poultry, and Seafood. . . . . . . . . . . . . . . . . . . . . . . . . . . . . . 14
Discussion . . . . . . . . . . . . . . . . . . . . . . . . . . . . . . . . . . . . . . . . . . . . . . . . . . 18
References . . . . . . . . . . . . . . . . . . . . . . . . . . . . . . . . . . . . . . . . . . . . . . . . . . 20
Recommended citation format for this publication:
Buzby, Jean C., Hodan Farah Wells, Bruce Axtman, and Jana Mickey. Supermarket Loss Estimates for Fresh Fruit, Vegetables, Meat, Poultry, and Seafood and Their Use in the ERS Loss-Adjusted Food Availability Data. EIB-44, U.S. Dept. of Agriculture, Econ. Res. Serv. March 2009.

iiiSupermarket Loss Estimates for Fresh Fruit, Vegetables, Meat, Poultry, and Seafood... / EIB-44
Economic Research Service/USDA
Summary
ERS maintains the web-based Loss-Adjusted Food Availability data series, an important resource for estimating trends in the amount of food available for consumption over time. By tracking food loss—food made inedible by moisture loss, spoilage, and other causes—analysts can estimate how much food is eaten per person over a given period.
What Is the Issue?
Some of the food loss assumptions used in the ERS Loss-Adjusted Food Availability data were seemingly simplistic and may not have refl ected current manufacturing, retail, and food preparation practices. Retail food loss was particularly diffi cult to estimate. Prior to this study, the per capita food loss estimates at the retail level were, across the board, 12 percent for every fresh fruit and vegetable commodity (e.g., fresh strawberries, fresh spinach) and 7 percent for every type of meat, poultry, and seafood (i.e., fi sh and shellfi sh, both farm-raised and wild-caught) covered in the database. More precise estimates for each fresh commodity are desirable to refl ect physical differences in spoilage rates and other reasons that infl uence food loss, such as use of innovative packaging to prolong shelf life. Using new estimates for each commodity could affect ERS calculations of the amounts of different foods available for consumption.
What Did the Study Find?
This report and the accompanying ERS Loss-Adjusted Food Availability data give analysts, for the fi rst time, national estimates of the food loss percentage at the supermarket level for each fresh fruit, vegetable, meat, and poultry commodity in the data set. The average loss rates for 2005-06 for individual fresh fruit, vegetable, meat, and poultry commodities at the supermarket level, as estimated by the Perishables Group, Inc., varied from 0.6 percent for sweet corn to 63.6 percent for mustard greens. The study also provided new average estimates for all fi sh and all shellfi sh. When the study incorporated the new loss estimates into the ERS Loss-Adjusted Food Availability data series, the impact on per capita estimates varied broadly among commodities within a food group (e.g., among all fresh fruit). The largest annual impacts, per capita, were for fresh potatoes, chicken, beef, pork, bananas, and sweet corn—all of which have high shares of food available for consumption for their respective food groups.
However, as a whole, the new food loss estimates had little impact on average food loss rates for each food group in the ERS Loss-Adjusted Food Availability data series or on per capita estimates of the quantity of the different food groups available for consumption at the retail level because the newer estimates were generally close to the earlier loss assumptions. Compared with the earlier ERS per capita food loss estimates of 12 percent for each type of fruit and vegetable and 7 percent for each type of meat, poultry, and seafood covered in the database, ERS found that annual super-market losses for 2005 and 2006 averaged 11.4 percent for fresh fruit, 9.7 percent for fresh vegetables, and 4.5 percent for fresh meat, poultry, and seafood. The new estimates would increase per capita estimates at the retail level in 2005 by 0.7 pounds (0.6 percent) for fresh fruit, 4.2 pounds (2.7
ivSupermarket Loss Estimates for Fresh Fruit, Vegetables, Meat, Poultry, and Seafood... / EIB-44
Economic Research Service/USDA
percent) for fresh vegetables, and 4.8 pounds (2.7 percent) for fresh meat, poultry, and seafood. Dividing these annual changes in per capita estimates by 365 days results in very small daily per capita changes.
How Was the Study Conducted?
ERS obtained updated food loss estimates at the retail level for individual fresh fruits, vegetables, meat, and poultry and aggregate estimates for all fi sh and all shellfi sh from the Perishables Group, Inc. and applied them to update some of the assumptions used in constructing ERS Loss-Adjusted Food Availability data to see how they affected per capita estimates of the food available for consumption. The Perishables Group, Inc., an independent consulting fi rm, used a sample of data from six large national and regional supermarket retailers from their proprietary database. The sample did not include convenience stores, megastores, club stores, and mom-and-pop grocery stores. For each store in the sample, supplier shipment data for 2005 and 2006 was paired with point-of-sale data to identify food loss percentages for each covered commodity. For fresh meat, poultry, and seafood, data were supplemented by the Perishables Group with qualitative information from more than 10 retailers. The study also compared loss estimates for 2005 and 2006 as a validation of methods used.

1Supermarket Loss Estimates for Fresh Fruit, Vegetables, Meat, Poultry, and Seafood... / EIB-44
Economic Research Service/USDA
Introduction
In 1941, the U.S. Department of Agriculture (USDA) fi rst published compre-hensive data to assess the availability of food and nutrients for the U.S. civilian population and to provide a basis for comparisons with the food supplies of our World War II allies. By 1949, USDA had extended the data back to 1909 for most commodities. Since 1949, the database has been maintained and updated every year with very few exceptions. The data measure the food supply of over 200 food commodities, such as beef, fresh apples, and eggs.
The Food Availability data represent the supply of food available for consumption in the United States. For a given year, the supply of each commodity is the sum of production, imports, and beginning inventories, and from this amount, USDA’s Economic Research Service (ERS) subtracts out exports, farm and industrial uses, and ending stocks. USDA collects data on these components directly from producers and distributors using techniques that vary by commodity. These data are not collected from indi-vidual consumers, and thus provide an independent basis for examining food consumption trends. Per capita estimates are calculated by dividing the total annual availability for a commodity by the U.S. population for that year.
ERS manages and disseminates the Food Availability data within a data system posted on the ERS website (www.ers.usda.gov/Data/FoodConsumption/). The data system is the only source of time series data on the food available for human consumption in the country. Accordingly, the data play a key role in monitoring the potential of the food supply to meet the nutritional needs of Americans and to examine historical consumption trends.
The Food Availability data overstate the amount of food actually ingested because they do not take into account all of the substantial quantities of food lost to human use through waste, moisture loss, and spoilage beyond the farm gate in the marketing system and the home. Therefore, in the mid-1990s, ERS developed methods to adjust the availability data for spoilage and other losses. In particular, the Loss-Adjusted Food Availability data series refi nes the Food Availability data more fully for three general types of losses:
(1) loss from primary (e.g., farm) to retail weight.
(2) loss at the retail level (e.g., in supermarkets, megastores such as Walmart, and other retail outlets, including convenience stores and mom-and-pop grocery stores). This type of loss does not include losses in restaurants and other foodservice outlets.
(3) loss at the consumer level. This includes losses for food consumed at home and away from home (e.g., restaurants, fast-food outlets, etc.) by consumers and foodservice and has two components:
(a) “Nonedible share” of a food (e.g., asparagus stalk, apple core). Data on the nonedible share are from the National Nutrient Data-base for Standard Reference, compiled by USDA’s Agricultural Research Service (U.S. Department of Agriculture, 2007).
(b) “Cooking loss and uneaten food such as plate waste” from the edible share.

2Supermarket Loss Estimates for Fresh Fruit, Vegetables, Meat, Poultry, and Seafood... / EIB-44
Economic Research Service/USDA
Each commodity in the Loss-Adjusted Food Availability data has a spread-sheet posted on the ERS website that provides the loss assumptions used by ERS (www.ers.usda.gov/Data/FoodConsumption/FoodGuideIndex.htm). Each fruit and vegetable has a separate spreadsheet for each type of processing. For example, apples have spreadsheets for fresh, frozen, dehydrated/dried, and canned apples as well as a spreadsheet for apples made into juice. These loss estimates are sometimes called “conversion factors,” particularly when describing how a farm commodity is transformed into a consumer-ready product (e.g., fresh chicken to boneless fresh chicken).
One of ERS’s long-term goals for the food availability data system is to rigorously update the loss assumptions of the Loss-Adjusted Food Availability data so that the data series replaces the food availability data as ERS’ premiere estimate for food consumption over time. ERS aims to update the loss estimates for each covered commodity for the most recent years of data available, and ascertain if any of these loss estimates have changed since 1970, the fi rst year in the data series. If there have been changes, ERS plans to explore the reasons for these changes.
Figure 1
Loss-adjusted food availability data for fresh apples, per capita, in 2005
1This 12-percent estimate is the estimate used prior to this study.2MyPyramid equivalents can be thought of as “servings” needed to meet the dietary recommendations. See www.mypyramid.gov/pyramid/index.html for details.
Loss from farm to retail: 4%
Farm weight: 17.1 lbs
Retail weight: 16.4 lbs
Consumer weight: 14.4 lbs
Loss-adjustedquantity available:
Loss from retail to consumer: 12%1
Loss at consumer level: 29%(includes spoilage, plate waste, and losses from inedible parts
(stems and cores)
(1) 10.4 lbs available per year(2) 0.5 oz (12.9 grams) per day (3) 6.9 calories available per day(4) .122 MyPyramid equivalents available per day2

3Supermarket Loss Estimates for Fresh Fruit, Vegetables, Meat, Poultry, and Seafood... / EIB-44
Economic Research Service/USDA
The previous ERS estimates of food loss were documented to varying degrees, ranging from little to no documentation for the estimates at the retail level to well-documented estimates on the nonedible share for each food. Therefore, the objectives of this study were to obtain and document updated estimates of food loss at the retail level using supermarket loss estimates from the Perishables Group, Inc., as an estimate for food loss at the retail level even though the updated data do not include convenience stores, mega-stores, club stores, and mom-and-pop grocery stores. Because the previous estimates of retail food loss were so poorly documented, one well-docu-mented estimate for each fresh food at supermarkets is an important improve-ment. The report also provides an analysis of how the updated loss estimates impact the Loss-Adjusted Food Availability data.

4Supermarket Loss Estimates for Fresh Fruit, Vegetables, Meat, Poultry, and Seafood... / EIB-44
Economic Research Service/USDA
Data Collection and Analysis
The Perishables Group, Inc. (PG), an independent consulting fi rm in the fresh food industry, conducted the data collection, estimated the new loss factors, and analyzed the relationships between the new loss factors and the current activities and trends (e.g., consumer purchasing behaviors, in-store retail activities, such as product handling and industry supply chain activi-ties) in the U.S. supermarket sector.1 The PG proprietary data represents point-of-sale data collected from conventional U.S. grocery store chains that have more than $2 million in sales annually. The chains include key national and regional retailers such as Safeway, Kroger, Albertson’s, and Ahold. As of May 2008, Perishables Group data represented 62.8 percent of the total grocery-channel dollars. The data omit the total grocery-channel dollars from independent grocers and retailers that do not report sales to syndicated data providers, including convenience stores, mom-and-pop grocery stores, mass retailers/club stores (Costco), and megastores (Walmart). The Perishables Group has a business alliance with Nielsen (formerly ACNielsen), which collects point-of-sale data from over 13,000 retail supermarkets across the United States. Nielsen provides sales data across the fi ve fresh departments (produce, bakery, meat, seafood, and deli) to PG, which has a customized data production process to effectively code and analyze data on food loss.
The Perishables Group identifi ed the shipment data (supplier shipments to retailers) available in their proprietary data set appropriate for this analysis. In order to be used in the analysis sample, data from each store under consideration had to have both weekly shipment data on a particular food commodity (e.g., actual purchases, measured in pounds, of fresh boneless chicken breast shipments sent from a supplier to the store) and point-of-sale data on consumer purchases (e.g., scanner data showing the pounds of fresh boneless chicken breasts sold). Combined, these two types of information enabled the Perishables Group to match shipment data to purchase data so that percentage of food loss could be calculated as the residual for each fresh food commodity covered in the Loss-Adjusted Food Availability data. The data sample includes information from over 600 stores from six large national and regional food retail chains that, combined, are located in all four U.S. regions—East, South, Central, and West. Data were collected for 2005 and 2006 full calendar years. If the complete 2-year timeframe was not avail-able for a specifi c retailer, the data within this time period were used. Four of the six retailers had complete data. For the two retailers missing some data (one was missing 2 months and the other 5 months), the Perishables Group did not extrapolate the data to a full year, but rather used the data “as is” to develop the averages.
Retailer shipment and point-of-sale data were coded for the fresh commodi-ties covered in the Loss-Adjusted Food Availability data. Both the shipment data and the point-of-sale data are at the item level. For example, a 2-pound bag of fresh carrots would be identifi ed by its universal product code (UPC) and its purchase by a particular store. Therefore, the data can be aggregated to the appropriate product level at a particular store and a loss rate can be calculated. “Fresh carrots” consists of UPC-coded baby carrots, shredded carrots, and 1-, 3-, and 5-pound bags of whole carrots, plus whole carrots sold by random weight. The food-loss percentage was calculated as pounds
1The Perishables Group, Inc., conducted the research for the new food loss estimates under Grant No. 53-3K06-06-0801).

5Supermarket Loss Estimates for Fresh Fruit, Vegetables, Meat, Poultry, and Seafood... / EIB-44
Economic Research Service/USDA
of a particular product that came into the store but were not sold (i.e., the “residual food loss”), divided by the pounds (or other appropriate unit) of that product that came into the store. This methodology yields actual, as opposed to estimated, loss rates and provides accurate tracking of food loss trends across fresh food categories. This methodology and the data sources offer the most accurate possible depiction of retail loss activity for fresh food items on a national level (both random-weight and UPC-coded items). These data are based on true aggregates of all store data, not projections.
Retailer categories were aggregated where necessary to match food catego-ries in the ERS Loss-Adjusted Food Availability data as closely as possible, so that the new loss estimates could be incorporated later into the ERS data set. For example, data on all random-weight apples (e.g., Gala, Granny Smith, McIntosh, Red Delicious, and Golden Delicious) were combined with UPC-coded apples to match the ERS category for “fresh apples.” UPC-coded apples included packaged apples sold in a bag or “value-added” ones such as presliced apples. Data were only used for apples by themselves, that is, the data did not include caramel or candy-coated apples or sliced apples mixed with other kinds of fruit. Fresh fruit mixtures were not included because the Perishables Group did not have data on the share or weight of the different fruits in each mixture. Sliced or otherwise minimally processed fresh apples were included if they were not mixed with other fruit and if they were still sold as fresh apples. Similarly, fresh vegetable mixtures were not included. Some aggregations required additional information gathering and decision-making between ERS and the Perishables Group, such as whether arugula should be included with the ERS group “romaine and leaf lettuce.” In each case, the goal was to have store purchase and store sales aggregates that were consistent with the foods in the Loss-Adjusted Food Availability data. The end result was that the Perishables Group aggregated their data and provided new loss estimates for each of the fresh fruits, vegetables, meat, and poultry covered in the Loss-Adjusted Food Availability data plus estimates for all fi sh and all shellfi sh (see box, “Fresh Food Commodities Covered in the Perishables Group (PG) Data and Analysis”).
The Perishables Group solicited additional qualitative loss and shipment data and insights for meat, poultry, and seafood (i.e., fi sh and shellfi sh, both farm-raised and wild-caught) from more than 10 retailers via their current business relationships. Retailers did not track meat, poultry, and seafood shipment data as effectively as they tracked produce shipment data. Therefore, these departments did not have the same level of detail available as produce depart-ments did. The Perishables Group developed and distributed a supporting study among their retail contacts to obtain additional insight on the food loss as it related to meat, poultry, and seafood.

6Supermarket Loss Estimates for Fresh Fruit, Vegetables, Meat, Poultry, and Seafood... / EIB-44
Economic Research Service/USDA
Fresh Food Commodities Covered in the Perishables Group (PG) Data and Analysis
Fruit Vegetables1 Meat, Poultry & Seafood
Oranges
Tangerines
Grapefruits
Lemons
Limes
Apples
Apricots
Avocados
Bananas
Blueberries
Cantaloups
Cherries
Cranberries
Grapes
Honeydew melons
Kiwis
Mangoes
Peaches
Pears
Pineapples
Papayas
Plums
Strawberries
Watermelons
Artichokes
Asparagus
Bell peppers
Broccoli
Brussels sprouts
Cabbage
Carrots
Caulifl ower
Celery
Collard greens
Sweet corn
Cucumbers
Eggplant
Escarole/endive
Garlic
Head lettuce
Kale
Romaine and leaf lettuce
Mushrooms
Mustard greens
Okra
Onions
Potatoes
Pumpkins
Radishes
Snap beans
Spinach
Squash
Sweet potatoes
Tomatoes
Turnip greens
Red Meat
Beef
Veal
Pork
Lamb/Goat2
Poultry
Chicken
Turkey
Seafood
Fish
Shellfi sh
1 Lima bean data were not available from any of the retailers participating in the study.2 A small portion of goat was included in the PG data for lamb. The PG estimates show that goat made up 0.12 percent of the lamb/goat category.
Source: Perishables Group fi nal report to ERS, September 28, 2007.

7Supermarket Loss Estimates for Fresh Fruit, Vegetables, Meat, Poultry, and Seafood... / EIB-44
Economic Research Service/USDA
Results
For each food group, this study presents the new loss estimates for 2005 and 2006 from the Perishables Group, Inc., grant and then analyzes the updated Loss-Adjusted Food Availability data after ERS incorporated the 2005-06 average supermarket loss estimate as an estimate for retail loss for each fresh food. The new supermarket loss estimates do not include loss in megastores, club stores, mom-and-pop grocery stores, or convenience stores. There are determinants of supermarket losses, such as product turnover, inherent product perishability (e.g., spoilage and moisture loss) and availability, and appropriate application of technologies to prevent product deterioration (e.g., refrigeration and produce-misting equipment). Loss rates may change over time as consumer demand changes, new products are introduced that broaden food choices, and new technologies are adopted by industry.
The study compared loss estimates for 2005 and 2006 data as a validation of methods used. Widely varying estimates in 2005 and 2006 for a particular fresh food could suggest that there is greater year-to-year variability in the loss estimates. Or, more importantly, widely varying estimates could mean that one of the estimates may be an outlier, and it should be considered more closely when deciding whether to use it to compute the 2005-06 average for inclusion as an estimate of the retail loss for that food in the Loss-Adjusted Food Availability data. However, 2 years of data are insuffi cient to make fi rm conclusions about increases or decreases in loss estimates. The study also compared the 2005-06 average loss estimates for each food group with the data used in the Loss-Adjusted Food Availability data.
Fresh Fruit
The overall average supermarket loss rate during 2005-06 varied consider-ably for individual commodities covered in the fresh fruit section. Average estimated food loss for fruit at the supermarket level decreased 2.3 percentage points from 10.7 percent in 2005 to 8.4 percent in 2006. One possible theory for this decreased loss could be the increased popularity of fresh-cut fruit. During the 52 weeks ending June 30, 2007, national average weekly sales of fresh-cut produce per store rose 8.3 percent from the previous year (Morley, 2007). Fresh-cut produce is one of the fastest-growing categories in the produce department. Although fresh-cut fruit tends to have a shorter shelf life than other types of processed fruit and although more rinds, cores, etc., were trimmed away by supermarkets in preparing the fresh-cut fruit, the demand for fresh-cut fruit may have been suffi ciently high to reduce the total loss for fresh fruit. ERS used the 2005-06 average change because it provides a snapshot of what might potentially be a longer term trend, arising from a new technology or a change in demand, for example. On the other hand, changes could also refl ect some unidentifi ed fl uctuations in the data.
Blueberries had the lowest loss in 2006 (4.6 percent), though cherries had the lowest 2005-06 average loss (3.9 percent). Blueberries are typically sold in clear plastic clamshells, which prevent high food loss and allow for a longer shelf life. Over the past year, several new varieties of hardy blueberries have increased overall blueberry shelf life.
8Supermarket Loss Estimates for Fresh Fruit, Vegetables, Meat, Poultry, and Seafood... / EIB-44
Economic Research Service/USDA
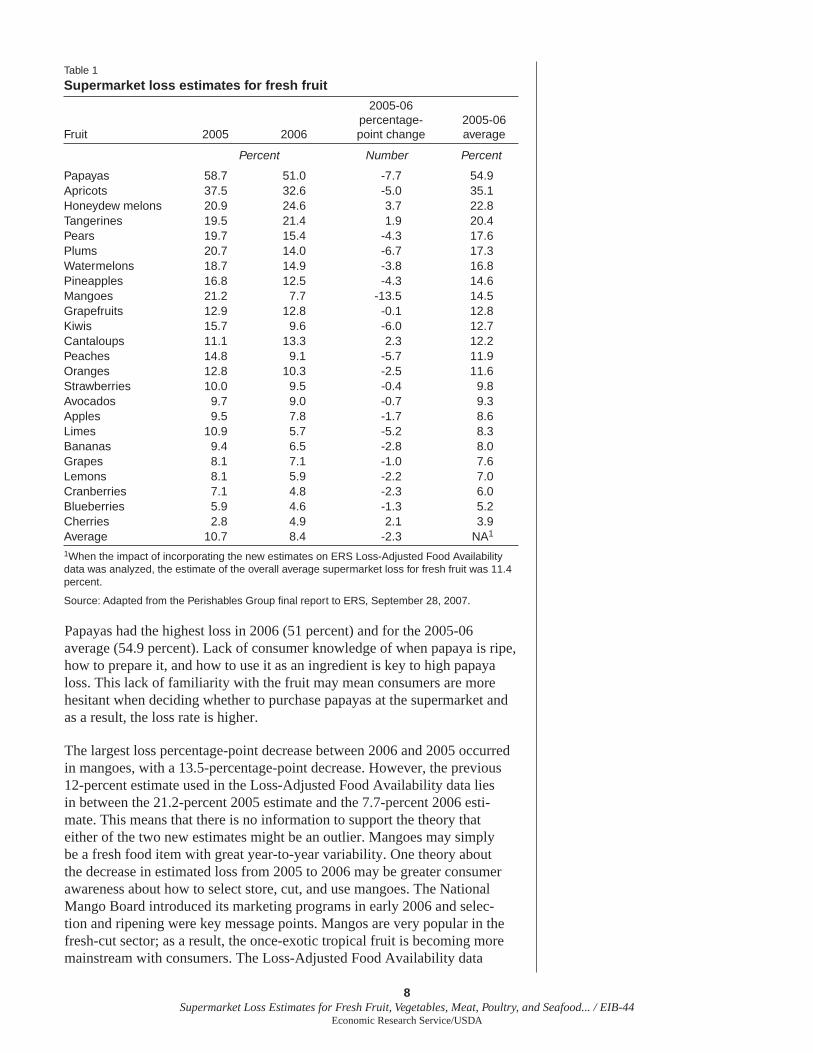
Papayas had the highest loss in 2006 (51 percent) and for the 2005-06 average (54.9 percent). Lack of consumer knowledge of when papaya is ripe, how to prepare it, and how to use it as an ingredient is key to high papaya loss. This lack of familiarity with the fruit may mean consumers are more hesitant when deciding whether to purchase papayas at the supermarket and as a result, the loss rate is higher.
The largest loss percentage-point decrease between 2006 and 2005 occurred in mangoes, with a 13.5-percentage-point decrease. However, the previous 12-percent estimate used in the Loss-Adjusted Food Availability data lies in between the 21.2-percent 2005 estimate and the 7.7-percent 2006 esti-mate. This means that there is no information to support the theory that either of the two new estimates might be an outlier. Mangoes may simply be a fresh food item with great year-to-year variability. One theory about the decrease in estimated loss from 2005 to 2006 may be greater consumer awareness about how to select store, cut, and use mangoes. The National Mango Board introduced its marketing programs in early 2006 and selec-tion and ripening were key message points. Mangos are very popular in the fresh-cut sector; as a result, the once-exotic tropical fruit is becoming more mainstream with consumers. The Loss-Adjusted Food Availability data
Table 1
Supermarket loss estimates for fresh fruit
2005-06 percentage- 2005-06Fruit 2005 2006 point change average
Percent Number Percent
Papayas 58.7 51.0 -7.7 54.9Apricots 37.5 32.6 -5.0 35.1Honeydew melons 20.9 24.6 3.7 22.8Tangerines 19.5 21.4 1.9 20.4Pears 19.7 15.4 -4.3 17.6Plums 20.7 14.0 -6.7 17.3Watermelons 18.7 14.9 -3.8 16.8Pineapples 16.8 12.5 -4.3 14.6Mangoes 21.2 7.7 -13.5 14.5Grapefruits 12.9 12.8 -0.1 12.8Kiwis 15.7 9.6 -6.0 12.7Cantaloups 11.1 13.3 2.3 12.2Peaches 14.8 9.1 -5.7 11.9Oranges 12.8 10.3 -2.5 11.6Strawberries 10.0 9.5 -0.4 9.8Avocados 9.7 9.0 -0.7 9.3Apples 9.5 7.8 -1.7 8.6Limes 10.9 5.7 -5.2 8.3Bananas 9.4 6.5 -2.8 8.0Grapes 8.1 7.1 -1.0 7.6Lemons 8.1 5.9 -2.2 7.0Cranberries 7.1 4.8 -2.3 6.0Blueberries 5.9 4.6 -1.3 5.2Cherries 2.8 4.9 2.1 3.9Average 10.7 8.4 -2.3 NA1
1When the impact of incorporating the new estimates on ERS Loss-Adjusted Food Availability data was analyzed, the estimate of the overall average supermarket loss for fresh fruit was 11.4 percent.
Source: Adapted from the Perishables Group fi nal report to ERS, September 28, 2007.

9Supermarket Loss Estimates for Fresh Fruit, Vegetables, Meat, Poultry, and Seafood... / EIB-44
Economic Research Service/USDA
estimate that per capita availability for mangoes is still small compared with more popular fruits. Mango per capita availability increased more than 56 percent between 1996 and 2006 from 0.55 pounds per year to .86 pounds per year. Meanwhile, signifi cant declines in loss also occurred for papayas, plums, kiwis, peaches, and limes. The decline in lime loss may be attributed to increased lime sales over the past year, especially within specifi c regions of the United States.
The largest loss percentage-point increase between 2005 and 2006 occurred for honeydew melons (3.7 percent) and cantaloups (2.3 percent). These increases are small and do not suggest that there were outliers in the new data. Honeydew and cantaloup quality often varies from year to year based on crop conditions. Increased loss of these two products could be due to a lower quality crop in 2006. ERS used the 2005-06 average loss for each fresh food, and this reduced the impact of a single low-quality crop year of these melons on the Loss-Adjusted Food Availability data.
Both apples and bananas had declines in loss from 2005 to 2006 (1.7 and 2.8 percent, respectively), a portion of which can be attributed to the use of new postharvest technology that better controls ripening and rotting. According to the Loss-Adjusted Food Availability data, Americans consume more fresh apples and bananas than any other fresh fruits.
Next, ERS used the 2005-06 estimated average supermarket losses for each type of fruit in the Loss-Adjusted Food Availability data to see how these estimates would change the per capita estimates of the food available for consumers to take home from retail stores. One important concept to under-stand here is that the updated per capita commodity estimates (after incorpo-rating the Perishables Group loss estimates) represent the loss-adjusted food available for consumption at the retail level and that additional consumer-level losses (e.g., plate waste at home and away from home) are accounted for later in the Loss-Adjusted Food Availability data to calculate the fi nal estimates of food available for consumption.
Table 2 shows that the total impact of using the 2005-06 average Perishables Group estimates from table 1 for all fruit was small, with less than 1-pound difference (.67 pounds or 0.6 percent) in the fruit available at the retail level in 2005. Overall, ERS estimates that the average loss rate for 2005-06 for fresh fruit at this level was 11.4 percent (not shown), compared with 12 percent for the previous assumptions in the Loss-Adjusted Food Availability data. The similarity in these two estimates suggests that the previous esti-mates for fresh fruit in the ERS data series were reasonable, despite the lack of documentation.
The greatest positive impacts were observed for fresh bananas, apples, and grapes, largely because consumption of these fruits accounts for a large share of total fruit consumption and because the PG estimates of food loss for these commodities were substantially lower than the 12-percent estimate previ-ously used for each fruit in the Loss-Adjusted Food Availability data. Some fruits, such as kiwis, peaches, and cranberries, saw little to no change in the levels of fruit available at the retail level. For some fruits, such as water-melons, papayas, tangerines, and honeydew melons, the per capita annual

10Supermarket Loss Estimates for Fresh Fruit, Vegetables, Meat, Poultry, and Seafood... / EIB-44
Economic Research Service/USDA
Table 2
Comparison of ERS and Perishable Group (PG) estimates of annual fresh fruit loss at the retail/institutional level (per capita)
CommodityRetail
weight1
Percent loss from retail/institutional level to
consumer level
Percent difference
between ERS and PG
estimates
Pounds of commodity available at the consumer level
Difference in pounds between ERS and
PG estimates
ERSestimates
PG estimates
ERS estimate PG estimate
Pounds Percent Pounds
Fresh bananas 25.1 12.0 8.0 -4.0 22.1 23.1 1.01
Fresh apples 16.2 12.0 8.6 -3.4 14.3 14.8 0.55
Fresh grapes 7.8 12.0 7.6 -4.4 6.9 7.2 0.34
Fresh lemons 2.8 12.0 7.0 -5.0 2.5 2.6 0.14
Fresh strawberries 5.4 12.0 9.8 -2.2 4.7 4.8 0.12
Fresh avocados 3.1 12.0 9.3 -2.7 2.7 2.8 0.08
Fresh limes 2.0 12.0 8.3 -3.7 1.8 1.9 0.08
Fresh cherries 0.8 12.0 3.9 -8.1 0.7 0.8 0.06
Fresh oranges 11.1 12.0 11.6 -0.4 9.7 9.8 0.05
Fresh blueberries 0.4 12.0 5.2 -6.8 0.4 0.4 0.03
Fresh cranberries 0.1 12.0 6.0 -6.0 0.1 0.1 0.01
Fresh peaches 4.5 12.0 11.9 -0.1 4.0 4.0 0.00
Fresh kiwis 0.4 12.0 12.7 0.7 0.4 0.4 0.00
Fresh cantaloups 9.3 12.0 12.2 0.2 8.2 8.2 -0.02
Fresh grapefruits 2.6 12.0 12.8 0.8 2.3 2.2 -0.02
Fresh apricots 0.1 12.0 35.1 23.1 0.1 0.1 -0.03
Fresh mangoes 1.8 12.0 14.5 2.5 1.6 1.5 -0.04
Fresh plums 1.1 12.0 17.3 5.3 0.9 0.9 -0.06
Fresh pineapples 4.7 12.0 14.6 2.6 4.1 4.0 -0.12
Fresh pears 2.8 12.0 17.6 5.6 2.4 2.3 -0.15
Fresh honeydew melons
1.7 12.0 22.8 10.8 1.5 1.4 -0.19
Fresh tangerines 2.3 12.0 20.4 8.4 2.1 1.9 -0.20
Fresh papayas 0.9 12.0 54.9 42.9 0.8 0.4 -0.38
Fresh watermelons 12.4 12.0 16.8 4.8 10.9 10.3 -0.59
Total selected 119.4 ----- ----- ----- 105.1 105.8 0.67
1Retail weight from ERS Loss-Adjusted Food Availability data for 2005.
Source: Computed by authors using Perishables Group data and ERS Loss-Adjusted Food Availability data.

11Supermarket Loss Estimates for Fresh Fruit, Vegetables, Meat, Poultry, and Seafood... / EIB-44
Economic Research Service/USDA
estimates of fruit available at the retail level declined because the PG esti-mates were notably larger than the baseline 12-percent estimate.
Fresh Vegetables
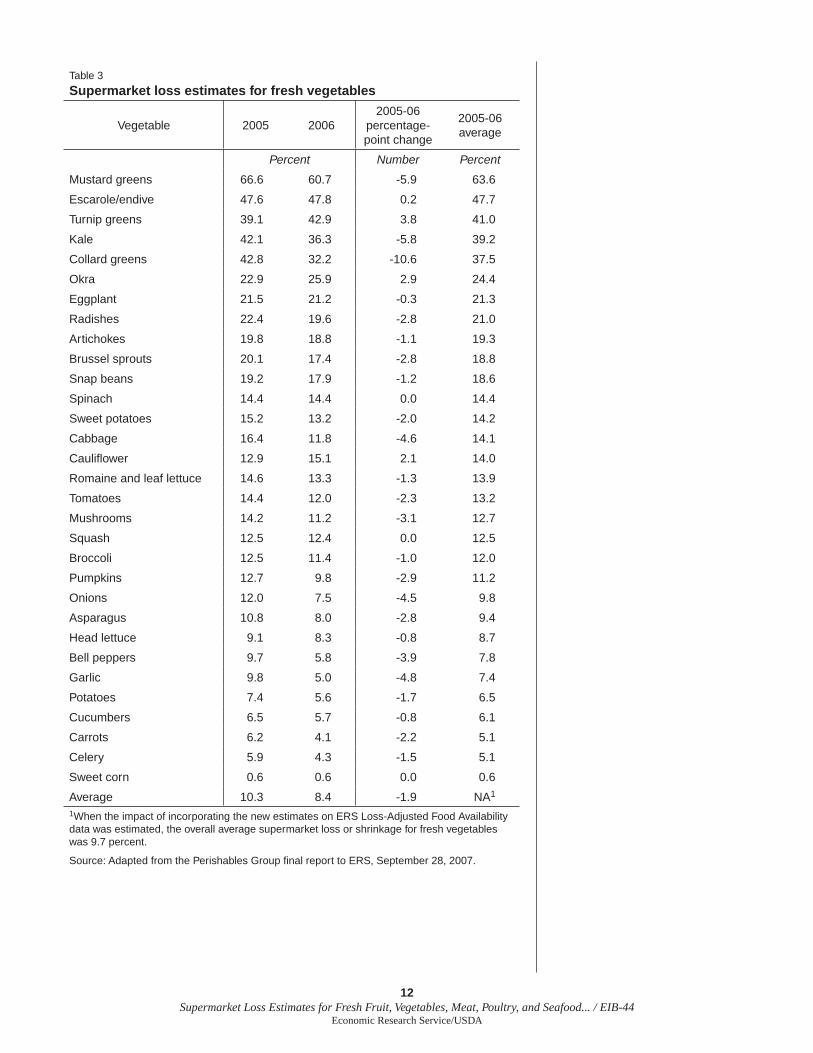
Table 3 shows how the average supermarket loss for the different varieties of fresh vegetables varied during 2005-06. Estimated food loss for vegetables at the supermarket level decreased 1.9 percentage points from 10.3 percent in 2005 to 8.4 percent in 2006.
Sweet corn’s low loss in both 2005 and 2006 (0.6 percent) may be attrib-uted to its limited seasonal availability, mostly from mid-summer to the fi rst frost. Consumers actively purchase corn during this limited season, which results in limited loss at the store level. Also, most fresh sweet corn is sold in its husk, which may protect the corn from damage and may suggest that any spoilage might not be apparent until the husk is removed. New pack-aging innovation has also increased shelf life for sweet corn, as it has for some other vegetables. For example, tomatoes have seen declines in loss due to improved clamshell packaging and the introduction of varieties with improved shelf life.
The highest loss was for fresh mustard greens, with a 2005-06 average of 63.6 percent. A general lack of consumer knowledge of the product and its preparation may contribute to this high loss. The demand for fresh mustard greens is relatively low compared with the demand for frozen mustard greens. That is, consumers who typically buy mustard greens purchase them frozen. Although the new average loss estimate for mustard greens is far higher than the 12-percent ERS estimate, it was relatively similar in magni-tude in 2005 (66.6 percent) and 2006 (60.7 percent). This means that there is no information about whether either of the new estimates are outliers.
Other vegetables with high loss levels included escarole/endive, turnip greens, kale, and collard greens. Leafy greens are relatively more prone to moisture loss than many other types of produce and hence tend to have higher loss levels. Despite the massive spinach recall that occurred in September 2006 due to contamination with E. coli O157:H7, spinach loss remained constant in 2006 versus 2005. The recalled spinach shipments were not used in the loss calculations. Spinach sales were limited during the month following the recall.
Other information gleaned from retailers by the Perishables Group included the observation that head lettuce realized a slight spoilage decline, partly because many retailers reduced shelf space of head lettuce. By reducing shelf space and inventory, retailers increased turnover of the product, reducing its time on the shelf. Another observation by the retailers is that red and yellow bell peppers typically have higher loss than green peppers. They believe this is due to lower prices for green peppers that make them relatively more attractive to consumers when deciding which peppers to buy. Nevertheless, more people are purchasing bell peppers in general, thus attributing to the decline in loss.
The largest loss percentage-point decrease between 2005 and 2006 occurred in collard greens—a 10.6-percentage-point improvement. We do not have a
12Supermarket Loss Estimates for Fresh Fruit, Vegetables, Meat, Poultry, and Seafood... / EIB-44
Economic Research Service/USDA
Table 3
Supermarket loss estimates for fresh vegetables
Vegetable 2005 20062005-06
percentage-point change
2005-06 average
Percent Number Percent
Mustard greens 66.6 60.7 -5.9 63.6
Escarole/endive 47.6 47.8 0.2 47.7
Turnip greens 39.1 42.9 3.8 41.0
Kale 42.1 36.3 -5.8 39.2
Collard greens 42.8 32.2 -10.6 37.5
Okra 22.9 25.9 2.9 24.4
Eggplant 21.5 21.2 -0.3 21.3
Radishes 22.4 19.6 -2.8 21.0
Artichokes 19.8 18.8 -1.1 19.3
Brussel sprouts 20.1 17.4 -2.8 18.8
Snap beans 19.2 17.9 -1.2 18.6
Spinach 14.4 14.4 0.0 14.4
Sweet potatoes 15.2 13.2 -2.0 14.2
Cabbage 16.4 11.8 -4.6 14.1
Caulifl ower 12.9 15.1 2.1 14.0
Romaine and leaf lettuce 14.6 13.3 -1.3 13.9
Tomatoes 14.4 12.0 -2.3 13.2
Mushrooms 14.2 11.2 -3.1 12.7
Squash 12.5 12.4 0.0 12.5
Broccoli 12.5 11.4 -1.0 12.0
Pumpkins 12.7 9.8 -2.9 11.2
Onions 12.0 7.5 -4.5 9.8
Asparagus 10.8 8.0 -2.8 9.4
Head lettuce 9.1 8.3 -0.8 8.7
Bell peppers 9.7 5.8 -3.9 7.8
Garlic 9.8 5.0 -4.8 7.4
Potatoes 7.4 5.6 -1.7 6.5
Cucumbers 6.5 5.7 -0.8 6.1
Carrots 6.2 4.1 -2.2 5.1
Celery 5.9 4.3 -1.5 5.1
Sweet corn 0.6 0.6 0.0 0.6
Average 10.3 8.4 -1.9 NA1
1When the impact of incorporating the new estimates on ERS Loss-Adjusted Food Availability data was estimated, the overall average supermarket loss or shrinkage for fresh vegetables was 9.7 percent.
Source: Adapted from the Perishables Group fi nal report to ERS, September 28, 2007.

13Supermarket Loss Estimates for Fresh Fruit, Vegetables, Meat, Poultry, and Seafood... / EIB-44
Economic Research Service/USDA
Table 4
Comparison of ERS and Perishable Group (PG) estimates of annual fresh vegetable loss at the retail/institutional level (per capita)
CommodityRetail
weight1
Percent loss from retail/institutional level to
consumer level
Percent difference between
ERS and PG estimates
Pounds of commodity available at the consumer level
Difference in pounds between ERS and
PG estimates
ERSestimates
PG estimates
ERS estimate
PG estimate
Pounds Percent Pounds
Fresh potatoes 40.3 12.0 6.5 -5.5 35.4 37.7 2.22
Fresh sweet corn 8.0 12.0 0.6 -11.4 7.1 8.0 0.92
Fresh head lettuce 19.4 12.0 8.7 -3.3 17.0 17.7 0.63
Fresh carrots 8.4 12.0 5.1 -6.9 7.4 8.0 0.58
Fresh onions 19.6 12.0 9.8 -2.2 17.2 17.7 0.44
Fresh celery 5.4 12.0 5.1 -6.9 4.8 5.2 0.38
Fresh cucumbers 5.8 12.0 6.1 -5.9 5.1 5.4 0.34
Fresh bell peppers 6.4 12.0 7.8 -4.2 5.7 5.9 0.27
Fresh garlic 1.9 12.0 7.4 -4.6 1.7 1.8 0.09
Fresh pumpkin 4.5 12.0 11.2 -0.8 4.0 4.0 0.03
Fresh broccoli 5.1 12.0 12.0 0.0 4.5 4.5 0.00
Fresh asparagus 1.0 12.0 9.4 -2.6 0.9 0.9 0.03
Fresh squash 4.0 12.0 12.5 0.5 3.5 3.5 -0.02
Fresh mushrooms 2.4 12.0 12.7 0.7 2.1 2.1 -0.02
Fresh caulifl ower 1.4 12.0 14.0 2.0 1.2 1.2 -0.03
Fresh Brussels sprouts 0.3 12.0 18.8 6.8 0.2 0.2 -0.02
Fresh spinach 2.1 12.0 14.4 2.4 1.8 1.8 -0.05
Fresh tomatoes 17.0 12.0 13.2 1.2 14.9 14.7 -0.20
Fresh artichokes 0.6 12.0 19.3 7.3 0.5 0.5 -0.04
Fresh radishes 0.5 12.0 21.0 9.0 0.4 0.4 -0.04
Fresh okra 0.4 12.0 24.4 12.4 0.4 0.3 -0.05
Fresh sweet potatoes 4.3 12.0 14.2 2.2 3.8 3.7 -0.09
Fresh eggplant 0.8 12.0 21.3 9.3 0.7 0.6 -0.08
Fresh cabbage 7.4 12.0 14.1 2.1 6.5 6.4 -0.15
Fresh escarole and endive 0.2 12.0 47.7 35.7 0.2 0.1 -0.09
Fresh Romaine and leaf lettuce
9.8 12.0 13.9 1.9 8.6 8.4 -0.19
Fresh kale 0.3 12.0 39.2 27.2 0.3 0.2 -0.09
Fresh snap beans 1.7 12.0 18.6 6.6 1.5 1.4 -0.11
Fresh turnip greens 0.4 12.0 41.0 29.0 0.3 0.2 -0.11
Fresh collard greens 0.5 12.0 37.5 25.5 0.4 0.3 -0.12
Fresh mustard greens 0.4 12.0 63.6 51.6 0.3 0.1 -0.20
Total selected 180.3 12.0 ----- ----- 158.7 162.9 4.23
1Retail weight from ERS Loss-Adjusted Food Availability data for 2005.
Source: Computed by authors using Perishables Group data and ERS Loss-Adjusted Food Availability data.

14Supermarket Loss Estimates for Fresh Fruit, Vegetables, Meat, Poultry, and Seafood... / EIB-44
Economic Research Service/USDA
theory on this change but, like the mustard greens fi nding, both collard green estimates (42.8 percent in 2005 and 32.2 percent in 2006) were much higher than the ERS baseline estimate of 12 percent so there is no information on whether either estimate is an outlier. In general, collard greens are best eaten when the leaves are older, allowing the product to have longer shelf life.
The largest loss percentage-point increase was in turnip greens (3.8-percent increase). In general, the high loss rate for turnip greens can be partly based on the lack of high-quality packaging. Turnip greens need to be refrigerated promptly after harvest in order to retain their moisture content and stay fresh.
When ERS used the 2005-06 average supermarket losses for fresh vegetables in the Loss-Adjusted Food Availability data, the total impact for all fresh vegetables in 2005 was a 4.2-pound (2.7-percent) increase in the fresh vege-tables available at the retail level, per capita, over the course of a year (table 4). Overall, ERS estimates that the average loss rate for 2005-06 for fresh vegetables at the supermarket level was 9.7 percent (not shown), compared with 12 percent for the previous assumptions in the Loss-Adjusted Food Availability data. Although these estimates are not as close as they were for fruit, they are still similar and this suggests that the previous estimates for fresh fruit in the ERS data series were reasonable, despite the lack of documentation.
The greatest positive impacts on per capita consumption estimates were observed for potatoes, sweet corn, and head lettuce—once again largely because consumption of these commodities accounts for a large share of total vegetable consumption and because the new estimates of food loss were substantially lower than the 12-percent estimate previously used for each vegetable in the Loss-Adjusted Food Availability data. Most of the fresh vegetables saw less than a 0.1-pound change in the level of vegetables available at retail outlets (per capita) over the course of a year. These small changes were mostly due to their relatively small share of total fresh vege-table consumption.
Fresh Meat, Poultry, and Seafood
Table 5 shows how the loss rates for the different types of fresh meat, poultry, and seafood varied during 2005-06. Meat and poultry had a slight 0.3-percentage-point (rounded) increase in loss between 2005 (4.3 percent) and 2006 (4.5 percent).
Veal had the highest 2005-06 average loss in the meat, poultry, and seafood group. Historically, veal and lamb have signifi cantly higher loss than other proteins. They represent a small percentage of the overall meat category in terms of dollars and volume. According to the Perishables Group’s discus-sions with retailers, the retailers feel that veal is an item that they must offer to consumers to enhance the perception of variety in the meat depart-ment even though relatively few consumers purchase it. Some consumers, however, do purchase veal routinely or for special-occasion meals. Although veal realized the highest percentage-point increase (4.7 percent) in loss between 2005 (23 percent) and 2006 (27.8 percent) of the fresh foods in table 5, in absolute terms, the 2006 estimate for veal was only 20 percent higher

15Supermarket Loss Estimates for Fresh Fruit, Vegetables, Meat, Poultry, and Seafood... / EIB-44
Economic Research Service/USDA
than the 2005 estimate. This difference does not provide evidence that either estimate might be an outlier.
While lamb remains one of the highest loss categories, its loss decreased by over 3 percentage points between 2005 and 2006. Retailers indicated to the Perishables Group that they feel they must offer lamb to consumers, just as they offer veal. Consumers are often unclear on how to prepare lamb and therefore decide not to buy it. Lamb is more likely than some other meats not to be sold before its expiration date. Fewer lamb products are typically avail-able to consumers, compared with other meats, and some consumers forgo purchasing lamb if a desired cut is not available. But lamb trimming and processing practices have changed over time to provide cuts that more closely meet consumer demand and this may have attributed to the lower loss.
Beef, with one of the relatively lower loss numbers, realized a slight increase from 4.3 percent in 2005 to 4.4 percent in 2006. During discussions with the Perishables Group, one explanation given by retailers for the increase in beef loss was that more retailers have introduced case-ready beef prepared at satellite centers or packing plants instead of prepared in the butcher section of the store. These retailers claim that some consumers may be hesitant to purchase some case-ready products. A reduction in the amount of regrinding that ground-beef products undergo may have also attributed to the increase in beef loss. Retailers now record items as out of code and dispose of the product at that time. When meat departments were doing more cutting, they would often pull less expensive cuts of meat from the counter prior to the
Table 5
Supermarket loss estimates for fresh meat, poultry, and seafood1
Meat/Poultry/Seafood 2005 20062005-06
percentage-point change
2005-06 average
Percent Number Percent
Veal 23.0 27.8 4.7 25.4
Lamb/goat 14.0 10.6 -3.3 12.3
Pork 4.1 4.6 0.6 4.4
Beef 4.3 4.4 0.1 4.3
Chicken 3.7 4.2 0.5 4.0
Turkey 3.4 3.5 0.2 3.5
Average 4.3 4.5 0.3 NA2
Shellfi sh 9.4 9.2 -0.2 9.3
Fish 8.8 8.6 -0.2 8.7
Average 9.1 8.9 -0.2 NA3
1Numbers may not total due to rounding.2A small portion of goat was included in the Perishables Group data for lamb although goat is not included in the Loss-Adjusted Food Availability data. The PG data estimates that goat made up 0.12 percent of this category.3When the impact of incorporating the new estimates on ERS Loss-Adjusted Food Availability data was analyzed, the overall average supermarket loss or shrinkage for fresh meat, poultry, and seafood was estimated to be 4.5 percent.
Source: Perishables Group fi nal report to ERS, September 28, 2007.

16Supermarket Loss Estimates for Fresh Fruit, Vegetables, Meat, Poultry, and Seafood... / EIB-44
Economic Research Service/USDA
cuts going out of code and add those products to their grind mixture for ground beef.
While overall meat, poultry, and seafood loss is low compared with the losses of fresh fruit and vegetables, increased loss of all protein foods can be attrib-uted to the growth in the variety of products available in supermarkets over the past few years. As consumers look for new fl avors, different cuts, and more convenient options (e.g., chicken presented as sliced tenders or boneless breasts), the number of unique meat products carried by a retailer increases. This requires more effort by stores to manage inventory and shelf space.
Turkey has the smallest 2005-06 average loss of the meat, poultry, and seafood categories. Turkey is often shipped frozen and is displayed and sold in partially frozen form, increasing shelf life.
Fish and shellfi sh loss decreased slightly between 2005 and 2006. Part of this decrease may be the result of a growing consumer awareness of seafood preparation and cooking techniques, which has increased seafood purchases outside of traditional products. Seafood loss also varies by retailer and is based on several factors. Consumer relationships with employees working at the retailer’s fresh seafood service case may result in the employees sharing information about cooking practices involving different types of seafood options. This interaction makes consumers more inclined to purchase nontra-ditional seafood varieties. However, retailers with seafood service cases typically have higher loss numbers for seafood than those with packaged fi sh only. A growing number of stores are offering prepared seafood products, such as heat-and-serve fully cooked seafood entrées and appetizers. These products typically have a longer shelf life than fresh seafood.
When the new supermarket loss estimates for meat, poultry, and seafood were incorporated in the Loss-Adjusted Food Availability data in place of the previous 7-percent estimate for the loss at the retail level, the total annual per capita amount of these foods available for consumption at the retail level in 2005 increased 4.8 pounds per year (table 6). This is roughly a 2.7-percent increase. Overall, the average loss rate for 2005-06 for fresh meat, poultry, and seafood at the supermarket level was 4.5 percent (not shown), compared with the 7-percent assumption previously used in the Loss-Adjusted Food Availability data. This 2.5-percentage-point difference between 4.5 percent and 7 percent is small, suggesting the previous ERS estimate was reasonable.
In the meat, poultry, and seafood category, the greatest changes in per capita consumption for individual commodities were for chicken, beef, and pork. These are the three leading meats with the highest share of total estimated consumption for this food group. The relatively high loss estimates for lamb and veal each had little impact on the per capita estimate for those meats—a change of less than one-tenth of 1 pound over the course of the year.

17Supermarket Loss Estimates for Fresh Fruit, Vegetables, Meat, Poultry, and Seafood... / EIB-44
Economic Research Service/USDA
Table 6
Comparison of ERS and Perishable Group (PG) estimates of annual fresh meat, poultry, and seafood loss at the retail/institutional level (per capita)
CommodityRetail
weight1
Percent loss from retail/institutional level to
consumer level
Percent difference between
ERS and PG estimates
Pounds of commodity available at the consumer level
Difference in pounds between ERS and
PG estimates
ERSestimates
PG estimates
ERS estimate
PG estimate
Pounds Percent Pounds
Chicken 60.4 7.0 4.0 -3.0 56.2 58.0 1.83
Beef 62.4 7.0 4.3 -2.7 58.0 59.7 1.66
Pork 46.5 7.0 4.4 -2.6 43.2 44.5 1.23
Turkey 13.1 7.0 3.5 -3.5 12.2 12.7 0.47
Lamb 0.8 7.0 12.3 5.3 0.7 0.7 -0.04
Veal 0.4 7.0 25.4 18.4 0.4 0.3 -0.07
Fish 6.1 7.0 8.7 1.7 5.6 5.5 -0.10
Shellfi sh 5.5 7.0 9.3 2.3 5.1 5.0 -0.12
Total selected 195.1 ----- ----- ----- 181.5 186.3 4.84
1Boneless-equivalent or edible weight at the retail level from ERS Loss-Adjusted Food Availability data for 2005.
Source: Computed by authors using Perishables Group data and ERS Loss-Adjusted Food Availability data.

18Supermarket Loss Estimates for Fresh Fruit, Vegetables, Meat, Poultry, and Seafood... / EIB-44
Economic Research Service/USDA
Discussion
The average loss rates for 2005-06 for individual commodities varied from 0.6 percent for sweet corn to 63.6 percent for mustard greens. When ERS incorporated the new loss estimates in the existing Loss-Adjusted Food Availability data, the impact on the per capita estimates varied broadly among commodities within a food group (e.g., all fresh fruit). The largest annual impacts, per capita, were for fresh potatoes, chicken, beef, pork, bananas, and sweet corn—all of which have high consumption shares for their respective food groups.
For many commodities, loss has declined over time due to several different factors, such as:
• improved packaging (e.g., plastic clam shells)
• improved ordering systems
• more frequent deliveries
• increased product handling training for in-store personnel
• improved temperature-control tracking
• introduction of produce varieties with improved shelf life
In some cases, loss increased for particular subcategories (e.g., leafy greens, citrus fruit) within a larger food group (e.g., vegetables, fruit), partly due to the introduction of a greater number of competing segments or items within a food subcategory. The presence of more segments/items can often increase the loss for a subcategory because of the larger number of products competing for consumers’ food dollars. For example, while packaged salads typically have a longer shelf life than head lettuce, loss of packaged salads is often higher due to the number of varieties available, as well as an increase in promotions for specifi c packaged salads. Both factors inadvertently raise sales of some products at the expense of others.
Future work is needed to update the remaining loss estimates at the retail level for commodities that were not included in the Perishables Group grant but are part of the Loss-Adjusted Food Availability data. Examples include: canned, frozen, or dried fruits and vegetables and juice made from them; added fats and oils; added sweeteners; grain products; and dairy products. Future work can investigate what is included in supermarket food loss. In addition to loss due to spoilage and moisture loss, what portions are thrown out, fed to animals, or given to food banks? Food consumed through food banks should not be considered as food loss in the Loss-Adjusted Food Availability data.
Once ERS has updated all the food loss assumptions in the data series, ERS can more accurately estimate the magnitude of such losses at the:
(1) farm-to-retail level
(2) retail level
(3) consumer level

19Supermarket Loss Estimates for Fresh Fruit, Vegetables, Meat, Poultry, and Seafood... / EIB-44
Economic Research Service/USDA
ERS will also be able to estimate the losses by commodity and commodity group. This information, combined with estimates of recovery costs, can be used to identify potential priority areas for food-loss reduction and food recovery to help reduce food insecurity. One implication of these updated loss estimates is that the amount of food loss at the supermarket level is slightly lower than previous estimates. This means the amount of food poten-tially available for charitable donations would be somewhat lower.
Updated food loss assumptions will help us more accurately estimate what is available for consumption, which is used as an estimate for actual consump-tion. This information is important for policymaking. Better estimates of food consumption for different foods and food groups can be used to more accurately calculate how well Americans are meeting Federal dietary recommendations.
The study found that for the commodities it examined, new supermarket loss estimates using the Perishables Group data averaged 11.4 percent for fresh fruit; 9.7 percent for fresh vegetables; and 4.5 percent for fresh meat, poultry, and seafood during 2005-06. In each case, these averages are slightly smaller than the previous estimates used in the ERS data (i.e., 12 percent for the fresh fruit; 12 percent for fresh vegetables; and 7 percent for fresh meat, poultry, and seafood). Although the direction of these differences is consistent with the notion that the food industry has adopted ways to reduce fresh food loss since the fi rst ERS estimates for retail loss were developed in the late 1990s, the magnitude of these differences is less than or equal to 2.5 percentage points for each of the three fresh food groups. Having more individualized and documented estimates for each fresh food commodity going back to 1970 for the Loss-Adjusted Food Availability data is an important improve-ment, even if the actual estimates of loss in the early years may be slightly higher in some cases (i.e., prior to the development and use of technological improvements and more hardy produce varieties). Additionally, a search for potential outliers among the 2005 and 2006 estimates did not reveal evidence that any of the individual estimates should be excluded. Therefore, ERS adopted the new 2005-06 average loss estimates for each fresh food as substi-tutes for the respective estimates of the retail loss in the Loss-Adjusted Food Availability data.
The most important fi nding for ERS is that incorporating the Perishables Group’s estimates of supermarket loss had little total impact on the Loss-Adjusted Food Availability estimates of the amount of these commodities that consumers can take home from retail stores over the course of a year. Using the new loss estimates increased our estimates of per capita avail-ability at the retail level in 2005 of fresh fruit by 0.7 pounds (0.6 percent); fresh vegetables by 4.2 pounds (2.7 percent); and fresh meat, poultry, and seafood by 4.8 pounds (2.7 percent). Dividing these estimates by 365 days to estimate the impact per capita per day results in very small numbers.

20Supermarket Loss Estimates for Fresh Fruit, Vegetables, Meat, Poultry, and Seafood... / EIB-44
Economic Research Service/USDA
References
Buzby, Jean C., Hodan Farah Wells, and Gary Vocke. November 2006. Possible Implications for U.S. Agriculture From Adoption of Select Dietary Guidelines, USDA, Economic Research Service, ERR-31, available at: www.ers.usda.gov/Publications/ERR31/
Morley, Lynn. October 2007. “Fresh-Cut Sales Continue to Rise,” Produce Merchandising, Vol. 92.
Nord, Mark, Margaret Andrews, and Steven Carlson. November 2007. Household Food Security in the United States, 2006, USDA, Economic Research Service, ERR-49, available at: www.ers.usda.gov/publications/err49/
U.S. Department of Agriculture, Agricultural Research Service. 2007. National Nutrient Database for Standard Reference, accessed November 21, 2007 at: http://www.nal.usda.gov/fnic/foodcomp/search/.
U.S. Department of Agriculture, Economic Research Service. 2009. ERS Loss-Adjusted Food Availability data updates are available at:www.ers.usda.gov/Data/FoodConsumption/FoodGuideIndex.htm/
Related Documents