Superior Tools for Adjustable Screening Process Kati Lindroos, Minna Puro Metso Paper Valkeakoski Oy, Finland ABSTRACT Between 2004 and 2006, extensive rotor foil and screen basket studies with flow simulations, laboratory studies and pilot and mill-scale trials were carried out to find new ways of controlling the pressure screen throughput conditions in order to better meet the requirements of different screening applications. As a base for the foil study, the pressure pulses created by different low consistency foil shapes were compared to determine the influence of the pulse shape created by the foil on the screening performance. The basket study focused on the influence of the flow resistance of a screen basket panel during production flow and suction pulse modes on the capacity and quality of the screening. The work commenced with flow simulations using a commercial CFD code to gain a deeper understanding of the basic flow patterns and particle separation phenomena inside the screen. The simulation results were then verified with the trials carried out with an industrial scale screen with a 0.9 m² screening area. Based on the results of the simulations and trial measurements, Metso has created a new foil, called ProFoil; and a new screen basket wire type, called Nimax. Optimal screening results by combining the new screen basket wire and new foil design can be summed up as follows: 10 – 30% energy saving 10 – 20% less thickening 20 – 30% more capacity excellent pulp quality excellent runnability Mill scale results prove that a foil shape with a gentle pressure gradient combined with a sufficiently strong pulsation and screen basket wire shape with optimized flow conditions deliver high separation efficiency, improved capacity, reduced energy consumption and less fiber loss. INTRODUCTION The operational demands for the separation processes in deinked pulp line have intensified significantly in recent years. The raw material contains more than double the amount of macro-stickies experienced ten years ago. However, accept pulp quality has to be at the same level as previously. In addition, a detailed consideration of the economical aspects of the screening and the actions to reduce the costs are increasingly important. Deinked pulp screening is nowadays typically performed with #0.15 mm slots. As a result of the constantly decreasing quality of incoming pulp, #0.12 mm slots are inevitably required for the screening in the future. However, a conventional combination of robust foil design and #0.12 mm narrow slot screen basket has resulted in capacity problems and a strong reject thickening, which restricts the runnability of the screen and leads to substantial fiber losses. The energy consumption of the screen has also been at an unnecessary high level due to relatively high foil speeds and a very strong co-rotation of the pulp caused by the conventional heavy foil designs. The combination of optimized foil geometry together with a recycled fiber specified screen basket allows a low level of thickening and minor fiber losses. Through use of the narrowest possible slot, excellent pulp quality will be achieved. Higher slot velocities can be used without blockage problems, which means that a higher capacity can be

Welcome message from author
This document is posted to help you gain knowledge. Please leave a comment to let me know what you think about it! Share it to your friends and learn new things together.
Transcript

Superior Tools for Adjustable Screening Process
Kati Lindroos, Minna PuroMetso Paper Valkeakoski Oy, Finland
ABSTRACT
Between 2004 and 2006, extensive rotor foil and screen basket studies with flow simulations, laboratory studies andpilot and mill-scale trials were carried out to find new ways of controlling the pressure screen throughput conditionsin order to better meet the requirements of different screening applications.
As a base for the foil study, the pressure pulses created by different low consistency foil shapes were compared todetermine the influence of the pulse shape created by the foil on the screening performance. The basket studyfocused on the influence of the flow resistance of a screen basket panel during production flow and suction pulsemodes on the capacity and quality of the screening.
The work commenced with flow simulations using a commercial CFD code to gain a deeper understanding of thebasic flow patterns and particle separation phenomena inside the screen. The simulation results were then verifiedwith the trials carried out with an industrial scale screen with a 0.9 m² screening area.
Based on the results of the simulations and trial measurements, Metso has created a new foil, called ProFoil; and anew screen basket wire type, called Nimax.
Optimal screening results by combining the new screen basket wire and new foil design can be summed up asfollows:
10 – 30% energy saving 10 – 20% less thickening 20 – 30% more capacity excellent pulp quality excellent runnability
Mill scale results prove that a foil shape with a gentle pressure gradient combined with a sufficiently strongpulsation and screen basket wire shape with optimized flow conditions deliver high separation efficiency, improvedcapacity, reduced energy consumption and less fiber loss.
INTRODUCTION
The operational demands for the separation processes in deinked pulp line have intensified significantly in recentyears. The raw material contains more than double the amount of macro-stickies experienced ten years ago.However, accept pulp quality has to be at the same level as previously. In addition, a detailed consideration of theeconomical aspects of the screening and the actions to reduce the costs are increasingly important.
Deinked pulp screening is nowadays typically performed with #0.15 mm slots. As a result of the constantlydecreasing quality of incoming pulp, #0.12 mm slots are inevitably required for the screening in the future.However, a conventional combination of robust foil design and #0.12 mm narrow slot screen basket has resulted incapacity problems and a strong reject thickening, which restricts the runnability of the screen and leads to substantialfiber losses. The energy consumption of the screen has also been at an unnecessary high level due to relatively highfoil speeds and a very strong co-rotation of the pulp caused by the conventional heavy foil designs.
The combination of optimized foil geometry together with a recycled fiber specified screen basket allows a low levelof thickening and minor fiber losses. Through use of the narrowest possible slot, excellent pulp quality will beachieved. Higher slot velocities can be used without blockage problems, which means that a higher capacity can be
reached without adding another screen, or that an even smaller screen can be used. By lowering foil speeds andreducing unnecessary co-rotation, energy consumption will be at a reasonable level.
The above mentioned issues were the basis for this extensive foil and screen basket study, for which minimized fiberloss and energy consumption combined with increased capacity and screening efficiency were the major targets.
NUMERICAL STUDY
A great amount of foil shape [1,2,3,4,5] and screen basket geometry [6,7] studies has been done during the pastdecades. However, despite the extensive investigations, the ideal shape of the pressure pulse and, accordingly, thefoil and the wire profile has remained undefined in precise engineering terms. Also, thorough insight into the flowpatterns over the screening surface and wires is needed to fully understand the principles of particle separation ineach screening position. Deep understanding of the effect of both critical elements in screening; foil and wire shapeis needed in order to reach the best screening performance for each application.
Work was started with flow simulation using modern computational tool; CFD simulation which was utilized toprovide more information for profound analysis than only the pressure pulses created by foil. In addition to thepressure pulses, the radial and tangential velocities around the foil are also investigated and compared in thisnumerical study. Since measuring the exact velocity field at the screen basket wire area through an opaquesuspension is difficult, CFD simulation was used as a way to ‘see’ inside the machine.
Simulation methods
The flow field inside the pressure screen was modeled using a commercial CFD code Fluent (version 6.1). At thestart, three different foil shapes were chosen for this comparison, see Table 1. In the screen basket wire study, threewire geometries were compared (Table 2).
Table 1. The basic data of the simulated foils.Foil 1 Foil 2 Foil 3
foil width [mm] 80 87 125foil thickness [mm] 24 25 35foil tail height [mm] 15 23 25foil gap [mm] 2-4 2-4 2-4foil speed [m/s] 12-16 12-16 12-16foil frequency [Hz] 31 31 31
Table 2. The basic data of the simulated wires.Wire 1 Wire 2 Wire 3
profile width [mm] 2.5 2.3 2.5profile height [mm] 1.2 0.8 0.8panel thickness [mm] 5.0 6.0 6.0slot width [mm] 0.12 0.12 0.12
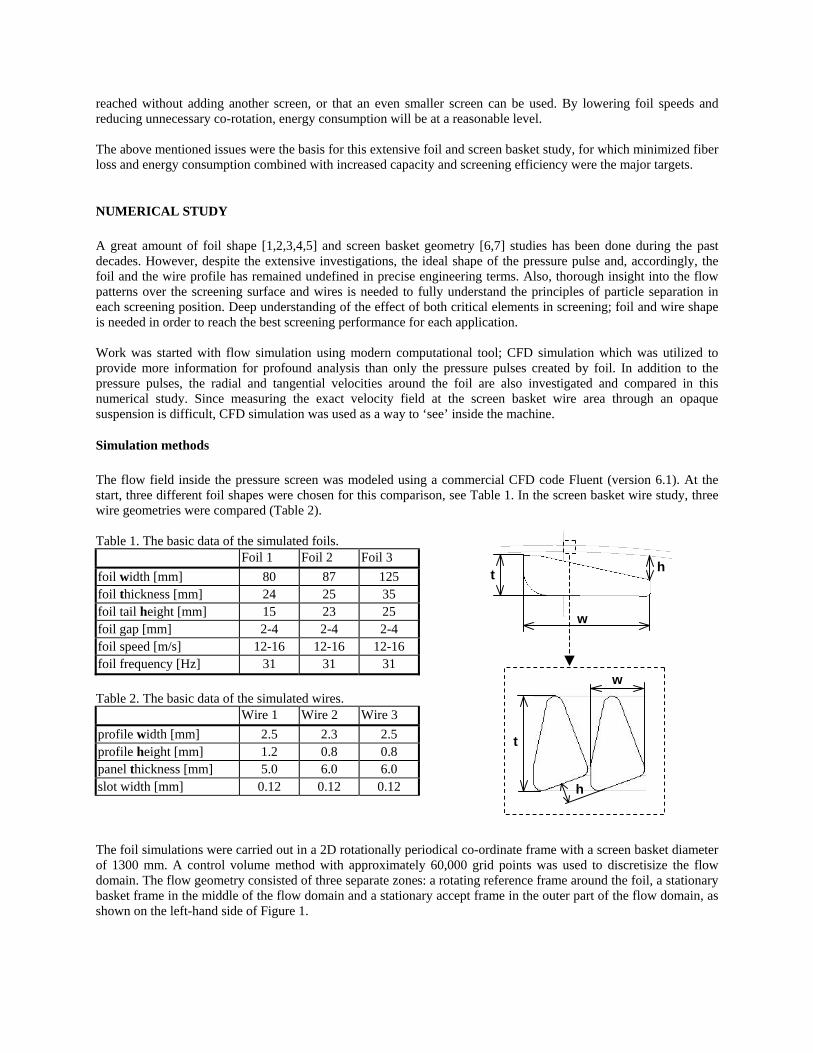
The foil simulations were carried out in a 2D rotationally periodical co-ordinate frame with a screen basket diameterof 1300 mm. A control volume method with approximately 60,000 grid points was used to discretisize the flowdomain. The flow geometry consisted of three separate zones: a rotating reference frame around the foil, a stationarybasket frame in the middle of the flow domain and a stationary accept frame in the outer part of the flow domain, asshown on the left-hand side of Figure 1.
w
t h
t
h
w
The geometry used in the micro-scale screen wire simulations is shown on the right hand side of the Figure 1.Stationary 2D flow domain consisted of three wires next to each other with periodic boundaries on both sides of themodel. Foil-induced velocity field was set as a boundary condition on the feed side of the screen and fixed tangentialvelocity was set on the accept side of the screen. Approximately 25,000 grid points was used to discretisize the flowdomain.
Figure 1. The flow geometry and boundary conditions used in the foil and wire simulati
Boundary conditions
The flow field information gained from foil simulations was utilized when setting thewire simulations, and vice versa. In the foil simulations, the basket frame was modelcertain pressure drop over it, meaning that the detailed slot geometry was not includedrop over the basket in the radial direction is characteristic of the actual slot geometbased on the detailed wire simulations. In the tangential direction, the pressure drop wain the radial direction since there cannot be any tangential flow in the basket area.
There was no inlet or outlet in the foil model. In other words, the rotating foil was the oflow inside the screen. In a real screening process there is, of course, a pressurized feedover the screen basket, and the function of the foil is mainly to keep the basket surface can be drawn from the relative differences between the modeled pulses and flow tpressure level itself is somewhat different from the actual screening conditions.
In the wire simulation model, radial and tangential velocity values between 1-10 conditions on the feed side of the screen basket to describe the flow field induced by avelocity on the accept side was fixed at 0.5 m/s, describing the continuous collection ohousing.
In the foil simulations, a low-Re k-epsilon turbulence model with standard wall funcmodeling. The basket area was simulated as a laminar zone since the Reynolds numbervery low. The basket was treated as a 100% open flow zone in the model, so there weno wall-induced turbulence in that area either.
In the wire simulations, a low-Re k-epsilon turbulence model with enhanced wall treatmodeling. The mesh was strongly refined close to the walls and particularly at the slot a
rotating frame
stationary accept frameporous mediabasket frame
periodic boundaries
periodicboundaries
accept flow
tang.ity
fixed veloc
ons.
boundary conditions in theed as a porous media with ad in the model. The pressurery and was set to 10-20 kPas set 1,000 times higher than
nly driving force causing the inducing the net throughputclean. However, conclusionshroughputs even though the
m/s were used as boundary passing foil. The tangentialf the flow around the screen
tions was used in turbulence in the area of narrow slots isre no walls and, accordingly,
ment was used in turbulencerea with a maximum y+ < 4.
feed flow
Since we were concentrating on low-consistency screening, the material properties of pure water were usedthroughout most of the simulation set. The effect of increasing consistency on pressure pulse was tested in one caseby increasing the viscosity of the fluid up to 100 times higher than water viscosity.
RESULTS
Simulation results of foil study
The effect of the foil shape, foil speed, foil gap and fluid viscosity on the form of the pressure pulse, radial velocitypulse and tangential velocity pulse were studied during the foil simulations. Detailed simulation results for chosenconventional foils 1–3 (Table 1) are presented in a previously published paper [8].
After comparing the flow fields and different pulses of numerous conventional foil shapes, a new foil shape for low-consistency screening was designed [8]. An optimal shape of the foil is an important criterion for an adjustablescreening process. Having an appropriate tangential co-rotation level in a particular application is a key issue fromboth a capacity and quality viewpoint.
In deinked pulp screening applications, the quality, i.e. the removal of soft and elastic stickies, is proposed to bemostly controlled by slot dimensions and an appropriate slot speed rather than by a very high level of tangential co-rotation over the basket surface [8]. The process consistency is low, typically from 0.5% to 1.5%, so highfluidization energy to break the fiber flocks is not needed. Accordingly, a considerably lower level of co-rotation canbe utilized in DIP screening to reduce the energy consumption and to increase the capacity of the screening processwith the same quality standard.
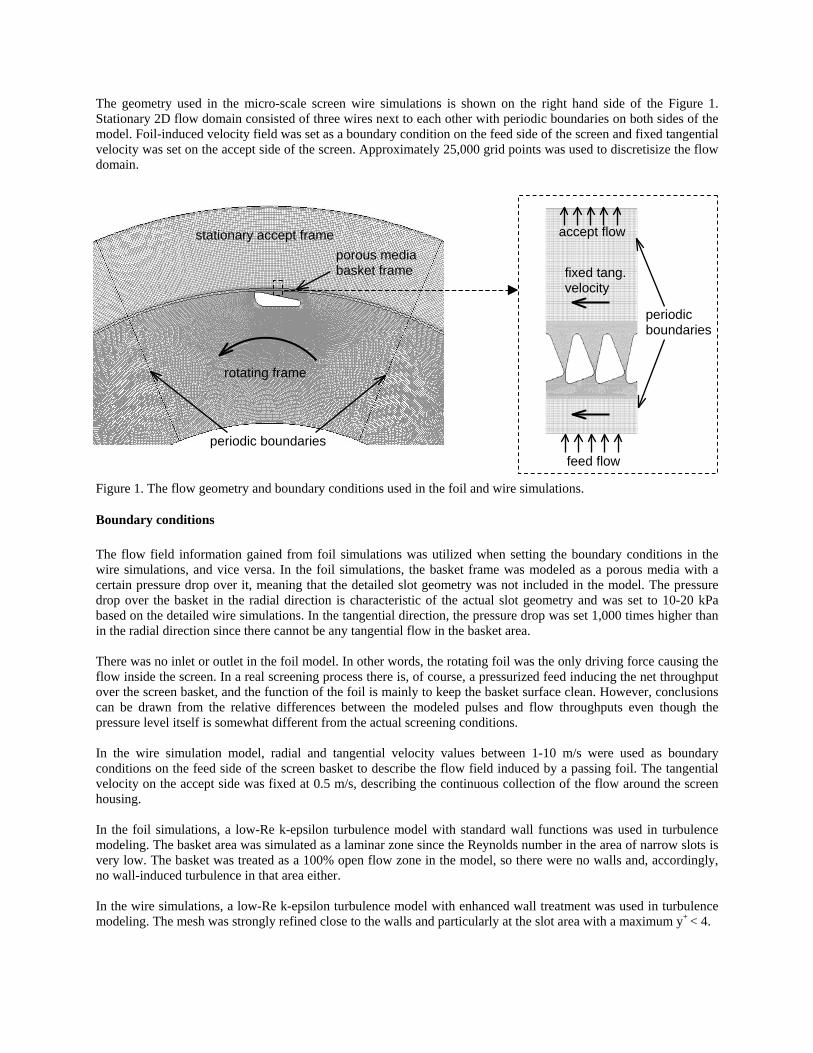
The main idea of new foil design was to obtain a remarkably stronger suction pulse with the same positive pressurepeak level than in the case of a conventional low-consistency foil. Another target for foil development was to reducethe co-rotation level and thereby achieve lower energy consumption at all rotation speeds. These demands are wellfulfilled with the thin and streamlined design of this new foil.
The radial and tangential velocity fields of new foil and a conventional foil* are illustrated in Figures 2−3. The colorscale slides from black to white such that black corresponds to the velocities lower than -1 m/s and whitecorresponds to the velocities higher than +1 m/s. Based on Figures 2−3, it can be concluded that the radial suctionpulse of new foil is much stronger and the tangential co-rotation at a lower level than in case of a conventional low-consistency foil.
Figure 2. Radial velocity fields of new foil (left) and conventional foil (right).
* conventional foil represents traditional, heavy foil design of low consistency foils 1–3 listed in Table 1
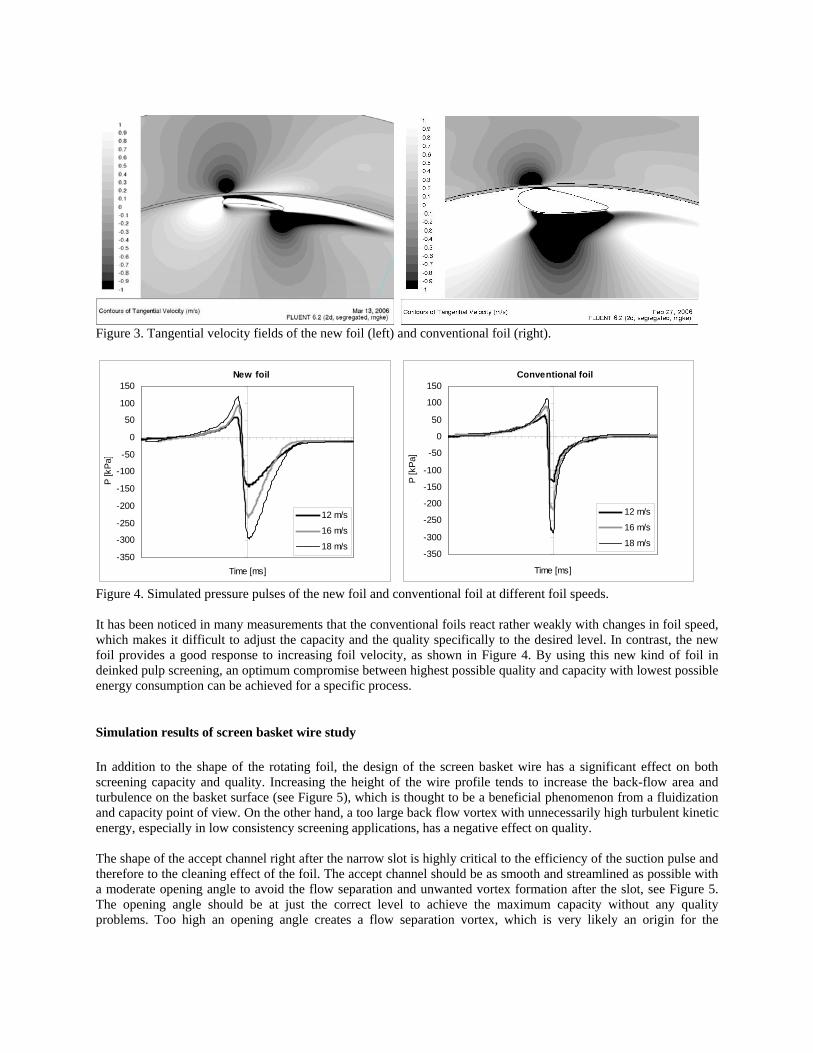
Figure 3. Tangential velocity fields of the new foil (left) and conventional foil (right).
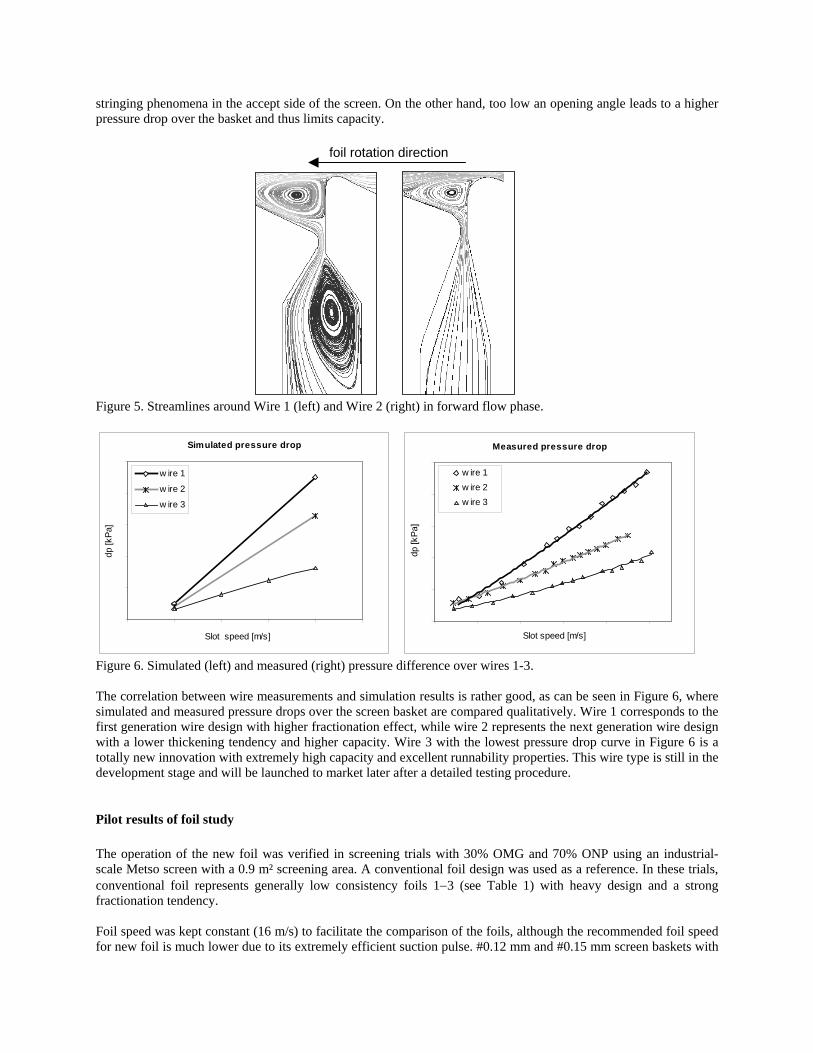
Figure 4. Simulated pressure pulses of the new foil and conventional foil at different foil speeds.
It has been noticed in many measurements that the conventional foils react rather weakly with changes in foil speed,which makes it difficult to adjust the capacity and the quality specifically to the desired level. In contrast, the newfoil provides a good response to increasing foil velocity, as shown in Figure 4. By using this new kind of foil indeinked pulp screening, an optimum compromise between highest possible quality and capacity with lowest possibleenergy consumption can be achieved for a specific process.
Simulation results of screen basket wire study
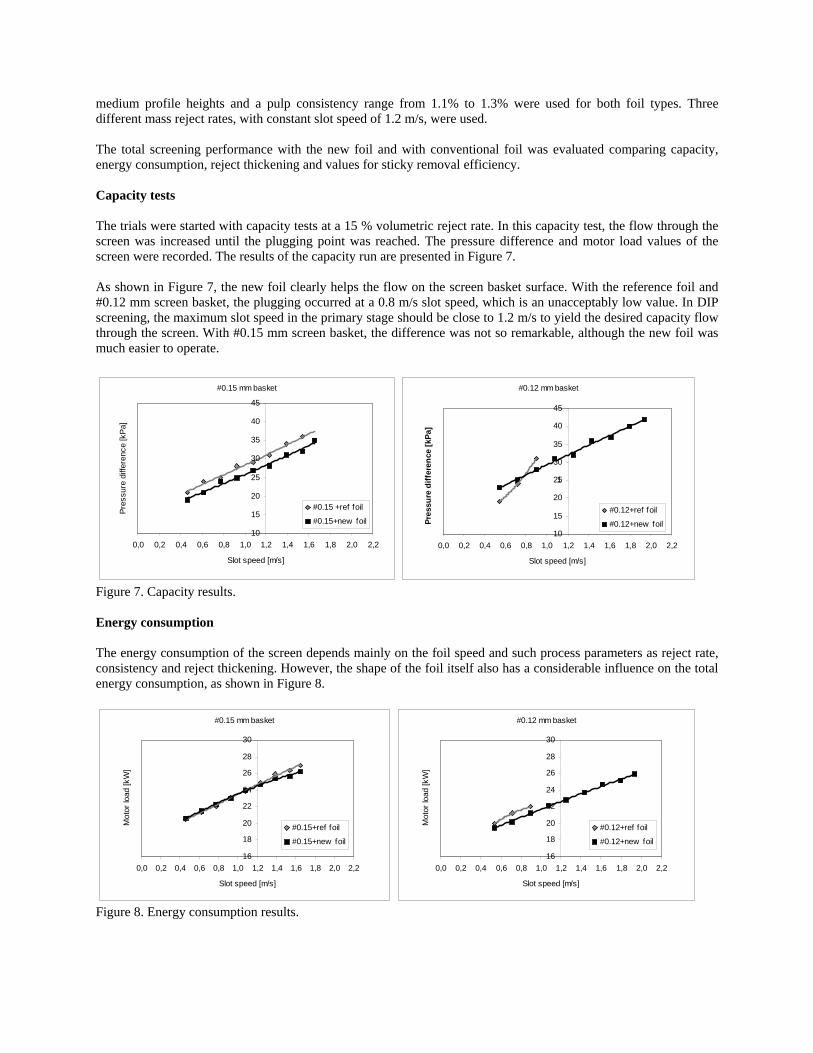
In addition to the shape of the rotating foil, the design of the screen basket wire has a significant effect on bothscreening capacity and quality. Increasing the height of the wire profile tends to increase the back-flow area andturbulence on the basket surface (see Figure 5), which is thought to be a beneficial phenomenon from a fluidizationand capacity point of view. On the other hand, a too large back flow vortex with unnecessarily high turbulent kineticenergy, especially in low consistency screening applications, has a negative effect on quality.
The shape of the accept channel right after the narrow slot is highly critical to the efficiency of the suction pulse andtherefore to the cleaning effect of the foil. The accept channel should be as smooth and streamlined as possible witha moderate opening angle to avoid the flow separation and unwanted vortex formation after the slot, see Figure 5.The opening angle should be at just the correct level to achieve the maximum capacity without any qualityproblems. Too high an opening angle creates a flow separation vortex, which is very likely an origin for the
Conventional foil
-350
-300
-250
-200
-150
-100
-50
0
50
100
150
Time [ms]
P [k
Pa]
12 m/s
16 m/s
18 m/s
New foil
-350
-300
-250
-200
-150
-100
-50
0
50
100
150
Time [ms]
P [k
Pa]
12 m/s
16 m/s
18 m/s
stringing phenomena in the accept side of the screen. On the other hand, too low an opening angle leads to a higherpressure drop over the basket and thus limits capacity.
Figure 5. Streamlines around Wire 1 (left) and Wire 2 (right) in forward flow phase.
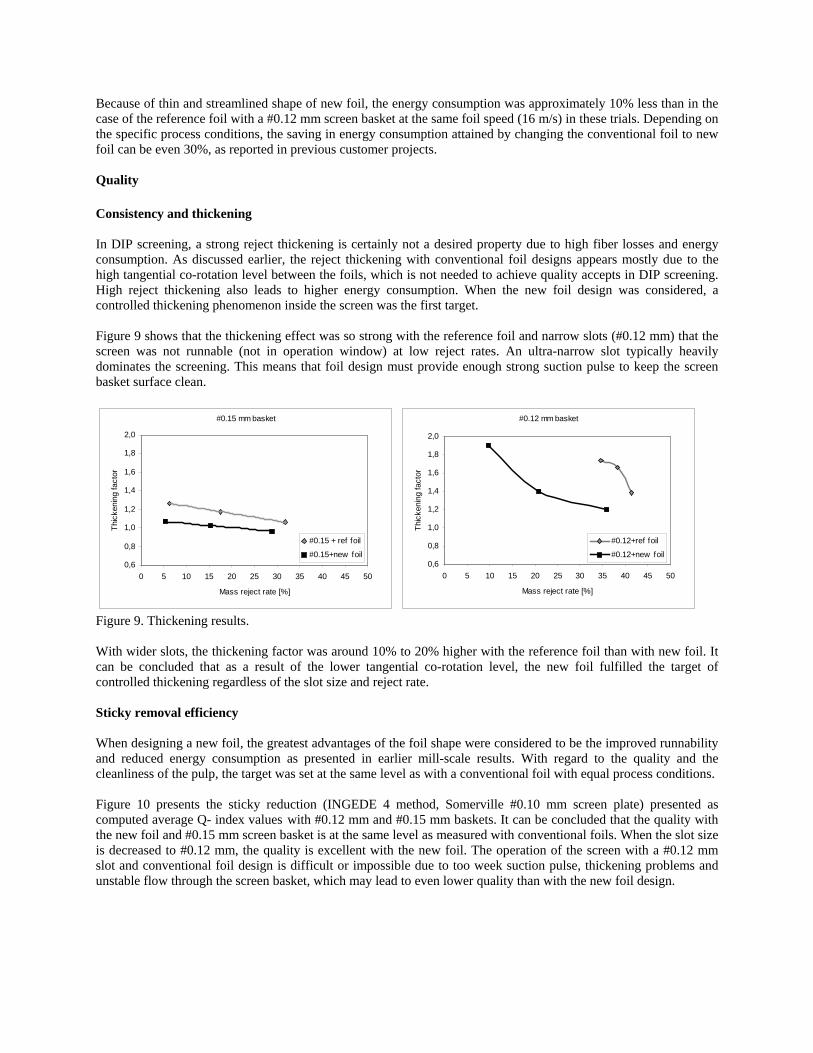
Figure 6. Simulated (left) and measured (right) pressure difference over wires 1-3.
The correlation between wire measurements and simulation results is rather good, as can be seen in Figure 6, wheresimulated and measured pressure drops over the screen basket are compared qualitatively. Wire 1 corresponds to thefirst generation wire design with higher fractionation effect, while wire 2 represents the next generation wire designwith a lower thickening tendency and higher capacity. Wire 3 with the lowest pressure drop curve in Figure 6 is atotally new innovation with extremely high capacity and excellent runnability properties. This wire type is still in thedevelopment stage and will be launched to market later after a detailed testing procedure.
Pilot results of foil study
The operation of the new foil was verified in screening trials with 30% OMG and 70% ONP using an industrial-scale Metso screen with a 0.9 m² screening area. A conventional foil design was used as a reference. In these trials,conventional foil represents generally low consistency foils 1−3 (see Table 1) with heavy design and a strongfractionation tendency. Foil speed was kept constant (16 m/s) to facilitate the comparison of the foils, although the recommended foil speedfor new foil is much lower due to its extremely efficient suction pulse. #0.12 mm and #0.15 mm screen baskets with
foil rotation direction
Simulated pressure drop
Slot speed [m/s]
dp [k
Pa]
w ire 1
w ire 2
w ire 3
Measured pressure drop
Slot speed [m/s]
dp [k
Pa]
w ire 1w ire 2w ire 3
medium profile heights and a pulp consistency range from 1.1% to 1.3% were used for both foil types. Threedifferent mass reject rates, with constant slot speed of 1.2 m/s, were used.
The total screening performance with the new foil and with conventional foil was evaluated comparing capacity,energy consumption, reject thickening and values for sticky removal efficiency.
Capacity tests
The trials were started with capacity tests at a 15 % volumetric reject rate. In this capacity test, the flow through thescreen was increased until the plugging point was reached. The pressure difference and motor load values of thescreen were recorded. The results of the capacity run are presented in Figure 7.
As shown in Figure 7, the new foil clearly helps the flow on the screen basket surface. With the reference foil and#0.12 mm screen basket, the plugging occurred at a 0.8 m/s slot speed, which is an unacceptably low value. In DIPscreening, the maximum slot speed in the primary stage should be close to 1.2 m/s to yield the desired capacity flowthrough the screen. With #0.15 mm screen basket, the difference was not so remarkable, although the new foil wasmuch easier to operate.
Figure 7. Capacity results.
Energy consumption
The energy consumption of the screen depends mainly on the foil speed and such process parameters as reject rate,consistency and reject thickening. However, the shape of the foil itself also has a considerable influence on the totalenergy consumption, as shown in Figure 8.
Figure 8. Energy consumption results.
#0.15 mm basket
10
15
20
25
30
35
40
45
0,0 0,2 0,4 0,6 0,8 1,0 1,2 1,4 1,6 1,8 2,0 2,2
Slot speed [m/s]
Pres
sure
diff
eren
ce [k
Pa]
#0.15 +ref foil
#0.15+new foil
#0.12 mm basket
10
15
20
25
30
35
40
45
0,0 0,2 0,4 0,6 0,8 1,0 1,2 1,4 1,6 1,8 2,0 2,2
Slot speed [m/s]
Pres
sure
diff
eren
ce [k
Pa]
#0.12+ref foil
#0.12+new foil
1
#0.15 mm basket
16
18
20
22
24
26
28
30
0,0 0,2 0,4 0,6 0,8 1,0 1,2 1,4 1,6 1,8 2,0 2,2
Slot speed [m/s]
Mot
or lo
ad [k
W]
#0.15+ref foil
#0.15+new foil
#0.12 mm basket
16
18
20
22
24
26
28
30
0,0 0,2 0,4 0,6 0,8 1,0 1,2 1,4 1,6 1,8 2,0 2,2
Slot speed [m/s]
Mot
or lo
ad [k
W]
#0.12+ref foil
#0.12+new foil
Because of thin and streamlined shape of new foil, the energy consumption was approximately 10% less than in thecase of the reference foil with a #0.12 mm screen basket at the same foil speed (16 m/s) in these trials. Depending onthe specific process conditions, the saving in energy consumption attained by changing the conventional foil to newfoil can be even 30%, as reported in previous customer projects.
Quality
Consistency and thickening
In DIP screening, a strong reject thickening is certainly not a desired property due to high fiber losses and energyconsumption. As discussed earlier, the reject thickening with conventional foil designs appears mostly due to thehigh tangential co-rotation level between the foils, which is not needed to achieve quality accepts in DIP screening.High reject thickening also leads to higher energy consumption. When the new foil design was considered, acontrolled thickening phenomenon inside the screen was the first target.
Figure 9 shows that the thickening effect was so strong with the reference foil and narrow slots (#0.12 mm) that thescreen was not runnable (not in operation window) at low reject rates. An ultra-narrow slot typically heavilydominates the screening. This means that foil design must provide enough strong suction pulse to keep the screenbasket surface clean.
Figure 9. Thickening results.
With wider slots, the thickening factor was around 10% to 20% higher with the reference foil than with new foil. Itcan be concluded that as a result of the lower tangential co-rotation level, the new foil fulfilled the target ofcontrolled thickening regardless of the slot size and reject rate.
Sticky removal efficiency
When designing a new foil, the greatest advantages of the foil shape were considered to be the improved runnabilityand reduced energy consumption as presented in earlier mill-scale results. With regard to the quality and thecleanliness of the pulp, the target was set at the same level as with a conventional foil with equal process conditions.
Figure 10 presents the sticky reduction (INGEDE 4 method, Somerville #0.10 mm screen plate) presented ascomputed average Q- index values with #0.12 mm and #0.15 mm baskets. It can be concluded that the quality withthe new foil and #0.15 mm screen basket is at the same level as measured with conventional foils. When the slot sizeis decreased to #0.12 mm, the quality is excellent with the new foil. The operation of the screen with a #0.12 mmslot and conventional foil design is difficult or impossible due to too week suction pulse, thickening problems andunstable flow through the screen basket, which may lead to even lower quality than with the new foil design.
#0.15 mm basket
0,6
0,8
1,0
1,2
1,4
1,6
1,8
2,0
0 5 10 15 20 25 30 35 40 45 50
Mass reject rate [%]
Thic
keni
ng fa
ctor
#0.15 + ref foil
#0.15+new foil
#0.12 mm basket
0,6
0,8
1,0
1,2
1,4
1,6
1,8
2,0
0 5 10 15 20 25 30 35 40 45 50
Mass reject rate [%]
Thic
keni
ng fa
ctor
#0.12+ref foil
#0.12+new foil
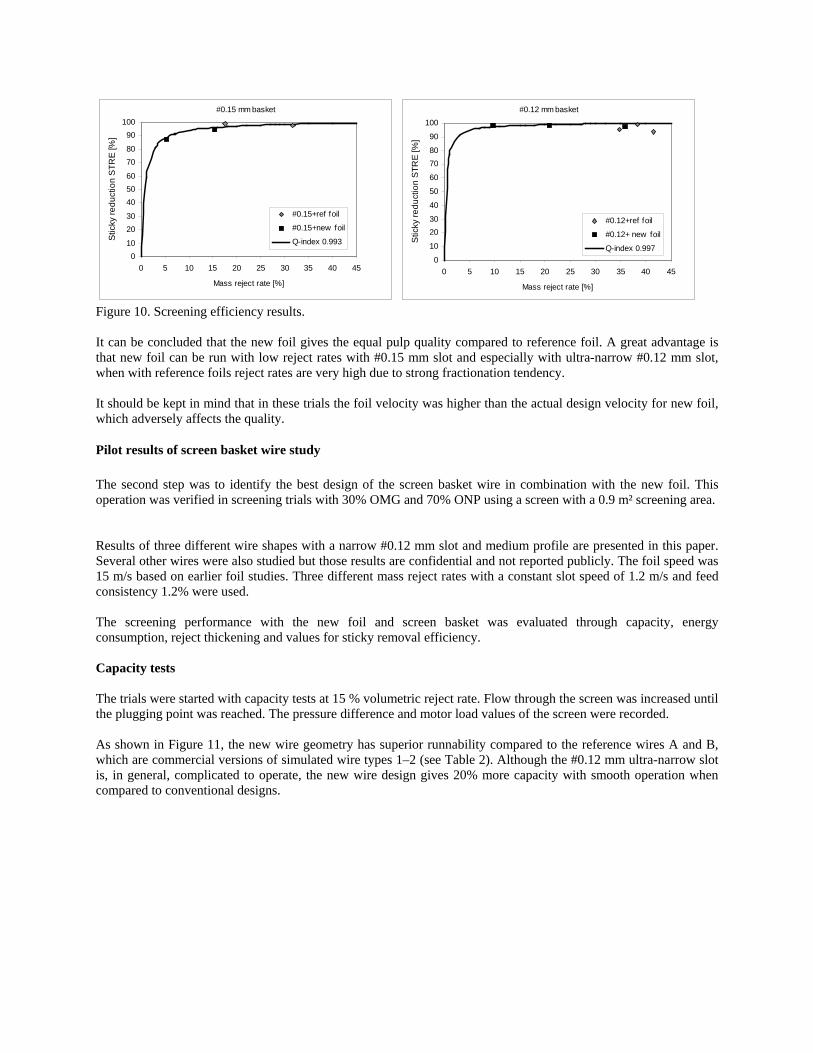
Figure 10. Screening efficiency results.
It can be concluded that the new foil gives the equal pulp quality compared to reference foil. A great advantage isthat new foil can be run with low reject rates with #0.15 mm slot and especially with ultra-narrow #0.12 mm slot,when with reference foils reject rates are very high due to strong fractionation tendency.
It should be kept in mind that in these trials the foil velocity was higher than the actual design velocity for new foil,which adversely affects the quality.
Pilot results of screen basket wire study
The second step was to identify the best design of the screen basket wire in combination with the new foil. Thisoperation was verified in screening trials with 30% OMG and 70% ONP using a screen with a 0.9 m² screening area.
Results of three different wire shapes with a narrow #0.12 mm slot and medium profile are presented in this paper.Several other wires were also studied but those results are confidential and not reported publicly. The foil speed was15 m/s based on earlier foil studies. Three different mass reject rates with a constant slot speed of 1.2 m/s and feedconsistency 1.2% were used.
The screening performance with the new foil and screen basket was evaluated through capacity, energyconsumption, reject thickening and values for sticky removal efficiency.
Capacity tests
The trials were started with capacity tests at 15 % volumetric reject rate. Flow through the screen was increased untilthe plugging point was reached. The pressure difference and motor load values of the screen were recorded.
As shown in Figure 11, the new wire geometry has superior runnability compared to the reference wires A and B,which are commercial versions of simulated wire types 1–2 (see Table 2). Although the #0.12 mm ultra-narrow slotis, in general, complicated to operate, the new wire design gives 20% more capacity with smooth operation whencompared to conventional designs.
#0.12 mm basket
0
10
2030
40
50
60
7080
90
100
0 5 10 15 20 25 30 35 40 45
Mass reject rate [%]
Stic
ky re
duct
ion
STR
E [%
]
#0.12+ref foil
#0.12+ new foil
Q-index 0.997
#0.15 mm basket
010
2030
405060
7080
90100
0 5 10 15 20 25 30 35 40 45
Mass reject rate [%]
Stic
ky re
duct
ion
STR
E [%
]
#0.15+ref foil
#0.15+new foil
Q-index 0.993

Figure 11. Capacity results.
Energy consumption
Previously, energy consumption has not been a major issue in screen basket design itself. However, nowadaysenergy saving is a critical element in worldwide sustainable development, so even minor savings are beneficial toconsider when discussing about the total energy consumption of the screen room. Based on the motor loadmeasurements shown in Figure 12, it can be concluded that the new wire design saves approximately 10% of energywhen compared to the reference wire designs. This result comes through the optimized flow conditions around thewire.
Figure 12. Energy consumption.
#0.12 mm baskets + new foil
10
15
20
25
30
35
0,0 0,2 0,4 0,6 0,8 1,0 1,2 1,4 1,6 1,8 2,0 2,2
Slot speed [m/s]
Pre
ssur
e di
ffere
nce
[kP
a]
wire Awire Bnew wire
#0.12 mm baskets + new foil
10
15
20
25
30
0,0 0,2 0,4 0,6 0,8 1,0 1,2 1,4 1,6 1,8 2,0 2,2
Slot speed [m/s]
Mot
or lo
ad [k
W]
wire A
wire Bnew wire
Quality
Consistency and thickening
As discussed earlier, strong thickening leads to high fiber losses and energy consumption and for this reason, it isnot a desired property in DIP screening.
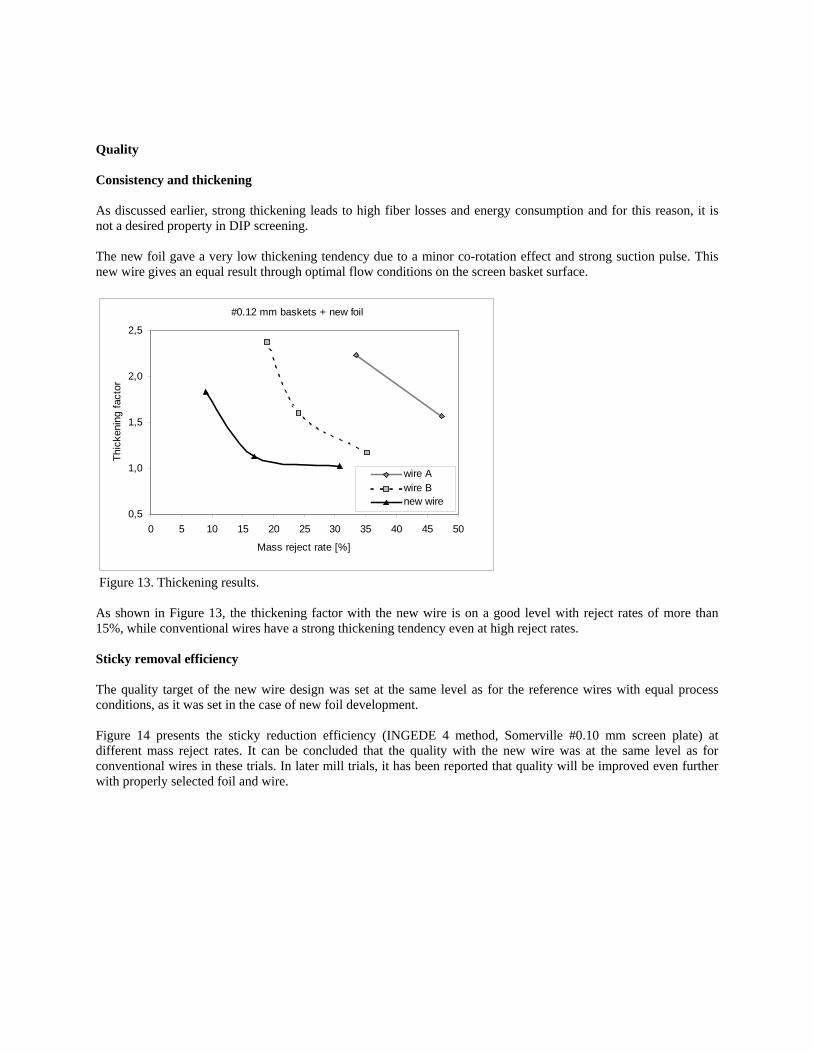
The new foil gave a very low thickening tendency due to a minor co-rotation effect and strong suction pulse. Thisnew wire gives an equal result through optimal flow conditions on the screen basket surface.
Figure 13. Thickening results.
As shown in Figure 13, the thickening factor with the new wire is on a good level with reject rates of more than15%, while conventional wires have a strong thickening tendency even at high reject rates.
Sticky removal efficiency
The quality target of the new wire design was set at the same level as for the reference wires with equal processconditions, as it was set in the case of new foil development.
Figure 14 presents the sticky reduction efficiency (INGEDE 4 method, Somerville #0.10 mm screen plate) atdifferent mass reject rates. It can be concluded that the quality with the new wire was at the same level as forconventional wires in these trials. In later mill trials, it has been reported that quality will be improved even furtherwith properly selected foil and wire.
#0.12 mm baskets + new foil
0,5
1,0
1,5
2,0
2,5
0 5 10 15 20 25 30 35 40 45 50
Mass reject rate [%]
Thic
keni
ng fa
ctor
wire Awire Bnew wire
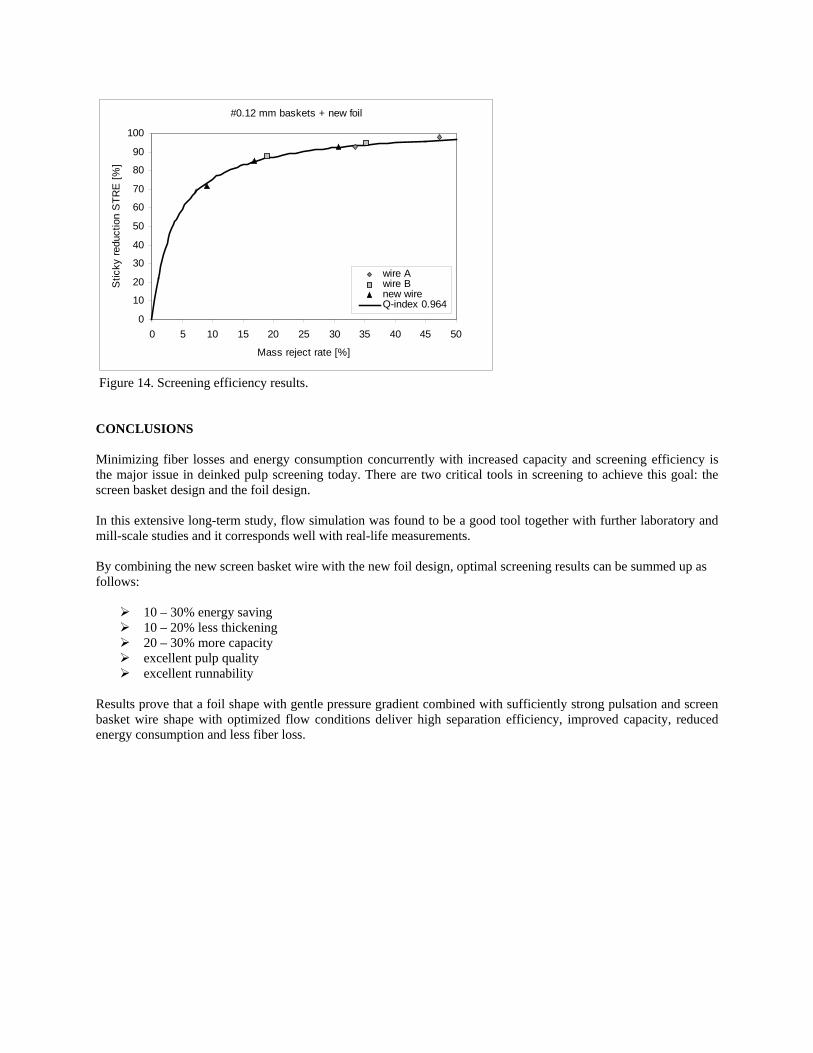
Figure 14. Screening efficiency results.
CONCLUSIONS
Minimizing fiber losses and energy consumption concurrently with increased capacity and screening efficiency isthe major issue in deinked pulp screening today. There are two critical tools in screening to achieve this goal: thescreen basket design and the foil design.
In this extensive long-term study, flow simulation was found to be a good tool together with further laboratory andmill-scale studies and it corresponds well with real-life measurements.
By combining the new screen basket wire with the new foil design, optimal screening results can be summed up asfollows:
10 – 30% energy saving 10 – 20% less thickening 20 – 30% more capacity excellent pulp quality excellent runnability
Results prove that a foil shape with gentle pressure gradient combined with sufficiently strong pulsation and screenbasket wire shape with optimized flow conditions deliver high separation efficiency, improved capacity, reducedenergy consumption and less fiber loss.
#0.12 mm baskets + new foil
0
10
20
30
40
50
60
70
80
90
100
0 5 10 15 20 25 30 35 40 45 50
Mass reject rate [%]
Stic
ky re
duct
ion
STR
E [%
]
wire Awire Bnew wireQ-index 0.964
REFERENCES
1. Julien Saint Amand, F. and Perrin, B., TAPPI 1999 Pulping Conference Proceedings, TAPPI PRESS, Atlanta,941 (1999).
2. Karvinen, R. and Halonen, L., Paperi ja Puu (2):80 (1984).
3. Pinon, V., Gooding, R.W. and Olson, J.A., TAPPI J. 2(10):9 (2003).
4. Marko, J.J. and LaRiviere, C.J., TAPPI 1999 Papermakers Conference Proceedings, TAPPI PRESS, Atlanta,1477 (1999).
5. Yu, C., Crossley, B. and Silveri, L., TAPPI J. 77(9):125 (1994).
6. Gooding, R.W., “Flow resistance of screen plate apertures“, PhD thesis, University of British Colombia (1996).
7. Julien Saint Amand, F., 9th CTP Recycled Fibres Forum, CTP/Grenoble, February 7 & 8 (2007).
8. Lindroos, K. and Puro, M, "ProFoil – Superior tool for adjustable screening process", 12th PTS-CTP DeinkingSymposium, Leipzig, February 25-27 (2006).
Related Documents