SUNTRUST BANKS, INC. 2009 ANNUAL REPORT

Welcome message from author
This document is posted to help you gain knowledge. Please leave a comment to let me know what you think about it! Share it to your friends and learn new things together.
Transcript

SUNTRUST BANKS, INC.
2009 ANNUAL REPORT
SUNTRUST BANKS, INC., 303 PEACHTREE STREET, ATLANTA, GEORGIA 30308
WWW.SUNTRUST.COM
SUN
TR
UST
BA
NK
S, INC
. 2009 AN
NU
AL R
EPORT
32676_Cover_AR.indd 132676_Cover_AR.indd 1 2/25/10 8:06 AM2/25/10 8:06 AM

CORPORATE HEADQUARTERS SunTrust Banks, Inc. 303 Peachtree Street, NE Atlanta, GA 30308 404.588.7711
CORPORATE MAILING ADDRESS SunTrust Banks, Inc. P.O. Box 4418 Center 645 Atlanta, GA 30302-4418
NOTICE OF ANNUAL MEETING The Annual Meeting of Shareholders will be held on Tuesday, April 27, 2010 at 9:30 a.m. in Suite 105 on the first floor of SunTrust Plaza Garden Offi ces, 303 Peachtree Center Avenue, Atlanta, Georgia.
COMMON STOCK SunTrust Banks, Inc. common stock is traded on the New York Stock Exchange (NYSE) under the symbol STI.
QUARTERLY COMMON STOCK PRICES AND DIVIDENDS The quarterly high, low, and close prices of SunTrust’s common stock for each quarter of 2009 and 2008 and the dividends paid per share are shown below. Quarter Market Price Dividends Ended High Low Close Paid
2009 December 31 $24.09 $18.45 $20.29 $0.01September 30 24.43 14.50 22.55 0.01 June 30 20.86 10.50 16.45 0.10March 31 30.18 6.00 11.74 0.10
2008 December 31 $57.75 $19.75 $29.54 $0.54September 30 64.00 25.60 44.99 0.77June 30 60.80 32.34 36.22 0.77March 31 70.00 52.94 55.14 0.77
CREDIT RATINGS Ratings as of December 31, 2009. Moody’s Standard Investors & Poor’s Fitch DBRS
Corporate Ratings Long Term Ratings Senior Debt Baa1 BBB+ A - A Subordinated Debt Baa2 BBB BBB+ A(low) Series A Preferred Stock Ba2 BB+ BBB BB(high) Short Term Commercial Paper P-2 A-2 F1 R-1(low)
Bank Ratings Long Term Ratings Senior Debt A2 A - A - A(high) Subordinated Debt A3 BBB+ BBB+ A Short Term P-1 A-2 F1 R-1 (middle)
SHAREHOLDER SERVICESRegistered shareholders of SunTrust Banks, Inc. who wish to change the name, address, or ownership of common stock, to report lost certifi cates, or to consolidate accounts should contact our Transfer Agent: Computershare 250 Royall Street Mail Stop 1A Canton, MA 02021 866.299.4214 www.computershare.com
For general shareholder information, contact Investor Relations at 1.800.324.8093.
ANALYST INFORMATIONAnalysts, investors, and others seeking additional financial information should contact: Steven Shriner Director of Investor Relations SunTrust Banks, Inc. P.O. Box 4418 Mail Code: GA-ATL-634 Atlanta, GA 30302-4418 800.324.8093
INVESTOR RELATIONS ON THE INTERNET To fi nd the latest investor relations information about SunTrust, including stock quotes, news releases, corporate governance practices, and fi nancial data, go to www.suntrust.com.
CLIENT INFORMATION For assistance with SunTrust products and services, call 1.800.SUNTRUST or visit www.suntrust.com.
WEB SITE ACCESS TO UNITED STATES SECURITIES AND EXCHANGE COMMISSION FILINGS All reports fi led electronically by SunTrust Banks, Inc. with the United States Securities and Exchange Commission, including the annual report on Form 10-K, quarterly reports on Form 10-Q, current event reports on Form 8-K, and amendments to those reports fi led or furnished pursuant to Section 13(a) or 15(d) of the Exchange Act are accessible as soon as reasonably practicable at no cost in the Investor Relations section of the corporate website at www.suntrust.com.
Des
ign:
Par
agra
ph
s, C
hic
ago
SHAREHOLDER INFORMATION
SUNTRUST AT A GLANCE
SunTrust Banks, Inc., with year-end 2009 assets of $174.2 billion, is one of the nation’s largest and strongest fi nancial services holding companies.
Through its fl agship subsidiary, SunTrust Bank, the Company provides deposit, credit, and trust and investment services to a broad range of retail, business, and institutional clients. Other subsidiaries provide mortgage banking, insurance, brokerage, investment management, equipment leasing, and investment banking services.
SunTrust enjoys leading positions in some of the most attractive markets in the United States and also serves clients in selected markets nationally. The Company’s mission is to help people and institutions prosper by providing fi nancial services that meet the needs, exceed the expectations, and enhance the lives of our clients, communities, colleagues, and ultimately our shareholders.
SunTrust’s 1,683 retail branches and 2,822 ATMs are located primarily in Florida, Georgia, Maryland, North Carolina, South Carolina, Tennessee, Virginia, and the District of Columbia. In addition, SunTrust provides clients with a full selection of technology-based banking channels including online, 24-hour customer services centers, and the latest mobile devices. Our internet address is www.suntrust.com.
CORPORATE HEADQUARTERS SunTrust Banks, Inc. 303 Peachtree Street, NE Atlanta, GA 30308 404.588.7711
CORPORATE MAILING ADDRESS SunTrust Banks, Inc. P.O. Box 4418 Center 645 Atlanta, GA 30302-4418
NOTICE OF ANNUAL MEETING The Annual Meeting of Shareholders will be held on Tuesday, April 27, 2010 at 9:30 a.m. in Suite 105 on the first floor of SunTrust Plaza Garden Offi ces, 303 Peachtree Center Avenue, Atlanta, Georgia.
COMMON STOCK SunTrust Banks, Inc. common stock is traded on the New York Stock Exchange (NYSE) under the symbol STI.
QUARTERLY COMMON STOCK PRICES AND DIVIDENDS The quarterly high, low, and close prices of SunTrust’s common stock for each quarter of 2009 and 2008 and the dividends paid per share are shown below. Quarter Market Price Dividends Ended High Low Close Paid
2009 December 31 $24.09 $18.45 $20.29 $0.01September 30 24.43 14.50 22.55 0.01 June 30 20.86 10.50 16.45 0.10March 31 30.18 6.00 11.74 0.10
2008 December 31 $57.75 $19.75 $29.54 $0.54September 30 64.00 25.60 44.99 0.77June 30 60.80 32.34 36.22 0.77March 31 70.00 52.94 55.14 0.77
CREDIT RATINGS Ratings as of December 31, 2009. Moody’s Standard Investors & Poor’s Fitch DBRS
Corporate Ratings Long Term Ratings Senior Debt Baa1 BBB+ A - A Subordinated Debt Baa2 BBB BBB+ A(low) Series A Preferred Stock Ba2 BB+ BBB BB(high) Short Term Commercial Paper P-2 A-2 F1 R-1(low)
Bank Ratings Long Term Ratings Senior Debt A2 A - A - A(high) Subordinated Debt A3 BBB+ BBB+ A Short Term P-1 A-2 F1 R-1 (middle)
SHAREHOLDER SERVICESRegistered shareholders of SunTrust Banks, Inc. who wish to change the name, address, or ownership of common stock, to report lost certifi cates, or to consolidate accounts should contact our Transfer Agent: Computershare 250 Royall Street Mail Stop 1A Canton, MA 02021 866.299.4214 www.computershare.com
For general shareholder information, contact Investor Relations at 1.800.324.8093.
ANALYST INFORMATIONAnalysts, investors, and others seeking additional financial information should contact: Steven Shriner Director of Investor Relations SunTrust Banks, Inc. P.O. Box 4418 Mail Code: GA-ATL-634 Atlanta, GA 30302-4418 800.324.8093
INVESTOR RELATIONS ON THE INTERNET To fi nd the latest investor relations information about SunTrust, including stock quotes, news releases, corporate governance practices, and fi nancial data, go to www.suntrust.com.
CLIENT INFORMATION For assistance with SunTrust products and services, call 1.800.SUNTRUST or visit www.suntrust.com.
WEB SITE ACCESS TO UNITED STATES SECURITIES AND EXCHANGE COMMISSION FILINGS All reports fi led electronically by SunTrust Banks, Inc. with the United States Securities and Exchange Commission, including the annual report on Form 10-K, quarterly reports on Form 10-Q, current event reports on Form 8-K, and amendments to those reports fi led or furnished pursuant to Section 13(a) or 15(d) of the Exchange Act are accessible as soon as reasonably practicable at no cost in the Investor Relations section of the corporate website at www.suntrust.com.
SUNTRUST AT A GLANCE
SunTrust Banks, Inc., with year-end 2009 assets of $174.2 billion, is one of the nation’s largest and strongest fi nancial services holding companies.
Through its fl agship subsidiary, SunTrust Bank, the Company provides deposit, credit, and trust and investment services to a broad range of retail, business, and institutional clients. Other subsidiaries provide mortgage banking, insurance, brokerage, investment management, equipment leasing, and investment banking services.
SunTrust enjoys leading positions in some of the most attractive markets in the United States and also serves clients in selected markets nationally. The Company’s mission is to help people and institutions prosper by providing fi nancial services that meet the needs, exceed the expectations, and enhance the lives of our clients, communities, colleagues, and ultimately our shareholders.
SunTrust’s 1,683 retail branches and 2,822 ATMs are located primarily in Florida, Georgia, Maryland, North Carolina, South Carolina, Tennessee, Virginia, and the District of Columbia. In addition, SunTrust provides clients with a full selection of technology-based banking channels including online, 24-hour customer services centers, and the latest mobile devices. Our internet address is www.suntrust.com.
Des
ign:
Par
agra
ph
s, C
hic
ago
SHAREHOLDER INFORMATION
32676_Cover_AR.indd 232676_Cover_AR.indd 2 2/25/10 8:06 AM2/25/10 8:06 AM

TO OUR SHAREHOLDERS
Writing this in early 2010, I must admit to a certain
degree of relief that 2009 is behind us. Details of the
severe, recession-related pressures faced last year by
our industry, our clients, and our Company have been
well reported and need not be recounted in detail here.
The impact on SunTrust’s fi nancial performance—notably
higher credit costs, softer fee income, and generally
weak loan demand—ultimately caused a loss of $3.98
per share for the year. There is no way to minimize my
disappointment in this result—recession or no recession.
The fact that our entire industry experienced the negative
earnings impact of the turbulent operating environment
does not make it any more palatable to report to you.
As diffi cult as 2009 was, the year ended on a more
encouraging note than it began. Fears of a global fi nancial
meltdown largely receded following coordinated efforts
to restore stability to financial markets. In the US,
indications that the recession is behind us are increasingly
credible, and there are even signs of improvement in the
housing market. This is all welcome news, and it augurs
well for SunTrust’s post-recession prospects.
Positive signals notwithstanding, we are tempered in our
optimism. The economy is far from strong, and there is
uncertainty in the outlook. Asset quality, revenues, and
ultimately earnings improvement will need time to gain
traction. That timing is largely dependent upon the
strength and sustainability of the economic recovery
coupled with the increasing effectiveness of our efforts
to grow the business. While our business was negatively
affected by the recessionary environment and borrowers’
intense focus on reducing leverage, SunTrust supported
its clients and communities through the extension of
approximately $90 billion in new loan originations,
commitments and renewals of commercial and consumer
loans during the year.
The operating environment for banks is also cloudy in
terms of the legislative and regulatory framework within
which we will be operating. The fi nancial services industry
is poised at the brink of a new relationship with our
rulemakers. It is not clear at this point what changes
there will be and how they will affect the way we do
business. We fundamentally agree with the idea that
certain regulatory reforms are needed and could
contribute to a more smoothly functioning financial
system, which is in everyone’s best interest. But, to
borrow a phrase, the devil is in the details. Our hope
is that specifi c legislative measures will be thoughtful,
responsible, inclusive, and augment the industry’s
ability to continue to support our communities,
finance individual dreams, and help contribute to
national economic growth. We are working with others
in our industry, and with government officials in
Washington, DC, to encourage the development of
responsible reform legislation.
Looking beyond Washington, our teammates are serving
our clients, running our businesses more effi ciently, and
executing the strategies aimed at making sure we are
well positioned competitively to take full advantage of
post-recession growth opportunities. To that end, we are
improving service quality and front-line execution. We
continue to be focused on controlling expenses and
managing risk. We are thinking in new ways and sharing
ideas across the organization. In time, we are confi dent
that the positive impact of these efforts will be refl ected
in our results.
The details of our 2009 fi nancial results are presented
in the 10-K that comprises the bulk of this annual report.
I will spend the balance of this letter outlining the
strong, stable foundation upon which we believe we can
drive improved performance. We are pursuing initiatives
designed to deliver that improved performance now and
as the economy recovers.
A STRONG FOUNDATION
As we see it, the elements that comprise SunTrust’s
strong foundation are our large and well-diversifi ed
franchise, solid capital, excellent liquidity, and relative
credit strength.
Large and Well-Diversifi ed Franchise
In terms of growth potential, SunTrust’s southeastern
and mid-Atlantic footprint is arguably the best in banking
with projected population growth well above the
national average. We have built strong market share in
some of the highest growth markets in the country. We
tend to focus our presence around the larger metropolitan
areas, and we believe that we are well diversifi ed within
our footprint, which includes a strong presence in Florida
that historically has contributed positively to our growth
SUNTRUST 2009 ANNUAL REPORT
1
32676_AR_Text.indd 132676_AR_Text.indd 1 2/26/10 3:05 PM2/26/10 3:05 PM

and credit quality. While Florida has been hard hit by the
current recession, we believe the state’s long-term prospects
are favorable and that it will continue to be an attractive
market for the same reasons it was before the recession.
Our relationship-based operating model allows us to
effectively meet the evolving needs of our clients. We
are building loyalty by understanding client preferences
and aligning our business to respond. We believe that
we have the optimal breadth and depth of products and
services to retain clients and attract new ones.
Strong Capital, Excellent Liquidity
We successfully completed capital actions that created
even stronger capitalization and complied with the new
rules established by the Federal Reserve under the
Supervisory Capital Assessment Program. While
disappointed that we were required to raise common
capital at arguably the deepest part of the recession with
depressed stock prices, the transactions were exceedingly
successful. Given our current capital and liquidity, we
are well positioned to repay TARP funds when regulatory
approval is received.
Regrettably, as we looked at all the ways necessary to
preserve capital in light of the recession, the uncertainty
created by it, and the related pressure on SunTrust’s
earnings and capital, we made the decision to reduce
our quarterly dividend to $0.01 per common share. This
decision was extremely diffi cult and made only after
signifi cant evaluation and deliberation. We did what
was necessary, and we believe prudent, to preserve and
generate the appropriate amount of capital. I can assure
you that we are looking forward to the time when we can
begin increasing the dividend.
With respect to liquidity, we have a diversifi ed funding
base with stable core deposits providing the majority of
SunTrust’s funding. We benefi ted from a sizeable increase
in deposits in 2009. Further, the composition of the
growth has been favorable with a large increase in lower
cost demand deposits. There are strong indications that
our efforts to grow deposit-based clients at a greater rate
than our competitors contributed to this outcome and that
it was not simply a function of broader economic forces.
Credit Quality
Despite the obvious—and in 2009, severe—credit
deterioration that comes with an economic downturn,
we believe that our mix of products, geographies
with solid long-term growth profi les, and historically
conservative underwriting are key elements in our relative
credit strength. The conservative nature of our portfolio
is evidenced, for example, by the fact that we have no
subprime or option ARM loans, a small credit card
portfolio, and low levels of unsecured loans to consumers
and small businesses.
Our loan portfolio is well diversifi ed by borrower type,
purpose, and collateral. The largest concentration is in
consumer loans and lines of credit secured by residential
real estate. This product concentration, coupled with our
Florida market share, has produced the majority of the
asset quality issues so far in this downturn. We remain
committed to this business though, obviously, adjustments
have been made. Not only has it historically been a profi t
driver for us, but it also provides opportunities to expand
and to deepen our relationships with clients.
We also have a conservative commercial loan portfolio
that has continued to perform relatively well throughout
this cycle. We have successfully reduced exposure to
higher risk loan categories, such as construction loans,
while continuing to experience stable performance in the
rest of the commercial portfolio.
Further, we maintain signifi cant loan loss reserves.
We continuously monitor the credit quality of our loan
portfolio and maintain an allowance for loan and lease
losses suffi cient to absorb current probable and estimable
losses inherent in our loan portfolio. We are committed to
the timely recognition of problem loans and to maintaining
an appropriate and adequate reserve against future losses.
GROWTH INITIATIVES
Building on the strong foundation outlined above, we
are actively implementing a variety of growth initiatives
to improve performance. Changes that we have already
implemented—from reducing expenses to more closely
aligning our service offerings with clients’ needs—have
not only given us an advantage in managing through
the current economy, but also provide a springboard for
moving forward. Specifi c programs of note are aimed
at further enhancing the client experience, improving
effi ciency, and optimizing the balance sheet and business
mix. All of this was built upon fundamental principles
such as a conservative risk posture.
Client Focus
We believe that enhanced client service, including making
it easier and more effi cient to do business with us, is critical
to driving revenue growth and improved shareholder
value. Over the past several years, we have undertaken
a deep look at our internal activities and processes
to identify new ways to improve our efficiency and
effectiveness in serving clients. Specifi c initiatives move
beyond quick fi xes to improve client satisfaction and get
2
SUNTRUST 2009 ANNUAL REPORT
32676_AR_Text.indd 232676_AR_Text.indd 2 2/26/10 3:05 PM2/26/10 3:05 PM

to the drivers that build loyalty by understanding individual
client preferences and aligning our business model to
respond. We are investing in technology, in better
understanding clients’ needs, in more effectively leveraging
teammates’ knowledge, in enhanced training and
development opportunities, and in delivering on our
brand promise to help our clients “Live Solid.” We are
pleased with the results to date and encouraged by the
momentum we have created in our ongoing efforts to
enhance client satisfaction.
Leaner and More Effi cient
Today’s SunTrust is a leaner, more effi cient, and more
productive organization than at any time in recent history.
We exceeded our stated goal of achieving more than
$600 million in run-rate savings during 2009, which is
over 12% of our 2006 noninterest expense base. During
this timeframe, we signifi cantly lowered offi ce space
utilization and reduced overall full-time staff, while
increasing hiring in key revenue-generation and risk areas.
We are committed to producing ongoing and sustainable
savings that will result in a more effi cient organization
and one that is easier to do business with, both externally
and internally. We expect that this discipline will enable
restrained expense growth and greater operating leverage
as revenue improves in the future.
Balance Sheet and Business Mix Management
The fi nal component of our growth initiatives I’d like to
note is a continuing effort to optimize the balance sheet
and business mix. We have been proactively taking actions
since 2006 to deleverage and improve the profi tability
of the balance sheet. In the early stages of these initiatives,
we focused mostly on reducing the securities portfolio
and on the sale of mortgage, student, and corporate
loans. More recently, we have been focused on the
liability side of the balance sheet given the increase in
deposits and liquidity. For example, we have actively
managed down higher cost deposits including brokered
deposits and certifi cates of deposit.
Further, we have focused resources on business mix
management and also continued our deliberate approach
to selectively growing or shrinking certain loan classes
in order to achieve appropriate balance between risk
and return. For instance, we have been decreasing the
construction portfolio and have selectively sought to
grow other categories such as consumer, commercial
and industrial, and more recently, indirect auto as
pricing improved.
So what does all this mean? We believe that when you
step back and consider the long-term economic prospects
of our markets, our strong capitalization, our relative
credit strength, and our growth initiatives, it all says
that we are positioned well to deliver steadily improving
returns as we come out of this cycle. And though some
things, notably the economic and regulatory environment,
are ultimately out of our control, I believe we are doing a
good job of controlling those things that we can control.
Going forward, we are in a better position to satisfy our
clients and our shareholders. Our team has never been
stronger, our strategy never better, and our client loyalty
never higher. As new challenges arise and new competition
surfaces, opportunities to truly differentiate the SunTrust
brand and experience will be created. The SunTrust team,
the individuals who execute our strategies across our
organization, are doing the things that make it possible
to look beyond the current operating environment with
a reasoned and realistic sense of confi dence.
We are strongly encouraged by the prospect of an
improving economy, by the strong foundation we have
created, and by the traction we are gaining from our
initiatives. On behalf of our management team and our
Board of Directors, I would like to express appreciation
to all of my SunTrust teammates for their dedication to our
institution and to our clients. It is that dedication that will
help drive our future performance.
Finally, I wish to thank our shareholders for your continued
support during a very diffi cult year. We are committed to
delivering a higher level of performance in the future.
As we see it, the future begins now.
JAMES M. WELLS III
Chairman and Chief Executive Offi cer
February 16, 2010
SUNTRUST 2009 ANNUAL REPORT
3
32676_AR_Text.indd 332676_AR_Text.indd 3 2/26/10 3:05 PM2/26/10 3:05 PM

SunTrust 2008 Annual Report
JAMES M. WELLS III 1 Chairman and Chief Executive Offi cer
ROBERT M. BEALL, II 2, 4
Chairman
Beall’s, Inc.Bradenton, Florida
A. D. CORRELL 1, 3, 4
Chairman
Atlanta Equity Investors, LLCAtlanta, Georgia
JEFFREY C. CROWE 1, 4, 5
Chairman of the Board
Landstar System, Inc.Jacksonville, Florida
PATRICIA C. FRIST 3, 4
Partner
Frist Capital PartnersNashville, Tennessee
BLAKE P. GARRETT, JR. 4, 5
Partner
Garrett & Garrett Co.Fountain Inn, South Carolina
DAVID H. HUGHES 3, 5
Former Chairman of the Board
Hughes Supply, Inc.Orlando, Florida
M. DOUGLAS IVESTER 1, 2, 4
President
Deer Run Investments, LLCAtlanta, Georgia
J. HICKS LANIER 2, 5 Chairman of the Board and Chief Executive Offi cer
Oxford Industries, Inc. Atlanta, Georgia
G. GILMER MINOR, III 1, 3, 4
Chairman of the Board
Owens & Minor, Inc.Richmond, Virginia
LARRY L. PRINCE 4, 5
Chairman of the Executive Committee
Genuine Parts CompanyAtlanta, Georgia
FRANK S. ROYAL, M.D. 2, 3
President
Frank S. Royal, M.D., P.C.Richmond, Virginia
KAREN HASTIE WILLIAMS 2, 4
Retired Partner
Crowell & Moring, L.L.P.Washington, DC
DR. PHAIL WYNN, JR. 4, 5
Vice President, Durham and Regional Affairs
Duke UniversityDurham, North Carolina
1 Executive Committee James M. Wells III, Chair
2 Audit Committee M. Douglas Ivester, Chair Audit Committee Financial Expert Lead Director
3 Compensation Committee A. D. Correll, Chair
4 Governance and Nominating Committee G. Gilmer Minor, III, Chair
5 Risk Committee Jeffrey C. Crowe, Chair
BOARD OF DIRECTORS
SUNTRUST 2009 ANNUAL REPORT
4
32676_AR_Text.indd 432676_AR_Text.indd 4 2/26/10 3:05 PM2/26/10 3:05 PM

JAMES M. WELLS III Chairman and Chief Executive Offi cer
42 years of service
WILLIAM H. ROGERS, JR.President
30 years of service
FRANCES L. BREEDENCorporate Executive Vice President
Director of Human Resources30 years of service
MARK A. CHANCYCorporate Executive Vice President
Chief Financial Offi cer andCorporate and Investment Banking Executive21 years of service
DAVID F. DIERKERCorporate Executive Vice President
Chief Administrative Offi cer13 years of service
RAYMOND D. FORTINCorporate Executive Vice President
General Counsel21 years of service
THOMAS E. FREEMANCorporate Executive Vice President
Chief Risk Offi cer 4 years of service
C.T. HILLChairman, President, and Chief Executive Offi cer,Mid-Atlantic Banking Group
Retail Line of Business Executive40 years of service
THOMAS G. KUNTZChairman, President, and Chief Executive Offi cer, Florida Banking Group
Commercial Line of Business Executive31 years of service
TIMOTHY E. SULLIVANCorporate Executive Vice President
Chief Information Offi cer7 years of service
E. JENNER WOOD, III Chairman, President, and Chief Executive Offi cer, Central Banking Group
Effi ciency and Productivity Initiatives Executive35 years of service
LEADERSHIP
SUNTRUST 2009 ANNUAL REPORT
5
32676_AR_Text.indd 532676_AR_Text.indd 5 2/26/10 3:05 PM2/26/10 3:05 PM

BANKING GROUPS AND REGIONS KEY CITY KEY EXECUTIVE
Central Group Atlanta, GA E. Jenner Wood, III
Atlanta Region Atlanta, GA S. Gary Peacock, Jr.
· SunTrust Bank, Atlanta Atlanta, GA S. Gary Peacock, Jr.
· SunTrust Bank, Gainesville Gainesville, GA Lana D. Nix
· SunTrust Bank, Athens Athens, GA Lana D. Nix
· SunTrust Bank, Northwest Georgia Rome, GA Bradley L. White
Eastern Tennessee Region Chattanooga, TN Michael R. Butler
· SunTrust Bank, Chattanooga Chattanooga, TN Sue D. Culpepper
· SunTrust Bank, East Tennessee Knoxville, TN Roger D. Osborne
· SunTrust Bank, Northeast Tennessee Johnson City, TN Jerome Julian
Georgia Region Savannah, GA William B. Haile
· SunTrust Bank, Augusta Augusta, GA R. Thomas Coghill
· SunTrust Bank, Middle Georgia Macon, GA James A. Manley
· SunTrust Bank, Savannah Savannah, GA Kay A. Ford
· SunTrust Bank, South Georgia Albany, GA D. Michael Marz
· SunTrust Bank, Southeast Georgia Brunswick, GA Brian R. Parks
· SunTrust Bank, West Georgia Columbus, GA W. Allen Taber
Memphis Region Memphis, TN Johnny B. Moore, Jr.
· SunTrust Bank, Memphis Memphis, TN Johnny B. Moore, Jr.
Nashville Region Nashville, TN Robert E. McNeilly, III
· SunTrust Bank, Nashville Nashville, TN Robert E. McNeilly, III
· SunTrust Bank, Tennessee Valley Florence, AL Jeffrey P. Daniel
Florida Group Orlando, FL Thomas G. Kuntz
Central Florida Region Orlando, FL Ray L. Sandhagen
· SunTrust Bank, Central Florida Orlando, FL Ray L. Sandhagen
· SunTrust Bank, Mid-Florida Lakeland, FL James E. Chaffi n
· SunTrust Bank, East Central Florida Daytona Beach, FL Steven R. Forsyth
· SunTrust Bank, Brevard County Melbourne, FL Donna M. Demers
· SunTrust Bank, Winter Haven Winter Haven, FL Bonnie B. Parker
North Florida Region Jacksonville, FL David M. Mann
· SunTrust Bank, North Florida Jacksonville, FL David M. Mann
· SunTrust Bank, Ocala Ocala, FL James C. Maguire
· SunTrust Bank, Tallahassee Tallahassee, FL Tom M. Pennekamp
· SunTrust Bank, Pensacola Pensacola, FL Christina L. Doss
· SunTrust Bank, Panama City Panama City, FL John S. Kranak, Jr.
South Florida Region Ft. Lauderdale, FL James W. Rasmussen
· SunTrust Bank, South Florida Ft. Lauderdale, FL James W. Rasmussen
SUNTRUST’S BANKING NETWORK
SUNTRUST 2009 ANNUAL REPORT
6
32676_AR_Text.indd 632676_AR_Text.indd 6 2/26/10 3:05 PM2/26/10 3:05 PM

BANKING GROUPS AND REGIONS KEY CITY KEY EXECUTIVE
Florida Group continued
Southwest Florida Region Sarasota, FL Margaret L. Callihan
· SunTrust Bank, Gulf Coast Sarasota, FL Margaret L. Callihan
· SunTrust Bank, Charlotte County Port Charlotte, FL Steven J. Vito
· SunTrust Bank, Lee County Fort Myers, FL Heidi Colgate-Tamblyn
· SunTrust Bank, Collier County Naples, FL Michael J. Davis
Tampa Region Tampa, FL Daniel W. Mahurin
· SunTrust Bank, Hillsborough County Tampa, FL O. Fred Dobbins
· SunTrust Bank, Nature Coast Brooksville, FL James H. Kimbrough
· SunTrust Bank, South Pinellas County St. Petersburg, FL Roy A. Binger
· SunTrust Bank, North Pinellas County Clearwater, FL Steven L. Cass
Mid-Atlantic Group Richmond, VA C.T. Hill
Central Carolina Region Raleigh, NC John G. Stallings
· SunTrust Bank, Durham Durham, NC Lisa H. Yarborough
· SunTrust Bank, Greensboro Greensboro, NC Spence H. Broadhurst
· SunTrust Bank, Wilmington Wilmington, NC Donna S. Cameron
Central Virginia Region Richmond, VA Gail L. Letts
· SunTrust Bank, Central Virginia Richmond, VA Gail L. Letts
· SunTrust Bank, Tri-Cities Petersburg, Hopewell, Colonial Heights, VA Ernest H. Yerly
Greater Washington & Maryland Region Washington, DC J. Scott Wilfong
· SunTrust Bank, Greater Washington Washington, DC J. Scott Wilfong
Hampton Roads Region Norfolk, VA Thomas V. Rueger
· SunTrust Bank, Hampton Roads Norfolk, VA Thomas V. Rueger
· SunTrust Bank, Newport News Newport News, VA Jerome F. Clark
· SunTrust Bank, Williamsburg Williamsburg, VA Bernard H. Ngo
Mecklenburg/South Carolina Region Charlotte, NC Carl E. Wicker, Jr.
· SunTrust Bank, Asheville Asheville, NC Wes G. Wright
· SunTrust Bank, Cabarrus Cabarrus, NC Jeffrey H. Joyce, Sr.
· SunTrust Bank, Charleston Charleston, SC Mark A. Lattanzio
· SunTrust Bank, Charlotte Charlotte, NC Thomas M. Hodges IV
· SunTrust Bank, Hilton Head Hilton Head, SC Stuart P. Wilbourne
· SunTrust Bank, Greenville Greenville, SC G. Francis O’Brien III
Western Virginia Region Roanoke, VA Barry L. Henderson
· SunTrust Bank, Roanoke Roanoke, VA Barry L. Henderson
· SunTrust Bank, Charleston Charleston, WV David L. Sayre
· SunTrust Bank, Charlottesville Charlottesville, VA Stephen C. Campbell
· SunTrust Bank, Harrisonburg Harrisonburg, VA Martha D. Shiffl ett
· SunTrust Bank, Lynchburg Lynchburg, VA Michael A. Syrek
· SunTrust Bank, Martinsville Martinsville, VA Ricky A. Swinney
· SunTrust Bank, New River Valley Radford, VA Edward B. Lawhorn
· SunTrust Bank, Staunton Staunton, VA Russell A. Rose
SUNTRUST 2009 ANNUAL REPORT
7
32676_AR_Text.indd 732676_AR_Text.indd 7 2/26/10 3:05 PM2/26/10 3:05 PM
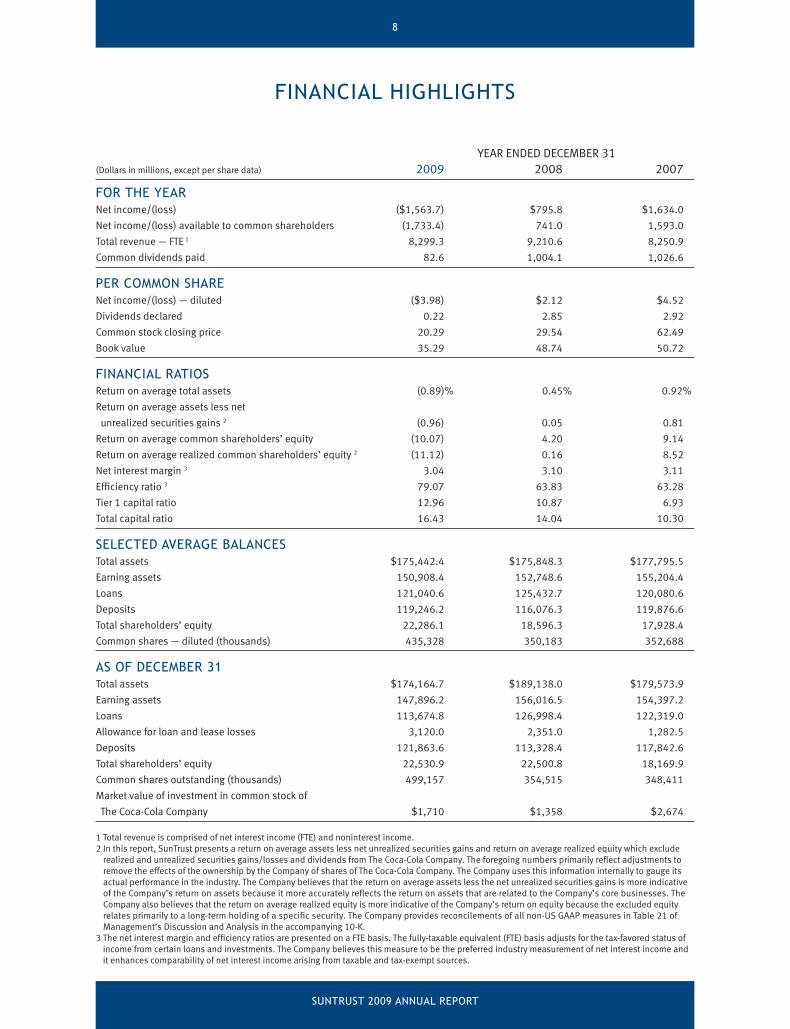
YEAR ENDED DECEMBER 31(Dollars in millions, except per share data) 2009 2008 2007
FOR THE YEARNet income/(loss) ($1,563.7) $795.8 $1,634.0
Net income/(loss) available to common shareholders (1,733.4) 741.0 1,593.0
Total revenue — FTE 1 8,299.3 9,210.6 8,250.9
Common dividends paid 82.6 1,004.1 1,026.6
PER COMMON SHARE Net income/(loss) — diluted ($3.98) $2.12 $4.52
Dividends declared 0.22 2.85 2.92
Common stock closing price 20.29 29.54 62.49
Book value 35.29 48.74 50.72
FINANCIAL RATIOS Return on average total assets (0.89)% 0.45% 0.92%
Return on average assets less net
unrealized securities gains 2 (0.96) 0.05 0.81
Return on average common shareholders’ equity (10.07) 4.20 9.14
Return on average realized common shareholders’ equity 2 (11.12) 0.16 8.52
Net interest margin 3 3.04 3.10 3.11
Effi ciency ratio 3 79.07 63.83 63.28
Tier 1 capital ratio 12.96 10.87 6.93
Total capital ratio 16.43 14.04 10.30
SELECTED AVERAGE BALANCES Total assets $175,442.4 $175,848.3 $177,795.5
Earning assets 150,908.4 152,748.6 155,204.4
Loans 121,040.6 125,432.7 120,080.6
Deposits 119,246.2 116,076.3 119,876.6
Total shareholders’ equity 22,286.1 18,596.3 17,928.4
Common shares — diluted (thousands) 435,328 350,183 352,688
AS OF DECEMBER 31 Total assets $174,164.7 $189,138.0 $179,573.9
Earning assets 147,896.2 156,016.5 154,397.2
Loans 113,674.8 126,998.4 122,319.0
Allowance for loan and lease losses 3,120.0 2,351.0 1,282.5
Deposits 121,863.6 113,328.4 117,842.6
Total shareholders’ equity 22,530.9 22,500.8 18,169.9
Common shares outstanding (thousands) 499,157 354,515 348,411
Market value of investment in common stock of
The Coca-Cola Company $1,710 $1,358 $2,674
1 Total revenue is comprised of net interest income (FTE) and noninterest income.2 In this report, SunTrust presents a return on average assets less net unrealized securities gains and return on average realized equity which exclude
realized and unrealized securities gains/losses and dividends from The Coca-Cola Company. The foregoing numbers primarily refl ect adjustments to remove the effects of the ownership by the Company of shares of The Coca-Cola Company. The Company uses this information internally to gauge its actual performance in the industry. The Company believes that the return on average assets less the net unrealized securities gains is more indicative of the Company’s return on assets because it more accurately refl ects the return on assets that are related to the Company’s core businesses. The Company also believes that the return on average realized equity is more indicative of the Company’s return on equity because the excluded equity relates primarily to a long-term holding of a specifi c security. The Company provides reconcilements of all non-US GAAP measures in Table 21 of Management’s Discussion and Analysis in the accompanying 10-K.
3 The net interest margin and effi ciency ratios are presented on a FTE basis. The fully-taxable equivalent (FTE) basis adjusts for the tax-favored status of income from certain loans and investments. The Company believes this measure to be the preferred industry measurement of net interest income and it enhances comparability of net interest income arising from taxable and tax-exempt sources.
FINANCIAL HIGHLIGHTS
SUNTRUST 2009 ANNUAL REPORT
8
32676_AR_Text.indd 832676_AR_Text.indd 8 2/26/10 3:05 PM2/26/10 3:05 PM

UNITED STATESSECURITIES AND EXCHANGE COMMISSION
Washington, D.C. 205492009 FORM 10-K
È ANNUAL REPORT PURSUANT TO SECTION 13 OR 15(d)OF THE SECURITIES EXCHANGE ACT OF 1934
For the fiscal year ended December 31, 2009or
‘ TRANSITION REPORT PURSUANT TO SECTION 13 OR 15(d) OF THE SECURITIES EXCHANGE ACT OF 1934
Commission File Number 001-08918
SUNTRUST BANKS, INC.(Exact name of registrant as specified in its charter)
Georgia 58-1575035(State or other jurisdiction
of incorporation or organization)(I.R.S. Employer
Identification No.)
303 Peachtree Street, N.E., Atlanta, Georgia 30308(Address of principal executive offices) (Zip Code)
(404) 588-7711(Registrant’s telephone number, including area code)
Securities registered pursuant to section 12(b) of the Act:
Title of each class Name of exchange on which registered
Common Stock New York Stock Exchange
Depository Shares, Each Representing 1/4000th Interest in a Share ofPerpetual Preferred Stock, Series A
New York Stock Exchange
7.875% Trust Preferred Securities of SunTrust Capital IX New York Stock Exchange
6.100% Trust Preferred Securities of SunTrust Capital VIII New York Stock Exchange
5.853% Fixed-to Floating Rate Normal Preferred PurchaseSecurities of SunTrust Preferred Capital I
New York Stock Exchange
Guarantee of 7.70% Trust Preferred Securities of NationalCommerce Capital Trust II
New York Stock Exchange
Indicate by check mark if the registrant is a well-known seasoned issuer, as defined in Rule 405 of the Securities Act. Yes È No ‘
Indicate by check mark if the registrant is not required to file reports pursuant to Section 13 or Section 15(d) of the Act. Yes ‘ No È
Indicate by check mark whether the registrant (1) has filed all reports required to be filed by Section 13 or 15(d) of the Securities ExchangeAct of 1934 during the preceding 12 months (or for such shorter period that the registrant was required to file such reports), and (2) hasbeen subject to such filing requirements for the past 90 days. Yes È No ‘
Indicate by check mark whether the registrant has submitted electronically and posted on its corporate website, if any, every InteractiveData File required to be submitted and posted pursuant to Rule 405 of Regulation S-T (§232.405 of this chapter) during the preceding 12months (or for such shorter period that the registrant was required to submit and post such files). È Yes ‘ No
Indicate by check mark if disclosure of delinquent filers pursuant to Item 405 of Regulation S-K is not contained herein, and will not becontained, to the best of registrant’s knowledge, in definitive proxy or information statements incorporated by reference in Part III of thisForm 10-K or any amendment to this Form 10-K. ‘
Indicate by check mark whether the registrant is a large accelerated filer, an accelerated filer, a non-accelerated filer, or a smaller reportingcompany. See the definitions of “large accelerated filer,” “accelerated filer,” and “smaller reporting company” in Rule 12b-2 of theExchange Act. (Check one):
Large accelerated filer È Accelerated filer ‘ Non-accelerated filer ‘ Smaller reporting company ‘
Indicate by check mark whether the registrant is a shell company (as defined in Rule 12b-2 of the Act). Yes ‘ No È
The aggregate market value of the voting Common Stock held by non-affiliates at June 30, 2009 was approximately $6.5 billion, based onthe New York Stock Exchange closing price for such shares on that date. For purposes of this calculation, the Registrant has assumed thatits directors and executive officers are affiliates.
At February 8, 2010, 499,350,064 shares of the Registrant’s Common Stock, $1.00 par value, were outstanding.
DOCUMENTS INCORPORATED BY REFERENCE
Pursuant to Instruction G of Form 10-K, information in the Registrant’s Definitive Proxy Statement for its 2010 Annual Shareholder’sMeeting, which it will file with the SEC no later than April 30, 2010 (the “Proxy Statement”), is incorporated by reference into Items 10-14of this Report.
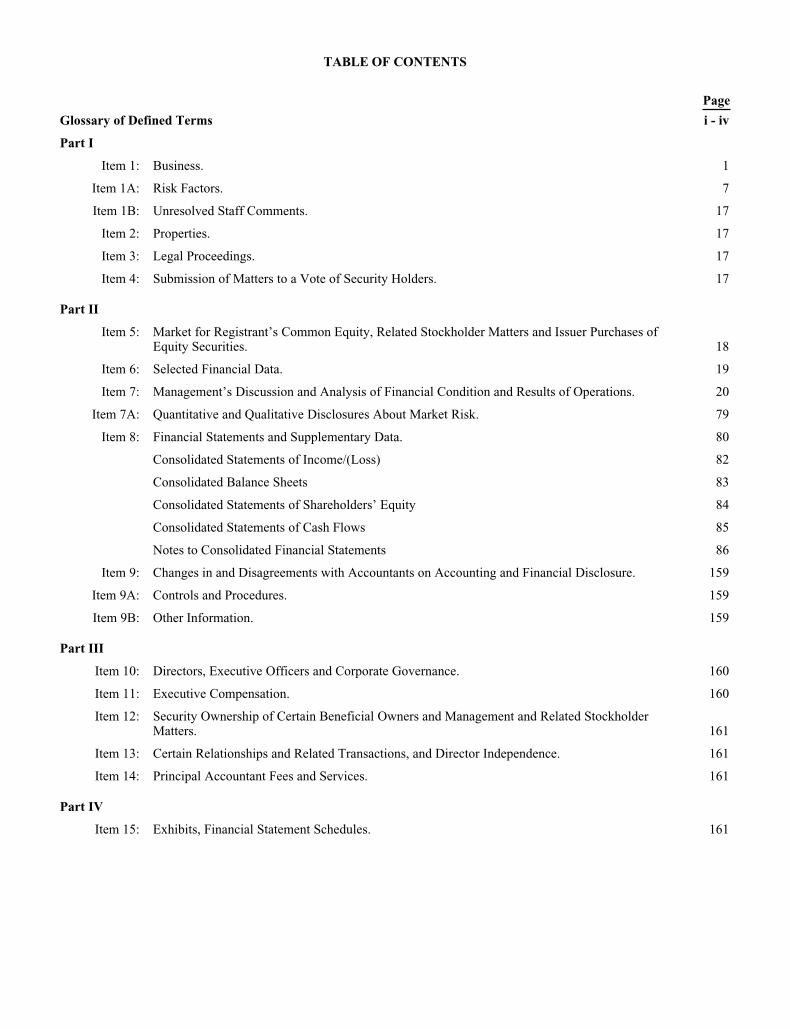
TABLE OF CONTENTS
Page
Glossary of Defined Terms i - iv
Part I
Item 1: Business. 1
Item 1A: Risk Factors. 7
Item 1B: Unresolved Staff Comments. 17
Item 2: Properties. 17
Item 3: Legal Proceedings. 17
Item 4: Submission of Matters to a Vote of Security Holders. 17
Part II
Item 5: Market for Registrant’s Common Equity, Related Stockholder Matters and Issuer Purchases ofEquity Securities. 18
Item 6: Selected Financial Data. 19
Item 7: Management’s Discussion and Analysis of Financial Condition and Results of Operations. 20
Item 7A: Quantitative and Qualitative Disclosures About Market Risk. 79
Item 8: Financial Statements and Supplementary Data. 80
Consolidated Statements of Income/(Loss) 82
Consolidated Balance Sheets 83
Consolidated Statements of Shareholders’ Equity 84
Consolidated Statements of Cash Flows 85
Notes to Consolidated Financial Statements 86
Item 9: Changes in and Disagreements with Accountants on Accounting and Financial Disclosure. 159
Item 9A: Controls and Procedures. 159
Item 9B: Other Information. 159
Part III
Item 10: Directors, Executive Officers and Corporate Governance. 160
Item 11: Executive Compensation. 160
Item 12: Security Ownership of Certain Beneficial Owners and Management and Related StockholderMatters. 161
Item 13: Certain Relationships and Related Transactions, and Director Independence. 161
Item 14: Principal Accountant Fees and Services. 161
Part IV
Item 15: Exhibits, Financial Statement Schedules. 161

GLOSSARY OF DEFINED TERMS
ABCP — Asset-backed commercial paper.
ABS — Asset-backed securities.
ALCO — Asset/Liability Management Committee.
ALLL — Allowance for loan and lease losses.
ANPR — Advance Notice of Proposed Rulemaking.
AOCI — Accumulated other comprehensive income.
ARMs — Adjustable rate mortgages.
ARRA — The American Reinvestment and Recovery Act of 2009.
ARS — Auction rate securities.
ASR — Accelerated share repurchase.
ASC — FASB Accounting Standard Codification.
ASU — Accounting standards update.
ATE — Additional termination event.
Bank — SunTrust Bank.
Board — The Company’s Board of Directors.
CDO — Collateralized debt obligation.
CD — Certificate of deposit.
CDS — Credit default swaps.
CIB — Corporate and Investment Banking.
Class B shares —Visa Inc. Class B common stock.
CLO — Collateralized loan obligation.
Coke — The Coca-Cola Company.
Company — SunTrust Banks, Inc.
CP — Commercial paper.
CPP — Capital Purchase Program.
CRA — Community Reinvestment Act of 1977.
CRC — Corporate Risk Committee.
CRO — Chief Risk Officer.
CSA — Credit support annex.
DDA — Demand deposit account.
DGP — Debt Guarantee Program.
DIF — Deposit Insurance Fund.
EESA — The Emergency Economic Stabilization Act of 2008.
EPS — Earnings per share.
i

Exchange Act — Securities Exchange Act of 1934.
FASB — Financial Accounting Standards Board.
FDA — Federal Deposit Insurance Act.
FDIC — The Federal Deposit Insurance Corporation.
FDICIA — The Federal Deposit Insurance Corporation Improvement Act of 1991.
Federal Reserve — The Board of Governors of the Federal Reserve System.
FFIEC — The Federal Financial Institutions Examination Council.
FHA — Federal Housing Administration.
FHLB — Federal Home Loan Bank.
FICO — Fair Isaac Corporation.
FINRA — Financial Industry Regulatory Authority.
Fitch — Fitch Ratings Ltd.
FTE — Fully taxable-equivalent.
First Mercantile — First Mercantile Trust Company.
FNMA — Federal National Mortgage Association.
FVO — Fair Value Option.
GB&T — GB&T Bancshares, Inc.
GenSpring — GenSpring Family Offices LLC.
GLB Act — Gramm-Leach-Bliley Act.
GNMA — Government National Mortgage Association.
IIS — Institutional Investment Solutions.
IPO — Initial public offering.
IRLCs — Interest rate lock commitments.
IRS — Internal Revenue Service.
ISDA — International Swaps and Derivatives Associations Master Agreement.
Lehman Brothers — Lehman Brothers Holdings, Inc.
LHFS — Loans held for sale.
LHFI-FV — Loans held for investment carried at fair value.
LIBOR — London InterBank Offered Rate.
Lighthouse Investment Partners — Lighthouse Investment Partners, LLC.
LOCOM — Lower of Cost or Market.
LTI — Long-term incentive.
LTV — Loan to value.
MBS — Mortgage-backed securities.
MD&A — Management’s Discussion and Analysis of Financial Condition and Results of Operations.
MIP — Management Incentive Plan.
ii

MMMF — Money market mutual funds.
Moody’s — Moody’s Investors Service.
MSRs — Mortgage servicing rights.
MVE — Market value of equity.
NAICS — North American Industry Classification System.
NCF — National Commerce Financial Corporation.
NOL — Net operating loss.
NSF — Non-sufficient funds.
NYSE — New York Stock Exchange.
OCI — Other comprehensive income.
OREO — Other real estate owned.
OTTI — Other-than-temporary impairment.
Parent Company — Parent Company of SunTrust Banks, Inc.
Patriot Act — The USA Patriot Act of 2001.
PRAC — Corporate Product Risk Assessment Committee.
Prime Performance — Prime Performance, Inc.
PUP — Performance Unit Plan.
PWM — Private Wealth Management.
QSPE — Qualifying special-purpose entity.
RCCs — Replacement Capital Covenants.
REITS — Real Estate Investment Trusts.
RidgeWorth — RidgeWorth Capital Management, Inc.
ROA — Return on average total assets.
ROE — Return on average common shareholders’ equity.
S&P — Standard and Poor’s.
SCAP — Supervisory Capital Assessment Program.
SEC — U.S. Securities and Exchange Commission.
Seix — Seix Investment Advisors, Inc.
SERP — Supplemental Executive Retirement Plan.
SIVs — Structured investment vehicles.
SPE — Special Purpose Entity.
STIAA — SunTrust Institutional Asset Advisors LLC.
STIS — SunTrust Investment Services, Inc.
STM — SunTrust Mortgage, Inc.
Stock Plan — SunTrust Banks, Inc. 2004 Stock Plan.
iii

STRH — SunTrust Robinson Humphrey, Inc.
SunAmerica — SunAmerica Mortgage.
SunTrust — SunTrust Banks, Inc.
SunTrust Community Capital — SunTrust Community Capital, LLC.
TAF — Term Auction Facility.
TAGP — Transaction Account Guarantee Program.
TARP — Troubled Asset Relief Program.
TDR — Troubled debt restructuring.
The Agreements — Equity forward agreements.
The Program — ABCP MMMF Liquidity Facility Program.
Three Pillars — Three Pillars Funding, LLC.
TLGP — Temporary Liquidity Guarantee Program.
TRS — Total return swaps.
Twin Rivers — Twin Rivers Insurance Company.
U.S. GAAP — Generally Accepted Accounting Principles in the United States.
U.S. Treasury — The United States Department of the Treasury.
UTBs — Unrecognized tax benefits.
VA — Veteran’s Administration.
VAR — Value at risk.
VEBA — Voluntary Employees’ Beneficiary Association.
VI — Variable interest.
VIE — Variable interest entity.
Visa — The Visa, U.S.A. Inc. card association or its affiliates, collectively.
VRDO — Variable rate demand obligation.
ZCI — Zevenbergen Capital Investments, LLC.
iv
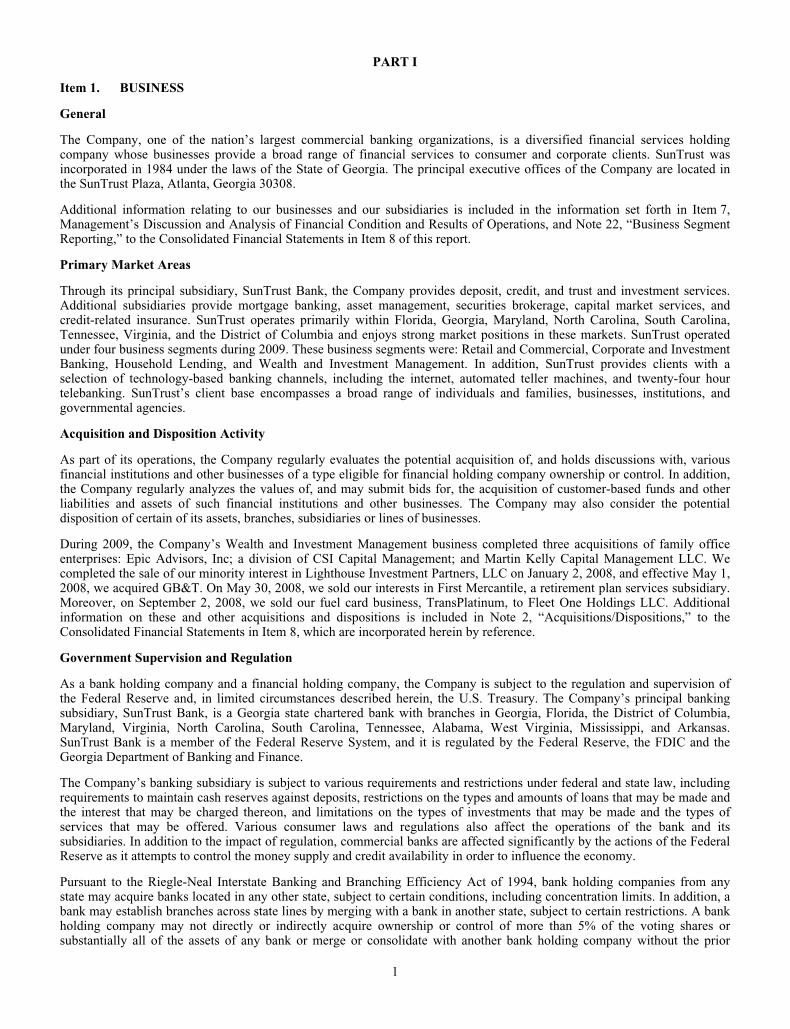
PART I
Item 1. BUSINESS
General
The Company, one of the nation’s largest commercial banking organizations, is a diversified financial services holdingcompany whose businesses provide a broad range of financial services to consumer and corporate clients. SunTrust wasincorporated in 1984 under the laws of the State of Georgia. The principal executive offices of the Company are located inthe SunTrust Plaza, Atlanta, Georgia 30308.
Additional information relating to our businesses and our subsidiaries is included in the information set forth in Item 7,Management’s Discussion and Analysis of Financial Condition and Results of Operations, and Note 22, “Business SegmentReporting,” to the Consolidated Financial Statements in Item 8 of this report.
Primary Market Areas
Through its principal subsidiary, SunTrust Bank, the Company provides deposit, credit, and trust and investment services.Additional subsidiaries provide mortgage banking, asset management, securities brokerage, capital market services, andcredit-related insurance. SunTrust operates primarily within Florida, Georgia, Maryland, North Carolina, South Carolina,Tennessee, Virginia, and the District of Columbia and enjoys strong market positions in these markets. SunTrust operatedunder four business segments during 2009. These business segments were: Retail and Commercial, Corporate and InvestmentBanking, Household Lending, and Wealth and Investment Management. In addition, SunTrust provides clients with aselection of technology-based banking channels, including the internet, automated teller machines, and twenty-four hourtelebanking. SunTrust’s client base encompasses a broad range of individuals and families, businesses, institutions, andgovernmental agencies.
Acquisition and Disposition Activity
As part of its operations, the Company regularly evaluates the potential acquisition of, and holds discussions with, variousfinancial institutions and other businesses of a type eligible for financial holding company ownership or control. In addition,the Company regularly analyzes the values of, and may submit bids for, the acquisition of customer-based funds and otherliabilities and assets of such financial institutions and other businesses. The Company may also consider the potentialdisposition of certain of its assets, branches, subsidiaries or lines of businesses.
During 2009, the Company’s Wealth and Investment Management business completed three acquisitions of family officeenterprises: Epic Advisors, Inc; a division of CSI Capital Management; and Martin Kelly Capital Management LLC. Wecompleted the sale of our minority interest in Lighthouse Investment Partners, LLC on January 2, 2008, and effective May 1,2008, we acquired GB&T. On May 30, 2008, we sold our interests in First Mercantile, a retirement plan services subsidiary.Moreover, on September 2, 2008, we sold our fuel card business, TransPlatinum, to Fleet One Holdings LLC. Additionalinformation on these and other acquisitions and dispositions is included in Note 2, “Acquisitions/Dispositions,” to theConsolidated Financial Statements in Item 8, which are incorporated herein by reference.
Government Supervision and Regulation
As a bank holding company and a financial holding company, the Company is subject to the regulation and supervision ofthe Federal Reserve and, in limited circumstances described herein, the U.S. Treasury. The Company’s principal bankingsubsidiary, SunTrust Bank, is a Georgia state chartered bank with branches in Georgia, Florida, the District of Columbia,Maryland, Virginia, North Carolina, South Carolina, Tennessee, Alabama, West Virginia, Mississippi, and Arkansas.SunTrust Bank is a member of the Federal Reserve System, and it is regulated by the Federal Reserve, the FDIC and theGeorgia Department of Banking and Finance.
The Company’s banking subsidiary is subject to various requirements and restrictions under federal and state law, includingrequirements to maintain cash reserves against deposits, restrictions on the types and amounts of loans that may be made andthe interest that may be charged thereon, and limitations on the types of investments that may be made and the types ofservices that may be offered. Various consumer laws and regulations also affect the operations of the bank and itssubsidiaries. In addition to the impact of regulation, commercial banks are affected significantly by the actions of the FederalReserve as it attempts to control the money supply and credit availability in order to influence the economy.
Pursuant to the Riegle-Neal Interstate Banking and Branching Efficiency Act of 1994, bank holding companies from anystate may acquire banks located in any other state, subject to certain conditions, including concentration limits. In addition, abank may establish branches across state lines by merging with a bank in another state, subject to certain restrictions. A bankholding company may not directly or indirectly acquire ownership or control of more than 5% of the voting shares orsubstantially all of the assets of any bank or merge or consolidate with another bank holding company without the prior
1

approval of the Federal Reserve. Moreover, a bank and its affiliates may not, after the acquisition of another bank, controlmore than 10% of the amount of deposits of insured depository institutions in the United States. In addition, certain statesmay have limitations on the amount of deposits any bank may hold within that state.
There are a number of obligations and restrictions imposed on bank holding companies and their depository institutionsubsidiaries by federal law and regulatory policy that are designed to reduce potential loss exposure to the depositors of suchdepository institutions and to the FDIC insurance fund in the event the depository institution becomes in danger of default oris in default. For example, under a policy of the Federal Reserve with respect to bank holding company operations, a bankholding company is required to serve as a source of financial strength to its subsidiary depository institutions and commitresources to support such institutions in circumstances where it might not do so absent such policy. In addition, the “cross-guarantee” provisions of federal law require insured depository institutions under common control to reimburse the FDIC forany loss suffered or reasonably anticipated as a result of the default of a commonly controlled insured depository institutionor for any assistance provided by the FDIC to a commonly controlled insured depository institution in danger of default. Thefederal banking agencies have broad powers under current federal law to take prompt corrective action to resolve problemsof insured depository institutions. The extent of these powers depends upon whether the institutions in question are “wellcapitalized,” “adequately capitalized,” “undercapitalized,” “significantly undercapitalized” or “critically undercapitalized” assuch terms are defined under regulations issued by each of the federal banking agencies.
The Federal Reserve and the FDIC have issued substantially similar risk-based and leverage capital guidelines applicable toUnited States banking organizations. In addition, these regulatory agencies may from time to time require that a bankingorganization maintain capital above the minimum levels, whether because of its financial condition or actual or anticipatedgrowth. The Federal Reserve risk-based guidelines define a tier-based capital framework. Tier 1 capital includes commonshareholders’ equity, trust preferred securities, minority interests and qualifying preferred stock, less goodwill (net of anyqualifying deferred tax liability) and other adjustments. Tier 2 capital consists of preferred stock not qualifying as Tier 1capital, mandatorily convertible debt, limited amounts of subordinated debt, other qualifying term debt, the allowance forcredit losses up to a certain amount and a portion of the unrealized gain on equity securities. The sum of Tier 1 and Tier 2capital represents the Company’s qualifying total capital. Risk-based capital ratios are calculated by dividing Tier 1 and totalcapital by risk-weighted assets. Assets and off-balance sheet exposures are assigned to one of four categories of risk-weights,based primarily on relative credit risk. In addition, the Company, and any bank with significant trading activity, mustincorporate a measure for market risk in their regulatory capital calculations. The leverage ratio is determined by dividingTier 1 capital by adjusted average total assets.
FDICIA, among other things, identifies five capital categories for insured depository institutions (“well capitalized,”“adequately capitalized,” “undercapitalized,” “significantly undercapitalized,” and “critically undercapitalized”) and requiresthe respective federal regulatory agencies to implement systems for “prompt corrective action” for insured depositoryinstitutions that do not meet minimum capital requirements within such categories. FDICIA imposes progressively morerestrictive constraints on operations, management and capital distributions, depending on the category in which an institutionis classified. Failure to meet the capital guidelines could also subject a banking institution to capital raising requirements. An“undercapitalized” bank must develop a capital restoration plan and its parent holding company must guarantee that bank’scompliance with the plan. The liability of the parent holding company under any such guarantee is limited to the lesser offive percent of the bank’s assets at the time it became “undercapitalized” or the amount needed to comply with the plan.Furthermore, in the event of the bankruptcy of the parent holding company, such guarantee would take priority over theparent’s general unsecured creditors. In addition, FDICIA requires the various regulatory agencies to prescribe certainnon-capital standards for safety and soundness relating generally to operations and management, asset quality, and executivecompensation and permits regulatory action against a financial institution that does not meet such standards.
The various regulatory agencies have adopted substantially similar regulations that define the five capital categoriesidentified by FDICIA, using the total risk-based capital, Tier 1 risk-based capital and leverage capital ratios as the relevantcapital measures. Such regulations establish various degrees of corrective action to be taken when an institution is consideredundercapitalized. Under the regulations, a “well capitalized” institution must have a Tier 1 risk-based capital ratio of at leastsix percent, a total risk-based capital ratio of at least ten percent and a leverage ratio of at least five percent and not be subjectto a capital directive order.
Regulators also must take into consideration: (a) concentrations of credit risk; (b) interest rate risk (when the interest ratesensitivity of an institution’s assets does not match the sensitivity of its liabilities or its off-balance-sheet position); and(c) risks from non-traditional activities, as well as an institution’s ability to manage those risks, when determining theadequacy of an institution’s capital. This evaluation will be made as a part of the institution’s regular safety and soundnessexamination. In addition, regulators may choose to examine other factors in order to evaluate the safety and soundness offinancial institutions. For instance, in connection with the Supervisory Capital Assessment Program, our regulators beganfocusing on “Tier 1 common equity,” which is the proportion of Tier 1 capital that is common equity. The Tier 1 commonequity ratio continues to be a factor which regulators examine in evaluating the safety and soundness of financial institutions.
2

In December 2009, the Basel Committee issued two consultative documents proposing reforms to bank capital and liquidityregulation. The Basel Committee’s capital proposals would significantly revise the definitions of Tier 1 capital and Tier 2capital. Among other things, they would: reemphasize that common equity is the “predominant” component of Tier 1 capitalby adding a minimum common equity to risk-weighted assets ratio, with the ratio itself to be determined based on theoutcome of an impact study that the Basel Committee is conducting, and requiring that goodwill, general intangibles andcertain other items that currently must be deducted from Tier 1 capital instead be deducted from common equity as acomponent of Tier 1 capital; disallow full value of MSRs from common equity; disqualify innovative capital instruments –including U.S.-style trust preferred securities and other instruments that effectively pay cumulative dividends – from Tier 1capital status; strengthen the risk coverage of the capital framework, particularly with respect to counterparty credit riskexposures arising from derivatives, repurchase agreements and securities financing activities; introduce a leverage ratiorequirement as an international standard, including all commitments (including liquidity facilities), unconditionallycancellable commitments, direct credit substitutes, and other items fully funded; and implement measures to promote thebuild-up of capital buffers in good times that can be drawn upon during periods of stress, introducing a countercyclicalcomponent designed to address the concern that existing capital requirements are procyclical – that is, they encouragereducing capital buffers in good times, when capital could more easily be raised, and increasing capital buffers in times ofdistress, when access to capital markets may be limited or they may effectively be closed. The capital proposals do notspecify a percentage for the new ratio of common equity to risk-weighted assets or changes in the current minimum Tier 1(4%) and total (8%) risk-based capital requirements. Instead, they state that the minimum percentage requirements for thenew ratio of common equity to risk-weighted assets and the other capital ratios – including Tier 1 capital to risk-weightedassets, total capital to risk-weighted assets and the new leverage ratio – will be included in a “fully calibrated, comprehensiveset” of capital and liquidity proposals to be released by December 31, 2010. Independently in September 2009, the U.S.Treasury issued a policy statement titled “Principles for Reforming the U.S. and International Regulatory Capital Frameworkfor Banking Firms” setting forth core principles intended to address many of the same substantive items as the BaselCommittee capital proposals.
The Basel Committee’s liquidity proposals, although similar in many respects to tests historically applied by bankingorganizations and regulators for management and supervisory purposes, if implemented would for the first time be formulaicand required by regulation. They would impose two measures of liquidity risk exposure, one based on a 30-day time horizonand the other addressing longer term structural liquidity mismatches over a one-year time period. The 30-day time horizonmeasure would not include certain assets (specifically, Fannie Mae and Freddie Mac securities) that play a major role incurrent liquidity management, which could have substantial impact.
The Basel Committee indicated that it expects final provisions responsive to the proposals to be implemented byDecember 31, 2012. Ultimate implementation in individual countries, including the United States, is subject to the discretionof the bank regulators in those countries. The Basel Committee’s final proposals may differ from the proposals released inDecember 2010, and the regulations and guidelines adopted by regulatory authorities having jurisdiction over the Companymay differ from the final accord of the Basel Committee. Moreover, although some aspects of the Basel Committeeproposals were quite specific (for example, the definition of the components of capital), others were merely conceptual (forexample, the description of the leverage test) and others not specifically addressed (for example, the minimum percentagesfor required capital ratios). We are not able to predict at this time the content of guidelines or regulations that will ultimatelybe adopted by regulatory agencies having authority over the Company or the impact of changes in capital and liquidityregulation upon us. However, a requirement that the Company and its bank subsidiaries maintain more capital, with commonequity as a more predominant component, or manage the configuration of their assets and liabilities in order to comply withformulaic liquidity requirements, could significantly impact our financial condition, operations, capital position and ability topursue business opportunities.
There are various legal and regulatory limits on the extent to which the Company’s subsidiary bank may pay dividends orotherwise supply funds to the Company. In addition, federal and state bank regulatory agencies also have the authority toprevent a bank or bank holding company from paying a dividend or engaging in any other activity that, in the opinion of theagency, would constitute an unsafe or unsound practice. The FDA provides that, in the event of the “liquidation or otherresolution” of an insured depository institution, the claims of depositors of the institution (including the claims of the FDICas subrogee of insured depositors) and certain claims for administrative expenses of the FDIC as a receiver will have priorityover other general unsecured claims against the institution. If an insured depository institution fails, insured and uninsureddepositors, along with the FDIC, will have priority in payment ahead of unsecured, nondeposit creditors, including the parentbank holding company, with respect to any extensions of credit they have made to such insured depository institution.
The FDIC maintains the DIF by assessing depository institutions an insurance premium. The amount each institution isassessed is based upon statutory factors that include the balance of insured deposits as well as the degree of risk theinstitution poses to the insurance fund. The FDIC recently increased the amount of deposits it insures from $100,000 to$250,000. This increase is temporary and will continue through December 31, 2013. The Company’s banking subsidiary paysan insurance premium into the DIF based on the quarterly average daily deposit liabilities net of certain exclusions held at theCompany’s banking subsidiary. The FDIC uses a risk-based premium system that assesses higher rates on those institutions
3

that pose greater risks to the DIF. The FDIC places each institution in one of four risk categories using a two-step processbased first on capital ratios (the capital group assignment) and then on other relevant information (the supervisory groupassignment). Subsequently, the rate for each institution within a risk category may be adjusted depending upon differentfactors that either enhance or reduce the risk the institution poses to the DIF, including the unsecured debt, secured liabilitiesand brokered deposits related to each institution. Finally, certain risk multipliers may be applied to the adjusted assessment.In 2009, the FDIC increased the amount assessed from financial institutions by increasing its risk-based deposit insuranceassessment scale uniformly by a total of seven basis points. The assessment scale for 2009 ranged from twelve basis points ofassessable deposits for the strongest institutions to fifty basis points for the weakest. In 2009, the FDIC also adopted auniform three basis points increase across all risk categories to be effective starting January 1, 2011.
On November 12, 2009, the FDIC voted to approve a rule to require insured institutions to prepay their estimated quarterlyrisk-based assessments for the fourth quarter of 2009, and for all of 2010, 2011, and 2012. An insured institution’s risk-baseddeposit insurance assessments will continue to be calculated on a quarterly basis, but will be paid from the amount theinstitution prepaid until the later of the date that amount is exhausted or June 30, 2013, at which point any remaining fundswould be returned to the insured institution. Consequently, the Company’s prepayment of DIF premiums made onDecember 29, 2009 resulted in a prepaid asset of $924.8 million.
In November 2008, the FDIC created the TLGP to strengthen confidence and encourage liquidity in the banking system byguaranteeing newly issued senior unsecured debt of banks, thrifts, and certain holding companies via its DGP, and byproviding full coverage of noninterest bearing deposit transaction accounts and capped NOW accounts, regardless of dollaramount via its TAGP. As of October 31, 2009, banks are no longer eligible to issue additional debt under the TLGP and theCompany has opted not to participate in the TAGP beyond December 31, 2009.
FDIC regulations require that management report annually on its responsibility for preparing its institution’s financialstatements, establishing and maintaining an internal control structure and procedures for financial reporting, and compliancewith designated laws and regulations concerning safety and soundness.
On November 12, 1999, financial modernization legislation known as the GLB Act was signed into law. Under the GLB Act,a bank holding company which elects to become a financial holding company may engage in expanded securities activities,insurance sales, and underwriting activities, and other financial activities, and may also acquire securities firms and insurancecompanies, subject in each case to certain conditions. The Company has elected to become a financial holding companyunder the GLB Act. If any of our banking subsidiaries ceases to be “well capitalized” or “well managed” under applicableregulatory standards, the Federal Reserve may, among other things, place limitations on our ability to conduct these broaderfinancial activities or, if the deficiencies persist, require us to divest the banking subsidiary. In order to become and maintainits status as a financial holding company, the Company and all of its affiliated depository institutions must be “well-capitalized,” “well-managed,” and have at least a satisfactory CRA rating. Furthermore, if the Federal Reserve determinesthat a financial holding company has not maintained a satisfactory CRA rating, the Company will not be able to commenceany new financial activities or acquire a company that engages in such activities, although the Company will still be allowedto engage in activities closely related to banking and make investments in the ordinary course of conducting merchantbanking activities.
The Patriot Act substantially broadens existing anti-money laundering legislation and the extraterritorial jurisdiction of theUnited States; imposes new compliance and due diligence obligations; creates new crimes and penalties; compels theproduction of documents located both inside and outside the United States, including those of non-U.S. institutions that havea correspondent relationship in the United States; and clarifies the safe harbor from civil liability to clients. The U.S.Treasury has issued a number of regulations that further clarify the Patriot Act’s requirements or provide more specificguidance on their application. The Patriot Act requires all “financial institutions,” as defined, to establish certain anti-moneylaundering compliance and due diligence programs. The Patriot Act requires financial institutions that maintaincorrespondent accounts for non-U.S. institutions, or persons that are involved in private banking for “non-United Statespersons” or their representatives, to establish, “appropriate, specific and, where necessary, enhanced due diligence policies,procedures, and controls that are reasonably designed to detect and report instances of money laundering through thoseaccounts.” Bank regulators are focusing their examinations on anti-money laundering compliance, and the Companycontinues to enhance its anti-money laundering compliance programs.
Federal banking regulators, as required under the GLB Act, have adopted rules limiting the ability of banks and otherfinancial institutions to disclose nonpublic information about consumers to nonaffiliated third parties. The rules requiredisclosure of privacy policies to consumers and, in some circumstances, allow consumers to prevent disclosure of certainpersonal information to nonaffiliated third parties. The privacy provisions of the GLB Act affect how consumer informationis transmitted through diversified financial services companies and conveyed to outside vendors.
In 2009, the Federal Reserve adopted amendments to its Regulation E that will restrict our ability to charge our clientsoverdraft fees beginning in July of 2010. Pursuant to the adopted regulation, clients must opt-in to an overdraft service in
4

order for the banking subsidiary to collect overdraft fees. Overdraft fees have in the past represented a significant amount ofnoninterest fees collected by the Company’s banking subsidiary. In addition, additional legislation is currently being debatedin Congress that would further restrict the Company’s banking subsidiary from collecting overdraft fees or limit the amountof overdraft fees that that may be collected by the Company’s banking subsidiary.
The Company is subject to the rules and regulations promulgated under the EESA by virtue of the Company’s sale ofpreferred stock to the U.S. Treasury under the U.S. Treasury’s CPP. Additional information relating to the restrictions ondividends and redemptions is included in the information set forth in Item 7 of this report under the caption, “LiquidityRisk.” Furthermore, under rules and regulations of EESA to which the Company is subject, no dividends may be declared orpaid on the Company’s common stock and the Company may not repurchase or redeem any common stock unless dividendsdue with respect to Senior Preferred Shares have been paid in full. Moreover, the consent of the U.S. Treasury will berequired for any increase in the per share dividends on the Company’s common stock, beyond the per share dividenddeclared prior to October 14, 2008 ($0.77 per share per quarter) until the third anniversary of the date of U.S. Treasury’sinvestment; unless prior to the third anniversary, the Senior Preferred Shares are redeemed in whole or the U.S. Treasury hastransferred all of its shares to third parties. Under this provision, the Company could reduce its dividend and subsequentlyrestore it to no more than $0.77 per share per quarter at any time. Additionally, if the Company pays a dividend in excess of$0.54 per share per quarter before the tenth anniversary then the anti-dilution provisions of the U.S. Treasury’s warrants willreduce its exercise price and increase the number of shares issuable upon exercise of the warrant.
Because of the Company’s participation in the CPP, the U.S. Treasury is permitted to determine whether the publicdisclosure required for the Company with respect to the Company’s off-balance sheet transactions, derivative instruments,contingent liabilities and similar sources of exposure are adequate to provide the public sufficient information as to the truefinancial position of the Company. If the U.S. Treasury were to determine that such disclosure is not adequate for suchpurpose, the U.S. Treasury will make additional recommendations for additional disclosure requirements to the FederalReserve, the Company’s primary federal regulator.
Because of the Company’s participation in the CPP, the Company is subject to certain restrictions on its executivecompensation practices, which are discussed in Item 11 of this report.
On October 22, 2009, the Federal Reserve published guidance for structuring incentive compensation arrangements atfinancial organizations. All financial institutions, not just companies that participated in the CPP, and even financialinstitutions which have repaid their CPP investments, would be subject to this guidance. The guidance does not set forth anyformulas or pay caps, but contains certain principles which companies would be required to follow with respect to,employees and groups of employees that may expose the organization to material amounts of risk. The three primaryprinciples are (i) balanced risk-taking incentives, (ii) compatibility with effective controls and risk management, and(iii) strong corporate governance. The Federal Reserve is conducting a special review of incentive compensation practices atlarge, complex banking organizations and is working with such organizations to review, analyze and provide input into theirincentive compensation arrangements.
On January 14, 2010, the Obama administration announced a proposal to impose a Financial Crisis Responsibility Fee onthose financial institutions that benefited extraordinarily from recent actions taken by the U.S. government to stabilize thefinancial system. If implemented, the Financial Crisis Responsibility Fee will only be applied to firms with over $50 billionin consolidated assets, and, therefore, by its terms would apply to the Company. Such Financial Crisis Responsibility Feewould be collected by the Internal Revenue Service and would be approximately fifteen basis points, or 0.15%, of an amountcalculated by subtracting a covered institution’s Tier 1 capital and FDIC-assessed deposits (and/or an adjustment forinsurance liabilities covered by state guarantee funds) from such institution’s total assets.
The Financial Crisis Responsibility Fee, if implemented as proposed by the Obama administration, would go into effect onJune 30, 2010 and remain in place for at least ten years. The U.S. Treasury would be asked to report after five years on theeffectiveness of the Financial Crisis Responsibility Fee as well as its progress in repaying projected losses to the U.S.government as a result of TARP. If losses to the U.S. government as a result of TARP have not been recouped after ten years,the Financial Crisis Responsibility Fee would remain in place until such losses have been recovered.
The Company’s non-banking subsidiaries are regulated and supervised by various other regulatory bodies. For example,STRH is a broker-dealer registered with the SEC and the FINRA. STIS is also a broker-dealer and investment adviserregistered with the SEC and a member of the FINRA. RidgeWorth and several of RidgeWorth’s subsidiaries are investmentadvisers registered with the SEC.
In addition, there have been a number of legislative and regulatory proposals that would have an impact on the operation ofbank/financial holding companies and their bank and non-bank subsidiaries. It is impossible to predict whether or in whatform these proposals may be adopted in the future and, if adopted, what their effect will be on us.
5

The House of Representatives has recently passed the Wall Street Reform and Consumer Protection Act (H.R. 4173). Thislegislation, if it becomes effective, would, among other things (i) create the Consumer Financial Protection Agency toregulate consumer financial products and services, (ii) create a Financial Stability Council that would identify and imposeadditional regulatory oversight on large financial firms, (iii) create a new process for the bankruptcy and liquidation of largefinancial institutions and finance such dissolutions with a Systemic Dissolution Fund that would be funded with assessmentson large institutions, (iv) require a shareholder “say on pay” vote on executive compensation and require financial firms todisclose certain information regarding incentive-based compensation for employees, (v) strengthen the SEC’s powers toregulate securities markets, (vi) regulate the over-the-counter derivatives marketplace, and (vii) adopt certain mortgagereforms and anti-predatory lending restrictions. The Senate is currently considering a similar bill, the Homeowner Protectionand Wall Street Accountability Act (S-3). If such legislation would be signed into law, the Company may be subject to someor all of the new restrictions and requirements. This new law may also require the Company to change or adapt some of itscurrent policies and procedures.
Competition
SunTrust operates in a highly competitive industry that could become even more competitive as a result of legislative,regulatory, economic, and technological changes, as well as continued consolidation. The Company also faces aggressivecompetition from other domestic and foreign lending institutions and from numerous other providers of financial services.The ability of non-banking financial institutions to provide services previously limited to commercial banks has intensifiedcompetition. Because non-banking financial institutions are not subject to many of the same regulatory restrictions as banksand bank holding companies, they can often operate with greater flexibility and lower cost structures. Although non-bankingfinancial institutions may not have the same access to government programs, those non-banking financial institutions mayelect to become financial holding companies and gain such access. Securities firms and insurance companies that elect tobecome financial holding companies may acquire banks and other financial institutions. This may significantly change thecompetitive environment in which the Company conducts business. Some of the Company’s competitors have greaterfinancial resources or face fewer regulatory constraints. As a result of these various sources of competition, the Companycould lose business to competitors or be forced to price products and services on less advantageous terms to retain or attractclients, either of which would adversely affect the Company’s profitability.
In the past two years, as a result of recent economic events, there has been an increase in the number of failures andacquisitions of commercial and investment banks, including large commercial and investment banks. This has allowedcertain larger financial institutions to acquire a presence in our footprint. Additionally, certain large financial institutions thatwere formerly engaged primarily in investment banking activities have amended their charters to become regulatedcommercial banks, thereby increasing the direct competitors to the Company. Consequently, merger activity has increasedwithin the banking industry.
The Company’s ability to expand into additional states remains subject to various federal and state laws. See “GovernmentSupervision and Regulation” for a more detailed discussion of interstate banking and branching legislation and certain statelegislation.
Employees
As of December 31, 2009, there were 28,001 full-time equivalent employees within SunTrust. None of the domesticemployees within the Company are subject to a collective bargaining agreement. Management considers its employeerelations to be good.
Additional Information
See also the following additional information which is incorporated herein by reference: Business Segments (under the captions“Business Segments” in Item 7, the MD&A, and “Business Segment Reporting” in Note 22 to the Consolidated FinancialStatements in Item 8, Financial Statements and Supplementary Data); Net Interest Income (under the captions “Net InterestIncome/Margin” in the MD&A and “Selected Financial Data” in Item 6); Securities (under the caption “Securities Available forSale” in the MD&A and Note 5 to the Consolidated Financial Statements); Loans and Leases (under the captions “Loans”,“Allowance for Credit Losses”, “Provision for Credit Losses”, and “Nonperforming Assets” in the MD&A and “Loans” and“Allowance for Credit Losses” in Notes 6 and 7, respectively, to the Consolidated Financial Statements); Deposits (under thecaption “Deposits” in the MD&A); Short-Term Borrowings (under the captions “Liquidity Risk” and “Other Short-TermBorrowings and Long-Term Debt” in the MD&A and “Other Short-Term Borrowings and Contractual Commitments” in Note10 to the Consolidated Financial Statements); Trading Activities and Trading Assets and Liabilities (under the caption “TradingAssets and Liabilities” in the MD&A and “Trading Assets and Liabilities” and “Fair Value Election and Measurement” in Notes4 and 20, respectively, to the Consolidated Financial Statements); Market Risk Management (under the caption “Market RiskManagement” in the MD&A); Liquidity Risk Management (under the caption “Liquidity Risk” in the MD&A); and OperationalRisk Management (under the caption “Operational Risk Management” in the MD&A).
6
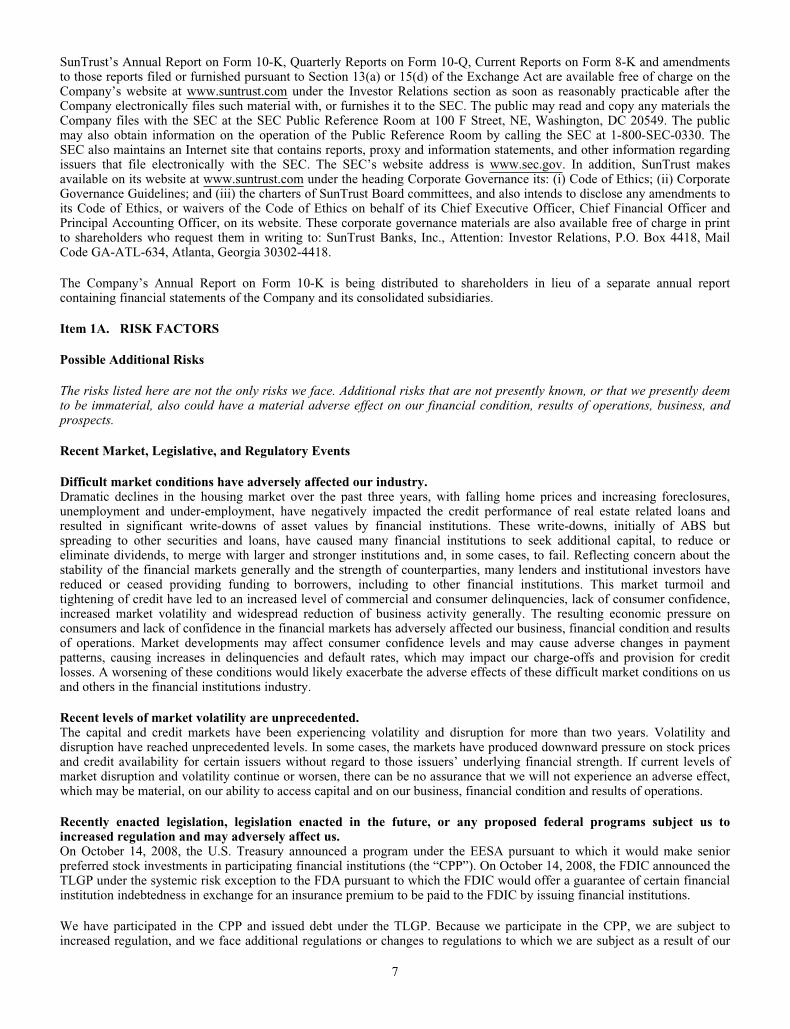
SunTrust’s Annual Report on Form 10-K, Quarterly Reports on Form 10-Q, Current Reports on Form 8-K and amendmentsto those reports filed or furnished pursuant to Section 13(a) or 15(d) of the Exchange Act are available free of charge on theCompany’s website at www.suntrust.com under the Investor Relations section as soon as reasonably practicable after theCompany electronically files such material with, or furnishes it to the SEC. The public may read and copy any materials theCompany files with the SEC at the SEC Public Reference Room at 100 F Street, NE, Washington, DC 20549. The publicmay also obtain information on the operation of the Public Reference Room by calling the SEC at 1-800-SEC-0330. TheSEC also maintains an Internet site that contains reports, proxy and information statements, and other information regardingissuers that file electronically with the SEC. The SEC’s website address is www.sec.gov. In addition, SunTrust makesavailable on its website at www.suntrust.com under the heading Corporate Governance its: (i) Code of Ethics; (ii) CorporateGovernance Guidelines; and (iii) the charters of SunTrust Board committees, and also intends to disclose any amendments toits Code of Ethics, or waivers of the Code of Ethics on behalf of its Chief Executive Officer, Chief Financial Officer andPrincipal Accounting Officer, on its website. These corporate governance materials are also available free of charge in printto shareholders who request them in writing to: SunTrust Banks, Inc., Attention: Investor Relations, P.O. Box 4418, MailCode GA-ATL-634, Atlanta, Georgia 30302-4418.
The Company’s Annual Report on Form 10-K is being distributed to shareholders in lieu of a separate annual reportcontaining financial statements of the Company and its consolidated subsidiaries.
Item 1A. RISK FACTORS
Possible Additional Risks
The risks listed here are not the only risks we face. Additional risks that are not presently known, or that we presently deemto be immaterial, also could have a material adverse effect on our financial condition, results of operations, business, andprospects.
Recent Market, Legislative, and Regulatory Events
Difficult market conditions have adversely affected our industry.Dramatic declines in the housing market over the past three years, with falling home prices and increasing foreclosures,unemployment and under-employment, have negatively impacted the credit performance of real estate related loans andresulted in significant write-downs of asset values by financial institutions. These write-downs, initially of ABS butspreading to other securities and loans, have caused many financial institutions to seek additional capital, to reduce oreliminate dividends, to merge with larger and stronger institutions and, in some cases, to fail. Reflecting concern about thestability of the financial markets generally and the strength of counterparties, many lenders and institutional investors havereduced or ceased providing funding to borrowers, including to other financial institutions. This market turmoil andtightening of credit have led to an increased level of commercial and consumer delinquencies, lack of consumer confidence,increased market volatility and widespread reduction of business activity generally. The resulting economic pressure onconsumers and lack of confidence in the financial markets has adversely affected our business, financial condition and resultsof operations. Market developments may affect consumer confidence levels and may cause adverse changes in paymentpatterns, causing increases in delinquencies and default rates, which may impact our charge-offs and provision for creditlosses. A worsening of these conditions would likely exacerbate the adverse effects of these difficult market conditions on usand others in the financial institutions industry.
Recent levels of market volatility are unprecedented.The capital and credit markets have been experiencing volatility and disruption for more than two years. Volatility anddisruption have reached unprecedented levels. In some cases, the markets have produced downward pressure on stock pricesand credit availability for certain issuers without regard to those issuers’ underlying financial strength. If current levels ofmarket disruption and volatility continue or worsen, there can be no assurance that we will not experience an adverse effect,which may be material, on our ability to access capital and on our business, financial condition and results of operations.
Recently enacted legislation, legislation enacted in the future, or any proposed federal programs subject us toincreased regulation and may adversely affect us.On October 14, 2008, the U.S. Treasury announced a program under the EESA pursuant to which it would make seniorpreferred stock investments in participating financial institutions (the “CPP”). On October 14, 2008, the FDIC announced theTLGP under the systemic risk exception to the FDA pursuant to which the FDIC would offer a guarantee of certain financialinstitution indebtedness in exchange for an insurance premium to be paid to the FDIC by issuing financial institutions.
We have participated in the CPP and issued debt under the TLGP. Because we participate in the CPP, we are subject toincreased regulation, and we face additional regulations or changes to regulations to which we are subject as a result of our
7

participation. Compliance with such regulation may increase our costs and limit our ability to pursue business opportunities.For example, participation in the CPP limits (without the consent of the U.S. Treasury) our ability to increase our dividend orto repurchase our common stock for so long as any securities issued under such program remain outstanding. In addition, theEESA, contains, among other things, significant restrictions on the payment of executive compensation, which may have anadverse effect on the retention or recruitment of key members of senior management. Also, the cumulative dividend payableunder the preferred stock that we issued to the U.S. Treasury pursuant to the CPP increases from 5% to 9% after 5 years.Additionally, we may not deduct interest paid on our preferred stock for income tax purposes.
Similarly, any program established by the FDIC under the systemic risk exception of the FDA may adversely affect uswhether we participate or not. Our participation in the TLGP requires we pay additional insurance premiums to the FDIC.Additionally, the FDIC has increased premiums on insured accounts because market developments, including the increase offailures in the banking industry, have significantly depleted the insurance fund of the FDIC and reduced the ratio of reservesto insured deposits.
Recently, the Federal Reserve adopted amendments to its Regulation E. These amendments will first apply to us on July 1,2010. The changes will affect the circumstances when we will be able to charge our clients overdraft fees.
On December 11, 2009, the U.S. House of Representatives passed a bill entitled the Wall Street Reform and ConsumerProtection Act (H.R. 4173). The Senate is considering a similar bill entitled the Homeowner Protection and Wall StreetAccountability Act (S-3). The legislation contained several changes to the regulatory system could adversely affect ourbusiness and the economies of the markets in which we operate. For example, the bill sets forth the establishment of aconsumer protection agency which would exercise authority under existing consumer laws, have broad rule writing powers toadminister and carry out its purpose and objectives, have the power to exempt certain persons or consumer financial productsfrom its purview, have the power to examine or require reports from certain persons to ensure compliance with such agency’smandates and have primary enforcement action over its mandates. The application of the powers of any consumer protectionagency is unclear; however, it has been advocated by its proponents that such an agency would standardize consumerfinancial products and permit un-standardized products to be offered under very limited circumstances, among other things.Such a limitation on the financial products we may offer may impact our ability to meet all of our clients’ needs and lead toclients seeking financial solutions and products through nonbanking channels outside the scope of this agency. Additionally,the bill strengthens mortgage regulations, seeks to regulate derivatives markets and give regulators greater power over howbank executives are compensated. Consequently, the increased expense of complying with an additional regulatory agencyand regulations may adversely affect profits.
We are not able to predict when or whether regulatory or legislative reforms will be enacted or what its contents will be.Accordingly, we cannot predict the impact of any legislation on our businesses or operations.
We are subject to capital adequacy guidelines and, if we fail to meet these guidelines, our financial condition would beadversely affected.Under regulatory capital adequacy guidelines and other regulatory requirements, our company and our subsidiary banks andbroker-dealers must meet guidelines subject to qualitative judgments by regulators about components, risk weightings andother factors. From time to time, the regulators implement changes to these regulatory capital adequacy guidelines. If wefailed to meet these minimum capital guidelines and other regulatory requirements, our financial condition would bematerially and adversely affected. In light of proposed changes in the regulatory accords on international banking institutionsformulated by the Basel Committee on Banking Supervision and implemented by the Federal Reserve Board, we may berequired to satisfy additional, more stringent, capital adequacy standards. We cannot fully predict the final form of, or theeffects of, these regulations.
We have not yet received permission to repay TARP funds.In order to repay the TARP funds we received, we must first receive approval from our primary federal regulator who willthen forward our application to the U.S. Treasury. Although we believe we have sufficient liquidity to repay our TARPfunds, to date, we have not obtained the necessary governmental approval to repay such funds. Until we repay our TARPfunds, we will continue to be subject to the constraints imposed on us by the federal government in connection with suchfunds.
Emergency measures designed to stabilize the U.S. banking system are beginning to wind down.Since the middle of 2008, a number of legislation and regulatory actions have been implemented in response to the recentfinancial crisis. Some of these programs have begun to expire and the impact of the wind down of these programs on thefinancial sector and on the economic recovery is unknown. A stall in the economic recovery or a continuation or worseningof current financial market conditions could materially and adversely affect our business and results of operations.
8
Business Risks
We are subject to credit risk.When we loan money, commit to loan money or enter into a letter of credit or other contract with a counterparty, we incurcredit risk, or the risk of losses if our borrowers do not repay their loans or our counterparties fail to perform according to theterms of their contracts. A number of our products expose us to credit risk, including loans, leases and lending commitments,derivatives, trading account assets, insurance arrangements with respect to such products, and assets held for sale. As one ofthe nation’s largest lenders, the credit quality of our portfolio can have a significant impact on our earnings. We estimate andestablish reserves for credit risks and credit losses inherent in our credit exposure (including unfunded credit commitments).This process, which is critical to our financial results and condition, requires difficult, subjective and complex judgments,including forecasts of economic conditions and how these economic predictions might impair the ability of our borrowers torepay their loans. As is the case with any such assessments, there is always the chance that we will fail to identify the properfactors or that we will fail to accurately estimate the impacts of factors that we identify.
Weakness in the economy and in the real estate market, including specific weakness within our geographic footprint,has adversely affected us and may continue to adversely affect us.If the strength of the U.S. economy in general and the strength of the local economies in which we conduct operations do notimprove, or continue to decline, this could result in, among other things, a deterioration of credit quality or a reduced demandfor credit, including a resultant effect on our loan portfolio and ALLL. A significant portion of our residential mortgages andcommercial real estate loan portfolios are composed of borrowers in the Southeastern and Mid-Atlantic regions of the UnitedStates, in which certain markets have been particularly adversely affected by declines in real estate value, declines in homesale volumes, and declines in new home building. These factors could result in higher delinquencies and greater charge-offsin future periods, which would materially adversely affect our financial condition and results of operations.
Weakness in the real estate market, including the secondary residential mortgage loan markets, has adverselyaffected us and may continue to adversely affect us.Significant ongoing disruptions in the secondary market for residential mortgage loans have limited the market for andliquidity of many mortgage loans. The effects of ongoing mortgage market challenges, combined with the ongoing correctionin residential real estate market prices and reduced levels of home sales, could result in further price reductions in singlefamily home values, adversely affecting the value of collateral securing mortgage loans that we hold, mortgage loanoriginations and profits on sales of mortgage loans. Declining real estate prices have caused cyclically higher delinquenciesand losses on certain mortgage loans, particularly Alt-A mortgages and home equity lines of credit and mortgage loanssourced from brokers that are outside our branch bank network. These conditions have resulted in losses, write downs andimpairment charges in our mortgage and other lines of business. Continued declines in real estate values, home salesvolumes, financial stress on borrowers as a result of job losses, interest rate resets on ARMs or other factors could havefurther adverse effects on borrowers that could result in higher delinquencies and greater charge-offs in future periods, whichadversely affect our financial condition or results of operations. Additionally, counterparties to insurance arrangements usedto mitigate risk associated with increased foreclosures in the real estate market are stressed by weaknesses in the real estatemarket and a commensurate increase in the number of claims. Additionally, decreases in real estate values might adverselyaffect the creditworthiness of state and local governments, and this might result in decreased profitability or credit lossesfrom loans made to such governments. A decline in home values or overall economic weakness could also have an adverseimpact upon the value of real estate or other assets which we own upon foreclosing a loan and our ability to realize value onsuch assets.
As a financial services company, adverse changes in general business or economic conditions could have a materialadverse effect on our financial condition and results of operations.The continuing weakness or further weakening in business and economic conditions generally or specifically in the principalmarkets in which we do business could have one or more of the following adverse impacts on our business:
• A decrease in the demand for loans and other products and services offered by us;• A decrease in the value of our LHFS or other assets;• A loss of clients and/or reduced earnings could trigger an impairment of certain intangible assets, such as goodwill;• An increase in the number of clients and counterparties who become delinquent, file for protection under
bankruptcy laws or default on their loans or other obligations to us. An increase in the number of delinquencies,bankruptcies or defaults could result in a higher level of nonperforming assets, net charge-offs, provision for creditlosses, and valuation adjustments on LHFS.
Changes in market interest rates or capital markets could adversely affect our revenue and expense, the value ofassets and obligations, and the availability and cost of capital or liquidity.Given our business mix, and the fact that most of the assets and liabilities are financial in nature, we tend to be sensitive tomarket interest rate movements and the performance of the financial markets. In addition to the impact of the general
9
economy, changes in interest rates or in valuations in the debt or equity markets could directly impact us in one or more ofthe following ways:
• The yield on earning assets and rates paid on interest-bearing liabilities may change in disproportionate ways;• The value of certain balance sheet and off-balance sheet financial instruments or the value of equity investments
that we hold could decline;• The value of assets for which we provide processing services would decline; or• To the extent we access capital markets to raise funds to support our business, such changes could affect the cost of
such funds or the ability to raise such funds.
The fiscal and monetary policies of the federal government and its agencies could have a material adverse effect onour earnings.The Board of Governors of the Federal Reserve System regulates the supply of money and credit in the United States. Itspolicies determine in large part the cost of funds for lending and investing and the return earned on those loans andinvestments, both of which affect the net interest margin. They can also materially decrease the value of financial assets wehold, such as debt securities and MSRs. Its policies can also adversely affect borrowers, potentially increasing the risk thatthey may fail to repay their loans. Changes in Federal Reserve Board policies are beyond our control and difficult to predict;consequently, the impact of these changes on our activities and results of operations is difficult to predict.
We may be required to repurchase mortgage loans or indemnify mortgage loan purchasers as a result of breaches ofrepresentations and warranties, borrower fraud, or certain borrower defaults, which could harm our liquidity, resultsof operations, and financial condition.When we sell mortgage loans, whether as whole loans or pursuant to a securitization, we are required to make customaryrepresentations and warranties to the purchaser about the mortgage loans and the manner in which they were originated. Ourwhole loan sale agreements require us to repurchase or substitute mortgage loans in the event we breach any of theserepresentations or warranties. In addition, we may be required to repurchase mortgage loans as a result of borrower fraud orin the event of early payment default of the borrower on a mortgage loan. Likewise, we are required to repurchase orsubstitute mortgage loans if we breach a representation or warranty in connection with our securitizations. The remediesavailable to us against the originating broker or correspondent may not be as broad as the remedies available to a purchaserof mortgage loans against us, and we face the further risk that the originating broker or correspondent may not have thefinancial capacity to perform remedies that otherwise may be available to us. Therefore, if a purchaser enforces its remediesagainst us, we may not be able to recover our losses from the originating broker or correspondent. We have received anincreased number of repurchase and indemnity demands from purchasers as a result of borrower fraud. This increase inrepurchase demands, combined with an increase in expected loss severity on repurchased loans due to deteriorated real estatevalues and liquidity for impaired loans, has resulted in an increase in the amount of accrued losses for repurchases as ofDecember 31, 2009. While we have taken steps to enhance our underwriting policies and procedures, there can be noassurance that these steps will be effective or reduce risk associated with loans sold in the past. If repurchase and indemnitydemands increase, our liquidity, results of operations and financial condition will be adversely affected.
We may continue to suffer increased losses in our loan portfolio despite enhancement of our underwriting policies.We seek to mitigate risks inherent in our loan portfolio by adhering to specific underwriting practices. These practices ofteninclude the analysis of a borrower’s credit history, financial statements, tax returns and cash flow projections; valuation ofcollateral based on reports of independent appraisers; and verification of liquid assets. Although we have taken steps toenhance our underwriting policies and procedures, we have still incurred high levels of losses on loans that have met thesecriteria, and may continue to experience higher than expected losses depending on economic factors and borrower behavior.
Depressed market values for our stock may require us to write down goodwill.Numerous facts and circumstances are considered when evaluating the carrying value of our goodwill. One of thoseconsiderations is the estimated fair value of each reporting unit. The estimated fair values of the individual reporting units areassessed for reasonableness several ways, including by aggregating the individual reporting unit’s fair value and analyzingthe combined fair value in relation to the total estimated fair value of SunTrust. We analyze the combined fair value ofSunTrust by reviewing a variety of indicators, including our market capitalization evaluated over a reasonable period of time.While this comparison provides some relative market information regarding the estimated fair value of the reporting units, itis not determinative and needs to be evaluated in the context of the current economic and political environment. However,significant and/or sustained declines in our market capitalization, especially in relation to our book value, could be anindication of potential impairment of goodwill.
Clients could pursue alternatives to bank deposits, causing us to lose a relatively inexpensive source of funding.Checking and savings account balances and other forms of client deposits could decrease if clients perceive alternativeinvestments, such as the stock market, as providing superior expected returns. When clients move money out of bankdeposits in favor of alternative investments, we can lose a relatively inexpensive source of funds, increasing our fundingcosts.
10

Consumers may decide not to use banks to complete their financial transactions, which could affect net income.Technology and other changes now allow parties to complete financial transactions without banks. For example, consumerscan pay bills and transfer funds directly without banks. This process could result in the loss of fee income, as well as the lossof client deposits and the income generated from those deposits.
We have businesses other than banking which subject us to a variety of risks.We are a diversified financial services company. This diversity subjects earnings to a broader variety of risks anduncertainties.
Hurricanes and other natural disasters may adversely affect loan portfolios and operations and increase the cost ofdoing business.Large scale natural disasters may significantly affect loan portfolios by damaging properties pledged as collateral and byimpairing the ability of certain borrowers to repay their loans. The nature and level of natural disasters cannot be predictedand may be exacerbated by global climate change. The ultimate impact of a natural disaster on future financial results isdifficult to predict and will be affected by a number of factors, including the extent of damage to the collateral, the extent towhich damaged collateral is not covered by insurance, the extent to which unemployment and other economic conditionscaused by the natural disaster adversely affect the ability of borrowers to repay their loans, and the cost of collection andforeclosure moratoriums, loan forbearances and other accommodations granted to borrowers and other clients.
Negative public opinion could damage our reputation and adversely impact business and revenues.As a financial institution, our earnings and capital are subject to risks associated with negative public opinion. Negativepublic opinion could result from our actual or alleged conduct in any number of activities, including lending practices, thefailure of any product or service sold by us to meet our clients’ expectations or applicable regulatory requirements, corporategovernance and acquisitions, or from actions taken by government regulators and community organizations in response tothose activities. Negative public opinion can adversely affect our ability to keep and attract and/or retain clients andpersonnel and can expose us to litigation and regulatory action. Actual or alleged conduct by one of our businesses can resultin negative public opinion about our other businesses. Negative public opinion could also affect our credit ratings, which areimportant to accessing unsecured wholesale borrowings. Significant changes in these ratings could change the cost andavailability of these sources of funding.
We rely on other companies to provide key components of our business infrastructure.Third parties provide key components of our business infrastructure such as banking services, processing, and internetconnections and network access. Any disruption in such services provided by these third parties or any failure of these thirdparties to handle current or higher volumes of use could adversely affect our ability to deliver products and services to clientsand otherwise to conduct business. Technological or financial difficulties of a third party service provider could adverselyaffect our business to the extent those difficulties result in the interruption or discontinuation of services provided by thatparty. We may not be insured against all types of losses as a result of third party failures and our insurance coverage may beinadequate to cover all losses resulting from system failures or other disruptions. Failures in our business infrastructure couldinterrupt the operations or increase the costs of doing business.
The soundness of other financial institutions could adversely affect us.Our ability to engage in routine funding transactions could be adversely affected by the actions and commercial soundness ofother financial institutions. Financial services institutions are interrelated as a result of trading, clearing, counterparty, orother relationships. We have exposure to many different industries and counterparties, and we routinely execute transactionswith counterparties in the financial industry, including brokers and dealers, commercial banks, investment banks, mutual andhedge funds, and other institutional clients. As a result, defaults by, or even rumors or questions about, one or more financialservices institutions, or the financial services industry generally, have led to market-wide liquidity problems and could leadto losses or defaults by us or by other institutions. Many of these transactions expose us to credit risk in the event of defaultof our counterparty or client. In addition, our credit risk may be exacerbated when the collateral held by us cannot be realizedupon or is liquidated at prices not sufficient to recover the full amount of the financial instrument exposure due us. There isno assurance that any such losses would not materially and adversely affect our results of operations.
We rely on our systems, employees, and certain counterparties, and certain failures could materially adversely affectour operations.We are exposed to many types of operational risk, including the risk of fraud by employees and outsiders, clerical andrecord-keeping errors, and computer/telecommunications systems malfunctions. Our businesses are dependent on our abilityto process a large number of increasingly complex transactions. If any of our financial, accounting, or other data processingsystems fail or have other significant shortcomings, we could be materially adversely affected. We are similarly dependenton our employees. We could be materially adversely affected if one of our employees causes a significant operational break-down or failure, either as a result of human error or where an individual purposefully sabotages or fraudulently manipulatesour operations or systems. Third parties with which we do business could also be sources of operational risk to us, including
11
relating to break-downs or failures of such parties’ own systems or employees. Any of these occurrences could result in adiminished ability of us to operate one or more of our businesses, financial loss, potential liability to clients, inability tosecure insurance, reputational damage and regulatory intervention, which could materially adversely affect us.
We may also be subject to disruptions of our operating systems arising from events that are wholly or partially beyond ourcontrol, which may include, for example, computer viruses or electrical or telecommunications outages or natural disasters,or events arising from local or regional politics, including terrorist acts. Such disruptions may give rise to losses in service toclients and loss or liability to us. In addition, there is the risk that our controls and procedures as well as business continuityand data security systems prove to be inadequate. The computer systems and network systems we and others use could bevulnerable to unforeseen problems. These problems may arise in both our internally developed systems and the systems ofthird-party service providers. In addition, our computer systems and network infrastructure present security risks, and couldbe susceptible to hacking or identity theft. Any such failure could affect our operations and could materially adversely affectour results of operations by requiring us to expend significant resources to correct the defect, as well as by exposing us tolitigation or losses not covered by insurance.
We depend on the accuracy and completeness of information about clients and counterparties.In deciding whether to extend credit or enter into other transactions with clients and counterparties, we may rely oninformation furnished by or on behalf of clients and counterparties, including financial statements and other financialinformation. We also may rely on representations of clients and counterparties as to the accuracy and completeness of thatinformation and, with respect to financial statements, on reports of independent auditors.
We are subject to certain litigation, and our expenses related to this litigation may adversely affect our results.We are subject to certain litigation in the ordinary course of our business. The outcome of these cases is uncertain. However,during the current credit crisis, we have seen both the number of cases and our expenses related to those cases increase.While we do not believe that any single case will have a material adverse effect on us, the cumulative burden of these casesmay adversely affect our results.
Industry Risks
Regulation by federal and state agencies could adversely affect the business, revenue, and profit margins.We are heavily regulated by federal and state agencies. This regulation is to protect depositors, the federal DIF and thebanking system as a whole. Congress and state legislatures and federal and state regulatory agencies continually reviewbanking laws, regulations, and policies for possible changes. Changes to statutes, regulations, or regulatory policies,including interpretation or implementation of statutes, regulations, or policies, could affect us adversely, including limitingthe types of financial services and products we may offer and/or increasing the ability of nonbanks to offer competingfinancial services and products. Also, if we do not comply with laws, regulations, or policies, we could receive regulatorysanctions and damage to our reputation.
Competition in the financial services industry is intense and could result in losing business or reducing margins.We operate in a highly competitive industry that could become even more competitive as a result of legislative, regulatory andtechnological changes, and continued consolidation. We face aggressive competition from other domestic and foreign lendinginstitutions and from numerous other providers of financial services. The ability of non-banking financial institutions to provideservices previously limited to commercial banks has intensified competition. Because non-banking financial institutions are notsubject to the same regulatory restrictions as banks and bank holding companies, they can often operate with greater flexibilityand lower cost structures. Securities firms and insurance companies that elect to become financial holding companies, can offervirtually any type of financial service, including banking, securities underwriting, insurance (both agency and underwriting) andmerchant banking, and may acquire banks and other financial institutions. This may significantly change the competitiveenvironment in which we conduct business. Some of our competitors have greater financial resources and/or face fewerregulatory constraints, including those competitors that have been able to repay TARP funds. As a result of these varioussources of competition, we could lose business to competitors or be forced to price products and services on less advantageousterms to retain or attract clients, either of which would adversely affect our profitability.
Future legislation could harm our competitive position.Federal, state, and local legislatures increasingly have been considering proposals to substantially change the financialinstitution regulatory system and to expand or contract the powers of banking institutions, bank holding companies and bankregulatory agencies. Various legislative bodies have also recently been considering altering the existing frameworkgoverning creditors’ rights, including legislation that would result in or allow loan modifications of various sorts. Suchlegislation may change banking statutes and the operating environment in substantial and unpredictable ways. If enacted,such legislation could increase or decrease the cost of doing business, limit or expand permissible activities, or affect thecompetitive balance among banks, savings associations, credit unions, and other financial institutions. We cannot predictwhether new legislation will be enacted and, if enacted, the effect that it, or any regulations, would have on our activities,financial condition, or results of operations.
12
Maintaining or increasing market share depends on market acceptance and regulatory approval of new products andservices.Our success depends, in part, on the ability to adapt products and services to evolving industry standards. There is increasingpressure to provide products and services at lower prices. This can reduce net interest income and noninterest income fromfee-based products and services. In addition, the widespread adoption of new technologies could require us to makesubstantial capital expenditures to modify or adapt existing products and services or develop new products and services. Wemay not be successful in introducing new products and services in response to industry trends or development in technology,or those new products may not achieve market acceptance. As a result, we could lose business, be forced to price productsand services on less advantageous terms to retain or attract clients, or be subject to cost increases.
We may not pay dividends on your common stock.Holders of our common stock are only entitled to receive such dividends as our Board of Directors may declare out of fundslegally available for such payments. Although we have historically declared cash dividends on our common stock, we are notrequired to do so and may reduce or eliminate our common stock dividend in the future. This could adversely affect themarket price of our common stock. Also, our ability to increase our dividend or to make other distributions is restricted dueto our participation in the CPP, which limits (without the consent of the U.S. Treasury) our ability to increase our dividend orto repurchase our common stock for so long as any securities issued under such program remain outstanding.
Our ability to receive dividends from our subsidiaries accounts for most of our revenue and could affect our liquidityand ability to pay dividends.We are a separate and distinct legal entity from our subsidiaries, including SunTrust Bank. We receive substantially all of ourrevenue from dividends from our subsidiaries. These dividends are the principal source of funds to pay dividends on ourcommon stock and interest and principal on our debt. Various federal and/or state laws and regulations limit the amount ofdividends that our bank and certain of our nonbank subsidiaries may pay us. Also, our right to participate in a distribution ofassets upon a subsidiary’s liquidation or reorganization is subject to the prior claims of the subsidiary’s creditors. Limitations onour ability to receive dividends from our subsidiaries could have a material adverse effect on our liquidity and on our ability topay dividends on common stock. Additionally, if our subsidiaries’ earnings are not sufficient to make dividend payments to uswhile maintaining adequate capital levels, we may not be able to make dividend payments to our common stockholders.
Significant legal actions could subject us to substantial uninsured liabilities.We are from time to time subject to claims related to our operations. These claims and legal actions, including supervisoryactions by our regulators, could involve large monetary claims and significant defense costs. Substantial legal liability orsignificant regulatory action against us could have material adverse financial effects or cause significant reputational harm tous, which in turn could seriously harm our business prospects. We may be exposed to substantial uninsured liabilities, whichcould adversely affect our results of operations and financial condition.
Company Risks
Recently declining values of real estate, increases in unemployment, and the related effects on local economies mayincrease our credit losses, which would negatively affect our financial results.We offer a variety of secured loans, including commercial lines of credit, commercial term loans, real estate, construction,home equity, consumer and other loans. Many of our loans are secured by real estate (both residential and commercial) in ourmarket area. A major change in the real estate market, such as deterioration in the value of this collateral, or in the local ornational economy, could adversely affect our customer’s ability to pay these loans, which in turn could adversely impact us.Additionally, increases in unemployment have and may continue to adversely affect the ability of certain clients to pay loansand the financial results of commercial clients in localities with higher unemployment, which may result in loan defaults andforeclosures and which may impair the value of our collateral. Risk of loan defaults and foreclosures are unavoidable in thebanking industry, and we try to limit our exposure to this risk by monitoring our extensions of credit carefully. We cannotfully eliminate credit risk, and as a result credit losses may increase in the future.
Deteriorating credit quality, particularly in real estate loans, has adversely impacted us and may continue toadversely impact us.We have experienced a downturn in credit performance, which became significant starting in the third and fourth quarters of2007 and continued through 2009. This deterioration has resulted in an increase in our allowance for loan losses starting in 2008and continuing throughout 2009, which increases were driven primarily by residential and commercial real estate and homeequity portfolios. Additional increases in the allowance for loan losses may be necessary in the future. Deterioration in thequality of our credit portfolio can have a material adverse effect on our capital, financial condition, and results of operations.
Our allowance for loan losses may not be adequate to cover our eventual losses.Like other financial institutions, we maintain an allowance for loan losses to provide for loan defaults and nonperformance.Our allowance for loan losses is based on our historical loss experience, as well as an evaluation of the risks associated with
13

our loan portfolio, including the size and composition of the loan portfolio, current economic conditions and geographicconcentrations within the portfolio. The current stress on the United States economy and the local economies in which we dobusiness may be greater or last longer than expected, resulting in, among other things, greater than expected deterioration incredit quality of our loan portfolio, or in the value of collateral securing these loans. Our allowance for loan losses may notbe adequate to cover eventual loan losses, and future provisions for loan losses could materially and adversely affect ourfinancial condition and results of operations.
We will realize future losses if the proceeds we receive upon liquidation of nonperforming assets are less than thecarrying value of such assets.Nonperforming assets are recorded on our financial statements at the estimated net realizable value that we expect to receivefrom holding and ultimately dispensing of the assets. Deteriorating market conditions could result in a realization of futurelosses if the proceeds we receive upon dispositions of nonperforming assets are less than the carrying value of such assets.
Disruptions in our ability to access global capital markets may negatively affect our capital resources and liquidity.In managing our consolidated balance sheet, we depend on access to global capital markets to provide us with sufficientcapital resources and liquidity to meet our commitments and business needs, and to accommodate the transaction and cashmanagement needs of our clients. Other sources of funding available to us, and upon which we rely as regular components ofour liquidity risk management strategy, include inter-bank borrowings, repurchase agreements, and borrowings from theFederal Reserve discount window. Any occurrence that may limit our access to the capital markets, such as a decline in theconfidence of debt purchasers, our depositors or counterparties participating in the capital markets, or a downgrade of ourdebt rating, may adversely affect our capital costs and our ability to raise capital and, in turn, our liquidity.
In 2009 and 2010, credit rating agencies downgraded the credit ratings of SunTrust Bank and SunTrust Banks, Inc.These downgrades and any subsequent downgrades could adversely impact the price and liquidity of our securitiesand could have an impact on our businesses and results of operations.Our credit ratings are an important factor in determining both the available volume and the cost of our wholesale funding. OnMarch 5, 2009, Fitch lowered the credit ratings for SunTrust Banks, Inc. and SunTrust Bank from A+/F-1 to A-/F-1. OnApril 23, 2009, Moody’s downgraded the senior credit ratings for SunTrust Banks, Inc. and SunTrust Bank from A1/P-1 andAa3/P-1, respectively, to Baa1/P-2 and A2/P-1, respectively. On April 28, 2009, S&P downgraded the credit ratings forSunTrust Banks, Inc. and SunTrust Bank from A/A-1 and A+/A-1, respectively to BBB+/A-2 and A-/A-2, respectively. OnFebruary 1, 2010, S&P downgraded SunTrust Banks, Inc’s. credit ratings to BBB/A-2 and SunTrust Bank’s credit ratings toBBB+/A-2. Our credit ratings remain on “Negative” outlook with Moody’s and Fitch, while S&P maintains a “Stable”outlook on our ratings. Additional downgrades are possible. Where our bank subsidiaries are providing forms of creditsupport such as letters of credit, standby lending arrangements or other forms of credit support, a decline in short-term creditratings may prompt customers of our bank subsidiaries to seek replacement credit support from a higher rated institution. InApril 2009, we experienced a downgrade which affected a part of our business which we discuss in the “Management’sDiscussion and Analysis – Liquidity Risk” section below. We cannot predict whether existing customer relationships oropportunities for future relationships could be further affected by customers who choose to do business with a higher ratedinstitution.
We have in the past and may in the future pursue acquisitions, which could affect costs and from which we may notbe able to realize anticipated benefits.We have historically pursued an acquisition strategy, and intend to continue to seek additional acquisition opportunities. Wemay not be able to successfully identify suitable candidates, negotiate appropriate acquisition terms, complete proposedacquisitions, successfully integrate acquired businesses into the existing operations, or expand into new markets. Onceintegrated, acquired operations may not achieve levels of revenues, profitability, or productivity comparable with thoseachieved by our existing operations, or otherwise perform as expected.
Acquisitions involve numerous risks, including difficulties in the integration of the operations, technologies, services andproducts of the acquired companies, and the diversion of management’s attention from other business concerns. We may notproperly ascertain all such risks prior to an acquisition or prior to such a risk impacting us while integrating an acquiredcompany. As a result, difficulties encountered with acquisitions could have a material adverse effect on the business,financial condition, and results of operations.
Furthermore, we must generally receive federal regulatory approval before we can acquire a bank or bank holding company.In determining whether to approve a proposed bank acquisition, federal bank regulators will consider, among other factors,the effect of the acquisition on competition, financial condition, future prospects, including current and projected capitallevels, the competence, experience, and integrity of management, compliance with laws and regulations, the convenience andneeds of the communities to be served, including the acquiring institution’s record of compliance under the CRA, and theeffectiveness of the acquiring institution in combating money laundering activities. In addition, we cannot be certain when orif, or on what terms and conditions, any required regulatory approvals will be granted. Consequently, we might be required to
14

sell portions of the acquired institution as a condition to receiving regulatory approval or we may not obtain regulatoryapproval for a proposed acquisition on acceptable terms or at all, in which case we would not be able to complete theacquisition despite the time and expenses invested in pursuing it.
We depend on the expertise of key personnel. If these individuals leave or change their roles without effectivereplacements, operations may suffer.The success of our business has been, and the continuing success will be, dependent to a large degree on the continuedservices of executive officers, especially our Chairman and Chief Executive Officer, James M. Wells III, and other keypersonnel who have extensive experience in the industry. We do not carry key person life insurance on any of the executiveofficers or other key personnel. If we lose the services of any of these integral personnel and fail to manage a smoothtransition to new personnel, the business could be impacted.
We may not be able to hire or retain additional qualified personnel and recruiting and compensation costs mayincrease as a result of turnover, both of which may increase costs and reduce profitability and may adversely impactour ability to implement our business strategy.Our success depends upon the ability to attract and retain highly motivated, well-qualified personnel. We face significantcompetition in the recruitment of qualified employees. Pursuant to recently enacted legislation, the U.S. Treasury hasinstituted certain restrictions on the compensation of certain senior management positions. It is possible that the U.S.Treasury may, as it is permitted to do, impose further requirements on us that may inhibit our ability to hire and retain themost qualified senior personnel. In addition, if we are unable to repay our TARP funds, we will continue to be subject tosignificant restrictions on the payment of executive compensation and may be at a disadvantage to our competitors who haverepaid TARP funds in our ability to recruit and retain the most qualified senior personnel. Our ability to execute the businessstrategy and provide high quality service may suffer if we are unable to recruit or retain a sufficient number of qualifiedemployees or if the costs of employee compensation or benefits increase substantially.
Further, the Federal Reserve on October 27, 2009 published proposed guidance on sound incentive compensation policies.Through this guidance, the Federal Reserve will regulate incentive compensation at financial institutions through its power toregulate the safety and soundness of the banking system. Such regulation will apply to us even after we repay TARP.Additionally, on January 12, 2010, the Board of Directors of the FDIC published an ANPR on Employee Compensation. TheANPR seeks comment on how, and whether, the FDIC’s risk-based deposit insurance assessment system applicable to allinsured banks should be amended to account for risks imposed by employee compensation programs. Citing a “broadconsensus that some compensation structures misalign incentives and induce imprudent risk taking within financialorganizations”, the FDIC is considering establishing criteria to determine whether a financial institution’s employeecompensation programs provide incentives for employees to take excessive risks. The FDIC is concerned that such risk-taking increases the institution’s risk of failure and thereby could lead to increased losses to the DIF. The ANPR proposalcould apply not only to compensation at the insured depository, but also at its parent and nonbank affiliates. Under theapproach outlined in the ANPR, whether a financial institution’s compensation program either “meets” or “does not meet”the criteria would be used to adjust the institution’s risk-based assessment rate, thereby acting as an incentive for institutionsthat meet the criteria and a disincentive for those that do not. According to the ANPR, the criteria that the FDIC isconsidering are not aimed at limiting the amount that insured depository institutions can pay their employees, but rather areintended to compensate the DIF for risks associated with certain compensation programs.
At this time, we cannot predict the impact of the Federal Reserve’s proposed guidance or the FDIC’s ANPR.
Our accounting policies and processes are critical to how we report our financial condition and results of operations.They require management to make estimates about matters that are uncertain.Accounting policies and processes are fundamental to how we record and report the financial condition and results ofoperations. Management must exercise judgment in selecting and applying many of these accounting policies and processesso they comply with U.S. GAAP.
Management has identified certain accounting policies as being critical because they require management’s judgment toascertain the valuations of assets, liabilities, commitments, and contingencies. A variety of factors could affect the ultimatevalue that is obtained either when earning income, recognizing an expense, recovering an asset, valuing an asset or liability,or recognizing or reducing a liability. We have established detailed policies and control procedures that are intended toensure these critical accounting estimates and judgments are well controlled and applied consistently. In addition, the policiesand procedures are intended to ensure that the process for changing methodologies occurs in an appropriate manner. Becauseof the uncertainty surrounding our judgments and the estimates pertaining to these matters, we cannot guarantee that we willnot be required to adjust accounting policies or restate prior period financial statements. See the “Critical AccountingPolicies” in the MD&A and Note 1, “Significant Accounting Policies,” to the Consolidated Financial Statements.
15

Changes in our accounting policies or in accounting standards could materially affect how we report our financialresults and condition.From time to time, the FASB and SEC change the financial accounting and reporting standards that govern the preparation ofour financial statements. These changes can be hard to predict and can materially impact how we record and report ourfinancial condition and results of operations. In some cases, we could be required to apply a new or revised standardretroactively, resulting in us restating prior period financial statements.
Our stock price can be volatile.Our stock price can fluctuate widely in response to a variety of factors including:
• variations in our quarterly operating results;• changes in market valuations of companies in the financial services industry;• governmental and regulatory legislation or actions;• issuances of shares of common stock or other securities in the future;• changes in dividends;• the addition or departure of key personnel;• cyclical fluctuations;• changes in financial estimates or recommendations by securities analysts regarding us or shares of our common stock;• announcements by us or our competitors of new services or technology, acquisitions, or joint ventures; and• activity by short sellers and changing government restrictions on such activity.
General market fluctuations, industry factors, and general economic and political conditions and events, such as terroristattacks, economic slowdowns or recessions, interest rate changes, credit loss trends, or currency fluctuations, also couldcause our stock price to decrease regardless of operating results.
Our disclosure controls and procedures may not prevent or detect all errors or acts of fraud.Our disclosure controls and procedures are designed to reasonably assure that information required to be disclosed by us inreports we file or submit under the Exchange Act is accurately accumulated and communicated to management, andrecorded, processed, summarized, and reported within the time periods specified in the SEC’s rules and forms. We believethat any disclosure controls and procedures or internal controls and procedures, no matter how well conceived and operated,can provide only reasonable, not absolute, assurance that the objectives of the control system are met.
These inherent limitations include the realities that judgments in decision-making can be faulty, that alternative reasonedjudgments can be drawn, or that breakdowns can occur because of a simple error or mistake. Additionally, controls can becircumvented by the individual acts of some persons, by collusion of two or more people or by an unauthorized override ofthe controls. Accordingly, because of the inherent limitations in our control system, misstatements due to error or fraud mayoccur and not be detected.
Our financial instruments carried at fair value expose us to certain market risks.We maintain an available for sale securities portfolio and trading assets which include various types of instruments andmaturities. In addition, we elected to record selected fixed-rate debt, mortgage loans, securitization warehouses and othertrading assets at fair value. The changes in fair value of the financial instruments elected to be carried at fair value arerecognized in earnings. The financial instruments carried at fair value are exposed to market risks related to changes ininterest rates, market liquidity, and our market-based credit spreads, as well as to the risk of default by specific borrowers.We manage the market risks associated with these instruments through active hedging arrangements or broader asset/liabilitymanagement strategies. Changes in the market values of these financial instruments could have a material adverse impact onour financial condition or results of operations. We may classify additional financial assets or financial liabilities at fair valuein the future.
Our revenues derived from our investment securities may be volatile and subject to a variety of risks.We generally maintain investment securities and trading positions in the fixed income, currency, commodity, and equitymarkets. Unrealized gains and losses associated with our investment portfolio and mark to market gains and losses associatedwith our trading portfolio are affected by many factors, including interest rate volatility, volatility in capital markets, andother economic factors. Our return on such investments and trading have in the past experienced, and will likely in the futureexperience, volatility and such volatility may materially adversely affect our financial condition and results of operations.Additionally, accounting regulations may require us to record a charge prior to the actual realization of a loss when marketvaluations of such securities are impaired and such impairment is considered to be other than temporary.
16

We may enter into transactions with off-balance sheet affiliates or our subsidiaries.We engage in a variety of transactions with off-balance sheet entities with which we are affiliated. While we have noobligation, contractual or otherwise, to do so, under certain limited circumstances, these transactions may involve providingsome form of financial support to these entities. Any such actions may cause us to recognize current or future gains or losses.Depending on the nature and magnitude of any transaction we enter into with off-balance sheet entities, accounting rules mayrequire us to consolidate the financial results of these entities with our financial results.
Item 1B. UNRESOLVED STAFF COMMENTS
None.
Item 2. PROPERTIES
The Company’s headquarters is located in Atlanta, Georgia. As of December 31, 2009, SunTrust Bank owned 598 of its1,683 full-service banking offices and leased the remaining banking offices. (See Note 8, “Premises and Equipment,” to theConsolidated Financial Statements for further discussion of its properties.)
Item 3. LEGAL PROCEEDINGS
The Company and its subsidiaries are parties to numerous claims and lawsuits arising in the normal course of its businessactivities, some of which involve claims for substantial amounts. Although the ultimate outcome of these suits cannot beascertained at this time, it is the opinion of management that none of these matters, when resolved, will have a material effecton the Company’s consolidated results of operations or financial position.
Also refer to Note 21, “Contingencies”, to the Consolidated Financial Statements.
Item 4. SUBMISSION OF MATTERS TO A VOTE OF SECURITY HOLDERS
There were no matters submitted to a vote of shareholders during the quarter ended December 31, 2009.
17
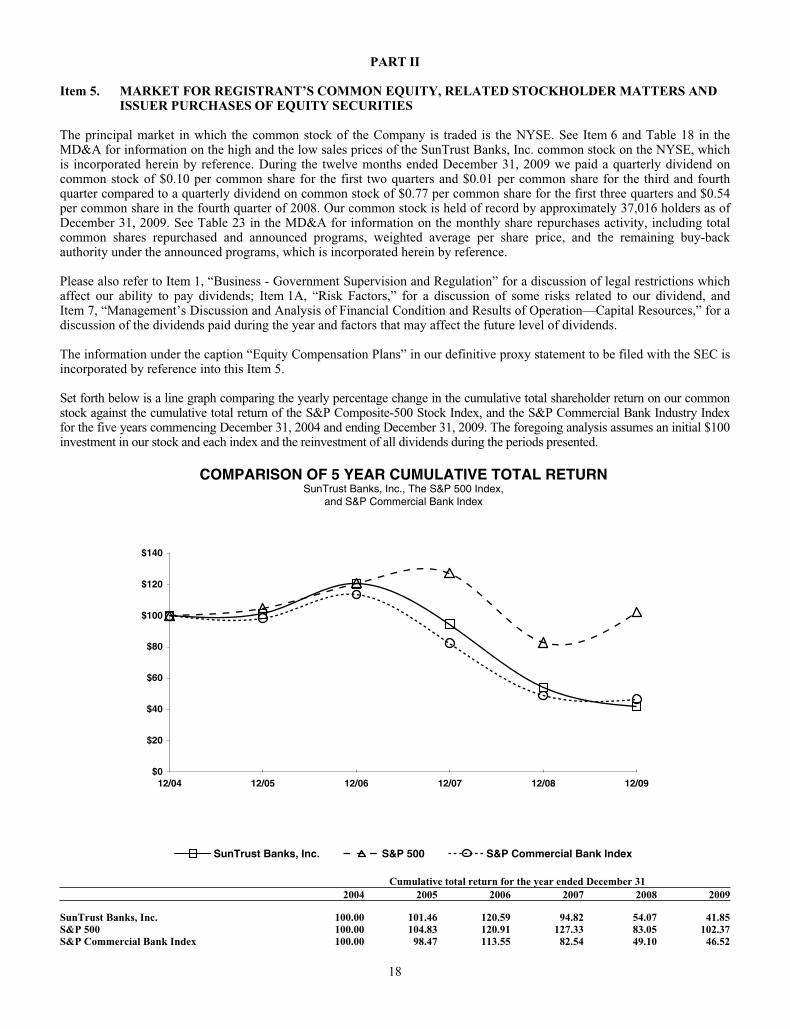
PART II
Item 5. MARKET FOR REGISTRANT’S COMMON EQUITY, RELATED STOCKHOLDER MATTERS ANDISSUER PURCHASES OF EQUITY SECURITIES
The principal market in which the common stock of the Company is traded is the NYSE. See Item 6 and Table 18 in theMD&A for information on the high and the low sales prices of the SunTrust Banks, Inc. common stock on the NYSE, whichis incorporated herein by reference. During the twelve months ended December 31, 2009 we paid a quarterly dividend oncommon stock of $0.10 per common share for the first two quarters and $0.01 per common share for the third and fourthquarter compared to a quarterly dividend on common stock of $0.77 per common share for the first three quarters and $0.54per common share in the fourth quarter of 2008. Our common stock is held of record by approximately 37,016 holders as ofDecember 31, 2009. See Table 23 in the MD&A for information on the monthly share repurchases activity, including totalcommon shares repurchased and announced programs, weighted average per share price, and the remaining buy-backauthority under the announced programs, which is incorporated herein by reference.
Please also refer to Item 1, “Business - Government Supervision and Regulation” for a discussion of legal restrictions whichaffect our ability to pay dividends; Item 1A, “Risk Factors,” for a discussion of some risks related to our dividend, andItem 7, “Management’s Discussion and Analysis of Financial Condition and Results of Operation—Capital Resources,” for adiscussion of the dividends paid during the year and factors that may affect the future level of dividends.
The information under the caption “Equity Compensation Plans” in our definitive proxy statement to be filed with the SEC isincorporated by reference into this Item 5.
Set forth below is a line graph comparing the yearly percentage change in the cumulative total shareholder return on our commonstock against the cumulative total return of the S&P Composite-500 Stock Index, and the S&P Commercial Bank Industry Indexfor the five years commencing December 31, 2004 and ending December 31, 2009. The foregoing analysis assumes an initial $100investment in our stock and each index and the reinvestment of all dividends during the periods presented.
COMPARISON OF 5 YEAR CUMULATIVE TOTAL RETURNSunTrust Banks, Inc., The S&P 500 Index,
and S&P Commercial Bank Index
SunTrust Banks, Inc. S&P 500 S&P Commercial Bank Index
12/04 12/05 12/06 12/07 12/08 12/09$0
$20
$40
$60
$80
$100
$120
$140
Cumulative total return for the year ended December 312004 2005 2006 2007 2008 2009
SunTrust Banks, Inc. 100.00 101.46 120.59 94.82 54.07 41.85S&P 500 100.00 104.83 120.91 127.33 83.05 102.37S&P Commercial Bank Index 100.00 98.47 113.55 82.54 49.10 46.52
18

Item 6. SELECTED FINANCIAL DATA
Year Ended December 31
(Dollars in millions, except per share and other data) 2009 2008 2007 2006 2005
Summary of OperationsInterest income $6,709.7 $8,327.4 $10,035.9 $9,792.0 $7,731.3Interest expense 2,244.1 3,707.7 5,316.4 5,131.6 3,152.3
Net interest income 4,465.6 4,619.7 4,719.5 4,660.4 4,579.0Provision for credit losses 3 4,063.9 2,474.2 664.9 262.5 176.9
Net interest income after provision for credit losses 401.7 2,145.5 4,054.6 4,397.9 4,402.1Noninterest income 3,710.3 4,473.5 3,428.7 3,468.4 3,155.0Noninterest expense 6,562.4 5,879.0 5,221.1 4,866.5 4,676.2
Income/(loss) before provision/(benefit) for income taxes (2,450.4) 740.0 2,262.2 2,999.8 2,880.9Net income attributable to noncontrolling interest 12.1 11.5 12.7 13.4 14.5Provision/(benefit) for income taxes (898.8) (67.3) 615.5 869.0 879.2
Net income/(loss) ($1,563.7) $795.8 $1,634.0 $2,117.4 $1,987.2
Net income/(loss) available to common shareholders ($1,733.4) $741.0 $1,593.0 $2,097.5 $1,975.5
Net interest income-FTE 1 $4,589.0 $4,737.2 $4,822.2 $4,748.4 $4,654.5Total revenue-FTE 1 8,299.3 9,210.6 8,250.9 8,216.8 7,809.5Total revenue-FTE excluding net securities gains/(losses), net1 8,201.2 8,137.3 8,007.8 8,267.3 7,816.7
Net income/(loss) per average common share 2
Diluted ($3.98) $2.12 $4.52 $5.78 $5.44Diluted excluding goodwill/intangible impairment charges, other than MSRs1 (2.34) 2.19 4.39 5.77 6.72Basic (3.98) 2.12 4.56 5.84 5.50Dividends paid per average common share 0.22 2.85 2.92 2.44 2.20Book value per common share 35.29 48.74 50.72 49.12 47.33Tangible book value per common share1 22.59 28.69 30.11 28.66 27.16
Market capitalization $10,128 $10,472 $21,772 $29,972 $26,338Market price:
High 30.18 70.00 94.18 85.64 75.77Low 6.00 19.75 60.02 69.68 65.32Close 20.29 29.54 62.49 84.45 72.76
Selected Average BalancesTotal assets $175,442.4 $175,848.3 $177,795.5 $180,315.1 $168,088.8Earning assets 150,908.4 152,748.6 155,204.4 158,428.7 146,639.8Loans 121,040.6 125,432.7 120,080.6 119,645.2 108,742.0Consumer and commercial deposits 113,164.0 101,332.8 98,020.2 97,175.3 93,355.0Brokered and foreign deposits 6,082.2 14,743.5 21,856.4 26,490.2 17,051.5Total shareholders’ equity 22,286.1 18,596.3 17,928.4 17,697.7 16,732.9
Average common shares - diluted (thousands) 435,328 350,183 352,688 362,802 363,454Average common shares - basic (thousands) 435,328 348,919 349,346 359,413 359,066
As of December 31Total assets $174,164.7 $189,138.0 $179,573.9 $182,161.6 $179,712.8Earning assets 147,896.2 156,016.5 154,397.2 159,063.8 156,640.9Loans 113,674.8 126,998.4 122,319.0 121,454.3 114,554.9Allowance for loan and lease losses 3,120.0 2,351.0 1,282.5 1,044.5 1,028.1Consumer and commercial deposits 116,303.5 105,275.7 101,870.0 99,775.9 97,572.4Brokered and foreign deposits 5,560.1 8,052.7 15,972.6 24,245.7 24,480.8Long-term debt 17,489.5 26,812.4 22,956.5 18,992.9 20,779.2Total shareholders’ equity 22,530.9 22,500.8 18,169.9 17,932.2 17,133.6
Financial Ratios and Other DataReturn on average total assets (0.89) % 0.45 % 0.92 % 1.17 % 1.18 %Return on average assets less net unrealized securities gains/(losses) 1 (0.96) 0.05 0.81 1.17 1.17Return on average common shareholders’ equity (10.07) 4.20 9.14 11.95 11.81Return on average realized common shareholders’ equity 1 (11.12) 0.16 8.52 12.53 12.45Net interest margin - FTE 3.04 3.10 3.11 3.00 3.17Efficiency ratio - FTE 79.07 63.83 63.28 59.23 59.88Tangible efficiency ratio 1 69.35 62.51 62.11 57.97 58.36Total average shareholders’ equity to average assets 12.70 10.58 10.08 9.81 9.95Tangible equity to tangible assets 1 9.66 8.46 6.38 6.10 5.70Effective tax rate (benefit) (36.50) (9.23) 27.21 28.97 30.52Allowance to year-end total loans 2.76 1.86 1.05 0.86 0.90Nonperforming assets to total loans plus OREO and other repossessed assets 5.33 3.49 1.35 0.49 0.29Common dividend payout ratio 4 N/A 135.6 64.5 41.9 40.2
Capital AdequacyTier 1 common equity 7.67 % 5.83 % 5.27 % 5.66 % 5.52 %Tier 1 capital 12.96 10.87 6.93 7.72 7.01Total capital 16.43 14.04 10.30 11.11 10.57Tier 1 leverage 10.90 10.45 6.90 7.23 6.65
1See Non-GAAP reconcilements in Tables 21 and 22 of the Management’s Discussion and Analysis of Financial Condition and Results of Operations.2Prior period amounts have been recalculated in accordance with updated accounting guidance related to earnings per share, that was effective January 1, 2009 and required retrospective application.3Beginning in the fourth quarter of 2009, SunTrust began recording the provision for unfunded commitments within the provision for credit losses in the Consolidated Statements of Income/(Loss). Theprovision for unfunded commitments for the fourth quarter of 2009 was $57.2 million. Considering the immateriality of this provision, prior to the fourth quarter of 2009, the provision for unfundedcommitments remains classified within other noninterest expense in the Consolidated Statements of Income/(Loss).4The common dividend payout ratio is not applicable in a period of net loss.
19
Item 7. MANAGEMENT’S DISCUSSION AND ANALYSIS OF FINANCIAL CONDITION AND RESULTS OFOPERATIONS
Important Cautionary Statement About Forward-Looking Statements
This report may contain forward-looking statements. Statements regarding (a) future levels of required mortgage repurchasereserves, revenue, net interest margin, charge-offs, provision expense, credit quality, FDIC and other regulatory expense,loans, LHFS, the investment portfolio, income, job losses, loan loss severities, loan loss frequency, and residential buildernonperforming loans, (b) the expected impact of the amendments to ASC 810-10 related to the consolidation of variousVIEs; (c) expected changes in the rate or level of deposit growth, loan growth, charge-offs, loan loss frequencies, andnonperforming loans; and (d) expected future asset quality and the performance of the commercial and industrial andcommercial real estate portfolios, are forward-looking statements. Also, statements that do not describe historical or currentfacts, including statements about future levels of revenues, net interest margin, FDIC and other regulatory expense, and creditquality are forward-looking statements. These statements often include the words “believes,” “expects,” “anticipates,”“estimates,” “intends,” “plans,” “targets,” “initiatives,” “potentially,” “probably,” “projects,” “outlook” or similarexpressions or future conditional verbs such as “may,” “will,” “should,” “would,” and “could.” Such statements are basedupon the current beliefs and expectations of management and on information currently available to management. Suchstatements speak as of the date hereof, and we do not assume any obligation to update the statements made herein or toupdate the reasons why actual results could differ from those contained in such statements in light of new information orfuture events.
Forward-looking statements are subject to significant risks and uncertainties. Investors are cautioned against placing unduereliance on such statements. Actual results may differ materially from those set forth in the forward-looking statements. Factorsthat could cause actual results to differ materially from those described in the forward-looking statements can be found inItem 1A of Part I of this report and include risks discussed in this MD&A and in other periodic reports that we file with theSEC. Those factors include: difficult market conditions have adversely affected our industry; recent levels of market volatilityare unprecedented; the soundness of other financial institutions could adversely affect us; recently enacted legislation orlegislation enacted in the future, or any proposed federal programs subject us to increased regulation and may adversely affectus; we have not yet received permission to repay TARP funds; emergency measures designed to stabilize the U.S. bankingsystem are beginning to wind down; we are subject to credit risk; weakness in the economy and in the real estate market,including specific weakness within our geographic footprint, has adversely affected us and may continue to adversely affect us;weakness in the real estate market, including the secondary residential mortgage loan markets, has adversely affected us andmay continue to adversely affect us; as a financial services company, adverse changes in general business or economicconditions could have a material adverse effect on our financial condition and results of operations; changes in market interestrates or capital markets could adversely affect our revenue and expense, the value of assets and obligations, and the availabilityand cost of capital or liquidity; the fiscal and monetary policies of the federal government and its agencies could have a materialadverse effect on our earnings; we may be required to repurchase mortgage loans or indemnify mortgage loan purchasers as aresult of breaches of representations and warranties, borrower fraud, or certain borrower defaults, which could harm ourliquidity, results of operations, and financial condition; we may continue to suffer increased losses in our loan portfolio despiteenhancement of our underwriting policies; depressed market values for our stock may require us to write down goodwill; clientscould pursue alternatives to bank deposits, causing us to lose a relatively inexpensive source of funding; consumers may decidenot to use banks to complete their financial transactions, which could affect net income; we have businesses other than bankingwhich subject us to a variety of risks; hurricanes and other natural disasters may adversely affect loan portfolios and operationsand increase the cost of doing business; negative public opinion could damage our reputation and adversely impact business andrevenues; we rely on other companies to provide key components of our business infrastructure; we rely on our systems,employees, and certain counterparties, and certain failures could materially adversely affect our operations; we depend on theaccuracy and completeness of information about clients and counterparties; regulation by federal and state agencies couldadversely affect the business, revenue, and profit margins; competition in the financial services industry is intense and couldresult in losing business or reducing margins; future legislation could harm our competitive position; maintaining or increasingmarket share depends on market acceptance and regulatory approval of new products and services; we may not pay dividends onyour common stock; our ability to receive dividends from our subsidiaries accounts for most of our revenue and could affect ourliquidity and ability to pay dividends; significant legal actions could subject us to substantial uninsured liabilities; recentlydeclining values of real estate, increases in unemployment, and the related effects on local economies may increase our creditlosses, which would negatively affect our financial results; deteriorating credit quality, particularly in real estate loans, hasadversely impacted us and may continue to adversely impact us; our allowance for loan losses may not be adequate to cover oureventual losses; we will realize future losses if the proceeds we receive upon liquidation of nonperforming assets are less thanthe carrying value of such assets; disruptions in our ability to access global capital markets may negatively affect our capitalresources and liquidity; credit rating agencies downgraded the credit ratings of SunTrust Bank and SunTrust Banks, Inc., andthese downgrades and any subsequent downgrades could adversely impact the price and liquidity of our securities and couldhave an impact on our businesses and results of operations; we have in the past and may in the future pursue acquisitions, whichcould affect costs and from which we may not be able to realize anticipated benefits; we depend on the expertise of key
20

personnel, and if these individuals leave or change their roles without effective replacements, operations may suffer; we may notbe able to hire or retain additional qualified personnel and recruiting and compensation costs may increase as a result ofturnover, both of which may increase costs and reduce profitability and may adversely impact our ability to implement ourbusiness strategy; our accounting policies and processes are critical to how we report our financial condition and results ofoperations, and require management to make estimates about matters that are uncertain; changes in our accounting policies or inaccounting standards could materially affect how we report our financial results and condition; our stock price can be volatile;our disclosure controls and procedures may not prevent or detect all errors or acts of fraud; our financial instruments carried atfair value expose us to certain market risks; our revenues derived from our investment securities may be volatile and subject to avariety of risks; and we may enter into transactions with off-balance sheet affiliates or our subsidiaries.
This narrative will assist readers in their analysis of the accompanying consolidated financial statements and supplementalfinancial information. It should be read in conjunction with the Consolidated Financial Statements and Notes. When we referto “SunTrust,” “the Company,” “we,” “our” and “us” in this narrative, we mean SunTrust Banks, Inc. and Subsidiaries(consolidated). Effective May 1, 2008, we acquired GB&T and the results of operations for GB&T were included with ourresults beginning on that date. Periods prior to the acquisition date do not reflect the impact of the merger.
In the MD&A, net interest income, net interest margin, and the efficiency ratio are presented on an FTE basis and thequarterly ratios are presented on an annualized basis. The FTE basis adjusts for the tax-favored status of income from certainloans and investments. We believe this measure to be the preferred industry measurement of net interest income and itenhances comparability of net interest income arising from taxable and tax-exempt sources. We also present diluted earningsper common share excluding goodwill and intangible impairment charges. We believe the exclusion of the impairmentcharges is more reflective of normalized operations and allows better comparability with peers throughout the industry.Additionally, we present a return on average realized common shareholders’ equity, as well as an ROE. We also present aROA less net realized and unrealized securities gains/losses and an ROA. The return on average realized commonshareholders’ equity and ROA less net realized and unrealized securities gains/losses exclude realized securities gains andlosses and the Coke dividend, from the numerator, and net unrealized securities gains from the denominator. We present atangible efficiency ratio and a tangible equity to tangible assets ratio, which excludes the effect of intangible assets costs. Webelieve these measures are useful to investors because, by removing the effect of intangible asset costs (the level of whichmay vary from company to company), it allows investors to more easily compare our efficiency and capital adequacy toother companies in the industry. We also present a tangible book value per common share ratio which excludes the after-taximpact of purchase accounting intangible assets. These measures are utilized by management to assess our financialperformance and capital adequacy. We provide reconcilements in Tables 21 and 22 in the MD&A for all non-U.S. GAAPmeasures. Certain reclassifications may be made to prior period financial statements and related information to conform themto the 2009 presentation.
INTRODUCTION
We are one of the nation’s largest commercial banking organizations and our headquarters are located in Atlanta, Georgia.Our principal banking subsidiary, SunTrust Bank, offers a full line of financial services for consumers and businessesthrough its branches located primarily in Florida, Georgia, Maryland, North Carolina, South Carolina, Tennessee, Virginia,and the District of Columbia. Within our geographic footprint, we operate under four business segments: Retail andCommercial, Corporate and Investment Banking, Household Lending, and Wealth and Investment Management, with theremainder in Corporate Other and Treasury. In addition to traditional deposit, credit, and trust and investment servicesoffered by SunTrust Bank, our other subsidiaries provide mortgage banking, credit-related insurance, asset management,securities brokerage, and capital market services.
EXECUTIVE OVERVIEW
While many economists have declared the recession to be over or at least abating by the end of 2009, the economicenvironment during 2009 adversely impacted our financial performance and will likely continue to impact our performanceinto 2010, particularly related to credit which tends to lag economic cycles. We recognize that the beginning of a recovery isjust that, a beginning, and history tells us that, looking over the long-term, it will take time before economic stabilizationmeaningfully translates into bottom line results for traditional banks. Asset quality, revenues and ultimately earningsimprovement will need time to gain traction and the timing will be largely dependent upon the strength and sustainability ofthe economic recovery, both of which remain uncertain at the end of 2009. Regardless of when economists determine the endof the recession, the economy remains weak, as evidenced by many key economic indicators. Notably, the nationalunemployment rate rose steadily during the year to finish at 10.0% as of December 31, which is up from a high of 7.4% atthe end of 2008. More specifically, the unemployment rate exceeds 10% within many of our markets. Furthermore, it isbelieved that the national unemployment rate will remain elevated during much of 2010. Additionally, home prices remaindepressed and continued to decline throughout the year in some of our more significant markets.
21

The Federal Reserve, the FDIC, and U.S. government undertook steps during the year to strengthen the capital of financialinstitutions, stimulate lending, and inject liquidity into the financial markets. Among the steps taken by the governmentagencies, the TLGP was extended into late 2009, billions of MBS were purchased in the open market, trillions of debtobligations were issued, and benchmark interest rates were kept at record low levels throughout the year. As 2009 came to aclose, the U.S. government and bank regulators were discussing how to reduce their involvement as a financial intermediaryin the markets due to the markets having exhibited some signs of stability. Most notably, the government is assessing whento discontinue some of its support programs including its ongoing purchases of mortgage-backed assets. This reduction insupport could cause mortgage interest rates to rise which would result in a potential reduction in mortgage originations,decrease in value of mortgage loans and securities, and an overall slowing of the housing market. Concurrently, the financialservices industry is entering a new phase in its relationship with regulatory authorities as the regulators debate newregulations and requirements that would affect our business, some in a negative way. See additional discussion of risksassociated with potential new regulations in Item 1, “Business,” under the heading “Government Supervision andRegulation” and Item 1A., “Risk Factors” in this 10-K.
During 2009, the federal bank regulatory agencies completed a review, called the SCAP, commonly referred to as the “stresstest,” of the capital needs through the end of 2010 of the nineteen largest U.S. bank holding companies. The Federal Reserveannounced the results of the SCAP on May 7, 2009. The Federal Reserve advised us that, based on the SCAP review, wepresently have and are projected to continue to have Tier 1 capital well in excess of the amount required to be wellcapitalized through the forecast period under both the baseline scenario and the more adverse-than-expected scenario (“moreadverse”) as estimated by the U.S. Treasury. The SCAP’s more adverse scenario represents a hypothetical scenario thatinvolves a recession that is longer and more severe than consensus expectations and results in higher than expected creditlosses, but is not a forecast of expected losses or revenues. The Federal Reserve advised us that based on the more adversescenario that it required us to adjust the composition of our Tier 1 capital by increasing the Tier 1 common equity portion by$2.2 billion. The common equity increase prescribed by the Federal Reserve is necessary to maintain Tier 1 common equityat 4% of risk weighted assets under the more adverse scenario, as specified by a new regulatory standard that was introducedas part of the stress test. This increase satisfied the regulatory request that we have an increased mix of common equity as apercentage of Tier 1 capital, to serve as a buffer against higher losses than generally expected, and allow us to remain wellcapitalized and able to lend to creditworthy borrowers should such losses materialize. Our 2009 actual credit losses weresignificantly less than the projections utilized in the SCAP process.
During the second quarter, in response to the SCAP, we successfully completed our capital plan and initiatives, generating$2.3 billion of capital and exceeding the target of $2.2 billion established by the Federal Reserve. The transactions utilized toraise the capital included the issuance of common stock, the repurchase of certain preferred stock and hybrid debt securities,and the sale of Visa Class B shares. These capital raising transactions increased Tier 1 common equity by $2.1 billion andwere the driving factor in the increase in our Tier 1 common equity ratio to 7.67% at December 31, 2009 compared to 5.83%at December 31, 2008. During the second quarter, we completed all required capital initiatives and believe that relative to themore adverse scenario, additional capital will be achieved through lower credit losses than projected by SCAP. As a result ofthe successful capital plan and initiatives, we have the ability and desire to repay the U.S. government for funds borrowed inthe form of preferred stock issued by us under the CPP. However, our repayment of TARP funds is predicated on approvalby our primary regulator, the Federal Reserve. See additional discussion of SCAP and the capital plan and initiatives in the“Capital Resources” section of this MD&A.
Despite the challenging economic environment, we continue to operate from a position of strength and are focused ongrowing revenue, improving expense efficiency, increasing the profitability of the balance sheet, investing for the future, andprudently managing credit. To this end, we remain acutely focused on clients, improving service quality and front-lineexecution, controlling expenses, and managing risk. During the year, revenue was soft, loan demand was down, credit costswere higher, and asset quality was weak. We are seeing sustained economic weakness that has reduced demand for loans asclients have focused on capital preservation and debt reduction, while accessing the debt markets in lieu of bank loans.However, we have also experienced positive operating trends in many of our businesses that included strong deposit growth,improved funding mix, significant expansion of net interest margin, positive fee income growth in certain areas, continuedstrong expense management, and credit trends that improved during the last half of 2009. Specifically, in the last quarter of2009, we experienced declining net charge-offs and early stage delinquencies, stabilizing nonperforming loans, and a lesserincrease in the ALLL. We believe our strong foundation coupled with our client-focused execution, risk mitigationcapabilities, and the long-term economic prospects of our markets position us to deliver improving financial performance asthe operating environment improves.
The difficult economic environment during 2009 negatively impacted our financial performance as we realized a net lossavailable to common shareholders of $1.7 billion, or $3.98 per common share. The net loss during the year was primarily aresult of goodwill impairment taken during the first quarter and increased provisioning for credit losses during the year. The firstquarter non-cash goodwill impairment charge attributable to common shareholders was $714.8 million, after-tax, or $1.64 percommon share, while the provision for credit losses increased by $993.6 million, after-tax, or $2.28 per common share.
22

While 2009 was a year of poor credit performance as most notably evidenced by our higher allowance for loan losses,provision for credit losses, net charge-offs, and nonperforming assets, asset quality trends improved in the final quarter of2009 when compared to the previous quarter as evidenced by the decline in credit losses and early stage delinquencies andstabilization of nonperforming loans. In addition, our reserve build decreased during each consecutive quarter during the yearwith the fourth quarter allowance for loan losses having increased by only 3.2% from the prior quarter. However, absoluteasset quality issues remain centered in the residential real estate-related portfolios, including residential mortgages, homeequity products, and residential construction. In addition, we experienced some weakness in our commercial client base,particularly those in more cyclically sensitive industries, and in our small business portfolio, and we expect that we willcontinue to see stress in asset quality in the commercial portfolio. The $1.7 billion increase in net charge-offs during the yearwas primarily related to residential mortgages, large corporate borrowers in economically cyclical industries, and theresolution of loan workouts related to the home builder portfolio. Our nonperforming loans grew by $1.5 billion during 2009,which is a result of the economic environment causing increased client defaults on their loans and extended disposition timeson our consumer loans secured by residential real estate. Given the extended timelines to foreclose, especially in Florida, weexpect that our nonperforming loan levels will remain elevated throughout 2010. However, during the second half of 2009,the level of increases in nonperforming loans moderated as compared to the increases seen during the first six months of theyear. This moderation in nonperforming loans, the first since the credit crisis began in 2007, was mainly due to a reduction innonaccrual commercial loans as the result of charge-offs recognized during the second half of the year and the transfer ofcertain commercial loans out of nonaccrual due to improved performance. We have implemented numerous loss mitigationefforts and are working to effectively manage elevated levels of nonperforming loans. While not a primary driver of theimprovement, our proactive mortgage loan modification programs have had a positive influence on these delinquency andnonperforming loan trends. We have seen a $1.2 billion increase in accruing restructured loans during 2009, which is due tous taking proactive steps to responsibly modify loans in order to mitigate loss exposure related to borrowers experiencingfinancial difficulty. We are aggressively pursuing modifications when there is a reasonable chance that the modification willallow the client to continue to remain in their home. Although, when there has been a loss of income such that the clientcannot reasonably support even a modified loan, we are strongly encouraging short sales and deed-in-lieu arrangements andrelocation to more affordable housing. See additional discussion of credit and asset quality in the “Loans”, “Allowance forCredit Losses”, “Provision for Credit Losses”, and “Nonperforming Assets” sections of this MD&A.
Despite the net losses in 2009, our capital and liquidity positions are stronger at the end of 2009 compared to prior year asevidenced by the growth during the year in our capital and liquidity ratios and growth in deposits. Our Tier 1 common equityratio improved to 7.67% from 5.83% at December 31, 2008. In addition, our Tier 1 capital ratio increased to 12.96% which isa 209 basis point increase from 10.87% at December 31, 2008. These improvements were the result of the capital raisingtransactions during the second quarter of 2009, as well as lower risk weighted assets from a reduction in loans and unfundedcommitments. We also have substantial available liquidity as the inflows of high quality deposits have largely been retainedin cash and invested in high quality government-backed securities. See additional discussion of our capital and liquidityposition in the “Capital Resources” and “Liquidity Risk” sections of this MD&A.
During the year, we experienced a significant increase in consumer and commercial deposits as evidenced by an 11.7%increase in average deposits compared to the prior year. Growth has occurred in all deposit products with money market andDDAs comprising the majority of the increase. This record level of deposits was driven by the industry-wide trend of clientsseeking the security of bank deposits; however, we believe our improved products and pricing, enhanced client service, andthe “Live Solid. Bank Solid.” brand advertising specifically assisted us in attracting new clients and expanding existingrelationships. Further, through an intense focus on improved execution, we have been successful in improving clientsatisfaction, acquisition, and retention. Additionally, as a result of the increase in these core deposits, we have been able toreduce our exposure to foreign deposits and higher-cost brokered deposits by $2.5 billion, or 31.0%, since December 31,2008 as well as higher-cost long-term debt by $9.3 billion, or 34.8%, over this same period. While we witnessed solid growthin core deposits during 2009, it has moderated during the latter part of the year, causing us to believe that it may furthermoderate going forward as the economy improves. Despite the moderation in total deposit growth, the mix of depositscontinues to shift towards lower cost transaction accounts.
During the year, average loans declined $4.4 billion, or 3.5%, and total loans at December 31, 2009 were down 10.5% fromprior year. Our aggressive effort to reduce exposure to construction lending, as evidenced by the 44.7% decline in averagebalances versus the previous year, was a primary driver of the decline in average loans during the year. In addition, wereduced our exposure to residential real estate loans as evidenced by the $3.0 billion, or 9.4%, decrease in average residentialreal estate loans in 2009. The decline in the remaining loan categories is primarily due to weak loan demand as a result of theeconomic environment, which has caused clients to be focused on capital preservation and an allocation of excess funds fordebt reduction. The trend of declining line of credit utilization among our mid-size and larger corporate clients continued dueto improved access to capital markets and lower working capital needs. We remain focused on extending credit to qualifiedborrowers as businesses and consumers work through the current economic downturn. Despite the reduction in our overallloan portfolio, new loan originations, commitments, and renewals of commercial and consumer loans were approximately$90 billion during 2009, with residential mortgage originations leading the way.
23

We increased our securities available for sale holdings during the year, resulting in a 44.6% increase in the year end balancecompared to prior year end. This increase was led by the increase in our holdings of U.S. Treasury and agency securities byover $7 billion in light of the increased liquidity from higher deposits and lower loan balances. In addition, agency MBSincreased by over $1 billion. This increase was related to sales during the year where we had the opportunity to manage theportfolio’s duration by selling bonds at a gain and repositioning the MBS portfolio into securities that we believe have higherrelative value. As a result of the securities sales, we realized $98.0 million in net gains during the year.
FTE net interest income was $4.6 billion for the year ended December 31, 2009, compared to $4.7 billion for the year endedDecember 31, 2008. FTE total revenue was down 9.9% to $8.3 billion for the year ended December 31, 2009 as a result ofsoft revenue generation in certain areas and substantially lower securities gains compared to the prior year. Net interestmargin in 2009 decreased six basis points when compared to the prior year primarily as a result of decreased loan pricing thatoutpaced the decreased deposit pricing during the year. Total noninterest expense increased by $683.4 million, or 11.6%, in2009, primarily driven by the $751.2 million non-cash goodwill impairment charge recognized during the year. Provision forcredit losses was $4.1 billion for the year ended 2009, an increase of $1.6 billion from the prior year. The provision for loanlosses was $769.0 million higher than net charge-offs of $3.2 billion for the year. The ALLL increased $769.0 million, or32.7%, from December 31, 2008 and was 2.76% of total loans not carried at fair value compared to 1.86% as ofDecember 31, 2008. Net charge-offs to average loans were 2.67% for the year ended 2009 compared to 1.25% for 2008.Nonperforming assets rose during the year to $6.1 billion at year end compared to $4.5 billion at the end of last year. Theaverage shareholders’ equity to average total assets ratio and the tangible equity to tangible assets ratio both improved from10.58% and 8.46% at December 31, 2008 to 12.70% and 9.66%, respectively, at December 31, 2009. We recorded $265.8million in dividends and accretion during 2009 related to preferred stock issued to the U.S. Treasury under the CPPcompared to $26.6 million during 2008. See additional discussion of our financial performance in the “ConsolidatedFinancial Results” section of this MD&A.
24

CONSOLIDATED FINANCIAL RESULTS
Table 1 - Consolidated Daily Average Balances, Income/Expense And Average Yields Earned And Rates Paid
2009 2008 2007
(Dollars in millions; yields on taxable-equivalent basis)AverageBalances
Income/Expense
Yields/Rates
AverageBalances
Income/Expense
Yields/Rates
AverageBalances
Income/Expense
Yields/Rates
AssetsLoans:1
Real estate 1-4 family $28,770.3 $1,722.5 5.99 % $31,758.9 $2,004.8 6.31 % $31,951.0 $2,036.5 6.37 %Real estate construction 5,991.0 198.1 3.31 10,828.5 575.8 5.32 13,519.4 1,011.0 7.48Real estate home equity lines 15,685.1 523.3 3.34 15,204.9 796.9 5.24 14,031.0 1,088.2 7.76Real estate commercial 15,573.4 639.4 4.11 13,968.9 789.7 5.65 12,803.4 887.5 6.93Commercial - FTE2 36,458.0 1,819.6 4.99 38,131.9 2,089.6 5.48 34,194.4 2,202.6 6.44Credit card 984.0 73.5 7.47 862.6 34.5 4.00 495.9 17.7 3.57Consumer - direct 5,101.0 207.1 4.06 4,541.8 254.1 5.60 4,221.0 304.9 7.22Consumer - indirect 6,594.0 418.0 6.34 7,262.5 459.8 6.33 8,017.5 495.4 6.18Nonaccrual and restructured 5,883.8 36.2 0.62 2,872.7 25.4 0.89 847.0 17.3 2.05
Total loans 121,040.6 5,637.7 4.66 125,432.7 7,030.6 5.61 120,080.6 8,061.1 6.71Securities available for sale:
Taxable 18,960.2 790.0 4.17 12,219.5 731.0 5.98 10,274.1 639.1 6.22Tax-exempt - FTE2 1,002.8 54.7 5.46 1,038.4 63.1 6.07 1,043.8 62.2 5.96
Total securities available for sale - FTE 19,963.0 844.7 4.23 13,257.9 794.1 5.99 11,317.9 701.3 6.20Funds sold and securities purchased under agreements to
resell 793.8 2.2 0.27 1,317.7 25.1 1.91 995.6 48.8 4.91Loans held for sale 5,228.4 232.8 4.45 5,105.6 289.9 5.68 10,786.7 668.9 6.20Interest-bearing deposits 25.3 0.2 0.91 25.6 0.8 3.18 24.0 1.3 5.44Interest earning trading assets 3,857.3 115.4 2.99 7,609.1 304.4 4.00 11,999.6 657.2 5.48
Total earning assets 150,908.4 6,833.0 4.53 152,748.6 8,444.9 5.53 155,204.4 10,138.6 6.53Allowance for loan and lease losses (2,705.5) (1,815.0) (1,065.7)Cash and due from banks 4,843.6 3,093.2 3,456.6Other assets 17,354.9 17,270.4 16,700.5Noninterest earning trading assets 3,429.1 2,641.6 1,198.9Unrealized gains on securities available for sale, net 1,611.9 1,909.5 2,300.8
Total assets $175,442.4 $175,848.3 $177,795.5
Liabilities and Shareholders’ EquityInterest-bearing deposits:
NOW accounts $23,600.6 $99.2 0.42 % $21,080.7 $252.9 1.20 % $20,042.8 $473.9 2.36 %Money market accounts 31,863.5 314.8 0.99 26,564.8 520.3 1.96 22,676.7 622.5 2.75Savings 3,664.2 10.1 0.27 3,770.9 16.3 0.43 4,608.7 55.5 1.20Consumer time 16,718.1 479.0 2.87 16,770.2 639.1 3.81 16,941.3 764.2 4.51Other time 13,068.4 382.1 2.92 12,197.2 478.6 3.92 12,073.5 586.3 4.86
Total interest-bearing consumer and commercialdeposits 88,914.8 1,285.2 1.45 80,383.8 1,907.2 2.37 76,343.0 2,502.4 3.28
Brokered deposits 5,648.3 154.2 2.69 10,493.2 391.5 3.73 16,091.9 861.2 5.35Foreign deposits 433.9 0.5 0.12 4,250.3 78.8 1.85 5,764.5 297.2 5.16
Total interest-bearing deposits 94,997.0 1,439.9 1.52 95,127.3 2,377.5 2.50 98,199.4 3,660.8 3.73Funds purchased 1,669.6 3.3 0.19 2,622.0 51.5 1.96 3,266.2 166.5 5.10Securities sold under agreements to repurchase 2,483.4 4.5 0.18 4,961.0 79.1 1.59 6,132.5 273.8 4.46Interest-bearing trading liabilities 487.8 20.2 4.14 785.7 27.1 3.46 430.2 15.6 3.62Other short-term borrowings 2,703.6 14.7 0.54 3,057.2 55.1 1.80 2,493.0 121.0 4.85Long-term debt 20,118.7 761.4 3.78 22,892.9 1,117.4 4.88 20,692.9 1,078.7 5.21
Total interest-bearing liabilities 122,460.1 2,244.0 1.83 129,446.1 3,707.7 2.86 131,214.2 5,316.4 4.05Noninterest-bearing deposits 24,249.2 20,949.0 21,677.2Other liabilities 4,387.2 5,061.4 5,662.7Noninterest-bearing trading liabilities 2,059.8 1,795.6 1,313.0Shareholders’ equity 22,286.1 18,596.2 17,928.4
Total liabilities and shareholders’ equity $175,442.4 $175,848.3 $177,795.5
Interest Rate Spread 2.70 % 2.67 % 2.48 %
Net Interest Income - FTE 3 $4,589.0 $4,737.2 $4,822.2
Net Interest Margin 4 3.04 % 3.10 % 3.11 %
1Interest income includes loan fees of $140.6 million, $134.5 million, and $119.8 million for the three years ended December 31, 2009, 2008, and 2007, respectively. Nonaccrual loans are included in averagebalances and income on such loans, if recognized, is recorded on a cash basis.2Interest income includes the effects of taxable-equivalent adjustments using a federal income tax rate of 35% and, where applicable, state income taxes to increase tax-exempt interest income to a taxable-equivalent basis. The net taxable-equivalent adjustment amounts included in the above table aggregated $123.3 million, $117.5 million, and $102.7 million for the three years ended December 31, respectively.3 The Company obtained derivative instruments to manage the Company’s interest-sensitivity position that increased net interest income $488.2 million and $180.7 million in the periods ended December 31,2009 and 2008, respectively and decreased net interest income $25.6 million in the period ended December 31, 2007.4The net interest margin is calculated by dividing net interest income – FTE by average total earning assets.
25

Table 2 - Analysis of Changes in Net Interest Income 1
2009 Compared to 2008 Increase(Decrease) Due to
2008 Compared to 2007 Increase(Decrease) Due to
(Dollars in millions on a taxable-equivalent basis) Volume Rate Net Volume Rate Net
Interest IncomeLoans:
Real estate 1-4 family ($183.4) ($98.8) ($282.2) ($12.3) ($19.3) ($31.6)Real estate construction (204.7) (173.1) (377.8) (177.6) (257.6) (435.2)Real estate home equity lines 24.4 (298.0) (273.6) 85.2 (376.5) (291.3)Real estate commercial 83.0 (233.2) (150.2) 75.9 (173.8) (97.9)Commercial - FTE2 (88.9) (181.1) (270.0) 236.9 (349.9) (113.0)Credit card 5.4 33.5 38.9 14.5 2.4 16.9Consumer - direct 28.7 (75.8) (47.1) 21.8 (72.5) (50.7)Consumer - indirect (42.4) 0.7 (41.7) (47.5) 11.8 (35.7)Nonaccrual and restructured 20.4 (9.6) 10.8 22.4 (14.3) 8.1
Securities available for sale:Taxable 323.7 (264.7) 59.0 117.3 (25.4) 91.9Tax-exempt 2 (2.1) (6.2) (8.3) (0.3) 1.2 0.9
Funds sold and securities purchased under agreements to resell (7.3) (15.6) (22.9) 12.5 (36.2) (23.7)Loans held for sale 6.8 (64.0) (57.2) (327.0) (52.1) (379.1)Interest-bearing deposits - (0.6) (0.6) 0.1 (0.6) (0.5)Interest earning trading assets (125.0) (64.0) (189.0) (203.0) (149.8) (352.8)
Total interest income (161.4) (1,450.5) (1,611.9) (181.1) (1,512.6) (1,693.7)
Interest ExpenseNOW accounts 27.2 (181.0) (153.8) 23.3 (244.2) (220.9)Money market accounts 89.0 (294.5) (205.5) 95.7 (197.9) (102.2)Savings (0.4) (5.7) (6.1) (8.7) (30.6) (39.3)Consumer time (2.0) (158.1) (160.1) (7.6) (117.5) (125.1)Other time 32.3 (128.7) (96.4) 6.0 (113.7) (107.7)Brokered deposits (150.1) (87.2) (237.3) (251.1) (218.6) (469.7)Foreign deposits (38.3) (39.9) (78.2) (63.5) (155.0) (218.5)Funds purchased (13.9) (34.3) (48.2) (27.9) (87.1) (115.0)Securities sold under agreements to repurchase (26.9) (47.7) (74.6) (44.6) (150.1) (194.7)Interest-bearing trading liabilities (11.6) 4.5 (7.1) 12.3 (0.7) 11.6Other short-term borrowings (5.7) (34.7) (40.4) 22.8 (88.7) (65.9)Long-term debt (124.5) (231.5) (356.0) 109.8 (71.1) 38.7
Total interest expense (224.9) (1,238.8) (1,463.7) (133.5) (1,475.2) (1,608.7)
Net change in net interest income $63.5 ($211.7) ($148.2) ($47.6) ($37.4) ($85.0)
1Changes in net interest income are attributed to either changes in average balances (volume change) or changes in average rates (rate change) for earning assets and sources of funds on whichinterest is received or paid. Volume change is calculated as change in volume times the previous rate, while rate change is change in rate times the previous volume. The rate/volume change,change in rate times change in volume, is allocated between volume change and rate change at the ratio each component bears to the absolute value of their total.2Interest income includes the effects of taxable-equivalent adjustments (reduced by the nondeductible portion of interest expense) using a federal income tax rate of 35% and, where applicable,state income taxes to increase tax-exempt interest income to a taxable-equivalent basis.
Net Interest Income/Margin
FTE net interest income was $4,589.0 million during 2009, a decrease of $148.2 million, or 3.1%, from 2008. Net interestmargin decreased six basis points from 3.10% in 2008 to 3.04% in 2009, while average earning assets decreased $1.8 billion,or 1.2%. Earning asset yields declined 100 basis points from 5.53% to 4.53%, and the rates paid on interest-bearing liabilitiesover the same period decreased 103 basis points.
Throughout 2009, we experienced an upward net interest margin trend, from 2.87% in the first quarter to 3.27% in the fourthquarter. The combination of liabilities re-pricing at lower rates and an increase in client deposits, as well as improved depositmix, enabled a reduction in higher-cost sources of funding while loans and earning assets declined more rapidly, offsettingsome of the benefit. Loan and deposit pricing are the primary opportunities to generate additional margin expansion in 2010,while the primary risks relate to the possibility that nonperforming assets will rise and loan demand will remain sluggish. Ourcurrent expectation for net interest margin in the near-term is for some compression. A full quarter’s impact of holding $5billion in U.S. Treasury securities and the first quarter consolidation of selected off-balance sheet entities, are expected tohave a small negative impact on margin which may be partially offset by improvements in deposit pricing. Additionally, weexpect to experience a seasonal decline in deposits.
26

Average earning assets decreased $1.8 billion, or 1.2%, from 2008. Average loans decreased $4.4 billion, or 3.5%. Thedecline is attributable to a $4.8 billion, or 44.7%, reduction in real estate construction loans, a $3.0 billion, or 9.4%, reductionin real estate 1-4 family residential loans, and a $1.7 billion, or 4.4%, reduction in commercial loans. The decreases in realestate construction, 1-4 family residential loans and commercial loans were partially offset by increases in the commercialreal estate loan portfolio of $1.6 billion, or 11.5%, as well as a $3.0 billion, or 104.8%, increase in nonperforming andrestructured loans. To offset the decline in loans, average securities available for sale increased $6.7 billion, or 50.6%, from2008 due to a $4.6 billion increase in MBS and a $2.1 billion increase in U.S. Treasury and agency securities.
Yields on average earning assets declined 100 basis points from 2008 to 2009 driven by declines in market interest rates. Ourloan portfolio yielded 4.66% for the year 2009, down 95 basis points from 2008. A large percentage of our commercial loansare variable rate indexed to one month LIBOR. In order to manage interest rate risk, we utilized receive fixed/pay floatinginterest rate swaps to hedge interest income in a declining rate environment. That interest rate risk management strategyalong with increased swap-related notional balances ($8.6 billion of additional floating rate commercial loans were swappedto fixed rate) and lower rates in 2009 resulted in swap income increasing from $229.0 million in 2008 to $539.5 million in2009. While the underlying loans swapped to fixed are classified as both commercial real estate and commercial, all of theswap income is recorded as interest on commercial loans. The classification of all swap income in the commercial loancategory, combined with the increased notional value of received fixed swaps and the declining balance of commercial loans,produced a significantly smaller decline in reported commercial loan yields as compared to underlying rate indices. Inaddition, loan-related interest income was augmented in 2009 by our loan pricing initiatives.
Average interest earning trading assets declined by $3.8 billion, or 49.3%. Despite the decline in trading assets, we continueto use this portfolio as part of our overall asset/liability management; however, the size and nature of trading assets willfluctuate over various economic cycles. Average LHFS were $5.2 billion during 2009, an increase of 2.4% from the prioryear. The increase in LHFS occurred as a result of increased mortgage loan production.
Average consumer and commercial deposits increased $11.8 billion, or 11.7%, in 2009 compared to 2008. This growthconsisted of increases of $5.3 billion, or 20.0%, in money market accounts, $3.3 billion, or 15.8%, in demand deposits, $2.5billion, or 12.0%, in NOW accounts, and $819.1 million, or 2.8%, in time deposits. Deposit growth was the result ofmarketing campaigns, competitive pricing, and clients’ increased preference for the security of insured deposit products.However, a portion of the deposit growth is related to the industry-wide flight to the safety of insured deposits and reducedclient demand for sweep accounts due to the low interest rate environment. The overall growth in consumer and commercialdeposits allowed for a reduction in other funding sources, including $4.8 billion of brokered deposits, $3.8 billion of foreigndeposits, and $2.8 billion of long-term debt. Overall, average interest-bearing liabilities declined $7.0 billion, or 5.4%. Wecontinue to pursue deposit growth initiatives to increase our presence in specific markets within our footprint. Competitionfor deposits remains strong, and as a result, deposit pricing pressure remains across our footprint. Despite these challengingmarket conditions, we have used a combination of regional and product-specific pricing initiatives to balance margin andvolume, while still growing our average deposit balances. We continue to believe that we are also benefiting from a numberof actions taken to improve marketplace awareness and client service. The “Live Solid. Bank Solid.” branding campaigncontinues to be very well received and we believe it is helping drive client acquisition. We also continue to refine pricingtactics to be competitive while maintaining deposit rates that are attractive to our clients. Notwithstanding these depositgeneration successes, some of the deposit growth is due to seasonality and the economic environment. Deposit balances areexpected to decline modestly in the first quarter related to seasonality, and further over time as the economy improves.
During 2009, the interest rate environment was characterized by lower rates, yet a steeper yield curve versus 2008. Morespecifically, the Fed funds target rate averaged 0.25%, a decrease of 183 basis points, the Prime rate averaged 3.25%, adecrease of 183 basis points, one-month LIBOR averaged 0.33%, a decrease of 235 basis points, five-year swaps averaged2.65%, a decrease of 104 basis points, and ten-year swaps averaged 3.44%, a decrease of 80 basis points. Rates paid ondeposits, our most significant funding source, tend to track movements in one-month LIBOR, while our fixed rate loan yieldstend to track movements in the five-year swap rate. However, due to the competition and customer demands surroundingdeposits, deposit pricing has reached an effective floor in some products, as evidenced by the 92 basis point decline in theaverage rate paid on interest-bearing consumer and commercial deposits versus the 235 basis point decline noted inone-month LIBOR.
Foregone interest income from nonperforming loans reduced net interest margin by 21 basis points for 2009 as averagenonaccrual loans increased $2.3 billion, or 82.7% from 2008. See additional discussion of our expectations for future levelsof credit quality in the “Allowance for Credit Losses”, “Provision for Credit Losses”, and “Nonperforming Assets” sectionsof this MD&A. Tables 1 and 2 contain more detailed information concerning average balances, yields earned, and rates paid.
27
Table 3 - Noninterest Income
Year Ended December 31
(Dollars in millions) 2009 2008 2007
Service charges on deposit accounts $848.4 $904.1 $822.0Other charges and fees 522.7 510.8 479.1Trust and investment management income 486.5 592.3 685.0Mortgage production related income 376.1 171.4 91.0Mortgage servicing related income 329.9 (211.8) 195.4Card fees 323.8 308.4 280.7Investment banking income 272.0 236.5 214.9Retail investment services 217.8 289.1 278.0Trading account profits/(losses) and commissions (40.7) 38.2 (361.7)Gain from ownership in Visa 112.1 86.3 -Gain on sale of businesses - 198.1 32.3Net gain on sale/leaseback of premises - 37.0 118.8Other income 163.6 239.8 350.1Net securities gains 98.0 1,073.3 243.1
Total noninterest income $3,710.2 $4,473.5 $3,428.7
Noninterest Income
Noninterest income decreased by $763.3 million, or 17.1%, in 2009, compared to 2008, driven largely by transactional itemsin 2008 that did not recur in 2009 such as gains from the sale and contribution of Coke stock, gains from the sale of certainbusinesses, and gains from the sale/leaseback of certain corporate real estate properties. In addition, mark to market valuationlosses on our public debt and related hedges carried at fair value were recognized in 2009 while mark to market valuationgains were recognized in 2008. The decrease in noninterest income was partially offset by higher mortgage-related income asa result of increased mortgage production in 2009 and an impairment charge recorded on our MSRs carried at LOCOMduring 2008 which was partially recovered in 2009. Additionally, in 2008, we recorded valuation losses related to ourexpected purchase of ARS and mark to market write-downs related to illiquid securities and warehouse loans carried atmarket that partially offset the overall decline in noninterest income.
Combined mortgage-related income increased $746.4 million compared to 2008. Mortgage servicing related incomeincreased $541.7 million compared to 2008, primarily due to a $199.2 million recovery of impairment on the MSRs carriedat LOCOM in 2009 compared to $370.0 million in impairment charges recorded during 2008 on our MSRs portfolio. Thisincrease was partially offset by higher amortization of MSRs due to an increase in prepayments, as well as a decline in thefair value of MSRs.
Mortgage production related income increased $204.7 million, or 119.4%, compared to 2008, primarily due to a $13.7billion, or 37.6%, increase in production volume that was partially offset by a $346.1 million increase in mortgagerepurchase related losses compared to 2008. The increase in production volume during 2009 was due in large part toincreased refinancing activity, which we do not expect to remain at this level in the near term. Mortgage repurchase relatedlosses increased from $98.2 million in 2008 to $444.3 million in 2009 as a result of increased repurchase requests fromgovernment-sponsored agencies. As discussed in more detail in Note 18, “Reinsurance Arrangements and Guarantees,” to theConsolidated Financial Statements, we provide standard representations and warranties when loans are sold to third partyinvestors. If it is later determined that such representations have been breached, the investor will request that we eitherpurchase the nonperforming loan or reimburse the investor for the loss incurred. Although mortgage repurchase reserves areestablished at the time of sale, actual credit losses have exceeded the original estimates and we are recognizing higher losses.We update our loss estimate by analyzing the population of loans sold by vintage and product in relation to our recentexperience and expected repurchase levels and as a result, the reserve for the repurchase of mortgage loans has increased. Ashift in the volume of repurchase requests occurred during the course of 2009 from loans originated and sold prior to 2007.During the latter half of 2009, the majority of our repurchase requests pertained to loans originated and sold in 2007. Webelieve ultimate losses on newer vintages, specifically 2008 and later, may be lower than older vintages. The elimination ofAlt-A loan products, tighter credit and underwriting guidelines, and enhanced processes have reduced the risk profile and,therefore, the repurchase risk exposure of loans originated and sold since 2008. In addition, loans sold in recent years havelower original loan-to-values and are subject to less home price depreciation which should reduce loss severities. Whilemortgage repurchase related losses are expected to remain elevated during 2010, the shift towards loans originated and sold
28
in more recent years gives us reason to believe that successful repurchase requests by investors and loss severities willdecline. The level of losses and reserves during 2010 are dependent primarily upon the continued shift in request volume tonewer vintages and no significant deterioration in the overall asset quality of the previously sold loans as indicated byborrower payment performance.
Net securities gains of $1.1 billion for 2008 included a $732.2 million gain on the sale and contribution of a portion of ourinvestment in Coke common stock in addition to a $413.1 million gain on the sale of MBS held in conjunction with our riskmanagement strategies associated with economically hedging the value of MSRs. These gains were partially offset by therecognition through earnings of $83.8 million in charges related to certain ABS that were determined in 2008 to be other-than-temporarily impaired. For additional information on transactions related to our holdings in Coke common stock, refer to“Investment in Common Shares of The Coca-Cola Company” within this MD&A. During 2009, we recorded net securitiesgains of $98.0 million which included a $90.2 million gain on the sale of approximately $9.2 billion of agency MBS. Thesesales were associated with repositioning the MBS portfolio into securities we believe have higher relative value. Netsecurities gains also included $20.0 million of credit-related OTTI losses on securities with a fair value of approximately$310.6 million, consisting primarily of purchased and retained private residential MBS.
In May 2009, we sold 3.2 million of our Visa Class B shares and entered into a derivative related to such shares. Werecognized a gain of $112.1 million in connection with these transactions. During the first quarter of 2008, Visa completedits IPO, and upon the closing, approximately 2 million of our Class B shares were mandatorily redeemed for $86.3 million,which was recorded as a gain in noninterest income. See Note 18, “Reinsurance Arrangements and Guarantees,” to theConsolidated Financial Statements for further discussion of the Visa transaction. Gain on sale of businesses consists of an$89.4 million gain on the sale of our remaining interest in Lighthouse Investment Partners during the first quarter of 2008, an$81.8 million gain on the sale of TransPlatinum, our fuel card and fleet management subsidiary, in the third quarter of 2008,a $29.6 million gain on the sale of First Mercantile, a retirement plan services subsidiary, during the second quarter of 2008,and a $2.7 million loss on the sale of a majority interest in ZCI during the fourth quarter of 2008.
Trust and investment management income decreased $105.8 million, or 17.9%, compared to 2008, primarily due to lower feeincome attributable to the decline in the equity markets, lower interest rates, and a decline in income associated with the saleof First Mercantile on May 30, 2008. Retail investment services income decreased $71.3 million, or 24.7%, compared to2008, due to lower annuity sales and reduced brokerage activity and client asset balances. Service charges on depositaccounts decreased $55.7 million, or 6.2%, compared to 2008, as a result of a reduction in consumer spending and lowernon-sufficient fund fees. We expect to comply with regulatory changes made by the Federal Reserve and are monitoringpotential legislative proposals which, should they become effective, have the potential to affect our ability to generate certaintypes of fee income in future periods.
Trading account profits/(losses) and commissions decreased $78.9 million compared to 2008, primarily due to $153.0 millionin mark to market losses on our public debt and related hedges carried at fair value during 2009 compared with gains of$431.7 million in 2008. The losses during 2009 were caused by an improvement in our credit spreads. These losses werepartially offset by $255.9 million in market valuation losses recorded during 2008 on our investments in certain illiquid ABScompared to small gains in 2009 as our exposure to these investments has been substantially reduced through sales,maturities, and write-downs. Additionally, during 2008, we recorded a $177.7 million loss related to our expected repurchaseof certain ARS. Capital markets related trading income increased during 2009, compared to the same periods in 2008, due toimproved equity derivatives and bond trading offset by decreased fixed income derivative performance. Investment bankingincome increased $35.5 million, or 15.0%, compared to 2008, due to improved bond origination fees, loan syndication fees,equity underwriting, and direct financing revenues.
Other income decreased $76.2 million, or 31.8%, compared to 2008. The decline was primarily due to losses recognized oncertain private equity investments and leases in 2009 compared to gains in 2008 and a recovery from the resolution of alitigation matter recognized in 2008.
During 2008, we completed sale/leaseback transactions, consisting of 152 branch properties and various individual officebuildings. In total, we sold and concurrently leased back $201.9 million in land and buildings with associated accumulateddepreciation of $110.3 million. For the year ended December 31, 2008, we recognized $37.0 million of the gain immediatelywhile the remaining $160.3 million in gains were deferred and will be recognized ratably over the expected term of therespective leases, predominantly as an offset to net occupancy expense.
29

Table 4 - Noninterest Expense
Year Ended December 31
(Dollars in millions) 2009 2008 2007
Employee compensation $2,257.5 $2,327.2 $2,329.0Employee benefits 542.4 434.0 441.2
Total personnel expense 2,799.9 2,761.2 2,770.2Amortization/impairment of goodwill/intangible assets 806.8 121.3 96.7Outside processing and software 579.3 492.6 410.9Net occupancy expense 356.8 347.3 351.2Regulatory assessments 302.2 54.9 22.4Credit and collection services 259.4 156.4 112.5Other real estate expense 243.7 104.7 15.8Equipment expense 171.9 203.2 206.5Marketing and customer development 151.5 372.2 195.0Mortgage reinsurance 114.9 179.9 0.2Operating losses 99.5 446.2 134.0Postage and delivery 83.9 90.1 93.2Communications 67.4 69.4 79.0Consulting and legal 57.5 58.6 101.2Other staff expense 50.8 70.3 132.5Operating supplies 41.0 44.3 48.7Net loss on debt extinguishment 39.4 11.7 9.8Visa litigation 7.0 (33.5) 76.9Merger expense - 13.4 -Other expense 329.5 314.8 364.4
Total noninterest expense $6,562.4 $5,879.0 $5,221.1
Noninterest Expense
Noninterest expense increased by $683.4 million, or 11.6%, in 2009 compared to 2008. The increase was primarily due to the$751.2 million non-cash goodwill impairment charge recorded in the first quarter of 2009 compared to a $45.0 millionimpairment charge related to a specific customer intangible asset recognized in the second quarter of 2008. Excluding theimpact of the goodwill and customer intangible impairment charges, noninterest expense decreased by $22.8 million, or0.4%, in 2009 compared to 2008. This slight decrease in noninterest expense (excluding impairment charges) resulted from adecline in credit-related expenses and marketing and customer development. Offsetting these decreases in 2009 wereincreases in personnel expense, outside processing and software, regulatory assessments, Visa litigation expense, debtextinguishment costs, and other economically cyclical expenses.
Amortization/impairment of intangible assets increased $685.5 million in 2009. The primary driver of the increase was anon-cash goodwill impairment charge of $751.2 million recorded in the first quarter of 2009 related to the HouseholdLending, Commercial Real Estate, and Affordable Housing businesses. The impairment resulted from continueddeterioration in real estate markets and the macro economy, which placed downward pressure on the fair value of ourmortgage and commercial real estate-related businesses, and caused the significant decline in our market capitalizationduring the first quarter. The impairment charge had no impact on our regulatory capital and tangible equity ratios. In thesecond quarter of 2008, we recorded an impairment charge of $45.0 million related to a specific customer intangible asset.
Credit-related costs include operating losses, credit and collection services, other real estate expense and mortgagereinsurance expense. These expenses decreased $169.7 million, or 19.1%, from 2008. Operating losses decreased $346.7million, or 77.7%, compared to 2008 primarily due to a change in classification related to borrower misrepresentation andclaim denials. Prior to the first quarter of 2009, borrower misrepresentation and mortgage insurance claim denials werecharged to operating losses. Beginning in 2009, we began recording these losses as charge-offs first against the previouslyestablished reserves for fraud losses and then against the ALLL, where the estimated reserves related to these loans are nowincluded. See additional discussion related to these losses in the “Allowance for Credit Losses” section of this MD&A.Included in 2008 was a $206.9 million reserve recorded for borrower misrepresentations and insurance claim denials. Otherreal estate expense increased $139.0 million, or 132.8%, in 2009 compared to 2008. This increase was due to a $129.1
30
million increase in valuation related losses on OREO properties and a $40.4 million increase in property expenses, partiallyoffset by net gains of $30.4 million on the sale of properties. Mortgage reinsurance reserve expense, which pertains to ourmortgage reinsurance subsidiary, Twin Rivers, decreased from $179.9 million in 2008 to $114.9 million in 2009 as a result oflosses reaching or approaching our loss limits within the insurance contracts in 2009. Twin Rivers’ loss exposure arises fromthird party mortgage insurers transferring a portion of their first loss exposure when losses by mortgage origination yearexceed certain thresholds. Credit and collection services expense increased $103.0 million, or 65.9%, in 2009 compared to2008 due to increased collection and loss mitigation activity.
Marketing and customer development expense decreased $220.7 million, or 59.3%, in 2009, compared to the same period in2008. The decrease was due to a reduction in corporate advertising and donations expense as a result of the $183.4 millioncontribution of Coke stock to the SunTrust Foundation made in the third quarter of 2008 and the related impact of reducingour ongoing contributions. Most of the remaining decrease related to a decline in customer development and promotionexpenses.
Personnel expenses in 2009 increased by $38.7 million, or 1.4%, from the same period in 2008. The slight increase inpersonnel expense is attributable to pension costs increasing from $23.9 million in 2008 to $140.9 million in 2009 resultingfrom an increase in the pension obligation due to 2009 market valuation assumptions. The increase in pension costs wereoffset by a decline in salaries expense of $69.7 million from 2008 to 2009 reflecting a reduction of approximately 1,332 fulltime equivalent employees since December 31, 2008 to 28,001 as of December 31, 2009. Personnel expense was alsoimpacted by an increase in incentive compensation primarily related to improved performance in certain businesses.
Outside processing and software increased $86.7 million, or 17.6%, compared to 2008 primarily due to our contracting witha third party in the third quarter of 2008 to provide certain check and related processing operations.
Regulatory assessments expense grew from $54.9 million in 2008 to $302.2 million in 2009 as a result of higher FDICinsurance premium rates and increased deposit balances, as the FDIC sought to replenish the insurance fund. Alsocontributing to the increase in 2009 was the FDIC special assessment recorded in the second quarter of 2009. The specialassessment was a charge that the FDIC levied on all banks to assist in replenishing their reserves. Our portion of thatassessment was $78.2 million. In the fourth quarter of 2009, we prepaid three years of expected FDIC premiums inaccordance with a newly-enacted regulatory requirement. The total premium of $925 million will be amortized into expenseover the next three years. The assessment will also increase in 2011 as a result of a three basis point increase which iseffective January 1, 2011. Other future assessments or taxes may occur on financial institutions as a result of legislativedevelopments and the support of the current administration.
Visa litigation expense increased by $40.5 million in 2009 compared to the same period in 2008. This increase is related to a$53.5 million reversal, during 2008, of a portion of the accrued liability associated with the Visa litigation as a result of thefunding by Visa of the litigation escrow account, partly offset by accruals based on the resolution of certain Visa relatedmatters.
Net loss on debt extinguishment increased from $11.7 million in 2008 to $39.4 million in 2009. The increase resultedprimarily from early termination fees for FHLB advances repaid during the fourth quarter of 2009 resulting in a $23.5million loss, net of gains on the early extinguishment of other long-term debt. These advance terminations were part of theinitiative we took to take advantage of the strong liquidity position we currently benefit from to repay wholesale funding andimprove margin.
Other noninterest expense increased $14.7 million, or 4.7%, in 2009 compared to 2008. The increase was due primarily towrite-downs of $46.8 million related to affordable housing properties in 2009 as compared to $19.9 million of relatedcharges in 2008. Also contributing to the increase was a $10.7 million increase in unfunded commitment expenses comparedto 2008, primarily related to increased loss exposure to unfunded commitments extended to a few large corporate clients andsome migration in risk ratings. Beginning in the fourth quarter of 2009, we began recording expense related to unfundedcommitment reserves in the provision for credit losses instead of noninterest expense. The expense which was included in theprovision for credit losses during the fourth quarter of 2009 amounted to $57.2 million. Partially offsetting the increase weregains from the current year sale of corporate assets and the successful resolution of specific contingent items in 2009.
Other operating expenses remain well controlled as a result of our ongoing commitment to improving efficiency.
Provision for Income Taxes
The provision for income taxes includes both federal and state income taxes. In 2009, the provision for income taxes was abenefit of $898.8 million, compared to a tax benefit of $67.3 million in 2008. The provision represents a negative 36.5%effective tax rate for 2009 compared to a negative 9.2% effective tax rate for 2008. The 2009 effective tax rate was primarilyattributable to the pre-tax loss and further increased by net favorable permanent tax items such as tax-exempt interestincome, federal tax credits and the release of unrecognized tax benefits related to the completion of audit examinations by
31

several taxing authorities during 2009. The tax benefit was reduced by a goodwill impairment, a significant portion of whichwas non-tax deductible. The 2008 effective tax rate included a discrete tax benefit related to the release of the deferred taxliability of approximately $65.8 million (net of valuation allowance) in connection with the contribution of 3.6 million sharesof Coke common stock to the SunTrust Foundation.
Table 5 - Loan Portfolio by Types of Loans
As of December 31
(Dollars in millions) 2009 2008 2007 2006 2005
Commercial $32,494.1 $41,039.9 $35,929.4 $34,613.9 $33,764.2Real estate:
Residential mortgages 30,789.8 32,065.8 32,779.7 33,830.1 29,877.3Home equity lines 15,952.5 16,454.4 14,911.6 14,102.7 13,635.7Construction 6,646.8 9,864.0 13,776.7 13,893.0 11,046.9
Commercial real estate:Owner occupied 8,915.4 8,758.1 7,948.5 7,709.0 7,398.6Investor owned 6,159.0 6,199.0 4,661.0 4,858.8 5,117.4
Consumer:Direct 5,117.8 5,139.3 3,963.9 4,160.1 5,060.8Indirect 6,531.1 6,507.6 7,494.1 7,936.0 8,389.5
Credit card 1,068.3 970.3 854.1 350.7 264.5
Total loans $113,674.8 $126,998.4 $122,319.0 $121,454.3 $114,554.9
Loans held for sale $4,669.8 $4,032.1 $8,851.7 $11,790.1 $13,695.6
Table 6 - Selected Residential Real Estate Loan Quality Information
(Dollars in millions)December 31,
200930 - 89 DaysDelinquent
NonperformingLoans
NonaccruingTDRs1
AccruingTDRs
Portion ofPortfolio in
Florida
Residential construction $3,822.9 1.55% 34.8% 0.2% 0.0% 27.0%Residential mortgages:
Core 23,913.5 1.98 8.5 2.6 4.5 30.3Prime second lien 2,904.1 2.46 3.1 1.2 3.3 11.9Lot 1,086.9 3.00 25.0 3.7 11.7 53.1Alt-A 897.1 5.22 30.2 14.2 15.0 19.0Home equity loans 1,988.2 2.47 2.8 0.6 1.7 31.1
Total residential mortgages 30,789.8 2.18 8.8 2.7 4.8 29.1Home equity lines 15,952.5 1.36 1.8 0.2 0.9 37.5
1Nonaccruing TDRs are included in Nonperforming Loans
Table 7 - Funded Exposures by Selected Industries1
As of December 31, 2009 As of December 31, 2008
(Dollars in millions) Loans% of Total
Loans Loans% of Total
Loans
Real Estate $12,756.0 11.2 % $16,853.5 13.3 %Retailing 6,060.8 5.3 7,207.8 5.7Consumer Products & Services 5,933.7 5.2 6,187.5 4.9Health Care & Pharmaceuticals 3,922.9 3.5 4,098.3 3.2Diversified Financials & Insurance 3,477.7 3.1 4,033.5 3.2Diversified Commercial Services & Supplies 2,867.9 2.5 3,313.2 2.6Capital Goods 2,463.8 2.2 3,264.2 2.6Energy & Utilities 2,195.1 1.9 3,414.7 2.7Religious Organizations/Non-Profits 1,964.3 1.7 2,067.7 1.6Government 1,954.9 1.7 2,015.4 1.6Individuals, Inv. & Trusts 1,664.8 1.5 1,086.2 0.9Media & Telecommunication Services 1,537.4 1.4 2,121.1 1.7Materials 1,285.5 1.1 1,722.6 1.4
1Industry groupings have been modified from the prior year presentation that was based on the NAICS. The new presentation presents exposure to industries as a result of repayment riskof the loan and allows for better comparability with industry peers who use a similar presentation. As a result of the new presentation, December 31, 2008 balances have been modifiedfrom the prior year presentation to reflect industry repayment risk. Groupings are loans in aggregate greater than $1 billion as of December 31.
32
Loans
Total loans as of December 31, 2009 were $113.7 billion, a decrease of $13.3 billion, or 10.5%, from December 31, 2008.The quarterly decline in total loans was $3.1 billion (December 31, 2008 to March 31, 2009); $1.1 billion (March 31, 2009 toJune 30, 2009); $6.3 billion (June 30, 2009 to September 30, 2009); and $2.8 billion (September 30, 2009 to December 31,2009). The decrease was primarily driven by reduced loan demand in the commercial portfolio, as well as a reduction in ourexposure to residential real estate, especially construction related. The portfolio is diversified by product, client, andgeography throughout our footprint, and has relatively low exposure to unsecured consumer loan products.
Residential mortgages were $30.8 billion, or 27.1% of the total loan portfolio, as of December 31, 2009, down $1.3 billion,or 4.0%, from December 31, 2008. The residential mortgage portfolio is comprised of core mortgages (prime first liens),prime second lien mortgages, home equity loans, lot loans, and Alt-A first and second mortgages. There are virtually nooption (negative amortizing) ARMs or subprime loans in the core portfolio.
The core mortgage portfolio was $23.9 billion, or 21.0% of total loans, as of December 31, 2009, and includes $16.6 billionin jumbo mortgages, of which $13.9 billion are ARMs. The remaining $7.3 billion of non jumbo loans includes $3.5 billionin ARMs and $0.9 billion in agency-eligible fixed rate loans. The agency-eligible fixed rate loans are effectively guaranteedby FNMA through a long-term standby commitment in which FNMA has committed to purchase at par those loans thatbecome delinquent. The core first mortgage portfolio included $12.1 billion in interest-only ARMs; however, the interest-only period is typically ten years, unlike many interest-only products in the market which have short interest-only periodswith early reset dates. The weighted average LTV at origination of the core mortgage portfolio was approximately 75%. Thecore mortgage portfolio includes approximately $1.0 billion of commercial purpose loans secured by residential real estate.
Prime second lien mortgages were $2.9 billion, or 2.6% of total loans, as of December 31, 2009 with $2.7 billion insuredthrough third party pool-level insurance. We consider the insurance to be integral to the loan and include probable insuranceproceeds in our analysis of the collectability of the loans. Total claims paid during 2009 and 2008 under the mortgageinsurance arrangements were $111.7 million and $43.8 million, respectively. Under the insurance arrangement, we areexposed to cumulative losses by vintage pool from 5% to 8%, as well as cumulative losses exceeding 10%. Due todeterioration in delinquency rates, most of the pools have reached the first tier insurance stop loss limit. As of December 31,2009, we had fully reserved for our exposure in the 5% to 8% loss layer, and we have also reserved for estimated lossesabove the 10% stop loss. In addition, we continue to experience claim denials on certain loans due to borrowermisrepresentation and loan documentation issues, which may impact the recognition of uninsured losses. See “Allowance forCredit Losses” section of this MD&A for a discussion of losses related to borrower misrepresentation and denied claims.
Home equity loans comprise $2.0 billion, or 1.7% of total loans, as of December 31, 2009 and have a 76% weighted averagecombined LTV at origination. Approximately 67% of the home equity loans are in a second lien position. Lot loans were$1.1 billion, or approximately 1.0% of total loans, as of December 31, 2009. Alt-A first lien loans were $0.7 billion, orapproximately 0.6% of total loans, as of December 31, 2009. Alt-A second lien loans totaled $0.2 billion. Alt-A firsts andseconds and lot loans have declined to less than 2% of the total loan portfolio.
The home equity line portfolio was $16.0 billion, or 14.0% of total loans, as of December 31, 2009, which is down $501.9million, or 3.1%, from December 31, 2008. The portfolio has a weighted average combined LTV at origination ofapproximately 73%. Third party originated home equity lines continued to perform poorly, however, only 10% of homeequity line balances were originated through that channel. We have eliminated origination of home equity products throughthird party channels, eliminated greater than 85% of LTV originations, implemented market specific LTV guidelines incertain declining markets, and have been reducing line commitments in higher risk situations. We continue to enhance ourcollections and default management processes. From a risk management perspective, there is virtually no line availabilityremaining in higher risk segments (i.e., lines originated by third parties and lines in Florida exceeding 80% current LTV).Overall, this portfolio displayed stable asset quality metrics; however, the portfolio continues to under perform.
The commercial loan portfolio decreased $8.5 billion, or 20.8%, from December 31, 2008 and comprises 28.6% of totalloans at December 31, 2009. The reduction in the commercial portfolio resulted primarily from a continued trend ofdeclining line of credit utilization among our mid-size and larger corporate clients due to lower working capital needs andenhanced access to the capital markets. The pace of decline did slow during the fourth quarter. The portfolio is diversified byindustry, geography, client segment, and collateral; and continues to perform reasonably well overall.
The commercial real estate portfolio was $15.1 billion, or 13.3% of total loans, an increase of $117.3 million, or 0.8%, fromDecember 31, 2008. The increase was attributable to the natural migration of loans maturing from the construction real estateloan portfolio into mini-perm financing. This portfolio includes both owner-occupied and income producing collateral, withalmost 60% being owner occupied properties. The commercial real estate portfolio, including both owner occupied andinvestor owned, is performing satisfactorily overall. Of the total commercial real estate portfolio, approximately 81% are
33

income properties such as office buildings, warehouses and retail buildings. Given conditions in the commercial real estatemarket, we anticipate continued stress and credit losses in this portfolio; however, we expect it to perform relatively wellgiven its composition and underwriting.
The construction portfolio was $6.6 billion, or 5.8% of total loans, at December 31, 2009, a decrease of $3.2 billion, or32.6%, from December 31, 2008. The construction portfolio consists of $0.8 billion of residential construction to perm loans,$1.2 billion of residential construction loans, $1.9 billion of commercial construction loans, $1.8 billion of acquisition anddevelopment loans, and $0.9 billion of undeveloped land loans. We have reduced the level of risk in the constructionportfolio by aggressively managing our construction exposure. This reduction is evident from the $7.1 billion, or 51.8%,decline in outstanding balances since December 2007. Commercial related construction loans represent 28.5% of the totalconstruction portfolio and credit performance remains acceptable overall. Performance of residential construction relatedloans remained weak; however, during the fourth quarter 30 days + delinquencies declined. We continue to be proactive inour credit monitoring and management processes to provide early warning for problem loans in the portfolio. For example,we use an expanded liquidity and contingency analysis to provide a thorough view of borrower capacity and their ability toservice obligations in a steep market decline. We also have strict limits and exposure caps on specific projects and borrowersfor risk diversification. Due to the lack of new construction projects and the completion of many that were previously started,the aggregate amount of interest reserves that we are obligated to fund is down from prior periods.
The indirect consumer portfolio was $6.5 billion, or 5.7% of total loans, at December 31, 2009, up $23.5 million, or 0.4%,from December 31, 2008. The increase is partially attributable to new vehicle sales triggered by the federal government“Cash for Clunkers” incentive program. This portfolio is experiencing a reduced level of charge-offs compared to 2008 andis benefiting from lower fuel prices, stabilized used car values, and natural turnover into newly underwritten vintages.
The direct consumer portfolio was $5.1 billion, or 4.5% of total loans, at December 31, 2009, down $21.5 million, or 0.4%,from December 31, 2008. Student loans, which are mostly government supported, made up $3.1 billion, or approximately61% of the direct consumer portfolio. This portfolio also includes loans and lines to individuals for personal or family uses.
The increase in LHFS of $637.7 million, or 15.8%, is due primarily to higher levels of mortgage loan originations.
Table 8 - Allowance for Loan and Lease Losses
(Dollars in millions) As of December 31
Allocation by Loan Type 2009 2008 2007 2006 2005
Commercial $650.0 $631.2 $422.6 $415.9 $439.6Real estate 2,268.0 1,523.2 664.6 443.1 394.1Consumer loans 202.0 196.6 110.3 95.5 109.4Unallocated 1 - - 85.0 90.0 85.0
Total $3,120.0 $2,351.0 $1,282.5 $1,044.5 $1,028.1
As of December 31
Year-end Loan Types as a Percent of Total Loans 2009 2008 2007 2006 2005
Commercial 28.6 % 32.3 % 29.4 % 28.8 % 29.2 %Real estate 60.2 57.8 60.6 61.2 58.7Consumer loans 11.2 9.9 10.0 10.0 12.1
Total 100.00 % 100.00 % 100.00 % 100.00 % 100.00 %
1 Beginning in 2008, the unallocated reserve is reflected in our homogeneous pool estimates.
34

Table 9 - Summary of Credit Losses Experience
Year Ended December 31
(Dollars in millions) 2009 2008 2007 2006 2005
Allowance for Credit LossesBalance - beginning of period $2,378.5 $1,290.2 $1,047.0 $1,031.7 $1,050.0Allowance associated with loans at fair
value 1 - - (4.1) - -Allowance from acquisitions and other
activity - net - 158.7 - - -Provision for loan losses 4,006.7 2,474.2 664.9 262.5 176.9Provision for unfunded commitments 4 87.4 19.8 5.2 (1.1) 3.6
Charge-offs:Commercial (612.8) (218.7) (133.6) (178.9) (107.3)Real estate:
Home equity lines (714.9) (449.6) (116.2) (28.8) (24.5)Construction (507.0) (194.5) (12.2) (2.3) (6.0)Residential mortgages 3 (1,235.7) (525.1) (113.1) (29.6) (22.8)Commercial real estate (31.6) (24.7) (2.1) (8.1) (3.1)
Consumer loans:Direct (56.9) (41.9) (23.4) (22.0) (37.2)Indirect (152.4) (192.9) (106.4) (82.3) (109.6)
Credit cards (86.0) (33.1) (7.3) (4.6) (4.7)
Total charge-offs (3,397.3) (1,680.5) (514.3) (356.6) (315.2)
Recoveries:Commercial 40.4 24.1 23.3 28.6 35.1Real estate:
Home equity lines 30.2 16.4 7.8 6.9 6.2Construction 7.6 2.8 1.2 2.0 0.8Residential mortgages 17.8 7.8 5.5 7.9 8.1Commercial real estate 3.8 1.1 1.9 6.2 2.6
Consumer loans:Direct 8.2 8.2 9.6 12.1 13.5Indirect 49.0 54.2 41.3 45.4 48.9
Credit cards 2.6 1.5 0.9 1.4 1.2
Total recoveries 159.6 116.1 91.5 110.5 116.4
Net charge-offs (3,237.7) (1,564.4) (422.8) (246.1) (198.8)
Balance - end of period $3,234.9 $2,378.5 $1,290.2 $1,047.0 $1,031.7
Components:Allowance for loan and lease losses $3,120.0 $2,351.0 $1,282.5 $1,044.5 $1,028.1Unfunded commitments reserve 114.9 27.5 7.7 2.5 3.6
Allowance for credit losses $3,234.9 $2,378.5 $1,290.2 $1,047.0 $1,031.7
Average loans $121,040.6 $125,432.7 $120,080.6 $119,645.2 $108,742.0Year-end loans outstanding 113,674.8 126,998.4 122,319.0 121,454.3 114,554.9
Ratios:Allowance to year-end loans5 2.76 % 1.86 % 1.05 % 0.86 % 0.90 %Allowance to nonperforming loans2,5 58.9 61.7 101.9 216.9 378.0Allowance to net charge-offs5 0.96 x 1.50 x 3.03 x 4.24 x 5.17 xNet charge-offs to average loans 2.67 % 1.25 % 0.35 % 0.21 % 0.18 %Provision for loan losses to average loans 3.31 1.97 0.55 0.22 0.16Recoveries to total gross charge-offs 4.7 6.9 17.8 31.0 36.9
1 Amount removed from the ALLL related to our election to record $4.1 billion of residential mortgages at fair value.2 During the second quarter of 2008, the Company revised its method of calculating this ratio to include, within the nonperforming loan amount, only loans measured at amortized cost.Previously, this calculation included nonperforming loans measured at fair value or the lower of cost or market. The Company believes this is an improved method of calculation due to thefact that the allowance for loan losses relates solely to the loans measured at amortized cost. Nonperforming loans measured at fair value or the lower of cost or market that have beenexcluded from the 2007 calculation were $171.5 million, which increased the calculation approximately 12 basis points as of December 31, 2007. Amounts excluded in years prior to 2007were immaterial and resulted in no basis point change in the respective calculation.3 Prior to 2009, borrower misrepresentation fraud and denied insurance claim losses were recorded as operating losses in the Consolidated Statements of Income/(Loss). These credit-relatedoperating losses totaled $160.3 million and $78.4 million during the year ended December 31, 2008 and 2007, respectively. Prior to 2007, credit-related operating losses were immaterial.During 2009, credit-related operating losses charged-off against previously established reserves within other liabilities totaled $194.9 million.4 Beginning in the fourth quarter of 2009, SunTrust recorded the provision for unfunded commitments of $57.2 million within the provision for credit losses in the Consolidated Statementsof Income/(Loss). Including the provision for unfunded commitments for the fourth quarter of 2009, the provision for credit losses was $4.1 billion for the twelve months endedDecember 31, 2009. Considering the immateriality of this provision prior to the fourth quarter of 2009, the provision for unfunded commitments remains classified within other noninterestexpense in the Consolidated Statements of Income/(Loss).5 This ratio is calculated using the allowance for loan and lease losses.
35

Allowance for Credit Losses
The allowance for credit losses consists of the ALLL as well as the reserve for unfunded commitments.
We continuously monitor the credit quality of our loan portfolio and maintain an ALLL sufficient to absorb current probableand estimable losses inherent in our loan portfolio. We are committed to the timely recognition of problem loans andmaintaining an appropriate and adequate ALLL. In addition to the review of credit quality through ongoing credit reviewprocesses, we employ a variety of modeling and estimation techniques to measure credit risk and construct an appropriateALLL. Numerous asset quality measures, both quantitative and qualitative, are considered in estimating the ALLL. Our ALLLCommittee has the responsibility of affirming the allowance methodology and assessing significant risk elements in order todetermine the appropriate level of allowance for the inherent losses in the loan portfolio at the point in time being reviewed. Themultiple factors evaluated include internal risk ratings, net charge-off trends, collateral values and geographic location, borrowerFICO scores, delinquency rates, nonperforming and restructured loans, origination channel, product mix, underwriting practices,and economic trends. These credit quality factors are incorporated into various loss estimation models and analytical toolsutilized in our ALLL process and/or are qualitatively considered in evaluating the overall reasonableness of the ALLL. Thefactors that have the greatest quantitative impact on the estimated ALLL tend to be internal risk rating trends, recent netcharge-off trends, delinquency rates, and loss severity levels (i.e., collateral values). Other factors such as nonperforming orrestructured loans tend to have a more isolated impact on subsets of loans in the loan pools. Also impacting the ALLL is theestimated incurred loss period, which tends to be approximately one year for consumer-related loans and between one andone-quarter to three years for wholesale-related loans. During periods of economic stress, the incurred loss period tends tocontract. The ALLL process excludes loans measured at fair value as subsequent mark to market adjustments related to loansmeasured at fair value include a credit risk component. Starting in third quarter 2009, the ALLL includes results from a recentlyenhanced residential mortgage loss forecast model. The model utilizes more granular loan specific information, as well as homeprice index changes at the Metropolitan Statistical Area level to estimate incurred losses and loss severities. The enhancedmodeling capabilities, as well as declines in the home price index, resulted in increases to average loss severity estimates relatedto residential mortgage loans, which partially contributed to the increase in the ALLL.
At December 31, 2009, the ALLL was $3,120.0 million, which represented 2.76% of period-end loans not carried at fairvalue. This compares with an ALLL of $2,351.0 million, or 1.86% of period-end loans not carried at fair value, as ofDecember 31, 2008. The year-over-year increase of $769.0 million in the ALLL is comprised of quarterly increases of$384.0 million (December 31, 2008 to March 31, 2009); $161.0 million (March 31, 2009 to June 30, 2009); $128.0 million(June 30, 2009 to September 30, 2009); and $96.0 million (September 30, 2009 to December 31, 2009) which reflects adeclining trend in ALLL increases as a result of stabilizing leading asset quality indicators. The year-over-year increase inALLL reflects, among other items, the current economic downturn, decreasing home prices, and higher losses in theresidential and commercial real estate-related portions of the loan portfolio. Future changes in the ALLL will dependsignificantly on credit quality indicators, which are highly influenced by the broader economy. The majority of the increasein the allowance for loan losses pertained to the residential real estate-related portion of the loan portfolio and specificreserves for residential developers. In the first quarter of 2009, we began classifying losses associated with borrowermisrepresentation and insurance claim denials in the ALLL. Previously, these fraud-related losses were recorded in operatinglosses within noninterest expense. These losses are now being recorded in the ALLL since we believe that borrower credit-related issues due to the deteriorating economic environment have become the predominant contributor to the losses.Realized losses on these loans are reflected as charge-offs.
Our ALLL framework has two basic elements: specific allowances for loans individually evaluated for impairment and acomponent for pools of homogeneous loans not individually evaluated. The first element of the ALLL analysis involves theestimation of allowance specific to individually evaluated impaired loans including accruing and nonaccruing restructuredcommercial and consumer loans. In this process, specific allowance is established for larger commercial impaired loansbased on an analysis of the most probable sources of repayment, including discounted cash flows, liquidation of collateral, orthe market value of the loan itself. Restructured consumer loans are also evaluated in this element of the estimate. As ofDecember 31, 2009, the specific allowance related to commercial impaired loans individually evaluated and restructuredconsumer loans totaled $538.0 million, compared to $201.8 million as of December 31, 2008; $292.2 million of this increaseis driven by the loan modification efforts on consumer and residential loans. Specific reserves associated with largercommercial loans individually evaluated increased $44.0 million to $193.0 million at December 31, 2009. This increase isprimarily driven by deterioration in loans to residential builders.
The second element of the ALLL, the general allowance for homogeneous loan pools not individually evaluated, is determinedby applying allowance factors to pools of loans within the portfolio that have similar risk characteristics. The general allowancefactors are determined using a baseline factor that is developed from an analysis of historical net charge-off experience andexpected losses. Expected losses are based on estimated probabilities of default and loss given default derived from our internalrisk rating process. These baseline factors are developed and applied to the various loan pools. Adjustments may be made tobaseline reserves for some of the loan pools based on an assessment of internal and external influences on credit quality not fullyreflected in the historical loss or risk-rating data. These influences may include elements such as changes in credit underwriting,concentration risk, macroeconomic conditions, and/or recent observable asset quality trends.
36

We continually evaluate our ALLL methodology seeking to refine and enhance this process as appropriate, and it is likelythat the methodology will continue to evolve over time. As of December 31, 2009, the general allowance totaled $2,582.0million. This compares to a general allowance totaling $2,149.2 million as of December 31, 2008. The increase was primarilydriven by declining home prices and the associated deterioration in credit quality of the residential mortgage and home equitylines of credit portfolios. Increases to the commercial related reserves were driven by higher expected loss factors.
Our charge-off policy meets or exceeds regulatory minimums. Losses on unsecured consumer loans are recognized at 90days past due compared to the regulatory loss criteria of 120 days. Secured consumer loans, including residential real estate,are typically charged down to net realizable value at 120 and 180 days delinquent, depending on the collateral type, incompliance with FFIEC guidelines. Commercial loans and real estate loans are typically placed on nonaccrual status whenprincipal or interest is past due for 90 days or more unless the loan is both secured by collateral having value sufficient todischarge the debt in full and the loan is in the legal process of collection. Accordingly, secured loans may be charged downor reserves established to the estimated value of the collateral with previously accrued unpaid interest reversed. Subsequentreserves and/or charge-offs may be required as a result of changes in the market value of collateral or other repaymentprospects. Initial reserves and/or charge-off amounts are based on valuation estimates derived from either appraisals, brokerprice opinions, or other market information. Generally, updated appraisals are received within 90 days of the foreclosureprocess. However, collateral values are updated and reviewed periodically based on market information from multiplesources.
Net charge-offs during 2009 were $3.2 billion, an increase of $1.7 billion from 2008. Net charge-offs to average loans ratiowas 2.67% and 1.25% as of December 31, 2009 and 2008, respectively. The increase in net charge-offs reflects the effects ofthe housing crisis and related economic downturn. The largest increases were seen in residential mortgage ($700.6 million),commercial ($377.8 million), real estate construction ($307.7 million) and home equity lines ($251.5 million). We do notoriginate subprime consumer real estate loans; however lower residential real estate values and recessionary economicconditions have affected borrowers of higher credit quality. Construction net charge-offs increased due to the resolution ofloan workouts in the residential builder construction portfolio. The increase in commercial net charge-offs was driven byrelatively fewer, but larger credits in unrelated, economically cyclical industries as well as small businesses. During thefourth quarter of 2009, net charge-offs declined across most loan categories, except residential construction, which increasedas a result of continued workout activities. Overall, our outlook is for elevated net charge-offs in the near term, particularlyrelated to residential mortgages associated with loans migrating to foreclosure, with the possibility that improvement couldbegin in the second half of 2010 depending on the strength and pace of economic recovery.
The ratio of the ALLL to total nonperforming loans decreased to 58.9% as of December 31, 2009 from 61.7% as ofDecember 31, 2008. The decline in this ratio was due to a $1.5 billion increase in nonperforming loans compared to 2008,driven primarily by increases in residential mortgage and real estate construction nonperforming loans, partially offset by the$769.0 million increase in the ALLL. The increase in nonperforming loans was driven primarily by deteriorating economicconditions and declining home values in most markets that we serve as well as home builders and commercial loans ineconomically sensitive businesses. We write down residential nonperforming loans to the expected value of the underlyingcollateral, less estimated selling costs as measured at the time the loan is 180 days past due. Declines, if any, in the collateralvalue of the nonperforming loans subsequent to the initial charge-off are captured in the ALLL and then recognized asadditional charge-offs upon foreclosure. The charge-off is applied against the ALLL; therefore, the relationship betweenALLL and nonperforming loans becomes less correlated since the carrying value of such charged-off nonperforming loanshas already recognized losses that are estimated to be realized at that point in time. Another factor that impacts the ALLL tononperforming loans ratio is that most of the nonperforming loans have some amount of net residual value; therefore, whilethe entire loan is classified as nonperforming, only the amount of estimated losses that has not already been charged-offwould be captured in the ALLL. Product mix of nonperforming loans and the related charge-off practices are relevantconsiderations in the evaluation of ALLL coverage of nonperforming loans.
The reserve for unfunded commitments was $114.9 million and $27.5 million as of December 31, 2009 and December 31,2008, respectively. Lending commitments such as letters of credit and binding unfunded loan commitments are assessedsimilarly to funded wholesale loans except utilization assumptions are considered. Larger nonperforming unfundedcommitments and letters of credit are individually evaluated for loss content. The $87.4 million increase in the reserve forunfunded commitments reflects the deterioration in the overall economy and credit conditions during the year. We do notanticipate this level of growth to continue during 2010 unless the economic environment deteriorates significantly.
Provision for Credit Losses
The provision for credit losses includes both the provision for loan losses, relating to funded loans, as well as the provisionfor unfunded commitments. The provision for loan losses is the result of a detailed analysis estimating an appropriate andadequate ALLL. The provision for loan losses during 2009 totaled $4.0 billion, an increase of $1.5 billion, or 61.9%, from2008. The increase in the provision for loan losses is primarily driven by elevated losses and increases in ALLL due to
37
deteriorating asset quality conditions in the residential related and wholesale portfolios. We expect net charge-offs and theprovision for loan losses to remain at elevated levels until we experience a sustained improvement in the credit quality of theloan portfolio. The amount of future growth in the ALLL is highly correlated to unemployment levels, changes in homeprices within our markets, especially Florida, as well as sustained improvement in our portfolio-specific credit qualityindicators. See additional discussion of our expectations for future levels of credit quality in the “Allowance for CreditLosses” and “Nonperforming Assets” sections of this MD&A.
Table 10 - Nonperforming AssetsAs of December 31
(Dollars in millions) 2009 2008 2007 2006 2005
Nonperforming AssetsNonaccrual/nonperforming loans:
Commercial $484.0 $322.0 $74.5 $106.8 $70.9Real estate:
Construction 1,484.6 1,276.8 295.3 38.6 24.4Residential mortgages 2,715.9 1,847.0 841.4 266.0 95.7Home equity lines 289.0 272.6 135.7 13.5 7.6Commercial real estate 391.8 176.6 44.5 55.4 44.6
Consumer loans 37.3 45.0 39.0 23.5 28.7
Total nonaccrual/nonperforming loans 5,402.6 3,940.0 1,430.4 503.8 271.9Other real estate owned 1 619.6 500.5 183.7 55.4 30.7Other repossessed assets 79.1 15.9 11.5 6.6 7.2
Total nonperforming assets $6,101.3 $4,456.4 $1,625.6 $565.8 $309.8
Ratios:Nonperforming loans to total loans 4.75 % 3.10 % 1.17 % 0.41 % 0.24 %Nonperforming assets to total loans plus
OREO and other repossessed assets 5.33 3.49 1.33 0.47 0.27Restructured loans (accruing) $1,640.9 $462.6 $29.9 $28.0 $24.4Accruing loans past due 90 days or more 1,499.9 1,032.3 611.0 351.5 371.51 Does not include foreclosed real estate related to loans previously serviced for GNMA reported in other assets and insured by FHA and VA as to principaland interest.
Nonperforming Assets
Nonperforming assets totaled $6.1 billion as of December 31, 2009, an increase of $1.6 billion, or 36.9%, from December 31,2008. Nonperforming loans as of December 31, 2009 were $5.4 billion, an increase of $1.5 billion, or 37.1%, fromDecember 31, 2008. Of this total increase, nonperforming residential mortgage loans represented $868.9 million, commercialreal estate loans represented $215.2 million, real estate construction loans represented $207.8 million, commercial loansrepresented $162.0 million, and home equity lines represented $16.4 million. We experienced slight declines in totalnonperforming assets and total nonperforming loans over the last six months of 2009 as well as a decline in early stagedelinquencies. The slight decline in total nonperforming loans was primarily related to commercial and construction loans,partially offset by increases in residential mortgages and commercial real estate loans.
Of the $5.4 billion in nonaccruing loans, approximately 80% is related to residential real estate. Residential mortgages andhome equity lines represent 55.6% of total nonaccruals. The increase in nonperforming assets is largely related to the housingcorrection and related decline in the values of residential real estate. The nonperforming assets are also affected by the time ittakes to complete the foreclosure process, especially in judicial jurisdictions. The asset quality of the residential mortgageportfolio showed signs of stabilization and moderating growth in nonperforming loans during the fourth quarter, although onan absolute basis, this portfolio continues to perform poorly. We have noted an increase in the amount of time it takes us toforeclose upon residential real estate collateral in certain states, primarily Florida, which we believe is primarily due todelays in the judicial foreclosure process. We apply rigorous loss mitigation processes to these nonperforming loans toensure that the asset value is preserved to the greatest extent possible; despite these efforts, it is likely we will realizeadditional losses on these nonperforming assets in the future.
Nonperforming residential mortgages are primarily collateralized by one-to-four family residential properties. Approximately84% of the nonperforming loans relate to properties in our footprint; approximately 52% of such nonperforming loans are inFlorida. Approximately 75% of the nonperforming residential mortgages have been on nonaccrual status for at least sixmonths. We have reached a point where growth in residential mortgage nonperforming loans has slowed as we areapproaching the equilibrium point where the nonperforming loan outflow from foreclosures is offsetting the inflow from newnonperforming loans. Approximately 52% of the nonperforming home equity lines were from lines originated by thirdparties, lines in Florida with combined LTVs greater than 80%, or lines in other states with combined LTVs greater than90%. Beginning in 2006, we tightened the underwriting standards applicable to many of the residential loan products offered.
Nonaccrual construction loans were $1.5 billion, an increase of $207.8 million, or 16.3%, from December 31, 2008.Approximately 90% of the nonperforming construction loans are secured by residential real estate; specifically, $261 million
38

construction to perm, $429 million residential construction, and $641 million in residential land, acquisition, anddevelopment properties. Beginning in September 2007, underwriting standards were tightened for new loan originations inthe construction to perm portfolio. At this point, we believe that the residential construction nonperforming loans are at ornear their peak. The vast majority of the problem loans in the portfolio have been identified and are in the workout process.As a result, charge-offs will remain elevated, but declining, over the next two to three quarters as we continue workoutactivities.
Nonaccrual commercial loans were $484.0 million, up $162.0 million, or 50.3%, from December 31, 2008. The increase wasdriven primarily by loans to a few larger commercial borrowers in economically cyclical industries together with loans tomid-size borrowers. Commercial loan charge-offs, early stage delinquency and nonperforming loans declined in the fourthquarter. We continue to see some stress in more cyclically sensitive industries and in our small business portfolio.
Nonaccrual commercial real estate loans increased by $215.2 million, or 121.9%, to $391.8 million compared toDecember 31, 2008. The increase occurred in a variety of property types, including office and hotel. The composition ofcommercial real estate nonaccruals is split almost equally between owner occupied and investor owned loans.
Early stage delinquencies (30-89 days past due) were stable to declining in almost all of our non-residential securedconsumer portfolios. The exception was in the consumer direct portfolio, which is largely comprised of federally guaranteedor privately insured student loans, and which drove the increase. Excluding student loans, the early stage delinquency ratiofor the consumer direct portfolio was 1.07%. Total early stage delinquencies declined to 1.37% as of December 31, 2009from 1.52% as of September 30, 2009 and 1.81% as of December 31, 2008.
In order to maximize the collection of loan balances, we evaluate accounts that experience financial difficulties on acase-by-case basis to determine if their terms should be modified. We are aggressively pursuing modifications when there isa reasonable chance that the modification will allow the client to continue servicing the debt. For residential real estatesecured loans, if the client demonstrates a loss of income such that the client cannot reasonably support even a modified loan,we strongly encourage short sales and deed-in-lieu arrangements. Accruing loans with modifications that are deemed to beeconomic concessions resulting from borrower difficulties are reported as TDRs. Nonaccruing loans that are modified anddemonstrate a history of repayment performance in accordance with their modified terms are reclassified to accruingrestructured typically after six months of repayment performance. Nonaccruing restructured loans were $912.5 million and$268.1 million as of December 31, 2009 and December 31, 2008, respectively.
Accruing restructured loans were $1.6 billion at December 31, 2009, an increase of $1.2 billion, or 254.7%, fromDecember 31, 2008. Of these TDRs, 97% are first and second lien residential mortgages and home equity lines of credit, andnot commercial or commercial real estate loans. At December 31, 2009, specific reserves included in the ALLL for allconsumer real estate TDRs (accruing and nonaccruing) were $345.0 million. In addition, we have already recordedapproximately $140 million in charge-offs on the nonaccruing TDRs and also have $86.0 million in mark to marketadjustments on TDRs carried at fair value. These loans are primarily residential related and are being restructured in a varietyof ways to help our clients remain in their homes and mitigate potential additional loss to us. The primary restructuringmethods offered to our clients are reductions in interest rates and extensions in terms. The increase in loan modifications alsoimpacted the moderation in nonperforming loan growth and early stage delinquencies. Within the accruing TDR portfolio,85% of loans are current on principal and interest and 70% of the total TDR portfolio is current. Not all restructurings willultimately result in the complete collection of principal and interest, as modified. We anticipate that some of the restructuredloans will default, which could result in incremental losses to us, which has been factored into our overall ALLL estimate.The level of re-defaults will be affected by future economic conditions. Generally, once a consumer loan becomes a TDR, itis probable that the loan will likely continue to be reported as TDR until it ultimately pays off in most circumstances.
Interest income on nonaccrual loans, if recognized, is recorded using the cash basis method of accounting. During 2009 and2008, this amounted to $36.2 million and $25.4 million, respectively. For 2009 and 2008, estimated interest income of$354.1 million and $233.3 million, respectively, would have been recorded if all such loans had been accruing interestaccording to their original contractual terms. Interest income on restructured loans that have met their performance criteriaand have been returned to accruing status is recognized according to the terms of the restructuring. During 2009, thisamounted to $52.2 million. For 2009, estimated interest income of $75.2 million would have been recorded if all loansreturned to accruing status had been accruing interest according to their original contractual terms. During 2008, thedifference between income under original contractual terms and the modified terms for restructured loans was insignificant.
As of December 31, 2009, accruing loans past due ninety days or more increased by $467.6 million, or 45.3%, fromDecember 31, 2008 to $1.5 billion. Included in this accruing loan population are $978.9 million and $493.7 million of loansat December 31, 2009 and December 31, 2008, respectively, that have been sold to GNMA and are fully insured by the FHAand the VA. When loans are sold to GNMA, we retain an option to repurchase the loans when they become delinquent. Assuch, we are required to record these loans on our balance sheet when our option becomes exercisable. Also included in theaccruing loans past due ninety days or more as of December 31, 2009 and December 31, 2008 were $366.7 million and$367.6 million, respectively, of student loans which were federally guaranteed at various levels between 97% and 100%.
39

OREO as of December 31, 2009 was $619.6 million, an increase of $119.1 million, or 23.8%, from December 31, 2008. Thegrowth consists of a $225.7 million increase in construction-related properties primarily driven by residential construction of$147.5 million and commercial properties of $78.2 million, acquired through foreclosure offset by a net decrease of $106.6million in residential homes. The amount of inflows and outflows has increased over the past several quarters asnonperforming loans migrate through the resolution process. Most of our OREO properties are located in Georgia, Florida,and North Carolina. Residential properties and land comprise 50% and 36%, respectively, of OREO; the remainder relates toresidential construction and other properties. Upon foreclosure, these properties were re-evaluated and if necessary, writtendown to their then current estimated net realizable value (estimated sales price less selling costs); further declines in homeprices could result in additional losses on these properties. We are actively managing these foreclosed assets to minimizefuture losses. See additional discussion of OREO-related costs in the “Noninterest Expense” section of this MD&A.
SELECTED FINANCIAL INSTRUMENTS CARRIED AT FAIR VALUE
Certain financial instruments such as trading securities, derivatives, and securities available for sale are required to be carriedat fair value. Companies are also permitted to elect to carry specific financial instruments at fair value to avoid some of thecomplexities of hedge accounting and more closely align the economics of their business with their results of operationswithout having to explain a mixed attribute accounting model. Based on our balance sheet management strategies andobjectives, we have elected to carry certain other financial assets and liabilities at fair value. These instruments include all, ora portion, of the following: debt, residential mortgage loans, brokered deposits, and trading loans.
We record changes in these instruments’ fair values through earnings and economically hedge and/or trade these assets orliabilities in order to manage the instrument’s fair value volatility and economic value. Following is a discussion of allfinancial assets and financial liabilities that are currently carried at fair value on the Consolidated Balance Sheets atDecember 31, 2009 and 2008.
Table 11 - Trading Assets and Liabilities
As of December 31
(Dollars in millions) 2009 2008 2007
Trading AssetsDebt securities:
U.S. Treasury and federal agencies $1,150.3 $3,127.6 $4,194.4U.S. states and political subdivisions 58.5 159.1 171.2Corporate debt securities 464.7 585.8 607.0Commercial paper 0.6 399.6 2.4Residential mortgage-backed securities - agency 94.2 58.6 127.5Residential mortgage-backed securities - private 13.9 38.0 600.4Collateralized debt obligations 174.9 261.5 2,245.1Other debt securities 25.9 813.2 149.8
Total debt securities 1,983.0 5,443.4 8,097.8Equity securities 163.0 116.8 242.7Derivative contracts 2,610.3 4,701.8 1,977.4Other 223.6 134.3 200.5
Total trading assets $4,979.9 $10,396.3 $10,518.4
Trading LiabilitiesDebt securities:
U.S. Treasury and federal agencies $192.9 $440.4 $332.7Corporate and other debt securities 144.1 146.8 188.1
Total debt securities 337.0 587.2 520.8Equity securities 7.8 13.3 71.9Derivative contracts 1,844.1 2,640.3 1,567.7
Total trading liabilities $2,188.9 $3,240.8 $2,160.4
40
Trading Assets and Liabilities
Trading assets decreased $5.4 billion, or 52.1%, since December 31, 2008. The majority of the decrease consisted of a $3.5billion reduction in trading debt securities, which was primarily driven by the sale in the first quarter of 2009 ofapproximately $2.0 billion of our agency trading portfolio that consisted of FHLB floating rate notes. The sale of thesesecurities was completed primarily to reduce low yielding securities and improve margin.
CP decreased $399.0 million from $399.6 million at December 31, 2008 to $0.6 million at December 31, 2009. The decreaseis primarily due to the discontinuation of the Federal Reserve Bank of Boston’s ABCP MMMF Liquidity Facility programthat was implemented in 2008 which allowed eligible depository institutions, bank holding companies, and affiliated broker/dealers to purchase certain ABCP from certain MMMF.
Other debt securities decreased $787.3 million during the year ended December 31, 2009. Of this decrease, $603.4 millionwas the result of the temporary suspension and wind-down of the TRS business. See Note 11, “Certain Transfers of FinancialAssets, Mortgage Servicing Rights and Variable Interest Entities”, to the Consolidated Financial Statements for additionalinformation regarding our TRS business.
Derivative assets and liabilities also decreased in 2009 by $2.1 billion and $0.8 billion, respectively, of which $1.5 billion and$655.1 million, respectively, was driven by the movements in fair values of interest rate based derivatives including $184.1million in terminated interest rate swaps on FHLB advances that were repaid in the first quarter of 2009. In addition, $249.5million of the decrease in derivative assets was due to the decline in fair value of our cash flow hedges related to the probableforecasted sale of Coke common shares, which change in fair value also increased the derivative liabilities by $45.9 million. Thetermination of TRS transactions resulted in the decrease of derivative assets and liabilities during 2009 of $171.0 million and$166.6 million, respectively. The remaining decrease in derivative assets and liabilities was primarily due to the partialtermination of cross currency swaps hedging foreign denominated debt and the changes in fair value of those hedge positionsstill outstanding.
Certain ABS were purchased during the fourth quarter of 2007 from affiliates and certain ARS were purchased primarily inthe fourth quarter of 2008 and first quarter of 2009. The securities acquired during the fourth quarter of 2007 included SIVs(that are collateralized by various domestic and foreign assets), residential MBS (including Alt-A and subprime collateral),CDO, and commercial loans, as well as super-senior interests retained from Company-sponsored securitizations. During theyear ended December 31, 2009, we recognized approximately $24.2 million in net market valuation gains related to theseABS. Through sales, maturities and write downs, we reduced our exposure to these distressed assets by approximately $3.3billion since the acquisition in the fourth quarter of 2007, reducing the exposure at December 31, 2009 to approximately$159.3 million. During 2009, we received approximately $6.5 million in sales proceeds and $108.5 million in paymentsrelated to securities acquired during the fourth quarter of 2007.
We continue to actively evaluate our holdings of these securities with the objective of opportunistically lowering ourexposure to them. In addition, we expect paydowns to continue on many of the residential MBS. All but a small amount ofthe remaining acquired asset portfolio consists of SIVs undergoing enforcement proceedings and, therefore, any significantreduction in the portfolio will largely depend on the status of those proceedings. During the second quarter of 2009, one ofour three remaining SIVs liquidated as a result of the completion of enforcement proceedings; this liquidation resulted inproceeds of $18.6 million and a realized gain of $1.8 million, due to the liquidation value being slightly above our recordedfair value, that was recorded in trading account profits/(losses) and commissions in the Consolidated Statements of Income/(Loss) for the year ended December 31, 2009. During 2009, we received approximately $65.0 million in partial payments onthe remaining SIVs undergoing enforcement. While further losses are possible, our experience during 2008 and 2009reinforces our belief that we have appropriately written these assets down to fair value as of December 31, 2009. Theestimated market value of these securities is based on market information, where available, along with significant,unobservable third party data. As a result of the high degree of judgment and estimates used to value these illiquid securities,the market values could vary significantly in future periods. See “Difficult to Value Financial Assets and Liabilities”included in this MD&A for more information.
The amount of ARS recorded in trading assets at fair value totaled $176.4 million at December 31, 2009 and $133.1 millionat December 31, 2008. The majority of these ARS are preferred equity securities, and the remaining securities consist ofABS backed by trust preferred bank debt or student loans.
In September 2008, we purchased, at amortized cost plus accrued interest, a Lehman Brothers security from the RidgeWorthPrime Quality Money Market Fund (the “Fund”). The Fund received a cash payment for the accrued interest along with a $70million note that we issued. RidgeWorth, one of our wholly-owned subsidiaries, is the investment adviser to the Fund. TheLehman Brothers security went into default when Lehman Brothers filed for bankruptcy in September 2008. We took this
41
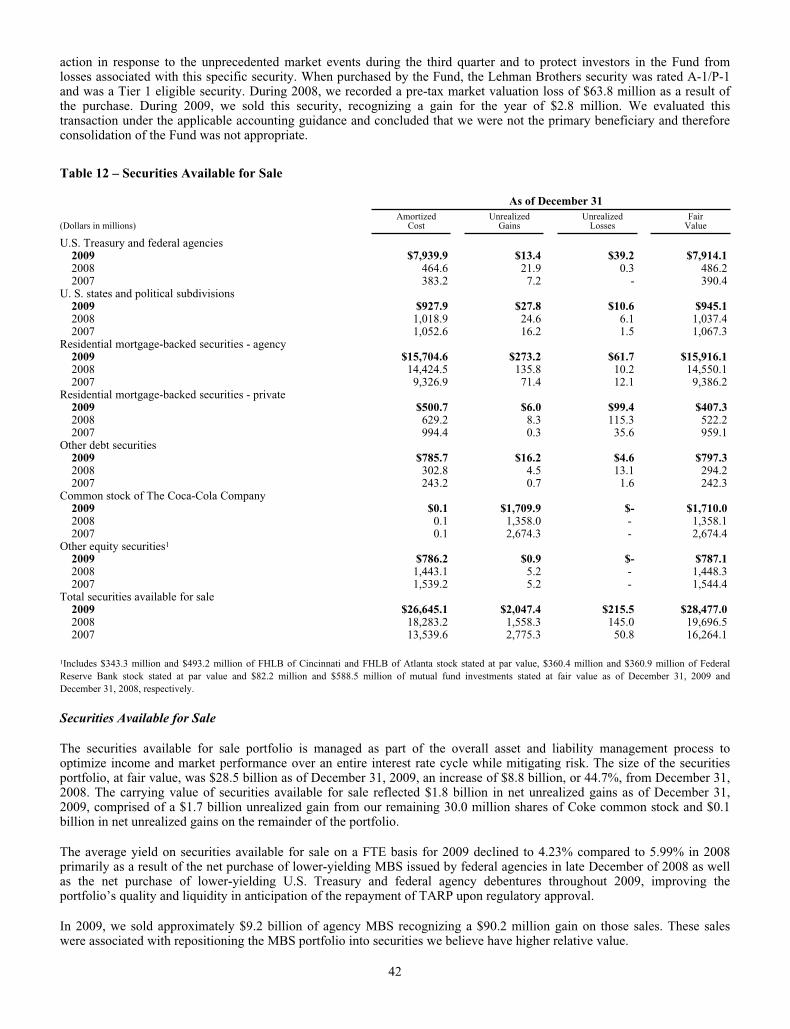
action in response to the unprecedented market events during the third quarter and to protect investors in the Fund fromlosses associated with this specific security. When purchased by the Fund, the Lehman Brothers security was rated A-1/P-1and was a Tier 1 eligible security. During 2008, we recorded a pre-tax market valuation loss of $63.8 million as a result ofthe purchase. During 2009, we sold this security, recognizing a gain for the year of $2.8 million. We evaluated thistransaction under the applicable accounting guidance and concluded that we were not the primary beneficiary and thereforeconsolidation of the Fund was not appropriate.
Table 12 – Securities Available for Sale
As of December 31
(Dollars in millions)Amortized
CostUnrealized
GainsUnrealized
LossesFair
Value
U.S. Treasury and federal agencies2009 $7,939.9 $13.4 $39.2 $7,914.12008 464.6 21.9 0.3 486.22007 383.2 7.2 - 390.4
U. S. states and political subdivisions2009 $927.9 $27.8 $10.6 $945.12008 1,018.9 24.6 6.1 1,037.42007 1,052.6 16.2 1.5 1,067.3
Residential mortgage-backed securities - agency2009 $15,704.6 $273.2 $61.7 $15,916.12008 14,424.5 135.8 10.2 14,550.12007 9,326.9 71.4 12.1 9,386.2
Residential mortgage-backed securities - private2009 $500.7 $6.0 $99.4 $407.32008 629.2 8.3 115.3 522.22007 994.4 0.3 35.6 959.1
Other debt securities2009 $785.7 $16.2 $4.6 $797.32008 302.8 4.5 13.1 294.22007 243.2 0.7 1.6 242.3
Common stock of The Coca-Cola Company2009 $0.1 $1,709.9 $- $1,710.02008 0.1 1,358.0 - 1,358.12007 0.1 2,674.3 - 2,674.4
Other equity securities1
2009 $786.2 $0.9 $- $787.12008 1,443.1 5.2 - 1,448.32007 1,539.2 5.2 - 1,544.4
Total securities available for sale2009 $26,645.1 $2,047.4 $215.5 $28,477.02008 18,283.2 1,558.3 145.0 19,696.52007 13,539.6 2,775.3 50.8 16,264.1
1Includes $343.3 million and $493.2 million of FHLB of Cincinnati and FHLB of Atlanta stock stated at par value, $360.4 million and $360.9 million of FederalReserve Bank stock stated at par value and $82.2 million and $588.5 million of mutual fund investments stated at fair value as of December 31, 2009 andDecember 31, 2008, respectively.
Securities Available for Sale
The securities available for sale portfolio is managed as part of the overall asset and liability management process tooptimize income and market performance over an entire interest rate cycle while mitigating risk. The size of the securitiesportfolio, at fair value, was $28.5 billion as of December 31, 2009, an increase of $8.8 billion, or 44.7%, from December 31,2008. The carrying value of securities available for sale reflected $1.8 billion in net unrealized gains as of December 31,2009, comprised of a $1.7 billion unrealized gain from our remaining 30.0 million shares of Coke common stock and $0.1billion in net unrealized gains on the remainder of the portfolio.
The average yield on securities available for sale on a FTE basis for 2009 declined to 4.23% compared to 5.99% in 2008primarily as a result of the net purchase of lower-yielding MBS issued by federal agencies in late December of 2008 as wellas the net purchase of lower-yielding U.S. Treasury and federal agency debentures throughout 2009, improving theportfolio’s quality and liquidity in anticipation of the repayment of TARP upon regulatory approval.
In 2009, we sold approximately $9.2 billion of agency MBS recognizing a $90.2 million gain on those sales. These saleswere associated with repositioning the MBS portfolio into securities we believe have higher relative value.
42

The portfolio’s effective duration increased to 3.0% as of December 31, 2009 from 2.8% as of December 31, 2008. Effectiveduration is a measure of price sensitivity of a bond portfolio to an immediate change in market interest rates, taking intoconsideration embedded options. An effective duration of 3.0% suggests an expected price change of 3.0% for a one percentinstantaneous change in market interest rates. The credit quality of the securities portfolio remained strong withapproximately 95% of the total securities available for sale portfolio rated AAA, the highest possible rating by nationallyrecognized rating agencies.
During 2009, we recognized $20.0 million of credit-related OTTI within net securities gains in the Consolidated Statementsof Income/(Loss) and $92.8 million of non-credit related OTTI within OCI. This total OTTI loss of $112.8 million relates tosecurities with a fair value of approximately $310.6 million as of December 31, 2009, consisting primarily of purchased andretained private residential MBS. These impaired securities were valued using third party pricing data, including brokerindicative bids, or expected cash flow models. See Note 5, “Securities Available for Sale,” to the Consolidated FinancialStatements for further discussion.
The amount of ARS recorded in the available for sale securities portfolio totaled $156.4 million as of December 31, 2009 and$48.2 million as of December 31, 2008. Included in ARS are tax-exempt municipal securities in addition to student loanABS.
Difficult to Value Financial Assets and Liabilities
The broad credit crisis that was triggered by the 2007 subprime loan melt-down intensified throughout 2008 and, as thebroader economy continued to worsen, the credit and liquidity markets became dysfunctional. The second half of 2008 wasmarked by turmoil in the financial sector, with the failure or government induced acquisitions of several large banks andinvestment banks, increased unemployment, and further declines in real estate values. Additional liquidity adjustments weremade on many securities, and wider spreads caused valuing our level 3 financial instruments to become even more difficult.Initially in 2009, we saw continued volatility with the credit crisis further eroding liquidity and investor confidence; however,we began to experience the return of some stability in certain financial markets throughout the majority of 2009. In spite ofsome improvement in the market, record high mortgage delinquencies and foreclosures led to further downward pressure oncertain private residential mortgage backed products. As a result, loss projections used by investors to estimate cash flows ofthese products more than doubled during the year, particularly for 2007 vintage private MBS.
Fair value is the estimated price using market-based inputs or assumptions that would be received to sell an asset or paid totransfer a liability in an orderly transaction between market participants at the measurement date. Current market conditionshave led to diminished, and in some cases, non-existent trading in certain of the financial asset classes that we own. We arerequired to consider observable inputs, to the extent available, in the fair value estimation process, unless that data results fromforced liquidations or distressed sales. When available, we will obtain third party broker quotes or use observable marketassumptions, as these levels of evidence are the strongest support for fair value, absent current market activity in that specificsecurity or a similar security. Despite our best efforts to maximize the use of relevant observable inputs, the current marketenvironment has generally diminished the observability of trades and assumptions that have historically been available. As such,the degree to which significant unobservable inputs have been utilized in our valuation procedures has increased over the pasttwo years, largely with respect to certain types of loans and securities. This decrease in observability of market data began in thethird quarter of 2007 and continued to persist in certain markets in 2009. However, we have begun to observe increased tradingactivity in certain markets, such as corporate debt markets (both primary and secondary) and the market for Small BusinessAdministration instruments, which has provided corroborating evidence for our estimates of fair value.
The lack of liquidity, as evidenced by significant decreases in the volume and level of activity in certain markets, createsadditional challenges when estimating the fair value of certain financial instruments. Generally, the assets and liabilities mostaffected by the lack of liquidity are those classified as level 3 in the fair value hierarchy. This lack of liquidity has caused usto evaluate the performance of the underlying collateral and use a discount rate commensurate with the rate a marketparticipant would use to value the instrument in an orderly transaction, but that also acknowledges illiquidity premiums andrequired investor rates of return that would be demanded under current market conditions. The discount rate considered thecapital structure of the instrument, market indices, and the relative yields of instruments for which third party pricinginformation and/or market activity was available. In certain instances, the interest rate and credit risk components of thevaluation indicated a full return of expected principal and interest; however, the lack of liquidity resulted in wide ranges ofdiscounts in valuing level 3 securities. The current illiquid markets are requiring discounts of this degree to drive a marketcompetitive yield, as well as account for the anticipated extended tenor. The discount rates selected derived reasonable priceswhen compared to (i) observable transactions, when available, (ii) other securities on a relative basis, (iii) the bid/ask spreadof non-binding broker indicative bids and/or (iv) our professional judgment. For certain securities, particularlynon-investment grade MBS, a reasonable market discount rate could not be determined using those methodologies and,therefore, dollar prices were established based on market intelligence.
Pricing services and broker quotes were obtained when available to assist in estimating the fair value of level 3 instruments.The number of quotes we obtained varied based on the number of brokers following a particular security, but we generally
43

attempt to obtain two to four quotes to determine reasonableness and comparability on a relative basis; however, the abilityto obtain reasonable and reliable broker quotes or price indications continues to be challenging. We gained an understandingof the information used by third party pricing sources to develop their estimated values. The information obtained from thirdparty pricing sources was evaluated and relied upon based on the degree of market transactions supporting the priceindications and the firmness of the broker quotes. In most cases, the current market conditions caused the broker quotes to beindicative and the price indications and broker quotes to be supported by very limited to no recent market activity. In thoseinstances, we weighted the third party information according to our judgment of it being a reasonable indication of theinstrument’s fair value.
Generally, pricing services’ values and broker quotes obtained on level 3 instruments were indications of value based on priceindications, market intelligence, and proprietary cash flow modeling techniques, but could not otherwise be supported by recenttrades due to the illiquidity in the markets. These values were evaluated in relation to other securities, and other broker indications,as well as our independent knowledge of the security’s collateral. We believe that we evaluated all available information to estimatethe value of level 3 instruments. The continued decline in the amount of third party information available necessitates the furtheruse of internal models when valuing level 3 instruments. All of the techniques used and information obtained in the valuationprocess provides a range of estimated values, which were evaluated and compared in order to establish an estimated value that,based on management’s judgment, represented a reasonable estimate of the instrument’s fair value. It was not uncommon for therange of value of these instruments to vary widely; in such cases, we selected an estimated value that we believed was the bestindication of value based on the yield a market participant in this current environment would expect.
Beginning in the first quarter of 2008, management established a level 3 valuation working group to evaluate the availableinformation pertaining to certain securities and ultimately develop a consensus estimate of the instrument’s fair value. Theprocess involves the gathering of multiple sources of information, including broker quotes, values provided by pricingservices, trading activity in other similar securities, market indices, and internal cash flow and pricing matrix estimates.Participation in this working group includes the business or functional area that manages the instrument, market risk, andfinance, including the independent price verification function. Pricing estimates are derived on most illiquid instrumentsweekly and at a minimum monthly, and the working group formally reviews the pricing information at least quarterly. Thesereviews may include assessing an instrument’s classification in the fair value hierarchy based on the significance of theunobservable assumptions used to estimate the fair value.
We used significant unobservable inputs to fair value, on a recurring basis, certain trading assets, securities available for sale,portfolio loans accounted for at fair value, IRLCs, LHFS, MSRs and certain derivatives. The following table discloses assetsand liabilities that have been impacted by level 3 fair value determinations.
Table 13
As of
(Dollars in millions) December 31, 2009 December 31, 2008
Trading assets $390.1 $1,391.4Securities available for sale 1,322.1 1,489.6Loans held for sale 151.5 487.4Loans 448.7 270.3Other intangible assets 1 935.6 -Other assets 2 13.5 73.6
Total level 3 assets $3,261.5 $3,712.3
Total assets $174,164.7 $189,138.0
Total assets measured at fair value $37,914.9 $32,897.2
Level 3 assets as a percent of total assets 1.9 % 2.0 %Level 3 assets as a percent of total assets measured at fair value 8.6 11.3
Long-term debt $- $3,496.3Trading liabilities 45.9 -Other liabilities 2, 3 48.1 1.2
Total level 3 liabilities $94.0 $3,497.5
Total liabilities $151,633.9 $166,637.2
Total liabilities measured at fair value $7,160.6 $11,456.5
Level 3 liabilities as a percent of total liabilities 0.1 % 2.1 %Level 3 liabilities as a percent of total liabilities measured at
fair value 1.3 30.5
1 Includes MSRs carried at fair value.2 Includes IRLCs.3 Includes derivative related to sale of Visa shares during the second quarter of 2009.
44

Securities Available for Sale and Trading Assets
Our level 3 securities available for sale totals approximately $1.3 billion at December 31, 2009, including FHLB andFederal Reserve Bank stock, as well as certain municipal bond securities, some of which are only redeemable with theissuer at par and cannot be traded in the market; as such, no significant observable market data for these instruments isavailable. These nonmarketable securities total approximately $836.9 million at December 31, 2009. Level 3 tradingassets total approximately $390.1 million at December 31, 2009. The remaining level 3 securities, both trading assetsand available for sale securities, are predominantly private MBS and collateral debt obligations, including interestsretained from Company-sponsored securitizations or purchased from third-party securitizations and investments inSIVs. We have also increased our exposure to bank trust preferred ABS, student loan ABS, and municipal securities dueto our purchase of certain ARS as a result of failed auctions. For all of the Level 3 securities, little or no market activityexists for either the security or the underlying collateral and therefore the significant assumptions used to value thesecurities are not market observable. Approximately half of the collateral in the remaining level 3 securities includesdirect or repackaged exposure to residential mortgages which is predominantly secured by 2007 vintage prime first lienmortgage loans, however, there is also exposure to prime first and second lien mortgages, as well as subprime first andsecond lien mortgages that were originated from 2003 through 2007. Level 3 trading liabilities consists of the Cokederivative valued at approximately $45.9 million at December 31, 2009.
ARS purchased since the auction rate market began failing in February 2008 have been considered level 3 securities dueto the significant decrease in the volume and level of activity in these markets which has necessitated the use ofsignificant unobservable inputs into our valuations. We classify ARS as securities available for sale or trading securities.As of December 31, 2009, the fair value of ARS purchased is approximately $176.4 million in trading assets and $156.4million in available for sale securities. ARS include municipal bonds, nonmarketable preferred equity securities, andABS collateralized by student loans or trust preferred bank obligations. Under a functioning market, ARS could beremarketed with tight interest rate caps to investors targeting short-term investment securities that repriced generallyevery 7 to 28 days. Unlike other short-term instruments, these ARS do not benefit from backup liquidity lines or lettersof credit and, therefore, as auctions began to fail, investors were left with securities that were more akin to longer-term,20-30 year, illiquid bonds, with the anticipation that auctions will continue to fail in the foreseeable future. Thecombination of materially increased tenors, capped interest rates and general market illiquidity has had a significantimpact on the risk profiles of these securities and has resulted in the use of valuation techniques and models that rely onsignificant inputs that are largely unobservable.
We saw a reduction in our level 3 portfolios during 2009 due to sales, paydowns, transfers of assets from level 3 to level2, and/or continued deterioration in values of certain securities, in particular, private MBS. At December 31, 2009, wehold assets in two SIVs that are in receivership and are carried at a fair value of approximately $126.1 million. Ourholdings of SIV assets decreased by $61.9 million during 2009, due to settlements or partial paydown of approximately$83.6 million, offset by gains of approximately $21.7 million. The gain resulted primarily from the improvement in thecash positions of the SIVs as well as modest improvements in the value of the underlying assets. Our level 3 portfoliohas experienced a significant number and amount of downgrades during this time of economic turmoil. While our level3 municipal securities and equity securities are of high credit quality, certain vintages of private MBS have sufferedfrom deterioration in credit quality leading to downgrades. At December 31, 2009, our private MBS containedapproximately $314 million of 2007 vintage securities available for sale and trading securities and approximately $19million of 1999-2006 vintage securities available for sale and trading securities that had been downgraded tonon-investment grade levels by at least one nationally recognized rating agency. The vast majority of these securitieshad high investment grade ratings at the time of origination or purchase. All of these securities that are classified asavailable for sale are also included as part of our quarterly OTTI evaluation process. See Note 5, “Securities Availablefor Sale,” to the Consolidated Financial Statements for details regarding impairment recognized through earnings onprivate MBS during the year ended December 31, 2009.
Residual and other retained interests classified as securities available for sale or trading securities are valued based oninternal models that incorporate assumptions, such as prepayment speeds, estimated credit losses, and discount rateswhich are generally not observable in the current markets. Generally, we attempt to obtain pricing for our securitiesfrom a third party pricing provider or third party brokers who have experience in valuing certain investments. Thispricing may be used as either direct support for our valuations or used to validate outputs from our own proprietarymodels. We evaluate third party pricing to determine the reasonableness of the information relative to changes in marketdata such as any recent trades we executed, market information received from outside market participants and analysts,and/or changes in the underlying collateral performance. When actual trades are not available to corroborate pricinginformation received, we will use industry standard or proprietary models to estimate fair value, and will considerassumptions such as relevant market indices that correlate to the underlying collateral, prepayment speeds, default rates,loss severity rates, and discount rates.
Due to the continued illiquidity and credit risk of level 3 securities, these market values are highly sensitive toassumption changes and market volatility. In many instances, pricing assumptions for level 3 securities may fall within
45
an acceptable range of values. In those cases, we attempt to consider all information to determine the most appropriateprice within that range. Improvements may be made to our pricing methodologies on an ongoing basis as observable andrelevant information becomes available to us. Sales, trading and settlement activity were scarce in 2009 for many of ourlevel 3 securities; however, we maintained consistency in our pricing methodology and processes, and incorporated anyrelevant changes to the valuation assumptions needed to ensure a supportable fair value for these illiquid securities,based on market conditions at December 31, 2009.
During the year ended December 31, 2009, we recognized through earnings $21.6 million in net losses related to tradingassets and securities available for sale classified as level 3. While we believe we have utilized all pertinent market datain establishing an appropriate fair value for our securities, current market conditions result in wide price ranges used toevaluate market value. While it is difficult to accurately predict the ultimate cash value of these securities, we believethe amount that would be ultimately realized if the securities were held to settlement or maturity will generally begreater than the current fair value of the securities classified as level 3. This assessment is based on the currentperformance of the underlying collateral, which is experiencing elevated losses but generally not to the degree thatcorrelates to current market values, which is pressured downward in this market due to liquidity issues and other broadmacroeconomic conditions. It is reasonably likely that this market volatility will continue as a result of a variety ofexternal factors, including but not limited to economic conditions, the sale of assets under government-sponsoredprograms, the restructuring of SIVs, and third party sales of securities, some of which could be large-scale.
During the year ended December 31, 2009, our level 3 assets were temporarily increased due to the purchase ofapproximately $1.3 billion of Three Pillars CP which was then transferred out of level 3 to level 2 due to increasedmarket trading levels subsequent to our purchases which ultimately reduced our outstanding amount to zero as ofDecember 31, 2009. We continued to see a reduction in other level 3 trading assets and securities available for sale asthe net result of purchases, sales, issuances, settlements, maturities, and paydowns. Included in this net reduction werepurchases of level 3 ARS totaling $234.3 million, of which $86.7 million was classified as trading securities and $147.6million was classified as securities available for sale. No other significant purchases of level 3 trading assets or availablefor sale securities were added. We also redeemed stock in the FHLB of approximately $150.8 million which is classifiedas level 3 available for sale securities. A modest amount of available for sale securities were transferred into level 3consisting of municipal bonds for which no observable activity exists. We also transferred U.S. Treasury and federalagency trading securities out of level 3 consisting of Small Business Administration securities for which the volume andlevel of observable trading activity had significantly decreased in prior quarters, but for which we began to observelimited increases in such activity during the three months ended March 31, 2009 and significant increases in suchactivity during the rest of 2009. This level of activity provided us with sufficient market evidence of pricing, such thatwe did not have to make any significant adjustments to observed pricing, nor was our pricing based on unobservabledata. As such, this portfolio was transferred out of level 3.
Most derivative instruments are level 1 or level 2 instruments, except for the IRLCs, the Visa litigation relatedderivative, discussed below, and The Agreements we entered into related to our investment in Coke common stock,which are level 3 instruments. Because the value of The Agreements is primarily driven by the embedded equity collarson the Coke common shares, a Black-Scholes model is the appropriate valuation model. Most of the assumptions aredirectly observable from the market, such as the per share market price of Coke common stock, interest rates, and thedividend rate on Coke common stock. Volatility is a significant assumption and is impacted both by the unusually largesize of the trade and the long tenor until settlement. The Agreements carry scheduled terms of approximately six and ahalf and seven years from the effective date, and as such, the observable and active options market on Coke does notprovide for any identical or similar instruments. As a result, we receive estimated market values from a marketparticipant who is knowledgeable about Coke equity derivatives and is active in the market. Based on inquiries of themarket participant as to their procedures as well as our own valuation assessment procedures, we have satisfiedourselves that the market participant is using methodologies and assumptions that other market participants would use inarriving at the fair value of The Agreements. At December 31, 2009, The Agreements were in a liability position to usof approximately $45.9 million.
Loans and Loans Held for Sale
Level 3 loans are primarily non-agency residential mortgage loans held for investment or LHFS for which there is littleto no observable trading in either the new issuance or secondary loan markets as either whole loans or as securities.Prior to the non-agency residential loan market disruption, which began during the third quarter of 2007 and continues,we were able to obtain certain observable pricing from either the new issuance or secondary loan market. However, asthe markets deteriorated and certain loans were not actively trading as either whole loans or as securities, we beganemploying the same alternative valuation methodologies used to value level 3 residential MBS to fair value themortgage loans.
During the years ended December 31, 2009 and 2008, we transferred $307.0 million and $656.1 million, respectively, ofloans that were previously designated as held for sale to held for investment, as they were determined to be no longer
46

marketable. Of these amounts, $272.1 million during the year ended December 31, 2009, and $83.9 million during theyear ended December 31, 2008 were LHFS reported at fair value and will continue to be reported at fair value as loansheld for investment.
On May 1, 2008, we acquired 100% of the outstanding common shares of GB&T. We elected to account for $171.6million of the acquired loans, which were classified as nonaccrual, at fair value. Upon acquisition, the loans had a fairvalue of $111.1 million. These loans are primarily commercial real estate loans which do not trade in an activesecondary market, and as such, are considered level 3 instruments. As these loans are all classified as nonperforming,cash proceeds from the sale of the underlying collateral is the expected source of repayment for the majority of theseloans. In order to fair value these loans, we utilized market data, when available, as well as internal assumptions, toderive fair value estimates of the underlying collateral. During the year ended December 31, 2009, we recorded throughearnings a gain of $2.4 million on these loans compared to a loss of $4.2 million on these loans during the year endedDecember 31, 2008. On December 31, 2009, primarily as a result of paydowns, payoffs, and transfers to OREO, theloans had a fair value of $12.2 million.
Other Intangible Assets
We record MSRs at fair value on both a recurring and non-recurring basis. See Note 20, “Fair Value Election andMeasurement,” to the Consolidated Financial Statements for discussion of the valuation methodology, underlyingassumptions and validation procedures performed.
Other Assets/Liabilities, net
During the second quarter of 2009, in connection with our sale of Visa Class B shares, we entered into a derivativecontract whereby the ultimate cash payments received or paid, if any, under the contract are based on the ultimateresolution of litigation involving Visa. The value of the derivative is estimated based on our expectations regarding theultimate resolution of that litigation, which involves a high degree of judgment and subjectivity. As a result, the value ofthe derivative liability was classified as a level 3 instrument. See Note 18, “Reinsurance Arrangements and Guarantees”,to the Consolidated Financial Statements for further discussion.
The fair value methodology and assumptions related to our IRLCs is described in Note 20, “Fair Value Election andMeasurement,” to the Consolidated Financial Statements.
Long-Term Debt
We elect to carry a portion of our publicly-issued, fixed rate debt at fair value. The debt consists of a number ofdifferent issuances that carry coupon rates ranging from 5.00% to 7.75%, resulting in a weighted average rate of 5.93%,and maturities from May 1, 2010 through April 1, 2020, resulting in a weighted average life of 4.9 years. During theyears ended December 31, 2009 and 2008, we recognized net losses of $153.0 million and net gains of $431.7 million,respectively, in noninterest income associated with fair value changes in the debt and related derivatives and tradingsecurities that provide an economic offset to the change in the value of the debt.
Credit spreads widened throughout 2008 and the first quarter of 2009 in connection with the continued deterioration ofthe broader financial markets and a number of failures in the financial services industry. However, credit spreadstightened throughout the remainder of 2009 after the SCAP results were published and additional capital was raised.Further fluctuations in our credit spreads are likely to occur in the future based on instrument specific and broadermarket conditions. To mitigate the prospective impact of spread tightening, we completed the repurchase ofapproximately $386.6 million of our publicly-traded long-term debt during the year ended December 31, 2008. No fairvalue public debt was repurchased during the year ended December 31, 2009.
To mitigate the impact of fair value changes on our debt due to interest rate movement, we generally enter into interestrate swaps; however, at times, we may also purchase fixed rate agency MBS to achieve this offset in interest rates.There were no agency MBS held as of December 31, 2009 for this purpose.
We have historically used quotes from a third party pricing service as our primary source for valuation and have deemedsuch quotes as reasonable estimates of fair value by utilizing broker quotes and/or institutional trading data, whenavailable, as corroborating evidence. Secondary trading activity had begun to increase in the first quarter of 2009 andwe observed continued increases in the volume and level of activity in the secondary markets through the fourth quarterof 2009. In addition, we observed issuances in the primary markets of similar securities. Because we had a sufficientamount of observable market pricing upon which to base our valuation, we utilized that data as the primary source forvaluing the fixed rate debt. Given that observable market data was used, we transferred our fixed rate debt out of level 3as of the end of the second quarter.
47
Overall, the financial impact of the level 3 financial instruments did not have a significant impact on our liquidity or capital.We acquired $3.5 billion of certain ABS from affiliates during the fourth quarter of 2007 using our existing liquidityposition, and since purchasing the securities, we have received approximately $2.5 billion in cash consideration frompaydowns, settlements, sales, and maturities of these securities. Some fair value assets are pledged for corporate borrowingsor other liquidity purposes. Most of these arrangements provide for advances to be made based on the market value and notthe principal balance of the assets, and therefore whether or not we have elected fair value accounting treatment does notimpact our liquidity. If the fair value of assets posted as collateral declines, we will be required to post more collateral underour borrowing arrangements which could negatively impact our liquidity position on an overall basis. For purposes ofcomputing regulatory capital, mark to market adjustments related to our own creditworthiness for debt accounted for at fairvalue are excluded from regulatory capital.
INVESTMENT IN COMMON SHARES OF THE COCA-COLA COMPANY
Background
We have owned common shares of Coke since 1919, when one of our predecessor institutions participated in theunderwriting of Coke’s IPO and received common shares of Coke in lieu of underwriting fees. These shares have grown invalue over the past 90 years and have been classified as available for sale securities, with unrealized gains, net of tax,recorded as a component of shareholders’ equity. Because of the low accounting cost basis of these shares, we haveaccumulated significant unrealized gains in shareholders’ equity. As of December 31, 2009, as a result of the transactionsundertaken in 2008 discussed herein, we owned 30 million Coke shares with an accounting cost basis of $69,295 and a fairmarket value of approximately $1.7 billion.
We commenced a comprehensive balance sheet review initiative in early 2007 in an effort to improve liquidity and capitalefficiency. As part of this initiative, we began to formally evaluate the capital efficiency of our holdings of Coke commonshares, as we were prohibited from including the market value of our investment in Coke common shares in Tier 1 capital inaccordance with Federal Reserve capital adequacy rules.
Executed Multi-Step Strategy
As we reported in connection with our financial results for the quarter ended June 30, 2007, we sold 4.5 million Cokecommon shares, or approximately 9% of our holdings at that time, in an open market sale. At that time, we also announcedpublicly that we were evaluating various strategies to address our remaining Coke common shares.
In the second and third quarters of 2008, we completed the following three-part strategy with respect to our remaining43.6 million common shares of Coke: (i) a market sale of 10 million shares, (ii) a charitable contribution of approximately3.6 million shares to the SunTrust Foundation and (iii) the execution of The Agreements on 30 million shares. Our primaryobjective in executing these transactions was to optimize the benefits we obtained from our long-term holding of this asset,including the capital treatment by bank regulators.
I. Market Sale
During the second quarter of 2008, we sold 10 million Coke common shares in the market. These sales, whichresulted in an increase of approximately $345.0 million to Tier 1 capital, generated approximately $549.0 millionin net cash proceeds and an after-tax gain of approximately $345.0 million that was recorded in our financialresults for the quarter ended June 30, 2008. This transaction resulted in foregone annual dividend income ofapproximately $15.0 million, after-tax, and gave rise to a current tax liability with a marginal rate of just over 37%.
II. Contribution to the SunTrust Foundation
In July 2008, we contributed approximately 3.6 million Coke common shares to the SunTrust Foundation, whichwas reflected as a contribution expense of $183.4 million in our financial results for the quarter endedSeptember 30, 2008. As the gain from this contribution is non-taxable, the only impact to our net income was therelease of the deferred tax liability of approximately $65.8 million (net of valuation allowance). This contributionincreased Tier 1 capital in the third quarter by approximately $65.8 million. This gain and resultant increase to Tier1 capital were reflected in our third quarter results, as we had not made any commitments or entered into any othertransactions as of June 30, 2008 that would have required us to record this contribution in the second quarter. Thiscontribution will result in foregone annual dividend income of approximately $5 million, after-tax. We expect thiscontribution to act as an endowment for the SunTrust Foundation to make grants to charities operating within ourfootprint for years to come and reduce our ongoing charitable contribution expense. This transaction was treated asa discrete item for income tax provision purposes and significantly lowered the effective tax rate for the thirdquarter of 2008.
48

III. The Agreements
The final piece of the strategy related to the remaining 30 million Coke common shares and was executed in July2008. We entered into The Agreements, which were comprised of two variable forward agreements and shareforward agreements effective July 15, 2008 with a major, unaffiliated financial institution (the “Counterparty”)collectively covering our 30 million Coke shares. Under The Agreements, we must deliver to the Counterparty atsettlement of the variable forward agreements either a variable number of Coke common shares or a cash paymentin lieu of such shares. The Counterparty is obligated to settle The Agreements for no less than approximately$38.67 per share, or approximately $1.16 billion in the aggregate (the “Minimum Proceeds”). The share forwardagreements give us the right, but not the obligation, to sell to the Counterparty, at prevailing market prices at thetime of settlement, any of the 30 million Coke common shares that are not delivered to the Counterparty insettlement of the variable forward agreements. The Agreements effectively ensure that we will be able to sell our30 million Coke common shares at a price no less than approximately $38.67 per share, while permitting us toparticipate in future appreciation in the value of the Coke common shares up to approximately $66.02 per share andapproximately $65.72 per share, under each of the respective Agreements.
During the terms of The Agreements, and until we sell the 30 million Coke common shares, we generally willcontinue to receive dividends as declared and paid by Coke and will have the right to vote such shares. However,the amounts payable to us under The Agreements will be adjusted if actual dividends are not equal to amountsexpected at the inception of the derivative.
Contemporaneously with entering into The Agreements, the Counterparty invested in senior unsecured promissorynotes issued by SunTrust Bank and SunTrust Banks, Inc. (collectively, the “Notes”) in a private placement in anaggregate principal amount equal to the Minimum Proceeds. The Notes carry stated maturities of approximatelyten years from the effective date and bear interest at one-month LIBOR plus a fixed spread. The Counterpartypledged the Notes to us and we pledged the 30 million Coke common shares to the Counterparty, securing eachentity’s respective obligations under The Agreements. The pledged Coke common shares are held by anindependent third party custodian and the Counterparty is prohibited under The Agreements from selling, pledging,assigning or otherwise using the pledged Coke common shares in its business.
We generally may not prepay the Notes. The interest rate on the Notes will be reset upon or after the settlement ofThe Agreements, either through a remarketing process or based upon dealer quotations. In the event of anunsuccessful remarketing of the Notes, we would be required to collateralize the Notes and the maturity of theNotes may accelerate to the first anniversary of the settlement of The Agreements. However, we presently believethat it is substantially certain that the Notes will be successfully remarketed.
The Agreements carry scheduled settlement terms of approximately seven years from the effective date. However,we have the option to terminate The Agreements earlier with the approval of the Federal Reserve. The Agreementsmay also terminate earlier upon certain events of default, extraordinary events regarding Coke and other typicaltermination events. Upon such early termination, there could be exit costs or gains, such as certain breakage feesincluding an interest rate make-whole amount, associated with both The Agreements and the Notes. Such costs orgains may be material but cannot be determined at the present time due to the unlikely occurrence of such eventsand the number of variables that are unknown. However, the payment of such costs, if any, will not result in usreceiving less than the Minimum Proceeds from The Agreements. We expect to sell all of the Coke common sharesupon settlement of The Agreements, either under the terms of The Agreements or in another market transaction.See Note 17, “Derivative Financial Instruments”, to the Consolidated Financial Statements for additionaldiscussion of the transactions.
The Federal Reserve determined that we may include in Tier 1 capital, as of the effective date of The Agreements,an amount equal to the Minimum Proceeds minus the deferred tax liability associated with the ultimate sale of the30 million Coke common shares. Accordingly, The Agreements resulted in an increase in Tier 1 capital during thethird quarter of approximately $728 million.
49

DEPOSITS
Table 14 – Composition of Average Deposits
Year Ended December 31 Percent of Total
(Dollars in millions) 2009 2008 2007 2009 2008 2007
Noninterest-bearing $24,249.2 $20,949.0 $21,677.2 20.3 % 18.0 % 18.1 %NOW accounts 23,600.6 21,080.7 20,042.8 19.8 18.2 16.7Money market accounts 31,863.5 26,564.8 22,676.7 26.7 22.9 18.9Savings 3,664.2 3,770.9 4,608.7 3.1 3.2 3.8Consumer time 16,718.1 16,770.2 16,941.3 14.0 14.5 14.2Other time 13,068.4 12,197.2 12,073.5 11.0 10.5 10.1
Total consumer and commercialdeposits 113,164.0 101,332.8 98,020.2 94.9 87.3 81.8
Brokered deposits 5,648.3 10,493.2 16,091.9 4.7 9.0 13.4Foreign deposits 433.9 4,250.3 5,764.5 0.4 3.7 4.8
Total deposits $119,246.2 $116,076.3 $119,876.6 100.0 % 100.0 % 100.0 %
Average consumer and commercial deposits increased during 2009 by $11.8 billion, or 11.7%, compared to 2008 with thegrowth concentrated in noninterest bearing DDA, NOW, and money market accounts. The increase was partially offset bydeclines in savings and consumer time account balances. During 2009, deposits increased and our deposit mix improved as aresult of our marketing efforts, pricing discipline with respect to interest-bearing deposits, improving operational execution,as well as an industry-wide flight to the safety of insured deposits.
Consumer and commercial deposit growth is one of our key initiatives, as we focus on deposit gathering opportunities acrossall lines of business throughout the geographic footprint. All 16 regions within which we operate exhibited deposit growthduring 2009. Deposit growth was accomplished through a judicious use of competitive rates in select products and selectgeographies. Other initiatives to attract deposits included innovative product and features offerings, enhanced programs andinitiatives like regional pricing, new and retention-oriented money offers, more customer-targeted offers, and advancedanalytics that leverage product offerings with customer segmentation. We continued to leverage the “Live Solid. BankSolid.” branding and marketing campaign to improve our visibility in the marketplace. It is designed to speak to what isimportant to clients in the current environment and to inspire customer loyalty and capitalize on some of the opportunitiespresented by the new banking landscape. Notwithstanding these deposit generation successes, some of the deposit growth isdue to seasonality and the economic environment. Deposit balances are expected to decline modestly in the first quarterrelated to seasonality, and further over time as the economy improves. Average brokered and foreign deposits decreased by$8.7 billion, or 58.8%, during 2009 compared to 2008. The decrease was due to our ability to grow deposits and, in turn,reduce our reliance upon wholesale funding sources. As of December 31, 2009, securities pledges as collateral for depositstotaled $9.0 billion.
In November 2008, the FDIC created the TLGP to strengthen confidence and encourage liquidity in the banking system byguaranteeing newly issued senior unsecured debt of banks, thrifts, and certain holding companies via its DGP, and byproviding full coverage of non-interest bearing deposit transaction accounts and capped NOW accounts, regardless of dollaramount via its TAGP. As of October 31, 2009, banks are no longer eligible to issue additional debt under the TLGP. We haveopted not to participate in the TAGP beyond December 31, 2009.
OTHER SHORT-TERM BORROWINGS AND LONG-TERM DEBT
Other short-term borrowings decreased $3.1 billion, or 60.1%, from December 31, 2008 to $2.1 billion at December 31,2009. During November and December of 2008, we purchased $2.5 billion in three-month funding under the TAF in supportof the Federal Reserve’s initiative. During the first quarter of 2009, our core deposit growth allowed us to discontinue the useof this source of short-term funding which was the primary cause for the overall decrease during the year.
Long-term debt decreased $9.3 billion, or 34.8%, from December 31, 2008 to $17.5 billion at December 31, 2009. Thechange in long-term debt was primarily the result of the repayment of $7.4 billion of FHLB advances, $3.4 billion of whichwere at fair value. Repayment was assisted by the growth during the year of our core deposit portfolio. Additionally, werepurchased approximately $500 million of Parent Company junior subordinated notes and approximately $300 million ofParent Company debt matured during 2009. In the first quarter of 2009, we issued $576.0 million of unsecured seniorfloating rate notes maturing in 2012 under the terms of the TLGP.
50

CAPITAL RESOURCES
Table 15 – Capital Ratios
As of December 31
(Dollars in millions) 2009 2008 2007
Tier 1 capital1 $18,068.8 $17,613.7 $11,424.9Total capital 22,895.2 22,743.4 16,994.1Risk-weighted assets 139,379.5 162,046.4 164,931.9
Tier 1 capital1 $18,068.8 $17,613.7 $11,424.9Less:
Qualifying trust preferred securities 2,356.4 2,847.3 2,133.4Preferred stock 4,917.3 5,221.7 500.0Allowable minority interest 103.6 101.8 105.0
Tier 1 common equity $10,691.5 $9,442.9 $8,686.5
Risk-based ratios:Tier 1 common equity 7.67 % 5.83 % 5.27 %Tier 1 capital 12.96 10.87 6.93Total capital 16.43 14.04 10.30Tier 1 leverage ratio 10.90 10.45 6.90
Total shareholders’ equity to assets 12.94 11.90 10.12
1Tier 1 capital includes trust preferred obligations of $2.4 billion at the end of 2009, $2.8 billion at the end of 2008, and $2.1 billion at the end of 2007. Tier 1 capitalalso includes qualifying minority interests in consolidated subsidiaries of $103.6 million at the end of 2009, $101.8 million at the end of 2008, and $105.0 million atthe end of 2007.
Our primary regulator, the Federal Reserve, measures capital adequacy within a framework that makes capital requirementssensitive to the risk profiles of individual banking companies. The guidelines weigh assets and off-balance sheet riskexposures (risk weighted assets) according to predefined classifications, creating a base from which to compare capitallevels. Tier 1 capital primarily includes realized equity and qualified preferred instruments, less purchase accountingintangibles such as goodwill and core deposit intangibles. Total capital consists of Tier 1 capital and Tier 2 capital, whichincludes qualifying portions of subordinated debt, allowance for loan losses up to a maximum of 1.25% of risk weightedassets, and 45% of the unrealized gain on equity securities.
Both the Company and the Bank are subject to a minimum Tier 1 capital and total capital ratios of 4% and 8%, respectively,of risk weighted assets. To be considered “well-capitalized,” ratios of 6% and 10%, respectively, are required. Additionally,the Company and the Bank are subject to Tier 1 leverage ratio requirements, which measures Tier 1 capital against averageassets. The minimum and well-capitalized ratios are 3% and 5%, respectively.
The Tier 1 common equity, Tier 1 capital, and total capital ratios improved from 5.83%, 10.87%, and 14.04%, respectively,at December 31, 2008 to 7.67%, 12.96%, and 16.43%, respectively, at December 31, 2009. The primary drivers of theincrease were the successful completion of our capital plan during the second quarter of 2009 and a $22.7 billion, or 14.0%,reduction in risk-weighted assets. The reduction in risk-weighted assets was due primarily to the $13.3 billion decline inloans held for investment. Also contributing to the reduction was a reduction in unfunded loan commitments and letters ofcredit during the year.
The Board of Governors of the Federal Reserve System, the Federal Reserve Banks, the FDIC and the Office of theComptroller of the Currency completed, in May 2009, the SCAP review of the potential capital needs through the end of2010 of the nineteen largest U.S. bank holding companies. The Federal Reserve advised us that based on the SCAP review,we presently have and are projected to continue to have Tier 1 capital well in excess of the amount required to be wellcapitalized through the forecast period under both the baseline scenario and the more adverse-than-expected scenario (“moreadverse”) as prepared by the U.S. Treasury. The SCAP’s more adverse scenario represented a hypothetical scenario thatinvolves a recession that is longer and more severe than consensus expectations and results in higher than expected creditlosses, but is not a forecast of expected losses or revenues. The Federal Reserve advised us in May 2009, based on the moreadverse scenario, that we needed to adjust the composition of our Tier 1 capital by increasing the Tier 1 common equityportion by $2.2 billion. The additional common equity was necessary to maintain Tier 1 common equity at 4% of riskweighted assets under the more adverse scenario, as specified by a new regulatory standard that was introduced as part of thestress test. They also intend the additional common equity to serve as a buffer against higher losses than generally expectedand to allow such bank holding companies to remain well capitalized and able to lend to creditworthy borrowers should suchlosses materialize. Our 2009 actual credit losses were significantly less than the projections utilized in the SCAP process.
As a result of the Federal Reserve establishing this capital target, we successfully completed a capital plan during the secondquarter of 2009 that adjusted the composition of our Tier 1 capital by increasing the portion that is composed of Tier 1common equity. The capital plan consisted of various transactions that generated an additional $2.3 billion in Tier 1 common
51

equity; $2.1 billion of which was raised in the second quarter. The transactions utilized to increase our Tier 1 common equityconsisted of the issuance of common stock, gains realized upon the purchase of certain of our preferred stock and hybrid debtsecurities, and the sale of Visa Class B shares. The common stock offering raised $1.8 billion in Tier 1 common equity, thepurchase of hybrid debt securities created an addition to Tier 1 common equity of $120.8 million, and the gain in connectionwith sale of the Visa Class B shares resulted in an addition to Tier 1 common equity of $70.1 million. While increasing ourtotal and Tier 1 capital, the results of the common stock offering also diluted our common share count and related book valueper share. The 142 million new shares issued in the common offering significantly contributed to the $13.45 decrease fromprior year end, to $35.29, in our book value per common share and the $6.10 decrease from prior year end in our tangiblebook value per common share to $22.59 at December 31, 2009.
We declared and paid common dividends totaling $82.6 million during the year ended December 31, 2009, or $0.22 percommon share, compared to $1.0 billion, or $2.85 per common share, during 2008. In addition, we declared dividendspayable during the years ended December 31, 2009 and 2008 of $14.1 million and $22.3 million, respectively, on our SeriesA preferred stock. Further, during the years ended December 31, 2009 and 2008, we declared dividends payable of $242.7million and $22.8 million, respectively, to the U.S. Treasury on the Series C and D Preferred Stock issued to the U.S.Treasury. During the year, we reduced the common share dividend to $0.01 per share, per quarter where it remained as of themost recent common share dividend declaration in December 2009. It is not likely that we will increase our dividend until wehave returned to profitability and obtained the consent of our applicable regulators as further described below.
In connection with the issuances of the Series A Preferred Stock of SunTrust Banks, Inc., the Fixed to Floating Rate NormalPreferred Purchase Securities of SunTrust Preferred Capital I, the 6.10% Enhanced Trust Preferred Securities of SunTrustCapital VIII, and the 7.875% Trust Preferred securities of SunTrust Capital IX (collectively, the “Issued Securities”), weentered into RCCs. The RCCs limit our ability to repay, redeem or repurchase the Issued Securities (or certain relatedsecurities). We executed each of the RCC in favor of the holders of certain debt securities, who are initially the holders of our6% Subordinated Notes due 2026. The RCCs are more fully described in Current Reports on Form 8-K filed onSeptember 12, 2006, November 6, 2006, December 6, 2006, and March 4, 2008.
In connection with the issuance of the Series C and D Preferred Stock of SunTrust Banks, Inc. we agreed to certain termsaffecting repurchase, redemption, and repayment of the preferred stock and restriction on payment of common stockdividends, among other terms. We are subject to certain restrictions on our ability to increase the dividend as a result ofparticipating in the U.S. Treasury’s CPP. Generally, we may not pay a regular quarterly cash dividend more than $0.77 pershare of common stock prior to November 14, 2011, unless either (i) we have redeemed the Series C and Series D PreferredStock, (ii) the U.S. Treasury has transferred the Series C and Series D Preferred Stock to a third party, or (iii) the U.S.Treasury consents to the payment of such dividends in excess of such amount. Additionally, if we increase our quarterlydividend above $0.54 per share prior to the tenth anniversary of our participation in the CPP, then the exercise price and thenumber of shares to be issued upon exercise of the warrants issued in connection with our participation in the CPP will beproportionately adjusted. The amount of such adjustment will be determined by a formula and depends in part on the extentto which we raise our dividend. The formulas are contained in the warrant agreements. There also exists limits on the abilityof the Bank to pay dividends to SunTrust Banks, Inc. (the “Parent Company”). Substantially all of our retained earnings areundistributed earnings of the Bank, which are restricted by various regulations administered by federal and state bankregulatory authorities. There was no capacity for payment of cash dividends to the Parent Company under these regulationsat December 31, 2009.
Included with the issuance of the Series C and D preferred stock was issuance of ten-year warrants to the Treasury topurchase approximately 11.9 million and 6.0 million shares of our common stock at initial exercise prices of $44.15 and$33.70. The preferred stock and related warrants were issued at a total discount of approximately $132 million, which will beaccreted into U.S. Treasury preferred dividend expense using the effective yield method over a five year period from eachrespective issuance date. The terms of the warrants as well as the restrictions related to the issuance of the preferred stock ismore fully described in Current Reports on Form 8-K filed on November 17, 2008 and January 2, 2009.
ENTERPRISE RISK MANAGEMENT
In the normal course of business, we are exposed to various risks. To manage the major risks that we face and to providereasonable assurance that key business objectives will be achieved, we have established an enterprise risk governanceprocess and the SunTrust Enterprise Risk Program. Moreover, we have policies and various risk management processesdesigned to effectively identify, monitor and manage risk.
We continually refine and enhance our risk management policies, processes and procedures to maintain effective riskmanagement and governance, including identification, measurement, monitoring, control, mitigation and reporting of allmaterial risks. Over the last several years, we have enhanced risk measurement applications and systems capabilities thatprovide management information on whether we are being appropriately compensated for the risk profile we have adopted.We balance our strategic goals, including revenue and profitability objectives, with the risks associated with achieving ourgoals. Effective risk management is an important element supporting our business decision making.
52

Corporate Risk Management’s focus is on synthesizing, assessing, reporting and mitigating the full set of risks at theenterprise level, and providing senior management with a holistic picture of the organization’s risk profile. We haveimplemented an enterprise risk management framework that has improved our ability to manage our aggregate risk profile.At the core of the framework is our risk vision and risk mission.
Risk Vision: To deliver sophisticated risk management capabilities that are consistent with those oftop-tier financial institutions and that support the needs of SunTrust business units.
Risk Mission: To measure, monitor and manage risk throughout SunTrust to ensure that risk at thetransaction, portfolio and institution levels is viewed consistently in order to optimize risk-adjustedreturn decision making.
The Board of Directors is wholly responsible for oversight of our corporate risk governance process. The Risk Committee ofthe Board assists the Board of Directors in executing this responsibility.
The CRO reports to the Chief Executive Officer and is responsible for the oversight of the Corporate Risk Managementorganization as well as the risk governance processes. The CRO provides overall leadership, vision and direction for ourenterprise risk management framework. In addition, the CRO provides regular risk assessments to the Risk Committee of theBoard and to the full Board of Directors, and provides other information to Executive Management and the Board, asrequested.
The risk governance framework incorporates a variety of senior management risk-related committees. These committees areresponsible for ensuring effective risk measurement and management in their respective areas of authority. These committeesinclude: CRC, ALCO, PRAC, and the SunTrust Enterprise Risk Program Steering Committee. The CRC is chaired by theCRO and supports the CRO in measuring and managing our aggregate risk profile. The CRC consists of various seniorexecutives and meets on a monthly basis.
Organizationally, we measure and oversee risk according to the three traditional risk disciplines of credit risk, market risk(including liquidity risk) and operational risk (including compliance risk). Credit risk programs are overseen by the ChiefWholesale Credit Officer and the Chief Retail Credit Officer. Market risk programs are overseen by the Chief Market RiskOfficer. Operational risk programs are overseen by the Chief Operational Risk Officer. The three risk disciplines areoverseen on a consolidated basis under our enterprise risk management framework, which also takes into consideration legaland reputation risk factors.
The SunTrust Enterprise Risk Program continues to ensure that the approach and plans for risk management are aligned tothe vision and mission of Corporate Risk Management. In addition, the SunTrust Enterprise Risk Program’s goal is to ensureour future compliance with the Basel II Capital Accord. Key objectives of the SunTrust Enterprise Risk Program includeincorporating risk management principles that encompass our values and standards and that are designed to guide risk-takingactivity, maximizing performance through the balance of risk and reward and leveraging initiatives driven by regulatoryrequirements to deliver capabilities to better measure and manage risk.
Credit Risk Management
Credit risk refers to the potential for economic loss arising from the failure of clients to meet their contractual agreements onall credit instruments, including on-balance sheet exposures from loans and leases, investment securities, contingentexposures from unfunded commitments, letters of credit, credit derivatives, and counterparty risk under derivative products.As credit risk is an essential component of many of the products and services we provide to our clients, the ability toaccurately measure and manage credit risk is integral to maintain both the long-run profitability of our lines of business andour capital adequacy.
The Credit Risk Management group manages and monitors extensions of credit risk through initial underwriting processesand periodic reviews which then maintain underwriting standards in accordance with credit policies and procedures. TheCorporate Risk Review unit conducts independent risk reviews to ensure active compliance with all policies and procedures.Credit Risk Management periodically reviews our lines of business to monitor asset quality trends and the appropriateness ofcredit policies. In addition, total borrower exposure limits are established and concentration risk is monitored. Credit risk ispartially mitigated through purchase of credit loss protection via third party insurance and use of credit derivatives such ascredit default swaps.
Borrower/counterparty (obligor) risk and facility risk are evaluated using our risk rating methodology, which has beenimplemented in all lines of business. We use various risk models in the estimation of expected and unexpected losses. Thesemodels incorporate both internal and external default and loss experience. To the extent possible, we collect internal data toensure the validity, reliability, and accuracy of our risk models used in default and loss estimation.
53
We have made a commitment to maintain and enhance comprehensive credit systems in order to meet business requirementsand comply with evolving regulatory standards. As part of a continuous improvement process, Credit Risk Managementevaluates potential enhancements to our risk measurement and management tools, implementing them as appropriate alongwith amended credit policies and procedures.
Operational Risk Management
We face ongoing and emerging risks and regulations related to the activities that surround the delivery of banking andfinancial products. Coupled with external influences such as market conditions, fraudulent activities, disasters, security risks,country risk, and legal risk, the potential for operational and reputational loss has increased significantly.
We believe that effective management of operational risk – defined as the risk of loss resulting from inadequate or failedinternal processes, people and systems, or from external events – plays a major role in both the level and the stability of theprofitability of the institution. Our Operational Risk Management function oversees an enterprise-wide framework intendedto identify, assess, control, quantify, monitor, and report on operational risks company wide. These efforts support our goalsin seeking to minimize operational losses and strengthen our performance by optimizing operational capital allocation.
Operational Risk Management is overseen by our Chief Operational Risk Officer, who reports directly to the CRO. Thecorporate governance structure also includes a risk manager and support staff embedded within each line of business andcorporate function. These risk managers also report indirectly to the Chief Operational Risk Officer and are responsible forexecution of the Operational Risk Management program within their areas.
Market Risk Management
Market risk refers to potential losses arising from changes in interest rates, foreign exchange rates, equity prices, commodityprices, and other relevant market rates or prices. Interest rate risk, defined as the exposure of net interest income and MVE toadverse movements in interest rates, is our primary market risk, and mainly arises from the structure of the balance sheet. Weare also exposed to market risk in our trading activities, Coke common stock, MSRs, loan warehouse and pipeline, and debtcarried at fair value. The ALCO meets regularly and is responsible for reviewing our open positions and establishing policiesto monitor and limit exposure to market risk. The policies established by ALCO are reviewed and approved by our Board.
Market Risk from Non-Trading Activities
The primary goal of interest rate risk management is to control exposure to interest rate risk, both within policy limitsapproved by the Board and within narrower guidelines established by ALCO. These limits and guidelines reflect ourtolerance for interest rate risk over both short-term and long-term horizons.
The major sources of our non-trading interest rate risk are timing differences in the maturity and repricing characteristics ofassets and liabilities, changes in the shape of the yield curve, and the potential exercise of explicit or embedded options. Wemeasure these risks and their impact by identifying and quantifying exposures through the use of sophisticated simulationand valuation models.
One of the primary methods that we use to quantify and manage interest rate risk is simulation analysis, which is used tomodel net interest income from assets, liabilities, and derivative positions under various interest rate scenarios and balancesheet structures. This analysis measures the sensitivity of net interest income over a two year time horizon. Key assumptionsin the simulation analysis (and in the valuation analysis discussed below) relate to the behavior of interest rates and spreads,the changes in product balances and the behavior of loan and deposit clients in different rate environments. This analysisincorporates several assumptions, the most material of which relate to the repricing characteristics and balance fluctuationsof deposits with indeterminate or non-contractual maturities.
As the future path of interest rates cannot be known in advance, we use simulation analysis to project net interest incomeunder various interest rate scenarios including implied forward and deliberately extreme and perhaps unlikely scenarios. Theanalyses may include rapid and gradual ramping of interest rates, rate shocks, basis risk analysis, and yield curve twists. Eachanalysis incorporates what management believes to be the most appropriate assumptions about client behavior in an interestrate scenario. Specific strategies are also analyzed to determine their impact on net interest income levels and sensitivities.
54

The sensitivity analysis included below is measured as a percentage change in net interest income due to an instantaneous100 basis point move in benchmark interest rates. Estimated changes set forth below are dependent upon materialassumptions such as those previously discussed. The net interest income profile reflects a fairly neutral interest ratesensitivity position with respect to an instantaneous 100 basis point change in rates.
Economic Perspective
Rate Change(Basis Points)
Estimated % Change inNet Interest Income Over 12 Months
December 31, 2009 December 31, 2008
+100 0.0% 3.5%-100 0.1% (0.1%)
The recognition of interest rate sensitivity from an economic perspective (above) is different from a financial reportingperspective (below) due to certain interest rate swaps that are used as economic hedges for fixed rate debt. The above profileincludes the recognition of the net interest payments from these swaps, while the profile below does not include the netinterest payments. The swaps are accounted for as trading assets and therefore, the benefit to income due to a decline in shortterm interest rates will be recognized as a gain in the fair value of the swaps and will be recorded as an increase in tradingaccount profits/(losses) and commissions from a financial reporting perspective.
Financial Reporting Perspective
Rate Change(Basis Points)
Estimated % Change inNet Interest Income Over 12 Months
December 31, 2009 December 31, 2008
+100 0.5% 4.2%-100 (0.3%) (1.3%)
The difference from December 31, 2008 to December 31, 2009 seen above in both the economic and financial reportingperspectives related to a 100 basis point shock is primarily due to the significant decline in our higher cost fixed rate fundingand brokered deposits year over year as well as a reduction in floating rate assets.
We also perform valuation analysis, which is used for discerning levels of risk present in the balance sheet and derivativepositions that might not be taken into account in the net interest income simulation analysis. Whereas net interest incomesimulation highlights exposures over a relatively short time horizon, valuation analysis incorporates all cash flows over theestimated remaining life of all balance sheet and derivative positions. The valuation of the balance sheet, at a point in time, isdefined as the discounted present value of asset cash flows and derivative cash flows minus the discounted value of liabilitycash flows, the net of which is referred to as MVE. The sensitivity of MVE to changes in the level of interest rates is ameasure of the longer-term repricing risk and options risk embedded in the balance sheet. Similar to the net interest incomesimulation, MVE uses instantaneous changes in rates. MVE values only the current balance sheet and does not incorporatethe growth assumptions that are used in the net interest income simulation model. As with the net interest income simulationmodel, assumptions about the timing and variability of balance sheet cash flows are critical in the MVE analysis. Particularlyimportant are the assumptions driving prepayments and the expected changes in balances and pricing of the indeterminatedeposit portfolios.
As of December 31, 2009, the MVE profile indicates modest changes with respect to an instantaneous 100 basis point changein rates.
Rate Shock(Basis Points) Estimated % Change in MVE
December 31, 2009 December 31, 2008
+100 (4.2%) (4.2%)-100 2.3% 1.8%
While an instantaneous and severe shift in interest rates is used in this analysis to provide an estimate of exposure under anextremely adverse scenario, we believe that a gradual shift in interest rates would have a much more modest impact. SinceMVE measures the discounted present value of cash flows over the estimated lives of instruments, the change in MVE doesnot directly correlate to the degree that earnings would be impacted over a shorter time horizon (i.e., the current fiscal year).Further, MVE does not take into account factors such as future balance sheet growth, changes in product mix, changes in
55
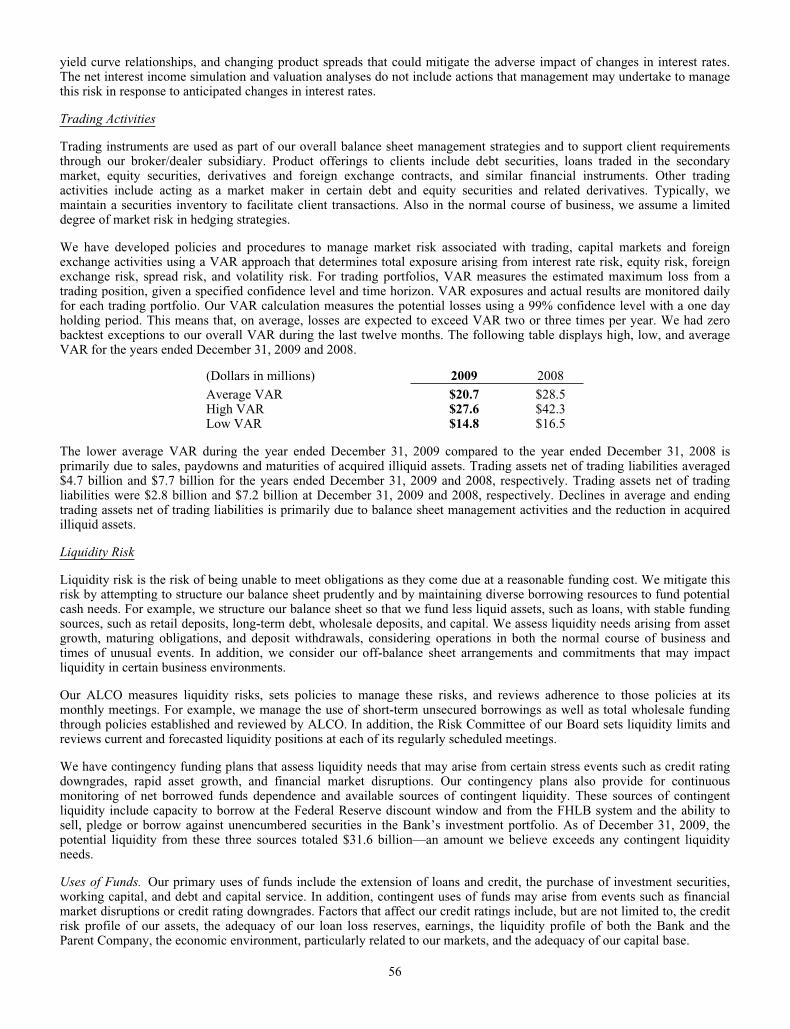
yield curve relationships, and changing product spreads that could mitigate the adverse impact of changes in interest rates.The net interest income simulation and valuation analyses do not include actions that management may undertake to managethis risk in response to anticipated changes in interest rates.
Trading Activities
Trading instruments are used as part of our overall balance sheet management strategies and to support client requirementsthrough our broker/dealer subsidiary. Product offerings to clients include debt securities, loans traded in the secondarymarket, equity securities, derivatives and foreign exchange contracts, and similar financial instruments. Other tradingactivities include acting as a market maker in certain debt and equity securities and related derivatives. Typically, wemaintain a securities inventory to facilitate client transactions. Also in the normal course of business, we assume a limiteddegree of market risk in hedging strategies.
We have developed policies and procedures to manage market risk associated with trading, capital markets and foreignexchange activities using a VAR approach that determines total exposure arising from interest rate risk, equity risk, foreignexchange risk, spread risk, and volatility risk. For trading portfolios, VAR measures the estimated maximum loss from atrading position, given a specified confidence level and time horizon. VAR exposures and actual results are monitored dailyfor each trading portfolio. Our VAR calculation measures the potential losses using a 99% confidence level with a one dayholding period. This means that, on average, losses are expected to exceed VAR two or three times per year. We had zerobacktest exceptions to our overall VAR during the last twelve months. The following table displays high, low, and averageVAR for the years ended December 31, 2009 and 2008.
(Dollars in millions) 2009 2008
Average VAR $20.7 $28.5High VAR $27.6 $42.3Low VAR $14.8 $16.5
The lower average VAR during the year ended December 31, 2009 compared to the year ended December 31, 2008 isprimarily due to sales, paydowns and maturities of acquired illiquid assets. Trading assets net of trading liabilities averaged$4.7 billion and $7.7 billion for the years ended December 31, 2009 and 2008, respectively. Trading assets net of tradingliabilities were $2.8 billion and $7.2 billion at December 31, 2009 and 2008, respectively. Declines in average and endingtrading assets net of trading liabilities is primarily due to balance sheet management activities and the reduction in acquiredilliquid assets.
Liquidity Risk
Liquidity risk is the risk of being unable to meet obligations as they come due at a reasonable funding cost. We mitigate thisrisk by attempting to structure our balance sheet prudently and by maintaining diverse borrowing resources to fund potentialcash needs. For example, we structure our balance sheet so that we fund less liquid assets, such as loans, with stable fundingsources, such as retail deposits, long-term debt, wholesale deposits, and capital. We assess liquidity needs arising from assetgrowth, maturing obligations, and deposit withdrawals, considering operations in both the normal course of business andtimes of unusual events. In addition, we consider our off-balance sheet arrangements and commitments that may impactliquidity in certain business environments.
Our ALCO measures liquidity risks, sets policies to manage these risks, and reviews adherence to those policies at itsmonthly meetings. For example, we manage the use of short-term unsecured borrowings as well as total wholesale fundingthrough policies established and reviewed by ALCO. In addition, the Risk Committee of our Board sets liquidity limits andreviews current and forecasted liquidity positions at each of its regularly scheduled meetings.
We have contingency funding plans that assess liquidity needs that may arise from certain stress events such as credit ratingdowngrades, rapid asset growth, and financial market disruptions. Our contingency plans also provide for continuousmonitoring of net borrowed funds dependence and available sources of contingent liquidity. These sources of contingentliquidity include capacity to borrow at the Federal Reserve discount window and from the FHLB system and the ability tosell, pledge or borrow against unencumbered securities in the Bank’s investment portfolio. As of December 31, 2009, thepotential liquidity from these three sources totaled $31.6 billion—an amount we believe exceeds any contingent liquidityneeds.
Uses of Funds. Our primary uses of funds include the extension of loans and credit, the purchase of investment securities,working capital, and debt and capital service. In addition, contingent uses of funds may arise from events such as financialmarket disruptions or credit rating downgrades. Factors that affect our credit ratings include, but are not limited to, the creditrisk profile of our assets, the adequacy of our loan loss reserves, earnings, the liquidity profile of both the Bank and theParent Company, the economic environment, particularly related to our markets, and the adequacy of our capital base.
56

The Bank and the Parent Company experienced credit rating downgrades from Moody’s, S&P, and Fitch during the first halfof 2009. As of December 31, 2009, the senior, long-term debt ratings for the Bank were A2, A- and A- from Moody’s, S&Pand Fitch, respectively. The comparable senior, long-term debt ratings for the Parent Company as of December 31, 2009were Baa1, BBB+ and A-. The Bank’s corresponding short-term ratings were P-1, A-2, and F1 (Moody’s, S&P and Fitch),while the Parent Company’s short-term ratings were P-2, A-2 and F1, respectively.
S&P’s April downgrade of the Bank’s short-term credit rating from A-1 to A-2 materially impacted some of our businessactivities. The activities most affected were two off-balance sheet businesses: our ABCP conduit, Three Pillars, and ourVRDO remarketing operation, both of which depend upon the support of investors who primarily purchase obligations ratedA-1 or equivalent. The Bank and the Parent Company have purchased certain amounts of Three Pillars’ overnight CP atestimated market rates, on a discretionary and non-contractual basis (See Note 11, “Certain Transfers of Financial Assets,Mortgage Servicing Rights and Variable Interest Entities”, in the Consolidated Financial Statements for additionalinformation). We did not own any of the outstanding Three Pillars’ CP as of December 31, 2009.
We conduct remarketing of municipal securities known as VRDOs. The terms of the VRDOs allow investors to put or tenderthe securities for repayment prior to maturity. The Bank backs most of these securities with letters of credit that provideliquidity in the event of this early repayment. After the S&P downgrade in April, a substantial portion of our VRDOinvestors tendered their bonds for repayment, which required the Bank to provide liquidity by funding the letters of creditbacking the tendered VRDOs. The Bank’s contingency funding plans anticipated this potential use of liquidity, and the Banksecured ample liquidity for the VRDO program as the funded loans came on to our balance sheet. As the year came to aclose, this use of Bank liquidity declined as investor demand for remarketed VRDOs increased and VRDO clients were ableto find alternative sources of funding.
The Bank and the Parent Company borrow in the money markets using instruments such as Fed funds, Eurodollars, or CP.Lenders in these unsecured instruments extend credit lines to borrowers based in large part upon the borrower’s credit ratingsfrom the three large nationally recognized statistical ratings organizations. After the S&P downgrade in April, the Bankexperienced a decrease in its available credit lines which reduced its depth of access and slightly increased its cost ofborrowing in these instruments. The Bank’s conservative liquidity profile and prudent liquidity management greatlymitigated the impact of the downgrade on its daily money markets funding activities and costs. During the fourth quarter, theParent Company had no CP outstanding and the Bank was a net lender into short-term money markets.
On February 1, 2010, S&P downgraded our senior, long-term debt Bank and Parent Company ratings from A- and BBB+,respectively, to BBB+ and BBB, respectively. Our short-term ratings remained unchanged at A-2. S&P cited expectations ofcontinued stress in and high exposure to residential mortgages, especially in Florida, as the primary factor in its decision todowngrade our long-term ratings. However, concurrent with the downgrade, S&P changed the outlook on our credit ratingsto “stable” noting our strong franchise, good liquidity and funding profile, and commercial loan portfolio performance thatwas in line with their expectations. Our business activities have not been materially impacted as a result of this recentdowngrade by S&P.
Sources of Funds. Our primary sources of funds include a large, stable retail deposit base. Core deposits, primarily gatheredfrom our retail branch network, are our largest and most cost-effective source of funding. During 2009, the Bank experiencedstrong core deposit growth. Core deposits totaled $116.3 billion as of December 31, 2009, up from $105.3 billion as ofDecember 31, 2008. The Bank used core deposit growth to replace short-term wholesale funding, contributing to the Bank’sstrong liquidity position.
We also maintain access to a diversified base of wholesale funding sources. These uncommitted sources include Fed fundspurchased from other banks, securities sold under agreements to repurchase, negotiable certificates of deposit, offshoredeposits, FHLB advances, global bank notes, and CP. Aggregate wholesale funding totaled $28.2 billion as of December 31,2009 reduced from $44.0 billion as of December 31, 2008. Net short-term unsecured borrowings, which includes wholesaledomestic and foreign deposits and Fed funds purchased, totaled $8.9 billion as of December 31, 2009, down from $14.2billion as of December 31, 2008.
An additional source of wholesale liquidity is our access to the capital markets. The Parent Company maintains an SEC shelfregistration statement from which it may issue senior or subordinated notes, and various capital securities such as common orpreferred stock. The current shelf allows the Parent Company to issue up to $3 billion of such securities. The Bank maintainsa Global Bank Note program under which it may issue senior or subordinated debt with various terms. As of December 31,2009, the Bank had capacity to issue $30.9 billion of notes under the Global Bank Note program. Borrowings under theseprograms are designed to appeal primarily to domestic and international institutional investors. Institutional investor demandfor these securities is dependent upon numerous factors, including but not limited to our credit ratings and investorperception of financial market conditions and the health of the banking sector. Our capacity under these programs refers toauthorization granted by our Board, and does not refer to a commitment to purchase by any investor.
57

Parent Company Liquidity. We measure Parent Company liquidity by comparing sources of liquidity from short-term assets,such as unencumbered and other investment securities and cash, relative to short-term liabilities, which include overnightsweep funds, seasoned long-term debt, and CP. As of December 31, 2009, the Parent Company had $2.6 billion in suchsources compared to short-term debt of $1.6 billion. As of December 31, 2009, the Parent Company also had approximately$5 billion in U.S. Treasury securities that were purchased in the fourth quarter of 2009 in anticipation of repayment of TARP.We also manage the Parent Company’s liquidity by structuring its maturity schedule to minimize the amount of debtmaturing within a short period of time. Approximately $300 million of Parent Company debt matured in October 2009 and$300 million is scheduled to mature during 2010. Much of the Parent Company’s liabilities are long-term in nature, comingfrom the proceeds of our capital securities and long-term senior and subordinated notes.
The primary uses of Parent Company liquidity include debt service, dividends on capital instruments, the periodic purchaseof investment securities, and loans to our subsidiaries. We believe the Parent Company holds ample cash to satisfy theseworking capital needs. We fund corporate dividends primarily with dividends from our banking subsidiary. We are subject toboth state and federal banking regulations that limit our ability to pay common stock dividends in certain circumstances. Inthe context of the recent economic recession and credit market turmoil, we reduced our quarterly common stock dividend.Effective for the quarterly dividend paid in September 2009, the common stock dividend was $0.01 per share. It is not likelythat we will increase our quarterly dividend until we have returned to profitability and obtained the consent from ourapplicable regulators.
Recent Market and Regulatory Developments. Financial market conditions remained under a state of stress during much of2009. As a result, the federal banking regulatory agencies reviewed the nineteen largest U.S. banks pursuant to the SCAP,which is discussed in greater detail in the “Capital Resources” section of this MD&A.
Pursuant to the SCAP results, we executed several transactions as part of a formalized capital plan approved by the FederalReserve that increased Tier 1 common equity by $2.3 billion and incidentally raised liquidity at both the Parent Companyand the Bank. The transactions included the sale of $1.8 billion of common stock, a $750 million cash tender for certainhybrid debt securities, and the sale of various corporate assets. The sale of additional shares of common stock, through both“at-the-market” and marketed offerings, provided substantial additional long-term liquidity to the Parent Company. Thepurchase of hybrid debt securities used approximately $525.0 million of Parent Company liquidity since these hybridsecurities were obligations of the Parent Company. The net effect of these capital actions was to increase Parent Companyliquidity by approximately $1.3 billion. Moreover, the aforementioned asset sales also generated $0.1 billion of liquidity atthe Bank.
Other Liquidity Considerations. As detailed in Table 16, we had an aggregate potential obligation of $72.1 billion to ourclients in unused lines of credit at December 31, 2009. Commitments to extend credit are arrangements to lend to clients whohave complied with predetermined contractual obligations. We also had $9.0 billion in letters of credit as of December 31,2009, most of which are standby letters of credit, which require that we provide funding if certain future events occur. Ourlines and letters of credit have declined since December 31, 2008 due to our decision to reduce exposure to certain higherrisk areas, as well as due to clients’ decision not to renew their lines and letters of credit as a result of their decreased needfor these facilities as they pay down their debt and reduce their need for working capital. Approximately $5.5 billion of theseletters as of December 31, 2009 supported VRDOs, as previously discussed. In addition, at December 31, 2009, lines ofcredit totaling approximately $3.8 billion supported CP issued by Three Pillars to investors not affiliated with us or ThreePillars. No amounts are currently outstanding related to Three Pillars’ lines of credit. For more information about ThreePillars, see Note 11, “Certain Transfers of Financial Assets, Mortgage Servicing Rights and Variable Interest Entities,” to theConsolidated Financial Statements.
In the third quarter of 2009, the FDIC, in response to the need to replenish DIF balances that declined as a result of recentbank failures, announced details of a plan to restore DIF balances. The restoration plan, as subsequently approved, requiredall FDIC insured banks to prepay their risk-based assessments for the years 2010, 2011, and 2012. The assessments, usuallydue quarterly, were instead required to be estimated for the three future years and paid prior to December 31, 2009. Inconjunction with the adoption of this rule, the FDIC also approved a three-basis point increase in assessment rates effectiveon January 1, 2011. Our estimate of three future years of assessments under this restoration plan was $924.8 million with theestimated assessment for 2010 calculated at current rates. We paid that assessment to the FDIC on December 29, 2009 andconcurrently recorded a prepaid asset in that amount within other assets in the Consolidated Balance Sheets. We anticipatefunding any differences between our prepayment and actual amounts due each quarter using our existing available liquidity.
Certain provisions of long-term debt agreements and the lines of credit prevent us from creating liens on, disposing of, orissuing (except to related parties) voting stock of subsidiaries. Further, there are restrictions on mergers, consolidations,certain leases, sales or transfers of assets, and minimum shareholders’ equity ratios. As of December 31, 2009, we were andexpect to remain in compliance with all covenants and provisions of these debt agreements.
As of December 31, 2009, our cumulative UTBs amounted to $160.6 million. Interest related to UTBs was $39.3 million asof December 31, 2009. These UTBs represent the difference between tax positions taken or expected to be taken in our tax
58

returns and the benefits recognized and measured in accordance with the relevant accounting guidance for income taxes. TheUTBs are based on various tax positions in several jurisdictions and, if taxes related to these positions are ultimately paid, thepayments would be made from our normal, operating cash flows, likely over multiple years.
Table 16 – Unfunded Lending Commitments
(Dollars in millions)
December 312009
December 312008
Unused lines of creditCommercial $35,027.6 $37,167.1Mortgage commitments1 12,227.1 17,010.4Home equity lines 15,207.9 18,293.8Commercial real estate 1,922.4 3,652.0Commercial paper conduit 3,787.1 6,060.3Credit card 3,945.7 4,167.8
Total unused lines of credit $72,117.8 $86,351.4
Letters of creditFinancial standby $8,778.6 $13,622.8Performance standby 139.7 220.2Commercial 82.7 99.0
Total letters of credit $9,001.0 $13,942.0
1Includes $3.3 billion and $7.2 billion in IRLCs accounted for as derivatives as of December 31, 2009 and December 31,2008, respectively.
Other Market Risk
Other sources of market risk include the risk associated with holding residential and commercial mortgage loans prior toselling them into the secondary market, commitments to clients to make mortgage loans that will be sold to the secondarymarket, and our investment in MSRs. We manage the risks associated with the residential and commercial mortgage loansclassified as held for sale (i.e., the warehouse) and our IRLCs on residential loans intended for sale. The warehouses andIRLCs consist primarily of fixed and adjustable rate single family residential and commercial real estate loans. The riskassociated with the warehouses and IRLCs is the potential change in interest rates between the time the customer locks in therate on the anticipated loan and the time the loan is sold on the secondary market, which is typically 60-150 days.
We manage interest rate risk predominantly with interest rate swaps, futures, and forward sale agreements, where thechanges in value of the instruments substantially offset the changes in value of the warehouse and the IRLCs. The IRLCs onresidential mortgage loans intended for sale are classified as free standing derivative financial instruments and are notdesignated as hedge accounting relationships.
MSRs are the present value of future net cash flows that are expected to be received from the mortgage servicing portfolio.The value of MSRs is highly dependent upon the assumed prepayment speed of the mortgage servicing portfolio which isdriven by the level of certain key interest rates, primarily the 30-year current coupon par mortgage rate known as the parmortgage rate. Future expected net cash flows from servicing a loan in the mortgage servicing portfolio would not be realizedif the loan pays off earlier than anticipated. Given the current economic environment, the level of prepayments has slowed.
We historically have not actively hedged MSRs, but have managed the market risk through our overall asset/liabilitymanagement process with consideration to the natural counter-cyclicality of servicing and production that occurs as interestrates rise and fall over time with the economic cycle as well as with securities available for sale. However, as of January 1,2009, we designated the 2008 MSRs vintage and all future MSRs production at fair value. In addition, as of January 1, 2010,we designated at fair value the remaining MSR portfolio being carried at LOCOM. Upon designating the remaining MSRs atfair value, we recognized a cumulative effect adjustment increase in retained earnings, net of taxes, of $88.5 million. Thedecision to designate the portfolio at fair value, key economic assumptions, and the sensitivity of the current fair value of theMSRs as of December 31, 2009 and 2008 is discussed in greater detail in Note 11, “Certain Transfers of Financial Assets,Mortgage Servicing Rights and Variable Interest Entities”, to the Consolidated Financial Statements.
Relative to the fair value portion of our retained MSRs, we designated $187.8 million at January 1, 2009 and added $681.8million of new production during 2009. We recorded an increase in fair value of $65.9 million for the year endedDecember 31, 2009, including “decay” resulting from the realization of expected monthly net servicing cash flows. TheMSRs being carried at fair value total $935.6 million as of December 31, 2009 and are managed within established risk limits
59

and are monitored as part of various governance processes. We recorded losses in the Consolidated Statements of Income/(Loss) related to fair value MSRs of $21.9 million for year ended December 31, 2009, inclusive of the mark to marketadjustments on the related hedges.
Relative to the LOCOM portion of our retained MSRs, an impairment recovery gain was recorded in the ConsolidatedStatements of Income/(Loss) of $199.2 million during 2009. As of December 31, 2009, we held $603.8 million of LOCOMMSRs with a fair value of $748.5 million. As discussed above, this class of MSRs was designated at fair value as ofJanuary 1, 2010.
We also have market risk from capital stock we hold in the FHLB of Atlanta and Cincinnati and from capital stock we holdin the Federal Reserve Bank. In order to be an FHLB member, we are required to purchase capital stock in the FHLB. Inexchange, members take advantage of competitively priced advances as a wholesale funding source and access grants andlow-cost loans for affordable housing and community-development projects, amongst other benefits. As of December 31,2009, we held a total of $343.3 million of capital stock in the FHLB. During 2009, we reduced our capital stock holdings inthe FHLB by $149.9 million. In order to become a member of the Federal Reserve System, regulations require that we hold acertain amount of capital stock as a percentage of the Bank’s capital. During 2009, we held $360.4 million of FederalReserve Bank capital stock.
For a detailed overview regarding actions taken to address the risk from changes in equity prices associated with ourinvestment in Coke common stock, see “Investment in Common Shares of the Coca-Cola Company,” in this MD&A. Wealso hold, as of December 31, 2009, a total of approximately $207.7 million of private equity investments that include directinvestments and limited partnerships. We hold these investments as long-term investments and make additional contributionsbased on our contractual commitments but have decided to limit investments into new private equity investments.
Impairment charges could occur if deteriorating conditions in the market persist, including, but not limited to, goodwill andother intangibles impairment charges and increased charges with respect to OREO.
OFF-BALANCE SHEET ARRANGEMENTS
See discussion of off-balance sheet arrangements in Note 11, “Certain Transfers of Financial Assets, Mortgage ServicingRights and Variable Interest Entities” and Note 18, “Reinsurance Arrangements and Guarantees”, to the ConsolidatedFinancial Statements.
CONTRACTUAL COMMITMENTS
In the normal course of business, we enter into certain contractual obligations, including obligations to make future paymentson debt and lease arrangements, contractual commitments for capital expenditures, and service contracts. Table 17summarizes our significant contractual obligations at December 31, 2009, except for pension and other postretirement benefitplans, included in Note 16, “Employee Benefit Plans,” to the Consolidated Financial Statements.
Table 17 – Contractual Commitments
As of December 31, 2009
(Dollars in millions) 1 year or less 1-3 years 3-5 years After 5 years Total
Time deposit maturities1 $23,686 $4,940 $2,744 $79 $31,449Short-term borrowings1 5,365 - - - 5,365Long-term debt1 2,141 7,530 657 7,147 17,475Operating lease obligations 208 372 322 664 1,566Capital lease obligations1 1 3 2 9 15Purchase obligations2 153 239 228 529 1,149
Total $31,554 $13,084 $3,953 $8,428 $57,019
1Amounts do not include accrued interest.2Includes contracts with a minimum annual payment of $5 million.
As of December 31, 2009, our cumulative UTBs amounted to $160.6 million. Interest related to UTBs was $39.3 million asof December 31, 2009. We are under continuous examination by various tax authorities. We are unable to make a reasonableestimate of the periods of cash settlement because it is not possible to reasonably predict, with respect to periods for whichthe statutes of limitations are open, the amount of tax and interest (if any) that might be assessed by a tax authority or thetiming of an assessment or payment. It is also not possible to reasonably predict whether or not the applicable statutes oflimitations might expire without us being examined by any particular tax authority.
60

CRITICAL ACCOUNTING POLICIES
Our significant accounting policies are described in detail in Note 1, “Significant Accounting Policies,” to the ConsolidatedFinancial Statements and are integral to understanding MD&A. We have identified certain accounting policies as beingcritical because (1) they require our judgment about matters that are highly uncertain and (2) different estimates that could bereasonably applied would result in materially different assessments with respect to ascertaining the valuation of assets,liabilities, commitments, and contingencies. A variety of factors could affect the ultimate value that is obtained either whenearning income, recognizing an expense, recovering an asset, valuing an asset or liability, or reducing a liability. Ouraccounting and reporting policies are in accordance with U.S. GAAP, and they conform to general practices within thefinancial services industry. We have established detailed policies and control procedures that are intended to ensure thesecritical accounting estimates are well controlled and applied consistently from period to period. In addition, the policies andprocedures are intended to ensure that the process for changing methodologies occurs in an appropriate manner. Thefollowing is a description of our current critical accounting policies.
Allowance for Loan and Lease Losses
The ALLL represents our estimate of probable losses inherent in the existing loan portfolio. The ALLL is increased by theprovision for credit losses and reduced by loans charged off, net of recoveries. The ALLL is determined based on our reviewand evaluation of larger loans that meet our definition of impairment and the current risk characteristics of pools ofhomogeneous loans (i.e., loans having similar characteristics) within the loan portfolio and our assessment of internal andexternal influences on credit quality that are not fully reflected in the historical loss or risk-rating data.
Larger nonaccrual loans and certain consumer, commercial, and commercial real estate loans whose terms have beenmodified in a TDR, are individually evaluated to determine the amount of specific allowance required using the mostprobable source of repayment, including the present value of the loan’s expected future cash flows, the fair value of theunderlying collateral less costs of disposition, or the loan’s estimated market value. In these measurements, we useassumptions and methodologies that are relevant to estimating the level of impaired and unrealized losses in the portfolio. Tothe extent that the data supporting such assumptions has limitations, our judgment and experience play a key role inenhancing the specific ALLL estimates. Key judgments used in determining the allowance for credit losses include internalrisk ratings, market and collateral values, discount rates, loss rates, and our view of current economic conditions.
General allowances are established for loans and leases grouped into pools that have similar characteristics, including smallerbalance homogeneous loans. The ALLL Committee estimates probable losses by evaluating quantitative and qualitativefactors, including net charge-off trends, internal risk ratings, loss forecasts, collateral values, geographic location, borrowerFICO scores, delinquency rates, nonperforming and restructured loans, origination channel, product mix, underwritingpractices, industry conditions, and economic trends.
Our financial results are affected by the changes in and the absolute level of the ALLL. This process involves our analysis ofcomplex internal and external variables, and it requires that we exercise judgment to estimate an appropriate ALLL. As aresult of the uncertainty associated with this subjectivity, we cannot assure the precision of the amount reserved, should weexperience sizeable loan or lease losses in any particular period. For example, changes in the financial condition of individualborrowers, economic conditions, or the condition of various markets in which collateral may be sold could require us tosignificantly decrease or increase the level of the ALLL. Such an adjustment could materially affect net income as a result ofthe change in provision for credit losses. During 2008 and 2009, we experienced increases in delinquencies and net charge-offs in residential real estate loans due to the deterioration of the housing market. The ALLL considered these marketconditions in deriving the estimated ALLL; however, given the continued economic difficulties, the ultimate amount of losscould vary from that estimate. For additional discussion of the ALLL see the “Provision for Credit Losses”, “Allowance forLoan and Lease Losses”, and “Nonperforming Assets” sections in this MD&A.
Estimates of Fair Value
Certain of our assets and liabilities are measured at fair value on a recurring basis. The extent to which we use fair value on arecurring basis was significantly expanded upon the election to begin to carry certain financial assets and liabilities at fairvalue beginning in 2007. Examples of recurring uses of fair value include derivative instruments, available for sale andtrading securities, certain held for investment and held for sale loans, certain issuances of long-term debt, certain classes ofthe MSR asset, and residual interests from Company-sponsored securitizations. We also measure certain assets at fair valueon a non-recurring basis either when such assets are carried at the LOCOM, to evaluate assets for impairment, or fordisclosure purposes. Examples of these non-recurring uses of fair value include certain LHFS and MSRs accounted for at theLOCOM, OREO, goodwill, intangible assets, nonmarketable equity securities, and long-lived assets. Depending on thenature of the asset or liability, we use various valuation techniques and assumptions when estimating fair value.
61

Fair value is the price that could be received to sell an asset or paid to transfer a liability in an orderly transaction betweenmarket participants. Estimating fair value requires that we make a number of significant judgments. Where observablemarket prices for identical assets or liabilities are not available, we identify what we believe to be similar assets or liabilities.If observable market prices are unavailable or impracticable to obtain for any such similar assets or liabilities, then fair valueis estimated using modeling techniques, such as discounted cash flow analyses. These modeling techniques incorporate ourassessments regarding assumptions that market participants would use in pricing the asset or the liability, including market-based assumptions, such as interest rates, as well as assumptions about the risks inherent in a particular valuation technique,the effect of a restriction on the sale or use of an asset, market liquidity, and the risk of nonperformance. In certain cases, ourassessments with respect to assumptions that market participants would make may be inherently difficult to determine andthe use of different assumptions could result in material changes to these fair value measurements. Various processes andcontrols have been adopted to determine that appropriate methodologies, techniques and assumptions are used in thedevelopment of fair value estimates. These processes include independent price verification, model validation, andcorroborating prices from third-parties when possible. The use of significant, unobservable inputs in our models is describedin Note 20, “Fair Value Election and Measurement,” to the Consolidated Financial Statements.
In certain instances, we use discount rates in our determination of the fair value of certain assets and liabilities such asretirement and other postretirement benefit obligations, MSRs, and certain financial instruments. Discount rates used arethose considered to be commensurate with the risks involved. A change in these discount rates could increase or decrease thevalues of those assets and liabilities. The fair value of MSRs is based on discounted cash flow analyses. We providedisclosure of the key economic assumptions used to measure MSRs and residual interests and a sensitivity analysis toadverse changes to these assumptions in Note 11, “Certain Transfers of Financial Assets, Mortgage Servicing Rights andVariable Interest Entities,” to the Consolidated Financial Statements. A detailed discussion of key variables, including thediscount rate, used in the determination of retirement and other postretirement obligations is contained in the “PensionAccounting” section below.
In estimating the fair values for investment securities and most derivative financial instruments, we believe that observablemarket prices are the best evidence of exit price. If such market prices are not available on the exact securities that we own,fair values are based on the market prices of similar instruments, third-party broker quotes or are estimated using industry-standard or proprietary models whose inputs may be unobservable. The distressed market conditions associated with thiseconomic recession have impacted our ability to obtain market pricing data for certain of our investments. Even when marketpricing has been available, the reduced trading activity resulting from current market conditions has challenged theobservability of these quotations. When fair values are estimated based on internal models, we will consider relevant marketindices that correlate to the underlying collateral, along with assumptions such as liquidity discounts, interest rates,prepayment speeds, default rates, loss severity rates, and discount rates.
The fair values of loans held for investment recorded at fair value and LHFS are based on observable current market prices inthe secondary loan market in which loans trade, as either whole loans or as ABS. When securities prices are obtained in thesecondary loan market, we will translate these prices into whole loan prices by incorporating adjustments for estimated creditenhancement costs, loan servicing fees, and various other transformation costs, when material. The fair value of a loan isimpacted by the nature of the asset and the market liquidity. When estimating fair value for loans that do not trade in anactive market, we will make assumptions about prepayment speeds, default rates, loss severity rates, and liquidity discounts.Absent comparable current market data, we believe that the fair value derived from these various approaches is a reasonableapproximation of the prices that we would receive upon sale of the loans.
The fair values of OREO and other repossessed assets are typically determined based on recent appraisals by third parties andother market information, less estimated selling costs. Estimates of fair value are also required when performing animpairment analysis of goodwill, intangible assets and long-lived assets. For long-lived assets, including intangible assetssubject to amortization, an impairment loss is recognized if the carrying amount of the asset is not recoverable and exceedsits fair value. In determining the fair value, management uses models which require assumptions about growth rates, the lifeof the asset, and/or the market value of the assets. We test long-lived assets for impairment whenever events or changes incircumstances indicate that our carrying amount may not be recoverable.
Goodwill
In 2008, our reporting units were comprised of Retail, Commercial, Commercial Real Estate, Mortgage, Corporate andInvestment Banking, Wealth and Investment Management, and Affordable Housing. We changed our business segments in2009. Among other changes, we combined the Consumer Lending business unit with the Mortgage reporting unit andrenamed the combined unit as Household Lending; previously Consumer Lending was included in the Retail reporting unit.See Note 22, “Business Segment Reporting” to the Consolidated Financial Statements for a discussion regarding the changesto our reportable segments.
62
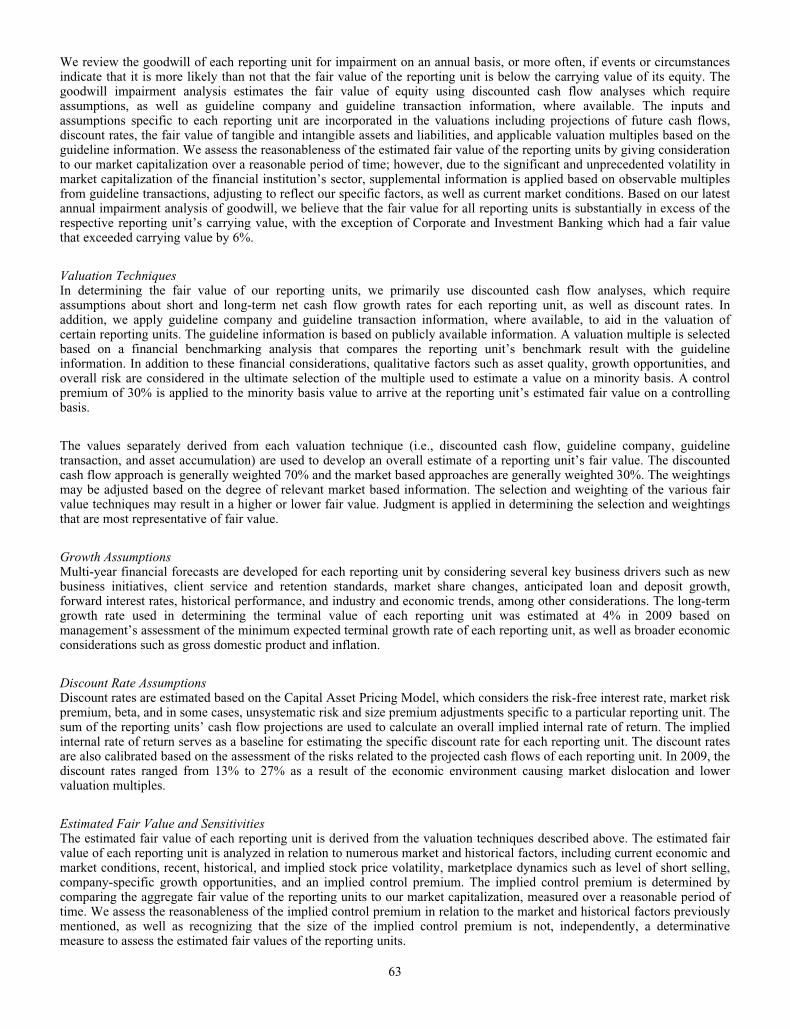
We review the goodwill of each reporting unit for impairment on an annual basis, or more often, if events or circumstancesindicate that it is more likely than not that the fair value of the reporting unit is below the carrying value of its equity. Thegoodwill impairment analysis estimates the fair value of equity using discounted cash flow analyses which requireassumptions, as well as guideline company and guideline transaction information, where available. The inputs andassumptions specific to each reporting unit are incorporated in the valuations including projections of future cash flows,discount rates, the fair value of tangible and intangible assets and liabilities, and applicable valuation multiples based on theguideline information. We assess the reasonableness of the estimated fair value of the reporting units by giving considerationto our market capitalization over a reasonable period of time; however, due to the significant and unprecedented volatility inmarket capitalization of the financial institution’s sector, supplemental information is applied based on observable multiplesfrom guideline transactions, adjusting to reflect our specific factors, as well as current market conditions. Based on our latestannual impairment analysis of goodwill, we believe that the fair value for all reporting units is substantially in excess of therespective reporting unit’s carrying value, with the exception of Corporate and Investment Banking which had a fair valuethat exceeded carrying value by 6%.
Valuation TechniquesIn determining the fair value of our reporting units, we primarily use discounted cash flow analyses, which requireassumptions about short and long-term net cash flow growth rates for each reporting unit, as well as discount rates. Inaddition, we apply guideline company and guideline transaction information, where available, to aid in the valuation ofcertain reporting units. The guideline information is based on publicly available information. A valuation multiple is selectedbased on a financial benchmarking analysis that compares the reporting unit’s benchmark result with the guidelineinformation. In addition to these financial considerations, qualitative factors such as asset quality, growth opportunities, andoverall risk are considered in the ultimate selection of the multiple used to estimate a value on a minority basis. A controlpremium of 30% is applied to the minority basis value to arrive at the reporting unit’s estimated fair value on a controllingbasis.
The values separately derived from each valuation technique (i.e., discounted cash flow, guideline company, guidelinetransaction, and asset accumulation) are used to develop an overall estimate of a reporting unit’s fair value. The discountedcash flow approach is generally weighted 70% and the market based approaches are generally weighted 30%. The weightingsmay be adjusted based on the degree of relevant market based information. The selection and weighting of the various fairvalue techniques may result in a higher or lower fair value. Judgment is applied in determining the selection and weightingsthat are most representative of fair value.
Growth AssumptionsMulti-year financial forecasts are developed for each reporting unit by considering several key business drivers such as newbusiness initiatives, client service and retention standards, market share changes, anticipated loan and deposit growth,forward interest rates, historical performance, and industry and economic trends, among other considerations. The long-termgrowth rate used in determining the terminal value of each reporting unit was estimated at 4% in 2009 based onmanagement’s assessment of the minimum expected terminal growth rate of each reporting unit, as well as broader economicconsiderations such as gross domestic product and inflation.
Discount Rate AssumptionsDiscount rates are estimated based on the Capital Asset Pricing Model, which considers the risk-free interest rate, market riskpremium, beta, and in some cases, unsystematic risk and size premium adjustments specific to a particular reporting unit. Thesum of the reporting units’ cash flow projections are used to calculate an overall implied internal rate of return. The impliedinternal rate of return serves as a baseline for estimating the specific discount rate for each reporting unit. The discount ratesare also calibrated based on the assessment of the risks related to the projected cash flows of each reporting unit. In 2009, thediscount rates ranged from 13% to 27% as a result of the economic environment causing market dislocation and lowervaluation multiples.
Estimated Fair Value and SensitivitiesThe estimated fair value of each reporting unit is derived from the valuation techniques described above. The estimated fairvalue of each reporting unit is analyzed in relation to numerous market and historical factors, including current economic andmarket conditions, recent, historical, and implied stock price volatility, marketplace dynamics such as level of short selling,company-specific growth opportunities, and an implied control premium. The implied control premium is determined bycomparing the aggregate fair value of the reporting units to our market capitalization, measured over a reasonable period oftime. We assess the reasonableness of the implied control premium in relation to the market and historical factors previouslymentioned, as well as recognizing that the size of the implied control premium is not, independently, a determinativemeasure to assess the estimated fair values of the reporting units.
63

Economic and market conditions can vary significantly which may cause increased volatility in a company’s stock price,resulting in a temporary decline in market capitalization. In those circumstances, current market capitalization may not be anaccurate indication of a market participant’s estimate of entity-specific value measured over a reasonable period of time. Webelieve that this volatility may be tied to market sentiment pertaining to the overall banking sector and concerns regardingdilution of common shareholders, rather than the result of company-specific adjustments to cash flows, guideline multiples,or asset values which would have influenced the fair value of reporting units. As a result, the use of market capitalization hasbecome a less relevant measure to assess the reasonableness of the aggregate value of the reporting units. Therefore, wesupplement the market capitalization information with other observable market information that provided benchmarkvaluation multiples from transactions over the last year and a half. These multiples allow us to estimate an aggregatepurchase value and implied premium based on current market conditions and the estimated net asset fair value for SunTrust.
The estimated fair value of the reporting unit is highly sensitive to changes in these estimates and assumptions; therefore, insome instances changes in these assumptions could impact whether the fair value of a reporting unit is greater than itscarrying value. We perform sensitivity analyses around these assumptions in order to assess the reasonableness of theassumptions and the resulting estimated fair values. Ultimately, future potential changes in these assumptions may impact theestimated fair value of a reporting unit and cause the fair value of the reporting unit to be below its carrying value.Additionally, a reporting unit’s carrying value of equity could change based on market conditions and the risk profile ofthose reporting units.
In those situations where the carrying value of equity exceeds the estimated fair value, an additional goodwill impairmentevaluation is performed which involves calculating the implied fair value of the reporting unit’s goodwill. The implied fairvalue of goodwill is determined in the same manner as goodwill is recognized in a business combination. The fair value ofthe reporting unit’s assets and liabilities, including previously unrecognized intangible assets, is individually determined.Significant judgment and estimates are involved in estimating the fair value of the assets and liabilities of the reporting unit.The excess fair value of the reporting unit over the fair value of the reporting unit’s net assets is the implied goodwill.
The value of the implied goodwill is highly sensitive to the estimated fair value of the reporting unit’s net assets. The fairvalue of the reporting unit’s net assets is estimated using a variety of valuation techniques including the following:
• recent data observed in the market, including similar assets• cash flow modeling based on projected cash flows and market discount rates• market indices• estimated net realizable value of the underlying collateral• price indications from independent third parties
Observable market information is utilized to the extent available and relevant. The estimated fair values reflectmanagement’s assumptions regarding how a market participant would value the net assets and includes appropriate credit,liquidity, and market risk premiums that are indicative of the current environment.
If the implied fair value of the goodwill for the reporting unit exceeds the carrying value of the goodwill for the respectivereporting unit, no goodwill impairment is recorded. If the carrying amount of a reporting unit’s goodwill exceeds the impliedgoodwill, an impairment loss is recognized in an amount equal to the excess. Changes in the estimated fair value of theindividual assets and liabilities may result in a different amount of implied goodwill, and ultimately the amount of goodwillimpairment, if any. Sensitivity analysis is performed to assess the potential ranges of implied goodwill.
The size of the implied goodwill is significantly affected by the estimated fair value of loans. The estimated fair value of aloan portfolio is based on an exit price, and the assumptions used are intended to approximate those that a market participantwould use in valuing the loans in an orderly transaction, including a market liquidity discount. The significant market riskpremium that is a consequence of distressed market conditions is a significant contributor to valuation discounts associatedwith loans. Future changes in the fair value of a reporting unit’s net assets could result in future goodwill impairment. Forexample, to the extent that market liquidity returns and the fair value of the individual assets of a reporting unit increases at afaster rate than the fair value of the reporting unit as a whole, that may cause the implied goodwill of a reporting unit to belower than the carrying value of goodwill, resulting in goodwill impairment.
Income Taxes
We are subject to the income tax laws of the various jurisdictions where we conduct business and estimate income taxexpense based on amounts expected to be owed to these various tax jurisdictions. The estimated income tax expense/(benefit)is reported in the Consolidated Statements of Income/(Loss). The evaluation pertaining to the tax expense and related taxasset and liability balances involves a high degree of judgment and subjectivity around the ultimate measurement andresolution of these matters.
64
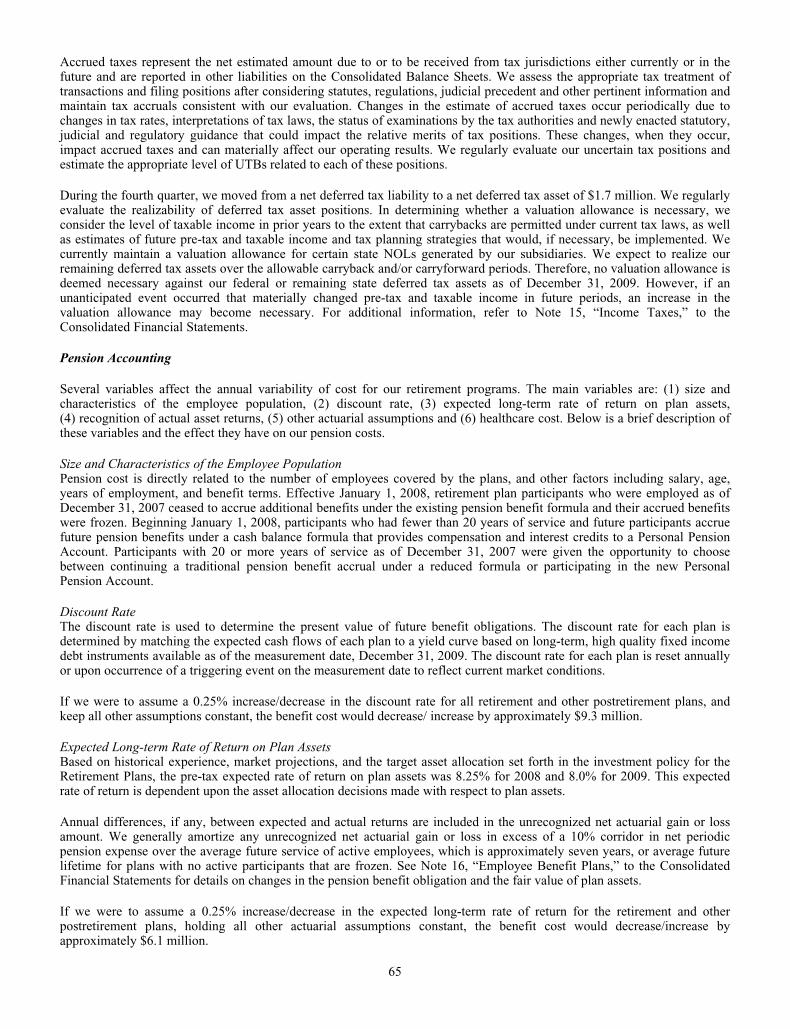
Accrued taxes represent the net estimated amount due to or to be received from tax jurisdictions either currently or in thefuture and are reported in other liabilities on the Consolidated Balance Sheets. We assess the appropriate tax treatment oftransactions and filing positions after considering statutes, regulations, judicial precedent and other pertinent information andmaintain tax accruals consistent with our evaluation. Changes in the estimate of accrued taxes occur periodically due tochanges in tax rates, interpretations of tax laws, the status of examinations by the tax authorities and newly enacted statutory,judicial and regulatory guidance that could impact the relative merits of tax positions. These changes, when they occur,impact accrued taxes and can materially affect our operating results. We regularly evaluate our uncertain tax positions andestimate the appropriate level of UTBs related to each of these positions.
During the fourth quarter, we moved from a net deferred tax liability to a net deferred tax asset of $1.7 million. We regularlyevaluate the realizability of deferred tax asset positions. In determining whether a valuation allowance is necessary, weconsider the level of taxable income in prior years to the extent that carrybacks are permitted under current tax laws, as wellas estimates of future pre-tax and taxable income and tax planning strategies that would, if necessary, be implemented. Wecurrently maintain a valuation allowance for certain state NOLs generated by our subsidiaries. We expect to realize ourremaining deferred tax assets over the allowable carryback and/or carryforward periods. Therefore, no valuation allowance isdeemed necessary against our federal or remaining state deferred tax assets as of December 31, 2009. However, if anunanticipated event occurred that materially changed pre-tax and taxable income in future periods, an increase in thevaluation allowance may become necessary. For additional information, refer to Note 15, “Income Taxes,” to theConsolidated Financial Statements.
Pension Accounting
Several variables affect the annual variability of cost for our retirement programs. The main variables are: (1) size andcharacteristics of the employee population, (2) discount rate, (3) expected long-term rate of return on plan assets,(4) recognition of actual asset returns, (5) other actuarial assumptions and (6) healthcare cost. Below is a brief description ofthese variables and the effect they have on our pension costs.
Size and Characteristics of the Employee PopulationPension cost is directly related to the number of employees covered by the plans, and other factors including salary, age,years of employment, and benefit terms. Effective January 1, 2008, retirement plan participants who were employed as ofDecember 31, 2007 ceased to accrue additional benefits under the existing pension benefit formula and their accrued benefitswere frozen. Beginning January 1, 2008, participants who had fewer than 20 years of service and future participants accruefuture pension benefits under a cash balance formula that provides compensation and interest credits to a Personal PensionAccount. Participants with 20 or more years of service as of December 31, 2007 were given the opportunity to choosebetween continuing a traditional pension benefit accrual under a reduced formula or participating in the new PersonalPension Account.
Discount RateThe discount rate is used to determine the present value of future benefit obligations. The discount rate for each plan isdetermined by matching the expected cash flows of each plan to a yield curve based on long-term, high quality fixed incomedebt instruments available as of the measurement date, December 31, 2009. The discount rate for each plan is reset annuallyor upon occurrence of a triggering event on the measurement date to reflect current market conditions.
If we were to assume a 0.25% increase/decrease in the discount rate for all retirement and other postretirement plans, andkeep all other assumptions constant, the benefit cost would decrease/ increase by approximately $9.3 million.
Expected Long-term Rate of Return on Plan AssetsBased on historical experience, market projections, and the target asset allocation set forth in the investment policy for theRetirement Plans, the pre-tax expected rate of return on plan assets was 8.25% for 2008 and 8.0% for 2009. This expectedrate of return is dependent upon the asset allocation decisions made with respect to plan assets.
Annual differences, if any, between expected and actual returns are included in the unrecognized net actuarial gain or lossamount. We generally amortize any unrecognized net actuarial gain or loss in excess of a 10% corridor in net periodicpension expense over the average future service of active employees, which is approximately seven years, or average futurelifetime for plans with no active participants that are frozen. See Note 16, “Employee Benefit Plans,” to the ConsolidatedFinancial Statements for details on changes in the pension benefit obligation and the fair value of plan assets.
If we were to assume a 0.25% increase/decrease in the expected long-term rate of return for the retirement and otherpostretirement plans, holding all other actuarial assumptions constant, the benefit cost would decrease/increase byapproximately $6.1 million.
65

Recognition of Actual Asset ReturnsAccounting guidance allows for the use of an asset value that smoothes investment gains and losses over a period up to fiveyears. However, we have elected to use a preferable method in determining pension cost. This method uses the actual marketvalue of the plan assets. Therefore, we will experience more variability in the annual pension cost, as the asset values will bemore volatile than companies who elected to “smooth” their investment experience.
Other Actuarial AssumptionsTo estimate the projected benefit obligation, actuarial assumptions are required about factors such as mortality rate, turnoverrate, retirement rate, disability rate, and the rate of compensation increases. These factors do not tend to change significantlyover time, so the range of assumptions, and their impact on pension cost, is generally limited. We annually review theassumptions used based on historical and expected future experience. The interest crediting rate applied to each PersonalPension Account was an annual effective rate of 6.64% from January 1, 2009 through June 30, 2009 and 3.0% from July 1,2009 through December 31, 2009.
Healthcare CostAssumed healthcare cost trend rates also have an impact on the amounts reported for the other postretirement benefit plans.Due to changing medical inflation, it is important to understand the effect of a one percent change in assumed healthcare costtrend rates. If we were to assume a one percent increase in healthcare cost trend rates, the effect on the other postretirementbenefit obligation and total interest and service cost would be a $12.9 million and $0.7 million increase, respectively. If wewere to assume a one percent decrease in healthcare trend rates, the effect on the other postretirement benefit obligation andtotal interest and service cost would be a $11.3 million and $0.6 million decrease, respectively.
To estimate the projected benefit obligation as of December 31, 2009, we projected forward the benefit obligations fromJanuary 1, 2009 to December 31, 2009, adjusting for benefit payments, expected growth in the benefit obligations, changes inkey assumptions and plan provisions, and any significant changes in the plan demographics that occurred during the year,including (where appropriate) subsidized early retirements, salary changes different from expectations, entrance of newparticipants, changes in per capita claims cost, Medicare Part D subsidy, and retiree contributions.
66

Table 18 – Selected Quarterly Financial Data
Three Months Ended
2009 2008
(Dollars in millions, except per share and other data) December 31 September 30 June 30 March 31 December 31 September 30 June 30 March 31
Summary of OperationsInterest income $1,629.6 $1,657.5 $1,693.3 $1,729.3 $1,985.4 $2,017.3 $2,066.4 $2,258.3Interest expense 453.1 520.0 603.6 667.2 808.5 871.1 909.7 1,118.5
Net interest income 1,176.5 1,137.5 1,089.7 1,062.1 1,176.9 1,146.2 1,156.7 1,139.8Provision for credit losses 4 973.7 1,133.9 962.2 994.1 962.5 503.7 448.0 560.0
Net interest income after provision for credit losses 202.8 3.6 127.5 68.0 214.4 642.5 708.7 579.8Noninterest income 1 742.3 775.0 1,071.7 1,121.2 717.7 1,285.2 1,413.0 1,057.5Noninterest expense 1,453.6 1,428.9 1,528.0 2,152.0 1,586.2 1,665.3 1,375.3 1,252.2
Income/(loss) before provision/(benefit) for income taxes (508.5) (650.3) (328.8) (962.8) (654.1) 262.4 746.4 385.1Net income attributable to noncontrolling interest 2.6 2.7 3.6 3.2 2.5 2.8 3.2 2.9Provision/(benefit) for income taxes (263.0) (336.1) (148.9) (150.8) (309.0) (52.8) 202.8 91.6
Net income/(loss) (248.1) (316.9) (183.5) (815.2) (347.6) 312.4 540.4 290.6
Net income/(loss) available to common shareholders ($316.4) ($377.1) ($164.4) ($875.4) ($374.9) $304.4 $530.0 $281.6Net interest income-FTE 2 $1,206.8 $1,168.2 $1,121.1 $1,093.0 $1,208.7 $1,175.7 $1,185.0 $1,167.8Total revenue-FTE 2 1,949.1 1,943.2 2,192.8 2,214.2 1,926.4 2,460.9 2,598.0 2,225.3Total revenue-FTE excluding net securities gains/(losses), net 2 1,876.2 1,896.5 2,217.7 2,210.8 1,515.3 2,287.9 2,048.2 2,285.9
Net income/(loss) per average common share: 3
Diluted ($0.64) ($0.76) ($0.41) ($2.49) ($1.07) $0.87 $1.52 $0.81Diluted excluding goodwill/intangible impairment charges
other than MSRs 2 (0.64) (0.76) (0.41) (0.46) (1.07) 0.87 1.59 0.81Basic (0.64) (0.76) (0.41) (2.49) (1.07) 0.87 1.52 0.81Dividends paid per average common share 0.01 0.01 0.10 0.10 0.54 0.77 0.77 0.77Book value per common share 35.29 36.06 36.16 46.03 48.74 49.64 49.56 51.59Tangible book value per common share 2 22.59 23.35 23.41 28.15 28.69 29.18 29.04 31.13
Market capitalization $10,128 $11,256 $8,205 $4,188 $10,472 $15,925 $12,805 $19,290
Market Price:High 24.09 24.43 20.86 30.18 57.75 64.00 60.80 70.00Low 18.45 14.50 10.50 6.00 19.75 25.60 32.34 52.94Close 20.29 22.55 16.45 11.74 29.54 44.99 36.22 55.14
Selected Average BalancesTotal assets $174,040.5 $172,463.2 $176,480.5 $178,871.3 $177,047.3 $173,888.5 $175,548.8 $176,916.9Earning assets 146,587.2 149,579.4 153,177.2 154,390.0 153,187.9 152,319.8 152,483.0 153,003.6Loans 115,036.1 119,796.2 124,123.4 125,333.5 127,607.9 125,642.0 125,191.9 123,263.0Consumer and commercial deposits 117,008.5 114,486.4 113,527.5 107,514.9 102,238.4 100,199.8 101,727.0 101,168.4Brokered and foreign deposits 5,145.0 5,192.9 6,608.4 7,417.3 12,648.7 15,799.8 15,068.3 15,468.6Total shareholders’ equity 22,380.7 22,467.9 21,925.7 22,367.9 19,891.0 18,097.4 18,209.3 18,178.7
Average common shares outstanding (000s)Diluted 494,332 494,169 399,242 351,352 350,439 350,970 349,783 348,072Basic 494,332 494,169 399,242 351,352 350,439 349,916 348,714 346,581
Financial Ratios and Other Data (Annualized)Return on average total assets (0.57) % (0.73) % (0.42) % (1.85) % (0.78) % 0.71 % 1.24 % 0.66 %
Return on average assets less net unrealized securities gains/(losses) 2 (0.70) (0.83) (0.41) (1.89) (1.39) 0.45 0.42 0.72
Return on average common shareholders equity (7.19) (8.52) (3.95) (20.71) (8.47) 6.88 12.04 6.41Return on average realized common shareholders’ equity 2 (8.81) (9.70) (4.02) (22.08) (15.33) 4.45 4.32 7.58Net interest margin- FTE 3.27 3.10 2.94 2.87 3.14 3.07 3.13 3.07Efficiency ratio- FTE 74.58 73.53 69.68 97.22 82.34 67.67 52.94 56.27Tangible efficiency ratio 2 73.96 72.82 69.05 62.97 81.44 66.92 50.45 55.34Total average shareholders’ equity to average assets 12.86 13.03 12.42 12.51 11.23 10.41 10.37 10.28Tangible equity to tangible assets 2 9.66 9.96 9.75 8.85 8.46 6.47 6.34 6.63Effective tax rate (benefit) (51.46) (51.46) (44.81) (15.61) (47.06) (20.32) 27.29 23.98Allowance to period-end loans 2.76 2.61 2.37 2.21 1.86 1.54 1.46 1.25
Nonperforming assets to total loans plus OREO and otherrepossessed assets 5.33 5.20 4.99 4.21 3.49 2.90 2.32 1.85
Common dividend payout ratio5 N/A N/A N/A N/A N/A 89.4 51.3 95.5
Capital AdequacyTier 1 common equity 7.67 % 7.49 % 7.34 % 5.83 % 5.83 % 6.02 % 5.41 % 5.18 %Tier 1 capital 12.96 12.58 12.23 11.02 10.87 8.15 7.47 7.23Total capital 16.43 15.92 15.31 14.15 14.04 11.16 10.85 10.97Tier 1 leverage 10.90 11.08 11.02 10.14 10.45 7.98 7.54 7.22
1Includes net securities gains/(losses) $72.8 $46.7 ($24.9) $3.4 $411.1 $173.0 $549.8 ($60.6)2See Non-GAAP reconcilements in Table 22 of the MD&A.3Prior period amounts have been recalculated in accordance with updated accounting guidance related to earnings per share, that was effective January 1, 2009 and required retrospective application .4Beginning in the fourth quarter of 2009, SunTrust began recording the provision for unfunded commitments within the provision for credit losses in the Consolidated Statements of Income/(Loss). Theprovision for unfunded commitments for the fourth quarter of 2009 was $57.2 million. Considering the immateriality of this provision, prior to the fourth quarter of 2009, the provision for unfundedcommitments remains classified within other noninterest expense in the Consolidated Statements of Income/(Loss).5The common dividend payout ratio is not calculable in a period of net loss.
67

FOURTH QUARTER 2009 RESULTS
We reported a net loss available to common shareholders of $316.4 million for the fourth quarter of 2009, a decrease of$58.5 million, or 15.6%, compared to the same period of the prior year. The net loss per average common share was $0.64for the fourth quarter of 2009 compared to a net loss of $1.07 per common share for the fourth quarter of 2008. The fourthquarter of 2009 results were adversely impacted by credit-related charges and cyclical expenses that reflected recessionarypressures as evidenced by soft revenue and weak loan demand from consumer and commercial borrowers. However,compared to recent quarterly trends, the provision for credit losses declined, deposit mix continued to improve while coredeposit volumes grew, net interest margin increased, and certain of our businesses experienced revenue growth.
For the fourth quarter of 2009, FTE net interest income was $1,206.8 million, essentially flat compared to the fourth quarterof 2008 due to a decline in average earning assets which resulted from a reduction in client demand for credit, offset byimprovement in the net interest margin. Margin expansion was due to lower rates paid for funds as client deposits increased,the mix of deposits improved, and higher cost sources of funding were reduced. Net interest margin grew from 3.14% in thefourth quarter of 2008 to 3.27% for the same period of 2009.
For the fourth quarter of 2009, the provision for credit losses was $973.7 million and included $57.2 million in provision forunfunded commitments. In the fourth quarter of 2009, we elected to change our financial statement presentation to includethe provision for unfunded commitments in the provision for credit losses. Previously, the unfunded commitment provisionwas included in noninterest expense. The provision for loan losses was $46.0 million below the provision for loan lossesrecorded in the fourth quarter of 2008. On an overall basis, the provision for credit losses increased only slightly as theimpact of increased charge-offs was largely offset by lower increases to the ALLL.
Total noninterest income was $742.3 million for the fourth quarter of 2009, an increase of $24.6 million, or 3.4%, from thefourth quarter of 2008. This increase was primarily driven by lower market-related losses on illiquid securities and otherinstruments carried at fair value, including our public debt. These lower losses in the fourth quarter of 2009 were largelyoffset by higher estimated losses related to the potential repurchase of mortgage loans resulting in lower mortgage productionincome. The fourth quarter of 2009 results include $220.2 million in estimated losses related to the potential repurchase ofmortgage loans that were previously sold to third parties compared to $60.4 million recognized in the fourth quarter of 2008.Although mortgage production related income declined $40.2 million, the decline was partially offset by lower marketvaluation losses and a 17% increase in loan production during the fourth quarter of 2009. Mortgage servicing incomeincreased $382.8 million compared to the fourth quarter of 2008, as a result of the $370.0 million temporary impairmentrecognized in the fourth quarter of 2008 related to MSRs that were carried at the LOCOM compared to a recovery of $10.5million recognized during the current quarter. During the fourth quarter of 2009, we recorded $72.8 million of net gains fromthe sale of available for sale securities compared to $411.1 million of net gains from the sale of available for sale securities inthe fourth quarter of 2008 that were realized in conjunction with risk management strategies associated with hedging thevalue of MSRs. Trading account profits/(losses) and commissions increased $30.7 million compared to the fourth quarter of2008 as market-related valuation losses on illiquid securities and other instruments carried at fair value improved. Valuationlosses on our public debt and related hedges carried at fair value were $38.1 million, a reduction of $6.2 million compared tothe fourth quarter of 2008. Trust and investment management income increased $8.2 million, or 6.5%, on increasedperformance based fees; however, retail investment income decreased $15.9 million, or 22.7%, due to lower transactionvolume.
Total noninterest expense was $1,453.6 million during the fourth quarter of 2009, a decrease of $132.6 million, or 8.4%,compared to the fourth quarter of 2008. The decrease was a result of credit-related expenses declining significantly andcontrollable expenses continuing to be tightly managed. Operating losses declined $210.2 million, or 89.0%, as fraud-relatedcredit losses were recorded in the provision for credit losses beginning in the first quarter of 2009. Mortgage reinsurancelosses declined $89.7 million, or 89.7%, as we reached the limits of our exposure to reinsurance losses (see Note 18,“Reinsurance Arrangements and Guarantees,” to the Consolidated Financial Statements). Other credit-related expensesincluding collection and credit costs and other real estate expense increased $58.6 million due to property valuation lossesand increased loss mitigation efforts. FDIC and regulatory expense increased $40.0 million, or 195.4%, in conjunction withthe replenishment of the FDIC’s insurance fund through increased premiums. Personnel expenses increased $56.1 million, or8.8%, due to higher pension costs and increased incentives related to improved financial performance in certain lines ofbusiness. The fourth quarter of 2009 also included $23.5 million in net losses related to early termination fees for FHLBadvances repaid during the quarter, net of gains on the early extinguishment of other long-term debt. These advanceterminations were part of the initiative we took to take advantage of the strong liquidity position we currently benefit from torepay wholesale funding and improve margin.
The income tax benefit for the fourth quarter of 2009 was $263.0 million compared to the income tax benefit of $309.0million for the fourth quarter of 2008. The decrease in the income tax benefit was primarily attributable to the lower level ofpre-tax losses in fourth quarter of 2009 compared to the same period in 2008.
68
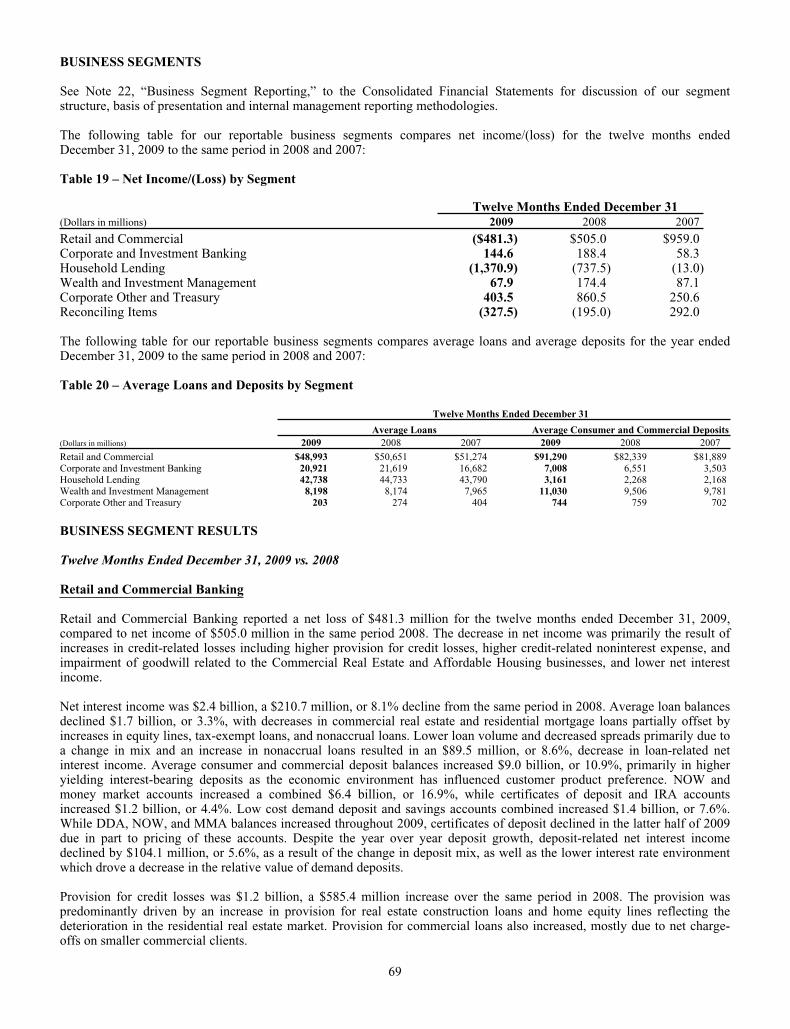
BUSINESS SEGMENTS
See Note 22, “Business Segment Reporting,” to the Consolidated Financial Statements for discussion of our segmentstructure, basis of presentation and internal management reporting methodologies.
The following table for our reportable business segments compares net income/(loss) for the twelve months endedDecember 31, 2009 to the same period in 2008 and 2007:
Table 19 – Net Income/(Loss) by Segment
Twelve Months Ended December 31(Dollars in millions) 2009 2008 2007
Retail and Commercial ($481.3) $505.0 $959.0Corporate and Investment Banking 144.6 188.4 58.3Household Lending (1,370.9) (737.5) (13.0)Wealth and Investment Management 67.9 174.4 87.1Corporate Other and Treasury 403.5 860.5 250.6Reconciling Items (327.5) (195.0) 292.0
The following table for our reportable business segments compares average loans and average deposits for the year endedDecember 31, 2009 to the same period in 2008 and 2007:
Table 20 – Average Loans and Deposits by Segment
Twelve Months Ended December 31
Average Loans Average Consumer and Commercial Deposits(Dollars in millions) 2009 2008 2007 2009 2008 2007
Retail and Commercial $48,993 $50,651 $51,274 $91,290 $82,339 $81,889Corporate and Investment Banking 20,921 21,619 16,682 7,008 6,551 3,503Household Lending 42,738 44,733 43,790 3,161 2,268 2,168Wealth and Investment Management 8,198 8,174 7,965 11,030 9,506 9,781Corporate Other and Treasury 203 274 404 744 759 702
BUSINESS SEGMENT RESULTS
Twelve Months Ended December 31, 2009 vs. 2008
Retail and Commercial Banking
Retail and Commercial Banking reported a net loss of $481.3 million for the twelve months ended December 31, 2009,compared to net income of $505.0 million in the same period 2008. The decrease in net income was primarily the result ofincreases in credit-related losses including higher provision for credit losses, higher credit-related noninterest expense, andimpairment of goodwill related to the Commercial Real Estate and Affordable Housing businesses, and lower net interestincome.
Net interest income was $2.4 billion, a $210.7 million, or 8.1% decline from the same period in 2008. Average loan balancesdeclined $1.7 billion, or 3.3%, with decreases in commercial real estate and residential mortgage loans partially offset byincreases in equity lines, tax-exempt loans, and nonaccrual loans. Lower loan volume and decreased spreads primarily due toa change in mix and an increase in nonaccrual loans resulted in an $89.5 million, or 8.6%, decrease in loan-related netinterest income. Average consumer and commercial deposit balances increased $9.0 billion, or 10.9%, primarily in higheryielding interest-bearing deposits as the economic environment has influenced customer product preference. NOW andmoney market accounts increased a combined $6.4 billion, or 16.9%, while certificates of deposit and IRA accountsincreased $1.2 billion, or 4.4%. Low cost demand deposit and savings accounts combined increased $1.4 billion, or 7.6%.While DDA, NOW, and MMA balances increased throughout 2009, certificates of deposit declined in the latter half of 2009due in part to pricing of these accounts. Despite the year over year deposit growth, deposit-related net interest incomedeclined by $104.1 million, or 5.6%, as a result of the change in deposit mix, as well as the lower interest rate environmentwhich drove a decrease in the relative value of demand deposits.
Provision for credit losses was $1.2 billion, a $585.4 million increase over the same period in 2008. The provision waspredominantly driven by an increase in provision for real estate construction loans and home equity lines reflecting thedeterioration in the residential real estate market. Provision for commercial loans also increased, mostly due to net charge-offs on smaller commercial clients.
69

Total noninterest income was $1.4 billion, a decrease of $29.3 million, or 2.1%, from the same period in 2008. The decreasewas primarily due to a $54.3 million, or 6.8%, decrease in service charges on deposits driven by lower consumer andcommercial NSF fees. The decrease in service charges was partially offset by a $37.2 million, or 11.8%, increase in ATMand card fees primarily due to an increase in accounts and transactions.
Total noninterest expense was $3.3 billion, up $562.6 million, or 20.6%, over the same period in 2008. FDIC insuranceexpense increased $135.7 million primarily due to increased premium rates. Credit-related expense increased $123.9 millionincluding operating losses, collections services, and other real estate. Also, the first quarter of 2009 included a non-cashcharge of $299.2 million related to the impairment of goodwill associated with the Commercial Real Estate and AffordableHousing businesses. The economic downturn has negatively impacted commercial real estate asset values and expectedearnings; however, we remain committed to the clients, products, and services of these businesses and believe that the longerterm growth prospects of these businesses are strong.
Corporate and Investment Banking
Corporate and Investment Banking’s net income for the twelve months ended December 31, 2009 was $144.6 million, adecrease of $43.8 million, or 23.3%, compared to the same period in 2008. The decline was driven by a $242.9 millionincrease in provision for credit losses which was mostly offset by strong growth in capital markets revenue and net interestincome.
Net interest income was $389.3 million, an increase of $49.7 million, or 14.7%, from the prior year primarily due to anincrease in loan portfolio spreads. Average loan balances decreased $698.2 million, or 3.2%, while the loan-related netinterest income increased $69.1 million, or 31.6%, due to increased portfolio spreads. Loan balances have decreased 9.8%compared to the third quarter of 2009 as higher revolver utilization by large corporate clients experienced early in the yearhas declined as borrower’s needs diminish and as access to capital markets funding has improved. Net interest income oninvestments decreased $21.0 million primarily due to decreased volume. Total average customer deposits increased $457.4million, or 7.0%, mainly due to a $552.0 million increase in demand deposits offset by a $94.8 million decrease in timedeposits. Customer deposit-related net interest income increased $1.5 million or 1.8%, due to increased average balancespartially offset by spread compression related to a decrease in the relative value of demand deposits.
Provision for credit losses was $298.2 million, as net charge-offs increased $242.9 million from the prior year driven by asmall number of large corporate borrowers operating in economically sensitive industries.
Total noninterest income was $700.1 million, an increase of $138.3 million, or 24.6%, over the prior year. Capital marketsrelated noninterest income increased $161.6 million, or 51.3%, primarily due to performance in equity derivatives, debt andequity originations, fixed income sales and trading, and syndications. The strong performance in capital markets was partiallyoffset by higher write-downs on private equity investments, equipment write downs on terminated leases and marketvolatility on credit hedges related to the corporate loan book.
Total noninterest expense was $559.7 million, an increase of $18.8 million, or 3.5%. The increase was primarily due tohigher operating losses, revenue based incentive compensation, and pension expense. Offsetting these higher expenses werelower salaries and other staff expenses, as well as lower outside processing and miscellaneous expenses.
Household Lending
Household Lending reported a net loss of $1.4 billion for the year ended December 31, 2009 compared with a net loss of$737.5 million in 2008. The $633.4 million increase in net loss was driven by higher credit costs and goodwill impairmentresulting from deterioration in residential real estate market conditions. Partially offsetting these costs were higherproduction and servicing income.
Net interest income was $780.2 million for the year ended December 31, 2009, up $53.3 million, or 7.3%, primarily due tohigher net interest income on LHFS, credit cards, and student loans offset by lower consumer mortgage net interest incomeand increased levels of nonaccrual loans. Additionally, the loan-related net interest income decline was influenced by thedecline in higher yielding second lien loans and lower yields on prime first lien mortgages. Average loans declined $2.0billion, or 4.5%, while the resulting net interest income declined $39.3 million, or 7.2%. Consumer mortgages andconstruction to perm loans declined $3.6 billion, or 11.8%, contributing $76.2 million to the decline in loan-related netinterest income. Additionally, nonaccrual loans increased $1.0 billion, resulting in a net interest income reduction of $38.4million. Partially offsetting these declines was a $0.8 billion, or 24.2%, increase in student loans and bank card loans, whichincreased net interest income $80.3 million. LHFS increased $0.2 billion and contributed $70.9 million to the increase in netinterest income due to improved funding costs resulting from lower short-term rates. Customer deposit-related net interestincome also increased $12.8 million principally due to higher volume.
70
Provision for credit losses was $1.7 billion, an increase of $790.3 million, or 88.5%, principally due to higher consumermortgage and home equity line charge-offs.
Total noninterest income was $727.7 million, a $246.4 million, or 51.2%, increase driven by higher mortgage production andservicing income. Total mortgage production income increased $190.2 million, or 105.4%, principally due to income fromhigher loan production volume at improved margins partially offset by higher reserves for repurchased loans. Total mortgageloan production for the year ended December 31, 2009 was $50.1 billion, up 37.6% from $36.4 billion the prior year. Totalservicing income increased $519.6 million primarily due to a $199.2 million recovery in 2009 on MSRs carried at theLOCOM compared to a $370.0 million impairment charge in 2008. The 2008 MSR impairment was offset by net securitiesgains of $410.7 million in the fourth quarter of 2008 from the sale of available for sale securities that were held inconjunction with our risk management strategies associated with economically hedging the value of MSRs. At December 31,2009 total mortgage loans serviced were $178.9 billion, up $16.9 billion, or 10.4%, from $162.0 billion at December 31,2008.
Total noninterest expense was $1.8 billion, an increase of $254.1 million, or 16.6%. The increase was primarily due to a$451.9 million non-cash goodwill impairment charge recorded in first quarter of 2009. Credit-related expense including otherreal estate, credit service, and collection costs also increased $125.4 million, or 61.0%. The increases were partially offset bya $373.7 million decrease in operating losses primarily due to a change in classification related to borrower misrepresentationand claim denials. Beginning in 2009, these losses were recorded as charge-offs against the allowance for loan losses andwere included in the overall allowance for loan losses. Additionally, personnel expense was up $115.8 million principallydue to higher commission expense resulting from higher loan production.
Wealth and Investment Management
Wealth and Investment Management’s net income for the twelve months ended December 31, 2009 was $67.9 million, adecrease of $106.5 million compared to the same period in 2008. The decrease in net income was primarily due to the gainsfrom the sales of First Mercantile and Lighthouse Investment Partners in 2008 and the resulting reduction in noninterestincome partially offset by lower noninterest expense in 2009. Net income in 2008 included a $63.8 million market valuationloss on an acquired security primarily in the third quarter and a $45.0 million impairment charge on a client-based intangibleasset in the second quarter.
Net interest income was $304.0 million, a decrease of $21.1 million, or 6.5%, as higher average loan and deposit balanceswere more than offset by spread compression. Average loans increased slightly while net interest income on loans declined$6.3 million, or 4.6%, due to compressed spreads. Average deposits increased $1.5 billion, or 16.0%, while deposit-relatednet interest income decreased $13.3 million, or 6.6%, due to a change in mix, a decrease in the relative value of demanddeposits, and spread compression in NOW and money market accounts.
Provision for credit losses were $79.2 million, an increase of $52.3 million primarily due to higher consumer and commercialloan net charge-offs.
Total noninterest income was $748.6 million, a $200.6 million, or 21.1%, decrease primarily due to an $89.4 million gain onsale of a minority interest in Lighthouse Investment Partners in the first quarter of 2008, $50.1 million net decline due to thesale of First Mercantile in the second quarter of 2008, and lower trust income and retail investment income. Trust incomedecreased $102.9 million, or 17.5%, primarily due to lower market valuations on managed equity assets, investment advisoryfee waivers on managed liquidity funds, migration of money market fund assets into deposits, and the sale of FirstMercantile. Retail investment income declined $71.3 million, or 25.5%, due to lower annuity sales and market drivendeclines in assets in managed accounts. Partially offsetting those declines, trading gains and losses increased $78.4 millionprimarily due to a $63.8 million market valuation loss on a security purchased from our RidgeWorth subsidiary recorded inthe third quarter of 2008.
As of December 31, 2009, assets under management were approximately $119.5 billion compared to $113.1 billion as ofDecember 31, 2008. Assets under management include individually managed assets, the RidgeWorth Funds, managedinstitutional assets, and participant-directed retirement accounts. SunTrust’s total assets under advisement wereapproximately $205.4 billion, which includes $119.5 billion in assets under management, $46.0 billion in non-managed trustassets, $31.8 billion in retail brokerage assets, and $8.1 billion in non-managed corporate trust assets.
Total noninterest expense was $863.1 million, down $106.8 million, or 11.0%, primarily due to the sale of First Mercantile in2008 and a $45.0 million impairment charge on a client based intangible incurred in the second quarter of 2008. Employeecompensation declined $63.2 million, or 13.4%, resulting from reduced headcount and lower incentive payments.Discretionary expenses including other staff, advertising, and customer development declined $12.3 million, or 36.4%. Otherexpense also declined $21.6 million primarily due to the sale of First Mercantile and reduced clearing costs related to retailinvestment income. These decreases were partially offset by higher operating losses, other real estate expense, indirectsupport cost, and FDIC expense.
71
Corporate Other and Treasury
Corporate Other and Treasury’s net income for the twelve months ended December 31, 2009 was $403.5 million, a decreaseof $457.0 million, or 53.1%, from the same period in 2008. The decrease was mainly due to a reduction in securities gainsdue to the sale and contribution of Coke stock in 2008, the FDIC insurance special assessment recognized in 2009, partiallyoffset by an increase in net interest income on receive-fixed interest rate swaps.
Net interest income was $433.6 million, a $268.4 million increase compared to the same period in 2008, mainly due to a$310.5 million increase in income on receive-fixed interest rate swaps employed as part of an overall interest rate riskmanagement strategy. Total average assets increased $6.9 billion, or 35.2%, mainly due to additions to the investmentportfolio, primarily lower risk U.S. agency MBS. Total average deposits decreased $8.8 billion, or 61.2%, mainly due to adecrease in brokered and foreign deposits, as we reduced our reliance on wholesale funding sources.
Total noninterest income was $202.2 million, a $901.1 million decrease primarily due to a decrease in net securities gains.Securities gains decreased $544.9 million primarily due to a $732.2 million gain on the sale and contribution of Coke stockin 2008. The decrease was offset by a $129.6 million gain, net of credit-related OTTI of $10.1 million in 2009, and $55.6million in market value losses in 2008 primarily related to certain ABS that were classified as available for sale andestimated to be other-than-temporarily impaired, triggering accounting recognition of the unrealized loss in earnings. Tradinggains decreased $227.8 million due to lower gains on our public debt and related hedges carried at fair value as our creditspreads improved during 2009. Additionally, 2009 included a $112.1 million gain on Visa Class B shares, compared to thesame period in 2008 which included a $81.8 million gain from the sale of a fuel card and fleet management subsidiary, an$86.3 million gain on our holdings of Visa in connection with its IPO, a $37.0 million gain on sale/leaseback of real estateproperties, and $21.1 million of merchant card fee income generated by Transplatinum in 2008.
Total noninterest expense decreased $28.1 million compared to the same period in 2008. The decrease was mainly due to therecognition of $183.4 million in expense related to the contribution of Coke shares to the SunTrust charitable foundation inthe third quarter of 2008. The decrease was partially offset by a $78.9 million increase in FDIC insurance expense primarilydue to the special assessment recorded in the second quarter of 2009. While the special assessment was recorded in the Otherline of business, the increase in base FDIC premium expenses was recognized within the lines of business. Also 2009included a $7.0 million accrual for Visa litigation compared to a $33.5 million reversal of a portion of the Visa litigation in2008.
Twelve Months Ended December 31, 2008 vs. 2007
Retail and Commercial
Retail and Commercial net income for the twelve months ended December 31, 2008 was $505.0 million, a decrease of$454.0 million, or 47.3%, compared to the same period in 2007. This decrease was primarily the result of higher provisionfor credit losses due to home equity line, real estate construction, and commercial loan net charge-offs, lower net interestincome, and higher credit-related noninterest expense, partially offset by strong growth in service charges on deposits.
Net interest income decreased $346.1 million, or 11.8%, primarily driven by a continued shift in deposit mix and decreasedspreads, as deposit competition and the interest rate environment encouraged clients to migrate into higher yielding interest-bearing deposits. Average consumer and commercial deposit balances increased $0.4 billion, or 0.6%. Despite depositgrowth, deposit-related net interest income declined by $223.1 million, or 10.7%, driven by the change in mix as well as thedecrease in the rate environment which drove a decrease in the relative value of demand deposits. NOW and money marketaccounts increased a combined $2.3 billion, or 6.4%, while combined certificates of deposit and IRA accounts were flatcompared to the prior year. Low cost demand deposit and savings accounts combined decreased $1.8 billion, or 8.9%.Average loan balances declined $0.6 billion, or 1.2%, as growth in commercial loans, equity lines, and loans acquired inconjunction with the GB&T transaction were offset by an approximate $1.8 billion decline in average loan balances relatedto the migration of middle market clients from Retail and Commercial to CIB. Net interest income from loans decreased$101.5 million, or 8.9%, due to the migration of middle market clients from Retail and Commercial to CIB, lower spreads,and the adverse impact of nonperforming loans.
Provision for credit losses increased $425.4 million over the same period in 2007. The provision increase was mostpronounced in home equity lines reflecting deterioration in the residential real estate market, while provision for credit losseson real estate construction and commercial loans, primarily to commercial clients with annual revenues of less than $5million, also increased.
Total noninterest income increased $81.5 million, or 6.2%, over the same period in 2007. This increase was driven primarilyby a $68.9 million, or 9.4%, increase in service charges on both consumer and business deposit accounts, primarily due togrowth in the number of accounts, higher NSF rates, and an increase in occurrences of NSF fees. Interchange fees increased$14.0 million, or 8.1%, and ATM revenue increased $9.9 million, or 8.4%.
72

Total noninterest expense increased $33.3 million, or 1.2%, from the same period in 2007. The transfer of middle market toCIB decreased expenses approximately $24.9 million. In addition, the continuing positive impact of expense savingsinitiatives, lower amortization of intangibles and impairments, was offset by higher credit-related expenses includingoperating losses due to fraud, other real estate, and collections, as well as continued investments in the branch distributionnetwork.
Corporate and Investment Banking
Corporate and Investment Banking’s net income for the twelve months ended December 31, 2008 was $188.4 million, anincrease of $130.1 million, or 223.2%, compared to the same period in 2007. Lower market valuation trading losses instructured products were partially offset by an increase in provision for credit losses, lower merchant banking gains, andhigher incentive-based compensation.
Net interest income was $339.5 million for the twelve months ended December 31, 2008, an increase of $95.6 million, or39.2%, from prior year. Average loan balances increased $4.9 billion, or 29.6%, while the corresponding net interest incomeincreased $62.8 million, or 40.2%. The migration of middle market clients from Retail and Commercial to CIB accounted forapproximately $1.8 billion of the increase in average loan balances and increased net interest income $25.8 million. Theremainder of CIB’s average loans increased $3.1 billion, or 19.5%, driven by increased corporate banking loans and leasefinancing. The corresponding net interest income increased $37.0 million, or 25.5%, due to higher commercial loans andimproved spreads. Total average consumer and commercial deposits increased $3.0 billion, or 87.0%, primarily in highercost interest-bearing deposits. Deposit-related net interest income increased $18.9 million, or 28.6%, driven by the lowercredit for funds on demand deposits partially offset by the increased volumes in higher cost deposit products.
Provision for credit losses was $55.3 million, an increase of $17.5 million, or 46.5%, over the prior year, resulting fromincreased charge-offs of middle market clients partially offset by lower charge-offs in corporate banking.
Noninterest income increased $179.8 million, or 47.1%, primarily due to lower market valuation trading losses in structuredproducts. In addition, increases in direct finance, loan syndications, credit-related fees, and fixed income sales and tradingwere partially offset by a reduction in merchant banking gains and lower revenues in structured leasing and derivatives.
Noninterest expense increased $45.3 million, or 9.1%, partially due to the transfer of the middle market business from Retailand Commercial to CIB which accounted for approximately $24.9 million of the increase. For the remainder of CIB,noninterest expense increased $20.4 million, or 4.2%, primarily due to higher incentive-based compensation offset byconsulting and certain other staff expenses.
Household Lending
Household Lending reported a net loss for the twelve months ended December 31, 2008 of $737.5 million, compared to a netloss of $13.0 million in 2007, an increase of $724.5 million, principally due to higher credit-related costs.
Net interest income declined $16.0 million, or 2.2%. Average loans increased $0.9 billion, or 2.2%, while the resulting netinterest income declined $33.8 million, or 5.8%. Nonaccrual loans accounted for $47.7 million of the net interest incomedecline as average nonaccrual loans increased $1.1 billion. Accruing loans declined $0.2 billion, or 0.5%, while net interestincome increased $13.9 million, or 2.3%. The increase in net interest income on accruing loans was influenced by higherincome from consumer loans that was partially offset by lower income resulting from a change in mortgage loan product mixas declines in construction-perm and Alt-A balances were replaced with lower yielding prime first lien mortgages. AverageLHFS declined $5.5 billion while the resulting net interest income increased $28.6 million primarily due to wideningspreads. Average investment securities were up $0.8 billion while net interest income increased $20.7 million. Funding ofother real estate and MSRs reduced net interest income $18.2 million. Average consumer and commercial deposits increased$0.1 billion, or 4.7%, although net interest income on deposits and other liabilities decreased $17.2 million primarily due tolower short-term interest rates.
Provision for credit losses increased $681.1 million to $893.1 million primarily due to higher residential mortgage, homeequity and residential construction net charge-offs.
Total noninterest income increased $82.3 million, or 20.6%, primarily due to reduced net valuation losses, increasedproduction fee income, and securities gains in excess of MSRs impairment, partially offset by higher repurchase reserves andlower gains from the sale of MSRs. Total production income increased $83.2 million, or 85.5%, driven by reduced valuationlosses associated with secondary market loans and the recognition of loan origination fees resulting from our election torecord certain mortgage loans at fair value beginning in May 2007. The increase in loan production income was partiallyoffset by increased reserves for the repurchase of loans. Mortgage loan production of $36.4 billion was down $21.9 billion,or 37.6%. Mortgage servicing related income declined $426.3 million from $193.6 million in 2007, to a net loss of $232.7million in 2008. The decline was driven by $370.0 million in impairment of MSRs that were carried at the LOCOM, as well
73

as lower gains from the sale of MSRs. The MSRs impairment was offset by $410.7 million of net gains from the sale ofavailable for sale securities that were held in conjunction with our risk management strategies associated with economicallyhedging the value of MSRs.
Total noninterest expense increased $549.4 million, or 56.0%, driven by increased credit-related expenses. Operating losseswere up $311.7 million driven by fraud losses primarily related to borrower misrepresentation and insurance claim denials.Reserves for mortgage reinsurance losses increased $179.8 million while other real estate expense and collection servicesexpense increased $110.8 million. Additionally, the recognition of loan origination costs resulting from our election to recordcertain mortgage loans at fair value beginning in May 2007 increased noninterest expense compared with the prior year,offsetting significant reductions in staff and commissions expense related to lower loan production.
Wealth and Investment Management
Wealth and Investment Management’s net income for the twelve months ended December 31, 2008 was $174.4 million, anincrease of $87.3 million compared to same period in 2007. The following transactions represented $141.7 million of theyear-over-year increase:
• $39.4 million decrease due to the after-tax impact of the market valuation loss on Lehman bonds in the thirdquarter of 2008.
• $18.4 million increase due to the after-tax gain on the sale of First Mercantile in the second quarter of 2008.• $27.9 million decrease due to the after-tax impairment charge on a client-based intangible asset incurred in the
second quarter of 2008.• $55.4 million increase due to the after-tax gain on sale of a minority interest in Lighthouse Investment Partners in
the first quarter of 2008.• $155.3 million increase due to the after-tax impact of the market valuation losses in the fourth quarter of 2007 on
purchased securities.• $20.1 million decrease due to the after-tax gain resulting from the sale upon merger of Lighthouse Partners into
Lighthouse Investment Partners in the first quarter of 2007.
Net interest income decreased $30.1 million, or 8.5%, primarily due to a decline in deposit-related net interest income.Average consumer and commercial deposits declined $0.3 billion, or 2.8%, while net interest income on deposits declined$24.6 million, or 10.9%, due to the decrease in average balance, as well as a lower credit for funds on demand deposits.Average loans increased $0.2 billion, or 2.6%, driven by growth in commercial loans in the professional specialty lendingunits while net interest income dropped $4.6 million due to a $5.6 million decrease in consumer lending related net interestincome.
Provision for credit losses increased $18.4 million driven by higher home equity, personal credit line, and consumermortgage net charge-offs.
Total noninterest income increased $136.2 million, or 16.8%, compared to the twelve months ended December 31, 2007driven by a decrease in market valuation losses. Additionally, gains on the sale of non-strategic businesses were offset by thecorresponding loss of revenue and lower market valuations on managed equity assets. A $250.5 million increase due to amarket valuation loss in the fourth quarter of 2007 related to securities purchased from our RidgeWorth subsidiary waspartially offset by a $63.8 million market valuation loss on Lehman bonds in 2008. A $29.6 million gain on sale of FirstMercantile in 2008, and $24.1 million of incremental noninterest income from the sale of our Lighthouse Partners investmentalso increased income. Retail investment income increased $6.8 million, or 2.5%, due to higher annuity sales and higherrecurring managed account fees. Trust income decreased $91.1 million, or 13.4%, primarily due to the aforementioned salesof Lighthouse Partners and First Mercantile, which resulted in a $49.1 million decline in trust income as well as lower marketvaluations on managed equity assets.
As of December 31, 2008, assets under management were approximately $113.1 billion compared to $142.8 billion as ofDecember 31, 2007. Assets under management include individually managed assets, the RidgeWorth Funds, managedinstitutional assets, and participant-directed retirement accounts. Our total assets under advisement were approximately$194.5 billion, which includes $113.1 billion in assets under management, $45.7 billion in non-managed trust assets, $31.2billion in retail brokerage assets, and $4.5 billion in non-managed corporate trust assets.
Total noninterest expense decreased $47.2 million, or 4.6%. This decline includes a $45.0 million impairment charge on aclient based intangible incurred in the second quarter of 2008. Noninterest expense before intangible amortization declined$85.4 million, or 8.6%, driven by lower staff, discretionary, and indirect expenses, as well as lower structural expensesresulting from the sales of Lighthouse Partners and First Mercantile.
74

Corporate Other and Treasury
Corporate Other and Treasury’s net income for the twelve months ended December 31, 2008 was $860.5 million, an increaseof $610.0 million from the same period in 2007.
Net interest income increased $313.9 million over the same period in 2007 mainly due to increased gains on interest rateswaps employed as part of an overall interest rate risk management strategy. Total average assets decreased $4.1 billion, or17.1%, mainly due to the reduction in the size of the investment portfolio in 2007 as part of our overall balance sheetmanagement strategy. Total average deposits decreased $7.9 billion, or 35.5%, mainly due to a decrease in brokered andforeign deposits as we reduced our reliance on wholesale funding sources.
Total noninterest income increased $555.4 million compared to the same period in 2007 mainly due to increased gains onsecurities and the sale of non-strategic businesses. Securities gains increased $431.4 million primarily due to the sale of Cokecommon stock, partially offset by market value losses related to certain ABS that were estimated to be other-than-temporarily impaired. Trading gains and losses increased $40.2 million as gains on our long-term debt carried at fair valuewere partially offset by losses on certain illiquid assets. Gains on our public debt carried at fair value, net of related hedges in2008, were $431.7 million as compared to $140.9 million during 2007. The increase was also due to an $86.3 million gain onour holdings of Visa in connection with its IPO and an $81.8 million gain on sale of TransPlatinum were offset by an $81.8million decrease in gains on the sale/leaseback of real estate properties.
Total noninterest expense increased $67.7 million from the same period in 2007. The increase in expense was mainly due toa $183.4 million contribution of Coke common stock to our charitable foundation recognized in marketing and customerdevelopment expense. The increase was offset by a $33.5 million reversal of a portion of the Visa litigation expense.
75

Table 21 – Reconcilement of Non-U.S. GAAP Measures – Annual
Year Ended December 31
(Dollars in millions, except per share and other data) 2009 2008 2007 2006 2005
Net income/(loss) ($1,563.7) $795.8 $1,634.0 $2,117.4 $1,987.2Securities gains/(losses), net of tax 60.8 665.4 150.7 (31.3) (4.4)
Net income/(loss) excluding net securities gains(losses), net of tax (1,624.5) 130.4 1,483.3 2,148.7 1,991.6Coke stock dividend, net of tax (43.8) (49.8) (54.2) (53.3) (48.1)
Net income/(loss) excluding net securities gains/(losses) and the Coke stock dividend, net of tax (1,668.3) 80.6 1,429.1 2,095.4 1,943.5Preferred dividends, Series A (14.1) (22.3) (30.3) (7.7) -U.S. Treasury preferred dividends and accretion of discount (265.8) (26.6) - - -Distributed and undistributed earnings allocated to unvested shares 15.9 (6.0) - - -Gain on purchase of Series A preferred stock 94.3 - - - -
Net income/(loss) available to common shareholders excluding net securities gains/(losses) and theCoke stock dividend, net of tax ($1,838.0) $25.7 $1,398.8 $2,087.7 $1,943.5
Net income/(loss) available to common shareholders ($1,733.4) $741.0 $1,593.0 $2,097.5 $1,975.5Goodwill/intangible impairment charges other than MSRs attributable to common shareholders, after
tax (714.8) (27.0) - - -
Net income/(loss) available to common shareholders excluding goodwill/intangible impairment chargesother than MSRs, after tax8 ($1,018.6) $768.0 $1,593.0 $2,097.5 $1,975.5
Efficiency ratio1 79.07 % 63.83 % 63.28 % 59.23 % 59.88 %Impact of excluding amortization/impairment of goodwill/intangible assets other than MSRs (9.72) (1.32) (1.17) (1.26) (1.52)
Tangible efficiency ratio2 69.35 % 62.51 % 62.11 % 57.97 % 58.36 %
Total average assets $175,442.4 $175,848.3 $177,795.5 $180,315.1 $168,088.8Average net unrealized securities gains 1,611.9 1,909.5 2,300.8 1,620.5 1,949.4
Average assets less net unrealized securities gains $173,830.5 $173,938.8 $175,494.7 $178,694.6 $166,139.4
Total average common shareholders’ equity $17,218.6 $17,646.1 $17,428.4 $17,545.6 $16,732.9Average accumulated other comprehensive income (692.1) (1,220.9) (1,143.3) (976.0) (1,220.5)
Total average realized common shareholders’ equity $16,526.5 $16,425.2 $16,285.1 $16,569.6 $15,512.4
Return on average total assets (0.89) % 0.45 % 0.92 % 1.17 % 1.18 %Impact of excluding net realized and unrealized securities gains/(losses) and the Coke stock dividend (0.07) (0.40) (0.11) - (0.01)
Return on average total assets less net unrealized securities gains/(losses) 3 (0.96) % 0.05 % 0.81 % 1.17 % 1.17 %
Return on average common shareholders’ equity (10.07) % 4.20 % 9.14 % 11.95 % 11.81 %Impact of excluding net realized and unrealized securities gains/(losses) and the Coke stock dividend (1.05) (4.04) (0.62) 0.58 0.64
Return on average realized common shareholders’ equity4 (11.12) % 0.16 % 8.52 % 12.53 % 12.45 %
Total shareholders’ equity $22,530.9 $22,500.8 $18,169.9 $17,932.2 $17,133.6Goodwill, net of deferred taxes (6,204.4) (6,941.1) (6,921.5) (6,889.8) (6,835.1)Other intangible assets including MSRs, net of deferred taxes (1,671.1) (978.2) (1,308.6) (1,182.0) (1,123.0)MSRs 1,539.4 810.5 1,049.4 810.5 657.6
Tangible equity 16,194.8 15,392.0 10,989.2 10,670.9 9,833.1Preferred stock (4,917.3) (5,221.7) (500.0) (500.0) -
Tangible common equity $11,277.5 $10,170.3 $10,489.2 $10,170.9 $9,833.1
Total assets $174,164.7 $189,138.0 $179,573.9 $182,161.6 $179,712.8Goodwill (6,319.1) (7,043.5) (6,921.5) (6,889.8) (6,835.1)Other intangible assets including MSRs (1,711.3) (1,035.4) (1,363.0) (1,182.0) (1,123.0)MSRs 1,539.4 810.5 1,049.4 810.5 657.6
Tangible assets $167,673.7 $181,869.6 $172,338.8 $174,900.3 $172,412.3
Tangible equity to tangible assets5 9.66 % 8.46 % 6.38 % 6.10 % 5.70 %Tangible book value per common share6 $22.59 $28.69 $30.11 $28.66 $27.16
Net interest income $4,465.7 $4,619.6 $4,719.5 $4,660.4 $4,579.0Taxable-equivalent adjustment 123.3 117.5 102.7 88.0 75.5
Net interest income - FTE 4,589.0 4,737.1 4,822.2 4,748.4 4,654.5Noninterest income 3,710.3 4,473.5 3,428.7 3,468.4 3,155.0
Total revenue - FTE 8,299.3 9,210.6 8,250.9 8,216.8 7,809.5Securities gains/(losses), net 98.0 1,073.3 243.1 (50.5) (7.2)
Total revenue - FTE excluding net securities gains/(losses), net7 $8,201.3 $8,137.3 $8,007.8 $8,267.3 $7,816.7
1Computed by dividing noninterest expense by total revenue - FTE. The efficiency ratios are presented on an FTE basis. The FTE basis adjusts for the tax-favored status of net interest income from certain loansand investments. We believe this measure to be the preferred industry measurement of net interest income and it enhances comparability of net interest income arising from taxable and tax-exempt sources.2We present a tangible efficiency ratio which excludes the amortization/impairment of intangible assets other than MSRs. We believe this measure is useful to investors because, by removing the effect of theseintangible asset costs (the level of which may vary from company to company), it allows investors to more easily compare our efficiency to other companies in the industry. This measure is utilized by us toassess our efficiency and that of our lines of business.3Computed by dividing net income/(loss), excluding tax effected net securities gains/(losses) and the Coke stock dividend, by average assets less net unrealized gains on securities. We use this informationinternally to gauge our actual performance in the industry. We believe that the return on average assets less the net unrealized securities gains is more indicative of the our return on assets because it moreaccurately reflects the return on the assets that are related to our core businesses which are primarily client relationship and client transaction driven.4Computed by dividing net income/(loss) available to common shareholders, excluding tax effected net securities gains/(losses) and the Coke stock dividend, by average realized common shareholders’ equity.We believe that the return on average realized common shareholders’ equity is more indicative of our return on equity because the excluded equity relates primarily to the holding of a specific security.5We present a tangible equity to tangible assets ratio that excludes the after-tax impact of purchase accounting intangible assets. We believe this measure is useful to investors because, by removing the effect ofintangible assets that result from merger and acquisition activity (the level of which may vary from company to company), it allows investors to more easily compare our capital adequacy to other companies inthe industry. This measure is used by us to analyze capital adequacy.6We present a tangible book value per common share that excludes the after-tax impact of purchase accounting intangible assets and also excludes preferred stock from tangible equity. We believe this measureis useful to investors because, by removing the effect of intangible assets that result from merger and acquisition activity as well as preferred stock (the level of which may vary from company to company), itallows investors to more easily compare our book value on common stock to other companies in the industry. This measure is also used by management to analyze capital adequacy.7We present total revenue- FTE excluding realized securities gains/(losses), net. We believe noninterest income without net securities gains/(losses) is more indicative of our performance because it isolatesincome that is primarily client relationship and client transaction driven and is more indicative of normalized operations.8We present net income/(loss) available to common shareholders that excludes the impairment charge on goodwill. We believe this measure is useful to investors, because removing the non-cash impairmentcharge provides a more representative view of normalized operations and the measure also allows better comparability with peers in the industry who also provide a similar presentation when applicable. Inaddition, management uses this measure internally to analyze performance.
76
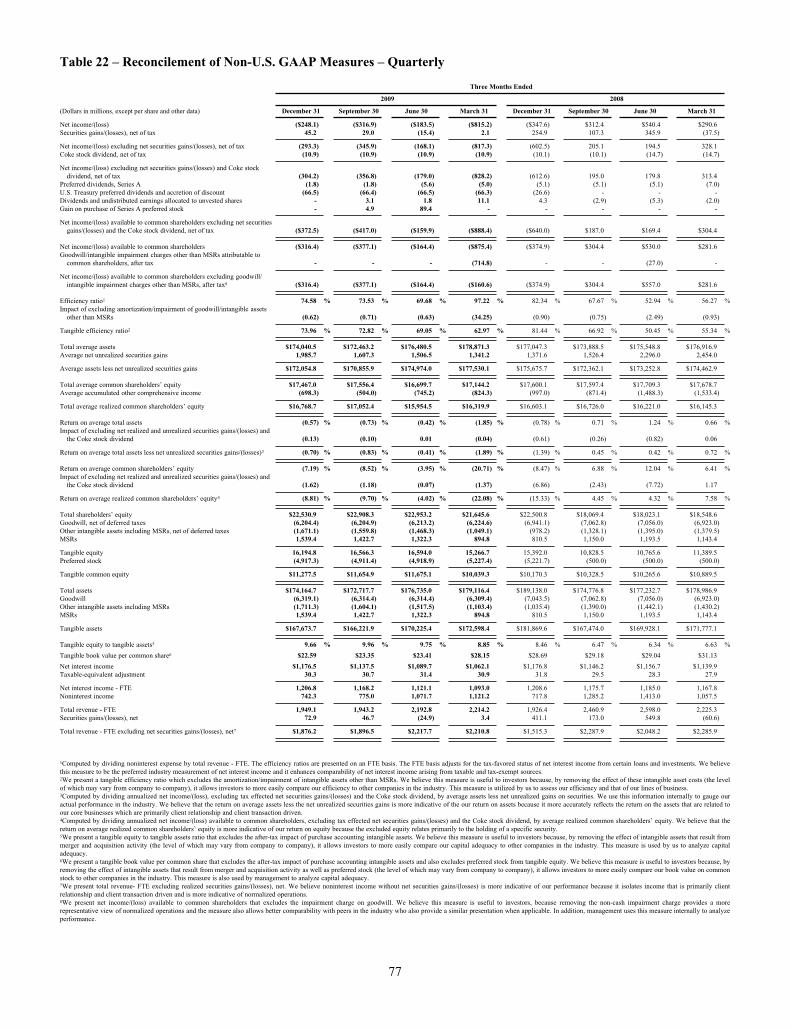
Table 22 – Reconcilement of Non-U.S. GAAP Measures – Quarterly
Three Months Ended
2009 2008
(Dollars in millions, except per share and other data) December 31 September 30 June 30 March 31 December 31 September 30 June 30 March 31
Net income/(loss) ($248.1) ($316.9) ($183.5) ($815.2) ($347.6) $312.4 $540.4 $290.6Securities gains/(losses), net of tax 45.2 29.0 (15.4) 2.1 254.9 107.3 345.9 (37.5)
Net income/(loss) excluding net securities gains/(losses), net of tax (293.3) (345.9) (168.1) (817.3) (602.5) 205.1 194.5 328.1Coke stock dividend, net of tax (10.9) (10.9) (10.9) (10.9) (10.1) (10.1) (14.7) (14.7)
Net income/(loss) excluding net securities gains/(losses) and Coke stockdividend, net of tax (304.2) (356.8) (179.0) (828.2) (612.6) 195.0 179.8 313.4
Preferred dividends, Series A (1.8) (1.8) (5.6) (5.0) (5.1) (5.1) (5.1) (7.0)U.S. Treasury preferred dividends and accretion of discount (66.5) (66.4) (66.5) (66.3) (26.6) - - -Dividends and undistributed earnings allocated to unvested shares - 3.1 1.8 11.1 4.3 (2.9) (5.3) (2.0)Gain on purchase of Series A preferred stock - 4.9 89.4 - - - - -
Net income/(loss) available to common shareholders excluding net securitiesgains/(losses) and the Coke stock dividend, net of tax ($372.5) ($417.0) ($159.9) ($888.4) ($640.0) $187.0 $169.4 $304.4
Net income/(loss) available to common shareholders ($316.4) ($377.1) ($164.4) ($875.4) ($374.9) $304.4 $530.0 $281.6Goodwill/intangible impairment charges other than MSRs attributable to
common shareholders, after tax - - - (714.8) - - (27.0) -
Net income/(loss) available to common shareholders excluding goodwill/intangible impairment charges other than MSRs, after tax8 ($316.4) ($377.1) ($164.4) ($160.6) ($374.9) $304.4 $557.0 $281.6
Efficiency ratio1 74.58 % 73.53 % 69.68 % 97.22 % 82.34 % 67.67 % 52.94 % 56.27 %Impact of excluding amortization/impairment of goodwill/intangible assets
other than MSRs (0.62) (0.71) (0.63) (34.25) (0.90) (0.75) (2.49) (0.93)
Tangible efficiency ratio2 73.96 % 72.82 % 69.05 % 62.97 % 81.44 % 66.92 % 50.45 % 55.34 %
Total average assets $174,040.5 $172,463.2 $176,480.5 $178,871.3 $177,047.3 $173,888.5 $175,548.8 $176,916.9Average net unrealized securities gains 1,985.7 1,607.3 1,506.5 1,341.2 1,371.6 1,526.4 2,296.0 2,454.0
Average assets less net unrealized securities gains $172,054.8 $170,855.9 $174,974.0 $177,530.1 $175,675.7 $172,362.1 $173,252.8 $174,462.9
Total average common shareholders’ equity $17,467.0 $17,556.4 $16,699.7 $17,144.2 $17,600.1 $17,597.4 $17,709.3 $17,678.7Average accumulated other comprehensive income (698.3) (504.0) (745.2) (824.3) (997.0) (871.4) (1,488.3) (1,533.4)
Total average realized common shareholders’ equity $16,768.7 $17,052.4 $15,954.5 $16,319.9 $16,603.1 $16,726.0 $16,221.0 $16,145.3
Return on average total assets (0.57) % (0.73) % (0.42) % (1.85) % (0.78) % 0.71 % 1.24 % 0.66 %Impact of excluding net realized and unrealized securities gains/(losses) and
the Coke stock dividend (0.13) (0.10) 0.01 (0.04) (0.61) (0.26) (0.82) 0.06
Return on average total assets less net unrealized securities gains/(losses)3 (0.70) % (0.83) % (0.41) % (1.89) % (1.39) % 0.45 % 0.42 % 0.72 %
Return on average common shareholders’ equity (7.19) % (8.52) % (3.95) % (20.71) % (8.47) % 6.88 % 12.04 % 6.41 %Impact of excluding net realized and unrealized securities gains/(losses) and
the Coke stock dividend (1.62) (1.18) (0.07) (1.37) (6.86) (2.43) (7.72) 1.17
Return on average realized common shareholders’ equity4 (8.81) % (9.70) % (4.02) % (22.08) % (15.33) % 4.45 % 4.32 % 7.58 %
Total shareholders’ equity $22,530.9 $22,908.3 $22,953.2 $21,645.6 $22,500.8 $18,069.4 $18,023.1 $18,548.6Goodwill, net of deferred taxes (6,204.4) (6,204.9) (6,213.2) (6,224.6) (6,941.1) (7,062.8) (7,056.0) (6,923.0)Other intangible assets including MSRs, net of deferred taxes (1,671.1) (1,559.8) (1,468.3) (1,049.1) (978.2) (1,328.1) (1,395.0) (1,379.5)MSRs 1,539.4 1,422.7 1,322.3 894.8 810.5 1,150.0 1,193.5 1,143.4
Tangible equity 16,194.8 16,566.3 16,594.0 15,266.7 15,392.0 10,828.5 10,765.6 11,389.5Preferred stock (4,917.3) (4,911.4) (4,918.9) (5,227.4) (5,221.7) (500.0) (500.0) (500.0)
Tangible common equity $11,277.5 $11,654.9 $11,675.1 $10,039.3 $10,170.3 $10,328.5 $10,265.6 $10,889.5
Total assets $174,164.7 $172,717.7 $176,735.0 $179,116.4 $189,138.0 $174,776.8 $177,232.7 $178,986.9Goodwill (6,319.1) (6,314.4) (6,314.4) (6,309.4) (7,043.5) (7,062.8) (7,056.0) (6,923.0)Other intangible assets including MSRs (1,711.3) (1,604.1) (1,517.5) (1,103.4) (1,035.4) (1,390.0) (1,442.1) (1,430.2)MSRs 1,539.4 1,422.7 1,322.3 894.8 810.5 1,150.0 1,193.5 1,143.4
Tangible assets $167,673.7 $166,221.9 $170,225.4 $172,598.4 $181,869.6 $167,474.0 $169,928.1 $171,777.1
Tangible equity to tangible assets5 9.66 % 9.96 % 9.75 % 8.85 % 8.46 % 6.47 % 6.34 % 6.63 %
Tangible book value per common share6 $22.59 $23.35 $23.41 $28.15 $28.69 $29.18 $29.04 $31.13
Net interest income $1,176.5 $1,137.5 $1,089.7 $1,062.1 $1,176.8 $1,146.2 $1,156.7 $1,139.9Taxable-equivalent adjustment 30.3 30.7 31.4 30.9 31.8 29.5 28.3 27.9
Net interest income - FTE 1,206.8 1,168.2 1,121.1 1,093.0 1,208.6 1,175.7 1,185.0 1,167.8Noninterest income 742.3 775.0 1,071.7 1,121.2 717.8 1,285.2 1,413.0 1,057.5
Total revenue - FTE 1,949.1 1,943.2 2,192.8 2,214.2 1,926.4 2,460.9 2,598.0 2,225.3Securities gains/(losses), net 72.9 46.7 (24.9) 3.4 411.1 173.0 549.8 (60.6)
Total revenue - FTE excluding net securities gains/(losses), net7 $1,876.2 $1,896.5 $2,217.7 $2,210.8 $1,515.3 $2,287.9 $2,048.2 $2,285.9
1Computed by dividing noninterest expense by total revenue - FTE. The efficiency ratios are presented on an FTE basis. The FTE basis adjusts for the tax-favored status of net interest income from certain loans and investments. We believethis measure to be the preferred industry measurement of net interest income and it enhances comparability of net interest income arising from taxable and tax-exempt sources.2We present a tangible efficiency ratio which excludes the amortization/impairment of intangible assets other than MSRs. We believe this measure is useful to investors because, by removing the effect of these intangible asset costs (the levelof which may vary from company to company), it allows investors to more easily compare our efficiency to other companies in the industry. This measure is utilized by us to assess our efficiency and that of our lines of business.3Computed by dividing annualized net income/(loss), excluding tax effected net securities gains/(losses) and the Coke stock dividend, by average assets less net unrealized gains on securities. We use this information internally to gauge ouractual performance in the industry. We believe that the return on average assets less the net unrealized securities gains is more indicative of the our return on assets because it more accurately reflects the return on the assets that are related toour core businesses which are primarily client relationship and client transaction driven.4Computed by dividing annualized net income/(loss) available to common shareholders, excluding tax effected net securities gains/(losses) and the Coke stock dividend, by average realized common shareholders’ equity. We believe that thereturn on average realized common shareholders’ equity is more indicative of our return on equity because the excluded equity relates primarily to the holding of a specific security.5We present a tangible equity to tangible assets ratio that excludes the after-tax impact of purchase accounting intangible assets. We believe this measure is useful to investors because, by removing the effect of intangible assets that result frommerger and acquisition activity (the level of which may vary from company to company), it allows investors to more easily compare our capital adequacy to other companies in the industry. This measure is used by us to analyze capitaladequacy.6We present a tangible book value per common share that excludes the after-tax impact of purchase accounting intangible assets and also excludes preferred stock from tangible equity. We believe this measure is useful to investors because, byremoving the effect of intangible assets that result from merger and acquisition activity as well as preferred stock (the level of which may vary from company to company), it allows investors to more easily compare our book value on commonstock to other companies in the industry. This measure is also used by management to analyze capital adequacy.7We present total revenue- FTE excluding realized securities gains/(losses), net. We believe noninterest income without net securities gains/(losses) is more indicative of our performance because it isolates income that is primarily clientrelationship and client transaction driven and is more indicative of normalized operations.8We present net income/(loss) available to common shareholders that excludes the impairment charge on goodwill. We believe this measure is useful to investors, because removing the non-cash impairment charge provides a morerepresentative view of normalized operations and the measure also allows better comparability with peers in the industry who also provide a similar presentation when applicable. In addition, management uses this measure internally to analyzeperformance.
77
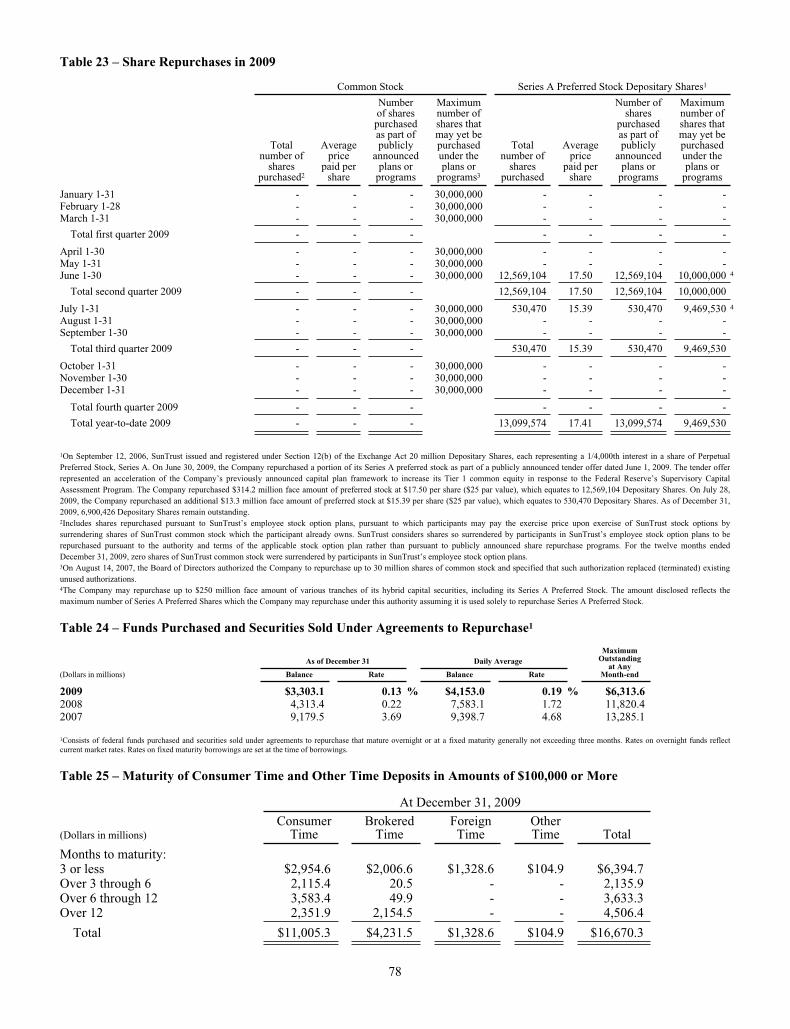
Table 23 – Share Repurchases in 2009
Common Stock Series A Preferred Stock Depositary Shares1
Totalnumber of
sharespurchased2
Averageprice
paid pershare
Numberof sharespurchasedas part ofpublicly
announcedplans or
programs
Maximumnumber ofshares thatmay yet bepurchasedunder theplans or
programs3
Totalnumber of
sharespurchased
Averageprice
paid pershare
Number ofshares
purchasedas part ofpublicly
announcedplans or
programs
Maximumnumber ofshares thatmay yet bepurchasedunder theplans or
programs
January 1-31 - - - 30,000,000 - - - -February 1-28 - - - 30,000,000 - - - -March 1-31 - - - 30,000,000 - - - -
Total first quarter 2009 - - - - - - -
April 1-30 - - - 30,000,000 - - - -May 1-31 - - - 30,000,000 - - - -June 1-30 - - - 30,000,000 12,569,104 17.50 12,569,104 10,000,000 4
Total second quarter 2009 - - - 12,569,104 17.50 12,569,104 10,000,000
July 1-31 - - - 30,000,000 530,470 15.39 530,470 9,469,530 4
August 1-31 - - - 30,000,000 - - - -September 1-30 - - - 30,000,000 - - - -
Total third quarter 2009 - - - 530,470 15.39 530,470 9,469,530
October 1-31 - - - 30,000,000 - - - -November 1-30 - - - 30,000,000 - - - -December 1-31 - - - 30,000,000 - - - -
Total fourth quarter 2009 - - - - - - -
Total year-to-date 2009 - - - 13,099,574 17.41 13,099,574 9,469,530
1On September 12, 2006, SunTrust issued and registered under Section 12(b) of the Exchange Act 20 million Depositary Shares, each representing a 1/4,000th interest in a share of PerpetualPreferred Stock, Series A. On June 30, 2009, the Company repurchased a portion of its Series A preferred stock as part of a publicly announced tender offer dated June 1, 2009. The tender offerrepresented an acceleration of the Company’s previously announced capital plan framework to increase its Tier 1 common equity in response to the Federal Reserve’s Supervisory CapitalAssessment Program. The Company repurchased $314.2 million face amount of preferred stock at $17.50 per share ($25 par value), which equates to 12,569,104 Depositary Shares. On July 28,2009, the Company repurchased an additional $13.3 million face amount of preferred stock at $15.39 per share ($25 par value), which equates to 530,470 Depositary Shares. As of December 31,2009, 6,900,426 Depositary Shares remain outstanding.2Includes shares repurchased pursuant to SunTrust’s employee stock option plans, pursuant to which participants may pay the exercise price upon exercise of SunTrust stock options bysurrendering shares of SunTrust common stock which the participant already owns. SunTrust considers shares so surrendered by participants in SunTrust’s employee stock option plans to berepurchased pursuant to the authority and terms of the applicable stock option plan rather than pursuant to publicly announced share repurchase programs. For the twelve months endedDecember 31, 2009, zero shares of SunTrust common stock were surrendered by participants in SunTrust’s employee stock option plans.3On August 14, 2007, the Board of Directors authorized the Company to repurchase up to 30 million shares of common stock and specified that such authorization replaced (terminated) existingunused authorizations.4The Company may repurchase up to $250 million face amount of various tranches of its hybrid capital securities, including its Series A Preferred Stock. The amount disclosed reflects themaximum number of Series A Preferred Shares which the Company may repurchase under this authority assuming it is used solely to repurchase Series A Preferred Stock.
Table 24 – Funds Purchased and Securities Sold Under Agreements to Repurchase1
As of December 31 Daily AverageMaximum
Outstandingat Any
Month-end(Dollars in millions) Balance Rate Balance Rate
2009 $3,303.1 0.13 % $4,153.0 0.19 % $6,313.62008 4,313.4 0.22 7,583.1 1.72 11,820.42007 9,179.5 3.69 9,398.7 4.68 13,285.1
1Consists of federal funds purchased and securities sold under agreements to repurchase that mature overnight or at a fixed maturity generally not exceeding three months. Rates on overnight funds reflectcurrent market rates. Rates on fixed maturity borrowings are set at the time of borrowings.
Table 25 – Maturity of Consumer Time and Other Time Deposits in Amounts of $100,000 or More
At December 31, 2009
(Dollars in millions)Consumer
TimeBrokered
TimeForeignTime
OtherTime Total
Months to maturity:3 or less $2,954.6 $2,006.6 $1,328.6 $104.9 $6,394.7Over 3 through 6 2,115.4 20.5 - - 2,135.9Over 6 through 12 3,583.4 49.9 - - 3,633.3Over 12 2,351.9 2,154.5 - - 4,506.4
Total $11,005.3 $4,231.5 $1,328.6 $104.9 $16,670.3
78

Table 26 – Maturity Distribution of Securities Available for Sale
As of December 31, 2009
(Dollars in millions)1 Yearor Less
1-5Years
5-10Years
After 10Years Total
Distribution of Maturities:Amortized Cost
U.S. Treasury and federal agencies $249.9 $7,563.3 $121.8 $5.0 $7,940.0U.S. states and political subdivisions 141.7 487.4 136.5 162.3 927.9Residential mortgage-backed securities - agency1 172.2 11,396.8 1,160.9 2,974.7 15,704.6Residential mortgage-backed securities - private 28.8 127.0 344.8 - 500.6Other debt securities 74.5 524.6 152.8 33.8 785.7
Total debt securities $667.1 $20,099.1 $1,916.8 $3,175.8 $25,858.8
Fair ValueU.S. Treasury and federal agencies $251.1 $7,537.0 $121.0 $5.0 $7,914.1U.S. states and political subdivisions 144.3 507.2 140.1 153.5 945.1Residential mortgage-backed securities - agency1 177.3 11,592.6 1,220.8 2,925.4 15,916.1Residential mortgage-backed securities - private 26.6 108.8 271.8 - 407.2Other debt securities 77.5 530.4 159.1 30.4 797.4
Total debt securities $676.8 $20,276.0 $1,912.8 $3,114.3 $25,979.9
Weighted average yield (FTE):U.S. Treasury and federal agencies 3.06 % 1.43 % 4.85 % 4.44 % 1.53 %U.S. states and political subdivisions 6.37 6.30 6.11 3.86 5.85Residential mortgage-backed securities - agency1 4.12 4.11 5.58 4.39 4.27Residential mortgage-backed securities - private 3.54 8.24 6.92 - 7.06Other debt securities 0.98 2.66 5.76 1.08 3.04
Total debt securities 3.82 % 3.14 % 5.83 % 4.35 % 3.50 %
1Distribution of maturities is based on the expected average life of the assets.
Table 27 – Loan Maturity
As of December 31, 2009Remaining Maturities of Selected Loans
(Dollars in millions) TotalWithin1 Year
1-5Years
After5 Years
Loan MaturityCommercial and commercial real estate 1 $42,447.0 $17,330.1 $21,738.0 $3,378.9Real estate - construction 6,646.8 5,039.7 1,441.0 166.1
Total $49,093.8 $22,369.8 $23,179.0 $3,545.0
Interest Rate SensitivitySelected loans with:
Predetermined interest rates $5,518.0 $1,510.8Floating or adjustable interest rates 17,661.0 2,034.2
Total $23,179.0 $3,545.0
1Excludes $5,121.5 million in lease financing.
Item 7A. QUANTITATIVE AND QUALITATIVE DISCLOSURES ABOUT MARKET RISK
See “Market Risk Management” in the MD&A which is incorporated herein by reference.
79

Item 8. FINANCIAL STATEMENTS AND SUPPLEMENTARY DATA
Report of Independent Registered Public Accounting Firm
The Board of Directors and Shareholders of SunTrust Banks, Inc.
We have audited the accompanying consolidated balance sheets of SunTrust Banks, Inc. and subsidiaries (the Company) asof December 31, 2009 and 2008, and the related consolidated statements of income/(loss), shareholders’ equity, and cashflows for each of the three years in the period ended December 31, 2009. These financial statements are the responsibility ofthe Company’s management. Our responsibility is to express an opinion on these financial statements based on our audits.
We conducted our audits in accordance with the standards of the Public Company Accounting Oversight Board (UnitedStates). Those standards require that we plan and perform the audit to obtain reasonable assurance about whether thefinancial statements are free of material misstatement. An audit includes examining, on a test basis, evidence supporting theamounts and disclosures in the financial statements. An audit also includes assessing the accounting principles used andsignificant estimates made by management, as well as evaluating the overall financial statement presentation. We believe thatour audits provide a reasonable basis for our opinion.
In our opinion, the financial statements referred to above present fairly, in all material respects, the consolidated financialposition of SunTrust Banks, Inc. and subsidiaries at December 31, 2009 and 2008, and the consolidated results of theiroperations and their cash flows for each of the three years in the period ended December 31, 2009, in conformity with U.S.generally accepted accounting principles.
We also have audited, in accordance with the standards of the Public Company Accounting Oversight Board (United States),SunTrust Banks, Inc.’s internal control over financial reporting as of December 31, 2009, based on criteria established inInternal Control-Integrated Framework issued by the Committee of Sponsoring Organizations of the Treadway Commissionand our report dated February 23, 2010 expressed an unqualified opinion thereon.
Atlanta, GeorgiaFebruary 23, 2010
80

Report of Independent Registered Public Accounting Firm
The Board of Directors and Shareholders of SunTrust Banks, Inc.
We have audited SunTrust Banks, Inc.’s internal control over financial reporting as of December 31, 2009, based on criteriaestablished in Internal Control—Integrated Framework issued by the Committee of Sponsoring Organizations of theTreadway Commission (the COSO criteria). SunTrust Banks, Inc.’s management is responsible for maintaining effectiveinternal control over financial reporting, and for its assessment of the effectiveness of internal control over financial reportingincluded in Management’s Report on Internal Control over Financial Reporting appearing under Item 9A. Our responsibilityis to express an opinion on the Company’s internal control over financial reporting based on our audit.
We conducted our audit in accordance with the standards of the Public Company Accounting Oversight Board (UnitedStates). Those standards require that we plan and perform the audit to obtain reasonable assurance about whether effectiveinternal control over financial reporting was maintained in all material respects. Our audit included obtaining anunderstanding of internal control over financial reporting, assessing the risk that a material weakness exists, testing andevaluating the design and operating effectiveness of internal control based on the assessed risk, and performing such otherprocedures as we considered necessary in the circumstances. We believe that our audit provides a reasonable basis for ouropinion.
A company’s internal control over financial reporting is a process designed to provide reasonable assurance regarding thereliability of financial reporting and the preparation of financial statements for external purposes in accordance withgenerally accepted accounting principles. A company’s internal control over financial reporting includes those policies andprocedures that (1) pertain to the maintenance of records that, in reasonable detail, accurately and fairly reflect thetransactions and dispositions of the assets of the company; (2) provide reasonable assurance that transactions are recorded asnecessary to permit preparation of financial statements in accordance with generally accepted accounting principles, and thatreceipts and expenditures of the company are being made only in accordance with authorizations of management anddirectors of the company; and (3) provide reasonable assurance regarding prevention or timely detection of unauthorizedacquisition, use or disposition of the company’s assets that could have a material effect on the financial statements.
Because of its inherent limitations, internal control over financial reporting may not prevent or detect misstatements. Also,projections of any evaluation of effectiveness to future periods are subject to the risk that controls may become inadequatebecause of changes in conditions, or that the degree of compliance with the policies or procedures may deteriorate.
In our opinion, SunTrust Banks, Inc. maintained, in all material respects, effective internal control over financial reporting asof December 31, 2009, based on the COSO criteria.
We also have audited, in accordance with the standards of the Public Company Accounting Oversight Board (United States),the consolidated balance sheets of SunTrust Banks, Inc. and subsidiaries as of December 31, 2009 and 2008, and the relatedconsolidated statements of income/(loss), shareholders’ equity, and cash flows for each of the three years in the period endedDecember 31, 2009 and our report dated February 23, 2010 expressed an unqualified opinion thereon.
Atlanta, GeorgiaFebruary 23, 2010
81
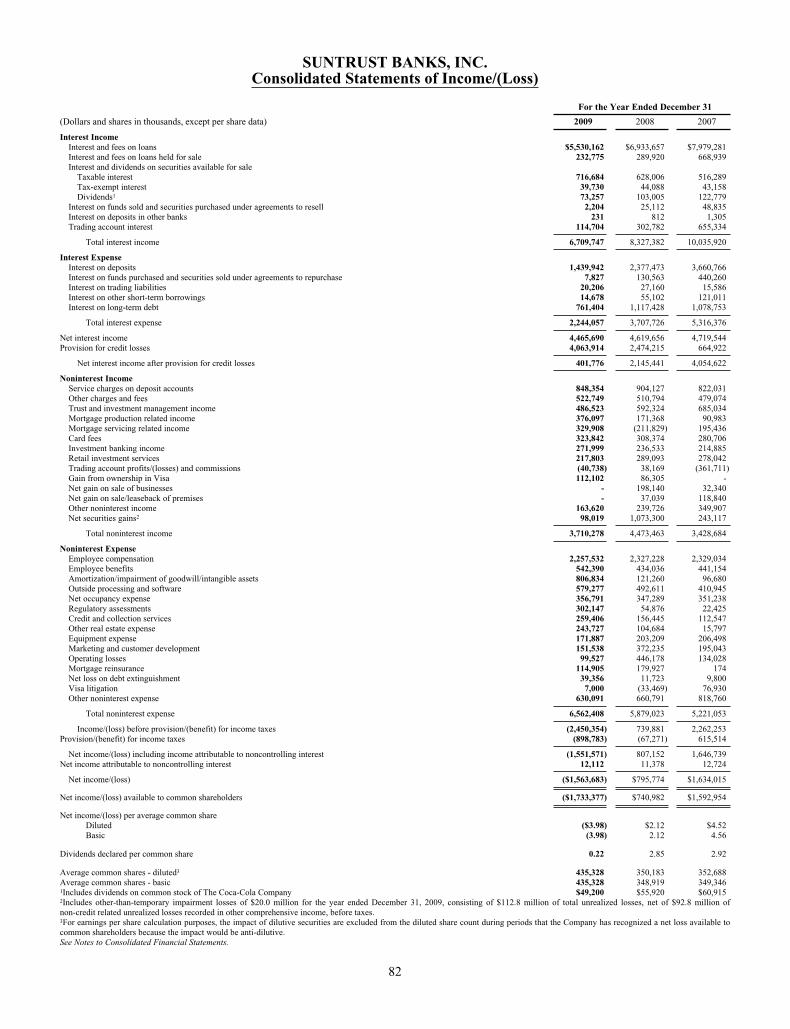
SUNTRUST BANKS, INC.Consolidated Statements of Income/(Loss)
For the Year Ended December 31
(Dollars and shares in thousands, except per share data) 2009 2008 2007
Interest IncomeInterest and fees on loans $5,530,162 $6,933,657 $7,979,281Interest and fees on loans held for sale 232,775 289,920 668,939Interest and dividends on securities available for sale
Taxable interest 716,684 628,006 516,289Tax-exempt interest 39,730 44,088 43,158Dividends1 73,257 103,005 122,779
Interest on funds sold and securities purchased under agreements to resell 2,204 25,112 48,835Interest on deposits in other banks 231 812 1,305Trading account interest 114,704 302,782 655,334
Total interest income 6,709,747 8,327,382 10,035,920
Interest ExpenseInterest on deposits 1,439,942 2,377,473 3,660,766Interest on funds purchased and securities sold under agreements to repurchase 7,827 130,563 440,260Interest on trading liabilities 20,206 27,160 15,586Interest on other short-term borrowings 14,678 55,102 121,011Interest on long-term debt 761,404 1,117,428 1,078,753
Total interest expense 2,244,057 3,707,726 5,316,376
Net interest income 4,465,690 4,619,656 4,719,544Provision for credit losses 4,063,914 2,474,215 664,922
Net interest income after provision for credit losses 401,776 2,145,441 4,054,622
Noninterest IncomeService charges on deposit accounts 848,354 904,127 822,031Other charges and fees 522,749 510,794 479,074Trust and investment management income 486,523 592,324 685,034Mortgage production related income 376,097 171,368 90,983Mortgage servicing related income 329,908 (211,829) 195,436Card fees 323,842 308,374 280,706Investment banking income 271,999 236,533 214,885Retail investment services 217,803 289,093 278,042Trading account profits/(losses) and commissions (40,738) 38,169 (361,711)Gain from ownership in Visa 112,102 86,305 -Net gain on sale of businesses - 198,140 32,340Net gain on sale/leaseback of premises - 37,039 118,840Other noninterest income 163,620 239,726 349,907Net securities gains2 98,019 1,073,300 243,117
Total noninterest income 3,710,278 4,473,463 3,428,684
Noninterest ExpenseEmployee compensation 2,257,532 2,327,228 2,329,034Employee benefits 542,390 434,036 441,154Amortization/impairment of goodwill/intangible assets 806,834 121,260 96,680Outside processing and software 579,277 492,611 410,945Net occupancy expense 356,791 347,289 351,238Regulatory assessments 302,147 54,876 22,425Credit and collection services 259,406 156,445 112,547Other real estate expense 243,727 104,684 15,797Equipment expense 171,887 203,209 206,498Marketing and customer development 151,538 372,235 195,043Operating losses 99,527 446,178 134,028Mortgage reinsurance 114,905 179,927 174Net loss on debt extinguishment 39,356 11,723 9,800Visa litigation 7,000 (33,469) 76,930Other noninterest expense 630,091 660,791 818,760
Total noninterest expense 6,562,408 5,879,023 5,221,053
Income/(loss) before provision/(benefit) for income taxes (2,450,354) 739,881 2,262,253Provision/(benefit) for income taxes (898,783) (67,271) 615,514
Net income/(loss) including income attributable to noncontrolling interest (1,551,571) 807,152 1,646,739Net income attributable to noncontrolling interest 12,112 11,378 12,724
Net income/(loss) ($1,563,683) $795,774 $1,634,015
Net income/(loss) available to common shareholders ($1,733,377) $740,982 $1,592,954
Net income/(loss) per average common shareDiluted ($3.98) $2.12 $4.52Basic (3.98) 2.12 4.56
Dividends declared per common share 0.22 2.85 2.92
Average common shares - diluted3 435,328 350,183 352,688Average common shares - basic 435,328 348,919 349,3461Includes dividends on common stock of The Coca-Cola Company $49,200 $55,920 $60,9152Includes other-than-temporary impairment losses of $20.0 million for the year ended December 31, 2009, consisting of $112.8 million of total unrealized losses, net of $92.8 million ofnon-credit related unrealized losses recorded in other comprehensive income, before taxes.3For earnings per share calculation purposes, the impact of dilutive securities are excluded from the diluted share count during periods that the Company has recognized a net loss available tocommon shareholders because the impact would be anti-dilutive.See Notes to Consolidated Financial Statements.
82
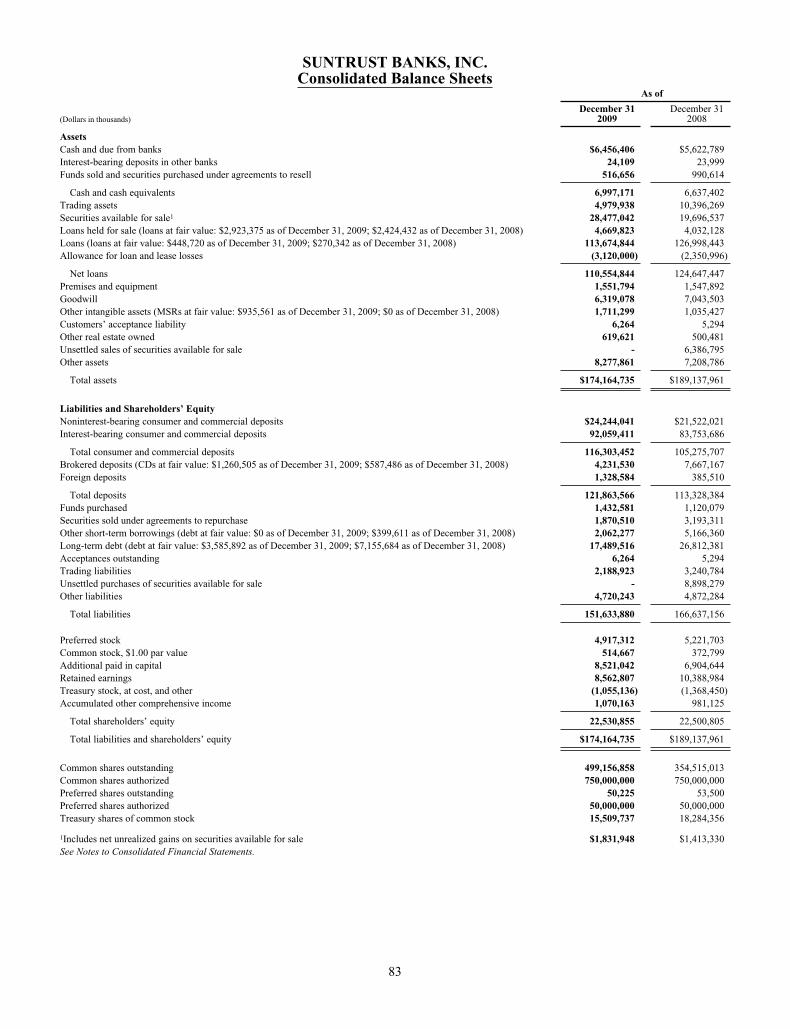
SUNTRUST BANKS, INC.Consolidated Balance Sheets
As of
(Dollars in thousands)December 31
2009December 31
2008
AssetsCash and due from banks $6,456,406 $5,622,789Interest-bearing deposits in other banks 24,109 23,999Funds sold and securities purchased under agreements to resell 516,656 990,614
Cash and cash equivalents 6,997,171 6,637,402Trading assets 4,979,938 10,396,269Securities available for sale1 28,477,042 19,696,537Loans held for sale (loans at fair value: $2,923,375 as of December 31, 2009; $2,424,432 as of December 31, 2008) 4,669,823 4,032,128Loans (loans at fair value: $448,720 as of December 31, 2009; $270,342 as of December 31, 2008) 113,674,844 126,998,443Allowance for loan and lease losses (3,120,000) (2,350,996)
Net loans 110,554,844 124,647,447Premises and equipment 1,551,794 1,547,892Goodwill 6,319,078 7,043,503Other intangible assets (MSRs at fair value: $935,561 as of December 31, 2009; $0 as of December 31, 2008) 1,711,299 1,035,427Customers’ acceptance liability 6,264 5,294Other real estate owned 619,621 500,481Unsettled sales of securities available for sale - 6,386,795Other assets 8,277,861 7,208,786
Total assets $174,164,735 $189,137,961
Liabilities and Shareholders’ EquityNoninterest-bearing consumer and commercial deposits $24,244,041 $21,522,021Interest-bearing consumer and commercial deposits 92,059,411 83,753,686
Total consumer and commercial deposits 116,303,452 105,275,707Brokered deposits (CDs at fair value: $1,260,505 as of December 31, 2009; $587,486 as of December 31, 2008) 4,231,530 7,667,167Foreign deposits 1,328,584 385,510
Total deposits 121,863,566 113,328,384Funds purchased 1,432,581 1,120,079Securities sold under agreements to repurchase 1,870,510 3,193,311Other short-term borrowings (debt at fair value: $0 as of December 31, 2009; $399,611 as of December 31, 2008) 2,062,277 5,166,360Long-term debt (debt at fair value: $3,585,892 as of December 31, 2009; $7,155,684 as of December 31, 2008) 17,489,516 26,812,381Acceptances outstanding 6,264 5,294Trading liabilities 2,188,923 3,240,784Unsettled purchases of securities available for sale - 8,898,279Other liabilities 4,720,243 4,872,284
Total liabilities 151,633,880 166,637,156
Preferred stock 4,917,312 5,221,703Common stock, $1.00 par value 514,667 372,799Additional paid in capital 8,521,042 6,904,644Retained earnings 8,562,807 10,388,984Treasury stock, at cost, and other (1,055,136) (1,368,450)Accumulated other comprehensive income 1,070,163 981,125
Total shareholders’ equity 22,530,855 22,500,805
Total liabilities and shareholders’ equity $174,164,735 $189,137,961
Common shares outstanding 499,156,858 354,515,013Common shares authorized 750,000,000 750,000,000Preferred shares outstanding 50,225 53,500Preferred shares authorized 50,000,000 50,000,000Treasury shares of common stock 15,509,737 18,284,356
1Includes net unrealized gains on securities available for sale $1,831,948 $1,413,330See Notes to Consolidated Financial Statements.
83

SUNTRUST BANKS, INC.Consolidated Statements of Shareholders’ Equity
(Dollars and shares in thousands, except per share data)Preferred
Stock
CommonShares
OutstandingCommon
StockAdditional
Paid in CapitalRetainedEarnings
Treasury Stockand Other1
AccumulatedOther
ComprehensiveIncome Total
Balance, January 1, 2007 $500,000 354,903 $370,578 $6,627,196 $10,541,152 ($1,032,720) $925,949 $17,932,155Net income - - - - 1,634,015 - - 1,634,015Other comprehensive income:Change in unrealized gains (losses) on securities, net of tax - - - - - - 243,986 243,986Change in unrealized gains (losses) on derivatives, net of tax - - - - - - 139,732 139,732Change related to employee benefit plans - - - - - - 70,401 70,401
Total comprehensive income 2,088,134Change in noncontrolling interest - - - - - (1,125) - (1,125)Common stock dividends, $2.92 per share - - - - (1,026,594) - - (1,026,594)Series A preferred stock dividends, $6,055 per share - - - - (30,275) - - (30,275)Exercise of stock options and stock compensation expense - 2,794 - (1,471) - 211,460 - 209,989Acquisition of treasury stock - (10,758) - 71,267 - (924,652) - (853,385)Restricted stock activity - 682 - 8,197 (3,535) (10,507) - (5,845)Amortization of restricted stock compensation - - - - - 34,820 - 34,820Issuance of stock for employee benefit plans - 785 - 2,046 - 60,594 - 62,640Adoption of fair value election - - - - (388,604) - 147,374 (241,230)Adoption of fair value measurement - - - - (10,943) - - (10,943)Adoption of uncertain tax position guidance - - - - (41,844) - - (41,844)Adoption of leveraged lease cash flows guidance - - - - (26,273) - - (26,273)Pension plan changes and resulting remeasurement - - - - - - 79,707 79,707Other activity - 5 - 58 (459) 412 - 11
Balance, December 31, 2007 $500,000 348,411 $370,578 $6,707,293 $10,646,640 ($1,661,718) $1,607,149 $18,169,942Net income - - - - 795,774 - - 795,774Other comprehensive income:Change in unrealized gains (losses) on securities, net of tax - - - - - - (806,586) (806,586)Change in unrealized gains (losses) on derivatives, net of tax - - - - - - 688,487 688,487Change related to employee benefit plans - - - - - - (507,925) (507,925)
Total comprehensive income 169,750Change in noncontrolling interest - - - - - (4,728) - (4,728)Issuance of common stock for GB&T acquisition - 2,221 2,221 152,292 - - - 154,513Common stock dividends, $2.85 per share - - - - (1,004,146) - - (1,004,146)Series A preferred stock dividends, $4,451 per share - - - - (22,255) - - (22,255)Issuance of U.S. Treasury preferred stock 4,717,971 - - 132,029 - - - 4,850,000Accretion of discount associated with U.S. Treasury preferred
stock 3,732 - - - (3,732) - - -U.S. Treasury preferred stock dividends, $471 per share - - - - (22,847) - - (22,847)Exercise of stock options and stock compensation expense - 495 - 16,160 - 39,766 - 55,926Restricted stock activity - 1,693 - (46,797) (450) 46,712 - (535)Amortization of restricted stock compensation - - - - - 76,656 - 76,656Issuance of stock for employee benefit plans - 1,695 - (56,834) - 134,862 - 78,028Other activity - - - 501 - - - 501
Balance, December 31, 2008 $5,221,703 354,515 $372,799 $6,904,644 $10,388,984 ($1,368,450) $981,125 $22,500,805Net loss - - - - (1,563,683) - - (1,563,683)Other comprehensive income:Change in unrealized gains (losses) on securities, net of taxes - - - - - - 280,336 280,336Change in unrealized gains (losses) on derivatives, net of taxes - - - - - - (434,795) (434,795)Change related to employee benefit plans - - - - - - 251,212 251,212
Total comprehensive loss (1,466,930)Change in noncontrolling interest - - - - - (4,500) - (4,500)Common stock dividends, $0.22 per share - - - - (82,619) - - (82,619)Series A preferred stock dividends, $4,056 per share - - - - (14,143) - - (14,143)U.S. Treasury preferred stock dividends, $5,004 per share - - - - (242,688) - - (242,688)Accretion of discount associated with U.S.
Treasury preferred stock 23,098 - - - (23,098) - - -Issuance of common stock in connection with SCAP capital plan - 141,868 141,868 1,687,867 - - - 1,829,735Extinguishment of forward stock purchase contract - - - 173,653 - - - 173,653Repurchase of preferred stock (327,489) - - 5,047 94,318 - - (228,124)Exercise of stock options and stock compensation expense - - - 11,406 - - - 11,406Restricted stock activity - 1,812 - (206,305) - 176,603 - (29,702)Amortization of restricted stock compensation - - - - - 66,420 - 66,420Issuance of stock for employee benefit plans and other - 962 - (55,270) (1,979) 74,791 - 17,542Adoption of OTTI guidance 2 - - - - 7,715 - (7,715) -
Balance, December 31, 2009 $4,917,312 499,157 $514,667 $8,521,042 $8,562,807 ($1,055,136) $1,070,163 $22,530,855
1 Balance at December 31, 2009 includes ($1,104,171) for treasury stock, ($59,161) for compensation element of restricted stock, $108,196 for noncontrolling interest.Balance at December 31, 2008 includes ($1,367,752) for treasury stock, ($113,394) for compensation element of restricted stock, $112,696 for noncontrolling interest.Balance at December 31, 2007 includes ($1,688,521) for treasury stock, ($90,622) for compensation element of restricted stock, $117,425 for noncontrolling interest.
2 Effective April 1, 2009, the Company adopted the update to ASC 320-10, which provided the guidance in determining the impact of other-than-temporary impairment. Amounts shown are net-of-tax. See Note 1, “SignificantAccounting Policies” and Note 5, “Securities Available For Sale” to the Consolidated Financial Statements for additional information on adoption of this accounting guidance.
See Notes to Consolidated Financial Statements.
84

SUNTRUST BANKS, INC.Consolidated Statements of Cash Flows
For the Year Ended December 31
(Dollars in thousands) 2009 2008 2007
Cash Flows from Operating Activities:Net income/(loss) including income attributable to noncontrolling interest ($1,551,571) $807,152 $1,646,739Adjustments to reconcile net income/(loss) to net cash provided by operating activities:
Net gain on sale of businesses - (198,140) (32,340)Visa litigation 7,000 (33,469) 76,930Expense recognized on contribution of common stock of Coke - 183,418 -Gain from ownership in Visa (112,102) (86,305) -Depreciation, amortization and accretion 966,093 824,263 802,342Impairment of goodwill/intangibles 751,156 415,000 -Recovery of MSRs impairment (199,159) - -Origination of MSRs (681,813) (485,597) (639,158)Provisions for credit losses and foreclosed property 4,270,340 2,551,574 683,114Deferred income tax benefit (894,974) (221,235) (147,758)Amortization of restricted stock compensation 66,420 76,656 34,820Stock option compensation 11,406 20,185 24,275Excess tax benefits from stock-based compensation (387) (4,580) (11,259)Net loss on extinguishment of debt 39,356 11,723 9,800Net securities gains (98,019) (1,073,300) (243,117)Net gain on sale/leaseback of premises - (37,039) (118,840)Net gain on sale of assets (65,648) (60,311) (30,569)Net (increase)/decrease in loans held for sale (965,249) 4,191,838 2,479,428
Contributions to retirement plans (25,666) (386,535) (11,185)Net (increase)/decrease in other assets 1,522,117 (2,694,422) (1,993,001)Net (decrease)/increase in other liabilities 2,864 (184,601) 1,200,614
Net cash provided by operating activities 3,042,164 3,616,275 3,730,835
Cash Flows from Investing Activities:Proceeds from maturities, calls and paydowns of securities available for sale 3,406,941 1,292,065 1,073,340Proceeds from sales of securities available for sale 19,487,740 5,737,627 1,199,231Purchases of securities available for sale (33,793,498) (8,170,824) (7,640,289)Proceeds from maturities, calls and paydowns of trading securities 148,283 4,329,198 11,896,617Proceeds from sales of trading securities 2,113,466 3,046,185 19,240,250Purchases of trading securities (85,965) (3,687,561) (22,717,152)Net decrease/(increase) in loans 8,609,239 (5,807,828) (7,158,570)Proceeds from sales of loans held for investment 755,855 881,410 5,721,662Proceeds from sale of MSRs - 148,387 270,215Capital expenditures (212,186) (221,602) (186,431)Net cash and cash equivalents received for sale of businesses - 301,604 -Net cash paid and cash equivalents acquired in acquisitions (6,711) (23,931) (32,200)Proceeds from sale/redemption of Visa shares 112,102 86,305 -Contingent consideration payouts related to acquisitions (18,043) (2,830) (50,689)Proceeds from the sale/leaseback of premises - 288,851 764,368Proceeds from the sale of other assets 566,451 318,910 145,871
Net cash provided by/(used) in investing activities 1,083,674 (1,484,034) 2,526,223
Cash Flows from Financing Activities:Net increase in consumer and commercial deposits 10,582,750 1,767,908 2,100,134Net decrease in foreign and brokered deposits (2,497,023) (7,917,898) (8,273,116)Assumption of deposits, net 448,858 160,517 -Net decrease in funds purchased, securities sold under agreements to repurchase, and other short-term borrowings (4,114,382) (2,796,359) (1,679,833)Proceeds from the issuance of long-term debt 574,560 7,834,388 5,197,020Repayment of long-term debt (10,034,157) (4,024,675) (1,553,412)Proceeds from the issuance of preferred stock - 4,850,000 -Proceeds from the exercise of stock options - 25,569 186,000Acquisition of treasury stock - - (853,385)Excess tax benefits from stock-based compensation 387 4,580 11,259Proceeds from the issuance of common stock 1,829,735 - -Repurchase of preferred stock (228,124) - -Common and preferred dividends paid (328,673) (1,041,470) (1,056,869)
Net cash used in financing activities (3,766,069) (1,137,440) (5,922,202)
Net increase in cash and cash equivalents 359,769 994,801 334,856Cash and cash equivalents at beginning of period 6,637,402 5,642,601 5,307,745
Cash and cash equivalents at end of period $6,997,171 $6,637,402 $5,642,601
Supplemental Disclosures:Interest paid $2,366,891 $3,868,034 $5,277,639Income taxes paid 44,723 341,396 724,351Income taxes refunded (106,020) (4,275) (13,859)Securities transferred from available for sale to trading - - 15,143,109Loans transferred from loans to loans held for sale 124,879 - 4,054,246Loans transferred from loans held for sale to loans 306,966 656,134 837,401Loans transferred from loans to other real estate owned 811,659 754,091 -Issuance of common stock for acquisition of GB&T - 154,513 -Noncash gain on contribution of common stock of Coke - 183,418 -Unsettled purchases of securities available for sale as of year-end - 8,898,279 -Unsettled sales of securities available for sale as of year-end - 6,386,795 -Amortization of deferred gain on sale/leaseback of premises 59,044 55,616 5,301U.S. Treasury preferred dividend accrued but unpaid 10,777 7,778 -Accretion on U.S. Treasury preferred stock 23,098 3,732 -Extinguishment of forward stock purchase contract 173,653 - -Gain on repurchase of Series A preferred stock 94,318 - -
See Notes to Consolidated Financial Statements.
85

SUNTRUST BANKS, INC.Notes to Consolidated Financial Statements
Note 1 – Significant Accounting Policies
General
SunTrust, one of the nation’s largest commercial banking organizations, is a financial services holding company with itsheadquarters in Atlanta, Georgia. SunTrust’s principal banking subsidiary, SunTrust Bank, offers a full line of financialservices for consumers and businesses through its branches located primarily in Florida, Georgia, Maryland, North Carolina,South Carolina, Tennessee, Virginia, and the District of Columbia. Within its geographic footprint, the Company operatedunder four business segments during 2009. These business segments are: Retail & Commercial, Wealth and InvestmentManagement, Corporate and Investment Banking, and Household Lending. In addition to traditional deposit, credit, and trustand investment services offered by SunTrust Bank, other SunTrust subsidiaries provide mortgage banking, credit-relatedinsurance, asset management, securities brokerage, and capital markets services.
Principles of Consolidation and Basis of Presentation
The consolidated financial statements include the accounts of the Company, its majority-owned subsidiaries, and VIEs wherethe Company is the primary beneficiary. All significant intercompany accounts and transactions have been eliminated.Results of operations of companies purchased are included from the date of acquisition. Results of operations associated withcompanies or net assets sold are included through the date of disposition. The Company reports any noncontrolling interestsin its subsidiaries (i.e. minority interest) in the equity section of the Consolidated Balance Sheets and separately presents theincome or loss attributable to the noncontrolling interest of a consolidated subsidiary in its Consolidated Statements ofIncome/(Loss). Assets and liabilities of purchased companies are stated at estimated fair values at the date of acquisition.Investments in companies which are not VIEs, or where SunTrust is not the primary beneficiary in a VIE, that the Companyowns a voting interest of 20% to 50%, and for which it has the ability to exercise significant influence over operating andfinancing decisions, are accounted for using the equity method of accounting. These investments are included in other assets,and the Company’s proportionate share of income or loss is included in other noninterest income in the ConsolidatedStatements of Income/(Loss).
The preparation of financial statements in conformity with U.S. GAAP requires management to make estimates andassumptions that affect the reported amounts of assets and liabilities, the disclosure of contingent assets and liabilities at thedate of the financial statements, and the reported amounts of revenues and expenses during the reporting period. Actualresults could vary from these estimates. Certain reclassifications have been made to prior period amounts to conform to thecurrent period presentation.
The Company evaluated subsequent events through the date its financial statements were issued.
Cash and Cash Equivalents
Cash and cash equivalents include cash and due from banks, interest-bearing deposits in other banks, federal funds sold, andsecurities purchased under agreements to resell. Cash and cash equivalents have maturities of three months or less, andaccordingly, the carrying amount of these instruments is deemed to be a reasonable estimate of fair value.
Securities and Trading Activities
Securities are classified at trade date as trading or available for sale securities. Trading account assets and liabilities arecarried at fair value with changes in fair value recognized within noninterest income. Realized and unrealized gains andlosses are determined using the specific identification method and are recognized as a component of noninterest income inthe Consolidated Statements of Income/(Loss). Securities available for sale are used as part of the overall asset and liabilitymanagement process to optimize income and market performance over an entire interest rate cycle. Interest income anddividends on securities are recognized in interest income on an accrual basis. Premiums and discounts on debt securities areamortized as an adjustment to yield over the estimated life of the security. Securities available for sale are carried at fairvalue with unrealized gains and losses, net of any tax effect, included in AOCI as a component of shareholders’ equity.
The Company reviews available for sale securities for impairment on a quarterly basis. A security is considered to beimpaired if the fair value of a debt security is less than its amortized cost basis at the measurement date. The Companydetermines whether a decline in fair value below the amortized cost basis is other-than-temporary. Prior to April 1, 2009,debt securities that the Company had the intent and ability to hold to recovery and for which it was probable that theCompany would receive all cash flows were considered not to be other-than-temporarily impaired. Available for sale debtsecurities which had OTTI were written down to fair value as a realized loss in the Consolidated Statements of Income/(Loss).
86

SUNTRUST BANKS, INC.Notes to Consolidated Financial Statements (Continued)
After April 1, 2009, the Company changed its policy based on an update to the guidance on determining OTTI. Based on theupdated guidance, the Company determines whether it has the intent to sell the debt security or whether it is more likely thannot it will be required to sell the debt security before the recovery of its amortized cost basis. If either condition is met, theCompany will recognize a full impairment and write the debt security down to fair value. For all other debt securities forwhich the Company does not expect to recover the entire amortized cost basis of the security and do not meet eithercondition, an OTTI loss is considered to have occurred, and the Company records the credit loss portion of impairment inearnings and the temporary impairment related to all other factors in OCI.
The Company also holds beneficial interests in securitized financial assets (other than those of high credit quality orsufficiently collateralized to ensure the possibility of credit loss is remote). The Company determines whether OTTI exists byevaluating whether there had been an adverse change in the present value of estimated cash flows from the present value ofcash flows previously projected. For additional information on the Company’s securities activities, refer to Note 5,“Securities Available for Sale,” to the Consolidated Financial Statements.
Nonmarketable equity securities include venture capital equity and certain mezzanine securities that are not publicly tradedas well as equity investments acquired for various purposes. These securities are accounted for under the cost or equitymethod and are included in other assets. The Company reviews nonmarketable securities accounted for under the costmethod on a quarterly basis and reduces the asset value when declines in value are considered to be other-than-temporary.Equity method investments are recorded at cost, adjusted to reflect the Company’s portion of income, loss or dividends of theinvestee. Realized income, realized losses and estimated other-than-temporary unrealized losses on cost and equity methodinvestments are recognized in noninterest income in the Consolidated Statements of Income/(Loss).
Loans Held for Sale
The Company’s LHFS includes certain residential mortgage loans, commercial loans, and student loans. LHFS are recordedat either the lower of cost or fair value, or fair value if elected. Origination fees and costs for LHFS recorded at the lower ofcost or fair value are capitalized in the basis of the loan and are included in the calculation of realized gains and losses uponsale. Origination fees and costs are recognized in earnings at the time of origination for LHFS that are recorded at fair value.Fair value is derived from observable current market prices, when available, and includes loan servicing value. Whenobservable market prices are not available, the Company will use judgment and estimate fair value using internal models, inwhich the Company uses its best estimates of assumptions it believes would be used by market participants in estimating fairvalue. Adjustments to reflect unrealized gains and losses resulting from changes in fair value and realized gains and lossesupon ultimate sale of the loans are classified as noninterest income in the Consolidated Statements of Income/(Loss).
The Company may transfer certain residential mortgage loans, commercial loans, and student loans to a held for saleclassification at the lower of cost or fair value. At the time of transfer, any credit losses are recorded as a reduction in theallowance for loan losses. Subsequent credit losses as well as incremental interest rate or liquidity related valuationadjustments are recorded as a component of noninterest income in the Consolidated Statements of Income/(Loss). TheCompany may also transfer loans from held for sale to held for investment. At the time of transfer, any difference betweenthe carrying amount of the loan and its outstanding principal balance is recognized as an adjustment to yield using theinterest method, unless the loan was elected upon origination to be accounted for at fair value. If a held for sale loan istransferred to held for investment for which fair value accounting was elected, it will continue to be accounted for at fairvalue in the held for investment portfolio. For additional information on the Company’s LHFS activities, refer to Note 6,“Loans,” to the Consolidated Financial Statements.
Loans
Loans that management has the intent and ability to hold for the foreseeable future or until maturity or pay-off are consideredheld for investment. The Company’s loan balance is comprised of loans held in portfolio, including commercial loans,consumer loans, real estate loans and lines, credit card receivables, direct financing leases, leveraged leases, and nonaccrualand restructured loans. Interest income on all types of loans is accrued based upon the outstanding principal amounts, exceptthose classified as nonaccrual loans. The Company typically classifies commercial and commercial real estate loans asnonaccrual when one of the following events occurs: (i) interest or principal has been in default 90 days or more, unless theloan is secured by collateral having realizable value sufficient to discharge the debt in full and the loan is in the legal processof collection; (ii) collection of recorded interest or principal is not anticipated; or (iii) income for the loan is recognized on acash basis due to the deterioration in the financial condition of the debtor. Consumer and residential mortgage loans aretypically placed on nonaccrual when payments have been in default for 90 and 120 days or more, respectively.
When a loan is placed on nonaccrual, unpaid interest is reversed against interest income. Interest income on nonaccrualloans, if recognized, is either recorded using the cash basis method of accounting or recognized at the end of the loan after
87
SUNTRUST BANKS, INC.Notes to Consolidated Financial Statements (Continued)
the principal has been reduced to zero, depending on the type of loan. If and when borrowers demonstrate the ability to repaya loan in accordance with the contractual terms of a loan classified as nonaccrual, the loan may be returned to accrual status.See “Allowance for Loan and Lease Losses” section of this Note for further discussion of impaired loans.
TDRs are loans in which the Company has granted a concession to the borrower, which would not otherwise be considereddue to the borrower experiencing financial difficulty. If a loan is in nonaccrual status before it is determined to be a TDR,then the loan remains in nonaccrual status. TDR loans in nonaccrual status may be returned to accrual status if there has beenat least a six month sustained period of repayment performance by the borrower. When the Company modifies the terms ofan existing loan that is not considered a TDR, the Company accounts for the loan modification as a new loan if the terms ofthe new loan resulting from a loan refinancing or restructuring are at least as favorable to the Company as the terms forcomparable loans to other customers with similar risk characteristics who are not undergoing a refinancing or restructuringand the modifications are more than minor.
For loans accounted for at amortized cost, fees and incremental direct costs associated with the loan origination and pricingprocess, as well as premiums and discounts, are deferred and amortized as level yield adjustments over the respective loanterms. Premiums for purchased credit cards are amortized on a straight-line basis over one year. Fees received for providingloan commitments that result in loans are recognized over the term of the loan as an adjustment of the yield. If a loan is neverfunded, the commitment fee is recognized into noninterest income at the expiration of the commitment period. Originationfees and costs are recognized in noninterest income and expense at the time of origination for newly originated loans that areaccounted for at fair value. For additional information on the Company’s loans activities, refer to Note 6, “Loans,” to theConsolidated Financial Statements.
Allowance for Loan and Lease Losses
The Company’s ALLL is the amount considered adequate to absorb probable losses within the portfolio based onmanagement’s evaluation of the size and current risk characteristics of the loan portfolio. Such evaluation considersnumerous factors, including, but not limited to net charge-off trends, internal risk ratings, changes in internal risk ratings,loss forecasts, collateral values, geographic location, borrower FICO scores, delinquency rates, nonperforming andrestructured loans, origination channel, product mix, underwriting practices, industry conditions and economic trends.
Specific allowances for loan and lease losses are established for large commercial, corporate, and commercial real estatenonaccrual loans that are evaluated on an individual basis and certain consumer, commercial, corporate, and commercial realestate loans whose terms have been modified in a TDR. The specific allowance established for these loans and leases is basedon a thorough analysis of the most probable source of repayment, including the present value of the loan’s expected futurecash flows, the loan’s estimated market value, or the estimated fair value of the underlying collateral depending on the mostlikely source of repayment.
General allowances are established for loans and leases grouped into pools based on similar characteristics. In this process,general allowance factors established are based on an analysis of historical charge-off experience, portfolio trends, regionaland national economic conditions, and expected loss given default derived from the Company’s internal risk rating process.Other adjustments may be made to the ALLL after an assessment of internal and external influences on credit quality that arenot fully reflected in the historical loss or other risk rating data.
The Company’s charge-off policy meets or is more stringent than regulatory minimums. Losses on unsecured consumerloans are recognized at 90-days past-due compared to the regulatory loss criteria of 120 days. Secured consumer loans,including residential real estate, are typically charged-off between 120 and 180 days, depending on the collateral type, incompliance with the FFIEC guidelines. Accordingly, secured loans may be charged-down to the estimated value of thecollateral with previously accrued unpaid interest reversed. Subsequent charge-offs may be required as a result of changes inthe market value of collateral or other repayment prospects.
In addition to the ALLL, the Company also estimates probable losses related to unfunded lending commitments, such asletters of credit and binding unfunded loan commitments. Unfunded lending commitments are analyzed and segregated byrisk similar to funded loans based on the Company’s internal risk rating scale. These risk classifications, in combination withan analysis of historical loss experience, probability of commitment usage, and any other pertinent information, result in theestimation of the reserve for unfunded lending commitments. The reserve for unfunded lending commitments is reported onthe Consolidated Balance Sheets in other liabilities and the provision associated with changes in the unfunded lendingcommitment reserve is reported in the Consolidated Statements of Income/(Loss) in noninterest expense through the thirdquarter of 2009. Beginning in the fourth quarter of 2009, the Company began recording changes in the unfunded lendingcommitment reserve in the provision for credit losses. See Note 7, “Allowance for Credit Losses,” to the ConsolidatedFinancial Statements for further discussion of the change in classification.
88

SUNTRUST BANKS, INC.Notes to Consolidated Financial Statements (Continued)
Premises and Equipment
Premises and equipment are carried at cost less accumulated depreciation and amortization. Depreciation is calculatedprimarily using the straight-line method over the assets’ estimated useful lives. Leasehold improvements are amortized usingthe straight-line method over the shorter of the improvements’ estimated useful lives or the lease term, depending on whetherthe lease meets the transfer of ownership or bargain-purchase option criterion. Certain leases are capitalized as assets forfinancial reporting purposes. Such capitalized assets are amortized, using the straight-line method, over the assets’ estimateduseful lives or the lease terms, depending on the criteria that gave rise to the capitalization of the assets. Construction andsoftware in process primarily includes in-process branch expansion, branch renovation, and software development projects.Upon completion, branch related projects are maintained in premises and equipment while completed software projects arereclassified to other assets. Maintenance and repairs are charged to expense, and improvements are capitalized. For additionalinformation on the Company’s premises and equipment activities, refer to Note 8, “Premises and Equipment,” to theConsolidated Financial Statements.
Goodwill and Other Intangible Assets
Goodwill represents the excess purchase price over the fair value of identifiable net assets of acquired companies. Goodwillis assigned to reporting units, which are operating segments or one level below an operating segment, as of the acquisitiondate. Goodwill is assigned to the Company’s reporting units that are expected to benefit from the synergies of the businesscombination.
Goodwill is not amortized and instead is tested for impairment, at least annually, at the reporting unit level. The goodwillimpairment test is performed in two steps. The first step is used to identify potential impairment and the second step, ifrequired, measures the amount of impairment by comparing the carrying amount of goodwill to its implied fair value. If theimplied fair value of the goodwill exceeds the carrying amount, there is no impairment. If the goodwill assigned to areporting unit exceeds the implied fair value of the goodwill, an impairment charge is recorded for the excess.
Identified intangible assets that have a designated finite life are amortized over their useful lives and are evaluated forimpairment whenever events or changes in circumstances indicate the carrying amount of the assets may not be recoverable.For additional information on the Company’s activities related to goodwill and other intangibles, refer to Note 9, “Goodwilland Other Intangible Assets,” to the Consolidated Financial Statements.
MSRs
The Company recognizes as assets the rights to service mortgage loans based on the estimated fair value of the MSRs whenloans are sold and the associated servicing rights are retained.
As of December 31, 2009, the Company maintained two classes of MSRs. Beginning January 1, 2009, MSRs related to loansoriginated and sold after January 1, 2008 are accounted for at fair value. MSRs related to loans sold before January 1, 2008were accounted for at amortized cost, net of any allowance for impairment losses. Effective January 1, 2010, the Companyelected to record the MSRs carried at the LOCOM at fair value. See Note 9, “Goodwill and Other Intangible Assets,” to theConsolidated Financial Statements for further discussion regarding this election. Historically, the Company has not directlyhedged its MSRs accounted for at amortized cost, but has managed the economic risk through the Company’s overall asset/liability management process with consideration to the natural counter-cyclicality of servicing and mortgage production.Effective January 1, 2009, when the Company created the class of MSRs accounted for at fair value, the Company began toactively hedge this class of MSRs.
The fair values of MSRs are determined by projecting net servicing cash flows, which are then discounted to estimate the fairvalue. The fair values of MSRs are impacted by a variety of factors, including prepayment assumptions, discount rates,delinquency rates, contractually specified servicing fees, and underlying portfolio characteristics. The underlyingassumptions and estimated values are corroborated by values received from independent third parties.
Amortized MSRs are carried at the LOCOM value. MSRs are amortized over the period of the estimated future net servicingcash flows. The projected future cash flows are derived from the same model and assumptions used to estimate the fair valueof MSRs. For purposes of measuring impairment, MSRs accounted for at amortized cost are stratified based on interest rateand type of related loan. When fair value is less than amortized cost for an individual stratum and the impairment is believedto be temporary, the impairment is recorded to a valuation allowance through mortgage servicing income in the ConsolidatedStatements of Income/(Loss). The carrying value of MSRs is maintained on the Consolidated Balance Sheets in other
89

SUNTRUST BANKS, INC.Notes to Consolidated Financial Statements (Continued)
intangible assets. Servicing fees are recognized as they are earned and are reported net of amortization expense and anyimpairments in mortgage servicing related income in the Consolidated Statements of Income/(Loss). For additionalinformation on the Company’s servicing fees, refer to Note 11, “Certain Transfers of Financial Assets, Mortgage ServicingRights and Variable Interest Entities,” to the Consolidated Financial Statements.
Other Real Estate Owned
Assets acquired through, or in lieu of, loan foreclosure are held for sale and are initially recorded at the lower of the loanbalance or the asset’s fair value at the date of foreclosure, less estimated costs to sell, establishing a new cost basis. Anydifference between this initial cost basis and the carrying value of the loan is charged to the ALLL at the date of transfer intoOREO. We estimate market values primarily based on appraisals and other market information. Subsequent changes in valueof the assets are reported as adjustments to the asset’s carrying amount. Subsequent to foreclosure, changes in value alongwith gains or losses from the disposition on these assets are reported in noninterest expense in the Consolidated Statements ofIncome/(Loss).
Loan Sales and Securitizations
The Company sells and at times may securitize loans and other financial assets. When the Company securitizes assets, it mayhold a portion of the securities issued, including senior interests, subordinated and other residual interests, interest-onlystrips, and principal-only strips, all of which are considered retained interests in the transferred assets. When the Companyretains securitized interests, the cost basis of the securitized financial assets are allocated between the sold and retainedinterests based on their relative fair values; the gain or loss on sale is then calculated based on the difference betweenproceeds received, which includes cash proceeds and the fair value of MSRs, if any, and the cost basis allocated to the soldinterests. The interests in securitized assets held by the Company are typically classified as either securities available for saleor trading assets. These interests are subsequently carried at fair value, which is based on independent, third-party marketprices, market prices for similar assets, or discounted cash flow analyses. If market prices are not available, fair value iscalculated using management’s best estimates of key assumptions, including credit losses, loan repayment speeds anddiscount rates commensurate with the risks involved. Unrealized gains and losses on retained interests classified as availablefor sale are shown, net of any tax effect, in AOCI as a component of shareholders’ equity. Realized gains and losses onavailable for sale or trading securities and unrealized gains and losses on trading securities are recorded in noninterestincome in the Consolidated Statements of Income/(Loss). For additional information on the Company’s securitizationactivities, refer to Note 11, “Certain Transfers of Financial Assets, Mortgage Servicing Rights and Variable Interest Entities,”to the Consolidated Financial Statements.
Income Taxes
The provision/(benefit) for income taxes is based on income and expense reported for financial statement purposes afteradjustment for permanent differences such as tax-exempt income and tax credits. Deferred income tax assets and liabilitiesresult from temporary differences between assets and liabilities measured for financial reporting purposes and for income taxreturn purposes. These assets and liabilities are measured using the enacted tax rates and laws that are currently in effect.Subsequent changes in the tax laws require adjustment to these assets and liabilities with the cumulative effect included inincome from continuing operations for the period in which the change was enacted. A valuation allowance is recognized for adeferred tax asset if, based on the weight of available evidence, it is more likely than not that some portion or all of the deferredtax asset will not be realized. In computing the income tax provision/(benefit), the Company evaluates the technical merits of itsincome tax positions based on current legislative, judicial and regulatory guidance. The Company classifies interest andpenalties related to its tax positions as a component of income tax expense/(benefit). For additional information on theCompany’s activities related to income taxes, refer to Note 15, “Income Taxes,” to the Consolidated Financial Statements.
Earnings per Share
Basic EPS are computed by dividing net income/(loss) available to common shareholders by the weighted average number ofcommon shares outstanding during each period. Diluted EPS are computed by dividing net income available to commonshareholders by the weighted average number of common shares outstanding during each period, plus common shareequivalents calculated for stock options and restricted stock outstanding using the treasury stock method. In periods of netloss, diluted EPS is calculated in the same manner as basic EPS.
The Company has issued certain restricted stock awards, which are unvested share-based payment awards that containnonforfeitable rights to dividends or dividend equivalents. These restricted shares are considered participating securities.
90

SUNTRUST BANKS, INC.Notes to Consolidated Financial Statements (Continued)
Accordingly, the Company calculated net income available to common shareholders pursuant to the two-class method,whereby net income is allocated between common shareholders and participating securities. In periods of net loss, noallocation is made to participating securities as they are not contractually required to fund net losses.
Net income available to common shareholders represents net income/(loss) after preferred stock dividends, accretion of thediscount on preferred stock issuances, income impact of any repurchases of preferred stock, and dividends and allocation ofundistributed earnings to the participating securities. For additional information on the Company’s EPS, refer to Note 13,“Earnings Per Share,” to the Consolidated Financial Statements.
Guarantees
The Company recognizes a liability at the inception of a guarantee, in an amount equal to the estimated fair value of theobligation. A guarantee is defined as a contract that contingently requires a company to pay a guaranteed party upon changesin an underlying asset, liability or equity security of the guaranteed party, or upon failure of a third-party to perform under aspecified agreement. The Company considers the following arrangements to be guarantees: certain asset purchaseagreements, standby letters of credit and financial guarantees, certain indemnification agreements included within third-partycontractual arrangements and certain derivative contracts. For additional information on the Company’s guarantorobligations, refer to Note 18, “Reinsurance Arrangements and Guarantees,” to the Consolidated Financial Statements.
Derivative Financial Instruments
The Company records all contracts that satisfy the definition of a derivative, at fair value in the Consolidated Balance Sheets.The Company enters into various derivatives in a dealer capacity to facilitate client transactions and as a risk managementtool. Derivatives entered into in a dealer capacity and those that either do not qualify for, or for which the Company haselected not to apply, hedge accounting are accounted for as freestanding derivatives. In addition to freestanding derivativeinstruments, the Company evaluates contracts such as brokered deposits and short-term debt to determine whether anyembedded derivatives exist and whether any of those embedded derivatives are required to be bifurcated and separatelyaccounted for as freestanding. If embedded derivatives are not bifurcated, then the entire contract is valued at fair value. Inaddition, as a normal part of its operations, the Company enters into certain IRLCs on mortgage loans that are accounted foras freestanding derivatives. Changes in the fair value of freestanding derivatives are recorded in noninterest income.
Where derivatives have been used in client transactions, the Company generally manages the risk associated with these contractswithin the framework of its VAR approach that monitors total exposure daily and seeks to manage the exposure on an overallbasis. Derivatives are used as a risk management tool to hedge the Company’s exposure to changes in interest rates or otheridentified market risks. The Company accounts for some of these derivatives as hedging instruments based on hedge accountingprovisions. The Company prepares written hedge documentation for all derivatives which are designated as (1) a hedge of thefair value of a recognized asset or liability (fair value hedge) or (2) a hedge of a forecasted transaction, such as, the variability ofcash flows to be received or paid related to a recognized asset or liability (cash flow hedge). The written hedge documentationincludes identification of, among other items, the risk management objective, hedging instrument, hedged item andmethodologies for assessing and measuring hedge effectiveness and ineffectiveness, along with support for management’sassertion that the hedge will be highly effective. Methodologies related to hedge effectiveness and ineffectiveness are consistentbetween similar types of hedge transactions and have included (i) statistical regression analysis of changes in the cash flows ofthe actual derivative and a perfectly effective hypothetical derivative, (ii) statistical regression analysis of changes in the fairvalues of the actual derivative and the hedged item and (iii) comparison of the critical terms of the hedged item and the hedgingderivative. For designated hedging relationships, the Company performs retrospective and prospective effectiveness testingusing quantitative methods and generally does not assume perfect effectiveness through the matching of critical terms. Changesin the fair value of a derivative that is highly effective and that has been designated and qualifies as a fair value hedge arerecorded in current period earnings, along with the changes in the fair value of the hedged item that are attributable to thehedged risk. Changes in the fair value of a derivative that is highly effective and that has been designated and qualifies as a cashflow hedge are initially recorded in AOCI and reclassified to earnings in the same period that the hedged item impacts earnings;and any ineffective portion is recorded in current period earnings. Assessments of hedge effectiveness and measurements ofhedge ineffectiveness are performed at least quarterly for ongoing effectiveness. Hedge accounting ceases on transactions thatare no longer deemed effective, or for which the derivative has been terminated or de-designated. For discontinued fair valuehedges where the hedged item remains outstanding, the hedged item would cease to be remeasured at fair value attributable tochanges in the hedged risk and any existing basis adjustment would be recognized as a yield adjustment over the remaining lifeof the hedged item. For discontinued cash flow hedges where the hedged transaction remains probable to occur as originallydesignated, the unrealized gains and losses recorded in AOCI would be reclassified to earnings in the period when thepreviously designated hedged cash flows occur. If the previously designated transaction were no longer probable of occurring,any unrealized gains and losses in AOCI would be immediately reclassified to earnings.
91

SUNTRUST BANKS, INC.Notes to Consolidated Financial Statements (Continued)
The Company has elected not to offset fair value amounts related to collateral arrangements recognized for derivativeinstruments under master netting arrangements. For additional information on the Company’s derivative activities, refer toNote 17, “Derivative Financial Instruments,” to the Consolidated Financial Statements.
Stock-Based Compensation
The Company sponsors stock plans under which incentive and nonqualified stock options and restricted stock may be grantedperiodically to certain employees. The Company accounts for stock-based compensation under the fair value recognitionprovisions whereby the fair value of the award at grant date is expensed over the award’s vesting period. Additionally, theCompany estimates the number of awards for which it is probable that service will be rendered and adjusts compensationcost accordingly. Estimated forfeitures are subsequently adjusted to reflect actual forfeitures. The required disclosures relatedto the Company’s stock-based employee compensation plan are included in Note 16, “Employee Benefit Plans,” to theConsolidated Financial Statements.
Employee Benefits
Employee benefits expense includes the net periodic benefit costs associated with the pension, supplemental retirement, andother postretirement benefit plans, as well as contributions under the defined contribution plan, the amortization of restrictedstock, stock option awards, and costs of other employee benefits.
Foreign Currency Transactions
Foreign denominated assets and liabilities resulting from foreign currency transactions are valued using period end foreignexchange rates and the associated interest income or expense is determined using approximate weighted average exchangerates for the period. The Company may elect to enter into foreign currency derivatives to mitigate its exposure to changes inforeign exchange rates. The derivative contracts are accounted for at fair value. Gains and losses resulting from suchvaluations are included as noninterest income in the Consolidated Statements of Income/(Loss).
Fair Value
Certain assets and liabilities are measured at fair value on a recurring basis. Examples of these include derivativeinstruments, available for sale and trading securities, certain loans held for investment and LHFS, certain issuances of long-term debt, certain classes of the MSR asset, and certain residual interests from Company-sponsored sales and securitizations.Fair value is used on a non-recurring basis as a measurement basis either when assets are evaluated for impairment, the basisof accounting is the LOCOM or for disclosure purposes. Examples of these non-recurring uses of fair value include certainLHFS and MSRs accounted for at the LOCOM, OREO, goodwill, intangible assets, nonmarketable equity securities, andlong-lived assets. Fair value is defined as the price that would be received to sell an asset or paid to transfer a liability in anorderly transaction between market participants at the measurement date. Depending on the nature of the asset or liability, theCompany uses various valuation techniques and assumptions when estimating fair value.
The Company applied the following fair value hierarchy:
Level 1 – Assets or liabilities for which the identical item is traded on an active exchange, such as publicly-tradedinstruments or futures contracts.
Level 2 – Assets and liabilities valued based on observable market data for similar instruments.
Level 3 – Assets or liabilities for which significant valuation assumptions are not readily observable in the market;instruments valued based on the best available data, some of which is internally developed, and considers risk premiumsthat a market participant would require.
When determining the fair value measurement for assets and liabilities required or permitted to be recorded at fair value, theCompany considers the principal or most advantageous market in which it would transact and considers assumptions thatmarket participants would use when pricing the asset or liability. When possible, the Company looks to active and observablemarkets to price identical assets or liabilities. When identical assets and liabilities are not traded in active markets, theCompany looks to market observable data for similar assets and liabilities. Nevertheless, the Company uses alternativevaluation techniques to derive a fair value measurement for those assets and liabilities that are either not actively traded inobservable markets or for which market observable inputs are not available. For additional information on the Company’svaluation of its assets and liabilities held at fair value, refer to Note 20, “Fair Value Election and Measurement,” to theConsolidated Financial Statements.
92

SUNTRUST BANKS, INC.Notes to Consolidated Financial Statements (Continued)
Accounting Policies Recently Adopted and Pending Accounting Pronouncements
In June 2009, the FASB issued an update to ASC 105-10, “Generally Accepted Accounting Principles”. This standardestablishes the ASC as the source of authoritative U.S. GAAP recognized by the FASB for nongovernmental entities. TheASC is effective for interim and annual periods ending after September 15, 2009. The ASC is a reorganization of existingU.S. GAAP and does not change existing U.S. GAAP. The Company adopted this standard during the third quarter of 2009.The adoption had no impact on the Company’s financial position, results of operations, and EPS.
In June 2009, the FASB issued ASU 2009-16, an update to ASC 860-10, “Transfers and Servicing,” and ASU 2009-17, anupdate to ASC 810-10, “Consolidation”. These updates are effective for the first interim reporting period of 2010. The updateto ASC 860-10 amends the guidance to eliminate the concept of a QSPE and changes some of the requirements forderecognizing financial assets. The amendments to ASC 810-10 will (a) eliminate the exemption for existing QSPEs fromU.S. GAAP, (b) shift the determination of which enterprise should consolidate a VIE to a current control approach, such thatan entity that has both the power to make decisions and right to receive benefits or absorb losses that could potentially besignificant to the VIE will consolidate a VIE, and (c) change when it is necessary to reassess who should consolidate a VIE.
The Company has analyzed the impacts of these amendments on all QSPEs and VIE structures with which it is involved.Based on this analysis, the Company expects to consolidate its multi-seller conduit, Three Pillars, and a CLO entity. TheCompany will consolidate these entities because certain subsidiaries of the Company have significant decision-making rightsand own VIs that could potentially be significant to these VIEs. The primary balance sheet impacts from consolidating ThreePillars and the CLO on January 1, 2010, will be increases in loans and leases, the related allowance for loan losses, LHFS,long-term debt, and other short-term borrowings. The consolidations of Three Pillars and the CLO will have no impact on theCompany’s earnings or cash flows that result from its involvement with these VIEs, but the Company’s ConsolidatedStatements of Income/(Loss) will generally reflect a reduction in noninterest income and an increase in net interest incomeand noninterest expense due to the consolidations. For additional information on the Company’s VIE structures, refer toNote 11, “Certain Transfers of Financial Assets, Mortgage Servicing Rights and Variable Interest Entities,” to theConsolidated Financial Statements.
The combined impact of consolidating Three Pillars and the CLO on January 1, 2010 were incremental total assets and totalliabilities of approximately $2 billion, respectively, and an insignificant impact on shareholders’ equity. No additionalfunding requirements with respect to these entities are expected to significantly impact the liquidity position of the Company.Upon adoption, the Company consolidated the assets and liabilities of Three Pillars at their unpaid principal amounts and willsubsequently account for these assets and liabilities on an accrual basis. Upon adoption, the Company consolidated the assetsand liabilities of the CLO based on their estimated fair values and made an irrevocable election to carry all of the financialassets and financial liabilities of the CLO at fair value. The pro forma impact on certain of the Company’s regulatory capitalratios as a result of consolidating Three Pillars and the CLO is not significant.
The Company does not currently believe that it is the primary beneficiary of any other significant off-balance sheet entitieswith which it is involved; however, the accounting guidance requires an entity to reassess whether it is the primarybeneficiary at least quarterly. The Company does not currently expect to consolidate additional VIEs in future periods.
In January 2010, the FASB voted to finalize an ASU that would defer the amendments to ASC 810-10 for certain investmententities that have the attributes of entities subject to the “Investment Company Guide” and for MMMF that comply with oroperate in accordance with requirements that are similar to those included in Rule 2a-7 of the Investment Company Act of1940. Certain of the Company’s wholly-owned subsidiaries provide investment advisor services for various privateplacement and publicly registered investment funds. The Company expects that the deferral will apply to all of these funds.
93

SUN
TR
UST
BA
NK
S,IN
C.
Not
esto
Con
solid
ated
Fin
anci
alSt
atem
ents
(Con
tinu
ed)
Not
e2
-A
cqui
siti
ons/
Dis
posi
tion
s
Dur
ing
the
thre
eye
arpe
riod
ende
dD
ecem
ber
31,2
009,
Sun
Tru
stco
nsum
mat
edth
efo
llow
ing
acqu
isit
ions
and
disp
osit
ions
:
(in
mil
lion
s)D
ate
Cas
hor
othe
rco
nsid
erat
ion
(pai
d)/r
ecei
ved
Goo
dwill
Oth
erIn
tang
ible
sG
ain/
(Los
s)C
omm
ents
2009
Acq
uisi
tion
ofas
sets
ofM
arti
nK
elly
Cap
ital
Man
agem
ent
12/2
2/09
($1.
9)$0
.9$1
.0$-
Goo
dwil
land
inta
ngib
les
reco
rded
are
tax-
dedu
ctib
le.
Acq
uisi
tion
ofce
rtai
nas
sets
ofC
SI
Cap
ital
Man
agem
ent
11/3
0/09
(2.8
)1.
11.
7-
Goo
dwil
land
inta
ngib
les
reco
rded
are
tax-
dedu
ctib
le.
Acq
uisi
tion
ofas
sets
ofE
pic
Adv
isor
s,In
c.2
4/1/
09(2
.0)
5.0
0.6
-G
oodw
illa
ndin
tang
ible
sre
cord
edar
eta
x-de
duct
ible
.
2008
Acq
uisi
tion
ofas
sets
ofC
ymri
cF
amil
yO
ffic
eS
ervi
ces
212
/31/
08(2
.9)
1.4
1.4
-G
oodw
illa
ndin
tang
ible
sre
cord
edar
eta
x-de
duct
ible
.S
ale
ofm
ajor
ity
inte
rest
inZ
CI
10/1
/08
7.9
(15.
4)0.
9(2
.7)
Goo
dwil
land
inta
ngib
les
reco
rded
are
tax-
dedu
ctib
le.
Pur
chas
eof
rem
aini
ngin
tere
stin
ZC
I9/
30/0
8(2
2.6)
20.7
--
Goo
dwil
lrec
orde
dis
tax-
dedu
ctib
le.
Sal
eof
Tra
nsP
lati
num
Ser
vice
Cor
p.9/
2/08
100.
0(1
0.5)
-81
.8S
ale
ofF
irst
Mer
cant
ile
Tru
stC
ompa
ny5/
30/0
859
.1(1
1.7)
(3.0
)29
.6A
cqui
siti
onof
GB
&T
15/
1/08
(154
.6)
143.
529
.5-
Goo
dwil
land
inta
ngib
les
reco
rded
are
non
tax-
dedu
ctib
le.
Sal
eof
24.9
%in
tere
stin
Lig
htho
use
Inve
stm
entP
artn
ers
1/2/
0815
5.0
-(6
.0)
89.4
Sun
Tru
stw
illc
onti
nue
toea
rna
reve
nue
shar
eba
sed
upon
clie
ntre
ferr
als
toth
efu
nds.
2007
Acq
uisi
tion
ofIn
lign
Wea
lth
Man
agem
ent,
LL
C2
12/3
1/07
(13.
0)7.
34.
1-
Goo
dwil
land
inta
ngib
les
reco
rded
are
non
tax-
dedu
ctib
le.
Acq
uisi
tion
ofT
BK
Inve
stm
ents
,Inc
.28/
31/0
7(1
9.2)
10.6
6.5
-G
oodw
illa
ndin
tang
ible
sre
cord
edar
eno
nta
x-de
duct
ible
.L
ight
hous
eP
artn
ers,
LL
C,a
who
lly
owne
dsu
bsid
iary
ofG
enS
prin
gH
oldi
ngs,
Inc.
,whi
chis
aw
holl
yow
ned
subs
idia
ryof
Sun
Tru
st,w
asm
erge
dw
ith
and
into
Lig
htho
use
Inve
stm
ent
Par
tner
s3/
30/0
7-
(48.
5)24
.132
.3S
unT
rust
rece
ived
a24
.9%
inte
rest
inL
ight
hous
eIn
vest
men
tPar
tner
sG
enS
prin
gH
oldi
ngs,
Inc.
(for
mer
ly“A
MA
Hol
ding
s,In
c.”)
call
edm
inor
ity
mem
ber
owne
din
tere
sts
inG
enS
prin
gF
amil
yO
ffic
es,L
LC
(for
mer
ly“A
sset
Man
agem
entA
dvis
ors,
LL
C”)
Var
ious
(12.
4)10
.22.
2-
1 On
May
1,20
08,S
unT
rust
acqu
ired
GB
&T
,aN
orth
Geo
rgia
-bas
edfi
nanc
iali
nsti
tuti
onse
rvin
gco
mm
erci
alan
dre
tail
cust
omer
s,fo
r$1
54.6
mil
lion
,inc
ludi
ngca
shpa
idfo
rfr
acti
onal
shar
es,v
iath
em
erge
rof
GB
&T
wit
han
din
toS
unT
rust
.In
conn
ecti
onth
erew
ith,
GB
&T
shar
ehol
ders
rece
ived
0.15
62sh
ares
ofth
eC
ompa
ny’s
com
mon
stoc
kfo
rea
chsh
are
ofG
B&
T’s
com
mon
stoc
k,re
sult
ing
inth
eis
suan
ceof
appr
oxim
atel
y2.
2m
illi
onsh
ares
ofS
unT
rust
com
mon
stoc
k.A
sa
resu
ltof
the
acqu
isit
ion,
Sun
Tru
stac
quir
edap
prox
imat
ely
$1.4
bill
ion
oflo
ans,
prim
aril
yco
mm
erci
alre
ales
tate
loan
s,an
das
sum
edap
prox
imat
ely
$1.4
bill
ion
ofde
posi
tlia
bili
ties
.Sun
Tru
stel
ecte
dto
acco
untf
or$1
71.6
mil
lion
ofth
eac
quir
edlo
ans
atfa
irva
lue.
The
rem
aini
nglo
ans
are
acco
unte
dfo
rat
amor
tize
dco
stan
dha
da
carr
yove
rre
serv
efo
rlo
anan
dle
ase
loss
esof
$158
.7m
illi
on.T
heac
quis
itio
nw
asac
coun
ted
for
unde
rth
epu
rcha
sem
etho
dof
acco
unti
ngw
ith
the
resu
lts
ofop
erat
ions
for
GB
&T
incl
uded
inS
unT
rust
’sre
sult
sbe
ginn
ing
May
1,20
08.
2 Acq
uisi
tion
byG
enS
prin
gF
amil
yO
ffic
es,L
LC
am
ajor
ity
owne
dsu
bsid
iary
ofS
unT
rust
.
94

SUNTRUST BANKS, INC.Notes to Consolidated Financial Statements (Continued)
Note 3 - Funds Sold and Securities Purchased Under Agreements to Resell
Funds sold and securities purchased under agreements to resell at December 31 were as follows:
(Dollars in thousands) 2009 2008
Federal funds $54,450 $134,000Resell agreements 462,206 856,614
Total funds sold and securities purchased under agreements to resell $516,656 $990,614
Securities purchased under agreements to resell are collateralized by U.S. government or agency securities and are carried atthe amounts at which securities will be subsequently resold. The Company takes possession of all securities underagreements to resell and performs the appropriate margin evaluation on the acquisition date based on market volatility, asnecessary. The Company requires collateral between 100% and 110% of the underlying securities. The total market value ofthe collateral held was $464.2 million and $866.7 million at December 31, 2009 and 2008, of which $110.1 million and$246.3 million was repledged, respectively.
Note 4 - Trading Assets and Liabilities
The fair values of the components of trading assets and liabilities at December 31 were as follows:
(Dollars in thousands) 2009 2008
Trading AssetsDebt securities:
U.S. Treasury and federal agencies $1,150,323 $3,127,635U.S. states and political subdivisions 58,520 159,135Corporate debt securities 464,684 585,809Commercial paper 639 399,611Residential mortgage-backed securities - agency 94,164 58,565Residential mortgage-backed securities - private 13,889 37,970Collateralized debt obligations 174,886 261,528Other debt securities 25,886 813,176
Total debt securities 1,982,991 5,443,429Equity securities 163,053 116,788Derivative contracts1 2,610,288 4,701,783Other 223,606 134,269
Total trading assets $4,979,938 $10,396,269
Trading LiabilitiesDebt securities:
U.S. Treasury and federal agencies $192,893 $440,408Corporate and other debt securities 144,142 146,805
Total debt securities 337,035 587,213Equity securities 7,841 13,263Derivative contracts1 1,844,047 2,640,308
Total trading liabilities $2,188,923 $3,240,784
1Excludes IRLCs and derivative financial instruments entered into by the Household Lending line of business tohedge its interest rate risk. The fair value of these derivatives is included in other assets and liabilities.
See Note 21, “Contingencies,” to the Consolidated Financial Statements for information concerning ARS added to tradingassets in 2008 as well as the current position in those assets at December 31, 2009.
Trading instruments are used as part of the Company’s overall balance sheet management strategies and to support clientrequirements through its broker/dealer subsidiary. The Company utilized trading instruments for balance sheet managementpurposes and manages the potential market volatility of these instruments with appropriate duration and/or hedging strategies.The size, volume and nature of the trading instruments can vary based on economic and Company specific asset or liabilityconditions. Product offerings to clients include debt securities, loans traded in the secondary market, equity securities, derivativeand foreign exchange contracts, and similar financial instruments. Other trading activities include acting as a market maker incertain debt and equity securities and related derivatives. The Company has policies and procedures to manage market riskassociated with these client trading activities, and will assume a limited degree of market risk by managing the size and natureof its exposure.
95

SUNTRUST BANKS, INC.Notes to Consolidated Financial Statements (Continued)
Note 5 - Securities Available for Sale
Securities available for sale at December 31 were as follows:
2009
(Dollars in thousands)Amortized
CostUnrealized
GainsUnrealized
LossesFair
Value
U.S. Treasury and federal agencies $7,939,917 $13,423 $39,229 $7,914,111U.S. states and political subdivisions 927,887 27,799 10,629 945,057Residential mortgage-backed securities - agency 15,704,594 273,207 61,724 15,916,077Residential mortgage-backed securities - private 500,651 6,002 99,425 407,228Other debt securities 785,728 16,253 4,578 797,403Common stock of The Coca-Cola Company 69 1,709,931 - 1,710,000Other equity securities1 786,248 918 - 787,166
Total securities available for sale $26,645,094 $2,047,533 $215,585 $28,477,042
2008
(Dollars in thousands)Amortized
Cost Unrealized GainsUnrealized
LossesFair
Value
U.S. Treasury and federal agencies $464,566 $21,889 $302 $486,153U.S. states and political subdivisions 1,018,906 24,621 6,098 1,037,429Residential mortgage-backed securities - agency 14,424,531 135,803 10,230 14,550,104Residential mortgage-backed securities - private 629,174 8,304 115,327 522,151Other debt securities 302,800 4,444 13,059 294,185Common stock of The Coca-Cola Company 69 1,358,031 - 1,358,100Other equity securities1 1,443,161 5,254 - 1,448,415
Total securities available for sale $18,283,207 $1,558,346 $145,016 $19,696,537
1Includes $343.3 million and $493.2 million of FHLB of Cincinnati and FHLB of Atlanta stock stated at par value, $360.4 million and $360.9 millionof Federal Reserve Bank stock stated at par value and $82.2 million and $588.5 million of mutual fund investments stated at fair value as ofDecember 31, 2009 and December 31, 2008, respectively.
The increase in U.S. Treasury and federal agency securities was due to the net purchase of lower-yielding U.S. Treasury andfederal agency securities throughout 2009, which improved the quality and liquidity of the portfolio in anticipation of therepayment of TARP upon regulatory approval.
In 2009, we sold approximately $9.2 billion of agency MBS recognizing a $90.2 million gain on those sales. These saleswere associated with repositioning the MBS portfolio into securities we believe have higher relative value.
See Note 21, “Contingencies”, to the Consolidated Financial Statements for information concerning ARS classified assecurities available for sale.
Securities available for sale that were pledged to secure public deposits, trusts, and other funds had fair values of $9.0 billionand $6.2 billion as December 31, 2009 and 2008, respectively.
The amortized cost and fair value of investments in debt securities at December 31, 2009 by estimated average life are shownbelow. Actual cash flows may differ from estimated average lives and contractual maturities because borrowers may have theright to call or prepay obligations with or without call or prepayment penalties.
(Dollars in thousands)1 Yearor Less
1-5Years
5-10Years
After 10Years Total
Distribution of Maturities:Amortized Cost
Residential mortgage-backed securities - agency $172,218 $11,396,795 $1,160,850 $2,974,731 $15,704,594All other debt securities 494,881 8,702,265 755,996 201,041 10,154,183
Total debt securities $667,099 $20,099,060 $1,916,846 $3,175,772 $25,858,777
Fair ValueResidential mortgage-backed securities - agency $177,313 $11,592,575 $1,220,845 $2,925,344 $15,916,077All other debt securities 499,473 8,683,395 691,947 188,984 10,063,799
Total debt securities $676,786 $20,275,970 $1,912,792 $3,114,328 $25,979,876
96

SUNTRUST BANKS, INC.Notes to Consolidated Financial Statements (Continued)
Gross realized gains and losses and OTTI on securities available for sale during the periods were as follows:
Years Ended December 31
(Dollars in thousands) 2009 2008 2007
Gross realized gains $152,075 $1,158,348 $251,076Gross realized losses (34,056) (1,297) (7,959)OTTI (20,000) (83,751) -
Net securities gains $98,019 $1,073,300 $243,117
Securities with unrealized losses at December 31 were as follows:
2009
Less than twelve months Twelve months or longer Total
(Dollars in thousands)Fair
ValueUnrealized
LossesFair
ValueUnrealized
LossesFair
ValueUnrealized
Losses
U.S. Treasury and federal agencies $6,424,579 $39,224 $263 $5 $6,424,842 $39,229U.S. states and political subdivisions 125,524 5,711 64,516 4,918 190,040 10,629Residential mortgage-backed securities - agency 5,418,226 61,724 - - 5,418,226 61,724Residential mortgage-backed securities - private 14,668 4,283 327,996 95,142 342,664 99,425Other debt securities 30,704 1,207 30,416 3,371 61,120 4,578
Total securities with unrealized losses $12,013,701 $112,149 $423,191 $103,436 $12,436,892 $215,585
2008
Less than twelve months Twelve months or longer Total
(Dollars in thousands)Fair
ValueUnrealized
LossesFair
ValueUnrealized
LossesFair
ValueUnrealized
Losses
U.S. Treasury and federal agencies $43,584 $302 $23 $- $43,607 $302U.S. states and political subdivisions 169,693 4,980 14,879 1,118 184,572 6,098Residential mortgage-backed securities - agency 3,354,319 10,223 472 7 3,354,791 10,230Residential mortgage-backed securities - private 450,653 98,696 40,269 16,631 490,922 115,327Other debt securities 143,666 6,901 28,944 6,158 172,610 13,059
Total securities with unrealized losses $4,161,915 $121,102 $84,587 $23,914 $4,246,502 $145,016
On December 31, 2009, the Company held certain investment securities having unrealized loss positions. The Company doesnot intend to sell these securities and it is not more likely than not that the Company will be required to sell these securitiesbefore their anticipated recovery. The Company has reviewed its portfolio for OTTI in accordance with the accountingpolicies outlined in Note 1, “Significant Accounting Policies,” to the Consolidated Financial Statements. Market changes ininterest rates and credit spreads will result in temporary unrealized losses as the market price of securities fluctuates. Theturmoil and illiquidity in the financial markets during 2008 and 2009 have increased market yields on securities as a result ofcredit spreads widening. This shift in market yields resulted in unrealized losses on certain securities within the Company’sportfolio.
The Company adopted the updated accounting guidance for determining OTTI on securities on April 1, 2009 and inconjunction therewith analyzed the securities for which it had previously recognized OTTI and recognized a cumulativeeffect adjustment representing the non-credit component of OTTI of $7.7 million, net of tax. The Company had previouslyrecorded the non-credit component as impairment through earnings and therefore this amount was reclassified from retainedearnings to AOCI. The beginning balance of $7.6 million, pre-tax, as of the effective date, represents the credit losscomponent which remained in retained earnings related to the securities for which a cumulative effect adjustment wasrecorded.
The Company records OTTI through earnings based on the credit impairment estimates derived from the cash flow analyses.The remaining unrealized loss recorded in AOCI is reflective of the current illiquidity and risk premiums reflected in themarket. The unrealized loss of $99.4 million in private residential MBS as of December 31, 2009 includes purchased andretained interests from securitizations that are evaluated quarterly for OTTI using cash flow models. The unrealized loss of$61.7 million in agency residential MBS as well as the unrealized loss of $39.2 million in U.S. Treasury and federal agencysecurities is primarily related to the increase in interest rates near the end of 2009. As of December 31, 2009, approximately95% of the total securities available for sale portfolio are rated “AAA,” the highest possible rating by nationally recognizedrating agencies.
While all securities are reviewed for OTTI, the securities impacted by credit impairment were primarily private residentialMBS with a fair value of approximately $310.6 million as of December 31, 2009. For these securities, impairment isdetermined through the use of cash flow models that estimate cash flows on the underlying mortgages, using security specific
97
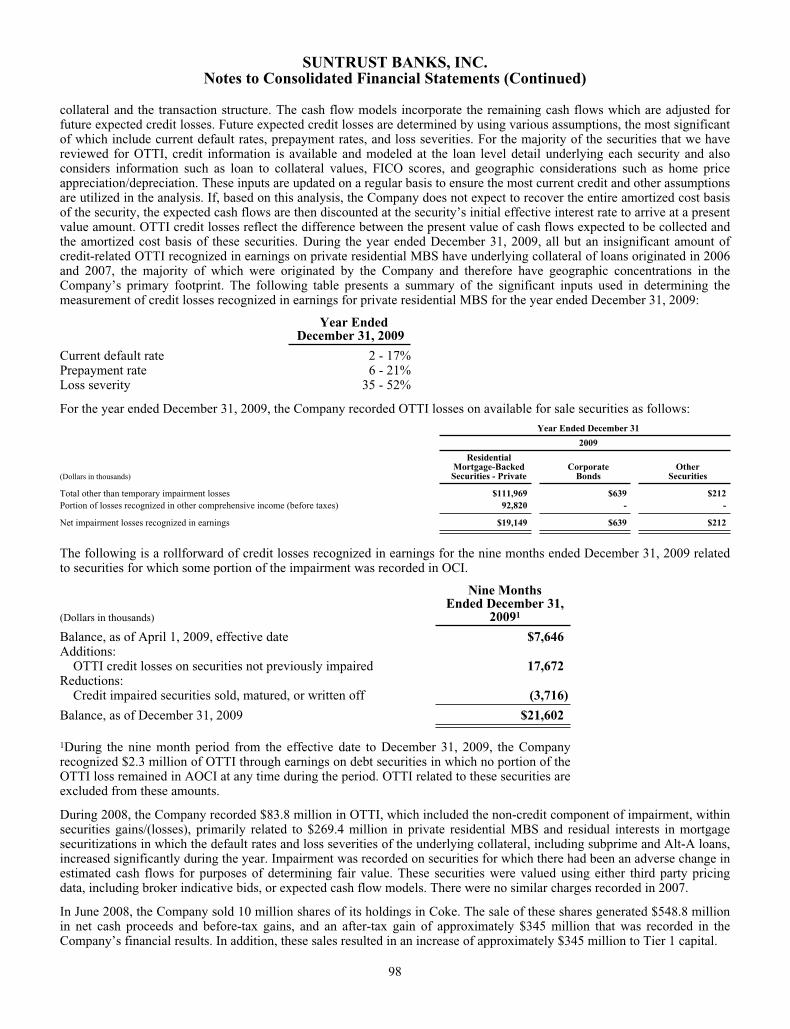
SUNTRUST BANKS, INC.Notes to Consolidated Financial Statements (Continued)
collateral and the transaction structure. The cash flow models incorporate the remaining cash flows which are adjusted forfuture expected credit losses. Future expected credit losses are determined by using various assumptions, the most significantof which include current default rates, prepayment rates, and loss severities. For the majority of the securities that we havereviewed for OTTI, credit information is available and modeled at the loan level detail underlying each security and alsoconsiders information such as loan to collateral values, FICO scores, and geographic considerations such as home priceappreciation/depreciation. These inputs are updated on a regular basis to ensure the most current credit and other assumptionsare utilized in the analysis. If, based on this analysis, the Company does not expect to recover the entire amortized cost basisof the security, the expected cash flows are then discounted at the security’s initial effective interest rate to arrive at a presentvalue amount. OTTI credit losses reflect the difference between the present value of cash flows expected to be collected andthe amortized cost basis of these securities. During the year ended December 31, 2009, all but an insignificant amount ofcredit-related OTTI recognized in earnings on private residential MBS have underlying collateral of loans originated in 2006and 2007, the majority of which were originated by the Company and therefore have geographic concentrations in theCompany’s primary footprint. The following table presents a summary of the significant inputs used in determining themeasurement of credit losses recognized in earnings for private residential MBS for the year ended December 31, 2009:
Year EndedDecember 31, 2009
Current default rate 2 - 17%Prepayment rate 6 - 21%Loss severity 35 - 52%
For the year ended December 31, 2009, the Company recorded OTTI losses on available for sale securities as follows:
Year Ended December 31
2009
(Dollars in thousands)
ResidentialMortgage-BackedSecurities - Private
CorporateBonds
OtherSecurities
Total other than temporary impairment losses $111,969 $639 $212Portion of losses recognized in other comprehensive income (before taxes) 92,820 - -
Net impairment losses recognized in earnings $19,149 $639 $212
The following is a rollforward of credit losses recognized in earnings for the nine months ended December 31, 2009 relatedto securities for which some portion of the impairment was recorded in OCI.
(Dollars in thousands)
Nine MonthsEnded December 31,
20091
Balance, as of April 1, 2009, effective date $7,646Additions:
OTTI credit losses on securities not previously impaired 17,672Reductions:
Credit impaired securities sold, matured, or written off (3,716)
Balance, as of December 31, 2009 $21,602
1During the nine month period from the effective date to December 31, 2009, the Companyrecognized $2.3 million of OTTI through earnings on debt securities in which no portion of theOTTI loss remained in AOCI at any time during the period. OTTI related to these securities areexcluded from these amounts.
During 2008, the Company recorded $83.8 million in OTTI, which included the non-credit component of impairment, withinsecurities gains/(losses), primarily related to $269.4 million in private residential MBS and residual interests in mortgagesecuritizations in which the default rates and loss severities of the underlying collateral, including subprime and Alt-A loans,increased significantly during the year. Impairment was recorded on securities for which there had been an adverse change inestimated cash flows for purposes of determining fair value. These securities were valued using either third party pricingdata, including broker indicative bids, or expected cash flow models. There were no similar charges recorded in 2007.
In June 2008, the Company sold 10 million shares of its holdings in Coke. The sale of these shares generated $548.8 millionin net cash proceeds and before-tax gains, and an after-tax gain of approximately $345 million that was recorded in theCompany’s financial results. In addition, these sales resulted in an increase of approximately $345 million to Tier 1 capital.
98
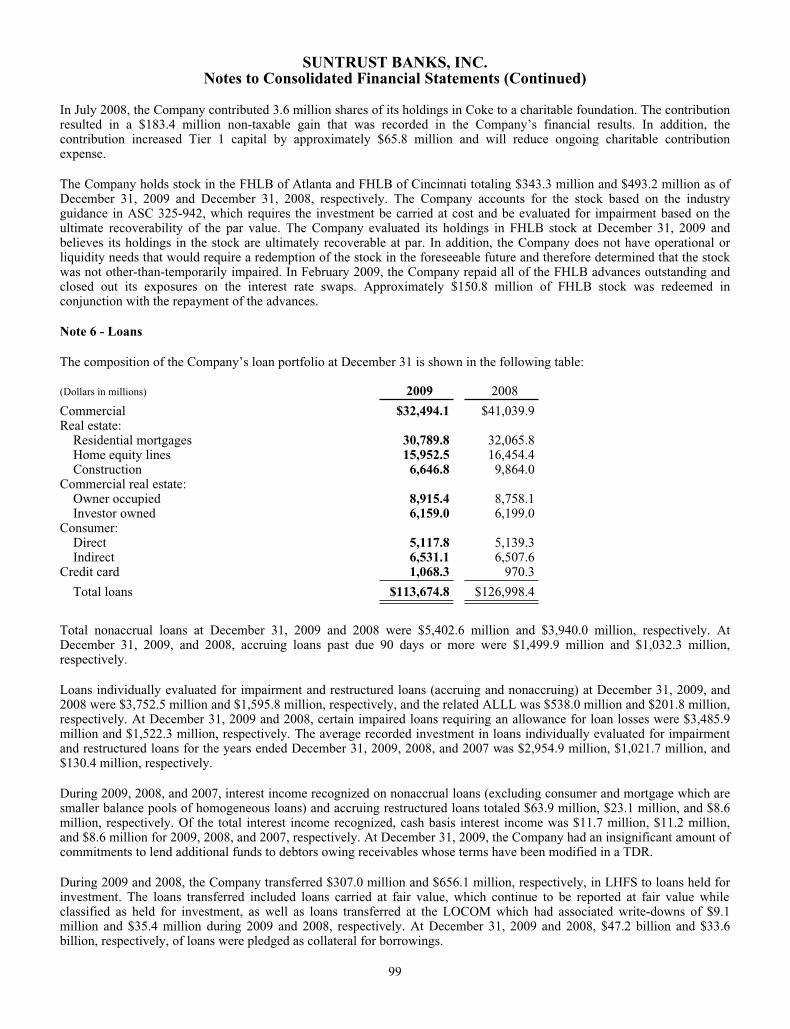
SUNTRUST BANKS, INC.Notes to Consolidated Financial Statements (Continued)
In July 2008, the Company contributed 3.6 million shares of its holdings in Coke to a charitable foundation. The contributionresulted in a $183.4 million non-taxable gain that was recorded in the Company’s financial results. In addition, thecontribution increased Tier 1 capital by approximately $65.8 million and will reduce ongoing charitable contributionexpense.
The Company holds stock in the FHLB of Atlanta and FHLB of Cincinnati totaling $343.3 million and $493.2 million as ofDecember 31, 2009 and December 31, 2008, respectively. The Company accounts for the stock based on the industryguidance in ASC 325-942, which requires the investment be carried at cost and be evaluated for impairment based on theultimate recoverability of the par value. The Company evaluated its holdings in FHLB stock at December 31, 2009 andbelieves its holdings in the stock are ultimately recoverable at par. In addition, the Company does not have operational orliquidity needs that would require a redemption of the stock in the foreseeable future and therefore determined that the stockwas not other-than-temporarily impaired. In February 2009, the Company repaid all of the FHLB advances outstanding andclosed out its exposures on the interest rate swaps. Approximately $150.8 million of FHLB stock was redeemed inconjunction with the repayment of the advances.
Note 6 - Loans
The composition of the Company’s loan portfolio at December 31 is shown in the following table:
(Dollars in millions) 2009 2008
Commercial $32,494.1 $41,039.9Real estate:
Residential mortgages 30,789.8 32,065.8Home equity lines 15,952.5 16,454.4Construction 6,646.8 9,864.0
Commercial real estate:Owner occupied 8,915.4 8,758.1Investor owned 6,159.0 6,199.0
Consumer:Direct 5,117.8 5,139.3Indirect 6,531.1 6,507.6
Credit card 1,068.3 970.3
Total loans $113,674.8 $126,998.4
Total nonaccrual loans at December 31, 2009 and 2008 were $5,402.6 million and $3,940.0 million, respectively. AtDecember 31, 2009, and 2008, accruing loans past due 90 days or more were $1,499.9 million and $1,032.3 million,respectively.
Loans individually evaluated for impairment and restructured loans (accruing and nonaccruing) at December 31, 2009, and2008 were $3,752.5 million and $1,595.8 million, respectively, and the related ALLL was $538.0 million and $201.8 million,respectively. At December 31, 2009 and 2008, certain impaired loans requiring an allowance for loan losses were $3,485.9million and $1,522.3 million, respectively. The average recorded investment in loans individually evaluated for impairmentand restructured loans for the years ended December 31, 2009, 2008, and 2007 was $2,954.9 million, $1,021.7 million, and$130.4 million, respectively.
During 2009, 2008, and 2007, interest income recognized on nonaccrual loans (excluding consumer and mortgage which aresmaller balance pools of homogeneous loans) and accruing restructured loans totaled $63.9 million, $23.1 million, and $8.6million, respectively. Of the total interest income recognized, cash basis interest income was $11.7 million, $11.2 million,and $8.6 million for 2009, 2008, and 2007, respectively. At December 31, 2009, the Company had an insignificant amount ofcommitments to lend additional funds to debtors owing receivables whose terms have been modified in a TDR.
During 2009 and 2008, the Company transferred $307.0 million and $656.1 million, respectively, in LHFS to loans held forinvestment. The loans transferred included loans carried at fair value, which continue to be reported at fair value whileclassified as held for investment, as well as loans transferred at the LOCOM which had associated write-downs of $9.1million and $35.4 million during 2009 and 2008, respectively. At December 31, 2009 and 2008, $47.2 billion and $33.6billion, respectively, of loans were pledged as collateral for borrowings.
99
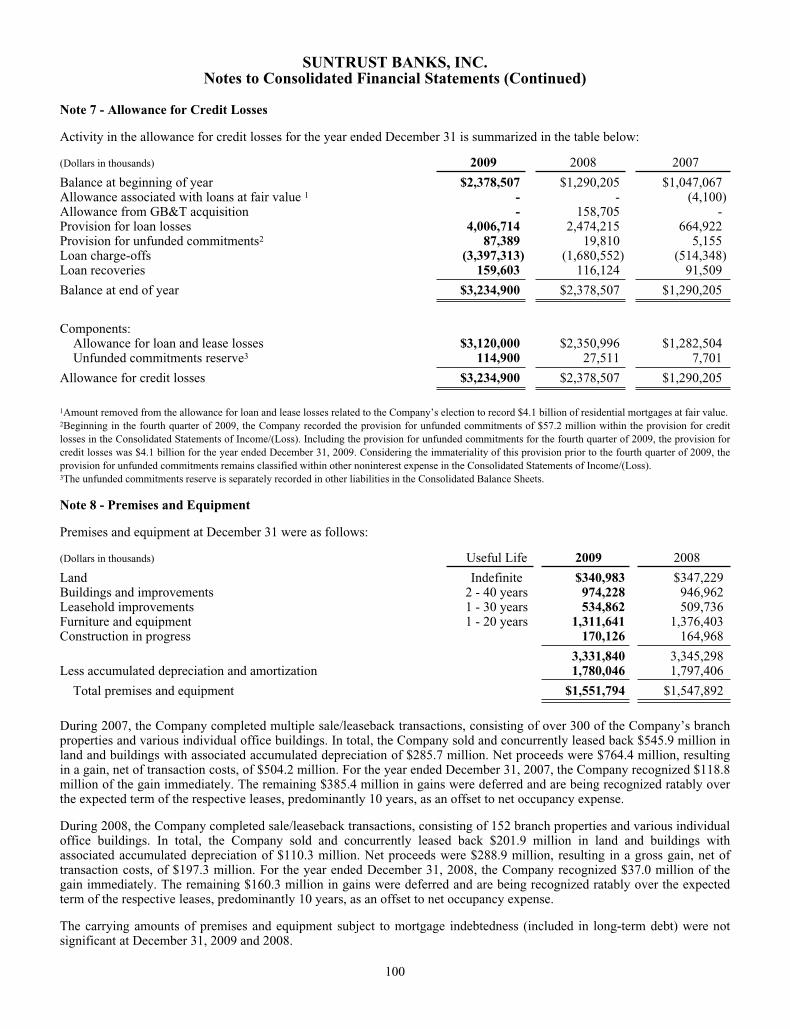
SUNTRUST BANKS, INC.Notes to Consolidated Financial Statements (Continued)
Note 7 - Allowance for Credit Losses
Activity in the allowance for credit losses for the year ended December 31 is summarized in the table below:
(Dollars in thousands) 2009 2008 2007
Balance at beginning of year $2,378,507 $1,290,205 $1,047,067Allowance associated with loans at fair value 1 - - (4,100)Allowance from GB&T acquisition - 158,705 -Provision for loan losses 4,006,714 2,474,215 664,922Provision for unfunded commitments2 87,389 19,810 5,155Loan charge-offs (3,397,313) (1,680,552) (514,348)Loan recoveries 159,603 116,124 91,509
Balance at end of year $3,234,900 $2,378,507 $1,290,205
Components:Allowance for loan and lease losses $3,120,000 $2,350,996 $1,282,504Unfunded commitments reserve3 114,900 27,511 7,701
Allowance for credit losses $3,234,900 $2,378,507 $1,290,205
1Amount removed from the allowance for loan and lease losses related to the Company’s election to record $4.1 billion of residential mortgages at fair value.2Beginning in the fourth quarter of 2009, the Company recorded the provision for unfunded commitments of $57.2 million within the provision for creditlosses in the Consolidated Statements of Income/(Loss). Including the provision for unfunded commitments for the fourth quarter of 2009, the provision forcredit losses was $4.1 billion for the year ended December 31, 2009. Considering the immateriality of this provision prior to the fourth quarter of 2009, theprovision for unfunded commitments remains classified within other noninterest expense in the Consolidated Statements of Income/(Loss).3The unfunded commitments reserve is separately recorded in other liabilities in the Consolidated Balance Sheets.
Note 8 - Premises and Equipment
Premises and equipment at December 31 were as follows:
(Dollars in thousands) Useful Life 2009 2008
Land Indefinite $340,983 $347,229Buildings and improvements 2 - 40 years 974,228 946,962Leasehold improvements 1 - 30 years 534,862 509,736Furniture and equipment 1 - 20 years 1,311,641 1,376,403Construction in progress 170,126 164,968
3,331,840 3,345,298Less accumulated depreciation and amortization 1,780,046 1,797,406
Total premises and equipment $1,551,794 $1,547,892
During 2007, the Company completed multiple sale/leaseback transactions, consisting of over 300 of the Company’s branchproperties and various individual office buildings. In total, the Company sold and concurrently leased back $545.9 million inland and buildings with associated accumulated depreciation of $285.7 million. Net proceeds were $764.4 million, resultingin a gain, net of transaction costs, of $504.2 million. For the year ended December 31, 2007, the Company recognized $118.8million of the gain immediately. The remaining $385.4 million in gains were deferred and are being recognized ratably overthe expected term of the respective leases, predominantly 10 years, as an offset to net occupancy expense.
During 2008, the Company completed sale/leaseback transactions, consisting of 152 branch properties and various individualoffice buildings. In total, the Company sold and concurrently leased back $201.9 million in land and buildings withassociated accumulated depreciation of $110.3 million. Net proceeds were $288.9 million, resulting in a gross gain, net oftransaction costs, of $197.3 million. For the year ended December 31, 2008, the Company recognized $37.0 million of thegain immediately. The remaining $160.3 million in gains were deferred and are being recognized ratably over the expectedterm of the respective leases, predominantly 10 years, as an offset to net occupancy expense.
The carrying amounts of premises and equipment subject to mortgage indebtedness (included in long-term debt) were notsignificant at December 31, 2009 and 2008.
100

SUNTRUST BANKS, INC.Notes to Consolidated Financial Statements (Continued)
Various Company facilities are leased under both capital and noncancelable operating leases with initial remaining terms inexcess of one year. Minimum payments, by year and in aggregate, as of December 31, 2009 were as follows:
(Dollars in thousands)Operating
LeasesCapitalLeases
2010 $208,124 $2,4882011 193,246 2,5362012 178,568 1,9032013 166,661 1,9472014 155,571 1,994Thereafter 663,627 10,789
Total minimum lease payments $1,565,797 21,657
Amounts representing interest 6,663
Present value of net minimum lease payments $14,994
Net premises and equipment included $8.4 million and $9.4 million at December 31, 2009 and 2008, respectively, related tocapital leases. Aggregate rent expense (principally for offices), including contingent rent expense and sublease income,totaled $171.3 million, $171.3 million, and $137.8 million for 2009, 2008, and 2007, respectively. Depreciation/amortizationexpense for the years ended December 31, 2009, 2008, and 2007 totaled $181.6 million, $195.8 million, and $216.2 million,respectively.
Note 9 – Goodwill and Other Intangible Assets
Goodwill is required to be tested for impairment on an annual basis or as events occur or circumstances change that wouldmore likely than not reduce the fair value of a reporting unit below its carrying amount. In 2009, the Company’s reportingunits were comprised of Retail, Commercial, Commercial Real Estate, Household Lending, Corporate and InvestmentBanking, Wealth and Investment Management, and Affordable Housing.
Due to the continued recessionary environment and sustained deterioration in the economy during the first quarter of 2009,the Company performed a complete goodwill impairment analysis for all of its reporting units. The estimated fair value ofthe Retail, Commercial, and Wealth and Investment Management reporting units exceeded their respective carrying values asof March 31, 2009; however, the fair value of the Household Lending, Corporate and Investment Banking, Commercial RealEstate (included in Retail and Commercial segment), and Affordable Housing (included in Retail and Commercial segment)reporting units were less than their respective carrying values. The implied fair value of goodwill of the Corporate andInvestment Banking reporting unit exceeded the carrying value of the goodwill, thus no goodwill impairment was recordedfor this reporting unit as of March 31, 2009. However, the implied fair value of goodwill applicable to the HouseholdLending, Commercial Real Estate, and Affordable Housing reporting units was less than the carrying value of the goodwill.As of March 31, 2009, an impairment loss of $751.2 million was recorded, which was the entire amount of goodwill carriedby each of those reporting units. $677.4 million of the goodwill impairment charge was non-deductible for tax purposes. Thegoodwill impairment charge was a direct result of continued deterioration in the real estate markets and macro economicconditions that put downward pressure on the fair value of these businesses. The primary factor contributing to theimpairment recognition was further deterioration in the actual and projected financial performance of these reporting units, asevidenced by the increase in net charge-offs and nonperforming loans. The decline in fair value of these reporting units wassignificantly influenced by the current economic downturn, which resulted in depressed earnings in these businesses and thesignificant decline in the Company’s market capitalization during the first quarter.
During the second quarter of 2009, the Company performed an updated evaluation of the Corporate and Investment Bankinggoodwill, which involved estimating the fair value of the reporting unit and the implied fair value of goodwill. The implied fairvalue of goodwill exceeded the carrying value of goodwill, thus no goodwill impairment was recorded as of June 30, 2009.
The Company completed its 2009 annual impairment review of goodwill as of September 30, 2009. The review utilizeddiscounted cash flow analysis, as well as guideline company and guideline transaction information, where available, toestimate the fair value of each reporting unit. The estimates, specific to each reporting unit, that were incorporated in thevaluations included projections of future cash flows, discount rates, and applicable valuation multiples based on the guidelineinformation. The assumptions considered the current market conditions in developing short and long-term growthexpectations and discount rates. The estimated fair value of each reporting unit as of September 30, 2009 exceeded itsrespective carrying value; therefore, the Company determined there was no impairment of goodwill. The improvement in theestimated fair value of the Corporate and Investment Banking reporting unit was due to increased observable market values.
101
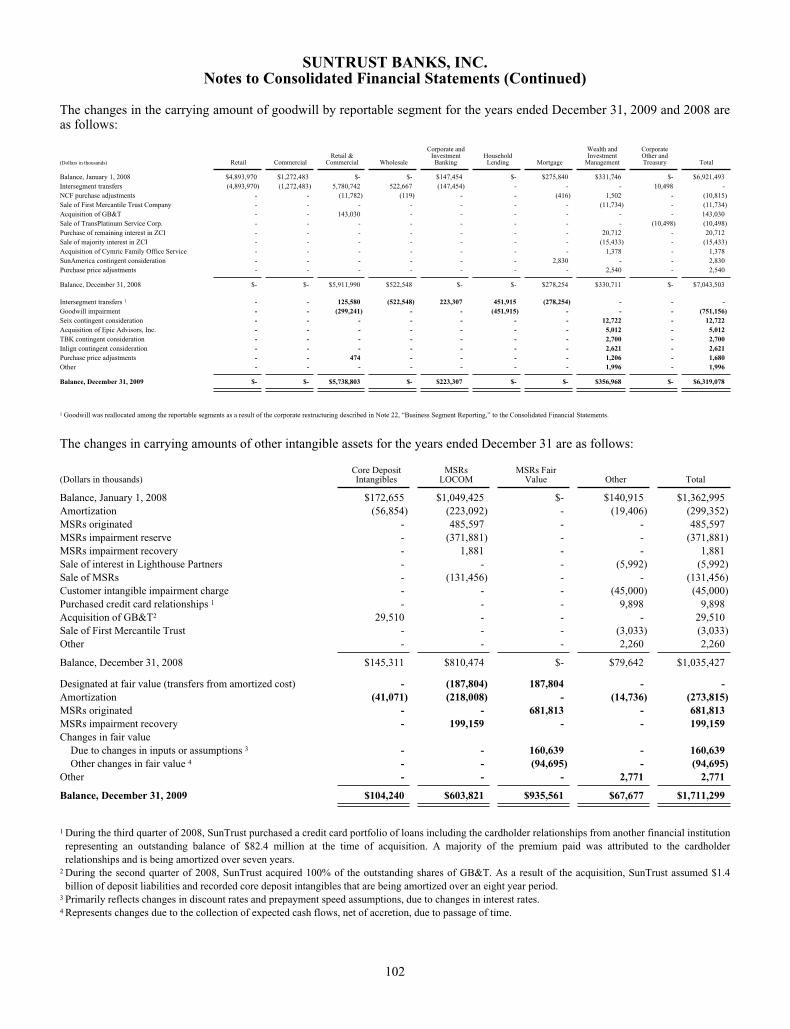
SUNTRUST BANKS, INC.Notes to Consolidated Financial Statements (Continued)
The changes in the carrying amount of goodwill by reportable segment for the years ended December 31, 2009 and 2008 areas follows:
(Dollars in thousands) Retail CommercialRetail &
Commercial Wholesale
Corporate andInvestment
BankingHouseholdLending Mortgage
Wealth andInvestment
Management
CorporateOther andTreasury Total
Balance, January 1, 2008 $4,893,970 $1,272,483 $- $- $147,454 $- $275,840 $331,746 $- $6,921,493Intersegment transfers (4,893,970) (1,272,483) 5,780,742 522,667 (147,454) - - - 10,498 -NCF purchase adjustments - - (11,782) (119) - - (416) 1,502 - (10,815)Sale of First Mercantile Trust Company - - - - - - - (11,734) - (11,734)Acquisition of GB&T - - 143,030 - - - - - - 143,030Sale of TransPlatinum Service Corp. - - - - - - - - (10,498) (10,498)Purchase of remaining interest in ZCI - - - - - - - 20,712 - 20,712Sale of majority interest in ZCI - - - - - - - (15,433) - (15,433)Acquisition of Cymric Family Office Service - - - - - - - 1,378 - 1,378SunAmerica contingent consideration - - - - - - 2,830 - - 2,830Purchase price adjustments - - - - - - - 2,540 - 2,540
Balance, December 31, 2008 $- $- $5,911,990 $522,548 $- $- $278,254 $330,711 $- $7,043,503
Intersegment transfers 1 - - 125,580 (522,548) 223,307 451,915 (278,254) - - -Goodwill impairment - - (299,241) - - (451,915) - - - (751,156)Seix contingent consideration - - - - - - - 12,722 - 12,722Acquisition of Epic Advisors, Inc. - - - - - - - 5,012 - 5,012TBK contingent consideration - - - - - - - 2,700 - 2,700Inlign contingent consideration - - - - - - - 2,621 - 2,621Purchase price adjustments - - 474 - - - - 1,206 - 1,680Other - - - - - - - 1,996 - 1,996
Balance, December 31, 2009 $- $- $5,738,803 $- $223,307 $- $- $356,968 $- $6,319,078
1 Goodwill was reallocated among the reportable segments as a result of the corporate restructuring described in Note 22, “Business Segment Reporting,” to the Consolidated Financial Statements.
The changes in carrying amounts of other intangible assets for the years ended December 31 are as follows:
(Dollars in thousands)Core DepositIntangibles
MSRsLOCOM
MSRs FairValue Other Total
Balance, January 1, 2008 $172,655 $1,049,425 $- $140,915 $1,362,995Amortization (56,854) (223,092) - (19,406) (299,352)MSRs originated - 485,597 - - 485,597MSRs impairment reserve - (371,881) - - (371,881)MSRs impairment recovery - 1,881 - - 1,881Sale of interest in Lighthouse Partners - - - (5,992) (5,992)Sale of MSRs - (131,456) - - (131,456)Customer intangible impairment charge - - - (45,000) (45,000)Purchased credit card relationships 1 - - - 9,898 9,898Acquisition of GB&T2 29,510 - - - 29,510Sale of First Mercantile Trust - - - (3,033) (3,033)Other - - - 2,260 2,260
Balance, December 31, 2008 $145,311 $810,474 $- $79,642 $1,035,427
Designated at fair value (transfers from amortized cost) - (187,804) 187,804 - -Amortization (41,071) (218,008) - (14,736) (273,815)MSRs originated - - 681,813 - 681,813MSRs impairment recovery - 199,159 - - 199,159Changes in fair value
Due to changes in inputs or assumptions 3 - - 160,639 - 160,639Other changes in fair value 4 - - (94,695) - (94,695)
Other - - - 2,771 2,771
Balance, December 31, 2009 $104,240 $603,821 $935,561 $67,677 $1,711,299
1 During the third quarter of 2008, SunTrust purchased a credit card portfolio of loans including the cardholder relationships from another financial institutionrepresenting an outstanding balance of $82.4 million at the time of acquisition. A majority of the premium paid was attributed to the cardholderrelationships and is being amortized over seven years.
2 During the second quarter of 2008, SunTrust acquired 100% of the outstanding shares of GB&T. As a result of the acquisition, SunTrust assumed $1.4billion of deposit liabilities and recorded core deposit intangibles that are being amortized over an eight year period.
3 Primarily reflects changes in discount rates and prepayment speed assumptions, due to changes in interest rates.4 Represents changes due to the collection of expected cash flows, net of accretion, due to passage of time.
102

SUNTRUST BANKS, INC.Notes to Consolidated Financial Statements (Continued)
Intangible assets subject to amortization must be tested for impairment whenever events or changes in circumstances indicatethat their carrying amounts may not be recoverable. The Company experienced a triggering event with respect to certainWealth and Investment Management customer relationship intangibles during the second quarter of 2008 and performedimpairment testing which resulted in an impairment charge of $45.0 million. The fair value of the customer relationshipintangibles was determined using the residual income method and was compared to the carrying value to determine theamount of impairment. The impairment charge was recorded in noninterest expense and pertains to the client relationshipsthat were recorded in 2004 in connection with an acquisition. While the overall acquired business was performingsatisfactorily, the attrition level of the legacy clients had increased resulting in the impairment of this intangible asset.
See Note 11, “Certain Transfers of Financial Assets, Mortgage Servicing Rights and Variable Interest Entities,” to theConsolidated Financial Statements for discussion of the impairment reserve recorded with respect to MSRs during 2008.
The Company elected to create a second class of MSRs effective January 1, 2009. This new class of MSRs is reported at fairvalue and is being actively hedged as discussed in Note 17, “Derivative Financial Instruments,” to the Consolidated FinancialStatements. The transfer of MSRs from LOCOM to fair value did not have a material effect on the Consolidated FinancialStatements since the MSRs were effectively reported at fair value as of December 31, 2008 as a result of impairment lossesrecognized at the end of 2008. MSRs associated with loans originated or sold prior to 2008 continued to be accounted for atDecember 31, 2009 at LOCOM and managed through the Company’s overall asset/liability management process. EffectiveJanuary 1, 2010, the Company elected to designate all remaining MSRs carried at LOCOM at fair value. Upon designatingthe remaining MSRs at fair value in January 2010, the Company recognized a cumulative effect adjustment increase toretained earnings, net of taxes, of $88.5 million.
The estimated amortization expense for intangible assets, excluding amortization of MSRs, is as follows:
(Dollars in thousands)Core DepositIntangibles Other Total
2010 $33,059 $13,925 $46,9842011 26,533 10,780 37,3132012 20,016 10,124 30,1402013 13,617 8,729 22,3462014 7,408 7,810 15,218Thereafter 3,607 16,309 19,916
Total $104,240 $67,677 $171,917
Note 10 - Other Short-Term Borrowings and Contractual Commitments
Other short-term borrowings as of December 31 include:
2009 2008
(Dollars in thousands) Balance Rates Balance Rates
Master notes $1,362,922 .75 % $1,034,555 .25 %Dealer collateral 584,781 various 1,055,606 variousU.S. Treasury demand notes 62,100 - 39,200 -Term Auction Facility - - 2,500,000 .49Short-term promissory notes - - 70,000 1.50Other 52,474 various 466,999 various
Total other short-term borrowings $2,062,277 $5,166,360
The average balances of other short-term borrowings for the years ended December 31, 2009, 2008, and 2007 were $2.7billion, $3.1 billion, and $2.5 billion, respectively, while the maximum amounts outstanding at any month-end during theyears ended December 31, 2009, 2008, and 2007 were $5.8 billion, $5.2 billion, and $3.8 billion, respectively. As ofDecember 31, 2009, the Company had collateral pledged to the Federal Reserve discount window to support $11.6 billion ofavailable borrowing capacity.
103

SUNTRUST BANKS, INC.Notes to Consolidated Financial Statements (Continued)
In the normal course of business, the Company enters into certain contractual obligations. Such obligations includeobligations to make future payments on lease arrangements, contractual commitments for capital expenditures, and servicecontracts. As of December 31, 2009, the Company had the following in unconditional obligations:
(Dollars in millions) 1 year or less 1-3 years 3-5 years After 5 years Total
Operating lease obligations $208 $372 $322 $664 $1,566Capital lease obligations 1 1 3 2 9 15Purchase obligations 2 153 239 228 529 1,149
Total $362 $614 $552 $1,202 $2,730
1Amounts do not include accrued interest.2 Includes contracts with a minimum annual payment of $5 million.
Note 11 - Certain Transfers of Financial Assets, Mortgage Servicing Rights and Variable Interest Entities
Certain Transfers of Financial Assets
The Company has transferred residential and commercial mortgage loans, student loans, commercial and corporate loans,and CDO securities in sale or securitization transactions in which the Company has, or had, continuing involvement. All suchtransfers have been accounted for as sales by the Company. The Company’s continuing involvement in such transfers hasbeen limited to owning certain beneficial interests, such as securitized debt instruments, and certain servicing or collateralmanager responsibilities. Except as specifically noted herein, the Company is not required to provide additional financialsupport to any of these entities, nor has the Company provided any support it was not obligated to provide. Interests thatcontinue to be held by the Company in transferred financial assets, excluding servicing and collateral management rights, aregenerally recorded as securities available for sale or trading assets at their allocated carrying amounts based on their relativefair values at the time of transfer and are subsequently remeasured at fair value. For such interests, when quoted marketprices are not available, fair value is generally estimated based on the present value of expected cash flows, calculated usingmanagement’s best estimates of key assumptions, including credit losses, loan prepayment speeds, and discount ratescommensurate with the risks involved, based on how management believes market participants would determine suchassumptions. See Note 20, “Fair Value Election and Measurement,” to the Consolidated Financial Statements for furtherdiscussion of the Company’s fair value methodologies. Servicing rights may give rise to servicing assets, which are eitherinitially recognized at fair value, subsequently amortized, and tested for impairment or elected to be carried at fair value on arecurring basis. Gains or losses upon sale, in addition to servicing fees and collateral management fees, are recorded innoninterest income. Changes in the fair value of interests that continue to be held by the Company that are accounted for astrading assets or securities available for sale are recorded in trading account profits/(losses) and commissions or as acomponent of AOCI, respectively. In the event any decreases in the fair value of such interests that are recorded as securitiesavailable for sale are deemed to be other-than-temporary due to underlying credit impairment, the estimated creditcomponent of such loss is recorded in securities gains/(losses). See Note 1, “Significant Accounting Policies,” to theConsolidated Financial Statements for a discussion of the impacts of amendments to ASC 810-10 on certain of theCompany’s involvement with VIEs discussed herein.
Residential Mortgage Loans
The Company typically transfers first lien residential mortgage loans in securitization transactions involving QSPEssponsored by Ginnie Mae, Fannie Mae, and Freddie Mac. These loans are exchanged for cash or securities that are readilyredeemed for cash proceeds and servicing rights, which generate servicing assets for the Company. The servicing assets arerecorded initially at fair value. Beginning January 1, 2009, the Company began to carry certain MSRs at fair value alongwith servicing rights that were originated in 2008 which were transferred to fair value. See “Mortgage Servicing Rights”herein and Note 9, “Goodwill and Other Intangible Assets,” to the Consolidated Financial Statements for further discussionregarding the accounting for servicing rights. In a limited number of securitizations, the Company has transferred loans toQSPEs sponsored by the Company. In these transactions, the Company has received securities representing retainedinterests in the transferred loans in addition to cash and servicing rights in exchange for the transferred loans. The retainedsecurities are carried at fair value as either trading assets or securities available for sale. Prior to December 31, 2009, theCompany accounted for all transfers of residential mortgage loans to QSPEs as sales, and because the transferees wereQSPEs, the Company did not consolidate any of these entities. Beginning on January 1, 2010, the Company applied thenewly adopted guidance in ASC 860-10 and ASC 810-10 as noted in Note 1, “Significant Accounting Policies,” to theConsolidated Financial Statements. The Company has determined that it does not have both the power to direct theactivities that most significantly impact the economic performance of the SPE that purchased these residential mortgageloans nor the obligation to absorb losses or the right to receive benefits that could potentially be significant, and thereforethe Company will not be required to consolidate any of these SPEs.
104

SUNTRUST BANKS, INC.Notes to Consolidated Financial Statements (Continued)
As seller, the Company has made certain representations and warranties with respect to the originally transferred loans,including those transferred to Ginnie Mae, Fannie Mae, and Freddie Mac, which are discussed in Note 18, “ReinsuranceArrangements and Guarantees,” to the Consolidated Financial Statements. Additionally, repurchases of loans from QSPEssponsored by the Company totaled approximately $17 million in 2008, including approximately $13 million of second lienloans that were substituted with new loans. No additional repurchases occurred during the year ended December 31, 2009;however, the Company accrued $36.0 million in the year ended December 31, 2009 for contingent losses related to certainof its representations and warranties made in connection with prior transfers of second lien loans.
Commercial Mortgage Loans
Certain transfers of commercial mortgage loans were executed with third party VIEs, which the Company deemed to beQSPEs and did not consolidate. During 2008, the Company sold all of its retained servicing rights, which were notfinancial assets subject to the accounting for transfers and servicing of financial assets, in exchange for cash proceeds ofapproximately $6.6 million. As seller, the Company had made certain representations and warranties with respect to theoriginally transferred loans and the Company has not incurred any losses with respect to such representations andwarranties. The adoption of the provisions of ASC 860-10 and ASC 810-10, on January 1, 2010, did not change theCompany’s conclusions that its prior transfers were sales and that it is not the primary beneficiary of those VIEs.
Commercial and Corporate Loans
In 2007, the Company completed a structured sale of corporate loans to multi-seller CP conduits, which are VIEsadministered by unrelated third parties, from which it retained a 3% residual interest in the pool of loans transferred,which does not constitute a VI in the third party conduits as it relates to the unparticipated portion of the loans. In thefirst quarter of 2009, the Company wrote this residual interest and related accrued interest to zero, resulting in a loss ofapproximately $16.6 million. This write off was the result of the deterioration in the performance of the loan pool tosuch an extent that the Company expects that it will no longer receive cash flows on the interest until the seniorparticipation interest has been repaid in full. The fair value of the residual at December 31, 2008 was $16.2 million. TheCompany provides commitments in the form of liquidity facilities to these conduits; the sum of these commitments,which represents the Company’s maximum exposure to loss under the facilities, totaled $322.0 million and $500.7million at December 31, 2009 and December 31, 2008, respectively. Due to deterioration in the loans that collateralizethese facilities, the Company recorded a contingent loss reserve of $16.1 million on the facilities during the year endedDecember 31, 2009. Subsequent to December 31, 2009, the administrator of the conduits drew on these commitments infull. This event did not modify the estimated contingent loss reserve the Company recorded as of December 31, 2009,nor did it modify the Company’s sale accounting treatment or conclusion that it is not the primary beneficiary of theseVIEs. In addition, no events have occurred during 2009 that would call into question either the Company’s saleaccounting or the Company’s conclusions that it is not the primary beneficiary of these VIEs.
The Company has had involvement with VIEs that own commercial leveraged loans and bonds, certain of which weretransferred by the Company to the VIEs. In addition to retaining certain securities issued by the VIEs, the Company alsoacts as manager or servicer for these VIEs. At December 31, 2009 and December 31, 2008, the Company’s directexposure to loss related to these VIEs was approximately $0 and $6.8 million, respectively, which represent theCompany’s interests in preference shares of these entities. In the first quarter of 2009, the Company recognized losses of$6.8 million which represented the complete write off of the preference shares in certain of the VIEs due to thecontinued deterioration in the performance of the collateral in those vehicles. The Company does not expect to receiveany significant cash distributions on those preference shares in the foreseeable future. At December 31, 2009 andDecember 31, 2008, total assets of these entities not included on the Company’s Consolidated Balance Sheets wereapproximately $2.6 billion and $2.7 billion, respectively. No reconsideration events occurred during 2009 that changedthe Company’s conclusion that it is not the primary beneficiary of these entities. Upon adoption of the amendments toASC 810-10, the Company determined that it was the primary beneficiary of one of these VIEs due to its collateralmanagement activities and VIs held by certain of the Company’s consolidated subsidiaries. As such, as of January 1,2010, the Company consolidated approximately $300 million of the $2.6 billion of assets that were previouslyunconsolidated. See Note 1, “Significant Accounting Policies,” to the Consolidated Financial Statements for furtherdiscussion of the impact of implementing the amendments to ASC 810-10.
Student Loans
In 2006, the Company completed one securitization of student loans through a transfer of loans to a QSPE and retained thecorresponding residual interest in the QSPE trust. The fair value of the residual interest at December 31, 2009 andDecember 31, 2008 was $18.5 million and $13.4 million, respectively. No events have occurred during 2009 that changedthe status of the QSPE or the nature of the transaction, which called into question either the Company’s sale accounting or
105

SUNTRUST BANKS, INC.Notes to Consolidated Financial Statements (Continued)
the QSPE status of the transferee. All the student loans that were securitized are U.S. government guaranteed student loans.As such, the Company has agreed to service each loan consistent with the guidelines determined by the applicablegovernment agencies. Accordingly, the Company believes that it does not have the power to direct activities that mostsignificantly impact the economic performance of the SPE that holds these student loans. Based on the application of thenew consolidation guidance adopted on January 1, 2010, the Company has determined that it will not consolidate this SPE.
CDO Securities
The Company has transferred bank trust preferred securities in securitization transactions. The majority of thesetransfers occurred between 2002 and 2005 with one transaction completed in 2007. The Company retained equityinterests in certain of these entities and also holds certain senior interests that were acquired during 2007 and 2008 inconjunction with its acquisition of assets from Three Pillars and the ARS transactions discussed in Note 21,“Contingencies,” to the Consolidated Financial Statements. During 2008, the Company recognized impairment losses,net of distributions received, of $15.9 million related to the ownership of its equity interests in these VIEs and, atDecember 31, 2008, these equity interests had all been written down to a fair value of zero due to increased losses in theunderlying collateral. During 2009, the Company sold its senior interest related to the acquisition of assets from ThreePillars. The Company continues to hold, at December 31, 2009, senior interests related to the ARS purchases. TheCompany is not obligated to provide any support to these entities and its maximum exposure to loss at December 31,2009 and December 31, 2008 is limited to (i) the current senior interests held in trading securities with a fair value of$25.5 million and $45.0 million, respectively, and (ii) the remaining senior interests expected to be purchased inconjunction with the ARS issue, which have a total fair value of $1.5 million and $9.7 million, respectively. The totalassets of the trust preferred CDO entities in which the Company has remaining exposure to loss was $1.3 billion atDecember 31, 2009 and $2.0 billion at December 31, 2008. No events occurred during the year ended December 31,2009 that called into question either the Company’s sale accounting or the Company’s conclusions that it is not theprimary beneficiary of these VIEs. The Company determined that it was not the primary beneficiary of any of theseVIEs under ASC 810-10, as the Company lacks the power to direct the significant activities of any of the VIEs.
The following tables present certain information related to the Company’s asset transfers in which it has continuingeconomic involvement for the years ended December 31, 2009, 2008, and 2007.
Year Ended December 31, 2009
(Dollars in thousands)Residential
Mortgage LoansCommercial
Mortgage LoansCommercial andCorporate Loans Student Loans CDO Securities Consolidated
Cash flows on interests held $93,674 $- $1,861 $7,601 $2,799 $105,935Servicing or management
fees 4,908 - 11,090 709 - 16,707
Year Ended December 31, 2008
(Dollars in thousands)Residential
Mortgage LoansCommercial
Mortgage LoansCommercial andCorporate Loans Student Loans CDO Securities Consolidated
Cash flows on interests held $85,848 $- $24,282 $7,971 $4,134 $122,235Servicing or management
fees 5,900 182 14,216 833 - 21,131
Year Ended December 31, 2007
(Dollars in thousands)Residential
Mortgage LoansCommercial
Mortgage LoansCommercial andCorporate Loans Student Loans CDO Securities Consolidated
Total proceeds $1,892,819 $416,321 $2,186,367 $- $- $4,495,507Gain/(loss) (15,669) (4,041) 4,949 - - (14,761)
Cash flows on interests held 52,882 - 22,194 - 3,198 78,274Servicing or management
fees 3,909 207 10,309 854 389 15,668
As transferor, the Company typically provides standard representations and warranties in relation to assets transferred.However, other than the loan substitution discussed previously herein, purchases of assets previously transferred insecuritization transactions were insignificant across all categories for all periods presented other than those related to GinnieMae, Fannie Mae, and Freddie Mac as discussed in Note 18, “Reinsurance Arrangements and Guarantees,” to theConsolidated Financial Statements.
The following tables present key assumptions and inputs, along with the impacts on the fair values of two unfavorablevariations from the expected amounts, related to the fair values of the Company’s retained interests, excluding MSRs, whichare separately addressed herein. Retained interests in residential mortgage securitization transactions include senior and
106

SUNTRUST BANKS, INC.Notes to Consolidated Financial Statements (Continued)
subordinated securities. To estimate the market value of these securities, consideration was given to dealer indications ofmarket value as well as the results of discounted cash flow models using market assumptions for prepayment rates, creditlosses and discount rates due to illiquidity in the market for non-agency residential MBS.
December 31, 2009
(Dollars in millions)ResidentialMortgage Student Loans CDO Securities Total
Fair Value $216.7 $18.5 $25.5 $260.7Prepayment Rate 11.4% - 17% 5.9% 0%
Decline in fair value from 10% adverse change 5.4 0.2 - 5.6Decline in fair value from 20% adverse change 9.9 0.6 - 10.5
Expected Credit Losses 0.26% - 21% nm 33.7% -38.4%Decline in fair value from 10% adverse change 2.6 nm - 2.6Decline in fair value from 20% adverse change 4.3 nm - 4.3
Annual Discount Rate 5% - 450% 22.5% 25.8% - 27.7%Decline in fair value from 10% adverse change 6.6 0.6 2.7 9.9Decline in fair value from 20% adverse change 12.2 1.3 5.1 18.6
Weighted Average Life (in years) 4.14 - 16.7 4.92 24.22Expected Static Pool Losses 0.26% - 28.6% nm 33.7% - 38.4%
“nm”- not meaningful.
At December 31, 2008, the total fair value of retained interests, excluding MSRs, was approximately $367.0 million. Theweighted average remaining lives of the Company’s retained interests ranged from approximately 2.5 years to 18 years forinterests in residential mortgage loans, commercial and corporate loans, and student loans as of December 31, 2008, with theweighted average remaining life of interests in CDO securities approximating 24 years. To estimate the fair values of thesesecurities, consideration was given to dealer indications of market value, where applicable, as well as the results ofdiscounted cash flow models using key assumptions and inputs for prepayment rates, credit losses, and discount rates. For themajority of the retained interests, the Company has considered the impacts on the fair values of two unfavorable variationsfrom the estimated amounts, related to the fair values of the Company’s retained and residual interests, excluding MSRs.Declines in fair values for the total retained interests due to 10% and 20% adverse changes in the key assumptions and inputstotaled approximately $22.2 million and $45.7 million, respectively, as of December 31, 2008. For certain subordinatedretained interests in residential mortgage securitizations, the Company used dealer indicated prices, as the Company believedthese price indications more accurately reflected the severe disruption in the market for these securities. As such, theCompany has not evaluated any adverse changes in key assumptions of these values. As of December 31, 2008, the fair valueof these subordinated interests was $4.4 million based on a weighted average price of 12.3% of par. Expected static poollosses were approximately 5% or less for residential mortgage loans and commercial and corporate loans, as of December 31,2008. For interests related to securitizations of CDO securities, expected static pool losses ranged from approximately 23%to 31% as of December 31, 2008.
Portfolio balances and delinquency balances based on 90 days or more past due (including accruing and nonaccrual loans) asof December 31, 2009 and December 31, 2008, and net charge-offs related to managed portfolio loans (both those that areowned by the Company and those that have been transferred) for years ended December 31, 2009 and 2008 are as follows:
Principal Balance Past Due Net Charge-offs
(Dollars in millions) 2009 2008 2009 2008 2009 2008
Type of loan:Commercial $32,494.1 $41,039.9 $507.8 $340.9 $572.4 $194.6Residential mortgage and home equity 46,742.3 48,520.2 4,064.6 2,727.6 1,902.6 950.5Commercial real estate and construction 21,721.2 24,821.1 1,901.7 1,492.6 527.2 215.2Consumer 11,648.9 11,646.9 428.4 411.1 152.1 172.4Credit card 1,068.3 970.3 - - 83.4 31.6
Total loan portfolio $113,674.8 $126,998.4 $6,902.5 $4,972.2 $3,237.7 $1,564.3Managed securitized loans
Commercial 3,460.2 3,766.8 64.5 30.2 27.9 -Residential mortgage 1,482.3 1,836.2 122.9 129.5 44.2 24.7Other 506.1 565.2 25.1 61.6 0.4 0.3
Total managed loans $119,123.4 $133,166.6 $7,115.0 $5,193.5 $3,310.2 $1,589.3
107
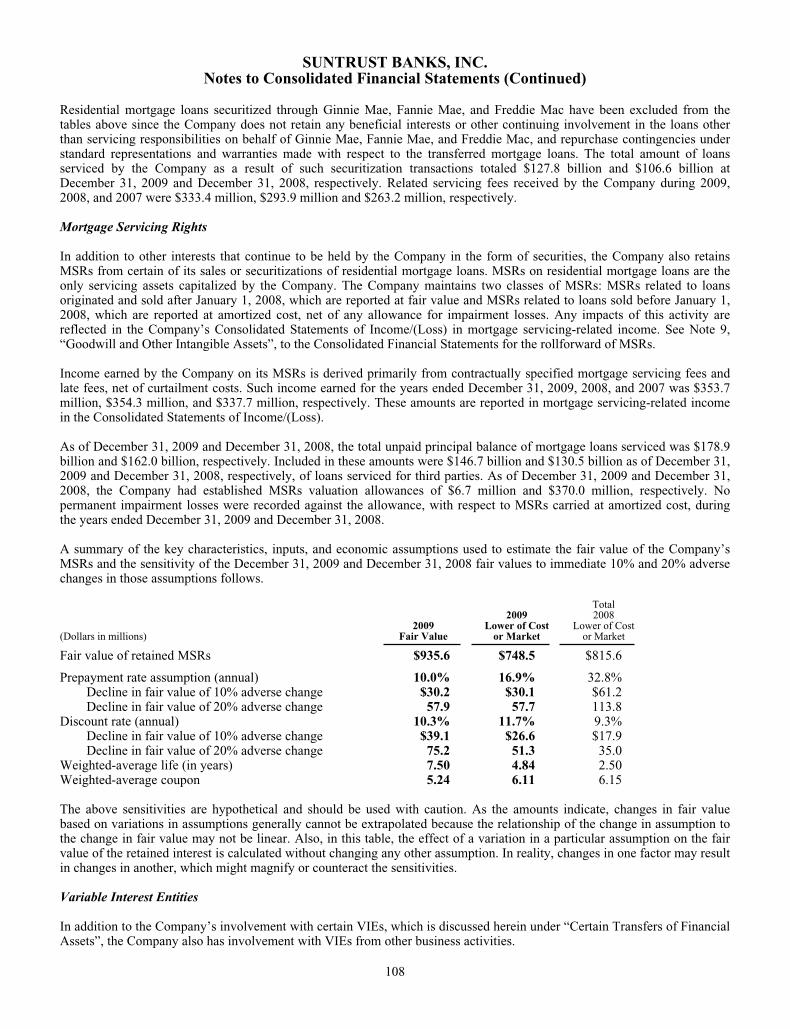
SUNTRUST BANKS, INC.Notes to Consolidated Financial Statements (Continued)
Residential mortgage loans securitized through Ginnie Mae, Fannie Mae, and Freddie Mac have been excluded from thetables above since the Company does not retain any beneficial interests or other continuing involvement in the loans otherthan servicing responsibilities on behalf of Ginnie Mae, Fannie Mae, and Freddie Mac, and repurchase contingencies understandard representations and warranties made with respect to the transferred mortgage loans. The total amount of loansserviced by the Company as a result of such securitization transactions totaled $127.8 billion and $106.6 billion atDecember 31, 2009 and December 31, 2008, respectively. Related servicing fees received by the Company during 2009,2008, and 2007 were $333.4 million, $293.9 million and $263.2 million, respectively.
Mortgage Servicing Rights
In addition to other interests that continue to be held by the Company in the form of securities, the Company also retainsMSRs from certain of its sales or securitizations of residential mortgage loans. MSRs on residential mortgage loans are theonly servicing assets capitalized by the Company. The Company maintains two classes of MSRs: MSRs related to loansoriginated and sold after January 1, 2008, which are reported at fair value and MSRs related to loans sold before January 1,2008, which are reported at amortized cost, net of any allowance for impairment losses. Any impacts of this activity arereflected in the Company’s Consolidated Statements of Income/(Loss) in mortgage servicing-related income. See Note 9,“Goodwill and Other Intangible Assets”, to the Consolidated Financial Statements for the rollforward of MSRs.
Income earned by the Company on its MSRs is derived primarily from contractually specified mortgage servicing fees andlate fees, net of curtailment costs. Such income earned for the years ended December 31, 2009, 2008, and 2007 was $353.7million, $354.3 million, and $337.7 million, respectively. These amounts are reported in mortgage servicing-related incomein the Consolidated Statements of Income/(Loss).
As of December 31, 2009 and December 31, 2008, the total unpaid principal balance of mortgage loans serviced was $178.9billion and $162.0 billion, respectively. Included in these amounts were $146.7 billion and $130.5 billion as of December 31,2009 and December 31, 2008, respectively, of loans serviced for third parties. As of December 31, 2009 and December 31,2008, the Company had established MSRs valuation allowances of $6.7 million and $370.0 million, respectively. Nopermanent impairment losses were recorded against the allowance, with respect to MSRs carried at amortized cost, duringthe years ended December 31, 2009 and December 31, 2008.
A summary of the key characteristics, inputs, and economic assumptions used to estimate the fair value of the Company’sMSRs and the sensitivity of the December 31, 2009 and December 31, 2008 fair values to immediate 10% and 20% adversechanges in those assumptions follows.
(Dollars in millions)2009
Fair Value
2009Lower of Cost
or Market
Total2008
Lower of Costor Market
Fair value of retained MSRs $935.6 $748.5 $815.6
Prepayment rate assumption (annual) 10.0% 16.9% 32.8%Decline in fair value of 10% adverse change $30.2 $30.1 $61.2Decline in fair value of 20% adverse change 57.9 57.7 113.8
Discount rate (annual) 10.3% 11.7% 9.3%Decline in fair value of 10% adverse change $39.1 $26.6 $17.9Decline in fair value of 20% adverse change 75.2 51.3 35.0
Weighted-average life (in years) 7.50 4.84 2.50Weighted-average coupon 5.24 6.11 6.15
The above sensitivities are hypothetical and should be used with caution. As the amounts indicate, changes in fair valuebased on variations in assumptions generally cannot be extrapolated because the relationship of the change in assumption tothe change in fair value may not be linear. Also, in this table, the effect of a variation in a particular assumption on the fairvalue of the retained interest is calculated without changing any other assumption. In reality, changes in one factor may resultin changes in another, which might magnify or counteract the sensitivities.
Variable Interest Entities
In addition to the Company’s involvement with certain VIEs, which is discussed herein under “Certain Transfers of FinancialAssets”, the Company also has involvement with VIEs from other business activities.
108

SUNTRUST BANKS, INC.Notes to Consolidated Financial Statements (Continued)
Three Pillars Funding, LLC
SunTrust assists in providing liquidity to select corporate clients by directing them to a multi-seller CP conduit, ThreePillars. Three Pillars provides financing for direct purchases of financial assets originated and serviced by SunTrust’scorporate clients by issuing highly rated CP.
The Company’s involvement with Three Pillars includes the following activities: services related to the administrationof Three Pillars’ activities and client referrals to Three Pillars; the issuing of letters of credit, which provide partialcredit protection to the CP holders; and providing liquidity arrangements that would provide funding to Three Pillars inthe event it can no longer issue CP or in certain other circumstances. The Company’s activities with Three Pillarsgenerated total fee revenue for the Company, net of direct salary and administrative costs incurred by the Company, ofapproximately $58.8 million, $48.2 million, and $28.7 million for the years ended December 31, 2009, December 31,2008, and December 31, 2007, respectively.
Three Pillars has issued a subordinated note to a third party, which matures in March 2015; however, the note holdermay declare the note due and payable upon an event of default, which includes any loss drawn on the note fundingaccount that remains unreimbursed for 90 days. The subordinated note holder absorbs the first dollar of loss in the eventof nonpayment of any of Three Pillars’ assets. Only the remaining balance of the first loss note, after any incurredlosses, would be due. The outstanding and committed amounts of the subordinated note were $20.0 million atDecember 31, 2009 and December 31, 2008, and no losses had been incurred through December 31, 2009. Subsequentto December 31, 2009, Three Pillars repaid and extinguished the subordinated note.
The Company has determined that Three Pillars is a VIE, as Three Pillars has not issued sufficient equity at risk. TheCompany and the holder of the subordinated note are the two significant VI holders in Three Pillars. The Company andthis note holder are not related parties or de facto agents of one another. The Company uses a mathematical model thatcalculates the expected losses and expected residual returns of Three Pillars’ assets and operations, based on a MonteCarlo simulation, and allocates each to the Company and the holder of the subordinated note. The results of this model,which the Company evaluates monthly, have shown that the holder of the subordinated note absorbs the majority of thevariability of Three Pillars’ expected losses. The Company believes the subordinated note is sized in an amountsufficient to absorb the expected loss of Three Pillars based on current commitment levels and the forecasted growth inThree Pillars’ assets; as such, the Company has concluded it is not Three Pillars’ primary beneficiary and is not requiredto consolidate Three Pillars. See Note 1, “Significant Accounting Policies,” to the Consolidated Financial Statements fora discussion of the impacts of the amendments to ASC 810-10 on the Company’s involvement with Three Pillars.
As of December 31, 2009 and December 31, 2008, Three Pillars had assets not included on the Company’sConsolidated Balance Sheets of approximately $1.8 billion and $3.5 billion, respectively, consisting primarily ofsecured loans. Funding commitments and outstanding receivables extended by Three Pillars to its customers totaled $3.7billion and $1.7 billion, respectively, as of December 31, 2009, almost all of which renew annually, as compared to $5.9billion and $3.5 billion, respectively, as of December 31, 2008. The majority of the commitments are backed by tradereceivables and commercial loans that have been originated by companies operating across a number of industrieswhich collateralize 50% and 18%, respectively, of the outstanding commitments, as of December 31, 2009, as comparedto 47% and 20%, respectively, as of December 31, 2008. Assets supporting those commitments have a weighted averagelife of 1.25 years and 1.52 years at December 31, 2009 and December 31, 2008, respectively. At December 31, 2009,Three Pillars’ outstanding CP used to fund the assets totaled approximately $1.8 billion, with remaining weightedaverage lives of 5.9 days and maturities through February 2010.
Each transaction added to Three Pillars is typically structured to a minimum implied A/A2 rating according toestablished credit and underwriting policies as approved by credit risk management and monitored on a regular basis toensure compliance with each transaction’s terms and conditions. Typically, transactions contain dynamic creditenhancement features that provide increased credit protection in the event asset performance deteriorates. If assetperformance deteriorates beyond predetermined covenant levels, the transaction could become ineligible for continuedfunding by Three Pillars. This could result in the transaction being amended with the approval of credit riskmanagement, or Three Pillars could terminate the transaction and enforce any rights or remedies available, includingamortization of the transaction or liquidation of the collateral. In addition, Three Pillars has the option to fund under theliquidity facility provided by the Bank in connection with the transaction and may be required to fund under theliquidity facility if the transaction remains in breach. In addition, each commitment renewal requires credit riskmanagement approval. The Company is not aware of unfavorable trends related to Three Pillars assets for which theCompany expects to suffer material losses. During the years ended December 31, 2009 and 2008, there were no write-downs of Three Pillars’ assets.
109

SUNTRUST BANKS, INC.Notes to Consolidated Financial Statements (Continued)
During the month of September 2008, the illiquid markets put a significant strain on the CP market and, as a result ofthis temporary disruption, the Company purchased approximately $275.4 million par amount of Three Pillars’ overnightCP, none of which was outstanding at December 31, 2008. Separate from the temporary disruption in the CP markets inSeptember 2008, the Company held outstanding Three Pillars’ CP at December 31, 2008 with a par amount ofapproximately $400 million, all of which matured on January 9, 2009. None of the Company’s purchases of CP during2008 altered the Company’s conclusion that it was not the primary beneficiary of Three Pillars.
Three Pillars has historically financed its activities by issuing A-1/P-1 rated CP and had no other form of senior fundingoutstanding, other than CP, as of December 31, 2009 or December 31, 2008. However, in the second quarter of 2009,Three Pillars CP was downgraded to A-2/P-1 due to the downgrade to A-/A2 of the Bank, which provides liquidity andcredit enhancement to Three Pillars. This downgrade was not a reflection of the asset quality of Three Pillars, but didnegatively impact its ability to issue CP to third party investors.
Subsequent to the S&P downgrade, the Company successfully completed its capital plan under the “stress test”, whichincluded a successful common equity raise and tender offer for certain of its preferred stock and hybrid debt instruments.Additionally, in June 2009, Three Pillars received an F-1 rating from Fitch and chose to replace S&P’s A-2 rating, whichwas simultaneously withdrawn. As such, Three Pillars’ CP now carries an F-1/P-1 rating, which has allowed Three Pillarsto issue approximately 75%, on average, of its CP to investors other than the Company during the quarter endedDecember 31, 2009. At December 31, 2009, the Company held no Three Pillars CP. The purchases of CP by the Companydid not alter the allocation of variability within Three Pillars in a manner that was not originally considered, nor was it ameans for the Company to provide non-contractual support to Three Pillars in order to protect any VI holders from losses.The predominant driver of risk is the credit risk of the underlying assets owned by Three Pillars, and S&P’s downgradewas not in response to any credit deterioration in these assets. Further, the subordinated note holder remained exposed tothe majority of variability in expected losses in Three Pillars to the same degree it had prior to any purchases of CP by theCompany. The Company’s at-market purchases of CP do not impact the interest rates paid by the clients of Three Pillars,as they are obligated to pay a pass through rate based on the rate at which Three Pillars issues CP. After evaluating all factsand circumstances, the Company concluded that the results of the mathematical model that the Company uses to support itsconclusion that it is not the primary beneficiary of Three Pillars had not changed, the design of Three Pillars had notchanged, and the purchases of CP by the Company had not given rise to an implicit VI in Three Pillars that would haveresulted in the Company becoming the primary beneficiary of Three Pillars.
The Company has off-balance sheet commitments in the form of liquidity facilities and other credit enhancements that ithas provided to Three Pillars. These commitments are accounted for as financial guarantees by the Company. Theliquidity commitments are revolving facilities that are sized based on the current commitments provided by ThreePillars to its customers. The liquidity facilities are generally used if new CP cannot be issued by Three Pillars to repaymaturing CP. However, the liquidity facilities are available in all circumstances, except certain bankruptcy-relatedevents with respect to Three Pillars. Draws on the facilities are subject to the purchase price (or borrowing base)formula that, in many cases, excludes defaulted assets to the extent that they exceed available over-collateralization inthe form of non-defaulted assets, and may also provide the liquidity banks with loss protection equal to a portion of theloss protection provided for in the related securitization agreement. Additionally, there are transaction specificcovenants and triggers that are tied to the performance of the assets of the relevant seller/servicer that may result in atransaction termination event, which, if continuing, would require funding through the related liquidity facility. Finally,in a termination event of Three Pillars, such as if its tangible net worth falls below $5,000 for a period in excess of 15days, Three Pillars would be unable to issue CP, which would likely result in funding through the liquidity facilities.Draws under the credit enhancement are also available in all circumstances, but are generally used to the extent requiredto make payment on any maturing CP if there are insufficient funds from collections of receivables or the use ofliquidity facilities. The required amount of credit enhancement at Three Pillars will vary from time to time as newreceivable pools are purchased or removed from its asset portfolio, but is generally equal to 10% of the aggregatecommitments of Three Pillars.
The total notional amounts of the liquidity facilities and other credit enhancements represent the Company’s maximumexposure to potential loss, which was $3.8 billion and $371.3 million, respectively, as of December 31, 2009, comparedto $6.1 billion and $597.5 million, respectively, as of December 31, 2008. The Company did not have any liabilityrecognized on its Consolidated Balance Sheets related to these liquidity facilities and other credit enhancements as ofDecember 31, 2009 or December 31, 2008, as no amounts had been drawn, nor were any draws probable to occur, suchthat a loss should have been accrued. In addition, no losses were recognized by the Company in connection with theseoff-balance sheet commitments during the years ended December 31, 2009 or 2008. There are no other contractualarrangements that the Company plans to enter into with Three Pillars to provide it additional support.
110
SUNTRUST BANKS, INC.Notes to Consolidated Financial Statements (Continued)
Total Return Swaps
The Company has had involvement with various VIEs related to its TRS business. The Company decided to temporarilysuspend this business in late 2008 and terminated its existing transactions during 2009. Under the TRS business model,the VIEs purchase portfolios of loans at the direction of third parties. These third parties are not related parties to theCompany, nor are they and the Company de facto agents of each other. In order for the VIEs to purchase the loans, theCompany provides senior financing to these VIEs. At December 31, 2008, the Company had $603.4 million in suchfinancing outstanding, which was classified within trading assets on the Consolidated Balance Sheets and none wasoutstanding at December 31, 2009. The Company enters into TRS transactions with the VIEs that the Company mirrorswith a TRS with the third party who controls the loans owned by the VIE. The TRS transactions pass through all interestand other cash flows on the loans to the third party, along with exposing the third parties to any depreciation on theloans and providing them with the rights to all appreciation on the loans. The terms of the TRS transactions require thethird parties to post initial margin, in addition to ongoing margin as the fair values of the underlying loans decrease.Previously, the Company had concluded it was not the primary beneficiary of the VIEs, as the VIEs were designed forthe benefit of the third parties. The third parties have implicit VIs in the VIEs via their TRS transactions with theCompany, whereby these third parties absorb the majority of the expected losses and are entitled to the majority of theexpected residual returns of the VIEs. At December 31, 2008, these VIEs had entered into TRS with the Company thathad outstanding notional of $602.1 million and none was outstanding at December 31, 2009. The Company has notprovided any support that it was not contractually obligated to for the year ended December 31, 2009 or December 31,2008. For additional information on the Company’s TRS with these VIEs, see Note 17, “Derivative FinancialInstruments” to the Consolidated Financial Statements.
Community Development Investments
As part of its community reinvestment initiatives, the Company invests almost exclusively within its footprint in multi-family affordable housing developments and other community development entities as a limited and/or general partnerand/or a debt provider. The Company receives tax credits for its partnership investments. The Company has determinedthat these partnerships are VIEs when SunTrust does not own 100% of the entity because the holders of the equityinvestment at risk do not have the direct or indirect ability to make decisions that have a significant impact on thebusiness. Accordingly, the Company’s general partner, limited partner, and/or debt interests are VIs that the Companyevaluates for purposes of determining whether the Company is the primary beneficiary. During 2009 and 2008,SunTrust did not provide any financial or other support to its consolidated or unconsolidated investments that it was notpreviously contractually required to provide. Beginning on January 1, 2010, the Company adopted the amendments toASC 810-10 and determined that the Company will continue to consolidate those partnerships in which it acts as thegeneral partner or the indemnifying party. In these situations, the Company has both the power to direct the activities ofthe VIE that most significantly impact the entity’s economic performance and the obligation to absorb losses or therights to receive benefits that could potentially be significant to the VIE. The Company will continue to not consolidatethose partnerships in which it acts solely as the limited partner. As the limited partner the Company does not have thepower to direct the activities of the VIE that most significantly impact the entity’s economic performance.
The Company manages certain community development projects that generate tax credits and help it meet therequirements of the CRA. The related interests in these projects are recorded within the other assets line item on theConsolidated Balance Sheets. During 2007, the Company completed a strategic review of these properties anddetermined that the sale of certain properties was possible, which resulted in the Company recording a $57.7 millionimpairment charge in other noninterest expense within the Commercial line of business. Total impairment chargesrecorded within the Commercial line of business in 2009 and 2008 totaled $46.8 million and $19.9 million, respectively.
For some partnerships, SunTrust operates strictly as a general partner or the indemnifying party and, as such, is exposedto a majority of the partnerships’ expected losses. Accordingly, SunTrust consolidates these partnerships on itsConsolidated Balance Sheets. As the general partner or indemnifying party, SunTrust typically guarantees the tax creditsdue to the limited partner and is responsible for funding construction and operating deficits. As of December 31, 2009and December 31, 2008, total assets, which consist primarily of fixed assets and cash attributable to the consolidatedpartnerships, were $14.4 million and $20.5 million, respectively, and total liabilities, excluding intercompany liabilities,were $3.2 million and $3.3 million, respectively. Security deposits from the tenants are recorded as liabilities on theCompany’s Consolidated Balance Sheets. The Company maintains separate cash accounts to fund these liabilities andthese assets are considered restricted. The tenant liabilities and corresponding restricted cash assets were $0.1 million asof December 31, 2009 and December 31, 2008. While the obligations of the general partner or indemnifying entity aregenerally non-recourse to SunTrust, the Company, as the general partner or the indemnifying entity, may from time totime step in when needed to fund deficits. During 2009 and 2008, SunTrust did not provide any significant amount offunding as the general partner or the indemnifying entity to cover any deficits the partnerships may have generated.
111
SUNTRUST BANKS, INC.Notes to Consolidated Financial Statements (Continued)
For other partnerships, the Company acts only in a limited partnership capacity. The Company has determined that it isnot the primary beneficiary of these partnerships because it will not absorb a majority of the expected losses of thepartnership. Typically, the general partner or an affiliate of the general partner provide guarantees to the limited partnerwhich protect the Company from losses attributable to operating deficits, construction deficits, and tax credit allocationdeficits. The Company accounts for its limited partner interests in accordance with the income tax guidance forinvestments in affordable housing projects. Partnership assets of approximately $1.1 billion and $1.0 billion in thesepartnerships were not included in the Consolidated Balance Sheets at December 31, 2009 and December 31, 2008,respectively. These limited partner interests had carrying values of $218.1 million and $188.9 million at December 31,2009 and December 31, 2008, respectively, and are recorded in other assets on the Company’s Consolidated BalanceSheets. The Company’s maximum exposure to loss for these limited partner investments totaled $468.2 million and$473.2 million at December 31, 2009 and December 31, 2008, respectively. The Company’s maximum exposure to losswould be borne by the loss of the limited partnership equity investments along with $219.4 million and $202.7 millionof loans issued by the Company to the limited partnerships at December 31, 2009 and December 31, 2008, respectively.The difference between the maximum exposure to loss and the investment and loan balances is primarily attributable tothe unfunded equity commitments. Unfunded equity commitments are amounts that the Company has committed to thepartnerships upon the partnerships meeting certain conditions. When these conditions are met, the Company will investthese additional amounts in the partnerships.
When SunTrust owns both the limited partner and general partner or acts as the indemnifying party, the Companyconsolidates the partnerships and does not consider these partnerships VIEs because, as owner of the partnerships, theCompany has the ability to directly and indirectly make decisions that have a significant impact on the business. As ofDecember 31, 2009 and December 31, 2008, total assets, which consist primarily of fixed assets and cash, attributable tothe consolidated, non-VIE partnerships were $424.9 million and $493.5 million, respectively, and total liabilities,excluding intercompany liabilities, primarily representing third-party borrowings, were $209.0 million and $327.6million, respectively.
Registered and Unregistered Funds Advised by RidgeWorth
RidgeWorth, a registered investment advisor and wholly-owned subsidiary of the Company, serves as the investmentadvisor for various private placement and publicly registered investment funds (collectively the “Funds”). The Companyevaluates these Funds to determine if the Funds are voting interest entities or VIEs, as well as monitors the nature of itsinterests in each Fund to determine if the Company is required to consolidate any of the Funds.
The Company has concluded that some of the Funds are VIEs because the equity investors lack decision making rights.However, the Company has concluded that it is not the primary beneficiary of these funds as the Company does notabsorb a majority of the expected losses or expected returns of the funds. As the Company does not directly invest inthese funds, its exposure to loss is limited to the investment advisor and other administrative fees it earns. Payment onthese fees is received from the individual investor accounts. The total unconsolidated assets of these funds as ofDecember 31, 2009 and December 31, 2008 were $3.3 billion and $3.6 billion, respectively. Beginning on January 1,2010, the Company adopted the amendments to ASC 810-10 as noted in Note 1, “Significant Accounting Policies.” InJanuary 2010, the FASB voted to finalize an ASU that would defer the amendments to ASC 810-10 for certaininvestment funds that meet specific criteria. The Company has determined that these Funds meet the criteria for deferraland accordingly will continue to be accounted for under the previous accounting model.
While the Company does not have any contractual obligation to provide monetary support to any of the Funds, theCompany did elect to provide support for specific securities on one occasion in 2008 and two occasions in 2007 to threeof the funds. In 2008 and 2007, the Company purchased approximately $2.4 billion of securities from these three fundsat amortized cost plus accrued interest. The Company took these actions in response to the unprecedented market eventsto protect investors in these funds from possible losses associated with these securities. Two of the funds werepreviously considered voting interest entities and in connection with these purchases, the Company re-evaluated itsinvolvement with these funds. As a result of the unprecedented circumstances that caused the Company to intervene, thelack of any contractual obligation to provide any current or future support to the funds, and the size of the financialsupport ultimately provided, the Company concluded that these two funds were still voting interest entities. TheCompany concluded that the third fund was a VIE and that, as a result of the purchase of securities, it was the primarybeneficiary of this fund as it was likely to absorb a majority of the expected losses of the fund. Accordingly, this fundwas consolidated in September 2007 and was subsequently closed in November 2007, which resulted in the terminationof the VIE. At December 31, 2009 and December 31, 2008, the Company still owned securities purchased from thesethree funds of $159.3 million and $246.0 million, respectively.
112

SUNTRUST BANKS, INC.Notes to Consolidated Financial Statements (Continued)
Note 12 - Long-Term Debt
Long-term debt at December 31 consisted of the following:
(Dollars in thousands) 2009 2008
Parent Company OnlySenior4.25% notes due 2009 $0 $299,7815.25% notes due 20123 452,555 427,718Floating rate notes due 2012 based on one month LIBOR + .46% 4 576,000 -Floating rate notes due 2015 based on one month LIBOR + 1.25% 885,227 885,2276.00% notes due 2017 485,000 500,000Floating rate notes due 2019 based on three month LIBOR + .15% 50,563 50,5636.00% notes due 20282 8,830 8,829
Total senior debt - Parent 2,458,175 2,172,118
Subordinated7.75% notes due 20103 305,545 303,6306.00% notes due 2026 199,907 199,903
Total subordinated debt - Parent 505,452 503,533
Junior SubordinatedFloating rate notes due 2027 based on three month LIBOR + .67%1 349,758 349,740Floating rate notes due 2027 based on three month LIBOR + .98%1 34,031 34,030Floating rate notes due 2028 based on three month LIBOR + .65%1 249,751 249,743Floating rate notes due 2032 based on three month LIBOR + 3.40%1 12,519 12,411Floating rate notes due 2033 based on three month LIBOR + 3.10%1 2,435 2,369Floating rate notes due 2034 based on three month LIBOR + 2.65%1 7,666 7,5716.10% notes due 20361, 2 907,398 999,8335.588% notes due 20421, 2 101,497 500,0007.7875% notes due 20681 685,000 685,000
Total junior subordinated debt—Parent 2,350,055 2,840,697
Total Parent Company (excluding intercompany of $160,000 in 2009 and $160,000 in2008) 5,313,682 5,516,348
SubsidiariesSeniorFloating rate notes due 2009 based on three month LIBOR + .10% - 400,000Floating rate notes due 2010 based on three month LIBOR + .65%4 750,000 750,0003.0% notes due 20114 2,245,475 2,243,257Floating rate euro notes due 2011 based on three month EURIBOR + .11%2 1,164,169 1,395,150Floating rate sterling notes due 2012 based on GBP LIBOR + .12%2 622,583 582,880Floating rate notes due 2012 based on three month LIBOR + .11%2 859,255 1,000,000Floating rate notes due 2014 based on one month LIBOR + 1.25% 274,837 274,837Capital lease obligations 14,994 16,061FHLB advances (0.00%—8.79%; advances at fair value $0 at December 31, 2009 and
$3,659,423 at December 31, 2008)2 2,242,759 10,739,956Direct finance lease obligations 251,213 153,569Other 422,757 475,409
Total senior debt—subsidiaries 8,848,042 18,031,119
Subordinated6.375% notes due 20113 887,273 862,0965.00% notes due 20153 515,104 494,886Floating rate notes due 2015 based on three month LIBOR + .30% 200,000 200,000Floating rate notes due 2015 based on three month LIBOR + .29% 300,000 300,0005.45% notes due 20173 450,144 441,1885.20% notes due 20173 320,426 312,6767.25% notes due 20183 388,196 394,1845.40% notes due 20203 266,649 259,884
Total subordinated debt—subsidiaries 3,327,792 3,264,914
Total subsidiaries 12,175,834 21,296,033
Total long-term debt $17,489,516 $26,812,381
1Notes payable to trusts formed to issue Trust Preferred Securities totaled $2.4 billion and $2.8 billion at December 31, 2009 and2008, respectively.2Debt was partially extinguished in 2009 and 2008 prior to the contractual repayment date. The Company recognized a net loss of$39.4 million and $11.7 million in 2009 and 2008, respectively, as a result of the prepayment.3Debt recorded at fair value.4Government guaranteed debt issued under the FDIC’s Temporary Liquidity Guarantee Program.
113

SUNTRUST BANKS, INC.Notes to Consolidated Financial Statements (Continued)
Maturities of long-term debt are: 2010 – $2,142.5 million; 2011 – $4,548.8 million; 2012 – $2,982.6 million; 2013 – $633.9million; 2014 – $25.3 million; and thereafter—$7,156.4 million. Restrictive provisions of several long-term debt agreementsprevent the Company from creating liens on, disposing of, or issuing (except to related parties) voting stock of subsidiaries.
Further, there are restrictions on mergers, consolidations, certain leases, sales or transfers of assets, minimum shareholders’equity, and maximum borrowings by the Company. As of December 31, 2009, the Company was in compliance with allcovenants and provisions of long-term debt agreements. As currently defined by federal bank regulators, long-term debt of$2,356.4 million and $2,847.3 million as of December 31, 2009 and 2008, respectively, qualified as Tier 1 capital and long-term debt of $2,817.9 million and $3,008.3 million as of December 31, 2009 and 2008, respectively, qualified as Tier 2capital. As of December 31, 2009, the Company had collateral pledged to the FHLB of Atlanta to support $7.2 billion ofavailable borrowing capacity.
The Company does not consolidate certain wholly-owned trusts which had been formed for the sole purpose of issuing trustpreferred securities. The proceeds from the trust preferred securities issuances were invested in junior subordinateddebentures of the Parent Company. The obligations of these debentures constitute a full and unconditional guarantee by theParent Company of the trust preferred securities.
Note 13 - Earnings Per Share
Net income/(loss) is the same in the calculation of basic and diluted earnings/(loss) per average common share. Equivalentshares of 32.5 million and 33.5 million related to common stock options and common stock warrants outstanding as ofDecember 31, 2009 and 2008, respectively, were excluded from the computations of diluted earnings/(loss) per averagecommon share because they would have been antidilutive. A reconciliation of the difference between average basic commonshares outstanding and average diluted common shares outstanding for the years ended December 31, 2009, 2008, and 2007is included below. For EPS calculation purposes, the impact of dilutive securities are excluded from the diluted share countduring periods that the Company has recognized a net loss available to common shareholders because the impact would beanti-dilutive. Additionally, included below is a reconciliation of net income/(loss) to net income/(loss) available to commonshareholders.
(In thousands, except per share data) 2009 2008 2007
Net income/(loss) ($1,563,683) $795,774 $1,634,015Series A preferred dividends (14,143) (22,255) (30,275)U.S. Treasury preferred dividends and accretion of discount (265,786) (26,579) -Gain on repurchase of Series A preferred stock 94,318 - -Dividends and undistributed earnings allocated to unvested shares 15,917 (5,958) (10,786)
Net income/(loss) available to common shareholders ($1,733,377) $740,982 $1,592,954
Average basic common shares 435,328 348,919 349,346Effect of dilutive securities:
Stock options 452 190 2,396Restricted stock 1,706 1,074 946
Average diluted common shares 437,486 350,183 352,688
Earnings/(loss) per average common share - diluted ($3.98) $2.12 $4.52
Earnings/(loss) per average common share - basic ($3.98) $2.12 $4.56
Note 14 – Capital
As part of the Company’s participation in the SCAP, the Company completed certain transactions as part of an announcedcapital plan during the second quarter of 2009 that increased its Tier 1 common equity by $2.1 billion. The transactionsutilized to raise the capital consisted of the issuance of common stock, the repurchase of certain preferred stock and hybriddebt securities, and the sale of Visa Class B shares.
• The common stock offerings that the Company completed in conjunction with the capital plan added 141.9 millionin new common shares and resulted in $1.8 billion in additional Tier 1 common equity, net of issuance costs.
114
SUNTRUST BANKS, INC.Notes to Consolidated Financial Statements (Continued)
• Also as part of the capital plan, the Company initiated a cash tender offer to repurchase a defined maximumamount of its outstanding Series A preferred stock. 3,142 shares of the Company’s Series A preferred stock wererepurchased, resulting in a decrease in preferred stock of $314.2 million. An after-tax gain of $89.4 million wasincluded in net loss available to common shareholders and an increase of $91.0 million was realized in Tier 1common equity during the three month period ended June 30, 2009. In addition, the Company also repurchasedapproximately $0.4 billion of its 5.588% Parent Company junior subordinated notes due 2042, and approximately$0.1 billion of its 6.10% Parent Company junior subordinated notes due 2036. These transactions resulted in a netafter-tax loss of $44.1 million, as a result of a $164.9 million after-tax loss related to the extinguishment of thepreferred stock forward sale agreement associated with the repurchase of the 5.588% Parent Company juniorsubordinated notes, and a $120.8 million after-tax gain from the repurchase of the Parent Company juniorsubordinated notes. The aggregate impact of the debt repurchases was a $120.8 million increase to Tier 1 commonequity.
• Another element of the capital plan involved the sale of Visa Class B shares resulting in an increase in Tier 1common equity of $70.1 million, net of tax.
The Company is subject to various regulatory capital requirements which involve quantitative measures of the Company’sassets.
As of December 31,
2009 2008
(Dollars in millions) Amount Ratio Amount Ratio
SunTrust Banks, Inc.Tier 1 common $10,692 7.67 % $9,443 5.83 %Tier 1 capital 18,069 12.96 17,614 10.87Total capital 22,895 16.43 22,743 14.04Tier 1 leverage 10.90 10.45
SunTrust BankTier 1 capital $11,973 8.76 % $12,565 7.88 %Total capital 16,377 11.98 17,331 10.87Tier 1 leverage 7.51 7.60
Substantially all of the Company’s retained earnings are undistributed earnings of SunTrust Bank, which are restricted byvarious regulations administered by federal and state bank regulatory authorities. There was no capacity for payment of cashdividends to the parent company under these regulations at December 31, 2009 and 2008. The Company also has amounts ofcash reserves required by the Federal Reserve. As of December 31, 2009 and 2008, these reserve requirements totaled $1.1billion and $914.8 million, respectively and were fulfilled with a combination of cash on hand and deposits at the FederalReserve.
Preferred Stock
As of December 31,
(Dollars in thousands) 2009 2008
Series A (1,858 shares outstanding) $172,511 $500,000Series C (35,000 shares outstanding) 3,423,929 3,404,841Series D (13,500 shares outstanding) 1,320,872 1,316,862
$4,917,312 $5,221,703
On September 12, 2006, the Company issued depositary shares representing ownership interests in 5,000 shares of PerpetualPreferred Stock, Series A, no par value and $100,000 liquidation preference per share (the “Series A Preferred Stock”). TheCompany is authorized to issue 50,000 shares. The Series A Preferred Stock has no stated maturity and will not be subject toany sinking fund or other obligation of the Company. Dividends on the Series A Preferred Stock, if declared, will accrue andbe payable quarterly at a rate per annum equal to the greater of three-month LIBOR plus 0.53 percent, or 4.00 percent.Dividends on the shares are non-cumulative. Shares of the Series A Preferred Stock have priority over the Company’scommon stock with regard to the payment of dividends. As such, the Company may not pay dividends on or repurchase,redeem, or otherwise acquire for consideration shares of its common stock unless dividends for the Series A Preferred Stockhave been declared for that period, and sufficient funds have been set aside to make payment. On or after September 15,
115

SUNTRUST BANKS, INC.Notes to Consolidated Financial Statements (Continued)
2011, the Series A Preferred Stock will be redeemable at the Company’s option at a redemption price equal to $100,000 pershare, plus any declared and unpaid dividends. Except in certain limited circumstances, the Series A Preferred Stock does nothave any voting rights.
On November 14, 2008, as part of the CPP established by the U.S. Treasury under the EESA, the Company entered into aPurchase Agreement with the U.S. Treasury pursuant to which the Company issued and sold to the U.S. Treasury 35,000shares of the Company’s Fixed Rate Cumulative Perpetual Preferred Stock, Series C, having a liquidation preference of$100,000 per share (the “Series C Preferred Stock”), and a ten-year warrant to purchase up to 11,891,280 shares of theCompany’s common stock, par value $1.00 per share, at an initial exercise price of $44.15 per share, for an aggregatepurchase price of $3.5 billion in cash.
Cumulative dividends on the Series C Preferred Stock will accrue on the liquidation preference at a rate of 5% per annum forthe first five years, and at a rate of 9% per annum thereafter, but will be paid only if, as, and when declared by theCompany’s Board. The Series C Preferred Stock has no maturity date and ranks senior to the Company’s common stock (andpari passu with the Company’s other authorized series of preferred stock) with respect to the payment of dividends anddistributions and amounts payable upon liquidation, dissolution, and winding up of the Company. The Series C PreferredStock generally is non-voting.
The Company may redeem the Series C Preferred Stock at par on or after December 15, 2011. Prior to this date, theCompany may redeem the Series C Preferred Stock at par if the Company has raised aggregate gross proceeds in one or moreQualified Equity Offerings, as defined in the Company’s articles of incorporation and in the purchase agreement, in excess of$875 million, and the aggregate redemption price does not exceed the aggregate net proceeds from such Qualified EquityOfferings. Any redemption is subject to the consent of the Federal Reserve.
On December 31, 2008, as part of the CPP established by the U.S. Treasury under the EESA, the Company entered into aPurchase Agreement with the U.S. Treasury dated December 31, 2008 pursuant to which the Company issued and sold to theU.S. Treasury 13,500 shares of the Company’s Fixed Rate Cumulative Perpetual Preferred Stock, Series D, having aliquidation preference of $100,000 per share (the “Series D Preferred Stock”), and a ten-year warrant to purchase up to6,008,902 shares of the Company’s common stock, par value $1.00 per share, at an initial exercise price of $33.70 per share,for an aggregate purchase price of $1.35 billion in cash.
Cumulative dividends on the Series D Preferred Stock will accrue on the liquidation preference at a rate of 5% per annum forthe first five years, and at a rate of 9% per annum thereafter, but will be paid only if, as, and when declared by theCompany’s Board. The Series D Preferred Stock has no maturity date and ranks senior to the Company’s common stock (andpari passu with the Company’s other authorized series of preferred stock) with respect to the payment of dividends anddistributions and amounts payable upon liquidation, dissolution, and winding up of the Company. The Series D PreferredStock generally is non-voting.
The Company may redeem the Series D Preferred Stock at par on or after March 15, 2012, but only after it has redeemed theSeries C Preferred Stock. Prior to such time, the Company may redeem the Series D Preferred Stock at par if the Companyhas redeemed all of the Series C Preferred Stock, the Company has raised aggregate gross proceeds in one or more QualifiedEquity Offerings, as defined in the Company’s articles of incorporation and in the purchase agreement, in excess of $337.5million, and the aggregate redemption price does not exceed the aggregate net proceeds from such Qualified EquityOfferings. Any redemption is subject to the consent of the Federal Reserve.
ARRA amends certain provisions of EESA and includes a provision that, subject to consultation with the appropriate Federalbanking agency, directs the U.S. Treasury to permit financial institutions from whom the U.S. Treasury purchased preferredstock to redeem such preferred stock without regard to whether such financial institution has replaced such funds and notsubject to any waiting period. The statute also directs the U.S. Treasury to enact regulations to implement the directives setforth in ARRA.
Upon issuance, the fair values of the Series C and Series D Preferred Stock and the associated warrants were computed as ifthe instruments were issued on a stand-alone basis. The fair values of the Series C and Series D Preferred Stock wereestimated based on observable trading levels of similar securities, resulting in a combined stand-alone fair value estimate ofapproximately $3.9 billion. The Company used an options pricing model (Bjerksund-Stensland) to estimate the fair value ofthe warrants as of the two issuance dates, resulting in a combined stand-alone fair value at each respective issuance date ofapproximately $110 million. The most significant and unobservable assumption in this valuation was volatility. TheCompany evaluated current listed market activity for its options, which is approximately two years, and historical data inarriving at an estimate of ten year volatility that the Company believed would be similar to an approach used by market
116

SUNTRUST BANKS, INC.Notes to Consolidated Financial Statements (Continued)
participants. The individual fair values were then used to record the Series C and Series D Preferred Stock and associatedwarrants on a relative fair value basis, with the warrants being recorded in Additional Paid in Capital as permanent equityand the Series C and Series D Preferred Stock being recorded at a discount of approximately $132 million. Accretion of thediscount associated with the Series C and Series D Preferred Stock is recognized as an increase to preferred stock dividendsin determining net income/(loss) available to common shareholders. The discount is being amortized over a five-year periodfrom each respective issuance date using the effective yield method and totaled $23.1 million and $3.7 million during 2009and 2008, respectively.
The Company is subject to certain restrictions on its ability to increase the dividend on common shares as a result ofparticipating in the CPP. Prior to November 14, 2011, unless the Company has redeemed the Series C and Series D PreferredStock or the U.S. Treasury has transferred the Series C and Series D Preferred Stock to a third party, the consent of the U.S.Treasury will be required for the Company to declare or pay any dividend or make any distribution on its common stock(other than regular quarterly cash dividends of not more than $0.77 per share of common stock) or redeem, purchase oracquire any shares of its common stock or other equity or capital securities, other than in connection with benefit plansconsistent with past practice and certain other circumstances specified in the Purchase Agreement. Prior to December 31,2011, unless the Company has redeemed the Series D Preferred Stock or the U.S. Treasury has transferred the Series DPreferred Stock to a third party, the consent of the U.S. Treasury will be required for the Company to declare or pay anydividend or make any distribution on its common stock (other than regular quarterly cash dividends of not more than $0.77per share of common stock) or redeem, purchase or acquire any shares of its common stock or other equity or capitalsecurities, other than in connection with benefit plans consistent with past practice and certain other circumstances specifiedin the Purchase Agreement. In addition, if the Company increases its dividend above $0.54 per share per quarter prior to thetenth anniversary of its participation in the CPP, then the anti-dilution warrants issued in connection with the Company’sparticipation in the CPP will require the exercise price and number of shares to be issued upon exercise to be proportionatelyadjusted. The amount of such adjustment is determined by a formula and depends in part on the extent to which the Companyraises its dividend. The formulas are contained in the warrant agreements which were filed as exhibits to the 2008 10-K.
During the years ended December 31, 2009 and 2008, the SunTrust Board of Directors paid cash dividends on perpetualpreferred stock totaling $246.1million and $37.3 million, respectively.
Accelerated Share Repurchase Agreement
On May 31, 2007, SunTrust entered into an ASR agreement with a global investment bank to purchase $800 million (gross ofsettlement costs) of SunTrust’s common stock. On June 7, 2007, the global investment bank delivered to SunTrust 8,022,254shares of SunTrust common stock, in exchange for the aforementioned consideration. During the third quarter of 2007,SunTrust completed this ASR when the Company received, without additional payment, an additional 1,462,091 shares.
Note 15 - Income Taxes
The components of income tax expense/(benefit) included in the Consolidated Statements of Income/(Loss) were as follows:
(Dollars in thousands) Years ended December 31,
Current income tax expense (benefit) 2009 2008 2007
Federal ($6,496) $140,484 $697,628State 2,687 13,480 65,644
Total ($3,809) $153,964 $763,272
Deferred income tax expense (benefit)
Federal ($798,507) ($93,895) ($110,760)State (96,467) (127,340) (36,998)
Total ($894,974) ($221,235) ($147,758)
Total income tax expense (benefit) ($898,783) ($67,271) $615,514
The Company’s income from international operations was not significant. Additionally, the tax effects of unrealized gainsand losses on securities available for sale, unrealized gains and losses on certain derivative financial instruments, and OCIrelated to certain retirement plans were recorded in OCI and had no effect on income tax expense (see Note 23,“Accumulated Other Comprehensive Income,” to the Consolidated Financial Statements).
117

SUNTRUST BANKS, INC.Notes to Consolidated Financial Statements (Continued)
A reconciliation of the expected income tax expense at the statutory federal income tax rate of 35% to the Company’s actualincome tax expense/(benefit) and effective tax rate for the past three years is as follows:
2009 2008 2007
(Dollars in thousands) Amount
Percent ofPre-TaxIncome Amount
Percent ofPre-TaxIncome Amount
Percent ofPre-TaxIncome
Income tax expense at federal statutoryrate ($861,863) (35.0) % $254,976 35.0 % $787,335 35.0 %
Increase (decrease) resulting from:Tax-exempt interest (79,293) (3.2) (74,921) (10.2) (74,183) (3.3)Dividends received deduction (12,117) (0.5) (13,766) (1.9) (14,949) (0.6)Dividends paid on employee stock
ownership plan shares (1,165) (0.1) (13,173) (1.9) (13,437) (0.6)Charitable contribution - - (64,196) (8.8) (2,168) (0.1)Income tax credits, net (79,425) (3.2) (75,164) (10.3) (75,480) (3.4)State income taxes, net (48,306) (2.0) (60,098) (8.2) 18,578 0.8Dividends on subsidiary preferred stock - - - - (23,884) (1.0)Completion of audit examinations by
taxing authorities (55,337) (2.2) (13,911) (1.9) - -Goodwill impairment 237,101 9.6 - - - -Other 1,622 0.1 (7,018) (1.0) 13,702 0.6
Total income tax expense (benefit) andrate ($898,783) (36.5) % ($67,271) (9.2) % $615,514 27.4 %
Deferred income tax liabilities and assets result from temporary differences between assets and liabilities measured forfinancial reporting purposes and for income tax return purposes. These assets and liabilities are measured using the enactedtax rates and laws that are currently in effect. The significant components of the net deferred tax asset and liability atDecember 31 were as follows:
December 31,
(Dollars in thousands) 2009 2008
Deferred Tax AssetsAllowance for loan losses $1,181,364 $887,401Accrued expenses 402,425 401,370Other real estate owned 61,659 33,428Loans 36,304 (44,207)State net operating losses (net of federal benefit) 103,429 77,901Federal net operating loss and credits 500,861 2,961Other 188,763 110,282
Gross deferred tax asset $2,474,805 $1,469,136
Deferred Tax LiabilitiesNet unrealized gains in accumulated other comprehensive income $590,363 $541,981Leasing 719,984 917,921Employee benefits 139,127 164,053Mortgage 706,087 485,045Securities 75,722 143,096Intangible assets 50,417 62,617Fixed assets 86,255 67,908Undistributed dividends 16,659 42,053Other 88,519 64,374
Gross deferred tax liability $2,473,133 $2,489,048
Net deferred tax asset/(liability) $1,672 ($1,019,912)
The deferred tax assets include a federal NOL and credits of $500.9 million as of December 31, 2009. No valuationallowance is necessary on the federal deferred tax assets. The federal NOL and credits will expire, if not utilized, by 2029.The deferred tax assets include state NOL carryforwards of $186.0 million (net of a valuation allowance of $53.2 million) for2009 and $148.5 million (net of a valuation allowance of $40.5 million) for 2008. The state NOLs expire, if not utilized, invarying amounts from 2009 to 2029.
118

SUNTRUST BANKS, INC.Notes to Consolidated Financial Statements (Continued)
As of December 31, 2009, the Company’s gross cumulative UTBs amounted to $160.6 million, of which $121.0 million (net offederal tax benefit) would affect the Company’s effective tax rate, if recognized. As of December 31, 2008, the Company’sgross cumulative UTBs amounted to $301.4 million. The reduction in UTBs was primarily attributable to the settlement ofexaminations by certain taxing authorities and the related payments and reversal of the liability. Additionally, the Companyrecognized a gross liability of $39.3 million and $70.9 million for interest related to its UTBs as of December 31, 2009 andDecember 31, 2008, respectively. Interest related to UTBs was income of $17.8 million for the year ended December 31, 2009,compared to expense of $22.4 million, for the same period in 2008. The Company continually evaluates the UTBs associatedwith its uncertain tax positions. It is reasonably possible that the total UTBs could decrease during the next 12 months by up to$15 million due to completion of tax authority examinations and the expiration of statutes of limitations.
The Company files consolidated and separate income tax returns in the United States federal jurisdiction and in various statejurisdictions. As of December 31, 2009, the Company’s federal returns through 2004 have been examined by the IRS and allissues have been resolved. An IRS examination of the Company’s 2005 and 2006 federal income tax returns is currently inprogress, but it is nearing completion with only one issue unresolved. Generally, the state jurisdictions in which the Companyfiles income tax returns are subject to examination for a period from three to seven years after returns are filed.
The following table provides a rollforward of the Company’s UTBs from January 1 to December 31:
2009 2008
Federal andState UTBs
Federal andState UTBs
(Dollars in thousands)Balance at January 1 $301,369 $323,654Increases in UTBs related to prior years 7,910 12,295Decreases in UTBs related to prior years - (24,622)Increases in UTBs related to the current year - 20,617Decreases in UTBs related to the current year (37) -Decreases in UTBs related to settlements (146,271) (17,258)Decreases in UTBs related to lapse of the applicable statutes of limitations (2,764) (2,752)Increases (decreases) in UTBs related to acquired entities in prior years, offset to goodwill 386 (10,565)
Balance at December 31 $160,593 $301,369
Note 16 - Employee Benefit Plans
SunTrust sponsors various short and LTI plans for eligible employees. The Company delivers LTIs through various incentiveprograms, including stock options, restricted stock, and a LTI cash plan. Prior to 2008, some LTIs were delivered through thePUP, a cash basis LTI plan with a three year time horizon. Effective January 1, 2008, the PUP was terminated, andoutstanding performance units under the PUP were replaced with a one-time grant of restricted stock. The LTI cash planbecame effective in 2008, and awards under the LTI cash plan cliff vest over a period of three years from the date of theaward and are paid in cash. The MIP is the Company’s short-term cash incentive plan for key employees that provides forpotential annual cash awards based on the attainment of the Company’s earnings and/or the achievement of business unit andindividual performance objectives. Compensation expense related to programs that have cash payouts for the years endedDecember 31, 2009, 2008 and 2007 totaled $28.3 million, $47.5 million and $48.5 million, respectively.
Stock Based Compensation
The Company provides stock-based awards through the SunTrust Banks Inc. 2009 Stock Plan under which the CompensationCommittee of the Board of Directors (the “Committee”) has the authority to grant stock options and restricted stock, ofwhich some may have performance features, to key employees of the Company. Under the 2009 Stock Plan, a total of9.3 million shares of common stock is authorized and reserved for issuance, of which no more than 4.8 million shares may beissued as restricted stock. Stock options are granted at a price which is no less than the fair market value of a share ofSunTrust common stock on the grant date and may be either tax-qualified incentive stock options or non-qualified stockoptions. Stock options typically vest after three years and generally have a maximum contractual life of ten years and uponoption exercise, shares are issued to employees from treasury stock.
Shares of restricted stock may be granted to employees and directors and typically cliff vest after three years. Restrictedstock grants may be subject to one or more criteria, including employment, performance or other conditions as established bythe Committee at the time of grant. Any shares of restricted stock that are forfeited will again become available for issuanceunder the Stock Plan. An employee or director has the right to vote the shares of restricted stock after grant unless and until
119

SUNTRUST BANKS, INC.Notes to Consolidated Financial Statements (Continued)
they are forfeited. Compensation cost for restricted stock is equal to the fair market value of the shares at the date of theaward and is amortized to compensation expense over the vesting period. Dividends are paid on awarded but unvestedrestricted stock.
The fair value of each stock option award is estimated on the date of grant using a Black-Scholes valuation model. Through2008, the expected volatility was based on the historical volatility of the Company’s stock. Beginning in 2009, SunTrustmoved to implied volatility. The expected term represents the period of time that stock options granted are expected to beoutstanding and is derived from historical data which is used to evaluate patterns such as stock option exercise and employeetermination. The expected dividend yield was based on recent dividend history through 2008; however, in 2009 the Companybegan using the current rate to calculate the yield. The risk-free interest rate is derived from the U.S. Treasury yield curve ineffect at the time of grant based on the expected life of the option.
The weighted average per share fair values of options granted during 2009, 2008, and 2007 were $5.13, $7.63 and $16.72,respectively. The fair value of each option grant is estimated on the date of grant using the Black-Scholes option pricingmodel with the following assumptions:
2009 2008 2007
Dividend yield 4.16% 5.62% 3.01%Expected stock price volatility 83.17 25.73 20.07Risk-free interest rate (weighted average) 1.94 2.63 4.70Expected life of options 6 years 6 years 6 years
The following table presents a summary of stock option and restricted stock activity:
Stock Options Restricted Stock
(Dollars in thousands except per share data) SharesPriceRange
WeightedAverage
Exercise Price SharesDeferred
Compensation
WeightedAverage
Grant Price
Balance, January 1, 2007 18,680,710 $14.56 - $83.74 $64.39 1,870,604 $60,487 $57.12Granted 717,494 77.75 - 85.06 85.04 1,054,837 88,892 84.27Exercised/vested (2,887,293) 14.56 - 78.39 60.50 (339,437) - 50.21Cancelled/expired/forfeited (452,765) 14.56 - 85.06 72.36 (315,660) (20,612) 65.30Amortization of restricted stock compensation - - - - (35,299) -Repurchase of AMA member interests - - - - (2,846) -
Balance, December 31, 2007 16,058,146 17.06 - 85.06 65.79 2,270,344 90,622 69.63
Granted 1,473,284 29.54 - 64.58 57.43 2,021,564 117,039 57.90Exercised/vested (514,149) 18.77 - 65.33 49.16 (213,431) - 55.16Cancelled/expired/forfeited (1,476,358) 31.80 - 154.61 69.30 (275,065) (17,611) 64.04Acquisition of GB&T 100,949 46.39 - 154.61 76.82 - - -Amortization of restricted stock compensation - - - - (76,656) -
Balance, December 31, 2008 15,641,872 17.06 - 150.45 65.29 3,803,412 113,394 64.61
Granted 3,803,796 9.06 9.06 2,565,648 28,205 10.40Exercised/vested - - - (1,255,092) - 64.79Cancelled/expired/forfeited (1,784,452) 9.06 - 149.81 65.39 (343,796) (16,018) 46.59Amortization of restricted stock compensation - - - - (66,420) -
Balance, December 31, 2009 17,661,216 $9.06 - $150.45 $53.17 4,770,172 $59,161 $37.02
Exercisable, December 31, 2009 12,108,820 $64.97
Available for Additional Grant, December 31, 2009 1 9,085,834
1 Includes 4,597,441 shares available to be issued as restricted stock.
120

SUNTRUST BANKS, INC.Notes to Consolidated Financial Statements (Continued)
The following table presents information on stock options by ranges of exercise price:
(Dollars in thousands, except per share data)Options Outstanding Options Exercisable
Range of ExercisePrices
NumberOutstanding atDecember 31,
2009
WeightedAverage
Exercise Price
WeightedAverage
RemainingContractual Life
(Years)
TotalAggregateIntrinsic
Value
NumberExercisable atDecember 31,
2009
WeightedAverageExercise
Price
WeightedAverage
RemainingContractualLife (Years)
TotalAggregateIntrinsic
Value
$9.06 to 49.46 4,510,659 $14.29 8.38 $41,788 489,563 $44.71 2.40 $-$49.47 to 64.57 4,991,845 56.44 2.29 - 4,991,845 56.44 2.29 -
$64.58 to 150.45 8,158,712 72.66 4.89 - 6,627,412 72.89 4.22 -
17,661,216 $53.17 5.05 $41,788 12,108,820 $64.97 3.35 $-
The aggregate intrinsic value in the table above represents the total pre-tax intrinsic value (the difference between theCompany’s closing stock price on the last trading day of 2009 and the exercise price, multiplied by the number of in-the-money stock options) that would have been received by the option holders had all option holders exercised their options onDecember 31, 2009. This amount changes based on the fair market value of the Company’s stock. Total intrinsic value ofoptions exercised for the twelve months ended December 31, 2009, 2008, and 2007 was $0, $4.5 million, and $68.2 million,respectively. Total fair value, measured as of the grant date, of restricted shares vested was $81.3 million, $11.8 million, and$17.0 million, for the twelve months ended December 31, 2009, 2008 and 2007, respectively.
As of December 31, 2009 and 2008, there was $77.8 million and $126.7 million unrecognized stock-based compensationexpense related to nonvested stock options and restricted stock. The unrecognized stock compensation expense as ofDecember 31, 2009 is expected to be recognized over a weighted average period of 1.68 years.
Stock-based compensation expense recognized in noninterest expense for the year ended December 31 was as follows:
(Dollars in thousands) 2009 2008 2007
Stock-based compensation expense:Stock options $11,439 $12,407 $16,908Restricted stock 66,420 76,656 35,299
Total stock-based compensation expense $77,859 $89,063 $52,207
The recognized tax benefit amounted to $29.6 million, $33.8 million and $19.8 million for the years ended December 31,2009, 2008 and 2007, respectively.
Retirement Plans
Defined Contribution Plan
SunTrust maintains a defined contribution plan that offers a dollar for dollar match on the first 5% of eligible pay that aparticipant, including executive participants, elects to defer to the 401(k) plan. Compensation expense related to this plan forthe years ended December 31, 2009, 2008 and 2007 totaled $76.4 million, $79.6 million and $69.6 million, respectively.
On December 31, 2007, SunTrust Banks, Inc. adopted written amendments to SunTrust Banks, Inc. 401(k) Excess Plan.Effective January 1, 2007, the Company matching contribution under the SunTrust Banks, Inc. 401(k) Excess Plan willprovide for a year-end true up to include deferrals to the deferred compensation plan that could have been deferred under the401(k) Excess Plan. Without further amendment, the matching contribution to the 401(k) Excess Plan increased, effectiveJanuary 1, 2008, in accordance with the terms of the plan to be the same percentage of match as provided in the qualified401(k) Plan, which is 100% of the first 5% of eligible pay that a participant, including an executive participant, elects todefer to the applicable plan, subject to such limitations as may be imposed by such plan provisions and applicable laws andregulations. Effective January 1, 2010, the 401(k) Excess Plan benefits were frozen. All future nonqualified plan deferralswill be made to the SunTrust Deferred Compensation Plan.
Noncontributory Pension Plans
SunTrust maintains a funded, noncontributory qualified retirement plan covering employees meeting certain servicerequirements. The plan provides benefits based on salary and years of service. Effective January 1, 2008, retirement planparticipants who were Company employees as of December 31, 2007 (“Affected Participants”) ceased to accrue additional
121
SUNTRUST BANKS, INC.Notes to Consolidated Financial Statements (Continued)
benefits under the existing pension benefit formula after that date and all their accrued benefits were frozen. BeginningJanuary 1, 2008, Affected Participants who have fewer than 20 years of service and future participants will accrue futurepension benefits under a cash balance formula that provides compensation and interest credits to a Personal Pension Account.Affected Participants with 20 or more years of service as of December 31, 2007 were given the opportunity to choosebetween continuing a traditional pension benefit accrual under a reduced formula or participating in the new PersonalPension Account. Effective January 1, 2008, the vesting schedule was changed from a 5-year cliff to a 3-year cliff forparticipants employed by the Company on and after that date. SunTrust monitors the funded status of the plan closely anddue to the current funded status, SunTrust did not make a contribution for the 2009 plan year.
On October 1, 2004, SunTrust acquired NCF. Prior to the acquisition, NCF sponsored a funded qualified retirement plan, anunfunded nonqualified retirement plan for some of its participants, and certain other postretirement health benefits for itsemployees. Effective December 31, 2004, participants no longer earned future service in the NCF Retirement Plan (qualifiedplan), and participants’ benefits were frozen with the exception of adjustments for pay increases after 2004. All former NCFemployees who met the service requirements began to earn benefits in the SunTrust Retirement Plan effective January 1, 2005.On February 13, 2007, the NCF Retirement Plan was amended to completely freeze benefits for those Affected Participants whodo not elect, or are not eligible to elect, the traditional pension benefit formula in the SunTrust Retirement Plan. The effectivedate for changes impacting the NCF Retirement Plan is January 1, 2008. Similar to the SunTrust Retirement Plan, due to thecurrent funded status of the NCF Retirement Plan, SunTrust did not make a contribution for the 2009 plan year.
SunTrust also maintains unfunded, noncontributory nonqualified supplemental defined benefit pension plans that cover keyexecutives of the Company. The plans provide defined benefits based on years of service and final average salary. SunTrust’sobligations for these nonqualified supplemental defined benefit pension plans are included within the qualified Pension Plansin the tables presented in this section under “Pension Benefits”.
On February 13, 2007, the SERP was amended to reduce the benefit formula for future service accruals. Current participantsin the SunTrust SERP will continue to earn future accruals under a reduced final average earnings formula. All futureparticipants and ERISA Excess Plan participants will accrue benefits under benefit formulas that mirror the revised benefitformulas in the SunTrust Retirement Plan. The effective date for changes impacting the SERP was January 1, 2008. AfterJanuary 1, 2008, a new SERP cash balance formula was implemented for existing and new participants with no limit on payfor SERP Tier 2 participants and a minimum preserved benefit for SERP participants at December 31, 2007. OnDecember 31, 2007, SunTrust Banks, Inc. also adopted an additional written amendment to the SunTrust Banks, Inc. ERISAExcess Plan. This amendment implemented changes to mirror the cash balance changes in the qualified Pension Plan, butwith an earnings limit of two times the qualified plan’s eligible earnings.
Other Postretirement Benefits
Although not under contractual obligation, SunTrust provides certain health care and life insurance benefits to retiredemployees (“Other Postretirement Benefits” in the tables). At the option of SunTrust, retirees may continue certain healthand life insurance benefits if they meet age and service requirements for Other Postretirement Benefits while working for theCompany. The health care plans are contributory with participant contributions adjusted annually, and the life insuranceplans are noncontributory. Employees who have retired or will retire after December 31, 2003 are not eligible for retiree lifeinsurance or subsidized post-65 medical benefits. Effective January 1, 2008, the pre-65 employer subsidy for medicalbenefits was discontinued for participants who will not be age 55 with at least 10 years of service before January 1, 2010.Certain retiree health benefits are funded in a Retiree Health Trust. In addition, certain retiree life insurance benefits arefunded in a VEBA. SunTrust reserves the right to amend or terminate any of the benefits at any time.
Assumptions
The SunTrust Benefits Plan Committee reviews and approves the assumptions for year-end measurement calculations. Adiscount rate is used to determine the present value of future benefit obligations. The discount rate for each plan isdetermined by matching the expected cash flows of each plan to a yield curve based on long-term, high quality fixed incomedebt instruments available as of the measurement date. A string of benefit payments projected to be paid by the plan for thenext 100 years is developed based on the most recent census data, plan provisions and assumptions. The benefit payments ateach future maturity are discounted by the year-appropriate spot interest rates. The model then solves for the discount ratethat produces the same present value of the projected benefit payments as generated by discounting each year’s payments bythe spot rate. This assumption is reviewed by the SunTrust Benefits Plan Committee and updated every year for each plan. Arate of compensation growth is used to determine future benefit obligations for those plans whose benefits vary by pay. Due
122

SUNTRUST BANKS, INC.Notes to Consolidated Financial Statements (Continued)
to current economic conditions and Company projections for wage growth, merit increases, and real inflation, compensationgrowth assumptions of 2.0% to 3.5% will be used for the next three years (2010 – 2012) with the ultimate assumptionreturning to 4% in 2013.
Actuarial gains and losses are created when actual experience deviates from assumptions. The actuarial losses on obligationsgenerated within the Pension Plans in 2009 resulted from lower lump sum rates and changes to actuarial demographicassumptions offset by higher discount rates and lower salary increases.
The change in benefit obligations for the years ended December 31 was as follows:
Pension BenefitsOther Postretirement
Benefits
(Dollars in thousands) 2009 2008 2009 2008
Benefit obligation, beginning of year $1,922,252 $1,841,153 $204,742 $200,723Service cost 63,858 77,872 292 618Interest cost 119,548 117,090 11,211 11,811Plan participants’ contributions - - 22,015 21,632Actuarial (gain)/loss 18,681 (7,646) (27,859) 1,360Benefits paid (116,399) (106,217) (33,792) (34,902)Less federal Medicare drug subsidy - - 2,518 3,500
Benefit obligation, end of year $2,007,940 $1,922,252 $179,127 $204,742
The accumulated benefit obligation for the Pension Benefits at December 31, 2009 and 2008 was $1.9 billion and $1.8billion, respectively.
Pension BenefitsOther Post-
retirement Benefits
(Weighted average assumptions used to determinebenefit obligations, end of year) 2009 2008 2009 2008
Discount rate 6.32 % 6.14 % 5.70 % 5.95 %Rate of compensation increase 4.00 2 4.00/4.50 1 N/A N/A
1At year-end 2008, all salaries were expected to increase by 2.00% for 2009 (0% for nonqualified plans), 3.00% for 2010, and total salaries were assumed to
increase at 4.50% while base salaries were assumed to increase at 4.00% for 2011 and beyond.2At year-end 2009, all salaries were expected to increase by 2.00% for 2010, 3.00% for 2011, 3.50% for 2012, and 4.00% for 2013 and beyond.
The change in plan assets for the years ended December 31 was as follows:
Pension BenefitsOther
Postretirement Benefits
(Dollars in thousands) 2009 2008 2009 2008
Fair value of plan assets, beginning of year $1,919,349 $2,287,322 $147,167 $162,881Actual return on plan assets 506,297 (617,770) 24,923 (32,965)Employer contributions 24,943 356,014 723 30,521Plan participants’ contributions - - 22,015 21,632Benefits paid (116,399) (106,217) (33,792) (34,902)
Fair value of plan assets, end of year $2,334,190 $1,919,349 $161,036 $147,167
Employer contributions and benefits paid in the above table include only those amounts contributed to pay participants’ planbenefits or added to plan assets in 2009 and 2008, respectively. SERPs are not funded through plan assets.
The basis for determining the overall expected long-term rate of return on plan assets considers past experience, currentmarket conditions and expectations on future trends. A building block approach is used that considers long-term inflation,real returns, equity risk premiums, target asset allocations, market corrections (for example, narrowing of fixed incomespreads between corporate bonds and U.S. Treasuries) and expenses. Capital market simulations from internal and externalsources, survey data, economic forecasts and actuarial judgment are all used in this process.
123

SUNTRUST BANKS, INC.Notes to Consolidated Financial Statements (Continued)
The expected long-term rate of return on plan assets was 8.00% and 8.25% in 2009 and 2008, respectively. The expectedlong-term rate of return is 8.00% for 2010. The asset allocation for the Pension Plans and the target allocation, by assetcategory, are as follows:
TargetAllocation1
Percentage of Plan Assetsat December 312
Asset Category 2010 2009 2008
Equity securities 55-75% 61% 62 %Debt securities 25-45 37 35Cash equivalents 0-5 2 3
Total 100% 100 %
1 SunTrust Pension Plan only.2 SunTrust and NCF Pension Plans.
The fair value of plan assets is measured based on the fair value hierarchy which is discussed in detail in Note 20, “FairValue Election and Measurement” to the Consolidated Financial Statements. The valuations are based on third party datareceived as of the balance sheet date. Level 1 assets such as equity securities, mutual funds, and REITS are instruments thatare traded in active markets and are valued based on identical instruments. Fixed income securities and common andcollective trust funds are classified as level 2 assets because there is not an identical asset in the market upon which to basethe valuation; however, there are no significant unobservable assumptions used to value level 2 instruments. Level 3 assetsprimarily consist of private placement and non-investment grade bonds. Limited visible market activity exists for theseinstruments or similar instruments and therefore significant unobservable assumptions are used to value the securities.
The following table sets forth by level, within the fair value hierarchy, plan assets related to Pension Benefits at fair value asof December 31, 2009:
Fair Value Measurements atDecember 31, 2009 Using 1
(Dollars in thousands)
Assets Measured atFair Value December 31,
2009
Quoted Prices InActive Markets for
Identical Assets(Level 1)
Significant OtherObservable Inputs
(Level 2)
SignificantUnobservable Inputs
(Level 3)
Money market funds $55,053 $55,053 $- $-Mutual funds:
Fixed income funds 96,617 96,617 - -International diversified funds 356,614 356,614 - -Large cap funds 263,052 263,052 - -Small and mid cap funds 214,082 214,082 - -
Equity securities:Consumer 100,505 100,505 - -Energy and utilities 40,103 40,103 - -Financials 43,904 43,904 - -Healthcare 65,182 65,182 - -Industrials 51,461 51,461 - -Information technology 157,471 157,471 - -Materials 19,909 19,909 - -Exchange traded funds 98,330 98,330 - -
Fixed income securities:Corporate - investment grade 554,307 - 471,645 82,662Corporate - non-investment grade 25,822 - - 25,822Foreign bonds 177,222 - 139,396 37,826Other 1,311 - 389 922
Real estate investment trusts 182 182 - -
$2,321,127 $1,562,465 $611,430 $147,232
1 Schedule does not include accrued income amounting to less than 0.6% of total plan assets.
124

SUNTRUST BANKS, INC.Notes to Consolidated Financial Statements (Continued)
The following table sets forth a summary of changes in the fair value of level 3 plan assets for the year ended December 31,2009:
(Dollars in thousands)
Fixed IncomeSecurities - Corporate
Investment Grade
Fixed IncomeSecurities - CorporateNon-investment Grade
Fixed IncomeSecurities - Foreign
Bonds Other
Balance as of January 1, 2009 $- $- $- $-Purchases/(sales) 69,486 20,385 21,015 (185)Realized gain/(loss) (29) - - -Unrealized gain/(loss) 7,280 4,253 2,898 -Transfers in level 3 5,925 1,184 13,913 1,107
Balance as of December 31, 2009 $82,662 $25,822 $37,826 $922
The following table sets forth by level, within the fair value hierarchy, plan assets related to Other Postretirement Benefits atfair value as of December 31, 2009:
Fair Value Measurements as of December 31, 2009 1
(Dollars in thousands)
Assets Measuredat Fair Value atDecember 31,
2009
Quoted Prices InActive Markets
for IdenticalAssets (Level 1)
Significant OtherObservable
Inputs (Level 2)
SignificantUnobservable
Inputs(Level 3)
Equity mutual fundsLarge cap fund $36,512 $36,512 $- $-Investment grade tax-exempt bond 25,217 25,217 - -International fund 7,633 7,633 - -
Common and collective funds 91,632 - 91,632 -
$160,994 $69,362 $91,632 $-
1Schedule does not include accrued income amounting to less than 0.1% of total plan assets.
The SunTrust Benefits Plan Committee, which includes several members of senior management, establishes investmentpolicies and strategies and formally monitors the performance of the funds on a quarterly basis. The Company’s investmentstrategy with respect to pension assets is to invest the assets in accordance with the Employee Retirement Income SecurityAct of 1974 and related fiduciary standards. The long-term primary investment objectives for the Pension Plans are toprovide for a reasonable amount of long-term growth of capital (both principal and income), without undue exposure to riskin any single asset class or investment category and to enable the plans to provide their specific benefits to participantsthereof. The objectives are accomplished utilizing a strategy of equities, fixed income and cash equivalents in a mix that isconducive to participation in a rising market while allowing for protection in a falling market. The portfolio is viewed aslong-term in its entirety, avoiding decisions based solely on short-term concerns and individual investments. The objective inthe allocation of assets is diversification of investments among asset classes that are not similarly affected by economic,political, or social developments. The diversification does not necessarily depend upon the number of industries orcompanies in a portfolio or their particular location, but rather upon the broad nature of such investments and of the factorsthat may influence them. To ensure broad diversification in the long-term investment portfolios among the major categoriesof investments, asset allocation, as a percent of the total market value of the total long-term portfolio, are set with the targetpercentages and ranges presented in the investment policy statement. Rebalancing occurs on a periodic basis to maintain thetarget allocation, but normal market activity may result in deviations. At December 31, 2009 and 2008, there was noSunTrust common stock held in the Pension Plans, nor were there any purchases during 2009 or 2008.
The investment strategy for the Other Postretirement Benefit Plans is maintained separately from the strategy for the PensionPlans. The Company’s investment strategy is to create a stream of investment returns sufficient to provide for current andfuture liabilities at a reasonable level of risk. Assets are diversified among equity and fixed income investments according tothe asset mix approved by the SunTrust Benefits Plan Committee which is presented in the target allocation table. Thepre-tax expected long-term rate of return on these plan assets was 7.25% in 2009 and 7.5% in 2008. The 2010 pre-taxexpected long-term rate of return is 7.00%. At December 31, 2009 and 2008, there was no common stock held in the OtherPostretirement Benefit Plans, nor were there any purchases during 2009 or 2008.
125

SUNTRUST BANKS, INC.Notes to Consolidated Financial Statements (Continued)
The asset allocation for Other Postretirement Benefit Plans and the target allocation, by asset category, are as follows:
TargetAllocation
Percentage of Plan Assets atDecember 31
Asset Category 2010 2009 2008
Equity securities 35-50% 48% 41%Debt securities 50-65 51 44Cash equivalents - 1 15
Total 100% 100%
Funded Status
The funded status of the plans, as of December 31, was as follows:
Pension BenefitsOther Postretirement
Benefits
(Dollars in thousands) 2009 2008 2009 2008
Fair value of plan assets $2,334,190 $1,919,349 $161,036 $147,167Benefit obligations (2,007,940) (1,922,252) (179,127) (204,742)
Funded status $326,250 ($2,903) ($18,091) ($57,575)
At December 31, 2009, the total outstanding unrecognized net loss to be recognized in future years for all pension andpostretirement benefits was $0.7 billion, compared to $1.3 billion as of December 31, 2008. The key sources of thecumulative net losses are attributable to lower discount rates for the past several years and lower return on assets in 2008. Asdiscussed previously, SunTrust reviews its assumptions annually to ensure they represent the best estimates for the future andwill, therefore, minimize future gains and losses.
As of December 31, amounts recognized in AOCI are as follows:
Pension BenefitsOther Postretirement
Benefits
(Dollars in thousands) 2009 2008 2009 2008
Net actuarial loss $715,050 $1,170,780 $34,137 $97,526Prior service credit (56,598) (67,483) (380) (1,938)
Total accumulated other comprehensive income, pre-tax $658,452 $1,103,297 $33,757 $95,588
Pension benefits with a projected benefit obligation, in excess of plan assets at December 31 were as follows:
(Dollars in thousands) 2009 2008
Projected benefit obligation $95,549 $109,751Accumulated benefit obligation 91,442 104,594
126

SUNTRUST BANKS, INC.Notes to Consolidated Financial Statements (Continued)
Expected Cash Flows
Information about the expected cash flows for the Pension Benefit and Other Postretirement Benefit plans is as follows:
(Dollars in thousands)Pension
Benefits1,2
Other PostretirementBenefits (excludingMedicare Subsidy)3
Value to Companyof Expected
Medicare Subsidy
Employer Contributions2010 (expected) to plan trusts $- $- ($2,400)2010 (expected) to plan participants 11,909 - -Expected Benefit Payments2010 106,371 16,552 (2,400)2011 120,571 16,722 (758)2012 123,871 16,532 (756)2013 133,331 16,185 (752)2014 142,463 15,849 (742)2015-2019 834,688 69,245 (3,451)
1At this time, SunTrust anticipates contributions to the Retirement Plan will be permitted (but not required) during 2010 based on the funded status of thePlan and contribution limitations under the Employee Retirement Income Security Act of 1974 (ERISA).2The expected benefit payments for the Supplemental Executive Retirement Plan will be paid directly from SunTrust corporate assets.3The 2010 expected contribution for the Other Postretirement Benefits Plans represents the Medicare Part D subsidy only. Note that expected benefits underOther Postretirement Benefits Plans are shown net of participant contributions.
Net Periodic Cost
Components of net periodic benefit cost for the years ended December 31 were as follows:
Pension Benefits Other Postretirement Benefits
(Dollars in thousands) 2009 2008 2007 2009 2008 2007
Service cost $63,858 $77,872 $68,322 $292 $618 $1,241Interest cost 119,548 117,090 111,920 11,211 11,811 11,337Expected return on plan assets (149,151) (185,653) (186,356) (7,033) (8,186) (8,194)Amortization of prior service cost (10,886) (11,166) (10,159) (1,558) (1,558) (1,370)Recognized net actuarial loss 112,095 22,223 34,849 18,593 12,750 14,286Amortization of initial transition obligation - - - - - 280Other 5,170 3,465 1,811 - - 11,586
Net periodic benefit cost $140,634 $23,831 $20,387 $21,505 $15,435 $29,166
Weighted average assumptions used to determine net costDiscount rate1 6.58 %2 6.28 %1 5.93 %2 5.95 % 5.95 % 5.75 %Expected return on plan assets 8.00 8.25 8.50 5.30 3 5.30 3 5.30 3
Rate of compensation increase 4.00/4.50 4.00/4.50 4.50 N/A N/A N/A
1 The weighted average shown for 2008 is the weighted average discount rates for the Pension Benefits as of the beginning of the fiscal year.2 Interim remeasurement was required on February 13, 2007 for all plans and again on April 30, 2009 for the SunTrust Pension Plan due to plan changes adopted at that time. The discount rateas of the remeasurement date was selected based on the economic environment on those dates.3 The weighted average shown for the Other Postretirement Benefit plan is determined on an after-tax basis.
Other changes in plan assets and benefit obligations recognized in OCI during 2009 are as follows:
(Dollars in thousands)PensionBenefits
OtherPostretirement
Benefits
Settlements ($5,170) $0Current year actuarial gain (338,466) (44,796)Amortization of actuarial loss (112,095) (18,593)Amortization of prior service credit 10,886 1,558
Total recognized in other comprehensive income, pre-tax ($444,845) ($61,831)
Total recognized in net periodic benefit cost and othercomprehensive income, pre-tax ($304,210) ($40,326)
127
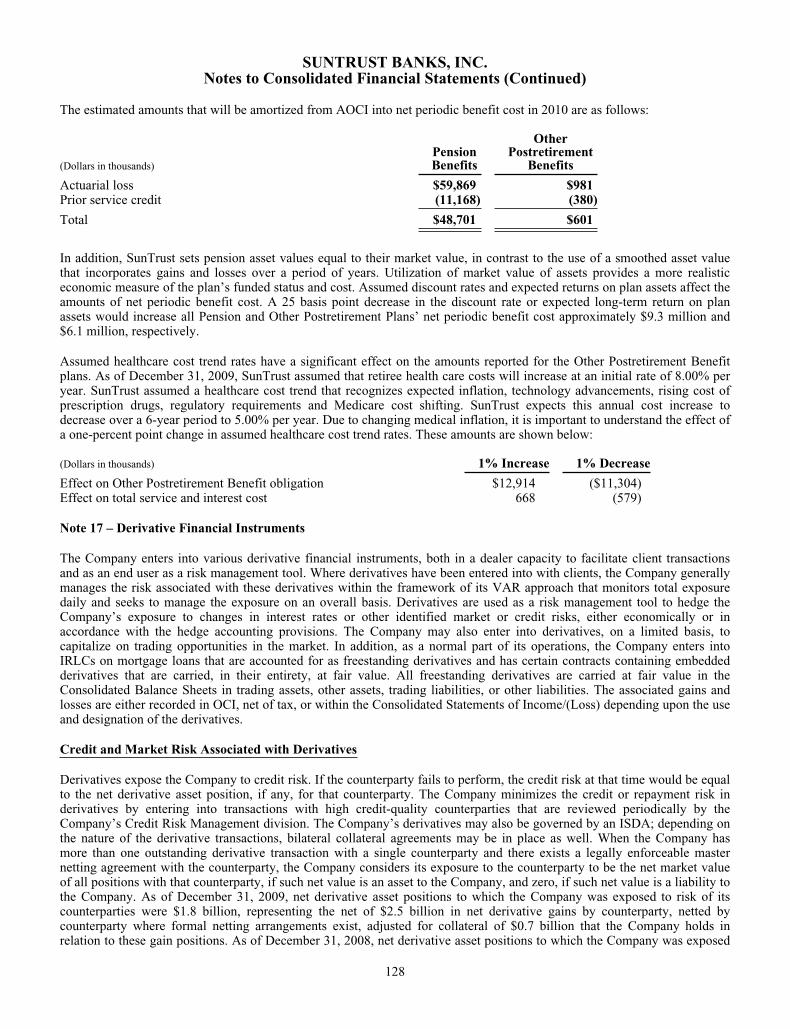
SUNTRUST BANKS, INC.Notes to Consolidated Financial Statements (Continued)
The estimated amounts that will be amortized from AOCI into net periodic benefit cost in 2010 are as follows:
(Dollars in thousands)PensionBenefits
OtherPostretirement
Benefits
Actuarial loss $59,869 $981Prior service credit (11,168) (380)
Total $48,701 $601
In addition, SunTrust sets pension asset values equal to their market value, in contrast to the use of a smoothed asset valuethat incorporates gains and losses over a period of years. Utilization of market value of assets provides a more realisticeconomic measure of the plan’s funded status and cost. Assumed discount rates and expected returns on plan assets affect theamounts of net periodic benefit cost. A 25 basis point decrease in the discount rate or expected long-term return on planassets would increase all Pension and Other Postretirement Plans’ net periodic benefit cost approximately $9.3 million and$6.1 million, respectively.
Assumed healthcare cost trend rates have a significant effect on the amounts reported for the Other Postretirement Benefitplans. As of December 31, 2009, SunTrust assumed that retiree health care costs will increase at an initial rate of 8.00% peryear. SunTrust assumed a healthcare cost trend that recognizes expected inflation, technology advancements, rising cost ofprescription drugs, regulatory requirements and Medicare cost shifting. SunTrust expects this annual cost increase todecrease over a 6-year period to 5.00% per year. Due to changing medical inflation, it is important to understand the effect ofa one-percent point change in assumed healthcare cost trend rates. These amounts are shown below:
(Dollars in thousands) 1% Increase 1% Decrease
Effect on Other Postretirement Benefit obligation $12,914 ($11,304)Effect on total service and interest cost 668 (579)
Note 17 – Derivative Financial Instruments
The Company enters into various derivative financial instruments, both in a dealer capacity to facilitate client transactionsand as an end user as a risk management tool. Where derivatives have been entered into with clients, the Company generallymanages the risk associated with these derivatives within the framework of its VAR approach that monitors total exposuredaily and seeks to manage the exposure on an overall basis. Derivatives are used as a risk management tool to hedge theCompany’s exposure to changes in interest rates or other identified market or credit risks, either economically or inaccordance with the hedge accounting provisions. The Company may also enter into derivatives, on a limited basis, tocapitalize on trading opportunities in the market. In addition, as a normal part of its operations, the Company enters intoIRLCs on mortgage loans that are accounted for as freestanding derivatives and has certain contracts containing embeddedderivatives that are carried, in their entirety, at fair value. All freestanding derivatives are carried at fair value in theConsolidated Balance Sheets in trading assets, other assets, trading liabilities, or other liabilities. The associated gains andlosses are either recorded in OCI, net of tax, or within the Consolidated Statements of Income/(Loss) depending upon the useand designation of the derivatives.
Credit and Market Risk Associated with Derivatives
Derivatives expose the Company to credit risk. If the counterparty fails to perform, the credit risk at that time would be equalto the net derivative asset position, if any, for that counterparty. The Company minimizes the credit or repayment risk inderivatives by entering into transactions with high credit-quality counterparties that are reviewed periodically by theCompany’s Credit Risk Management division. The Company’s derivatives may also be governed by an ISDA; depending onthe nature of the derivative transactions, bilateral collateral agreements may be in place as well. When the Company hasmore than one outstanding derivative transaction with a single counterparty and there exists a legally enforceable masternetting agreement with the counterparty, the Company considers its exposure to the counterparty to be the net market valueof all positions with that counterparty, if such net value is an asset to the Company, and zero, if such net value is a liability tothe Company. As of December 31, 2009, net derivative asset positions to which the Company was exposed to risk of itscounterparties were $1.8 billion, representing the net of $2.5 billion in net derivative gains by counterparty, netted bycounterparty where formal netting arrangements exist, adjusted for collateral of $0.7 billion that the Company holds inrelation to these gain positions. As of December 31, 2008, net derivative asset positions to which the Company was exposed
128

SUNTRUST BANKS, INC.Notes to Consolidated Financial Statements (Continued)
to risk of its counterparties were $3.5 billion, representing the net of $4.6 billion in derivative gains by counterparty, nettedby counterparty where formal netting arrangements exist, adjusted for collateral of $1.1 billion that the Company holds inrelation to these gain positions.
Derivative instruments are primarily transacted in the institutional dealer market and priced with observable marketassumptions at a mid-market valuation point, with appropriate valuation adjustments for liquidity and credit risk. Forpurposes of valuation adjustments to its derivative positions, the Company has evaluated liquidity premiums that may bedemanded by market participants, as well as the credit risk of its counterparties and its own credit. The Company hasconsidered factors such as the likelihood of default by itself and its counterparties, its net exposures, and remainingmaturities in determining the appropriate fair value adjustments to record. Generally, the expected loss of each counterpartyis estimated using the Company’s proprietary internal risk rating system. The risk rating system utilizes counterparty-specificprobabilities of default and loss given default estimates to derive the expected loss. For counterparties that are rated bynational rating agencies, those ratings are also considered in estimating the credit risk. In addition, counterparty exposure isevaluated by netting positions that are subject to master netting arrangements, as well as considering the amount ofmarketable collateral securing the position. Specifically approved counterparties and exposure limits are defined. Theapproved counterparties are regularly reviewed and appropriate business action is taken to adjust the exposure to certaincounterparties, as necessary. This approach used to estimate exposures to counterparties is also used by the Company toestimate its own credit risk on derivative liability positions. To date, no material losses due to a counterparty’s inability topay any net uncollateralized position has been incurred. The Company adjusted the net fair value of its derivative contractsfor estimates of net counterparty credit risk by approximately $24.9 million and $23.1 million as of December 31, 2009 andDecember 31, 2008, respectively.
The majority of the Company’s derivatives contain contingencies that relate to the creditworthiness of the Bank. These arecontained in industry standard master trading agreements as events of default. Should the Bank be in default under any ofthese provisions, the Bank’s counterparties would be permitted under such master agreements to close-out net at amountsthat would approximate the then-fair values of the derivatives and the netting of the amounts would produce a single sum dueby one party to the other. The counterparties would have the right to apply any collateral posted by the Bank against any netamount owed by the Bank. In addition, of the Company’s total derivative liability positions, approximately $1.3 billion infair value, contain provisions conditioned on downgrades of the Bank’s credit rating. These provisions, if triggered, wouldeither give rise to an ATE that permits the counterparties to close-out net and apply collateral or, where a CSA is present,require the Bank to post additional collateral. Collateral posting requirements generally result from differences in the fairvalue of the net derivative liability compared to specified collateral thresholds at different ratings levels of the Bank, both ofwhich are negotiated provisions within each CSA. At December 31, 2009, the Bank carried senior long-term debt ratings ofA-/A2 from two of the major ratings agencies. For illustrative purposes, if the Bank were downgraded to BBB-/Baa3, ATEswould be triggered in derivative liability contracts that had a fair value of approximately $25.5 million at December 31,2009, against which the Bank had posted collateral of approximately $10.4 million; ATEs do not exist at lower ratings levels.At December 31, 2009, approximately $1.3 billion in fair value of derivative liabilities are subject to CSAs, against which theBank has posted approximately $1.1 billion in collateral. If requested by the counterparty per the terms of the CSA, the Bankwould be required to post estimated additional collateral against these contracts of approximately $658.9 million if the Bankwere downgraded to BBB-/Baa3, and any further downgrades to BB+/Ba1 or below would require the posting of anadditional $20.0 million. Such collateral posting amounts may be more or less than the Bank’s estimates based on thespecified terms of each CSA as to the timing of a collateral calculation and whether the Bank and its counterparties differ ontheir estimates of the fair values of the derivatives or collateral.
Derivatives also expose the Company to market risk. Market risk is the adverse effect that a change in market factors, such asinterest rates, currency rates, equity prices, or implied volatility, has on the value of a derivative. The Company manages themarket risk associated with its derivatives by establishing and monitoring limits on the types and degree of risk that may beundertaken. The Company continually measures this risk by using a VAR methodology.
129

SUNTRUST BANKS, INC.Notes to Consolidated Financial Statements (Continued)
The table below presents the Company’s derivative positions at December 31, 2009. The notional amounts in the table arepresented on a gross basis and have been classified within Asset Derivatives or Liability Derivatives based on the estimatedfair value of the individual contract at December 31, 2009. On the Consolidated Balance Sheets, the fair values of derivativeswith counterparties with master netting agreements are recorded on a net basis. However, for purposes of the table below, thegross positive and gross negative fair value amounts associated with the respective notional amounts are presented withoutconsideration of any netting agreements. For contracts constituting a combination of options that contain a writtencomponent and a purchased component (such as a collar), the notional amount of each component is presented separately,with the purchased component being presented as an Asset Derivative and the written component being presented as aLiability Derivative. The fair value of each combination of options is presented with the purchased component, if thecombined fair value of the components is positive, and with the written component, if negative.
Asset Derivatives Liability Derivatives
(Dollars in thousands)Balance SheetClassification
NotionalAmounts Fair Value
Balance SheetClassification
NotionalAmounts Fair Value
Derivatives designated in cash flow hedging relationships 5
Equity contracts hedging:Securities available for sale Trading assets $1,546,752 $- Trading liabilities $1,546,752 $45,866
Interest rate contracts hedging:Floating rate loans Trading assets 15,550,000 865,391 Trading liabilities 3,000,000 22,202
Total 17,096,752 865,391 4,546,752 68,068
Derivatives not designated as hedging instruments 6
Interest rate contracts covering:Fixed rate debt Trading assets 3,223,085 200,183 Trading liabilities 295,000 10,335Corporate bonds and loans - - Trading liabilities 47,568 4,002MSRs Other assets 3,715,000 61,719 Other liabilities 3,810,000 57,048LHFS, IRLCs, LHFI-FV Other assets 7,461,935 3 75,071 Other liabilities 1,425,858 20,056Trading activity Trading assets 94,139,597 1 3,289,667 Trading liabilities 83,483,088 3,242,861
Foreign exchange rate contracts covering:Foreign-denominated debt and commercial loans Trading assets 1,164,169 96,143 Trading liabilities 656,498 144,203Trading activity Trading assets 2,059,097 107,065 Trading liabilities 2,020,240 96,266
Credit contracts covering:Loans Trading assets 115,000 771 Trading liabilities 240,750 4,051Trading activity Trading assets 170,044 2 6,344 Trading liabilities 156,139 2 3,837
Equity contracts - Trading activity Trading assets 3,344,875 1 446,355 Trading liabilities 6,907,657 672,221Other contracts:
IRLCs and other Other assets 1,870,040 13,482 Other liabilities 1,560,337 4 48,134 4
Trading activity Trading assets 39,117 7,095 Trading liabilities 51,546 6,929
Total 117,301,959 4,303,895 100,654,681 4,309,943
Total derivatives $134,398,711 $5,169,286 $105,201,433 $4,378,011
1 Amounts include $18.2 billion and $0.5 billion of notional related to interest rate futures and equity futures, respectively. These futures contracts settle in cash daily and therefore no derivativeasset or liability is recorded.2 Asset and liability amounts include $3.6 million and $8.7 million, respectively, of notional from purchased and written interest rate swap risk participation agreements, respectively, whichnotional is calculated as the notional of the interest rate swap participated adjusted by the relevant risk weighted assets conversion factor.3 Amount includes $2.0 billion of notional amounts related to interest rate futures. These futures contracts settle in cash daily and therefore no derivative asset or liability is recorded.4 Includes a $40.4 million derivative liability recorded in other liabilities in the Consolidated Balance Sheets, related to a notional amount of $134.3 million. This derivative was establishedupon the sale of Visa Class B shares in the second quarter of 2009 as discussed in Note 18, “Reinsurance Arrangements and Guarantees,” to the Consolidated Financial Statements.5 See “Cash Flow Hedges” in this Note for further discussion.6 See “Economic Hedging and Trading Activities” in this Note for further discussion.
130
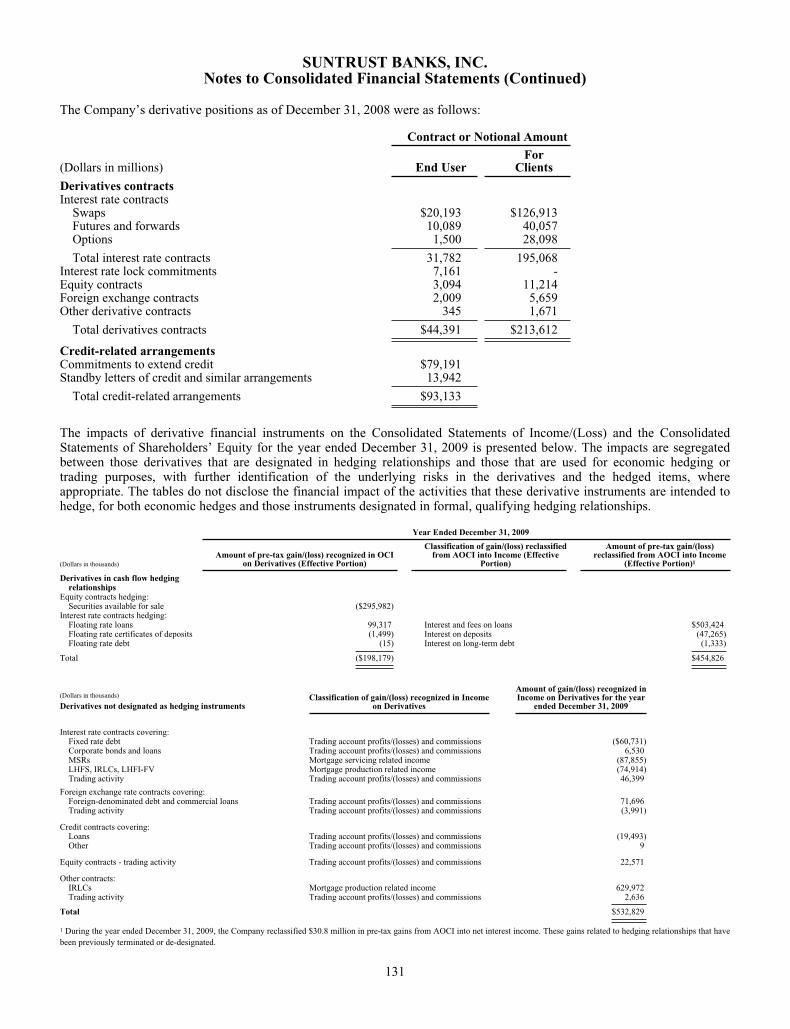
SUNTRUST BANKS, INC.Notes to Consolidated Financial Statements (Continued)
The Company’s derivative positions as of December 31, 2008 were as follows:
Contract or Notional Amount
(Dollars in millions) End UserFor
Clients
Derivatives contractsInterest rate contracts
Swaps $20,193 $126,913Futures and forwards 10,089 40,057Options 1,500 28,098
Total interest rate contracts 31,782 195,068Interest rate lock commitments 7,161 -Equity contracts 3,094 11,214Foreign exchange contracts 2,009 5,659Other derivative contracts 345 1,671
Total derivatives contracts $44,391 $213,612
Credit-related arrangementsCommitments to extend credit $79,191Standby letters of credit and similar arrangements 13,942
Total credit-related arrangements $93,133
The impacts of derivative financial instruments on the Consolidated Statements of Income/(Loss) and the ConsolidatedStatements of Shareholders’ Equity for the year ended December 31, 2009 is presented below. The impacts are segregatedbetween those derivatives that are designated in hedging relationships and those that are used for economic hedging ortrading purposes, with further identification of the underlying risks in the derivatives and the hedged items, whereappropriate. The tables do not disclose the financial impact of the activities that these derivative instruments are intended tohedge, for both economic hedges and those instruments designated in formal, qualifying hedging relationships.
Year Ended December 31, 2009
(Dollars in thousands)Amount of pre-tax gain/(loss) recognized in OCI
on Derivatives (Effective Portion)
Classification of gain/(loss) reclassifiedfrom AOCI into Income (Effective
Portion)
Amount of pre-tax gain/(loss)reclassified from AOCI into Income
(Effective Portion)1
Derivatives in cash flow hedgingrelationships
Equity contracts hedging:Securities available for sale ($295,982)
Interest rate contracts hedging:Floating rate loans 99,317 Interest and fees on loans $503,424Floating rate certificates of deposits (1,499) Interest on deposits (47,265)Floating rate debt (15) Interest on long-term debt (1,333)
Total ($198,179) $454,826
(Dollars in thousands)
Derivatives not designated as hedging instrumentsClassification of gain/(loss) recognized in Income
on Derivatives
Amount of gain/(loss) recognized inIncome on Derivatives for the year
ended December 31, 2009
Interest rate contracts covering:Fixed rate debt Trading account profits/(losses) and commissions ($60,731)Corporate bonds and loans Trading account profits/(losses) and commissions 6,530MSRs Mortgage servicing related income (87,855)LHFS, IRLCs, LHFI-FV Mortgage production related income (74,914)Trading activity Trading account profits/(losses) and commissions 46,399
Foreign exchange rate contracts covering:Foreign-denominated debt and commercial loans Trading account profits/(losses) and commissions 71,696Trading activity Trading account profits/(losses) and commissions (3,991)
Credit contracts covering:Loans Trading account profits/(losses) and commissions (19,493)Other Trading account profits/(losses) and commissions 9
Equity contracts - trading activity Trading account profits/(losses) and commissions 22,571
Other contracts:IRLCs Mortgage production related income 629,972Trading activity Trading account profits/(losses) and commissions 2,636
Total $532,829
1 During the year ended December 31, 2009, the Company reclassified $30.8 million in pre-tax gains from AOCI into net interest income. These gains related to hedging relationships that havebeen previously terminated or de-designated.
131

SUNTRUST BANKS, INC.Notes to Consolidated Financial Statements (Continued)
Credit Derivatives
As part of its trading businesses, the Company enters into contracts that are, in form or substance, written guarantees:specifically, CDS, swap participations, and TRS. The Company accounts for these contracts as derivative instrumentsand, accordingly, records these contracts at fair value, with changes in fair value recorded in trading account profits andcommissions.
The Company writes CDS, which are agreements under which the Company receives premium payments from itscounterparty for protection against an event of default of a reference asset. In the event of default under the CDS, theCompany would either net cash settle or make a cash payment to its counterparty and take delivery of the defaultedreference asset, from which the Company may recover all, a portion, or none of the credit loss, depending on theperformance of the reference asset. Events of default, as defined in the CDS agreements, are generally triggered uponthe failure to pay and similar events related to the issuer(s) of the reference asset. As of December 31, 2009, all writtenCDS contracts reference single name corporate credits or corporate credit indices. When the Company has written CDS,it has generally entered into offsetting CDS for the underlying reference asset, under which the Company paid apremium to its counterparty for protection against an event of default on the reference asset. The counterparties to thesepurchased CDS are of high creditworthiness and have ISDA agreements in place that subject the CDS to master nettingprovisions, thereby mitigating the risk of non-payment to the Company. As such, at December 31, 2009, the Companydoes not have any significant risk of making a non-recoverable payment on any written CDS. During 2009 and 2008,the only instances of default on written CDS were driven by credit indices with constituent credit default. In all caseswhere the Company made resulting cash payments to settle, the Company collected like amounts from thecounterparties to the offsetting purchased CDS. At December 31, 2009, the written CDS had remaining terms ofapproximately three months to five years. The maximum guarantees outstanding at December 31, 2009 andDecember 31, 2008, as measured by the gross notional amounts of written CDS, were $129.5 million and $190.8million, respectively. At December 31, 2009 and December 31, 2008, the gross notional amounts of purchased CDScontracts, which represent benefits to, rather than obligations of, the Company, were $184.5 million and $245.2 million,respectively. The fair values of the written CDS were $1.8 million and $34.7 million at December 31, 2009 andDecember 31, 2008, respectively, and the fair values of the purchased CDS were $4.3 million and $45.8 million atDecember 31, 2009, and December 31, 2008, respectively.
The Company writes swap participations, which are credit derivatives whereby the Company has guaranteed payment toa dealer counterparty in the event that the counterparty experiences a loss on a derivative instrument, such as an interestrate swap, due to a failure to pay by the counterparty’s customer (the “obligor”) on that derivative instrument. TheCompany monitors its payment risk on its swap participations by monitoring the creditworthiness of the obligors, whichis based on the normal credit review process the Company would have performed had it entered into the derivativeinstruments directly with the obligors. The obligors are all corporations or partnerships. However, the Companycontinues to monitor the creditworthiness of its obligors and the likelihood of payment could change at any time due tounforeseen circumstances. To date, no material losses have been incurred related to the Company’s written swapparticipations. At December 31, 2009, the remaining terms on these swap participations generally ranged from onemonth to nine years, with a weighted average on the maximum estimated exposure of 3.2 years. The Company’smaximum estimated exposure to written swap participations, as measured by projecting a maximum value of theguaranteed derivative instruments based on interest rate curve simulations and assuming 100% default by all obligors onthe maximum values, was approximately $83.3 million and $125.7 million at December 31, 2009 and December 31,2008, respectively. The fair values of the written swap participations were de minimis at December 31, 2009 andDecember 31, 2008. As part of its trading activities, the Company may enter into purchased swap participations, butsuch activity is not matched, as discussed herein related to CDS or TRS.
The Company has also entered into TRS contracts on loans. The Company’s TRS business consists of matched trades,such that when the Company pays depreciation on one TRS, it receives the same depreciation on the matched TRS. Assuch, the Company does not have any long or short exposure, other than credit risk of its counterparty, which ismanaged through collateralization. The Company typically receives initial cash collateral from the counterparty uponentering into the TRS and is entitled to additional collateral as the fair value of the underlying reference assetsdeteriorate. At December 31, 2008, there was $602.1 million of outstanding and offsetting TRS notional balances. Thefair values of the TRS derivative assets and liabilities were $171.0 million and $166.6 million at December 31, 2008,respectively, and related collateral held at December 31, 2008 was $296.8 million. As of December 31, 2008, theCompany had decided to temporarily suspend its TRS business and the Company has unwound its positions as ofDecember 31, 2009. The Company did not incur any losses on these unwinds.
132

SUNTRUST BANKS, INC.Notes to Consolidated Financial Statements (Continued)
Cash Flow Hedges
The Company utilizes a comprehensive risk management strategy to monitor sensitivity of earnings to movements ininterest rates. Specific types of funding and principal amounts hedged are determined based on prevailing marketconditions and the shape of the yield curve. In conjunction with this strategy, the Company employs various interest ratederivatives as risk management tools to hedge interest rate risk from recognized assets and liabilities or from forecastedtransactions. The terms and notional amounts of derivatives are determined based on management’s assessment offuture interest rates, as well as other factors. The Company establishes parameters for derivative usage, includingidentification of assets and liabilities to hedge, derivative instruments to be utilized, and notional amounts of hedgingrelationships. At December 31, 2009, the Company’s only outstanding interest rate hedging relationships relate tointerest rate swaps that have been designated as cash flow hedges of probable forecasted transactions related torecognized floating rate loans.
Interest rate swaps have been designated as hedging the exposure to the benchmark interest rate risk associated withfloating rate loans. The maximum range of hedge maturities for hedges of floating rate loans is approximately one tofive years, with the weighted average being approximately 3.3 years. Ineffectiveness on these hedges was de minimisduring the year ended December 31, 2009. As of December 31, 2009, $346.7 million, net of tax, of the deferred netgains on derivatives that are recorded in AOCI are expected to be reclassified to net interest income over the next twelvemonths in connection with the recognition of interest income on these hedged items.
During the third quarter of 2008, the Company executed The Agreements on 30 million common shares of Coke. Aconsolidated subsidiary of SunTrust owns approximately 22.9 million Coke common shares and a consolidatedsubsidiary of SunTrust Bank owns approximately 7.1 million Coke common shares. These two subsidiaries entered intoseparate Agreements on their respective holdings of Coke common shares with a large, unaffiliated financial institution(the “Counterparty”). Execution of The Agreements (including the pledges of the Coke common shares pursuant to theterms of The Agreements) did not constitute a sale of the Coke common shares under U.S. GAAP for several reasons,including that ownership of the common shares was not legally transferred to the Counterparty. The Agreementsresulted in zero cost equity collars which are derivatives in their entirety. The Company has designated The Agreementsas cash flow hedges of the Company’s probable forecasted sales of its Coke common shares, which are expected tooccur in approximately six and a half and seven years from The Agreements’ effective date, for overall price volatilitybelow the strike prices on the floor (purchased put) and above the strike prices on the ceiling (written call). Although theCompany is not required to deliver its Coke common shares under The Agreements, the Company has asserted that it isprobable that it will sell all of its Coke common shares at or around the settlement date of The Agreements. The FederalReserve’s approval for Tier 1 capital was significantly based on this expected disposition of the Coke common sharesunder The Agreements or in another market transaction. Both the sale and the timing of such sale remain probable tooccur as designated. At least quarterly, the Company assesses hedge effectiveness and measures hedge ineffectivenesswith the effective portion of the changes in fair value of The Agreements recorded in AOCI and any ineffective portionsrecorded in trading account profits and commissions. None of the components of The Agreements’ fair values areexcluded from the Company’s assessments of hedge effectiveness. Potential sources of ineffectiveness include changesin market dividends and certain early termination provisions. The Company did not recognize any ineffectivenessduring 2008, but did recognize approximately $0.6 million of ineffectiveness during the year ended December 31, 2009,which was recorded in trading account profits and commissions. Other than potential measured hedge ineffectiveness,no amounts will be reclassified from AOCI over the next twelve months and any remaining amounts recorded in AOCIwill be reclassified to earnings when the probable forecasted sales of the Coke common shares occur.
Economic Hedging and Trading Activities
In addition to designated hedging relationships, the Company also enters into derivatives as an end user as a riskmanagement tool to economically hedge risks associated with certain non-derivative and derivative instruments, alongwith entering into derivatives in a trading capacity with its clients.
The primary risks that the Company economically hedges are interest rate risk, foreign exchange risk, and credit risk.The economic hedging activities are accomplished by entering into individual derivatives or by using derivatives on amacro basis, and generally accomplish the Company’s goal of mitigating the targeted risk. To the extent that specificderivatives are associated with specific hedged items, the notional amounts, fair values, and gains/(losses) on thederivatives are illustrated in the tables above.
133

SUNTRUST BANKS, INC.Notes to Consolidated Financial Statements (Continued)
• The Company utilizes interest rate derivatives to mitigate exposures from various instruments.
O The Company is subject to interest rate risk on its fixed rate debt. As market interest rates move, aportion of the fair value of the Company’s debt is affected. To protect against this risk on certaindebt issuances that the Company has elected to carry at fair value, the Company has entered into payvariable-receive fixed interest rate swaps (in addition to entering into certain non-derivativeinstruments on a macro basis) that decrease in value in a rising rate environment and increase invalue in a declining rate environment.
O The Company is exposed to interest rate risk associated with MSRs, which the Company hedgeswith a combination of derivatives, including MBS forward and option contracts, and interest rateswap and swaption contracts.
O The Company enters into MBS forward and option contracts, interest rate swap and swaptioncontracts, futures contracts, and eurodollar options to mitigate interest rate risk associated withIRLCs, mortgage LHFS, and mortgage loans held for investment reported at fair value.
• The Company is exposed to foreign exchange rate risk associated with certain senior notes denominated in eurosand pound sterling. This risk is economically hedged by entering into cross currency swaps, which receive eithereuros or pound sterling and pay U.S. dollars. Interest expense on the Consolidated Statements of Income/(Loss)reflects only the contractual interest rate on the debt based on the average spot exchange rate during the applicableperiod, while fair value changes on the derivatives and valuation adjustments on the debt are both recorded withintrading account profits and commissions.
• The Company enters into CDS to hedge credit risk associated with certain loans held within its Corporate andInvestment Banking and Wealth and Investment Management lines of business. Trading activity, in the tablesabove, primarily includes interest rate swaps, equity derivatives, CDS, futures, options and foreign currencycontracts. These derivatives are entered into in a dealer capacity to facilitate client transactions or are utilized as arisk management tool by the Company as an end user in certain macro-hedging strategies. The macro-hedgingstrategies are focused on managing the Company’s overall interest rate risk exposure that is not otherwise hedgedby derivatives or in connection with specific hedges and, therefore, the Company does not specifically associateindividual derivatives with specific assets or liabilities.
Note 18 – Reinsurance Arrangements and Guarantees
Reinsurance
The Company provides mortgage reinsurance on certain mortgage loans through contracts with several primary mortgageinsurance companies. Under these contracts, the Company provides aggregate excess loss coverage in a mezzanine layer inexchange for a portion of the pool’s mortgage insurance premium. As of December 31, 2009, approximately $15.1 billion ofmortgage loans were covered by such mortgage reinsurance contracts. The reinsurance contracts are intended to place limitson the Company’s maximum exposure to losses by defining the loss amounts ceded to the Company as well as byestablishing trust accounts for each contract. The trust accounts, which are comprised of funds contributed by the Companyplus premiums earned under the reinsurance contracts, are maintained to fund claims made under the reinsurance contracts. Ifclaims exceed funds held in the trust accounts, the Company does not intend to make additional contributions beyond futurepremiums earned under the existing contracts.
At December 31, 2009, the total loss exposure ceded to the Company was approximately $645.0 million; however, themaximum amount of loss exposure based on funds held in each separate trust account, including net premiums due to thetrust accounts, was limited to $289.0 million. Of this amount, $285.0 million of losses have been reserved for as ofDecember 31, 2009, reducing the Company’s net remaining loss exposure to $4.0 million. Future reported losses may exceed$4.0 million since future premium income will increase the amount of funds held in the trust; however future cash losses, netof premium income, are not expected to exceed $4.0 million. The amount of future premium income is limited to thepopulation of loans currently outstanding since additional loans are not being added to the reinsurance contracts; futurepremium income could be further curtailed to the extent the Company agrees to relinquish control of individual trusts to themortgage insurance companies. Premium income, which totaled $47.6 million, $58.8 million and $37.7 million for the eachof the years ended December 31, 2009, 2008, and 2007, respectively, are reported as part of noninterest income. The relatedprovision for losses, which totaled $115.0 million and $180.0 million and $0.2 million for each of the years endedDecember 31, 2009, 2008, and 2007, respectively, is reported as part of noninterest expense.
134
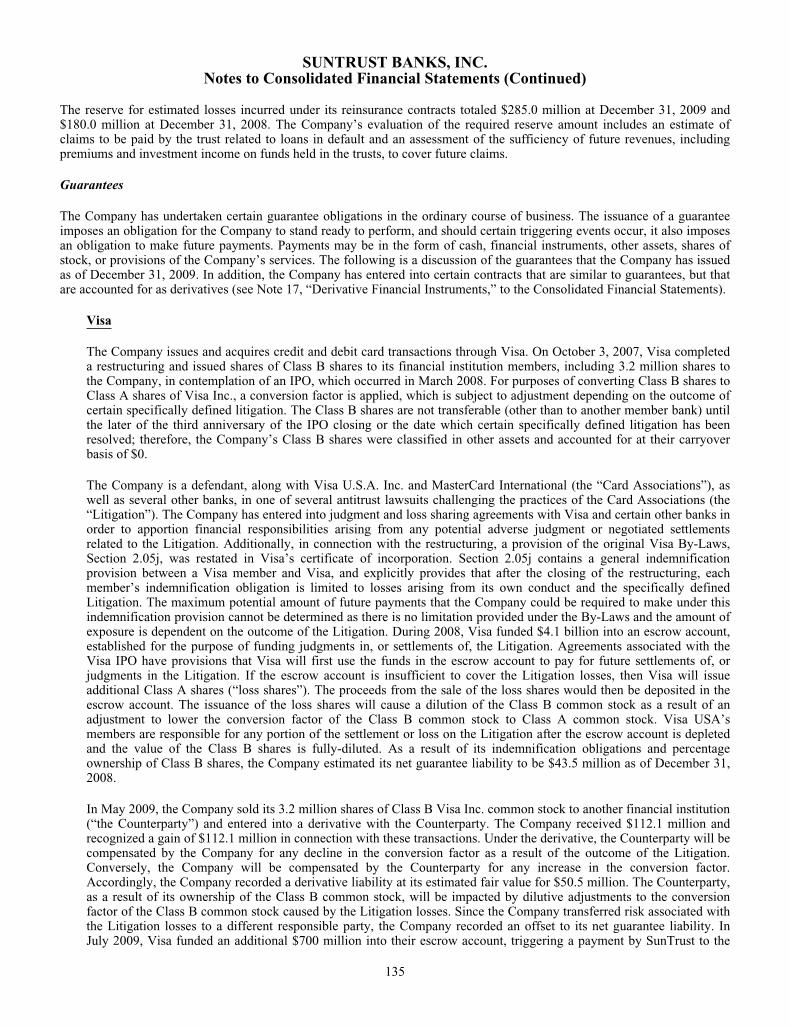
SUNTRUST BANKS, INC.Notes to Consolidated Financial Statements (Continued)
The reserve for estimated losses incurred under its reinsurance contracts totaled $285.0 million at December 31, 2009 and$180.0 million at December 31, 2008. The Company’s evaluation of the required reserve amount includes an estimate ofclaims to be paid by the trust related to loans in default and an assessment of the sufficiency of future revenues, includingpremiums and investment income on funds held in the trusts, to cover future claims.
Guarantees
The Company has undertaken certain guarantee obligations in the ordinary course of business. The issuance of a guaranteeimposes an obligation for the Company to stand ready to perform, and should certain triggering events occur, it also imposesan obligation to make future payments. Payments may be in the form of cash, financial instruments, other assets, shares ofstock, or provisions of the Company’s services. The following is a discussion of the guarantees that the Company has issuedas of December 31, 2009. In addition, the Company has entered into certain contracts that are similar to guarantees, but thatare accounted for as derivatives (see Note 17, “Derivative Financial Instruments,” to the Consolidated Financial Statements).
Visa
The Company issues and acquires credit and debit card transactions through Visa. On October 3, 2007, Visa completeda restructuring and issued shares of Class B shares to its financial institution members, including 3.2 million shares tothe Company, in contemplation of an IPO, which occurred in March 2008. For purposes of converting Class B shares toClass A shares of Visa Inc., a conversion factor is applied, which is subject to adjustment depending on the outcome ofcertain specifically defined litigation. The Class B shares are not transferable (other than to another member bank) untilthe later of the third anniversary of the IPO closing or the date which certain specifically defined litigation has beenresolved; therefore, the Company’s Class B shares were classified in other assets and accounted for at their carryoverbasis of $0.
The Company is a defendant, along with Visa U.S.A. Inc. and MasterCard International (the “Card Associations”), aswell as several other banks, in one of several antitrust lawsuits challenging the practices of the Card Associations (the“Litigation”). The Company has entered into judgment and loss sharing agreements with Visa and certain other banks inorder to apportion financial responsibilities arising from any potential adverse judgment or negotiated settlementsrelated to the Litigation. Additionally, in connection with the restructuring, a provision of the original Visa By-Laws,Section 2.05j, was restated in Visa’s certificate of incorporation. Section 2.05j contains a general indemnificationprovision between a Visa member and Visa, and explicitly provides that after the closing of the restructuring, eachmember’s indemnification obligation is limited to losses arising from its own conduct and the specifically definedLitigation. The maximum potential amount of future payments that the Company could be required to make under thisindemnification provision cannot be determined as there is no limitation provided under the By-Laws and the amount ofexposure is dependent on the outcome of the Litigation. During 2008, Visa funded $4.1 billion into an escrow account,established for the purpose of funding judgments in, or settlements of, the Litigation. Agreements associated with theVisa IPO have provisions that Visa will first use the funds in the escrow account to pay for future settlements of, orjudgments in the Litigation. If the escrow account is insufficient to cover the Litigation losses, then Visa will issueadditional Class A shares (“loss shares”). The proceeds from the sale of the loss shares would then be deposited in theescrow account. The issuance of the loss shares will cause a dilution of the Class B common stock as a result of anadjustment to lower the conversion factor of the Class B common stock to Class A common stock. Visa USA’smembers are responsible for any portion of the settlement or loss on the Litigation after the escrow account is depletedand the value of the Class B shares is fully-diluted. As a result of its indemnification obligations and percentageownership of Class B shares, the Company estimated its net guarantee liability to be $43.5 million as of December 31,2008.
In May 2009, the Company sold its 3.2 million shares of Class B Visa Inc. common stock to another financial institution(“the Counterparty”) and entered into a derivative with the Counterparty. The Company received $112.1 million andrecognized a gain of $112.1 million in connection with these transactions. Under the derivative, the Counterparty will becompensated by the Company for any decline in the conversion factor as a result of the outcome of the Litigation.Conversely, the Company will be compensated by the Counterparty for any increase in the conversion factor.Accordingly, the Company recorded a derivative liability at its estimated fair value for $50.5 million. The Counterparty,as a result of its ownership of the Class B common stock, will be impacted by dilutive adjustments to the conversionfactor of the Class B common stock caused by the Litigation losses. Since the Company transferred risk associated withthe Litigation losses to a different responsible party, the Company recorded an offset to its net guarantee liability. InJuly 2009, Visa funded an additional $700 million into their escrow account, triggering a payment by SunTrust to the
135
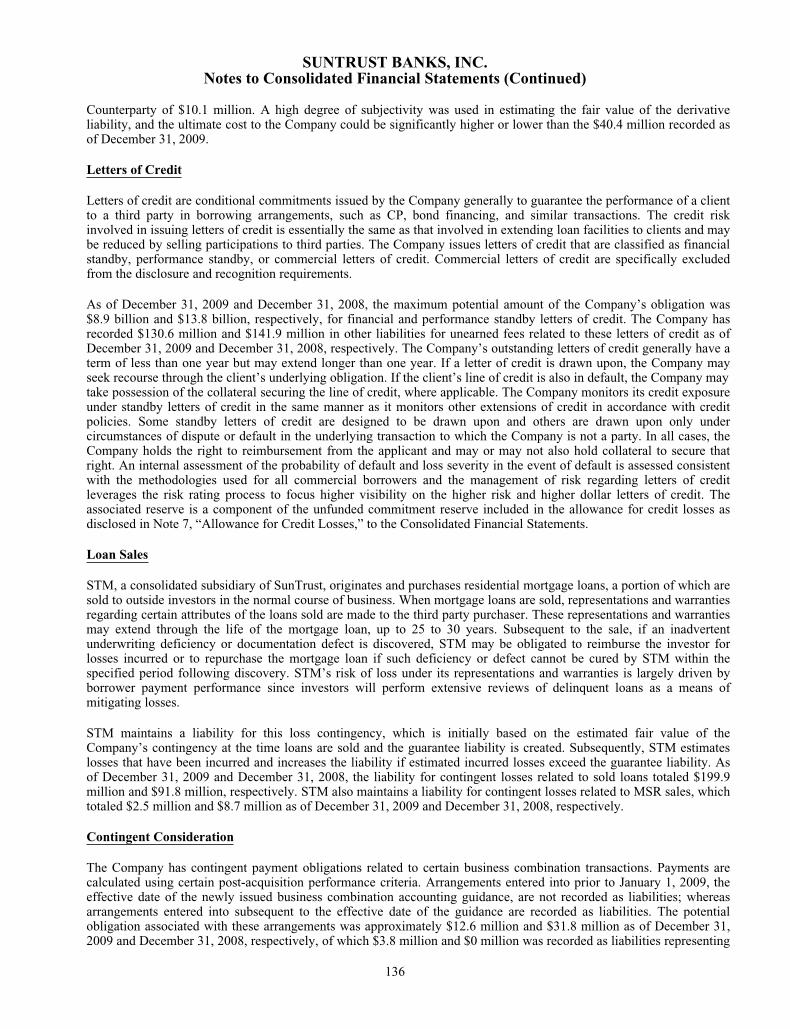
SUNTRUST BANKS, INC.Notes to Consolidated Financial Statements (Continued)
Counterparty of $10.1 million. A high degree of subjectivity was used in estimating the fair value of the derivativeliability, and the ultimate cost to the Company could be significantly higher or lower than the $40.4 million recorded asof December 31, 2009.
Letters of Credit
Letters of credit are conditional commitments issued by the Company generally to guarantee the performance of a clientto a third party in borrowing arrangements, such as CP, bond financing, and similar transactions. The credit riskinvolved in issuing letters of credit is essentially the same as that involved in extending loan facilities to clients and maybe reduced by selling participations to third parties. The Company issues letters of credit that are classified as financialstandby, performance standby, or commercial letters of credit. Commercial letters of credit are specifically excludedfrom the disclosure and recognition requirements.
As of December 31, 2009 and December 31, 2008, the maximum potential amount of the Company’s obligation was$8.9 billion and $13.8 billion, respectively, for financial and performance standby letters of credit. The Company hasrecorded $130.6 million and $141.9 million in other liabilities for unearned fees related to these letters of credit as ofDecember 31, 2009 and December 31, 2008, respectively. The Company’s outstanding letters of credit generally have aterm of less than one year but may extend longer than one year. If a letter of credit is drawn upon, the Company mayseek recourse through the client’s underlying obligation. If the client’s line of credit is also in default, the Company maytake possession of the collateral securing the line of credit, where applicable. The Company monitors its credit exposureunder standby letters of credit in the same manner as it monitors other extensions of credit in accordance with creditpolicies. Some standby letters of credit are designed to be drawn upon and others are drawn upon only undercircumstances of dispute or default in the underlying transaction to which the Company is not a party. In all cases, theCompany holds the right to reimbursement from the applicant and may or may not also hold collateral to secure thatright. An internal assessment of the probability of default and loss severity in the event of default is assessed consistentwith the methodologies used for all commercial borrowers and the management of risk regarding letters of creditleverages the risk rating process to focus higher visibility on the higher risk and higher dollar letters of credit. Theassociated reserve is a component of the unfunded commitment reserve included in the allowance for credit losses asdisclosed in Note 7, “Allowance for Credit Losses,” to the Consolidated Financial Statements.
Loan Sales
STM, a consolidated subsidiary of SunTrust, originates and purchases residential mortgage loans, a portion of which aresold to outside investors in the normal course of business. When mortgage loans are sold, representations and warrantiesregarding certain attributes of the loans sold are made to the third party purchaser. These representations and warrantiesmay extend through the life of the mortgage loan, up to 25 to 30 years. Subsequent to the sale, if an inadvertentunderwriting deficiency or documentation defect is discovered, STM may be obligated to reimburse the investor forlosses incurred or to repurchase the mortgage loan if such deficiency or defect cannot be cured by STM within thespecified period following discovery. STM’s risk of loss under its representations and warranties is largely driven byborrower payment performance since investors will perform extensive reviews of delinquent loans as a means ofmitigating losses.
STM maintains a liability for this loss contingency, which is initially based on the estimated fair value of theCompany’s contingency at the time loans are sold and the guarantee liability is created. Subsequently, STM estimateslosses that have been incurred and increases the liability if estimated incurred losses exceed the guarantee liability. Asof December 31, 2009 and December 31, 2008, the liability for contingent losses related to sold loans totaled $199.9million and $91.8 million, respectively. STM also maintains a liability for contingent losses related to MSR sales, whichtotaled $2.5 million and $8.7 million as of December 31, 2009 and December 31, 2008, respectively.
Contingent Consideration
The Company has contingent payment obligations related to certain business combination transactions. Payments arecalculated using certain post-acquisition performance criteria. Arrangements entered into prior to January 1, 2009, theeffective date of the newly issued business combination accounting guidance, are not recorded as liabilities; whereasarrangements entered into subsequent to the effective date of the guidance are recorded as liabilities. The potentialobligation associated with these arrangements was approximately $12.6 million and $31.8 million as of December 31,2009 and December 31, 2008, respectively, of which $3.8 million and $0 million was recorded as liabilities representing
136

SUNTRUST BANKS, INC.Notes to Consolidated Financial Statements (Continued)
the fair value of the contingent payments as of December 31, 2009 and December 31, 2008. If required, these contingentpayments will be payable at various times over the next five years and will become additions to goodwill.
Public Deposits
The Company holds public deposits of various states in which it does business. Individual state laws require banks tocollateralize public deposits, typically as a percentage of their public deposit balance in excess of FDIC insurance andmay also require a cross-guarantee among all banks holding public deposits of the individual state. The amount ofcollateral required varies by state and may also vary by institution within each state, depending on the individual state’srisk assessment of depository institutions. Certain of the states in which the Company holds public deposits use a pooledcollateral method, whereby in the event of default of a bank holding public deposits, the collateral of the defaulting bankis liquidated to the extent necessary to recover the loss of public deposits of the defaulting bank. To the extent thecollateral is insufficient, the remaining public deposit balances of the defaulting bank are recovered through anassessment, from the other banks holding public deposits in that state. The maximum potential amount of futurepayments the Company could be required to make is dependent on a variety of factors, including the amount of publicfunds held by banks in the states in which the Company also holds public deposits and the amount of collateral coverageassociated with any defaulting bank. Individual states appear to be monitoring risk relative to the current economicenvironment and evaluating collateral requirements and therefore, the likelihood that the Company would have toperform under this guarantee is dependent on whether any banks holding public funds default as well as the adequacy ofcollateral coverage.
Other
In the normal course of business, the Company enters into indemnification agreements and provides standardrepresentations and warranties in connection with numerous transactions. These transactions include those arising fromsecuritization activities, underwriting agreements, merger and acquisition agreements, loan sales, contractualcommitments, payment processing sponsorship agreements, and various other business transactions or arrangements.
The extent of the Company’s obligations under these indemnification agreements depends upon the occurrence of futureevents; therefore, the Company’s potential future liability under these arrangements is not determinable.
STIS and STRH, broker-dealer affiliates of SunTrust, use a common third party clearing broker to clear and executetheir customers’ securities transactions and to hold customer accounts. Under their respective agreements, STIS andSTRH agree to indemnify the clearing broker for losses that result from a customer’s failure to fulfill its contractualobligations. As the clearing broker’s rights to charge STIS and STRH have no maximum amount, the Company believesthat the maximum potential obligation cannot be estimated. However, to mitigate exposure, the affiliate may seekrecourse from the customer through cash or securities held in the defaulting customers’ account. For the years endedDecember 31, 2009 and December 31, 2008, STIS and STRH experienced minimal net losses as a result of theindemnity. The clearing agreements expire in May 2010 for both STIS and STRH.
SunTrust Community Capital, a SunTrust subsidiary, previously obtained state and federal tax credits through theconstruction and development of affordable housing properties and continues to obtain state and federal tax creditsthrough investments as a limited partner in affordable housing developments. SunTrust Community Capital or itssubsidiaries are limited and/or general partners in various partnerships established for the properties. If the partnershipsgenerate tax credits, those credits may be sold to outside investors. As of December 31, 2009, SunTrust CommunityCapital has completed six tax credit sales containing guarantee provisions stating that SunTrust Community Capital willmake payment to the outside investors if the tax credits become ineligible. SunTrust Community Capital also guaranteesthat the general partner under the transaction will perform on the delivery of the credits. The guarantees are expected toexpire within a ten year period from inception. As of December 31, 2009, the maximum potential amount that SunTrustCommunity Capital could be obligated to pay under these guarantees is $38.6 million; however, SunTrust CommunityCapital can seek recourse against the general partner. Additionally, SunTrust Community Capital can seekreimbursement from cash flow and residual values of the underlying affordable housing properties provided that theproperties retain value. As of December 31, 2009 and December 31, 2008, $9.4 million and $11.6 million, respectively,were accrued representing the remainder of tax credits to be delivered, and were recorded in other liabilities on theConsolidated Balance Sheets.
137

SUNTRUST BANKS, INC.Notes to Consolidated Financial Statements (Continued)
Note 19 - Concentrations of Credit Risk
Credit risk represents the maximum accounting loss that would be recognized at the reporting date if borrowers failed toperform as contracted and any collateral or security proved to be of no value. Concentrations of credit risk (whether on- oroff-balance sheet) arising from financial instruments can exist in relation to individual borrowers or groups of borrowers,certain types of collateral, certain types of industries, certain loan products, or certain regions of the country.
Credit risk associated with these concentrations could arise when a significant amount of loans, related by similarcharacteristics, are simultaneously impacted by changes in economic or other conditions that cause their probability ofrepayment to be adversely affected. The Company does not have a significant concentration of risk to any individual clientexcept for the U.S. government and its agencies. The major concentrations of credit risk for the Company arise by collateraltype in relation to loans and credit commitments. The only significant concentration that exists is in loans secured byresidential real estate. At December 31, 2009, the Company owned $46.7 billion in residential mortgage loans and homeequity lines, representing 41.1% of total loans, $3.8 billion of residential construction loans, representing 3.4% of total loans,and an additional $15.2 billion in commitments to extend credit on home equity loans and $12.2 billion in mortgage loancommitments. At December 31, 2008, the Company had $48.5 billion in residential mortgage loans and home equity lines,representing 38.2% of total loans, $6.2 billion of residential construction loans, representing 4.9% of total loans and anadditional $18.3 billion in commitments to extend credit on home equity loans and $17.0 billion in mortgage loancommitments. The Company originates and retains certain residential mortgage loan products that include features such asinterest only loans, high LTV loans, and low initial interest rate loans. As of December 31, 2009, the Company owned $15.4billion of interest only loans, primarily with a 10 year interest only period. Approximately $2.4 billion of those loans hadcombined original LTV ratios in excess of 80% with no mortgage insurance. Additionally, the Company ownedapproximately $3.0 billion of amortizing loans with combined original LTV ratios in excess of 80% with no mortgageinsurance. The Company attempts to mitigate and control the risk in each loan type through private mortgage insurance andunderwriting guidelines and practices. A geographic concentration arises because the Company operates primarily in theSoutheastern and Mid-Atlantic regions of the United States.
SunTrust engages in limited international banking activities. The Company’s total cross-border outstanding loans were$572.0 million and $945.8 million as of December 31, 2009 and December 31, 2008, respectively.
Note 20 – Fair Value Election and Measurement
In certain circumstances, fair value enables a company to more accurately align its financial performance with the economicvalue of actively traded or hedged assets or liabilities. Fair value enables a company to mitigate the non-economic earningsvolatility caused from financial assets and financial liabilities being carried at different bases of accounting, as well as tomore accurately portray the active and dynamic management of a company’s balance sheet.
The Company has elected to record specific financial assets and financial liabilities at fair value. These instruments includeall, or a portion, of the following: fixed rate debt, loans, LHFS, brokered deposits, and trading loans. The following is adescription of each financial asset and liability class as of December 31, 2009 for which fair value has been elected,including the specific reasons for electing fair value and the strategies for managing the financial assets and liabilities on afair value basis.
Fixed Rate Debt
The debt that the Company initially elected to carry at fair value was all of its fixed rate debt that had previously beendesignated in qualifying fair value hedges using receive-fixed interest rate swaps. The Company has also elected fairvalue for specific fixed rate debt issued subsequent to 2006 in which the Company concurrently entered into derivativefinancial instruments that economically converted the interest rate on the debt from fixed to floating. The Companyelected to record this debt at fair value in order to align the accounting for the debt with the accounting for thederivatives without having to account for the debt under hedge accounting, thus avoiding the complex and timeconsuming fair value hedge accounting requirements. This move to fair value introduced earnings volatility due tochanges in the Company’s credit spread. As of December 31, 2008, the fair value of all such elected fixed rate debt wascomprised of $3.7 billion of fixed rate FHLB advances and $3.5 billion of publicly-issued debt. In February 2009, theCompany repaid all of the FHLB advances outstanding and closed out its exposures on the interest rate swaps.Approximately $150.8 million of FHLB stock was redeemed in conjunction with the repayment of the advances. Totaldebt carried at fair value debt as of December 31, 2009 had a par value of $3.6 billion.
138
SUNTRUST BANKS, INC.Notes to Consolidated Financial Statements (Continued)
In September 2008, the Federal Reserve instituted the Program that allows eligible depository institutions, bank holdingcompanies and affiliated broker/dealers to purchase certain ABCP from certain MMMF. These purchases will be madeby the participating institution at a price equal to the MMMF’s amortized cost. The Fed will then make a fixed ratenon-recourse loan to the participating institution that will mature on the same date as the ABCP that was purchased witha specific draw. As of December 31, 2008, STRH owned $400 million of eligible ABCP at a price of $399.6 million. AtDecember 31, 2008, this ABCP had a weighted average maturity of 9 days and a risk weighting of 0% for regulatorycapital purposes. Per the terms of the Program, STRH also had outstanding loans from the Federal Reserve in theamount of $399.6 million. In 2009, all of this ABCP matured, STRH collected 100% of the par amount of this ABCPfrom the issuer and repaid the loan to the Federal Reserve. At December 31, 2008, this ABCP was classified withintrading assets and carried at fair value, and the loans from the Federal Reserve were elected to be carried at fair valueand classified within other short-term borrowings. Because of the non-recourse nature of the loan, the Company did notrecognize through earnings any differences in fair value between the loans and the ABCP.
Brokered Deposits
The Company had elected to measure certain CDs at fair value. These debt instruments include embedded derivativesthat are generally based on underlying equity securities or equity indices, but may be based on other underlyings that aregenerally not clearly and closely related to the host debt instrument. The Company elected to carry these instruments atfair value in order to remove the mixed attribute accounting model. This required bifurcation of a single instrument intoa debt component, which would be carried at amortized cost, and a derivative component, which would be carried at fairvalue, with such bifurcation being based on the fair value of the derivative component and an allocation of anyremaining proceeds to the host debt instrument. Prior to 2009, the Company had elected to carry substantially all newly-issued CDs at fair value to economically hedge the embedded features. In 2009, given the continued dislocation in thecredit markets, the Company evaluated, on an instrument by instrument basis, whether a new issuance would be carriedat fair value.
Loans and Loans Held for Sale
In the second quarter of 2007, the Company began recording at fair value certain newly-originated mortgage LHFSbased upon defined product criteria. SunTrust chose to fair value these mortgage LHFS in order to eliminate thecomplexities and inherent difficulties of achieving hedge accounting and to better align reported results with theunderlying economic changes in value of the loans and related hedge instruments. This election impacts the timing andrecognition of origination fees and costs, as well as servicing value. Specifically, origination fees and costs, which hadbeen appropriately deferred and recognized as part of the gain/loss on sale of the loan, are now recognized in earnings atthe time of origination. The servicing value, which had been recorded as MSRs at the time the loan was sold, is nowincluded in the fair value of the loan and initially recognized at the time the Company enters into IRLCs with borrowers.The Company began using derivatives to economically hedge changes in servicing value as a result of including theservicing value in the fair value of the loan. The mark to market adjustments related to LHFS and the associatedeconomic hedges are captured in mortgage production income.
On May 1, 2008, SunTrust acquired 100% of the outstanding common shares of GB&T. As a result of the acquisition,SunTrust acquired approximately $1.4 billion of loans, primarily commercial real estate loans. SunTrust elected toaccount for at fair value, $171.6 million of the acquired loans, which were classified as nonaccrual, in order to eliminatethe complexities of accounting for these purchased impaired loans. Upon acquisition, the loans had a fair value of$111.1 million. On December 31, 2009, primarily as a result of paydowns, payoffs and transfers to OREO, the loans hada fair value of $12.2 million.
Trading Loans
The Company often maintains a portfolio of loans that it trades in the secondary market. The Company elected to carrycertain loans at fair value in order to reflect the active management of these positions. Loans are purchased and recordedat fair value as part of the Company’s normal loan trading activities. As of December 31, 2009, approximately $286.5million of trading loans were outstanding.
In addition to loans carried at fair value in connection with the Company’s loan trading business, the Company has alsoelected to carry short-term loans made in connection with its total return swap business at fair value. At December 31,2008, the Company had approximately $603.4 million of such short-term loans carried at fair value, which are includedin trading assets. As of December 31, 2008, the Company had decided to temporarily suspend its TRS business and theCompany has unwound its positions as of December 31, 2009.
139

SUNTRUST BANKS, INC.Notes to Consolidated Financial Statements (Continued)
Valuation Methodologies and Fair Value Hierarchy
The primary financial instruments that the Company carries at fair value include securities, derivative instruments, fixed ratedebt, loans and LHFS. Financial instruments that have significantly limited or unobservable trading activity (i.e., inactivemarkets), such that the estimates of fair value include significant unobservable inputs, are classified as level 3 instruments.The fair values were generally based on proprietary models or non-binding broker price indications that estimated the creditand liquidity risk.
The classification of an instrument as level 3 versus level 2 involves judgment based on a variety of subjective factors. Amarket is considered “inactive” based on whether significant decreases in the volume and level of activity for the asset orliability have been observed. In determining whether a market is inactive, the Company evaluates such factors as the numberof recent transactions in either the primary or secondary markets, whether price quotations are current, the nature of themarket participants, the variability of price quotations, the significance of bid/ask spreads, declines in (or the absence of) newissuances and the availability of public information. Inactive markets necessitate the use of additional judgment whenvaluing financial instruments, such as pricing matrices, cash flow modeling and the selection of an appropriate discount rate.The assumptions used to estimate the value of an instrument where the market was inactive were based on the Company’sassessment of the assumptions a market participant would use to value the instrument in an orderly transaction and includedconsiderations of illiquidity in the current market environment. Where the Company determined that a significant decrease inthe volume and level of activity had occurred, the Company was then required to evaluate whether significant adjustmentswere required to market data to arrive at an exit price.
Level 3 Instruments
SunTrust used significant unobservable inputs to fair value certain financial and non-financial instruments as ofDecember 31, 2009 and December 31, 2008. The general lack of market liquidity necessitates the use of unobservableinputs in certain cases, as the observability of actual trades and assumptions used by market participants that wouldotherwise be available to the Company to use as a basis for estimating the fair values of these instruments hasdiminished. It is reasonably likely that current inactive markets will continue as a result of a variety of external factors,including, but not limited to, economic conditions.
The Company’s level 3 securities available for sale include instruments totaling approximately $1.3 billion atDecember 31, 2009, including FHLB and Federal Reserve Bank stock, as well as certain municipal bond securities,some of which are only redeemable with the issuer at par and cannot be traded in the market. As such, no significantobservable market data for these instruments is available. These nonmarketable securities total approximately $836.9million at December 31, 2009. Level 3 trading assets total approximately $390.1 million at December 31, 2009. Theremaining level 3 securities, both trading assets and available for sale securities, are predominantly private MBS andcollateral debt obligations, including interests retained from Company-sponsored securitizations or purchased from thirdparty securitizations and investments in SIVs. The Company also has exposure to bank trust preferred ABS, student loanABS, and municipal securities due to its offer to purchase certain ARS as a result of failed auctions. For all level 3securities, little or no market activity exists for either the security or the underlying collateral and therefore thesignificant assumptions used to value the securities are not market observable. Level 3 trading liabilities consist of theCoke derivative, valued at approximately $45.9 million at December 31, 2009.
ARS purchased since the auction rate market began failing in February 2008 have been considered level 3 securities dueto the significant decrease in the volume and level of activity in these markets, which has necessitated the use ofsignificant unobservable inputs into the Company’s valuations. ARS are classified as securities available for sale ortrading securities. Under a functioning ARS market, ARS could be remarketed with interest rate caps to investorstargeting short-term investment securities that repriced generally every 7 to 28 days. Unlike other short-terminstruments, these ARS do not benefit from back-up liquidity lines or letters of credit; therefore, as auctions began tofail, investors were left with securities that were more akin to longer-term, 20-30 year, illiquid bonds. The combinationof materially increased tenors, capped interest rates and general market illiquidity has had a significant impact on therisk profiles of these securities and has resulted in the use of valuation techniques and models that rely on significantinputs that are largely unobservable.
Investments in various ABS such as residual and other retained interests from securitizations, SIVs and private MBS,which are classified as securities available for sale or trading securities, are valued based on internal models thatincorporate assumptions, such as prepayment speeds, estimated credit losses, and discount rates which are generally not
140

SUNTRUST BANKS, INC.Notes to Consolidated Financial Statements (Continued)
observable in the current markets. Generally, the Company attempts to obtain pricing for its securities from a third partypricing provider or third party brokers who have experience in valuing certain investments. This pricing may be used aseither direct support for the Company’s valuation or used to validate outputs from its own proprietary models. Althoughthird party price indications have been available for the majority of the securities, the significant decrease in the volumeand level of trading activity makes it difficult to support the observability of these quotations. Therefore, the Companyevaluates third party pricing to determine the reasonableness of the information relative to changes in market data basedon any recent trades it executed, market information received from outside market participants and analysts, and/orchanges in the underlying collateral performance. When actual trades are not available to corroborate pricinginformation received, the Company will use industry standard or proprietary models to estimate fair value and willconsider assumptions such as relevant market indices that correlate to the underlying collateral, prepayment speeds,default rates, loss severity rates, and discount rates.
Level 3 loans are primarily non-agency residential mortgage loans held for investment or LHFS for which there is littleto no observable trading activity of similar instruments in either the new issuance or secondary loan markets as eitherwhole loans or as securities. Prior to the non-agency residential loan market disruption, which began during the thirdquarter of 2007 and continues, the Company was able to obtain certain observable pricing from either the new issuanceor secondary loan market. However, as the markets deteriorated and certain loans were not actively trading as eitherwhole loans or as securities, the Company began employing the same alternative valuation methodologies used to valuelevel 3 residential MBS to fair value the loans. In the normal course of business, the Company may elect to transfercertain fair valued mortgage LHFS to mortgage loans held for investment. During the years ended December 31, 2009and 2008, the Company transferred $307.0 million and $656.1 million, respectively, of loans that were previouslydesignated as held for sale to held for investment, as they were determined to be no longer marketable. Of this amount,$272.1 million during the year ended December 31, 2009, and $83.9 million during the year ended December 31, 2008were LHFS reported at fair value and will continue to be reported at fair value as loans held for investment.
As disclosed in the tabular level 3 rollforwards, during the year ended December 31, 2008, the Company transferredcertain mortgage LHFS into level 3 based on secondary market illiquidity and the resulting reduction of observablemarket data for certain non-agency loans requiring increased reliance on unobservable inputs. The transfers into level 3were not the result of using an alternative valuation approach to estimate fair value that otherwise would have impactedearnings. Transfers into level 3 during 2009, as shown in the table, were largely due to borrower defaults or theidentification of other loan defects impacting the marketability of the loans.
Additionally, level 3 loans include some of the loans acquired through the acquisition of GB&T. The loans theCompany elected to account for at fair value are primarily nonperforming commercial real estate loans, which do nottrade in an active secondary market. As these loans are classified as nonperforming, cash proceeds from the sale of theunderlying collateral is the expected source of repayment for a majority of these loans. Accordingly, the fair value ofthese loans is derived from internal estimates, incorporating market data when available, of the value of the underlyingcollateral.
The Company records MSRs at fair value on both a recurring and non-recurring basis. The fair values of MSRs aredetermined by projecting cash flows, which are then discounted to estimate an expected fair value. The fair values ofMSRs are impacted by a variety of factors, including prepayment assumptions, discount rates, delinquency rates,contractually specified servicing fees, and underlying portfolio characteristics. The underlying assumptions andestimated values are corroborated by values received from independent third parties based on their review of theservicing portfolio. Because these inputs are not transparent in market trades, MSRs are considered to be level 3 assetsin the valuation hierarchy.
The publicly-issued, fixed rate debt that the Company has elected to carry at fair value is valued by obtaining quotesfrom a third party pricing service and utilizing broker quotes to corroborate the reasonableness of those marks. Inaddition, information from market data of recent observable trades and indications from buy side investors, if available,are taken into consideration as additional support for the value. During the third and fourth quarters of 2008, there werefew trades to reference, and therefore, given the continued decline in liquidity for these types of instruments, both in thesecondary markets and for primary issuances, this debt was transferred from a level 2 to a level 3 classification in thefair value hierarchy effective July 1, 2008. The volume and level of activity for transactions in the Company’s debt inthe secondary markets had begun to increase in the three months ended March 31, 2009 and significantly increasedduring the three months ended June 30, 2009. As such, the Company was able to use pricing received from third-partypricing services and market-makers and therefore elected to transfer its fixed rate debt out of level 3 as of June 30, 2009.
141
SUNTRUST BANKS, INC.Notes to Consolidated Financial Statements (Continued)
As disclosed in the tabular level 3 rollforwards, the Company also transferred certain trading securities out of level 3during the year ended December 31, 2009. The U.S. Treasury and federal agency trading securities and other assets thatwere transferred out of level 3 were Small Business Administration securities or loans for which the volume and level ofobservable trading activity had significantly decreased in prior quarters, but for which the Company began to observelimited increases in such activity during the three months ended March 31, 2009 and significant increases in suchactivity during the rest of 2009. This level of activity provided the Company with sufficient market evidence of pricing,such that the Company did not have to make any significant adjustments to observed pricing, nor was the Company’spricing based on unobservable data. Transfers into level 3 are generally assumed to be as of the beginning of the quarterin which the transfer occurred, while transfers out of level 3 are generally assumed to occur as of the end of the quarter.None of the transfers into or out of level 3 were the result of using alternative valuation approaches to estimate fairvalues.
As discussed in Note 11, “Certain Transfers of Financial Assets, Mortgage Servicing Rights and Variable InterestEntities,” to the Consolidated Financial Statements, the Company began to purchase CP from Three Pillars, which is amulti-seller CP conduit with which the Company has certain levels of involvement. This CP was classified as level 3.The downgrade of Three Pillars’ CP to A-2/P-1 during the second quarter of 2009 caused the volume and level ofactivity for its CP to significantly decrease. Because of this significant decrease, the observability for identical or similartransactions in the market also significantly decreased. As such, in order to estimate the fair value of its CP issuances tothe Company, significant adjustments were required to the most similar asset for which a sufficient level of marketobservability existed. Three Pillars subsequently received a F-1 rating from Fitch, such that it is now rated F-1/P-1.These ratings triggered increased third party demand for its CP during the quarter ended September 30, 2009 to such alevel that the Company stopped making any significant adjustments to third party pricing information when valuing theinvestments. As such, this CP was transferred out of level 3 effective September 30, 2009 and matured prior toDecember 31, 2009.
Most derivative instruments (see Note 17, “Derivative Financial Instruments” to the Consolidated Financial Statements)are level 1 or level 2 instruments. Beginning in the first quarter of 2008, the Company classified IRLCs on residentialmortgage LHFS which are derivatives, on a gross basis within other assets or other liabilities. The fair value of thesecommitments, while based on interest rates observable in the market, is highly dependent on the ultimate closing of theloans. These “pull-through” rates are based on the Company’s historical data and reflect the Company’s best estimate ofthe likelihood that a commitment will ultimately result in a closed loan. Beginning in the first quarter of 2008, servicingvalue was included in the fair value of IRLCs. The fair value of servicing value is determined by projecting cash flowswhich are then discounted to estimate an expected fair value. The fair value of servicing value is impacted by a varietyof factors, including prepayment assumptions, discount rates, delinquency rates, contractually specified servicing feesand underlying portfolio characteristics. Because these inputs are not transparent in market trades, IRLCs are consideredto be level 3 assets in the valuation hierarchy.
In addition, The Agreements the Company entered into related to its Coke stock are level 3 instruments, due to theunobservability of a significant assumption used to value these instruments. Because the value is primarily driven by theembedded equity collars on the Coke shares, a Black-Scholes model is the appropriate valuation model. Most of theassumptions are directly observable from the market, such as the per share market price of Coke common stock, interestrates, and the dividend rate on the Coke common stock. Volatility is a significant assumption and is impacted both bythe unusually large size of the trade and the long tenor until settlement. Because the derivatives carry scheduled terms ofapproximately six and a half and seven years from the effective date and are on a significant number of Coke shares, theobservable and active options market on Coke does not provide for any identical or similar instruments. As such, theCompany receives estimated market values from a market participant who is knowledgeable about Coke equityderivatives and is active in the market. Based on inquiries of the market participant as to their procedures, as well as theCompany’s own valuation assessment procedures, the Company has satisfied itself that the market participant is usingmethodologies and assumptions that other market participants would use in arriving at the fair value of The Agreements.At December 31, 2009 and December 31, 2008, The Agreements’ fair value represented a liability position for theCompany of approximately $45.9 million and an asset position for the Company of $249.5 million, respectively.
During the second quarter of 2009, in connection with its sale of Visa Class B shares, the Company entered into aderivative contract whereby the ultimate cash payments received or paid, if any, under the contract are based on theultimate resolution of litigation involving Visa. The value of the derivative was estimated based on the Company’sexpectations regarding the ultimate resolution of that litigation, which involved a high degree of judgment andsubjectivity. Accordingly, the value of the derivative liability was classified as a level 3 instrument. See Note 18,“Reinsurance Arrangements and Guarantees”, to the Consolidated Financial Statements for further discussion.
142
SUNTRUST BANKS, INC.Notes to Consolidated Financial Statements (Continued)
Certain level 3 assets include non-financial assets such as affordable housing properties, private equity investments, andintangible assets that are measured on a non-recurring basis based on third party price indications or the estimatedexpected remaining cash flows to be received from these assets discounted at a market rate that is commensurate withtheir risk profile.
A portion of the Company’s OREO portfolio resides in level 3 due to the lack of observable market data available forvacant developed lots and land. The Company utilized a pooled valuation approach to value the vacant developed lotsand land and estimated the percentage decline that has taken place in these property types on a per state basis. As aresult of the valuation analysis performed in assessing market value deterioration by state, the Company recorded anallowance of $46.4 million for the vacant developed lots and land totaling $123.8 million in net carrying value. Thesevacant developed lots and land are located primarily in Georgia and North Carolina.
Credit Risk
The credit risk associated with the underlying cash flows of an instrument carried at fair value was a consideration inestimating the fair value of certain financial instruments. Credit risk was considered in the valuation through a variety ofinputs, as applicable, including, the actual default and loss severity of the collateral, the instrument’s spread in relationto U.S. Treasury rates, the capital structure of the security and level of subordination, and/or the rating on a security/obligor as defined by nationally recognized rating agencies. The assumptions used to estimate credit risk appliedrelevant information that a market participant would likely use in valuing an instrument.
For loan products that the Company has elected to carry at fair value, the Company has considered the component of thefair value changes due to instrument-specific credit risk, which is intended to be an approximation of the fair valuechange attributable to changes in borrower-specific credit risk. For the year ended December 31, 2009, SunTrustrecognized a loss on loans accounted for at fair value of approximately $24.1 million, due to changes in fair valueattributable to borrower-specific credit risk. For the year ended December 31, 2008, SunTrust recognized a loss on loansaccounted for at fair value of approximately $46.6 million, due to changes in fair value attributable to borrower-specificcredit risk. In addition to borrower-specific credit risk, there are other, more significant variables that will drive changesin the fair value of the loans, including interest rates changes and general conditions in the principal markets for theloans.
For the publicly-traded fixed rate debt and brokered deposits carried at fair value, the Company estimated credit spreadsabove U.S. Treasury rates and LIBOR, respectively, based on credit spreads from actual or estimated trading levels ofthe debt, or other relevant market data. Prior to the second quarter of 2008, the Company had estimated the impacts ofits own credit spreads over LIBOR for its public debt; however, given the volatility in the interest rate markets during2008, the Company analyzed the difference between using U.S. Treasury rates and LIBOR. While the historical analysisindicated only minor differences, the Company believes that beginning in the second quarter of 2008 a more accuratedepiction of the impacts of changes in its own credit spreads on its public debt is to base such estimation on the U.S.Treasury rate, which reflects a risk-free interest rate. A reason the Company had selected LIBOR in the past was due tothe presence of LIBOR-based interest rate swap contracts that the Company had historically used to hedge its interestrate exposure on these debt instruments. The Company may, however, also purchase fixed rate trading securities in aneffort to hedge its fair value exposure to its fixed rate debt. The Company may also continue to use interest rate swapcontracts to hedge interest exposure on future fixed rate debt issuances. The Company continues to use LIBOR as thebasis for estimating credit spreads on its brokered deposits, due to differences in terms, principal markets, and otherfactors. The Company recognized a loss of approximately $235.3 million for the year ended December 31, 2009, and again of approximately $398.1 million for the year ended December 31, 2008, due to changes in its own credit spread onits public debt and brokered deposits.
143

SUNTRUST BANKS, INC.Notes to Consolidated Financial Statements (Continued)
The following tables present assets and liabilities measured at fair value on a recurring basis and the change in fair value forthose specific financial instruments in which fair value has been elected. The tables do not reflect the change in fair valueattributable to the related economic hedges the Company used to mitigate the market-related risks associated with thefinancial instruments. The changes in the fair value of economic hedges were also recorded in trading account profits andcommissions or mortgage production or mortgage servicing related income, as appropriate, and are designed to partiallyoffset the change in fair value of the financial instruments referenced in the tables below. The Company’s economic hedgingactivities are deployed at both the instrument and portfolio level.
Fair Value Measurements atDecember 31, 2009,
Using
(Dollars in thousands) Assets/Liabilities
QuotedPrices InActive
Marketsfor
IdenticalAssets/Liabilities
(Level 1)
Significant OtherObservable Inputs
(Level 2)
SignificantUnobservable
Inputs(Level 3)
AssetsTrading assets
U.S. Treasury and federal agencies $1,150,323 $498,781 $651,542 $-U.S. states and political subdivisions 58,520 - 51,119 7,401Residential mortgage-backed securities - agency 94,164 - 94,164 -Residential mortgage-backed securities - private 13,889 - - 13,889Collateralized debt obligations 174,886 - - 174,886Corporate debt securities 464,684 - 464,684 -Commercial paper 639 - 639 -Other debt securities 25,886 - 1,183 24,703Equity securities 163,053 1,049 11,260 150,744Derivative contracts 2,610,288 102,520 2,507,768 -Other 223,606 - 205,136 18,470
Total trading assets 4,979,938 602,350 3,987,495 390,093
Securities available for saleU.S. Treasury and federal agencies 7,914,111 5,176,525 2,737,586 -U.S. states and political subdivisions 945,057 - 812,949 132,108Residential mortgage-backed securities - agency 15,916,077 - 15,916,077 -Residential mortgage-backed securities - private 407,228 - - 407,228Other debt securities 797,403 - 719,449 77,954Common stock of The Coca-Cola Company 1,710,000 1,710,000 - -Other equity securities 787,166 182 82,187 704,797
Total securities available for sale 28,477,042 6,886,707 20,268,248 1,322,087
Loans held for sale 2,923,375 - 2,771,890 151,485Loans 448,720 - - 448,720Other intangible assets 2 935,561 - - 935,561Other assets 1 150,272 - 136,790 13,482
LiabilitiesBrokered deposits 1,260,505 - 1,260,505 -Trading liabilities 2,188,923 259,103 1,883,954 45,866Long-term debt 3,585,892 - 3,585,892 -Other liabilities 1 125,239 - 77,105 48,134
1These amounts include IRLCs and derivative financial instruments entered into by the Household Lending line of business to hedge its interest rate riskalong with a derivative associated with the Company’s sale of Visa shares during the quarter ended June 30, 2009.2This amount includes MSRs carried at fair value.
144

SUNTRUST BANKS, INC.Notes to Consolidated Financial Statements (Continued)
Fair Value Gain/(Loss) for the Year Ended December 31,2009, for Items Measured at Fair Value Pursuant to Election of the Fair Value Option
(Dollars in thousands)
Trading AccountProfits/(losses) and
Commissions
MortgageProduction
RelatedIncome 2
MortgageServicing
Related Income
TotalChanges inFair ValuesIncluded in
Current-Period
Earnings1
AssetsTrading assets $3,165 $- $ - $3,165Loans held for sale 2,020 625,396 - 627,416Loans 2,353 (666) - 1,687Other intangible assets - 17,551 65,944 83,495
LiabilitiesBrokered deposits 11,249 - - 11,249Long-term debt (64,826) - - (64,826)
1Changes in fair value for the year ended December 31, 2009, exclude accrued interest for the periods then ended. Interest income or interest expense on trading assets,loans, loans held for sale, brokered deposits and long-term debt that have been elected to be carried at fair value are recorded in interest income or interest expense in theConsolidated Statements of Income/(Loss) based on their contractual coupons. Certain trading assets do not have a contractually stated coupon and, for these securities,the Company records interest income based on the effective yield calculated upon acquisition of those securities.2For the year ended December 31, 2009, income related to loans held for sale, includes $664.3 million related to MSRs recognized upon the sale of loans reported at fairvalue. For the year ended December 31, 2009, income related to other intangible assets includes $17.5 million of MSRs recognized upon the sale of loans reported at thelower of cost or market value. These MSRs are included in the table since the Company elected to report MSRs recognized in 2009 using the fair value method.Previously, MSRs were reported under the amortized cost method.
Fair Value Measurements atDecember 31, 2008,
Using
(Dollars in thousands) Assets/Liabilities
QuotedPrices InActive
Marketsfor
IdenticalAssets/Liabilities
(Level 1)
SignificantOther
ObservableInputs
(Level 2)
SignificantUnobservable
Inputs(Level 3)
AssetsTrading assets
U.S. Treasury and federal agencies $3,127,635 $142,906 $2,339,469 $645,260U.S. states and political subdivisions 159,135 - 151,809 7,326Corporate debt securities 585,809 - 579,159 6,650Commercial paper 399,611 - 399,611 -Residential mortgage-backed securities - agencies 58,565 - 58,565 -Residential mortgage-backed securities - private 37,970 - - 37,970Collateralized debt obligations 261,528 - - 261,528Other debt securities 813,176 - 790,231 22,945Equity securities 116,788 6,415 8,409 101,964Derivative contracts 4,701,783 - 4,452,236 249,547Other 134,269 - 76,074 58,195
Total trading assets 10,396,269 149,321 8,855,563 1,391,385
Securities available for saleU.S. Treasury and federal agencies 486,153 127,123 359,030 -U.S. states and political subdivisions 1,037,429 - 958,167 79,262Residential mortgage-backed securities - agencies 14,550,104 - 14,550,104 -Residential mortgage-backed securities - private 522,151 - - 522,151Other debt securities 294,185 - 265,772 28,413Common stock of The Coca-Cola Company 1,358,100 1,358,100 - -Other equity securities 1,448,415 141 588,495 859,779
Total securities available for sale 19,696,537 1,485,364 16,721,568 1,489,605
Loans held for sale 2,424,432 - 1,936,987 487,445Loans 270,342 - - 270,342Other assets 1 109,600 775 35,231 73,594
LiabilitiesBrokered deposits 587,486 - 587,486 -Trading liabilities 3,240,784 440,436 2,800,348 -Other short-term borrowings 399,611 - 399,611 -Long-term debt 7,155,684 - 3,659,423 3,496,261Other liabilities 1 72,911 - 71,738 1,173
1This amount includes IRLCs and derivative financial instruments entered into by the Household Lending line of business to hedge its interest rate risk.
145

SUNTRUST BANKS, INC.Notes to Consolidated Financial Statements (Continued)
Fair Value Gain/(Loss) for the Year EndedDecember 31, 2008, for Items Measured at Fair Value
Pursuant to Election of the Fair Value Option
(Dollars in thousands)
Trading AccountProfits and
Commissions
MortgageProduction
RelatedIncome
TotalChanges inFair ValuesIncluded in
Current-Period
Earnings1
AssetsTrading assets ($6,598) $ - ($6,598)Loans held for sale2 - 268,386 268,386Loans (4,195) (26,066) (30,261)
LiabilitiesBrokered deposits 46,007 - 46,007Long-term debt (65,322) - (65,322)
1Changes in fair value for the year ended December 31, 2008 exclude accrued interest for the period then ended. Interest income orinterest expense on trading assets, loans, loans held for sale, brokered deposits and long-term debt that have been elected to be carried atfair value are recorded in interest income or interest expense in the Consolidated Statements of Income/(Loss) based on their contractualcoupons. Certain trading assets do not have a contractually stated coupon and, for these securities, the Company records interest incomebased on the effective yield calculated upon acquisition of those securities.2For the year ended December 31, 2008, these amounts include $467.1 million related to MSR assets recognized upon the sale of theloans. These amounts exclude $18.5 million of MSRs recognized upon the sale of loans reported at the lower of cost or market value.These MSRs are excluded from the table because neither the loans nor the related MSRs were reported at fair value on a recurring basis.
The following tables present the change in carrying value of those assets measured at fair value on a non-recurring basis, forwhich impairment was recognized in the current period. The table does not reflect the change in fair value attributable to anyrelated economic hedges the Company may have used to mitigate the interest rate risk associated with LHFS and MSRs, nordoes it include information related to the goodwill impairment charge recorded during the year ended December 31, 2009which is discussed in Note 9, “Goodwill and Other Intangible Assets”, to the Consolidated Financial Statements. TheCompany’s economic hedging activities for LHFS and MSRs are deployed at the portfolio level.
Fair Value Measurement atDecember 31, 2009, Using
(Dollars in thousands)
NetCarrying
Value
Quoted Prices InActive Markets
for IdenticalAssets/Liabilities
(Level 1)
SignificantOther
ObservableInputs
(Level 2)
SignificantUnobservable
Inputs(Level 3)
ValuationAllowance
Loans Held for Sale 1 $1,339,324 $- $1,173,310 $166,014 ($48,204)MSRs 2 23,342 - - 23,342 (6,718)OREO 3 619,621 - 495,827 123,794 (110,458)Affordable Housing 4 395,213 - - 395,213 -Loans 5 96,062 - 96,062 - (15,607)Other Assets 6 143,600 - 60,852 82,748 -
1These balances are measured at the lower of cost or market.2MSRs carried at amortized cost are stratified for the purpose of impairment testing with impaired amounts presented herein.3OREO is recorded at the lower of cost or fair value, less costs to sell.4Affordable housing was impacted by $46.8 million in impairment charges recorded during the year ended December 31, 2009.5These balances are measured at fair value on a non-recurring basis using the fair value of the underlying collateral.6These assets include equity partner investments, structured leasing products, and other repossessed assets. These assets were impacted by $26.3 million inimpairment charges recorded during the year ended December 31, 2009.
146

SUNTRUST BANKS, INC.Notes to Consolidated Financial Statements (Continued)
Fair Value Measurement atDecember 31, 2008, Using
(Dollars in thousands)
NetCarrying
Value
Quoted Prices InActive Markets
for IdenticalAssets/Liabilities
(Level 1)
SignificantOther
ObservableInputs
(Level 2)
SignificantUnobservable
Inputs(Level 3)
ValuationAllowance
Loans Held for Sale 1 $839,758 - $738,068 $101,690 ($68,154)MSRs 2 794,783 - - 794,783 (370,000)OREO 3 500,481 - 500,481 - (54,450)Affordable Housing 4 471,156 - - 471,156 -Loans 5 178,692 - 178,692 - (34,105)Other Assets 6 45,724 - - 45,724 -Other Intangible Assets 7 17,298 - - 17,298 -
1These balances are measured at the lower of cost or market.2MSRs carried at amortized cost are stratified for the purpose of impairment testing with impaired amounts presented herein.3OREO is recorded at the lower of cost or fair value, less costs to sell.4Affordable housing was impacted by a $19.9 million impairment charge recorded during the year ended December 31, 2008.5These balances are measured at fair value on a non-recurring basis using the fair value of the underlying collateral and were impacted by a $34.1 million impairmentcharge recorded during the year ended December 31, 2008.6These assets were impacted by a $27.2 million impairment charge recorded during the year ended December 31, 2008.7 These balances were impacted by a $45.0 million impairment charge recorded during the second quarter of 2008.
The following tables show a reconciliation of the beginning and ending balances for fair valued assets and liabilitiesmeasured on a recurring basis using significant unobservable inputs (other than MSRs which are disclosed in Note 9,“Goodwill and Other Intangible Assets”, to the Consolidated Financial Statements):
Fair Value MeasurementsUsing Significant Unobservable Inputs
(Dollars in thousands)Beginning balance
January 1, 2009Included in
earnings
Othercomprehensive
income
Purchases, sales,issuances,
settlements,maturities
paydowns, net
Transfersto/from other
balance sheet lineitems
Level 3transfers, net
Fair valueDecember 31, 2009
Change in unrealizedgains/(losses) included
in earnings for theyear ended
December 31, 2009related to financial
instruments stillheld at
December 31, 2009
Assets
Trading assetsU.S. Treasury and federal agencies $645,260 ($3,221) 1 $- ($181,154) $- ($460,885) $- $-U.S. states and political subdivisions 7,326 (324) 1, 5 - 399 - - 7,401 (324) 1
Residential mortgage-backedsecurities—private 37,970 1,420 1 - (25,501) - - 13,889 (7,150) 1
Collateralized debt obligations 261,528 (3,630) 1, 5 - (83,012) - - 174,886 556 1
Corporate debt securities 6,650 2,800 1 - (9,450) - - - -Commercial paper - - - 1,295,355 - (1,295,355) - -Other debt securities 22,945 1,138 1, 5 - 620 - - 24,703 907 1
Equity securities 101,964 6,343 1, 5 - 42,437 - - 150,744 2,300 1
Derivative contracts 249,547 569 1 (250,116) 6 - - - - -Other 58,195 (10,890) 1 - (4,019) - (24,816) 18,470 9,131 1
Total trading assets 1,391,385 (5,795) 1, 5 (250,116) 1,035,675 - (1,781,056) 390,093 5,420 1
Securities available for saleU.S. states and political subdivisions 79,262 5,555 2, 5 (3,495) 47,650 - 3,136 132,108 -Residential mortgage-backed
securities—private 522,151 (21,455) 2 29,669 (123,137) - - 407,228 (19,149) 2
Other debt securities 28,413 288 2, 5 2,872 46,381 - - 77,954 -Other equity securities 859,779 (212) 2 (4,378) (150,392) - - 704,797 -
Total securities available for sale 1,489,605 (15,824) 2, 5 24,668 (179,498) - 3,136 1,322,087 (19,149) 2
Loans held for sale 487,445 (8,413) 3 - (81,742) (279,367) 33,562 151,485 (19,345) 3
Loans 270,342 1,687 4 - (71,603) 262,602 (14,308) 448,720 14,593 4
Other assets/(liabilities), net 72,421 629,973 3 - (40,370) (696,676) - (34,652) 5,718
Liabilities
Trading liabilities - - (45,866) 6 - - - (45,866) -Long-term debt (3,496,261) 130,612 1 - - - 3,365,649 - -
1Amounts included in earnings are recorded in trading account profits/(losses) and commissions.2Amounts included in earnings are recorded in net securities gains/(losses).3Amounts included in earnings are net of issuances, fair value changes, and expirations and are recorded in mortgage production related income.4Amounts are generally included in mortgage production related income except $2.4 million for the year ended December 31, 2009 related to loans acquired in the GB&T acquisition.The mark on these loans is included in trading account profits and commissions.5Amounts included in earnings do not include losses accrued as a result of the auction rate securities settlement discussed in Note 21, “Contingencies,” to the Consolidated Financial Statements.6Amount recorded in other comprehensive income is the effective portion of the cash flow hedges related to the Company’s probable forecasted sale of its shares of the Coca-Cola Company stock as discussed in Note 17, “Derivative Financial
Instruments,” to the Consolidated Financial Statements.
147

SUNTRUST BANKS, INC.Notes to Consolidated Financial Statements (Continued)
Fair Value MeasurementsUsing Significant Unobservable Inputs
(Dollars in thousands)TradingAssets
SecuritiesAvailablefor Sale
LoansHeld for
Sale LoansLong-term
Debt
Beginning balance January 1, 2008 $2,950,145 $869,707 $481,327 $220,784 $-Total gains/(losses) (realized/unrealized):
Included in earnings (401,347) 1, 5 (80,251) 2, 5 (60,114) 3 (30,261) 4 (52,600) 1
Included in other comprehensive income 249,547 6 (20,708) - - -Purchase accounting adjustments - - - 5,141 -
Purchases and issuances 414,936 193,054 - 112,153 -Settlements (50,682) (70,643) - - -Sales (1,628,149) (116,555) (34,049) - -Repurchase of debt - - - - 151,966Paydowns and maturities (852,052) (164,230) (216,861) (57,537) -Transfers from loans held for sale to loans held in portfolio - - (83,894) 83,894 -Loan foreclosures transferred to other real estate owned - - (5,884) (63,832) -Level 3 transfers, net 708,987 879,230 406,920 - (3,595,627)
Ending balance December 31, 2008 $1,391,385 $1,489,604 $487,445 $270,342 ($3,496,261)
The amount of total losses for the year ended December 31, 2008 included inearnings attributable to the change in unrealized gains/(losses) relating toinstruments still held at December 31, 2008 ($208,377) 1 ($45,098) 2 ($70,975) 3 ($26,804) 4 ($52,699) 1
1Amounts included in earnings are recorded in trading account profits and commissions.2Amounts included in earnings are recorded in net securities gains/(losses).3Amounts included in earnings are recorded in mortgage production related income.4Amounts are generally included in mortgage production income except $4.2 million in the year ended December 31, 2008, related to loans acquired in the GB&T acquisition. Themark on the loans is included in trading account profits and commissions.5Amounts included in earnings do not include losses accrued as a result of the ARS settlement discussed in Note 21 “Contingencies,” to the Consolidated Financial Statements.6Amount recorded in other comprehensive income is the effective portion of the Cash Flow hedges related to the Company’s probable forecasted sale of its shares of the Coca-ColaCompany stock as discussed in Note 17 “Derivative Financial Instruments,” to the Consolidated Financial Statements.
The following tables show a reconciliation of the beginning and ending balances for fair valued other assets/(liabilities),which are IRLCs on residential mortgage LHFS, measured using significant unobservable inputs:
(Dollars in thousands)Other Assets/
(Liabilities), net
Beginning balance January 1, 2008 ($19,603)Included in earnings: 1
Issuances (inception value) 491,170Fair value changes (71,127)Expirations (143,701)
Settlements of IRLCs and transfers into closed loans (184,318)
Ending balance December 31, 2008 2 $72,421
1Amounts included in earnings are recorded in mortgage production related income.2 The amount of total gains/(losses) for the period included in earnings attributable to the change in unrealized gains or losses relating toIRLCs still held at December 31, 2008.
148
SUNTRUST BANKS, INC.Notes to Consolidated Financial Statements (Continued)
The following tables present the difference between the aggregate fair value and the aggregate unpaid principal balance oftrading assets, loans, LHFS, brokered deposits, and long-term debt instruments for which the FVO has been elected. Forloans and LHFS for which the FVO has been elected, the tables also include the difference between aggregate fair value andthe aggregate unpaid principal balance of loans that are 90 days or more past due, as well as loans in nonaccrual status.
(Dollars in thousands)
AggregateFair Value
December 31, 2009
Aggregate UnpaidPrincipal
Balance under FVODecember 31, 2009
Fair valueover/(under)
unpaid principal
Trading assets $286,544 $261,693 $24,851Loans 397,764 453,751 (55,987)
Past due loans of 90 days or more 4,697 8,358 (3,661)Nonaccrual loans 46,259 83,396 (37,137)
Loans held for sale 2,889,111 2,874,578 14,533Past due loans of 90 days or more 3,288 4,929 (1,641)Nonaccrual loans 30,976 52,019 (21,043)
Brokered deposits 1,260,505 1,319,901 (59,396)Long-term debt 3,585,892 3,613,085 (27,193)
(Dollars in thousands)
AggregateFair Value
December 31, 2008
AggregateUnpaid Principal
Balance under FVODecember 31, 2008
Fair valueover/(under)
unpaid principal
Trading assets $852,300 $861,239 ($8,939)Loans 222,221 247,098 (24,877)
Past due loans of 90 days or more 2,018 2,906 (888)Nonaccrual loans 46,103 81,618 (35,515)
Loans held for sale 2,392,286 2,408,392 (16,106)Past due loans of 90 days or more 4,663 7,222 (2,559)Nonaccrual loans 27,483 47,228 (19,745)
Brokered deposits 587,486 627,737 (40,251)Long-term debt 7,155,684 6,963,085 192,599
Fair Value of Financial Instruments
The carrying amounts and fair values of the Company’s financial instruments at December 31 were as follows:
2009 2008
(Dollars in thousands)CarryingAmount Fair Value
CarryingAmount Fair Value
Financial assetsCash and cash equivalents $6,997,171 $6,997,171 (a) $6,637,402 $6,637,402 (a)Trading assets 4,979,938 4,979,938 (b) 10,396,269 10,396,269 (b)Securities available for sale 28,477,042 28,477,042 (b) 19,696,537 19,696,537 (b)Loans held for sale 4,669,823 4,681,915 (c) 4,032,128 4,032,128 (c)Total loans 113,674,844 113,674,844 126,998,443 126,998,443Interest/credit adjustment (3,120,000) (4,121,806) (2,350,996) (4,369,121)
Subtotal 110,554,844 109,553,038 (d) 124,647,447 122,629,322 (d)Market risk/liquidity adjustment - (7,815,567) - (11,731,290)
Loans, net $110,554,844 $101,737,471 (d) $124,647,447 $110,898,032 (d)
Financial liabilitiesConsumer and commercial deposits $116,303,452 $116,607,808 (e) $105,275,707 $105,770,657 (e)Brokered deposits 4,231,530 4,160,835 (f) 7,667,167 7,586,427 (f)Foreign deposits 1,328,584 1,328,584 (f) 385,510 385,510 (f)Short-term borrowings 5,365,368 5,355,625 (f) 9,479,750 9,479,750 (f)Long-term debt 17,489,516 16,701,653 (f) 26,812,381 25,878,644 (f)Trading liabilities 2,188,923 2,188,923 (b) 3,240,784 3,240,784 (b)
149
SUNTRUST BANKS, INC.Notes to Consolidated Financial Statements (Continued)
The following methods and assumptions were used by the Company in estimating the fair value of financial instruments. See“Level 3 Instruments” in this footnote for a more detailed discussion of the methods and assumptions used to value theCompany’s level 3 instruments:
(a) Cash and cash equivalents are valued at their carrying amounts reported in the balance sheet, which are reasonableestimates of fair value due to the relatively short period to maturity of the instruments.
(b) Securities available for sale, trading assets, and trading liabilities are generally valued based on quoted marketprices or, if quoted market prices are not available, on quoted market prices of similar instruments. In instanceswhen significant valuation assumptions are not readily observable in the market, instruments are valued based onthe best available data in order to approximate fair value. This data may be internally-developed and considers riskpremiums that a market participant would require under then-current market conditions.
(c) LHFS are generally valued based on observable current market prices or, if quoted market prices are not available,on quoted market prices of similar instruments. In instances when significant valuation assumptions are not readilyobservable in the market, instruments are valued based on the best available data in order to approximate fair value.This data may be internally-developed and considers risk premiums that a market participant would require underthen-current market conditions.
(d) Loan fair values are based on a hypothetical exit price, which does not represent the estimated intrinsic value of theloan if held for investment. The assumptions used are expected to approximate those that a market participantpurchasing the loans would use to value the loans, including a market risk premium and liquidity discount.Estimating the fair value of the loan portfolio when loan sales and trading markets are illiquid, or for certain loantypes, nonexistent, requires significant judgment. Therefore, the estimated fair value can vary significantlydepending on a market participant’s ultimate considerations and assumptions. The final value yields a marketparticipant’s expected return on investment that is indicative of the current market conditions, but it does not takeinto consideration the Company’s estimated value from continuing to hold these loans or its lack of willingness totransact at these estimated values.
The Company estimated fair value based on estimated future cash flows discounted, initially, at current originationrates for loans with similar terms and credit quality, which derived an estimated value of approximately 99% and98% on the loan portfolio’s net carrying value as of December 31, 2009 and December 31, 2008, respectively. Thevalue derived from origination rates likely does not represent an exit price due to the current distressed marketconditions; therefore, an incremental market risk and liquidity discount, was subtracted from the initial value toreflect the illiquid market conditions as of December 31, 2009 and December 31, 2008, respectively. Thediscounted value is a function of a market participant’s required yield in the current environment and is not areflection of the expected cumulative losses on the loans. Loan prepayments are used to adjust future cash flowsbased on historical experience and prepayment model forecasts. The carrying amount of accrued interestapproximates its fair value. The value of long-term customer relationships is not permitted under U.S. GAAP to beincluded in the estimated fair value.
(e) Deposit liabilities with no defined maturity such as demand deposits, NOW/money market accounts, and savingsaccounts have a fair value equal to the amount payable on demand at the reporting date (i.e., their carryingamounts). Fair values for certificates of deposit are estimated using a discounted cash flow calculation that appliescurrent interest rates to a schedule of aggregated expected maturities. The assumptions used in the discounted cashflow analysis are expected to approximate those that market participants would use in valuing deposits. The valueof long-term relationships with depositors is not taken into account in estimating fair values.
(f) Fair values for foreign deposits, brokered deposits, short-term borrowings, and long-term debt are based on quotedmarket prices for similar instruments or estimated using discounted cash flow analysis and the Company’s currentincremental borrowing rates for similar types of instruments.
Note 21 – Contingencies
The Company and its subsidiaries are parties to numerous claims and lawsuits arising in the course of their normal businessactivities, some of which involve claims for substantial amounts. The Company’s experience has shown that the damagesoften alleged by plaintiffs or claimants are grossly overstated, unsubstantiated by legal theory, or bear no relation to theultimate award that a court might grant. In addition, valid legal defenses, such as statutes of limitations, frequently result injudicial findings of no liability by the Company. Because of these factors, the Company cannot provide a meaningfulestimate of the range of reasonably possible outcomes of claims in the aggregate or by individual claim. However, it is theopinion of management that liabilities arising from these claims in excess of the amounts currently accrued, if any, will nothave a material impact to the Company’s financial condition or results of operations.
150
SUNTRUST BANKS, INC.Notes to Consolidated Financial Statements (Continued)
In September 2008, STRH and STIS entered into an “agreement in principle” with FINRA related to the sales and brokeringof ARS by STRH and STIS regardless of whether any claims had been asserted by the investor. This agreement isnon-binding and is subject to the negotiation of a final settlement. At this time there is no final settlement with FINRA, andFINRA has resumed its investigation. Notwithstanding that fact, the Company announced in November 2008 that it wouldmove forward with ARS purchases from essentially the same categories of investors who would have been covered by theoriginal agreement with FINRA. Additionally, the Company has elected to purchase ARS from certain other investors notaddressed by the agreement. As of December 31, 2009, the Company has already purchased approximately $548.2 million ofARS and is expected to purchase approximately $92.2 million in additional ARS. As of December 31, 2009, the Companyhas repurchased approximately 86% of the securities it intended to purchase. The fair value of ARS purchased pursuant tothe pending settlement, net of redemptions and calls, is approximately $176.4 million and $133.1 million in trading securitiesand $156.4 million and $48.2 million in available for sale securities, at December 31, 2009 and December 31, 2008,respectively. The Company has reserved for the remaining probable loss that could be reasonably estimated to beapproximately $33.1 million and $99.4 million at December 31, 2009 and December 31, 2008, respectively. The remainingloss amount represents the difference between the par amount and the estimated fair value of the remaining ARS that theCompany believes it will likely purchase from investors. This amount may change by the movement in fair market value ofthe underlying investment and therefore, can be impacted by changes in the performance of the underlying obligor orcollateral as well as general market conditions. The total gain relating to the ARS agreements recognized during the yearended December 31, 2009 was approximately $14.6 million, compared to a loss recognized during the year endedDecember 31, 2008 of $177.3 million. These amounts are comprised of trading gains or losses on probable future purchases,trading losses on ARS classified as trading securities that were purchased from investors, securities gains on calls andredemptions of available for sale securities that were purchased from investors, and estimated fines levied against STRH andSTIS by various federal and state agencies. Due to the pass-through nature of these security purchases, the economic loss hasbeen included in the Corporate Other and Treasury segment.
Note 22 - Business Segment Reporting
The Company has four business segments used to measure business activities: Retail and Commercial, Corporate andInvestment Banking, Household Lending, and Wealth and Investment Management with the remainder in Corporate Otherand Treasury. Beginning in 2009, the segment reporting structure was adjusted in the following ways:
1. The management of Consumer Lending was combined with Mortgage to create Household Lending. ConsumerLending, which includes student lending, indirect auto, and other specialty consumer lending units, was previouslya part of Retail and Commercial. This change will enable the Company to provide a strategic framework for allconsumer lending products and will also create operational efficiencies.
2. Commercial Real Estate is now a part of Retail and Commercial as Commercial and Commercial Real Estateclients have similar needs due to their comparable size and because the management structure is geographicallybased. Previously, Commercial Real Estate was combined with Corporate and Investment Banking in WholesaleBanking.
Retail and Commercial serves consumers and businesses with up to $100 million in annual revenue. Retail and Commercialprovides services to clients through an extensive network of traditional and in-store branches, ATMs, the internet(www.suntrust.com), and the telephone (1-800-SUNTRUST). Financial products and services offered to consumers includeconsumer deposits, home equity lines, consumer lines, and other fee-based products. The business also serves commercialclients including business banking clients, government/not-for-profit enterprises, as well as commercial and residentialdevelopers and investors. Financial products and services offered to business clients include commercial and commercial realestate lending, financial risk management, insurance premium financing, treasury and payment solutions includingcommercial card services, as well as specialized commercial real estate investments delivered through SunTrust CommunityCapital. Retail and Commercial also serves as an entry point and provides services for other lines of business. When clientneeds change and expand, Retail and Commercial refers clients to our Wealth and Investment Management, Corporate andInvestment Banking, and the Household Lending lines of business.
Corporate and Investment Banking serves clients in the large and middle corporate and commercial markets. The CorporateBanking Group generally serves clients with greater than $750 million in annual revenue and is focused on selected industrysectors: consumer and retail, diversified, energy, financial services and technology, and healthcare. The Middle MarketGroup generally serves clients with annual revenue ranging from $100 million to $750 million and is more geographicallyfocused. Through SunTrust Robinson Humphrey, Corporate and Investment Banking provides an extensive range of
151

SUNTRUST BANKS, INC.Notes to Consolidated Financial Statements (Continued)
investment banking products and services to its clients, including strategic advice, capital raising, and financial riskmanagement. These investment banking products and services are also provided to Commercial and Wealth and InvestmentManagement clients. In addition, Corporate and Investment Banking offers traditional lending, leasing, treasury managementservices and institutional investment management to its clients.
Household Lending offers residential mortgages, home equity lines and loans, indirect auto, student, bank card and otherconsumer loan products. Loans are originated through the Company’s extensive network of traditional and in-store retailbranches, via the internet (www.suntrust.com), and by phone (1-800-SUNTRUST). Residential mortgage loans are alsooriginated nationally through the Company’s wholesale and correspondent channels. These products are either sold in thesecondary market – primarily with servicing rights retained – or held in the Company’s loan portfolio. The line of businessservices loans for itself, for other SunTrust lines of business, and for other investors, and operates a tax service subsidiary(ValuTree Real Estate Services, LLC).
Wealth and Investment Management provides a full array of wealth management products and professional services to bothindividual and institutional clients. Wealth and Investment Management’s primary businesses include PWM, GenSpring, IIS,and RidgeWorth.
The PWM group offers brokerage, professional investment management, and trust services to clients seeking activemanagement of their financial resources. PWM includes the Private Banking group which offers a full array of loan anddeposit products to clients. PWM also includes SunTrust Investment Services which offers discount/online and full servicebrokerage services to individual clients.
GenSpring provides family office solutions to ultra high net worth individuals and their families. Utilizing teams of multi-disciplinary specialists with expertise in investments, tax, accounting, estate planning and other wealth managementdisciplines, GenSpring helps families manage and sustain their wealth across multiple generations.
Institutional Investment Solutions is comprised of Employee Benefit Solutions, Foundations & Endowments SpecialtyGroup, Corporate Agency Services, as well as STIAA. Employee Benefit Solutions provides administration and custodyservices for defined benefit and defined contribution plans as well as administration services for non-qualified deferredcompensation plans. Foundations & Endowments provides bundled administrative and investment solutions (includingplanned giving, charitable trustee, and foundation grant administration services) for non-profit organizations. CorporateAgency Services targets corporations, governmental entities and attorneys requiring escrow services. STIAA providesportfolio construction and manager due diligence services to other units within IIS to facilitate the delivery of investmentmanagement services to their clients.
RidgeWorth, an SEC registered investment advisor, serves as investment manager for the RidgeWorth Funds as well asindividual clients. RidgeWorth is also a holding company with ownership in other institutional asset management boutiquesoffering a wide array of equity, alternative, fixed income, and liquidity management capabilities. These boutiques includeAlpha Equity Management, Ceredex Value Advisors, Certium Asset Management, IronOak Advisors, Seix, Silvant CapitalManagement, and StableRiver Capital Management.
In addition, the Company reports Corporate Other and Treasury, which includes the investment securities portfolio, long-term debt, end user derivative instruments, short-term liquidity and funding activities, balance sheet risk management, andmost real estate assets. Other components include Enterprise Information Services, which is the primary data processing andoperations group; the Corporate Real Estate group, Marketing, SunTrust Online, Human Resources, Finance, Corporate RiskManagement, Legal and Compliance, Branch Operations, Corporate Strategies, Procurement, and Executive Management.Finally, Corporate Other and Treasury also includes Trustee Management, which provides treasury management and depositservices to bankruptcy trustees.
Because the business segment results are presented based on management accounting practices, the transition to theconsolidated results, which are prepared under U.S. GAAP, creates certain differences which are reflected in ReconcilingItems.
For business segment reporting purposes, the basis of presentation in the accompanying discussion includes the following:
• Net interest income – All net interest income is presented on a FTE basis. The revenue gross-up has been appliedto tax-exempt loans and investments to make them comparable to other taxable products. The segments have alsobeen matched maturity funds transfer priced, generating credits or charges based on the economic value or cost
152

SUNTRUST BANKS, INC.Notes to Consolidated Financial Statements (Continued)
created by the assets and liabilities of each segment. The mismatch between funds credits and funds charges at thesegment level resides in Reconciling Items. The change in the matched maturity funds mismatch is generallyattributable to the corporate balance sheet management strategies.
• Provision for credit losses - Represents net charge-offs by segment. The difference between the segment netcharge-offs and the consolidated provision for credit losses is reported in Reconciling Items.
• Provision/(benefit) for income taxes - Calculated using a nominal income tax rate for each segment. Thiscalculation includes the impact of various income adjustments, such as the reversal of the FTE gross up ontax-exempt assets, tax adjustments, and credits that are unique to each business segment. The difference betweenthe calculated provision/(benefit) for income taxes at the segment level and the consolidated provision/(benefit) forincome taxes is reported in Reconciling Items.
The Company continues to augment its internal management reporting methodologies. Currently, the segment’s financialperformance is comprised of direct financial results as well as various allocations that for internal management reportingpurposes provide an enhanced view of analyzing the segment’s financial performance. The internal allocations include thefollowing:
• Operational Costs – Expenses are charged to the segments based on various statistical volumes multiplied byactivity based cost rates. As a result of the activity based costing process, planned residual expenses are alsoallocated to the segments. The recoveries for the majority of these costs are in the Corporate Other and Treasurysegment.
• Support and Overhead Costs – Expenses not directly attributable to a specific segment are allocated based onvarious drivers (e.g., number of full-time equivalent employees and volume of loans and deposits). The recoveriesfor these allocations are in Corporate Other and Treasury.
• Sales and Referral Credits – Segments may compensate another segment for referring or selling certain products.The majority of the revenue resides in the segment where the product is ultimately managed.
The application and development of management reporting methodologies is a dynamic process and is subject to periodicenhancements. The implementation of these enhancements to the internal management reporting methodology maymaterially affect the results disclosed for each segment with no impact on consolidated results. Whenever significant changesto management reporting methodologies take place, the impact of these changes is quantified and prior period information isreclassified wherever practicable.
Twelve Months Ended December 31, 2009
(Dollars in thousands)Retail and
Commercial
Corporateand
InvestmentBanking
HouseholdLending
Wealth andInvestment
Management
CorporateOther andTreasury
ReconcilingItems Consolidated
Average total assets $56,409,092 $30,897,635 $51,221,820 $8,984,057 $26,690,861 $1,238,958 $175,442,423Average total liabilities 93,395,855 14,571,273 3,935,072 11,356,812 29,750,582 146,736 153,156,330Average total equity - - - - - 22,286,093 22,286,093
Net interest income $2,345,576 $316,759 $780,190 $303,954 $419,581 $299,630 $4,465,690Fully taxable-equivalent adjustment (FTE) 37,269 72,530 - 17 14,054 (581) 123,289
Net interest income (FTE)1 2,382,845 389,289 780,190 303,971 433,635 299,049 4,588,979Provision for credit losses2 1,175,241 298,164 1,683,450 79,166 1,690 826,203 4,063,914
Net interest income after provision for credit losses 1,207,604 91,125 (903,260) 224,805 431,945 (527,154) 525,065Noninterest income 1,362,990 700,073 727,682 748,551 202,155 (31,173) 3,710,278Noninterest expense 3,292,965 559,718 1,785,327 863,061 92,908 (31,571) 6,562,408
Income/(loss) before provision/(benefit) for income taxes (722,371) 231,480 (1,960,905) 110,295 541,192 (526,756) (2,327,065)Provision/(benefit) for income taxes3 (241,060) 86,893 (593,021) 42,434 128,563 (199,303) (775,494)
Net income/(loss) including income attributable tononcontrolling interest (481,311) 144,587 (1,367,884) 67,861 412,629 (327,453) (1,551,571)
Net income attributable to noncontrolling interest - - 2,971 (7) 9,148 - 12,112
Net income/(loss) ($481,311) $144,587 ($1,370,855) $67,868 $403,481 ($327,453) ($1,563,683)
153
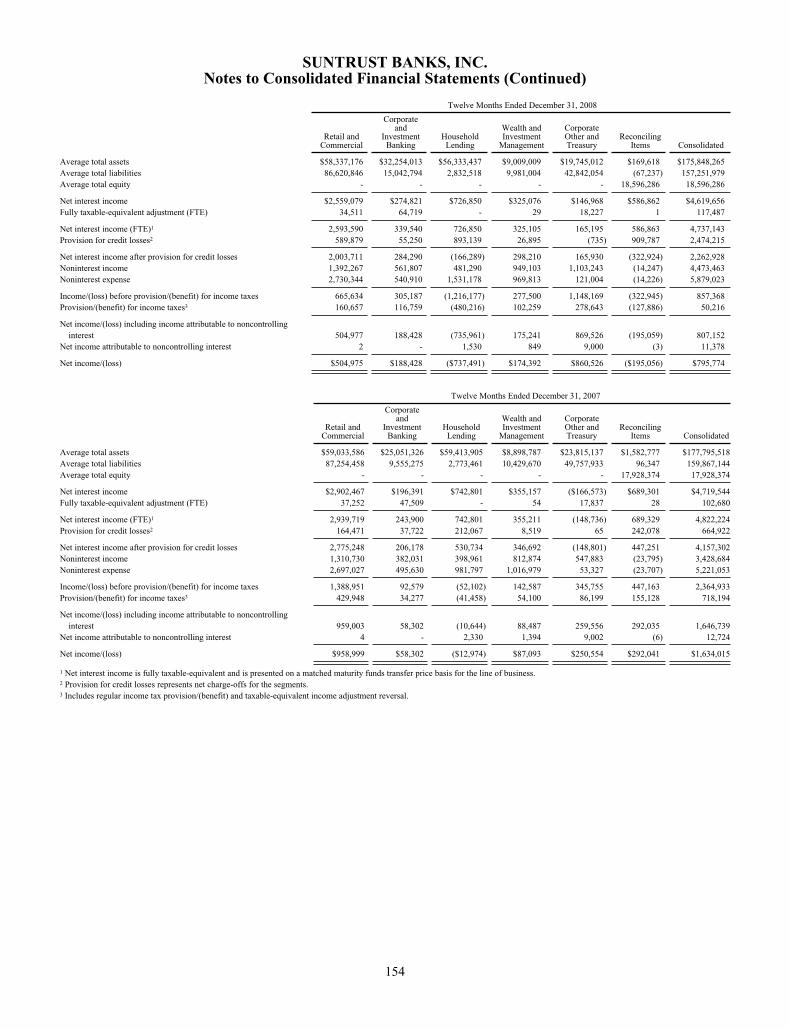
SUNTRUST BANKS, INC.Notes to Consolidated Financial Statements (Continued)
Twelve Months Ended December 31, 2008
Retail andCommercial
Corporateand
InvestmentBanking
HouseholdLending
Wealth andInvestment
Management
CorporateOther andTreasury
ReconcilingItems Consolidated
Average total assets $58,337,176 $32,254,013 $56,333,437 $9,009,009 $19,745,012 $169,618 $175,848,265Average total liabilities 86,620,846 15,042,794 2,832,518 9,981,004 42,842,054 (67,237) 157,251,979Average total equity - - - - - 18,596,286 18,596,286
Net interest income $2,559,079 $274,821 $726,850 $325,076 $146,968 $586,862 $4,619,656Fully taxable-equivalent adjustment (FTE) 34,511 64,719 - 29 18,227 1 117,487
Net interest income (FTE)1 2,593,590 339,540 726,850 325,105 165,195 586,863 4,737,143Provision for credit losses2 589,879 55,250 893,139 26,895 (735) 909,787 2,474,215
Net interest income after provision for credit losses 2,003,711 284,290 (166,289) 298,210 165,930 (322,924) 2,262,928Noninterest income 1,392,267 561,807 481,290 949,103 1,103,243 (14,247) 4,473,463Noninterest expense 2,730,344 540,910 1,531,178 969,813 121,004 (14,226) 5,879,023
Income/(loss) before provision/(benefit) for income taxes 665,634 305,187 (1,216,177) 277,500 1,148,169 (322,945) 857,368Provision/(benefit) for income taxes3 160,657 116,759 (480,216) 102,259 278,643 (127,886) 50,216
Net income/(loss) including income attributable to noncontrollinginterest 504,977 188,428 (735,961) 175,241 869,526 (195,059) 807,152
Net income attributable to noncontrolling interest 2 - 1,530 849 9,000 (3) 11,378
Net income/(loss) $504,975 $188,428 ($737,491) $174,392 $860,526 ($195,056) $795,774
Twelve Months Ended December 31, 2007
Retail andCommercial
Corporateand
InvestmentBanking
HouseholdLending
Wealth andInvestment
Management
CorporateOther andTreasury
ReconcilingItems Consolidated
Average total assets $59,033,586 $25,051,326 $59,413,905 $8,898,787 $23,815,137 $1,582,777 $177,795,518Average total liabilities 87,254,458 9,555,275 2,773,461 10,429,670 49,757,933 96,347 159,867,144Average total equity - - - - - 17,928,374 17,928,374
Net interest income $2,902,467 $196,391 $742,801 $355,157 ($166,573) $689,301 $4,719,544Fully taxable-equivalent adjustment (FTE) 37,252 47,509 - 54 17,837 28 102,680
Net interest income (FTE)1 2,939,719 243,900 742,801 355,211 (148,736) 689,329 4,822,224Provision for credit losses2 164,471 37,722 212,067 8,519 65 242,078 664,922
Net interest income after provision for credit losses 2,775,248 206,178 530,734 346,692 (148,801) 447,251 4,157,302Noninterest income 1,310,730 382,031 398,961 812,874 547,883 (23,795) 3,428,684Noninterest expense 2,697,027 495,630 981,797 1,016,979 53,327 (23,707) 5,221,053
Income/(loss) before provision/(benefit) for income taxes 1,388,951 92,579 (52,102) 142,587 345,755 447,163 2,364,933Provision/(benefit) for income taxes3 429,948 34,277 (41,458) 54,100 86,199 155,128 718,194
Net income/(loss) including income attributable to noncontrollinginterest 959,003 58,302 (10,644) 88,487 259,556 292,035 1,646,739
Net income attributable to noncontrolling interest 4 - 2,330 1,394 9,002 (6) 12,724
Net income/(loss) $958,999 $58,302 ($12,974) $87,093 $250,554 $292,041 $1,634,015
1 Net interest income is fully taxable-equivalent and is presented on a matched maturity funds transfer price basis for the line of business.2 Provision for credit losses represents net charge-offs for the segments.3 Includes regular income tax provision/(benefit) and taxable-equivalent income adjustment reversal.
154

SUNTRUST BANKS, INC.Notes to Consolidated Financial Statements (Continued)
Note 23 - Accumulated Other Comprehensive Income
(Dollars in thousands)Pre-taxAmount
Income Tax(Expense)
BenefitAfter-taxAmount
Accumulated Other Comprehensive IncomeAccumulated other comprehensive income, January 1, 2007 $1,398,409 ($472,460) $925,949
Unrealized net gain on securities 666,387 (253,227) 413,160Unrealized net gain on derivatives 240,816 (91,510) 149,306Change related to employee benefit plans 113,550 (43,149) 70,401Adoption of fair value election 231,211 (83,837) 147,374Pension plan changes and resulting remeasurement 128,560 (48,853) 79,707Reclassification adjustment for realized gains and losses on securities (272,861) 103,687 (169,174)Reclassification adjustment for realized gains and losses on derivatives (15,442) 5,868 (9,574)
Accumulated other comprehensive income, December 31, 2007 2,490,630 (883,481) 1,607,149Unrealized net gain on securities (238,013) 186,343 (51,670)Unrealized net gain on derivatives 1,337,260 (535,772) 801,488Change related to employee benefit plans (812,782) 304,857 (507,925)Reclassification adjustment for realized gains and losses on securities (1,073,300) 318,384 (754,916)Reclassification adjustment for realized gains and losses on derivatives (180,689) 67,688 (113,001)
Accumulated other comprehensive income, December 31, 2008 1,523,106 (541,981) 981,125Unrealized net gain on securities 528,976 (187,482) 341,494Unrealized net gain on derivatives (189,690) 58,309 (131,381)Change related to employee benefit plans 394,085 (142,873) 251,212Adoption of OTTI guidance (12,339) 4,624 (7,715)Reclassification adjustment for realized gains and losses on securities (98,019) 36,861 (61,158)Reclassification adjustment for realized gains and losses on derivatives (485,593) 182,179 (303,414)
Accumulated other comprehensive income, December 31, 2009 $1,660,526 ($590,363) $1,070,163
The components of AOCI at December 31 were as follows:
(Dollars in thousands) 2009 2008 2007
Unrealized net gain on available for sale securities $1,159,982 $887,361 $1,693,947Unrealized net gain on derivative financial instruments 412,320 847,115 158,628Employee benefit plans (502,139) (753,351) (245,426)
Total accumulated other comprehensive income $1,070,163 $981,125 $1,607,149
Note 24 - Other Noninterest Expense
Other noninterest expense in the Consolidated Statements of Income/(Loss) includes:
Twelve Months EndedDecember 31
(Dollars in thousands) 2009 2008 2007
Postage and delivery $83,870 $90,055 $93,182Communications 67,385 69,417 79,028Consulting and legal 57,518 58,639 101,223Other staff expense 50,845 70,313 132,496Operating supplies 41,000 44,257 48,745Other expense 329,473 328,110 364,086
Total other noninterest expense $630,091 $660,791 $818,760
155
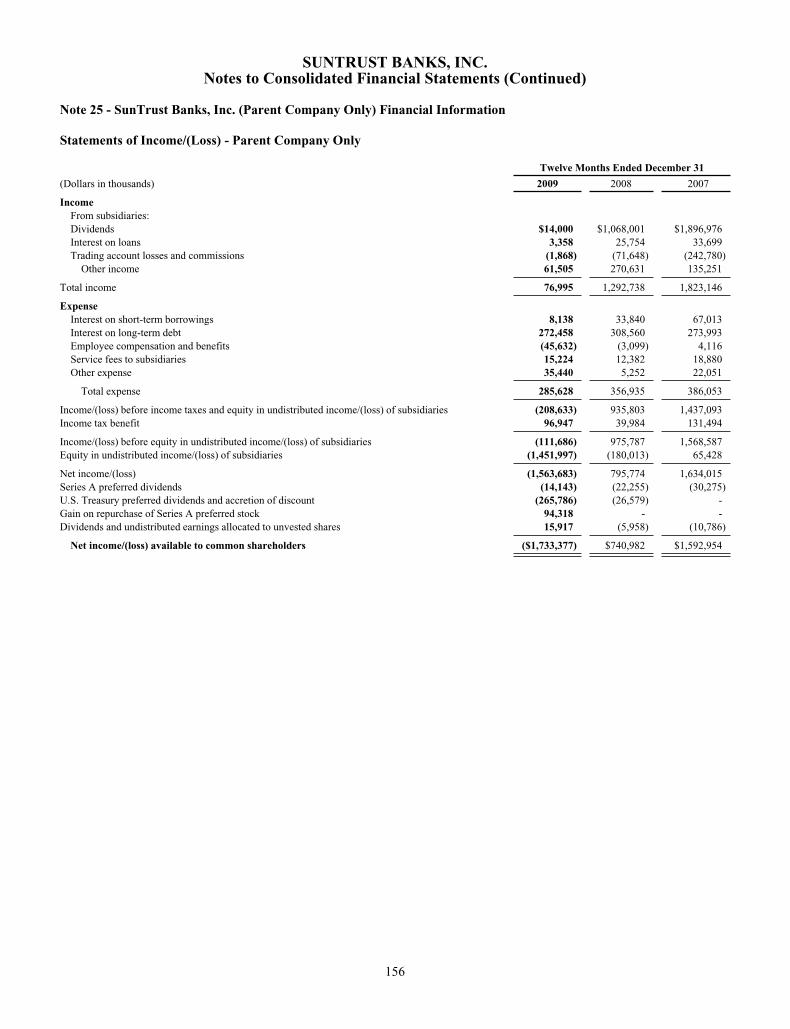
SUNTRUST BANKS, INC.Notes to Consolidated Financial Statements (Continued)
Note 25 - SunTrust Banks, Inc. (Parent Company Only) Financial Information
Statements of Income/(Loss) - Parent Company Only
Twelve Months Ended December 31
(Dollars in thousands) 2009 2008 2007
IncomeFrom subsidiaries:Dividends $14,000 $1,068,001 $1,896,976Interest on loans 3,358 25,754 33,699Trading account losses and commissions (1,868) (71,648) (242,780)
Other income 61,505 270,631 135,251
Total income 76,995 1,292,738 1,823,146
ExpenseInterest on short-term borrowings 8,138 33,840 67,013Interest on long-term debt 272,458 308,560 273,993Employee compensation and benefits (45,632) (3,099) 4,116Service fees to subsidiaries 15,224 12,382 18,880Other expense 35,440 5,252 22,051
Total expense 285,628 356,935 386,053
Income/(loss) before income taxes and equity in undistributed income/(loss) of subsidiaries (208,633) 935,803 1,437,093Income tax benefit 96,947 39,984 131,494
Income/(loss) before equity in undistributed income/(loss) of subsidiaries (111,686) 975,787 1,568,587Equity in undistributed income/(loss) of subsidiaries (1,451,997) (180,013) 65,428
Net income/(loss) (1,563,683) 795,774 1,634,015Series A preferred dividends (14,143) (22,255) (30,275)U.S. Treasury preferred dividends and accretion of discount (265,786) (26,579) -Gain on repurchase of Series A preferred stock 94,318 - -Dividends and undistributed earnings allocated to unvested shares 15,917 (5,958) (10,786)
Net income/(loss) available to common shareholders ($1,733,377) $740,982 $1,592,954
156

SUNTRUST BANKS, INC.Notes to Consolidated Financial Statements (Continued)
Balance Sheets - Parent Company Only
December 31
(Dollars in thousands) 2009 2008
AssetsCash in subsidiary banks $1,235 $769Interest-bearing deposits in other banks 2,793,649 6,311,919
Cash and cash equivalents 2,794,884 6,312,688Trading assets 340,938 337,499Securities available for sale 5,643,734 246,850Loans to subsidiaries 699,202 984,303Investment in capital stock of subsidiaries stated on the basis of the
Company’s equity in subsidiaries’ capital accounts:Banking subsidiaries 19,021,759 20,469,508Nonbanking subsidiaries 1,136,737 929,726
Premises and equipment 1,160 1,356Goodwill 99,355 98,905Other assets 393,013 460,310
Total assets $30,130,782 $29,841,145
Liabilities and Shareholders’ EquityShort-term borrowings from:
Subsidiaries $271,936 $86,161Non-affiliated companies 1,362,922 1,104,555
Long-term debt 5,473,682 5,676,349Other liabilities 599,583 585,971
Total liabilities 7,708,123 7,453,036
Preferred stock 4,917,312 5,221,703Common stock 514,667 372,799Additional paid in capital 8,521,042 6,904,644Retained earnings 8,562,807 10,388,984Treasury stock, at cost, and other (1,163,332) (1,481,146)Accumulated other comprehensive income 1,070,163 981,125
Total shareholders’ equity 22,422,659 22,388,109
Total liabilities and shareholders’ equity $30,130,782 $29,841,145
157

SUNTRUST BANKS, INC.Notes to Consolidated Financial Statements (Continued)
Statements of Cash Flow – Parent Company Only
Year Ended December 31
(Dollars in thousands) 2009 2008 2007
Cash Flows from Operating Activities:Net income/(loss) ($1,563,683) $795,774 $1,634,015Adjustments to reconcile net loss to net cash used in operating activities:
Net gain on sale of businesses - (200,851) -Equity in undistributed loss/(income) of subsidiaries 1,451,997 180,013 (65,428)Depreciation, amortization and accretion 11,990 4,410 1,028Stock based compensation 11,406 20,185 24,275Deferred income tax provision/(benefit) 23,066 (32,725) 17,701Excess tax benefits from stock-based compensation (387) (4,580) (11,259)Net loss on extinguishment of debt 31,432 - -Amortization of restricted stock compensation 66,420 76,656 34,820Net securities gains (7,378) (448) -
Contributions to retirement plans (25,666) (64,016) (11,185)Net decrease in other assets 49,693 241,423 27,145Net (decrease)/increase in other liabilities 47,933 (95,978) (272,472)
Net cash provided by operating activities 96,823 919,863 1,378,640
Cash Flows from Investing Activities:Proceeds from sale of businesses - 314,146 -Net cash equivalents acquired in acquisitions - 1,707 -Proceeds from maturities, calls and repayments of securities available for sale 80,863 16,713 37,355Proceeds from sales of securities available for sale 38,035 - -Purchases of securities available for sale (5,540,615) (47,237) (214,005)Proceeds from maturities, calls and repayments of trading securities 128,754 518,600 195,235Proceeds from sales of trading securities 9,475 402,020 211Purchases of trading securities (86,559) (214,693) (1,205,136)Net change in loans to subsidiaries 133,568 47,574 (241,583)Capital contributions to subsidiaries (20) (268,245) (9,812)Other, net 2,436 844 904
Net cash (used in)/provided by investing activities (5,234,063) 771,429 (1,436,831)
Cash Flows from Financing Activities:Net increase/(decrease) in other short-term borrowings 444,142 (1,245,076) 1,594,733Redemption of real estate investment trust security - - (424,923)Proceeds from the issuance of long-term debt 574,560 1,549,800 1,000,000Repayment of long-term debt (672,591) (959,372) (900,572)Proceeds from the issuance of preferred stock - 4,850,000 -Proceeds from the exercise of stock options - 25,569 186,000Acquisition of treasury stock - - (853,385)Excess tax benefits from stock-based compensation 387 4,580 11,259Proceeds from the issuance of common stock 1,829,735 - -Repurchase of preferred stock (228,124) - -Dividends paid (328,673) (1,041,470) (1,056,869)
Net cash provided by/(used in) financing activities 1,619,436 3,184,031 (443,757)
Net increase/(decrease) in cash and cash equivalents (3,517,804) 4,875,323 (501,948)Cash and cash equivalents at beginning of period 6,312,688 1,437,365 1,939,313
Cash and cash equivalents at end of period $2,794,884 $6,312,688 $1,437,365
Supplemental Disclosures:Income taxes received from subsidiaries $124,560 $332,802 $734,078Income taxes paid by Parent Company (710) (313,647) (703,653)
Net income taxes received by Parent Company $123,850 $19,155 $30,425
Interest paid $274,663 $332,481 $344,691Issuance of common stock for acquisition of GB&T - 154,513 -U.S. Treasury preferred dividends accrued but unpaid 10,777 7,778 -Accretion of U.S. Treasury preferred stock discount 23,098 3,732 -Extinguishment of forward stock purchase contract 173,653 - -Gain on repurchase of Series A preferred stock 94,318 - -Noncash capital contribution to subsidiary 151,533 - -
158

Item 9. CHANGES IN AND DISAGREEMENTS WITH ACCOUNTANTS ON ACCOUNTING ANDFINANCIAL DISCLOSURE
None.
Item 9A. Controls and Procedures
Evaluation of Disclosure Controls and Procedures
The Company conducted an evaluation, with the participation of its Chief Executive Officer and Chief Financial Officer, ofthe effectiveness of the Company’s disclosure controls and procedures as of December 31, 2009. The Company’s disclosurecontrols and procedures are designed to ensure that information required to be disclosed by the Company in the reports that itfiles or submits under the Securities Exchange Act of 1934 is recorded, processed, summarized, and reported on a timelybasis.
Based upon that evaluation, the Chief Executive Officer and Chief Financial Officer concluded, as of December 31, 2009,that the Company’s disclosure controls and procedures were effective in recording, processing, summarizing, and reportinginformation required to be disclosed by the Company, within the time periods specified in the SEC’s rules and forms, andsuch information is accumulated and communicated to management to allow timely decisions regarding required disclosures.
Management’s Report on Internal Control over Financial Reporting
Management is responsible for establishing and maintaining adequate internal control over financial reporting for theCompany. The Company’s internal control over financial reporting is a process designed under the supervision of theCompany’s Chief Executive Officer and Chief Financial Officer to provide reasonable assurance regarding the reliability offinancial reporting and the preparation of the Company’s financial statements for external purposes in accordance with U.S.generally accepted accounting principles.
Because of its inherent limitations, internal control over financial reporting may not prevent or detect misstatements. Also,projections of any evaluation of effectiveness to future periods are subject to the risk that controls may become inadequatebecause of changes in conditions, or that the degree of compliance with the policies or procedures may deteriorate.
Management has made a comprehensive review, evaluation, and assessment of the Company’s internal control over financialreporting as of December 31, 2009. In making its assessment of internal control over financial reporting, management usedthe criteria issued by the Committee of Sponsoring Organizations of the Treadway Commission in Internal Control-Integrated Framework. Based on that assessment, management concluded that, as of December 31, 2009, the Company’sinternal control over financial reporting is effective.
Changes in Internal Control over Financial Reporting
Management of the Company has evaluated, with the participation of the Company’s Chief Executive Officer and ChiefFinancial Officer, changes in the Company’s internal control over financial reporting (as defined in rules 13a-15(f) and15d-15(f) of the Exchange Act) during the quarter ended December 31, 2009. Based upon that evaluation, Management hasdetermined that there have been no changes to the Company’s internal control over financial reporting that occurred duringthe Company’s fourth quarter of 2009 that have materially affected, or are reasonably likely to materially affect, theCompany’s internal control over financial reporting.
Item 9B. OTHER INFORMATION
Amendments to Certain Compensation Plans. The Company made certain amendments to its compensation plans. Thefollowing summary of those amendments is qualified in its entirety by reference to the full terms and provisions of thoseplans, which are filed as exhibits to this report.
Effective January 1, 2010, the Company amended the MIP. The amendments added additional performance metrics uponwhich incentive awards might be determined. These performance goals will be presented to shareholders at the 2010 AnnualMeeting for approval. In addition, the amendments made ministerial and other changes to conform the plan to our otherplans. The plan, as amended and restated, is filed as exhibit 10.1 to this report.
Effective January 1, 2010, the Company amended the SunTrust Banks, Inc. SERP, the Crestar SERP and the SunTrustBanks, Inc. ERISA Excess Retirement Plan. The purpose of the amendments was to limit the dollar value of the 2010 Salary
159

Shares that may be included as base pay in the benefit calculations of certain officers. The intent is to ensure that SalaryShares will not result in increased benefits under these plans. These plans, as amended and restated, are filed as exhibits 10.7and 10.8 to this report.
Effective January 1, 2010, the Company amended its Change in Control Agreements with certain officers. The purpose of theamendments was to ensure that the Company’s payment of a portion of 2010 base pay in the form of Salary Shares to certainemployees will not result in an increase in benefits under these agreements. These agreements, as amended and restated, arefiled as exhibits 10.12 and 10.13 to this report.
Effective December 31, 2009, the Company merged the SunTrust Banks, Inc. 401(k) Excess Plan into the SunTrust Banks,Inc. Deferred Compensation Plan and amended and restated the Deferred Compensation Plan effective January 1, 2010. Thepurpose of the merger and subsequent amendment was to simplify the administration of executive deferrals and Companycontributions by combining all salary and bonus deferrals into a single plan and to clarify that no deferrals may be based on2010 Salary Shares. The Deferred Compensation Plan, as amended and restated, is filed as exhibit 10.10 to this report.
Changes to Long-Term Incentive Structure for Named Executive Officers. Presently, the Company remains subject to theexecutive compensation limits under EESA. As a result, the Company is limited to making long-term incentive awards in theform of long-term restricted stock of the Company in amounts not exceeding one-third of each employee’s annualcompensation. The Committee has elected to make such awards further conditioned on Company performance.
On February 19, 2010, the Compensation Committee of the Board of Directors of the Company (the “Committee”) approvedchanges to the long-term incentive structure for the Named Executive Officers and additional executives. The Committeecontinued its practice of tying a significant portion of its long-term awards to the Company’s performance, and increasedfrom 50% to 100% the portion of such awards which will be tied to corporate performance. For 2010, performance will bebased half on relative total shareholder return (TSR) on an annual basis and the remainder on net income available tocommon shareholders, return on equity (ROE), and the level of charge-offs.
The Committee has established threshold, target, and maximum performance levels for each of the performance metrics forfiscal 2010. Accomplishment of these performance levels will determine a number of shares of restricted stock which theCommittee potentially will award to each executive before the end of 2010. However, the actual number of shares to beawarded will be subject to the Committee’s negative discretion (can only reduce the number of shares that may be awarded).Further, in no case shall the maximum number of shares awarded exceed the compensation limits under EESA of one-thirdof the executive’s total annual compensation.
The Committee will measure achievement of the performance metrics in late December, 2010 and, after considering whetherto exercise negative discretion, will make long-term restricted stock grants to the executives at that time. In accordance withthe requirements of EESA, such grants will vest (100%) only after two years and after the Company’s repayment of TARP.The table below indicates each Named Executive Officer’s potential award at maximum performance.
Named Executive Officer
Potential Award atMaximum
Performance
James M. Wells III . . . . . . . . . . . . . . . . . . . . . . . . . . . . . . . . . . . . . . . . . . . . . . . . . . . . . . . . . . . . . . . . . . $2,033,650William H. Rogers, Jr . . . . . . . . . . . . . . . . . . . . . . . . . . . . . . . . . . . . . . . . . . . . . . . . . . . . . . . . . . . . . . . . $810,000Mark A. Chancy . . . . . . . . . . . . . . . . . . . . . . . . . . . . . . . . . . . . . . . . . . . . . . . . . . . . . . . . . . . . . . . . . . . . $705,000Thomas E. Freeman . . . . . . . . . . . . . . . . . . . . . . . . . . . . . . . . . . . . . . . . . . . . . . . . . . . . . . . . . . . . . . . . . $652,500David F. Dierker . . . . . . . . . . . . . . . . . . . . . . . . . . . . . . . . . . . . . . . . . . . . . . . . . . . . . . . . . . . . . . . . . . . . $490,000
Part III
Item 10. DIRECTORS, EXECUTIVE OFFICERS AND CORPORATE GOVERNANCE.
The information at the captions “Nominees for Directorship,” “Nominees for Terms Expiring in 2011,” “Executive Officers,”“Section 16(a) Beneficial Ownership Reporting Compliance,” “Corporate Governance and Director Independence,”“Shareholder Nominations for Election to the Board,” and “Board Committees” in the Registrant’s definitive proxy statementfor its annual meeting of shareholders to be held on April 27, 2010 and to be filed with the Commission is incorporated byreference into this Item 10.
Item 11. EXECUTIVE COMPENSATION.
The information at the captions “Compensation Policies that Affect Risk Management,” “Executive Compensation”(“Compensation Discussion and Analysis,” “Compensation Committee Report,” “Summary of Cash and Certain Other
160

Compensation and Other Payments to the Named Executive Officers,” “2009 Summary Compensation Table,” “2009 Grantsand Plan-Based Awards,” “Option Exercises and Stock Vested in 2009,” “Outstanding Equity Awards at December 31,2009,” “2009 Pension Benefits,” “2009 Nonqualified Deferred Compensation,” and “2009 Potential Payments UponTermination of Change in Control”), “2009 Director Compensation,” and “Compensation Committee Interlocks and InsiderParticipation” in the Registrant’s definitive proxy statement for its annual meeting of shareholders to be held on April 27,2010 and to be filed with the Commission is incorporated by reference into this Item 11.
Item 12. SECURITY OWNERSHIP OF CERTAIN BENEFICIAL OWNERS AND MANAGEMENT ANDRELATED STOCKHOLDER MATTERS.
The information at the captions “Equity Compensation Plans,” “Stock Ownership of Certain Persons” and “Stock Ownershipof Principal Shareholder” in the Registrant’s definitive proxy statement for its annual meeting of shareholders to be held onApril 27, 2010 and to be filed with the Commission is incorporated by reference into this Item 12.
Item 13. CERTAIN RELATIONSHIPS AND RELATED TRANSACTIONS, AND DIRECTOR INDEPENDENCE.
The information at the captions “Policies and Procedures for Approval of Related Party Transactions,” “Transactions withRelated Persons, Promoters, and Certain Control Persons,” and “Corporate Governance and Director Independence” in theRegistrant’s definitive proxy statement for its annual meeting of shareholders to be held on April 27, 2010 and to be filedwith the Commission is incorporated by reference into this Item 13.
Item 14. PRINCIPAL ACCOUNTANT FEES AND SERVICES.
The information at the captions “Audit Fees and Related Matters,” “Audit and Non-Audit Fees,” and “Audit CommitteePolicy for Pre-approval of Independent Auditor Services” in the Registrant’s definitive proxy statement for its annualmeeting of shareholders to be held on April 27, 2010 and to be filed with the Commission is incorporated by reference intothis Item 14.
PART IV
ITEM 15. EXHIBITS, FINANCIAL STATEMENT SCHEDULES
(a)(1) Financial Statements of SunTrust Banks, Inc. included in this report:
Consolidated Statements of Income/(Loss) for the year ended December 31, 2009, 2008, and 2007;
Consolidated Balance Sheets as of December 31, 2009, and 2008;Consolidated Statements of Shareholders’ Equity as of December 31, 2009, 2008, and 2007; andConsolidated Statements of Cash Flows for the year ended December 31, 2009, 2008, and 2007.
(a)(2) Financial Statement Schedules
All financial statement schedules for the Company have been included in the Consolidated Financial Statements on therelated footnotes, or are either inapplicable or not required.
(a)(3) Exhibits
The following documents are filed as part of this report:
Exhibit Description
3.1 Amended and Restated Articles of Incorporation of the Registrant, restated effective January 16,2009, incorporated by reference to Exhibit 3.1 of the Registrant’s Current Report on Form 8-K filedJanuary 22, 2009.
*
3.2 Bylaws of the Registrant, as amended and restated on November 11, 2008, incorporated byreference to Exhibit 3.2 of the Registrant’s Current Report on Form 8-K filed November 13, 2008.
(filedherewith)
4.1 Indenture between Registrant and PNC, N.A., as Trustee, incorporated by reference to Exhibit 4(a)to Registration Statement No. 33-62162.
*
161

Exhibit Description
4.2 Indenture between Registrant and The First National Bank of Chicago, as Trustee, incorporated byreference to Exhibit 4(b) to Registration Statement No. 33-62162.
*
4.3 Form of Indenture to be used in connection with the issuance of Subordinated Debt Securities,incorporated by reference to Exhibit 4.4 to Registration Statement No. 333-25381.
*
4.4 Second Supplemental Indenture by and among NCF, SunTrust Banks, Inc. and The Bank of NewYork, as Trustee, dated September 22, 2004, incorporated by reference to Exhibit 4.9 to Registrant’s2004 Annual Report on Form 10-K.
*
4.5 First Supplemental Indenture between NCF and the Bank of New York, as Trustee, dated as ofMarch 27, 1997, incorporated by reference to Exhibit 4.2 to the Registration Statement on Form S-4of National Commerce Bancorporation (File No. 333-29251).
*
4.6 Indenture between NCF and The Bank of New York, as Trustee, dated as of March 27, 1997,incorporated by reference to Exhibit 4.1 to the Registration Statement on Form S-4 of NationalCommerce Bancorporation (File No. 333-29251).
*
4.7 Indenture, dated as of October 25, 2006, between SunTrust Banks, Inc. and U.S. Bank NationalAssociation, as Trustee, incorporated by reference to Exhibit 4.3 to the Registrant’s RegistrationStatement on Form 8-A filed on December 5, 2006.
*
4.8 Form of First Supplemental Indenture (to Indenture dated as of October 25, 2006) betweenSunTrust Banks, Inc. and U.S. Bank National Association, as Trustee, incorporated by reference toExhibit 4.5 to the Registrant’s Registration Statement on Form 8-A filed on October 24, 2006.
*
4.9 Form of Second Supplemental Indenture (to Indenture dated as of October 25, 2006) betweenSunTrust Banks, Inc. and U.S. Bank National Association, as Trustee, incorporated by reference toExhibit 4.4 to the Registrant’s Registration Statement on Form 8-A filed on December 5, 2006.
*
4.10 Form of Stock Purchase Contract Agreement between SunTrust Banks, Inc. and SunTrustPreferred Capital I, incorporated by reference to Exhibit 4.6 to the Registrant’s RegistrationStatement on Form 8- A filed on October 24, 2006.
*
4.11 Senior Indenture dated as of September 10, 2007 by and between SunTrust Banks, Inc. and U.S.Bank National Association, as Trustee, incorporated by reference to Exhibit 4.1 to the Registrant’sCurrent Report on Form 8-K filed on September 10, 2007.
*
4.12 Form of Third Supplemental Indenture to the Junior Subordinated Notes Indenture betweenSunTrust Banks, Inc. and U.S. Bank National Association, as Trustee, incorporated by reference toExhibit 4.4 to the Registrant’s Registration Statement on Form 8-A filed on March 3, 2008.
*
4.13 Warrant to Purchase up to 11,891,280 shares of Common Stock dated as of November 14, 2008,incorporated by reference to Exhibit 4.1 to the Registrant’s Current Report on Form 8-K/A filedJanuary 5, 2009.
*
4.14 Warrant to Purchase up to 6,008,902 shares of Common Stock dated as of December 31, 2008,incorporated by reference to Exhibit 4.1 to the Registrant’s Current Report on Form 8-K filedJanuary 2, 2009.
*
4.15 Form of Series A Preferred Stock Certificate, incorporated by reference to Exhibit 4.2 toRegistrant’s Current Report on Form 8-K filed September 12, 2006.
*
4.16 Form of Series C Preferred Stock Certificate, incorporated by reference to Exhibit 4.2 toRegistrant’s Current Report on Form 8-K filed November 17, 2008.
*
4.17 Form of Series D Preferred Stock Certificate, incorporated by reference to Exhibit 4.2 toRegistrant’s Current Report on Form 8-K filed January 2, 2009.
*
4.18 Amended and Restated Stock Purchase Contract Agreement, dated as of June 26, 2009, betweenthe Company and SunTrust Preferred Capital I, acting through U.S. Bank National Association, asProperty Trustee, incorporated by reference to Exhibit 99.2 to Current Report on Form 8-K filedJuly 1, 2009.
*
10.1 SunTrust Banks, Inc. MIP, amended and restated as of January 1, 2010. (filedherewith)
162
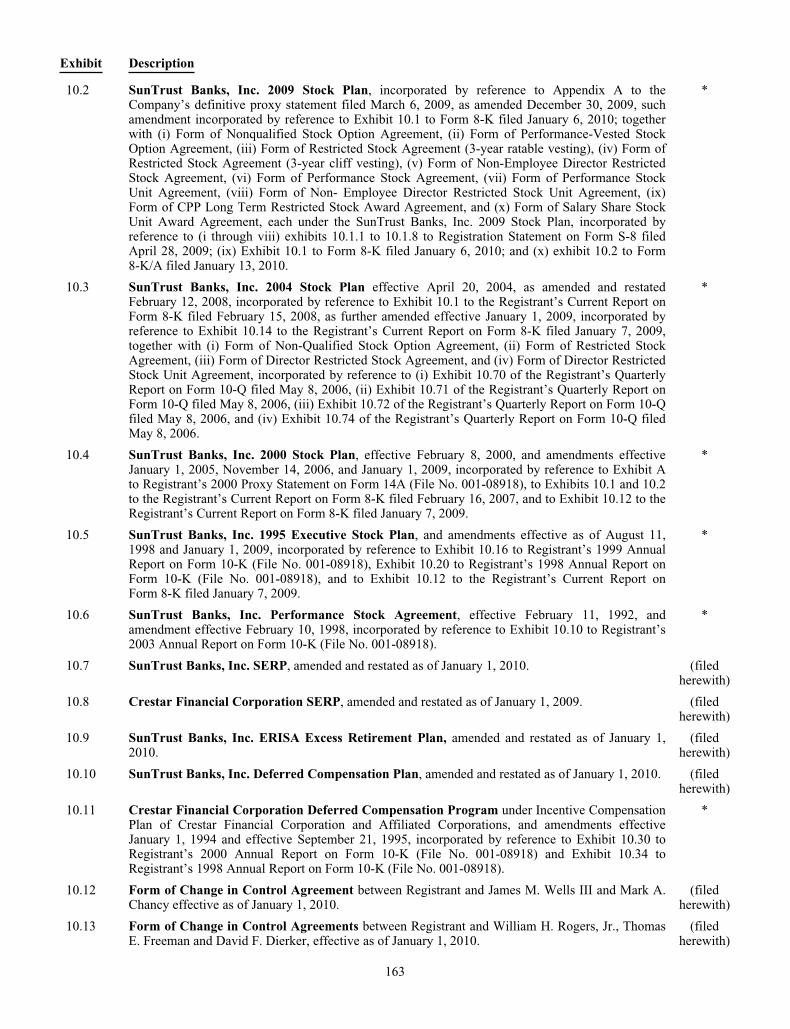
Exhibit Description
10.2 SunTrust Banks, Inc. 2009 Stock Plan, incorporated by reference to Appendix A to theCompany’s definitive proxy statement filed March 6, 2009, as amended December 30, 2009, suchamendment incorporated by reference to Exhibit 10.1 to Form 8-K filed January 6, 2010; togetherwith (i) Form of Nonqualified Stock Option Agreement, (ii) Form of Performance-Vested StockOption Agreement, (iii) Form of Restricted Stock Agreement (3-year ratable vesting), (iv) Form ofRestricted Stock Agreement (3-year cliff vesting), (v) Form of Non-Employee Director RestrictedStock Agreement, (vi) Form of Performance Stock Agreement, (vii) Form of Performance StockUnit Agreement, (viii) Form of Non- Employee Director Restricted Stock Unit Agreement, (ix)Form of CPP Long Term Restricted Stock Award Agreement, and (x) Form of Salary Share StockUnit Award Agreement, each under the SunTrust Banks, Inc. 2009 Stock Plan, incorporated byreference to (i through viii) exhibits 10.1.1 to 10.1.8 to Registration Statement on Form S-8 filedApril 28, 2009; (ix) Exhibit 10.1 to Form 8-K filed January 6, 2010; and (x) exhibit 10.2 to Form8-K/A filed January 13, 2010.
*
10.3 SunTrust Banks, Inc. 2004 Stock Plan effective April 20, 2004, as amended and restatedFebruary 12, 2008, incorporated by reference to Exhibit 10.1 to the Registrant’s Current Report onForm 8-K filed February 15, 2008, as further amended effective January 1, 2009, incorporated byreference to Exhibit 10.14 to the Registrant’s Current Report on Form 8-K filed January 7, 2009,together with (i) Form of Non-Qualified Stock Option Agreement, (ii) Form of Restricted StockAgreement, (iii) Form of Director Restricted Stock Agreement, and (iv) Form of Director RestrictedStock Unit Agreement, incorporated by reference to (i) Exhibit 10.70 of the Registrant’s QuarterlyReport on Form 10-Q filed May 8, 2006, (ii) Exhibit 10.71 of the Registrant’s Quarterly Report onForm 10-Q filed May 8, 2006, (iii) Exhibit 10.72 of the Registrant’s Quarterly Report on Form 10-Qfiled May 8, 2006, and (iv) Exhibit 10.74 of the Registrant’s Quarterly Report on Form 10-Q filedMay 8, 2006.
*
10.4 SunTrust Banks, Inc. 2000 Stock Plan, effective February 8, 2000, and amendments effectiveJanuary 1, 2005, November 14, 2006, and January 1, 2009, incorporated by reference to Exhibit Ato Registrant’s 2000 Proxy Statement on Form 14A (File No. 001-08918), to Exhibits 10.1 and 10.2to the Registrant’s Current Report on Form 8-K filed February 16, 2007, and to Exhibit 10.12 to theRegistrant’s Current Report on Form 8-K filed January 7, 2009.
*
10.5 SunTrust Banks, Inc. 1995 Executive Stock Plan, and amendments effective as of August 11,1998 and January 1, 2009, incorporated by reference to Exhibit 10.16 to Registrant’s 1999 AnnualReport on Form 10-K (File No. 001-08918), Exhibit 10.20 to Registrant’s 1998 Annual Report onForm 10-K (File No. 001-08918), and to Exhibit 10.12 to the Registrant’s Current Report onForm 8-K filed January 7, 2009.
*
10.6 SunTrust Banks, Inc. Performance Stock Agreement, effective February 11, 1992, andamendment effective February 10, 1998, incorporated by reference to Exhibit 10.10 to Registrant’s2003 Annual Report on Form 10-K (File No. 001-08918).
*
10.7 SunTrust Banks, Inc. SERP, amended and restated as of January 1, 2010. (filedherewith)
10.8 Crestar Financial Corporation SERP, amended and restated as of January 1, 2009. (filedherewith)
10.9 SunTrust Banks, Inc. ERISA Excess Retirement Plan, amended and restated as of January 1,2010.
(filedherewith)
10.10 SunTrust Banks, Inc. Deferred Compensation Plan, amended and restated as of January 1, 2010. (filedherewith)
10.11 Crestar Financial Corporation Deferred Compensation Program under Incentive CompensationPlan of Crestar Financial Corporation and Affiliated Corporations, and amendments effectiveJanuary 1, 1994 and effective September 21, 1995, incorporated by reference to Exhibit 10.30 toRegistrant’s 2000 Annual Report on Form 10-K (File No. 001-08918) and Exhibit 10.34 toRegistrant’s 1998 Annual Report on Form 10-K (File No. 001-08918).
*
10.12 Form of Change in Control Agreement between Registrant and James M. Wells III and Mark A.Chancy effective as of January 1, 2010.
(filedherewith)
10.13 Form of Change in Control Agreements between Registrant and William H. Rogers, Jr., ThomasE. Freeman and David F. Dierker, effective as of January 1, 2010.
(filedherewith)
163

Exhibit Description
10.14 SunTrust Banks, Inc. Directors Deferred Compensation Plan, as amended and restated as ofJanuary 1, 2009, incorporated by reference to Exhibit 10.1 to the Registrant’s Current Report onForm 8-K filed January 7, 2009.
*
10.15 Crestar Financial Corporation Deferred Compensation Plan for Outside Directors of CrestarFinancial Corporation and Crestar Bank, as restated with amendments through January 1, 2009,incorporated by reference to Exhibit 10.312 to the Registrant’s Annual Report on Form 10-K filedMarch 2, 2009.
*
10.16 Crestar Financial Corporation Directors’ Equity Program, as restated as of December 31, 2008,incorporated by reference to Exhibit 10.2 to the Registrant’s Current Report on Form 8-K filedJanuary 7, 2009.
*
10.17 NCF Directors’ Fees Deferral Plan and First Amendment, effective January 1, 2002, andamendments effective January 1, 2005 and November 14, 2006, incorporated by reference to Exhibit10.64 to Registrant’s 2004 Annual Report on Form 10-K, and Exhibits 10.1 and 10.2 to theRegistrant’s Current Report on Form 8-K filed February 16, 2007.
*
10.18 Letter Agreement dated August 10, 2004 from Registrant to James M. Wells III, regarding splitdollar life insurance, incorporated by reference to Exhibit 10.1 to Registrant’s Quarterly Report onForm 10-Q for the quarter ended September 30, 2004.
*
10.19 Letter Agreement with U.S. Treasury Department dated as of November 14, 2008 (including theSecurities Purchase Agreement – Standard Terms), incorporated by reference to Exhibit 10.1 to theRegistrant’s Current Report on Form 8-K/A filed January 5, 2009.
*
10.20 Letter Agreement with U.S. Treasury Department dated as of December 31, 2008 (including theSecurities Purchase Agreement – Standard Terms), incorporated by reference to Exhibit 10.1 to theRegistrant’s Current Report on Form 8-K filed January 2, 2009.
*
10.21 Form of Waiver, executed by each of Messrs. James M. Wells III, Mark A. Chancy, and WilliamH. Rogers, Jr. (incorporated by reference to Ex. 10.2 to the Registrant’s Current Report onForm 8-K filed November 17, 2008).
*
10.22 Form of Letter Agreement, executed by each of Messrs. James M. Wells III, Mark A. Chancy, andWilliam H. Rogers, Jr. with the Company (incorporated by reference to Ex. 10.3 to the Registrant’sCurrent Report on Form 8-K filed November 17, 2008).
*
10.23 GB&T Stock Option Plan of 1997, incorporated by reference to Exhibit 10.6 to the annual reporton Form 10-K of GB&T Bancshares Inc. filed March 31, 2003 (File No. 005-82430).
*
10.24 GB&T 2007 Omnibus LTI Plan, incorporated by reference to Appendix A to the definitive proxystatement of GB&T Bancshares Inc. filed April 18, 2007 (File No. 005-82430).
*
10.25 Crestar Amended Executive Life Insurance Plan, amended and restated as of January 1, 2009. (filedherewith)
12.1 Ratio of Earnings to Fixed Charges and Preferred Stock Dividends. (filedherewith)
21.1 Registrant’s Subsidiaries. (filedherewith)
23.1 Consent of Independent Registered Public Accounting Firm. (filedherewith)
31.1 Certification of Chairman and Chief Executive Officer pursuant to 18 U.S.C. Section 1350, asadopted pursuant to Section 302 of the Sarbanes-Oxley Act of 2002.
(filedherewith)
31.2 Certification of Chief Financial Officer and Corporate Executive Vice President pursuant to 18U.S.C. Section 1350, as adopted pursuant to Section 302 of the Sarbanes-Oxley Act of 2002.
(filedherewith)
32.1 Certification of Chairman and Chief Executive Officer pursuant to 18 U.S.C. Section 1350, asadopted pursuant to Section 906 of the Sarbanes-Oxley Act of 2002.
(filedherewith)
32.2 Certification of Chief Financial Officer and Corporate Executive Vice President pursuant to 18U.S.C. Section 1350, as adopted pursuant to Section 906 of the Sarbanes-Oxley Act of 2002.
(filedherewith)
164

Exhibit Description
99.1 Certification of Chairman and Chief Executive Officer pursuant to the Emergency EconomicStability Act of 2008.
(filedherewith)
99.2 Certification of Chief Financial Officer and Corporate Executive Vice President pursuant to theEmergency Economic Stability Act of 2008.
(filedherewith)
101.1 Interactive Data File. (filedherewith)
Certain instruments defining rights of holders of long-term debt of the Registrant and its subsidiaries are not filed herewithpursuant to Item 601(b)(4)(iii) of Regulation S-K. At the Commission’s request, the Registrant agrees to give theCommission a copy of any instrument with respect to long-term debt of the Registrant and its consolidated subsidiaries andany of its unconsolidated subsidiaries for which financial statements are required to be filed under which the total amount ofdebt securities authorized does not exceed ten percent of the total assets of the Registrant and its subsidiaries on aconsolidated basis.
* incorporated by reference
165
SIGNATURES
Pursuant to the requirements of Section 13 or 15(d) of the Securities and Exchange Act of 1934, the Registrant has dulycaused this report to be signed on its behalf by the undersigned, thereunto duly authorized.
SUNTRUST BANKS, INC.
By: /s/ James M. Wells III
James M. Wells IIIChairman and Chief Executive Officer
Dated: February 23, 2010
POWER OF ATTORNEY
KNOW ALL PERSONS BY THESE PRESENTS, that each person whose signature appears below hereby constitutesand appoints Raymond D. Fortin and Mark A. Chancy and each of them acting individually, as his attorneys-in-fact, eachwith full power of substitution, for him in any and all capacities, to sign any and all amendments to this Form 10-K, and tofile the same, with exhibits thereto and other documents in connection therewith, with the SEC, hereby ratifying andconfirming our signatures as they may be signed by our said attorney to any and all amendments said Form 10-K.
Pursuant to the requirements of the Securities Act, this Form 10-K has been signed by the following persons in thecapacities and on the dates indicated:
Signatures Title
Principal Executive Officer:
/s/ James M. Wells III
James M. Wells III2/23/2010Date
Chairman and Chief Executive Officer; Director
Principal Financial Officer:
/s/ Mark A. Chancy
Mark A. Chancy2/23/2010Date
Corporate Executive Vice President andChief Financial Officer
Principal Accounting Officer:
/s/ Thomas E. Panther
Thomas E. Panther2/23/2010Date
Senior Vice President, Controller andChief Accounting Officer
Directors:
/s/ Robert M. Beall, II
Robert M. Beall, II2/23/2010Date
Director
/s/ Alston D. Correll
Alston D. Correll2/23/2010Date
Director
/s/ Jeffrey C. Crowe
Jeffrey C. Crowe2/23/2010Date
Director
/s/ Patricia C. Frist
Patricia C. Frist2/23/2010Date
Director
166

Signatures Title
/s/ Blake P. Garrett, Jr.
Blake P. Garrett, Jr.2/23/2010Date
Director
/s/ David H. Hughes
David H. Hughes2/23/2010Date
Director
/s/ M. Douglas Ivester
M. Douglas Ivester2/23/2010Date
Director
/s/ J. Hicks Lanier
J. Hicks Lanier2/23/2010Date
Director
/s/ G. Gilmer Minor, III
G. Gilmer Minor, III2/23/2010Date
Director
/s/ Larry L. Prince
Larry L. Prince2/23/2010Date
Director
/s/ Frank S. Royal, M.D.
Frank S. Royal, M.D.2/23/2010Date
Director
/s/ Karen Hastie Williams
Karen Hastie Williams2/23/2010Date
Director
/s/ Dr. Phail Wynn, Jr.
Dr. Phail Wynn, Jr.2/23/2010Date
Director
167

[THIS PAGE INTENTIONALLY LEFT BLANK]

CORPORATE HEADQUARTERS SunTrust Banks, Inc. 303 Peachtree Street, NE Atlanta, GA 30308 404.588.7711
CORPORATE MAILING ADDRESS SunTrust Banks, Inc. P.O. Box 4418 Center 645 Atlanta, GA 30302-4418
NOTICE OF ANNUAL MEETING The Annual Meeting of Shareholders will be held on Tuesday, April 27, 2010 at 9:30 a.m. in Suite 105 on the first floor of SunTrust Plaza Garden Offi ces, 303 Peachtree Center Avenue, Atlanta, Georgia.
COMMON STOCK SunTrust Banks, Inc. common stock is traded on the New York Stock Exchange (NYSE) under the symbol STI.
QUARTERLY COMMON STOCK PRICES AND DIVIDENDS The quarterly high, low, and close prices of SunTrust’s common stock for each quarter of 2009 and 2008 and the dividends paid per share are shown below. Quarter Market Price Dividends Ended High Low Close Paid
2009 December 31 $24.09 $18.45 $20.29 $0.01September 30 24.43 14.50 22.55 0.01 June 30 20.86 10.50 16.45 0.10March 31 30.18 6.00 11.74 0.10
2008 December 31 $57.75 $19.75 $29.54 $0.54September 30 64.00 25.60 44.99 0.77June 30 60.80 32.34 36.22 0.77March 31 70.00 52.94 55.14 0.77
CREDIT RATINGS Ratings as of December 31, 2009. Moody’s Standard Investors & Poor’s Fitch DBRS
Corporate Ratings Long Term Ratings Senior Debt Baa1 BBB+ A - A Subordinated Debt Baa2 BBB BBB+ A(low) Series A Preferred Stock Ba2 BB+ BBB BB(high) Short Term Commercial Paper P-2 A-2 F1 R-1(low)
Bank Ratings Long Term Ratings Senior Debt A2 A - A - A(high) Subordinated Debt A3 BBB+ BBB+ A Short Term P-1 A-2 F1 R-1 (middle)
SHAREHOLDER SERVICESRegistered shareholders of SunTrust Banks, Inc. who wish to change the name, address, or ownership of common stock, to report lost certifi cates, or to consolidate accounts should contact our Transfer Agent: Computershare 250 Royall Street Mail Stop 1A Canton, MA 02021 866.299.4214 www.computershare.com
For general shareholder information, contact Investor Relations at 1.800.324.8093.
ANALYST INFORMATIONAnalysts, investors, and others seeking additional financial information should contact: Steven Shriner Director of Investor Relations SunTrust Banks, Inc. P.O. Box 4418 Mail Code: GA-ATL-634 Atlanta, GA 30302-4418 800.324.8093
INVESTOR RELATIONS ON THE INTERNET To fi nd the latest investor relations information about SunTrust, including stock quotes, news releases, corporate governance practices, and fi nancial data, go to www.suntrust.com.
CLIENT INFORMATION For assistance with SunTrust products and services, call 1.800.SUNTRUST or visit www.suntrust.com.
WEB SITE ACCESS TO UNITED STATES SECURITIES AND EXCHANGE COMMISSION FILINGS All reports fi led electronically by SunTrust Banks, Inc. with the United States Securities and Exchange Commission, including the annual report on Form 10-K, quarterly reports on Form 10-Q, current event reports on Form 8-K, and amendments to those reports fi led or furnished pursuant to Section 13(a) or 15(d) of the Exchange Act are accessible as soon as reasonably practicable at no cost in the Investor Relations section of the corporate website at www.suntrust.com.
Des
ign:
Par
agra
ph
s, C
hic
ago
SHAREHOLDER INFORMATION
SUNTRUST AT A GLANCE
SunTrust Banks, Inc., with year-end 2009 assets of $174.2 billion, is one of the nation’s largest and strongest fi nancial services holding companies.
Through its fl agship subsidiary, SunTrust Bank, the Company provides deposit, credit, and trust and investment services to a broad range of retail, business, and institutional clients. Other subsidiaries provide mortgage banking, insurance, brokerage, investment management, equipment leasing, and investment banking services.
SunTrust enjoys leading positions in some of the most attractive markets in the United States and also serves clients in selected markets nationally. The Company’s mission is to help people and institutions prosper by providing fi nancial services that meet the needs, exceed the expectations, and enhance the lives of our clients, communities, colleagues, and ultimately our shareholders.
SunTrust’s 1,683 retail branches and 2,822 ATMs are located primarily in Florida, Georgia, Maryland, North Carolina, South Carolina, Tennessee, Virginia, and the District of Columbia. In addition, SunTrust provides clients with a full selection of technology-based banking channels including online, 24-hour customer services centers, and the latest mobile devices. Our internet address is www.suntrust.com.
CORPORATE HEADQUARTERS SunTrust Banks, Inc. 303 Peachtree Street, NE Atlanta, GA 30308 404.588.7711
CORPORATE MAILING ADDRESS SunTrust Banks, Inc. P.O. Box 4418 Center 645 Atlanta, GA 30302-4418
NOTICE OF ANNUAL MEETING The Annual Meeting of Shareholders will be held on Tuesday, April 27, 2010 at 9:30 a.m. in Suite 105 on the first floor of SunTrust Plaza Garden Offi ces, 303 Peachtree Center Avenue, Atlanta, Georgia.
COMMON STOCK SunTrust Banks, Inc. common stock is traded on the New York Stock Exchange (NYSE) under the symbol STI.
QUARTERLY COMMON STOCK PRICES AND DIVIDENDS The quarterly high, low, and close prices of SunTrust’s common stock for each quarter of 2009 and 2008 and the dividends paid per share are shown below. Quarter Market Price Dividends Ended High Low Close Paid
2009 December 31 $24.09 $18.45 $20.29 $0.01September 30 24.43 14.50 22.55 0.01 June 30 20.86 10.50 16.45 0.10March 31 30.18 6.00 11.74 0.10
2008 December 31 $57.75 $19.75 $29.54 $0.54September 30 64.00 25.60 44.99 0.77June 30 60.80 32.34 36.22 0.77March 31 70.00 52.94 55.14 0.77
CREDIT RATINGS Ratings as of December 31, 2009. Moody’s Standard Investors & Poor’s Fitch DBRS
Corporate Ratings Long Term Ratings Senior Debt Baa1 BBB+ A - A Subordinated Debt Baa2 BBB BBB+ A(low) Series A Preferred Stock Ba2 BB+ BBB BB(high) Short Term Commercial Paper P-2 A-2 F1 R-1(low)
Bank Ratings Long Term Ratings Senior Debt A2 A - A - A(high) Subordinated Debt A3 BBB+ BBB+ A Short Term P-1 A-2 F1 R-1 (middle)
SHAREHOLDER SERVICESRegistered shareholders of SunTrust Banks, Inc. who wish to change the name, address, or ownership of common stock, to report lost certifi cates, or to consolidate accounts should contact our Transfer Agent: Computershare 250 Royall Street Mail Stop 1A Canton, MA 02021 866.299.4214 www.computershare.com
For general shareholder information, contact Investor Relations at 1.800.324.8093.
ANALYST INFORMATIONAnalysts, investors, and others seeking additional financial information should contact: Steven Shriner Director of Investor Relations SunTrust Banks, Inc. P.O. Box 4418 Mail Code: GA-ATL-634 Atlanta, GA 30302-4418 800.324.8093
INVESTOR RELATIONS ON THE INTERNET To fi nd the latest investor relations information about SunTrust, including stock quotes, news releases, corporate governance practices, and fi nancial data, go to www.suntrust.com.
CLIENT INFORMATION For assistance with SunTrust products and services, call 1.800.SUNTRUST or visit www.suntrust.com.
WEB SITE ACCESS TO UNITED STATES SECURITIES AND EXCHANGE COMMISSION FILINGS All reports fi led electronically by SunTrust Banks, Inc. with the United States Securities and Exchange Commission, including the annual report on Form 10-K, quarterly reports on Form 10-Q, current event reports on Form 8-K, and amendments to those reports fi led or furnished pursuant to Section 13(a) or 15(d) of the Exchange Act are accessible as soon as reasonably practicable at no cost in the Investor Relations section of the corporate website at www.suntrust.com.
SUNTRUST AT A GLANCE
SunTrust Banks, Inc., with year-end 2009 assets of $174.2 billion, is one of the nation’s largest and strongest fi nancial services holding companies.
Through its fl agship subsidiary, SunTrust Bank, the Company provides deposit, credit, and trust and investment services to a broad range of retail, business, and institutional clients. Other subsidiaries provide mortgage banking, insurance, brokerage, investment management, equipment leasing, and investment banking services.
SunTrust enjoys leading positions in some of the most attractive markets in the United States and also serves clients in selected markets nationally. The Company’s mission is to help people and institutions prosper by providing fi nancial services that meet the needs, exceed the expectations, and enhance the lives of our clients, communities, colleagues, and ultimately our shareholders.
SunTrust’s 1,683 retail branches and 2,822 ATMs are located primarily in Florida, Georgia, Maryland, North Carolina, South Carolina, Tennessee, Virginia, and the District of Columbia. In addition, SunTrust provides clients with a full selection of technology-based banking channels including online, 24-hour customer services centers, and the latest mobile devices. Our internet address is www.suntrust.com.
Des
ign:
Par
agra
ph
s, C
hic
ago
SHAREHOLDER INFORMATION
32676_Cover_AR.indd 232676_Cover_AR.indd 2 2/25/10 8:06 AM2/25/10 8:06 AM

SUNTRUST BANKS, INC.
2009 ANNUAL REPORT
SUNTRUST BANKS, INC., 303 PEACHTREE STREET, ATLANTA, GEORGIA 30308
WWW.SUNTRUST.COM
SUN
TR
UST
BA
NK
S, INC
. 2009 AN
NU
AL R
EPORT
32676_Cover_AR.indd 132676_Cover_AR.indd 1 2/25/10 8:06 AM2/25/10 8:06 AM
Related Documents