Welcome message from author
This document is posted to help you gain knowledge. Please leave a comment to let me know what you think about it! Share it to your friends and learn new things together.
Transcript


Learning Weather A resource study kit, contains:
1. Mapping Weather A series of maps with exercises, Teaches how weather moves. Includes climatic data for 50 Cana· dian locations.
2. Knowing Weather Booklet discusses weather events, weather facts and folklore, measurement of weather and several student projects to study weather,
3. Knowing Clouds A cloud chart to help students identify various cloud formations.
CGPC Code: 002401
Each kit $4 .95 (Canada) $5 .95 (Outside Canada)
ORDER FORM - BON DE COMMANDE
• ~~~:~1e:reer~nt!~ ~hn·:t:.~u~~: ::n'l': ~~O:~:'~::'n ' sans I)I.aw~
.+ SuWyIildSer-ioces """". ca~" Govemmenl F'lb/Istw"og Ca"llrl!
Learning Weather • • • A resource study kit suitable for students grade seven and up, prepared by the Atmospheric Environment Service of Environment Canada Includes new revised poster·size cloud chart
Decouvrons la meteO ... Pochettes destinees aux eliwes du secondaire et du collegial, preparees par Ie Service de I'environnement atmospherlque d'Environnement Canada
Incluant un tableau revise descriptif des nuages
Decouvrons la meteo Pochette documentaire comprenant:
1. Cartographie de la mel eo Serie de cartes accompagnees d'exercices. Decrit les fluctuations du temps et fournit des donnees climatologiques pour 50 localites canadiennes.
2. Apprenons iI connailre la meleo Brochure traitant d'evenements, de faits et de legen· des meteorologiques. Techniques de I'observation et de la prevision de la meteo, Projets scolaires sur la meteorologie.
3. Apprenons iI connailre les nuages Tableau descriptif des nuages aidant les eleves a identifier differentes formations.
Code CEGC: 002402
chaque pochette 4,95 $ (Canada) 5,95 $ (A I'etranger)
Please do nol send cash N'envoyez pas d'argenl comptant s.v.p .
cope Code - Gode eEOC O1y-Ole Pr ice-Prix Tolal Shipping and handling lee extr.: f-....;,.....;,.-- - ---+-'----1f----+-----; Frail supplementairer; pour expedition al manu ten lion:
es Ch&que/Money Order (payable \0 the Receiver Generallat Canadil) enclosed. Ch8que/mandal (payable. I'ordre du Receveur general du C.nada) cl·inclus .
f---------+----1f----+-----; ;".~.a:rvd~ul: commande =7:11
Also available IhlOugh commercial bookslOfes associaled
wilh CGPC or Ihrough your toeal bookseller
Egalement dlSponible par I'entremlse des librait ies
commerciales associees .u eEOC au de votre libraire.
Ship To - Envoyer a:
Canada
$OO.Q1 101' $25.00 = $1.55 525.01 101' $75.00 = $2.25 575.Q1 101. 5200.00 = $4 ,50 ~erJPlul de $200.00 = 4% 1-----1 (01/01211 or der \lalue)
(de la valeur de 121 commando)
Credit Card Expiry Datil Dollie d'explfallon
Stgnatul e
Send your order to: - Envoyer Jes commandes au:
Canadian Government Publishing Centre
Ottaw~ Canada K1A 0.:.9
Centre d'Eidition du gouvernement du Canada
Tel, No. -N° de leI. (819) 997·2560 Terex - Telex 053-4296

THE HOLE IN THE SKY. By John Gribbin. Bantam New Age Books, May 1988, 192 pages, $5.50.
John Gribbin's book, The Hole in the Sky, is a welcome source of factual and timely information for the general public on recently observed ozone-layer depletions. This small paperback summarizes hundreds of pages of scientific literature and countless hours of discussion and debate into 192 pages of informative and ' educational material on our changing ozone layer and atmosphere. (See also the article by Evans, Chinook, Vol. 10, No.2.)
Whatever your level of interest or scientific literacy on the ozone issue, this book is highly recommended. Although scientific terminology cannot be avoided, readers with a non-scientific background need not leave it on the shelf. After all, it was written to convince the public at large why we must be concerned about our changing ozone layer. Gribbin might occasionally use too many numbers in his descriptions, but this only taxes your memory, not your reasoning. Just keep going, don't get bogged down. Reread over particular chapters a few times if necessary. The chapters average 22 pages in length and the longest one is only 36.
Continued on page 52
BOOK REVIEW
STORM FLIGHT By Jay Anderson
Summer/Ete 1988 Vol. 10 No.3
43
44
HALO PHENOMENA OBSERVED BY A.Y. JACKSON ON ST. PATRICK'S DAY, 1920
51
By Bill Pike
WINTER OF 1987-88 IN REVIEW By Amir Shabbar
53
WHEN PLACES WERE NAMED FOR WEATHERMEN By Morley Thomas
56
INTERPRETING SATELLITE IMAGERY By Phil Cote
58
EDITORIAL BOARD I CONSEIL DE REDACTION
Barry Grace Agriculture Canada Research Branch Lethbridge, Alberta
Yves Gratton Universite du Quebec a Rimouski Rimouski, Quebec
Paul H. LeBlond The University of British Columbia Vancouver, British Columbia
Richard Leduc Ministere de l'environnement Quebec, Quebec
John W. Loder Bedford Institute of Oceanography Dartmouth, Nova Scotia
John Maybank Saskatchewan Research Council Saskatoon, Saskatchewan
David W. Phillips Atmospheric Environment Service Downsview, Ontario
Jerry Salloum Don Mills Collegiate City of North York, Ontario
Hans VanLeeuwen (Chairman) Pickering, Ontario
EDITOR Hans VanLeeuwen REDACTEUR TECHNICAL EDITOR Edward J Truhlar REDACTION TECHNIQUE
BUSINESS MANAGER J. Carr McLeod GESTIONNAIRE ART WORK Bill Kiely I Joan Badger ILLUSTRATION
TRANSLATION Joanne Gagnon Pacini I Gilles Tardif TRADUCTION FOUNDER AND EDITOR 1978- 1984 Michael J. Newark FONDATEUR EDITEUR 1978-1984
ISSN 0705·4572
Published by: Canadian Meteorological and Oceanographic Society
Printed and produced in Canada and published quarterly by the Canadian Meteorological and Oceanographic Sociely. P.O. Box 334. Newmarket. Ont, L3Y 4X7, Tel,: (416) 898-1040. Annual subscription rates are $1000 for CMOS members, $12,00 for non-members and $15,00 for instilulions. Contents copyright © Ihe aUlhors 1988. Copying done for other than personal or internal reference use withoul the expressed permission 01 the CMOS is prohibited , All correspondence including requests for special permission or bulk orders should be addressed to Chinook al the above address
Second Class Mall Regislration No. 4508 Summer 1988 Dale of issue - January 1989
COVER
Cloud formations observed during a joint Canadian-United States project in the ocean Storms Experiment to study the development of Pacific storms and their interaction with the surface layers of the ocean, See the article on page 44.
Publie par: La Societe canadienne de meteorologie el d'oceanographie
Edite et imprime au Canada. Chinook esl publie tous les trois mois par la Sociele canadienne de meteorologie el d'oceanographie, C p, 334, Newmarket, On I. L3Y 4X7, Tel. : (416) 898-1040. Les frais d'abonnemenl annuel sonl de 10,00 $ pour les membres de la SCMO, de 12,00 $ pour les non-membres et de 15,00 $ pour les inslitutions Les auteurs deliennenl Ie droit exclusif d'exploiler leur oeuvre Iilteraire (© 1988) Toule reproduction, sauf pour usage personnel au consultation interne, est interdHe sans la permission explicite de la SCMO Toute correspondance doit etre envoyee au Chinook a radresse ci-dessus, y compris les demandes de permission speciale et les commandes en gros.
Courrier de deuxieme classe - enregistremenl nO 4508 Ete 1988 Date de parution - janvier 1989
COUVERTURE
Nebulosite observee a l'occasion du projet canado-americain" Ocean Storms » sur l'etude du developpement des tempetes dans Ie Pacifique et de leur interaction avec la couche de surface de l'ocean. Voir l'article a la page 44.
43

Takeoff is an hour late, at 7:04 a.m., and dawn is already under way as we lift off from Boeing Field in Seattle, turning northwestward across the Olympic Mountains to fly parallel to the west coast of Vancouver Island. Technicians scurry to attach radiometers to ceiling and floor mounts, opening fabric panels and releasing a cascade of rain-water onto the floor of the aircraft. The water has accumulated during our delayed departure on the ground, running in through roof hatches that would not seal properly until the aircraft is airborne and the interior properly pressurized.
I am aboard one of NOAA's Lockheed P-3 research aircraft, affectionately named "Miss Piggy" in dubious honour of her less than exemplary repair record. The aircraft is on loan for the joint American-Canadian Ocean Storms project, borrowed from Miami where it is normally used for hurricane patrol and research. Wet interiors are accepted as a minor annoyance - now that the aircraft is airborne, and seatbeIts are undone, it is a comfortable though spartan laboratory of atmospheric physics.
Major funding for the Ocean Storms project was provided by the U.S. Navy's Office of Naval Research (ONR), with additional participation from the National Atmospheric and Oceanographic Administration (NOAA) and Canada's Atmospheric Environment Service. Though coordination of the experiment is conducted by the Applied Physics Laboratory at the University of Washington, the participants were from a host of organizations, including the Pacific Marine Environmental Laboratory (PMEL) in Seattle, the NOAA Wave Propagation Laboratory in Boulder, the Pacific Weather Centre in Vancouver, the Weather Services Forecast Office in Seattle and the Institute of Ocean Sciences in Victoria.
The Ocean Storms Experiment is a joint meteorological and oceanographic project designed to study the development of Pacific storms and their interaction with the surface layers of the ocean. During the fall, the surface layers of the Pacific Ocean cool rapidlymore rapidly than simple models of heat transfer from ocean to atmosphere would predict. Suspicion had settled on the role of storms in cooling the ocean surface, perhaps by mixing cooler water from below with the warmer surface waters. Heating and cooling rates were
44 Chinook Summer/Ete 1988
STORM FLIGHT by Jay Anderson
Undulations in the low-level stratocumulus clouds reveal at least two scales of wave motion in the atmosphere while Miss Piggy emerges from the first weather system and turns southward to meet the second. Clouds in the middle distance are more cumuliform in appearance.
poorly determined, especially in the cold air following a frontal passage, with considerable variation from place to place being expected. Oceanographers were also interested in the currents set in motion by the complex and shifting winds associated with frontal passages, and in other forms of air/sea interaction that would contribute to energy exchanges between atmosphere and ocean.
Meteorologists wanted data on the rapid development of Pacific storms and the fine-scale variations in temperature, wind, stability and humidity along a cold front, particularly in the boundary layer close to the surface of the earth. The study of these subjects could lead directly to more accurate forecasts of such storms, and more time to warn those caught in their paths. Ocean Storms was designed to collect data to study all of these problems, using a mixture of ship, buoy, satellite and aircraft sensors.
But Mother Nature refused to cooperate, jealously protecting her secrets through October and into November. A large blocking ridge of high pressure over the experiment area near 48°N, 139°W had refused to budge, and storms were being diverted northward into the Gulf of Alaska, too far to chase from Seattle. As the weeks passed and the abnormally warm, fall weather continued, plans were amended to search farther afield, but still the atmosphere would not cooperate. Then, as Novem-
ber came to its closing week, cold air began to move closer and closer from its source over the Bering Sea, giving promise of a change to winter weather if only the right storm would come along. With December beckoning, the suspense ended when a fast-moving low brought a blast of cold air onto the West Coast. The experiment was on, with only two weeks to collect all of the necessary data.
As a forecaster on loan from the Pacific Weather Centre, I had to watch wistfully as the planes headed out to probe the bowels of the storms. My job was to provide the forecasts for the planning, remaining at the desk to monitor developments while the P-3 searched for fronts and weather. My shifts in Seattle ended without an opportunity to fly, and I returned to Vancouver with instructions to "call me if anything develops". As the last week of the experiment arrived I was still without a call, and resigned to missing a close-up look at the atmosphere in action.
Then it came. "Be in Seattle by 3:30 in the morning for a briefing. The plane leaves at 6". I finished my shift at the Pacific Weather Centre, grabbed a quick supper and 3 hours' sleep, then headed to Seattle at midnight. Three a.m. saw me in the Seattle Ocean Storms weather office at Sandpoint, ready to go, and at 6 I was on board Miss Piggy, briefed quickly in survival

Weather briefing discussions at the Ocean Storms Forecast Office, located in Seattle at the U.S. Weather Service Forecast Office (WSFO), and staffed by forecasters from the AES Pacific Weather Centre, WSFO-Seattle and WSFO-Honolulu.
The Institute of Ocean Sciences ship CSS Parizeau under heavy seas with the CLASS container at left. The radiosonde-launching hatch on top of the container is closed.
procedures, and belted up in front of a computer terminal.
Heading northwestward across Washington, window space is at a premium while the meteorologists on board cluster around the large oval windows. Below in the cold post-frontal air, orographically organized lines of stratocumulus cloud outline the contours of the Olympic Mountains, while embedded convective showers and smooth-topped wave clouds compete for our attention. At 0733 we cross the coast at Cape Alava, already meeting the cirrus associated with the storm we want to study. Reaching 5300 m we are jostled by turbulence, in contrast to the low cloud below which has a peaceful tropical appearance in the morning sun. The belly radar shows the coasts of Washington and Vancouver Island receding to the east, while side-scan radar in the tail paints returns from the thunderstorm anvils over the Olympics.
Seating is arranged in groups of two, with a computer console facing each couplet. Line after line of numbers parade across the screens from top to bottom as the instruments faithfully record our progress second by second. Outside winds, temperatures and dew points pass in a numbing chorus of figures, but a flip of the dial converts the numbers to graphs, and the progress of our flight is displayed in a more convenient format while we fly to the first intercept point. Dropsondes are removed from their storage boxes and gently placed beside the chute that will expell them from the belly of the plane to measure the atmosphere below.
Coffee is brewing in the tail, beside the two HP 8900 computers that manage the data display and manipulation for the flight. I ante up a dollar, and
OCEAN STORMS
MOORINGS
Schematic of major data collection systems in the Oceans Storms project.
collect the first of many cups that will fuel my mind in the hours ahead. Soft drinks are in the cooler and two large sandwiches rest in my pocket, stoically ignored until noon is a little closer. We have fuel for nine hours.
The Lockheed is heavily instrumented with a host of probes. Wind and temperature sensors protrude from its nose, while conventional and Doppler radar systems sprout from belly and tail enclosures. A radio-facsimile recorder is available to pick up satellite pictures transmitted from Seattle, and radiometers collect infrared radiation from the sky above and surface below. Ozone sensors stare upward, looking for their
own special signs of atmospheric structure near the tropopause. Three navigation systems and several computers tie all of the measurements together.
Dr. Mel Shapiro from the Wave Propagation Laboratory in Boulder is the senior scientist aboard, aided by Mike Douglas, a post-doctoral fellow from the Cooperative Institute for Research in Environmental Studies (CIRES). Examining the already worn image of the pre-flight satellite image, they direct the aircraft onto a westward track, heading into the top of the storm we were about to study. Satellite pictures show an unusual shaped system developing along 135°W, and we plan to
45

examine the more northerly cloud system before heading southward to catch the area we think most likely to develop into a storm.
A sudden hiss interrupts the steady four-engine drone and the first dropsonde is on its way downward at 0812. Falling four millibars every 10 seconds after its parachute opens, it passes its measurements back to the aircraft where a printer faithfully displays pressure, temperature and humidity for our examination. Dr. Nick Bond, from PMEL, makes a quick plot on photocopies of tephigram charts to give us a visual impression of the atmosphere below. The first sonde's temperatures are erratic, and a second quickly hisses its way downward to replace it. As ifin irritated response to this gentle probing, the turbulence increases and I am careful to fill my second coffee only half full. A few rough bounces and it is over, leaving me in temporary peace to finish the drink.
The early dropsondes show a steady southerly wind below us, with a maximum speed at 620 millibars of 27 mis from 190°. Winds lower down are slightly more easterly, backing to 170°. By 0830 we have passed through the northern cloud mass, and white-caps appear on the ocean below. Scattered stratocumulus cloud is organized into rough north-south lines, marshalled into rows by the low-level winds. Suddenly we are over a line of convective cloud, topped at the aircraft altitude. Temperature and dew-point graphs give a brief jump as we pass, recording the effects of an otherwise insignificant cloud for posterity. The white-caps below are fewer in number while the surface winds decrease to 25 knots from an earlier 35-knot gale.
The many varieties of cloud below and above present a range of meteorological phenomena to our inquisitive eyes. Small outflow boundaries of cumulus and stratocumulus cloud reveal the complex interaction of the wind flows at the surface. Organized lines of low-level convection come and go, unrelated to the higher cloud above. Radar screens show a jumble of convective echoes with overhanging anvils and sheets of altostratus. We attempt to make sense of the scramble of weather about us but are moving too quickly to organize the patterns in our minds.
Mel Shapiro paces from console to console, confirming that data collection is proceeding normally, and planning our approach into the next weather system. The radar turns tempermental and we lose 20 minutes of data.
Yet another dropsonde hisses off into
46 Chinook Summer/Ete 1988
2216~~:=-_...5...,..-____ _
"-1903
"'.:~ "
Figure 1 The flight track flown by Miss Piggy on December 7,1987. Each number along the track indicates the time in UTe (Universal Coordinated Time) at which that point was passed. To convert to PST, subtract 8 hours. Positions at 1616, 1816 and 2216 UTC correspond to the times at which the GOES satellite images were taken (Figure 4).
·Goo; .[J
........... ........ ,
~ COLD. FRONT
..A............WARM FRONT
~OCCLusrON ~" " -~~'
. .
. . .. , . ..... .. ....... . .. , . ..
2216 UTe
Diagram of a typical comma cloud, based on the GOES satellite image taken at 2216 UTC. The shape of the comma cloud is determined by wind flow at upper levels of the atmosphere, particularly in the vicinity of the jet stream. The usual position of the surface low, denoted by a circle with the letter L, is at the top of the dry slot. The low is moving northward.
The tail region of the comma is associated with the surface cold front, and is normally found a short distance ahead of the leading edge of the dry slot. The head region is an area of ascending warm air, causally related to the position of the warm front. The heaviest precipitation in a comma system is normally found in the head region, along the back edge of the dry slot, though heavy thunderstorms along the cold front may drop larger amounts over a limited area.
The dry slot, which gives the cloud mass the typical shape of a comma, is caused when dry air aloft is carried into the centre of the storm by the jet stream winds. Since the winds along the jet are higher than elsewhere, the drier airis advanced farthest along its axis, resulting in the "slot" in the cloud cover. The jet stream usually spreads out and becomes diffuse through the head of a comma system before reorganizing on the northeast side. This particular comma system is a little unusual in that the cloud east of the cold front extends well to the east.
the troposphere, from 5500 m. The air outside falls from -28 to -32°C when we move into colder air. A quick plot of the dropsonde data reveals a moist adiabatic air mass with small regions of stable and unstable lapse rates. The side-scan radar paints a magnificent
Rorschach pattern of slanted convective echoes. I never tire of watching the overhanging precipitation layers downwind from the updraft towers, revealed better from this altitude than I have ever seen them from the ground.
Reaching 135°W (Figure 1), we make

Figure 2 Technician Alex Henry monitors dropsonde data and performance in this view looking toward the nose of the aircraft. The slanted pipe behind his seat is used to release the dropsondes to the atmosphere. The dropsondes themselves are in the boxes next to the tube.
a sharp turn southward, outlining a magnificant thunderhead against the morning sun. There is a rush to the available windows to collect pictures, and for a moment the click of shutters competes with the soporific drone of the engines. Temperatures outside begin to climb as we move into the warm air ahead of the next system. If our ideas are correct this system should already be forming the characteristic comma shape of a mature storm. The warmer air we are moving into is the result of the latent heat released by the developing storm as moisture condenses into raindrops in the head of the comma.
A sudden stomach-churning drop as we cross a wind maximum of 63 knots and then we are on the warm side of the jet. After a few minutes, the winds drop to 45 knots outside and veer to the southwest. The sun disappears into another smoky, grey cirrus curtain as we drone southward.
Three hours into the flight and the housekeeping routine sets in. The crew collects into small groups - coffee, lunch or fitful dozing are now more important than the featureless vista outside. Technician Alex Henry (Figure 2) religiously expells dropsondes through the aircraft belly while Nick faithfully plots the results . How many is that now? How many are left? Conversation slows as
voices weary of talking over the engine noise.
The cloud thickens as we move deeper into the comma head, searching for the cold air and convection we know to lie ahead. The flight plan we have filed prevents us from descending to a lower level for a closer look. A new plan takes 45 minutes to file and by then we will be in our scheduled descent. It's 10 a.m. now, and the data beckon us lower. Mel scans the computer terminals anxiously, concerned that he may be missing data essential to his study.
Ijoin a hurried consultation between Mel and Mike, centred on the one satellite photo we have with us. No new ones are available: the radio fax has been tempermental since the beginning of the experiment. Dropsondes begin to show a more southeasterly circulation in the low levels - a sign that the surface low is beginning to develop. Low-level stratus and cumulus appears while the cloud around us thins. Mel scans the horizon looking for signs of heavier convection but the white veil closes in again and the turbulence picks up.
Winds outside climb to 75 knots and the air continues to warm. We turn south-southeastward, looking for more dynamic weather in the conviction that we are flying down the tail of the comma
and are west of the front. Wind speeds climb sharply to 95 knots when a light chop and a staggering side-to-side lurch announces the presence of the jet stream. Temperatures are up to -25°C outside, and winds have backed to 200°. Are we moving into the centre of this system?
A change in my stomach announces the start of a descent to lower levels. The bumpiness picks up again when we enter the thickest cloud yet. Outside the large oval plexiglass a grey featureless mist veils both ground and sky, leaving only the ghostly outlines of the wings and four large props for reference. And despite the reassuring parade of latitudes and longitudes across the computerscreens ... 43° 16.5' ... 43° 16.4' .. . 134° 4' ... we are lost. Where is the cold air? Where are we - or more aptly, where is the heart of this storm? The constant temperature, steady winds, unvarying moisture and jumble of radar returns give us no clues where to turn.
We reach 3000 m and an angry sea appears again. Jeff Masters, the flight meteorologist and a veteran of numerous hurricane flights, estimates 40-knot winds from the pattern of sea spray and white-caps. A long roller-coaster ride begins, and suddenly, at 1500 m there is rain on the windows. Side-scan radar shows embedded convection again and then we are in it as the sea plays peek-a-boo with the clouds. Surface winds appear to be near storm force now and the cloud takes on a curious 3-D appearance, brought on by our rapid motion and the small scale of the convection. The air smooths as we reach our planned flight level at 600 m.
Bingo! The radar shows a line of organized showers ahead and just as suddenly we are through it. Doppler radar is turned on but too late. We swing in a wide turn to the northeast and prepare to make a second pass. We want to confirm the presence of the front by looking for the characteristic signature of its wind shifts. A sudden bumpiness - with the seat-belt sign illuminated this time - while we approach the radar line. The winds are at 65 knots but are turning in the wrong direction! We turn easterly to cross the suspected front at a right angle. Winds begin to back, temperatures increase. We have found the front and are moving into the warm air.
Ozone sensors record a sharp increase in the gas above us as we pass the front. "A tropopause fold", I am informed. "We see them all the time". For the second pass the Doppler radar is ready. Melinda Trizinsky from PMEL has a fresh tape loaded and the data accumulates rapidly.
47

o ~ 25
200
150
70
60 50
40
30
10
5
o -5
-10
1.5
1.0
0.5
o
8
6
4
2
o
- 2
!<'I.
rnr ''II'r
.I
.t, .• ~ J. irr" "",' t~
~ ~ ~ ,0/1.. ~ oA. .~
'Y
'- - -..r1 ~(",( N.M.
...r ,vt/ ~/ \ If"! ,
Vt '\ ,,"""- .... I ... -...
I _.iw.. J ~ ~,,~ .... .....
l IL~, .. I ll.M; ~, ~W'~ TW .. ~ ~, r'" ~""'\ ...
19:32 19:42 19 :52 2002 2012
Time (UTC)
Wind Direction (degrees)
Wind Speed (knots)
Temperature (C)
Liquid Water
Vertical Wind (m/s)
Figu.re 3 This charl, a copy of the computer displays available aboard the NOAA P-3, shows atmospheric behaviour during repeated passes through the cold front. Each pass is marked by an arrow at the top of the chart: they represent the third to sixth passes described.in the text.
The wind direction graph shows the characteristic shif of winds aloft as the airoraft transits the front. Winds veer from southwest to southeast during the third pass while the aircraft moves from cold air to warm, and in the opposite direction during the fourth pass in the reverse direction. Subsequent passes are less distinct, since the crossing was made at various angles, with sharp change in direction once the frontal surface had been penetrated_
Wind speed sensors show the great variation in conditions along the front , The sharp drop on the fourth pass is associated with the most extreme turbulence of the night, when the aircraft descended SOm in a suddenjolt. In general, winds are strongest at or just on the warm side of the upper-level front,
Temperature changes along the flight path are also most. distinct for the third and fourth passes. Changes in temperat ure are also affected by changes in aircraft alti tude.
Liquid water content of the outside air peaked markedly whe.n the aircraft passed the location of the front. This is due to moisture brought upward by the narrow band of con vecti ve cloud along the front. It was the detection of this band of organized showers by radar that first showed the location of the front.
The vertical wind at aircraft altitude shows sharp peaks of upward motion at the location of the front, This feature of cold fronts (Browning and Pardoe, 1973; Shapiro, 1984; Browning, 1986) is convectively driven, as indicated by the corresponding pattern of liquid water content. A compensating pattern of weak descent can be seen between the frontal passes. Smaller peaks are likely due to convective buildups away from the immediate influence of the front.
48 Chinook Summer!1l:te 1988
New tapes are handy in a box on the floor, ready for the tremendous volume of data to come, Months or years of painstaking analysis will follow before the full tale of this weather system will be told,
Now that the front has been found we follow a sawtooth flight pattern back to the north, eventually zig-zagging across the baroclinic zone eight times. Successive passes show an increasingly disturbed sea surface. Well defined spray streaks, closely spaced, with the surface more than 30% covered by white water indicates winds of at least storm force . We estimate 55 knots, but a few moments later push that to 60. The rapid changes in wind speed surprise me. I had not expected the effect of the front to be so sharply defined on the sea surface.
Our repeated passes show small but distinct variations along the front (Figure 3). The temperature difference between warm and cold air increases from 2 to 3°C as we move northward. Deeper convection develops as we move into our fourth crossing. There is a sudden lurch and my stomach has an out-of-body experience. The floor falls out and I am airborne and temporarily weightless as my feet rise a foot off the carpet. Unsecured objects go flying and garbage spills. The seat-belt light goes on. Luckily I was hanging on to the overhead rail, designed for just such events .
A trip back to the data print-out when the air smooths out shows me that we had only fallen 50 m, in three stiff jolts. "This is nothing", Jeff confides, "In hurricanes we've dropped as much as 450 metres.". Still, it's my first step off of a 150-foot staircase, and I've no desire to improve on it. Discretion is the better part of valour, and Commander Jim Gunnoe has the seat-belt light on as we make pass five. It's barely needed.
Approaching pass seven we seem to be in an occlusion area, with winds shifting very gradually and a much smoother sea. Fatigue is slowing me down, and I attack the sandwiches that had been carried from Vancouver more than 12 hours before. I begin to hope for a turn toward home, and wonder whether I'll be fit for the three-hour drive back to Vancouver. We still have three hours' fuel.
Pass seven fools us. The gentle change in wind direction suddenly sharpens, backing quickly through 40 degrees as we pass through the line of convective cells that marks its position. While we move into the warm air the turbulence returns and the roller-coaster ride is with us for a few more minutes. Strong isolated thunderstorm echoes appear on

a .':'., .. -:-. ~.,~~r.~r~~1~~'-~~~~"~::,
radar 20 miles to the east. We drop to 300 m and turn sharply left for an extended low-level run, I lose my feeling for motion, and am only aware of the turn westward when the sea stares back at me directly through the plexigalss window,
By now the routine is familiar and I begin to doze off, lulled by an annoying whine from a cooling fan, and the steady drone of the engines. Pass eight occurs with much fuss from me and the atmosphere. We are unable to go farther north because of our flight-plan restrictions; therefore we climb and continue westward to search for the low centre. It's 1:30 in the afternoon and we still have an hour and a half of research time before we have to head for home, Dropsondes are readied again as we
Figure 4 Three satellite images taken from West GOES (Geostationary Operational Environmental Satellite) at (a) 1616, (b) 1816 and (c) 2216 UTe, West GOES is in a stationary orbit at 33,000 km above the equator at 135°W longitude and scans the earth at a multitude of wavelengths every half hour, The position of the aircraft at the time of each image is shown by an asterisk (*).
These images were acquired by an infrared sensor operating at 11 fLm on board the spacecraft. Radiation emitted by the earth at this wavelength is almost entirely thermal in origin, and the pictures thus represent a temperature image of the eastern Pacific at each time. Objects with relatively cool temperatures are printed in shades of white, while warm surfaces are in grey or black. Thus the cold deep clouds ofthe storm system are brilliant white while lower (and warmer) clouds are grey and the land surface is nearly black. Grey shades over California darken considerably between the 1616 and 2216 UTe
images because ofthe warming of the ground during the daytime.
The three images show the gradual evolution of a comma cloud system over a six-hour period. During this time the low is developing rapidly at the surface, and winds over the ocean are increasing. The most apparent feature of the development is the movement and opening of the dry slot region as the jet stream carries cool dry air into the system (see Figure 4b). The mottled cloud behind the storm is an extensive area of showers and thundershowers that have developed over the warm ocean as cooler air moves in from the northwest. Unstable conditions over Nevada and Oregon have also given rise to an area of convective cloud on the 2216 UTe
image.
49
\, '" ... -.-
r---~--55--~------11~~
t-----I--~--H'----
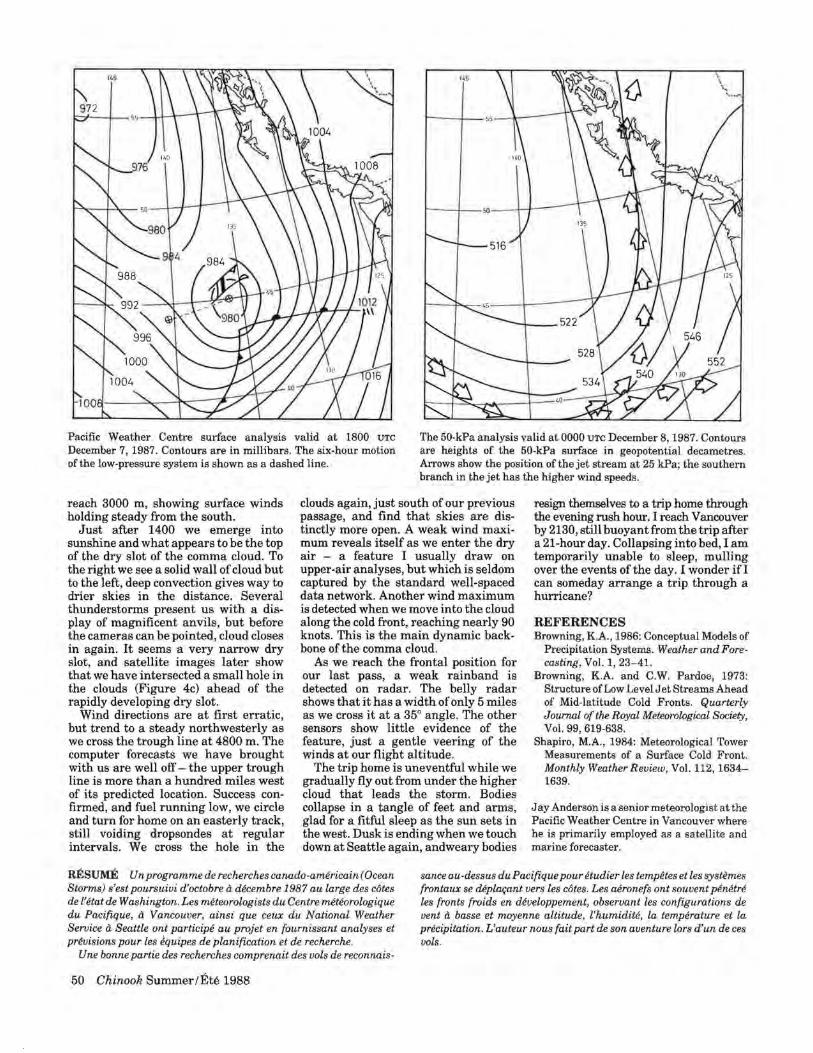
Pacific Weather Centre surface analysis valid at 1800 UTC
December 7,1987. Contours are in millibars. The six-hour motion of the low-pressure system is shown as a dashed line.
The 50-kPa analysis valid at 0000 UTC December 8,1987. Contours are heights of the 50-kPa surface in geopotential decametres. Arrows show the position of the jet stream at 25 kPa; the southern branch in the jet has the higher wind speeds.
reach 3000 m, showing surface winds holding steady from the south.
Just after 1400 we emerge into sunshine and what appears to be the top of the dry slot of the comma cloud. To the right we see a solid wall of cloud but to the left, deep convection gives way to drier skies in the distance. Several thunderstorms present us with a display of magnificent anvils, but before the cameras can be pointed, cloud closes in again. It seems a very narrow dry slot, and satellite images later show that we have intersected a small hole in the clouds (Figure 4c) ahead of the rapidly developing dry slot.
Wind directions are at first erratic, but trend to a steady northwesterly as we cross the trough line at 4800 m. The computer forecasts we have brought with us are well off - the upper trough line is more than a hundred miles west of its predicted location. Success confirmed, and fuel running low, we circle and turn for home on an easterly track, still voiding dropsondes at regular intervals. We cross the hole in the
clouds again, just south of our previous passage, and find that skies are distinctly more open. A weak wind maximum reveals itself as we enter the dry air - a feature I usually draw on upper-air analyses, but which is seldom captured by the standard well-spaced data network. Another wind maximum is detected when we move into the cloud along the cold front, reaching nearly 90 knots. This is the main dynamic backbone of the comma cloud.
As we reach the frontal position for our last pass, a weak rainband is detected on radar. The belly radar shows that it has a width of only 5 miles as we cross it at a 35° angle. The other sensors show little evidence of the feature, just a gentle veering of the winds at our flight altitude.
The trip home is uneventful while we gradually fly out from under the higher cloud that leads the storm. Bodies collapse in a tangle of feet and arms, glad for a fitful sleep as the sun sets in the west. Dusk is ending when we touch down at Seattle again, andweary bodies
resign themselves to a trip home through the evening rush hour. I reach Vancouver by 2130, still buoyant from the trip after a 21-hour day. Collapsing into bed, I am temporarily unable to sleep, mulling over the events of the day. I wonder if! can someday arrange a trip through a hurricane?
REFERENCES Browning, K.A. , 1986: Conceptual Models of
Precipitation Systems. Weather and Forecasting, Vo!' 1,23- 41.
Browning, K.A. and C.W. Pardoe, 1973: Structure of Low Level Jet Streams Ahead of Mid-latitude Cold Fronts. Quarterly Journal of the Royal Meteorological Society, Vo!' 99, 619-638.
Shapiro, M.A., 1984: Meteorological Tower Measurements of a Surface Cold Front. Monthly Weather Review, Vo!' 112, 1634-1639.
Jay Anderson is a senior meteorologist at the Pacific Weather Centre in Vancouver where he is primarily employed as a satellite and marine forecaster.
RESUME Un programme de recherches canado-americain(Ocean Storms) s'est poursuivi d'octobre d decembre 1987 au large des c6tes de l' etat de Washington. Les meteorologists du Centre meteorologique du Pacifique, d Vancouver, ainsi que ceux du National Weather Service d Seattle ont participe au projet en fournissant analyses et previsions pour les €quipes de planification et de recherche.
sance au-dessus duPacifique pour etudier les tempetes et les systemes frontaux se deplar;ant vers les c6tes. Les aeronefs ont souvent penetre les fronts fro ids en developpement, observant les configurations de vent d basse et moyenne altitude, l'humidite, la temperature et la precipitation. L'auteur nous fait part de son aventure lars d'un de ces vols.
Une bonne partie des recherches comprenait des vols de reconnais-
50 Chinook Summer/EM 1988

HALO PHENOMENA OBSERVED BY A.Y. JACKSON ON ST. PATRICK'S DAY, 1920
by Bill Pike
Alexander Young Jackson (1882-1974) had been a Canadian War Artist upon whom Lord Beaverbrook had conferred the rank oflieutenant during the First World War. In 1918, the war's end came suddenly and appeared to have been seen as a surprise anticlimax by Jackson who wrote:
Simpson and I had received twenty-four hours' notice to go to Siberia with the expeditionary force which was being organized to support the White Russians, and we found ourselves back in Canada receiving instructions and getting information about extra equipment. The Armistice was signed while I was in Canada and the Siberian affair collapsed. All I got out of it was twenty tubes of white paint. It was probably this paint that was responsible for me becoming a snow painter as I had to find some use for it.
(J ackson, 1958, p.40)
In February 1920, Jackson answered an "inner urge" to visit friends on an island in Georgian Bay, Ontario, at a time when few people had seen it in winter, to explore and paint there. From Penetanguishene (always abbreviated to Penetang in his references), he set off across the ice on snowshoes to Franceville, some 24 km to the northwest to, what was in summer, a hamlet on a small island.
Having lodged with the France family for some time and applying himself with enthusiasm to painting, a problem arose with the virtual exhaustion of his supply of birch panels (despite painting on both sides). Finding fresh supplies difficult to obtain, painting could no longer be all-consuming, and therefore became a less-immediate occupation, so there was more time to observe nature and write letters instead.
The dubious condition of the ice following several thaws meant an enforced stay with the France family until the end of April when "the ice got honeycombed, turned almost black and suddenly disappeared", enabling Alex to return with all his canvasses to Penetang by boat, and then on to Toronto. It was during this period of relative inactivity at Franceville that he was able to give time to observing a striking meteorological display of halo phenomena that occurred in "clearing weather" in the late afternoon on St. Patrick's Day, 1920.
AN INTERPRETATION OF JACKSON'S OBSERVATIONS This display of halo phenomena was of sufficient brilliance and complexity to move Alex Jackson to write a glowing description of it immediately that evening to his friend and fellow painter, J.E.H. (Jim) MacDonald.
After a brief preamble, the precision and clarity of reporting enables a detailed interpretation of observed phenomena (in brackets below) and a sketch (Figure 1) to be made from Jackson's account:
Still dull and windy, but the cold is no longer making the flake white hard and I have used a considerable quantity ... This afternoon about four it cleared up and I beheld a most remarkable phenomenon .. . about four the sun came out, a cold wintry sun that made grey washed-out shadows on the
Figure 1 "Fish-Eye" view of Jackson's observation of the Franceville display of halo phenomena, seen near Penetang, southeastern Georgian Bay, Ontario, Canada, on 17 March 1920, 1600-1630 EST;
interpreted and drawn by the author.
snow; and then quite suddenly the whole sky seemed full of rainbows, sun dogs and other things. Directly overhead there was a brilliant rainbow [upper circumzenithal are, Z], the blues and violets most intense on the west side; meeting this and forming a vast circle around the sun was a paler rainbow fading toward the horizon [460 halo, H, which only touches the circumzenithal arc when the sun is about 220 high], and inside this another rainbow [220 halo, h], on either side of it a sun dog of such brightness that it was almost like gazing at the sun [parhelia, Land R]. From the sun and through the sun dogs ran a line of light stretching almost entirely round the horizon [parhelic circle, 0]. In the east directly opposite the sun was a whitish blur stretching upward [anthelion, A, with possibly an anthelic pillar, P], and in the line of light on either side, but much wider apart than the sun dogs, were two more blurs of light [paranthelia, Nand M, which occur 1200
from the sun]. It lasted over half an hour, getting fainter and then brilliant again, sometimes one sun dog disappearing entirely; then it faded until nothing was left but the sun and the opposite blue [anthelion] in the eastern sky.
(Jackson, 1958, p. 51)
General fall-out of cirriform cloud in the form of numerous small ice crystals (plates and/or needles in widespread descent with their major axes more-or-Iess horizontal) would explain both the coloured (refraction) and white (reflection)
51

March 1920 (0800 local time around Georgian Bay), continuous light snow was reported farther west in Michigan at Marquette and Grand Rapids, apparently in association with a disturbance (probably a minor trough) moving southeastwards. The halo display was observed in clearing skies, most likely occurring immediately behind this disturbance, with probably subsidence causing a widespread fall-out of crystals as a ridge moved in from the west.
REFERENCES Jackson, A.Y., 1958: A Painter's Country: The Autobiography of
A.Y. Jackson. Clarke, Irwin, Vancouver and Toronto, 170 pp. Tricker, R.A.R., 1970: An Introduction to Meteorological Optics.
Mills & Boon, London, 285 pp.
Bill Pike was an operational meteorologist (1966-72) with the UK Meteorological Office in England. He is now working "selfemployed" as a free-lance meteorological writer and consultant, with special interest in mesoscale events and aviation weather. He is also a qualified artist with an MFA from the University of British Columbia and has been commissioned to paint "Public Art" for several hospitals. He is a fellow ofthe Royal Meteorological Society.
Figure 2 Surface synoptic chart for 1300 GMT 17 March 1920, with 24-h pressure-centre tracks (dotted lines), and the position of A.Y. Jackson's halo observation (EB). The analysis is based on U.S. Northern Hemisphere synoptic weather maps published in the Washington Daily Weather Report. The position of the trough is suggested by the author.
RESUME On donne une explication scientifique aux phenomenes de halo observes par Ie peintre canadien A.Y. Jackson pendant une periode d'environ 30 minutes Ie 17 mars 1920, jour de Ia Saint-Patrick, sur une £le de la baie Georgienne, Ontario. Ses descriptions etaient assez detaillees pour permettre d'esquisser divers phenomenes sola ires tels que les arc-en-ciel, les faux soleils, les halos et les colonnes lumineuses. Ces phenomemes lumineux sont associes aux conditions meteorologiques du moment qui favoriseraient une chute etendue de crystaux de glace dans un ciel qui s'eclaircit d la suite du passage d'un petit creux de basse pression sur la region.
phenomena observed by Jackson (see Tricker, 1970). Figure 2 shows the synoptic situation some 8-8! hours
before A.Y. Jackson's halo observation. At 1300 GMT on 17
Continued from page 43 The book is a result of Gribbin being
an invited observer at a week-long scientific conference in Dahlem, Germany, in November 1987. This opportunity allowed Gribbin to listen to several of the top atmospheric scientists while they presented data collected from the Antarctic continent a few weeks earlier that showed the most severe ozonelayer depletions ever observed.
I appreciated the first five chapters of the book for their role in the presentation of the ozone problem. The relevant terminology is introduced, the background history on ozone-layer concerns is presented, and the facts about our current understanding of ozone-destroying chemicals and how they deplete the ozone layer are provided.
Chapter six on the Antarctic ozone hole is probably the one most readers will be eager to read. Ten to twenty million dollars were spent over the last two years on two international scientific expeditions to Antarctica to try and understand why' ozone concentrations deplete over the southern pole during
52 Chinook Summer/Ete 1988
springtime. Of the three main theories proposed, i.e., solar activity, chemical and dynamic, the latest results "point the finger" at man-made chlorine and bromine chemicals in the upper atmosphere as the main culprits. These chemicals are called chlorofluorocarbons and halons, also known as CFCs or freons. CFCs are used as coolants in refrigeration units, as propellants in some aerosol cans (e.g., air horns), as blowing agents to make rigid foams, and as solvents for electronics circuitry; halons are used mainly in certain types of fire extinguishers.
The scientific community is also very interested in investigating possible ozone depletions in the northern polar regions. A joint American-Russian expedition is expected for the 1988-1989 winter to monitor the Arctic ozone layer. Curiously enough though, Gribbin does not mention Canadian activities at all. Canadian scientists have been monitoring stratospheric chemistry since 1974 as part of Environment Canada's STRATOPROBE project. Highaltitude research balloons are launched regularly to gather data on the ozone layer over Canada. In fact, in March of 1988, the most northerly scientific research balloon flight took place from
Alert (82°30'N, 62°20'W) to collect data on north polar ozone-layer chemistry. More activities are planned for this upcoming winter.
Gribbin makes his book a wellrounded one, listing most of the presently known ozone-layer modifying theories, and containing an extensive list of the chemicals harmful to the ozone layer and even a chapter on the greenhouse effect, i.e., where atmospheric gases like carbon dioxide, methane, water vapour and yes, ozone and CFCs, (also called greenhouse gases or Radiatively Active GaseS, RAGS) absorb and reflect some of the earth's heat trying to escape to space. Our "modern" lifestyles are increasing the concentration of these greenhouse gases in the atmosphere, which in turn is causing our atmosphere to get warmer. Climate modifications caused by this induced warming are expected to be even more serious than ozone-layer depletions.
So what's being done to save our changing atmosphere? Politicians are already meeting internationally to discuss how to deal with the social impacts of ozone depletions and a changing atmosphere. In September 1987, a UNEP
Continued on page 55

WINTER OF 1987-88 IN REVIEW by Amir Shabbar
Fairly mild and snow-free winters are getting to be the norm in Western Canada but harsh winter weather continues to plague Atlantic Canada.
F or the the third consecutive winter, Canadians from the Yukon to the Great Lakes enjoyed a balmy winter. Snowfall amounts were well below the seasonal values in Prairie agricultural areas. In sharp contrast, winter in Atlantic Canada continued to be cold and stormy.
TEMPERATURES Except for the East Coast, northern Quebec and southern Baffin Island, the whole country experienced a milder than normal winter. Temperatures were more than 4°C above normal in the Yukon, central Alberta and southeastern Saskatchewan. Elsewhere, the winter was 2 to 3°C above the long-term average, but managed to be only slightly above normal in southern British Columbia. During February, a dome of cold Arctic air stagnated over northern Quebec and the temperatures dropped to a bone-chilling -43°C in northern and central Quebec. Eureka set a daily record low temperature of -52.6°C for January 31.
PRECIPITATION Once again, winter was drier than normal throughout most of southern Canada. Precipitation was less than half of normal over most of the grain-growing areas ofthe Prairies and over the Yukon. The northern Prairies and the High Arctic had more than 150% of normal. Near normal precipitation fell elsewhere. By the end of January, snowfall was well below normal across the southern Prairies and over the Great Lakes basin. Record-low January snow amounts were recorded at Sarnia (only 8 cm compared with the former record of 12 cm in 1973) and at Toronto, 4.8 cm was the least in 44 years. Heavy snow fell along the East Coast, and by the end of February, Charlottetown had received over 300 cm.
CLIMATIC IMPACTS December, known as a cold month across the Arctic, didn't live up to its past reputation. Although winter did settle in as scheduled, the temperatures were still well above normal in the Yukon. At Whitehorse, the Rendez-Vous week in February was the second warmest in 20 years when daytime highs rose above the freezing mark and it was also one of the driest, with very little snow. Record warm temperatures soaring into the mid-teens characterized the Prairie winter. On several occasions, the mercury climbed into the 16-19°C range in southern Saskatchewan and southern Alberta. Residents were lured to tennis courts and golf courses and other springtime outdoor activities. December was a record mild month on the Prairies, where the temperatures were nearly 9°C above normal in some locations. At least 90 daily maximum temperature records wel'e set including a reading of 9°C at Edmonton on December 25, which established the mildest Christmas Day since the observations began in 1880. December's warmth pushed the mean 1987 temperature to an all-time record high value at many places in a vast area from the Great Lakes to British Columbia, and extending into the Yukon and the District of Mackenzie. The annual mean of 5.5°C at Winnipeg topped the highest reading set in 1931.
Because of the lack of snow on the ground, athletes at the 15th Winter Olympics had to be content with artificial snow for outdoor events.
AES automatic weather observing station at Upper Canada Olympic Park. Eight other observing stations were installed for the 15th Olympic Winter Games near Calgary. Note the dearth of snow on the ground.
Below normal snowfall, however, was the main story from the Prairies. Southern Saskatchewan and southern Alberta were particularly dry receiving no more than one half their normal winter allotment. Estevan's meager 1.8 mm of
53

Nearly 40 cm of snow accompanied by 100 kmlh winds caused whiteouts at Gander on March 18. A total snowfall of over 121 em during March increased the snow depth to almost 100 cm.
300
200
100
1---- CHARLOTTETOWN A. 1
TOTAL SNOWFALL TO END OF MONTH
I /
I
I /
/
ACTUAL /
(WINTER 1987- 88)- /_ AVERAGE
I I
I I
I I
/
I I
/ (1951-80)
/
",..-
// REGINA A. /
4-AVERAGE // (1951-80)
I / I // /
MONTH
Recent winters have been snowy on the East Coast but relatively snow-free on the Prairies. This graph illustrates the large difference between the seasonal snowfall accumulations at Charlettetown and Regina.
precipitation in December was only 9% of normal. Most dugouts in southern Saskatchewan were dry and for the first time since the drought of the Thirties, Old Wives Lake, southwest of Moose Jaw, dried up. Lack of SnOW cover added to the agricultural problems when strong winds blew away precious topsoil off many southwestern Prairie farms. Owing to a lack of adequate snOW cover, cattle ranchers realized a substantial saving in animal feed costs since their cattle could graze On the snow-free rangeland.
54 Chinook Summer/Ete 1988
15 -
10
U !.. 5 w a: :J
~ a: w 0 -Q.
:iE w t-
:iE i -5
x " :iE
10 15
FEBRUARY 1988
CALGARY
29
The daily progress of maximum temperature at Calgary during February. Record to near-record warmth provided balmy weather and hampered some of the Winter Olympic events.
During the Fifteenth Olympic Winter Games in Calgary, the weather was spring-like. Both the participants and the spectators enjoyed the balmy weather while the temperatures rose to near 20°C. Strong winds hampered the skijumping event at the Winter Olympics. For nearly a week, peak sustained winds exceeded 40 kmlh. The winds were much stronger on the slopes of Mount Allen where on some days downhill skiing was postponed. Precipitation was also below normal in the southern B.C. interior where the dry spell was described as the worst in 60 years.
Scanty January snowfall in combination with a relatively snow-free December accounted for a paltry seasonal accumulation of 30.2 cm in the city of Toronto - the lowest seasonal total since the 13.4 cm in the winter of 1943-44. In Ontario, winter arrived with a vengeance in February heralding the onset ofreal winter weather. Snowfalls were nearly double

DEPARTURE FROM NORMAL OF
MEAN TEMPERATURE (OC)
PER CENT OF NORMAL PRECIPITATION
DECEMBER 1987 TO FEBRUARY 1988
the usual amounts in southern and central Ontario. Owing to the low snowfall, the city of North York saved hundreds of thousands of dollars in snow removal costs.
Once again this year, Atlantic Canada shouldered the brunt of cold and stormy weather. A major storm accompanied by strong winds dropped heavy snow on the Maritimes. The Trans-Canada Highway near the Nova Scotia-New Brunswick Border was closed, and sections of other major routes were made impassable by the harsh weather. Charlottetown received its second highest December snowfall of 153 cm. During January 14-15, bitter cold temperatures along with strong winds created extremely uncomfortable conditions in the Maritimes. Heavy demands for electricity caused
widespread power outages in several areas of New Brunswick, and a new 24-hour record for power consumption was set in Nova Scotia. At least three major winter storms crossed the East Coast during January. Nain in northern Labrador received a whopping 199 cm of snow, double the normal amount. Compared with past winters, indoor heating costs were 10-14% less in western Canada because of the prolonged mild winter weather. But they were slightly more in Atlantic Canada.
Continued from page 52
(United Nations Environment Program) conference saw 27 countries sign the Montreal Protocol, to protect the earth's ozone layer by adopting a global strategy to ban the use of CFCs. Gribbin and other environmentalists are obviously not impressed with the Montreal protocol. They claim that had the conference been held after the latest Antarctica results, the meeting's objectives to phase out CFCs would have been taken more seriously. We must keep in mind though that many levels of government and industry are involved in these talks and we should applaud that there is an agreement at all. The Montreal protocol also holds a very important clause. The treaty will undergo a review every four years to keep the objectives current with the scientific evidence. In fact, the UNEP leader can reconvene all countries at any time if the scientific evidence warrants new protocol objectives. Gribbin's book will be a valuable tool to educate the politicians and
Amir Shabbar is a meteorologist in the Canadian Climate Centre engaged in developing long-range prediction techniques.
public prior to the next round of negotiating sessions. Our desire to reconvene again in the near future will show our level of commitment to protect the ozone layer.
Gribbin encourages consumers to voice their desire to protect the ozone layer by finding out where CFCs are used and then by refusing to buy products that contain ozone-destroying chemicals. Friends of the Earth, in England, have produced a list of products that do not contain ozone-destroying chemicals. I have not found such a list in Canada but it could make for a very interesting science fair project. Friends of the Earth-Canada offers an ozone information kit for $7.00 that is also a good source of information on ozonelayer concerns for the consumer. Their new address is: Friends of the EarthCanada, Les Ami(e)s de la TerreCanada, 251 Laurier Ave. W., Suite 701, Ottawa, Ontario KIP 5J6.
Gribbin's section on further reading is a valuable source of material and his index makes the book valuable as a mini-dictionary on ozone-related terminology. I would recommend this book for advanced high school science classes on up, from chemistry to physics, to
biology and geography; even economics classes can benefit by discussing the social and environmental impacts of CFCs and energy pricing. An excellent source of information for more advanced readers is F. Sherrwood Roland's (free) booklet Earth's Atmosphere in the Twenty-First Century. This cohesive account of stratospheric chemistry from a pioneer of ozone-layer research is an invaluable reference. Write to: Institute for Environmental Studies, University of North Carolina at Chapel Hill, 311 Pittsboro Street (256H), Chapel Hill, NC 27514, U.S.A. (tel: 919-966-2358).
Browsers might find leafing through Gribbin's diagrams frustrating since not all of them are properly labelled or quote their source of reference. I would have preferred SI units as well. Maybe for future editions, an executive summary at the beginning of each chapter using non-scientific terms would be appreciated by the readers with less scientific training.
However, as we head into battle again to save our ozone layer, rarely have so few pages done so much for so many.
Lewis Poulin
55

WHEN PLACES WERE NAMED FOR WEATHERMEN
A little more than a century ago six locations in the Hudson Strait area were named by Lieut. Andrew Robertson Gordon for the weathermen who overwintered there in 1884-85. Gordon, a retired Royal Navy officer, was Deputy Superintendent of the Meteorological Service at this time but spent most summers away from his desk in Toronto seconded for naval operations with the Department of Marine and Fisheries.
In 1884 Gordon was named commander of the First Hudson's Bay Expedition launched to ascertain "for what period of the year the Straits are navigable" . In July 1884 he sailed from Halifax on the S.S. Neptune with the ship's crew and an expedition staff of two dozen. After a few stops along the Labrador coast Gordon selected his first observing station near Cape Chid ley on August 15 and named it Port Burwell after the observer he placed in charge, Herbert Mahlon Burwell of London, Ontario. Two "station men" were left with Burwell as assistants to take several observations daily of tide, ice and weather.
Over the next two months Gordon established five similar observing stations at Ashe's Inlet, Stupart's Bay, Port De Boucherville, Port Laperriere and Skynner's Cove, each named for the head of the observing party he left behind at that location. After visiting Churchill and York Factory on the west side of Hudson Bay, where he engaged Hudson's Bay Company men to make similar observations, Gordon and the ship's party sailed for St. John's, Newfoundland, where they arrived on October 11. Meanwhile the six observing parties were beginning their period of isolation which was to last for nearly a year.
Gordon got an early start in 1885 sailing from Halifax with replacement observers on H.M.S. Alert on May 27. Progress was slow, however, owing to ice, and it was August 1 before he anchored in Skynner's Cove were he found that "the observers were all well and had passed a very pleasant winter" . At Port Burwell because of the ice,
56 Chinook SummerlIhe 1988
by Morley Thomas
65 0 -
NOTTINGHAM~ HUos ISLANDC"'-, ON
'-" PORT DE c::::::I
~BOUCHERVILLE
PORT ~ lAPERRIERE
r-\ QU EBEC
\ \ ( \ 800 75°
\ ..
\ ATLANTIC
<::::l OCEAN
q RESOLUTION ISLAND
PO RT BURWELL
DUNGA VA , BA Y
\ 600
600
/'
Map of Hudson Strait showing the si tes of the six observation posts set up in 1884 and named after the weather observers who manned them (Adapted from RL. Richards, 1982: Dr. John Rae and the Hudson Bay Route. Muskox, Vol. 31, 60- 70).
WEATHERMEN'S PLACE NAMES
Names Given by Gordon in 1884
Other Names Used by Gordon
Port Burwell Cape Chidleigh 600 25'N,64°50'W Ashe's Inlet 62°34 'N,700 36'W Stupart's Bay 61°34'N,71°35 'W Port De Boucherville Nottingham Island 63°12'N,77°33'W Port la Perri ere Cape Digges 62°43'N,78°04 'W Skynner's Cove Nachvak Cove 59°06'N, 63°31 'W
Gordon had to walk ashore where he found that the observers had also spent a pleasant winter. The ice continued to pose major problems and by August 21 he decided he could not take the ship into Ashe's Inlet. There, the assistants came out over the ice to advise that Mr. Ashe was sick and had a sprained wrist. Next, Gordon anchored at Stupart's Bay and learned that Stu part had been forced to leave for Fort Chimo in his boat, since he had given his remaining provisions to relieve famine amongst the natives. At Port De Boucherville,
Chief Observer 1884-85 1885-86
H.M. Burwell G.R Shaw
W.A. Ashe J .W. Tyrell
RF. Stupart F.F. Payne
C.V. De Boucherville John McKenzie
A.N. Laperriere Percy Woodworth
William Skynner [Abandoned]
Gordon heard that a station man had died of scurvy but at Port Laperriere he found the men had "spent a very pleasant and comfortable winter". On the eastbound trip through the Strait, Gordon found that Ashe was suffering from scurvy, but with medical treatment Ashe improved rapidly.
During these summer expeditions, scientific studies were made from the ship of ice, geology, currents, tides and sea surface temperatures. Some surveying was done. Gordon reported on his observations of the native people and

Ashe's Inlet meteorological station .
Friendly eskimos at the meteorological sta tion, Stupart's Bay.
the fauna, on the natural resources of the Hudson Bay and Strait's region and on the trade carried on by the HBC and some Americans. In one report Gordon argued strongly for Churchill as the terminus of the proposed railway to Hudson Bay instead of Port Nelson where he discovered no harbour really existed. Gordon's final voyage in 1886, again on the Alert, was to dismantle the observing stations and to pick up those who had overwintered in 1885-86.
Little is known of most of the eleven chief observers who manned the sta-
tions over the two winters but three were professional meteorological observers. William Ashe, of Quebec City, was the son of Commander E.D. Ashe, founder and director of the Quebec Observatory, and later served as director himself from 1886 until his death in 1893. Frederic Stu part had begun to work with the Meteorological Service at age 15 in 1872, became director in 1894 and did not retire until 1929. Frank Payne also served at Meteorological Service headquarters in Toronto from 1877 to 1922 variously as an assistant
librarian, as secretary and as accountant. The J.W. Tyrell who overwintered in 1885-86 at Ashe's Inlet was from Weston, Ontario, a brother of J.B. Tyrell, the famous geologist and historian . C.V. De Boucherville and A.N. Laperriere were from Ottawa and William Skynner from Springfield, Ontario.
Lieutenant Gordon was somewhat of a maverick in the Meteorological Service. Appointed to the Toronto post at age 29 by the Department, the sea remained his first love. He helped administer the Service, made inspection trips and prepared a plan for expansion of the observing network into the Canadian West but he did manage to get away for naval duty each summer from 1884 until he left the Service in 1890. In his reports on the Hudson's Bay Expeditions he was able to advise that the best navigation conditions were to be encountered in August and September with July and October marginal in some years. Despite being a public servant Gordon was very active in politics, which may have led to his appointment in October 1891 as Nautical Advisor and Commander of the Fisheries Protection Service of the department. Unfortunately he died from consumption in 1893 at age 42.
Even though native names are replacing English and French place names in the Hudson Strait and other areas of Canada's North , most of the weathermen's names given by Gordon still exist. The name Skynner's Cove has been renamed Schooner Cove and Port Burwell, unofficially listed as Killiniq in Quebec, has been abandoned as a populated place. However, Ashe Inlet, Port de Boucherville, Port de Laperriere and Stu part Bay are names still in use, appearing on the latest 1:250,000 scale maps published in 1983. In addition, it is pleasing to note that Andrew Gordon Bay was so named and the name still exists on the north side ofH udson Strai t just east of Cape Dorset.
Morley Thomas has had a long and distinguished career with the Atmospheric Environment Service and the World Meteorological Organization. He is a former Director General of the AES Canadian Climate Centre and is currently Archivist for the Canadian Meteorological and Oceanographic Society.
57

INTERPRETING SATELLITE IMAGERY
by Phil Cote
Have you ever wondered how much information can be obtained from satellite imagery? On the accompanying visual (VIS) and infrared (ll-fLm) NOAA-lO satellite pictures for 12 November 1986, a number of features can readily be recognized. Much more information can be obtained from the satellite imagery; only the major features that the majority of people can identify are pointed out below. I should stress that to gain the most from satellite imagery, it is better to have both the visual and infrared channels rather than either one alone.
GEOGRAPHICAL AREA Much of the geographical area con
tained in the satellite photographs is southern Hudson Bay and all of James Bay. The Belcher Islands are located near the centre of each picture. Northern Ontario and northern Quebec constitute most of the land mass.
METEOROLOGY The 1200 UTe surface analysis for 12 November 1986 from the Canadian Meteorological Centre showed a quasistationary 100.2-kPa low-pressure area centred near 63°30'N, 800 W in northeastern Hudson Bay, a 105.0-kPa highpressure area centred in Montana, and a 101.6-kPa low-pressure area with an accompanying Arctic frontal wave over the Great Lakes. A moderate to strong cyclonic flow of Arctic air existed over much of Hudson Bay. A broad trough of low pressure extends southwestward from the low-pressure area located in northeastern Hudson Bay.
CLOUD INTERPRETATION First let us turn our attention to the various cloud patterns and indicate the main mechanism causing the clouds to form. The low-pressure area over the Great Lakes with its associated Arctic frontal wave is causing overrunning to spread as far north as southern James
58 Chinook Summer/Ete 1988
Visual satellite image for 1355 UTe on 12 November 1986.
Bay. This can be seen by the thick cloud cover of fairly warm, moist air that masks most features south of James Bay but becomes gradually thinner towards the north. The visual image hides more features of southern James Bay than the infrared image, which is recording temperatures for the surface rather than for the thinning cloud layer. This is the reason the ice edge is easier to identify southeast of Akimiski Island (see Ice Interpretation section).
These two satellite pictures also show a good example of the effect of cold air moving over open water. The area from the Belcher Islands to just north of Akimiski Island is dominated by this effect. Since the surface windflow pattern is from the west, the convective cumulus clouds form over the open water just downwind ofthe ice edge and not at the coastline. The ice cover in effect cuts off the moisture transfer from the warmer water to the colder air, and thus for most moisture transfer models may be considered a "land" surface rather than a water surface. Close inspection shows individual cumulus clouds to be small upon formation. These cells gradually increase in size with time and distance travelled over open water. Notice how the clouds line up in "streets" and are parallel to the
wind direction. This orientation results in part because the air lifted by convection is replaced by the surrounding air, which descends from above - a process called subsidence that retards cloud formation. Once the air moves over any land areas, the influx of moisture terminates and the clouds dissipate rapidly. Even Long Island has such an effect of stopping the convective process, which is shown by the narrow band of clear skies stretching due eastward.
Much of Hudson Bay is being controlled by a cyclonic circulation that is conducive to extensive cloud cover. In the top left-hand portion of the visual image, it is rather difficult to make out the forms of this cloud cover owing to the low sun angle at the latitude of this picture. However, the infrared image, being temperature-dependent, clearly shows the cloud patterns. Within this cyclonic circulation two embedded troughs are indicated by the cloud patterns on both satellite images. One exists in northwestern Ontario, westward from Winisk, and its cloud formation masks the ice cover just offshore between Winisk and Fort Severn. The second is located in southeastern Hudson Bay, showing up as a weak cyclonic circulation located between the Belcher Islands and Inukjuak.

· .... SUTTON . LAKE
MISSISA ~ LAKE
The ll-f.Lm satellite image for 1355 UTe on 12 November 1986.
ICE INTERPRETATION Next let us see what ice information
can be obtained. The most obvious is the ice cover forming along the coastline in both southwestern Hudson Bay and western James Bay. The visual and infrared images can each delineate the ice edge throughout most of the area. Within 15 to 40 nautical miles of the shore, there is about 90% coverage of sea ice (classified as new and grey ice up to 15 cm thick. In the area between Winisk and Fort Severn, cloud cover masks much of the ice. To the southeast of Akimiski Island, the ice edge is very difficult to locate using the visual
imagery because both cloud and ice have similar textures and grey scales in the visible spectrum. However, using the infrared imagery, the ice edge is clearly identifiable since the infrared radiation emitted by the ice is different from that of the open water. Farther south in James Bay, the ice edge becomes masked by the cloud cover in both the visual and infrared images.
On close examination of both images, one can see the effect the wind is having on the ice near its edge, between Cape Henrietta Maria and Akimiski Island. Here the surface winds are drifting the ice farther seaward resulting in lesser
ATMOSPHERE-OCEAN The scientific journal of international meteorological and oceanographic research. Quarterly publication.
CMOS NEWSLETTER Keeps you in touch with the activities ofthe Canadian Meteorological and Oceanographic Society. Six times a year.
CLIMATOLOGICAL BULLETIN Climatological research and news. Three times a year.
ice concentrations and causing it to form strips and patches. Northward from Akimiski Island and immediately along the coastline, a narrow coastal lead is evident due also to the offshore wind stress. In this zone, new ice is continually being created, and then is driven eastward, to be replaced by more new ice; like a conveyor belt.
Two other ice-related features are also identifiable, particularly on the infrared image. In Sutton Lake, one can easily see the darkness that signifies warmer temperatures and indicates mainly open water. This is only partially noticeable on the visual image because cloud cover is encroaching from the northwest. The second feature is on Missisa lake. On the visual image, the lake is seen as a continuous white area that signifies the lake is completely ice and snow covered. On the infrared imagery, the entire area of the lake is seen as a light grey colour in contrast to the white colour of the surrounding land mass. The grey tone tells us that the ice cover is fairly thin since it allows significant infrared radiation from the water below to pass through it.
NON·METEOROLOGICAL INTERPRETATION One other feature shows up in these satellite photos - the convective streamer produced at the James Bay Hydroelectric Project located near Radisson. On the infrared image the streamer stands out clearly but is nearly hidden on the visual image. Looking at this convective streamer, one can deduce that the winds in the lower levels of the atmosphere are blowing from west to east.
Phil Cote is an Ice Meteorologist and Consultant working in the Atmospheric Environment Service Ice Centre, Ottawa. He is engaged in special studies, handles satellite data, prepares publications and provides information to various clients.
These publications are all available from CMOS, P.O. Box 334, Newmarket, Ontario, Canada L3Y 4X7.
59
THE CANADIAN MAGAZINE OF WEATHER AND OCEANS
WHAT? Chinook is a popular magazine concerned with two major components of the Canadian environment - the atmosphere and the oceans. It is published quarterly by the Canadian Meteorological and Oceanographic Society (CMOS).
Features in Chinook include articles, weather summaries, interpretations of satellite and other photographs, and news and notes. These appear in the language submitted (English or French) , In addition, summaries of all articles appear in the other language.
WHY? The aims of Chinook are • to increase public awareness of mete
orology and oceanography in Canada and of their modern scientific and technological aspects and achievements
• to stimulate public interest in and understanding of the impact of climate, weather and oceans on Canadian society and economics
• to inform Canadians about the education , information and interpretative services available to them on climate, weather and oceans
WHO? Features in Chinook are chosen to appeal particularly to • secondary school andcommunitycol
lege students • farmers, fishermen and foresters
I I I I , I I I
I I
I I I I I 1 I I I I 1 I
SUBSCRIPTION ORDER
Please enwr my subscription to Chinook for one year (1989, 4 issues) at the following raW (please check one):
o CMOS Member $10,00 o Non-member Ind ividual $12 .00 o Institution $15 ,00
Nnm~c----------------------~I7.r<=.~ •• ~PH~' N~T~l----------------------
AddreR·'-------------------------------------------- ':-......,.-,--.-L-C-OO-,El
School o r U ni versity (if s tudent) __________________________________ __
Mail with payment to CMOS, P,O, Box 334, Newmarket, Ontario L3Y 4X7,
This is a 0 NEW order; a 0 subscription renewal. $ _________ is enclosed.
Back issues: $5,00 each; 10 or more: $4,00 each L ________ __ _____________________ _______________ ______ _________ _
• marine-recreation, sports and tourism operators and enthusiasts
• aviators • amateur observers of natural pheno-
mena • specialists in other sciences • environmentalists
HOW? Subscriptions to Chinook may be ordered using the handy form above.
LA REVUE CANADIENNE DE LA METEO ET DES OCEANS
QUOI? Chinook est une revue de vulgarisation qui traite de I'atmosphere et des oceans - deux des importants elements qui composent I'environnement canadien . Chinook est publ ie tous les trois mois par la Societe canadienne de meteorologie et d'oceanographie (SCMO),
On retrouve dans Chinook des articles, des sommaires du temps, des interpretations de photos satellitaires et autres, des articles d'actualite et des notes. Ces articles paraissent dans la langue originale, Ie francais ou I'anglais; tous les resumes sont rediges dans I'autre langue.
POURQUOI? Chinook vise a ; • eveiller la curiosite du public en ce
qui a trait aux aspects de la meteorologie et de I'oceanographie au Canada et a I'informer des realisations scientifiques et technologiques d'aujourd'hui;
• stimuler I'interet du public et I'aider a mieux com prendre les effets du climat, du temps et des oceans sur la societe et sur I'economie du Canada;
• renseigner les canadiens sur les services d'education, d'information et d'interpretation qui leurs sont disponibles et qui traitent du climat, du temps et des oceans,
QUI? Les articles choisis pour Chinook vise a interesser notamment ;
ABONNEMENT • les etudiants d'ecoles secondaires et
de colleges communautaires
Je desire m'abonner a Chinook pour une annee (1989, 4 numeros) au tarif suivant (veuillez cocher):
• les agriculteurs, pecheurs et agents forestiers
o Membre de la SCMO 10,00 $ 12,00 $ 15,00 $
• les exploitants d'etablissements de nautisme, de sports et de tourisme, et les amateurs des ces activites
o Non-membre o Institution
Nom--------------------~,~.K~M~A~"~u,=cu=L=Es~'~v=e~l--------------------
Adre$~ .. --------------------------------------------~(~CO~O~E~~~ST~A~L)
Ecole ou un iversi te (pour etud iantJ ________________________________ __
Envoyez votre paiement ala SCMO, C,P, 334, Newmarket (Ontario) L3Y 4X7.
Premier abonnement 0 Renouvellement d'abonnement 0 Numeros epuis.s: 5,00 $ chacun; pour 10 au plus: 4,00 $ chacun J'inclus _______ $
• les aviateurs • les observateurs amateurs de pheno
menes naturels • les specialistes d'autres sciences • les environnementalistes
COMMENT? On peut s'abonner a Chinook en envoyant Ie formulaire cicontre .
Related Documents