Office of Institutional Research Prepared by the Office of Institutional Research 6/21/2012 7th Day Enrollment Report Summer 2012

Welcome message from author
This document is posted to help you gain knowledge. Please leave a comment to let me know what you think about it! Share it to your friends and learn new things together.
Transcript

Office of Institutional Research
Prepared by the Office of Institutional Research
6/21/2012
7th Day Enrollment Report
Summer 2012
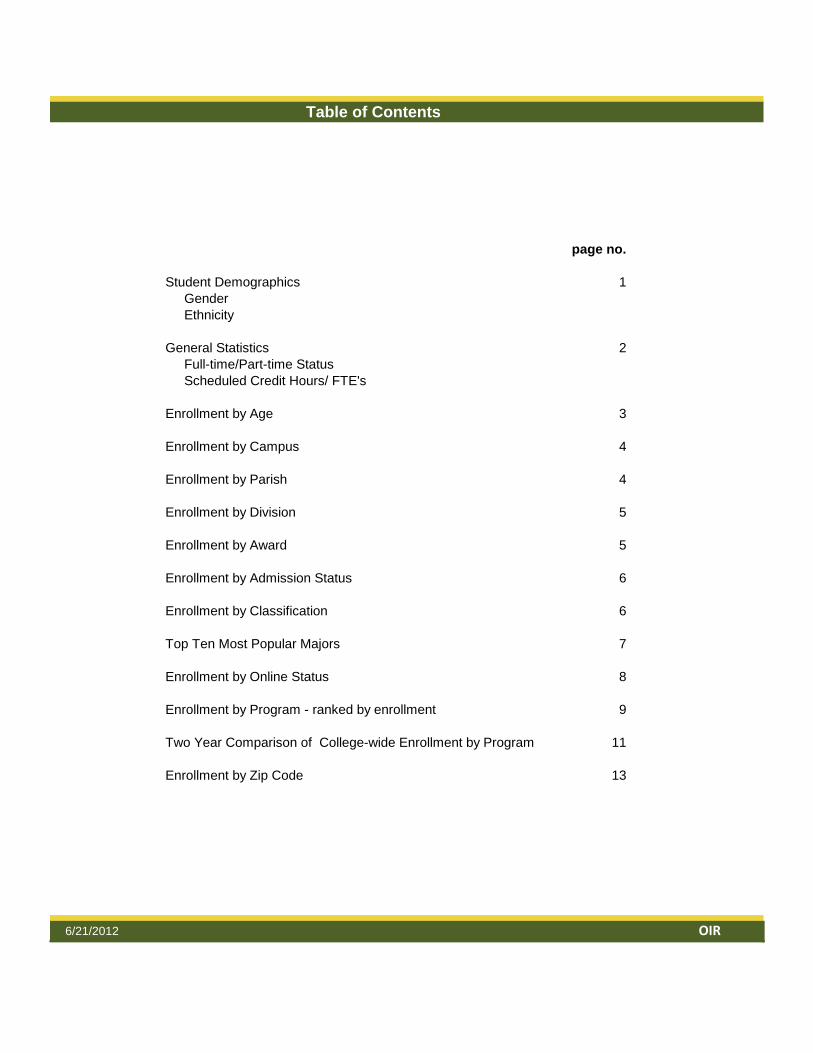
Table of Contents
page no.
Student Demographics 1
Gender
Ethnicity
General Statistics 2
Full-time/Part-time Status
Scheduled Credit Hours/ FTE's
Enrollment by Age 3
Enrollment by Campus 4
Enrollment by Parish 4
Enrollment by Division 5
Enrollment by Award 5
Enrollment by Admission Status 6
Enrollment by Classification 6
Top Ten Most Popular Majors 7
Enrollment by Online Status 8
Enrollment by Program - ranked by enrollment 9
Two Year Comparison of College-wide Enrollment by Program 11
Enrollment by Zip Code 13
6/21/2012 OIR
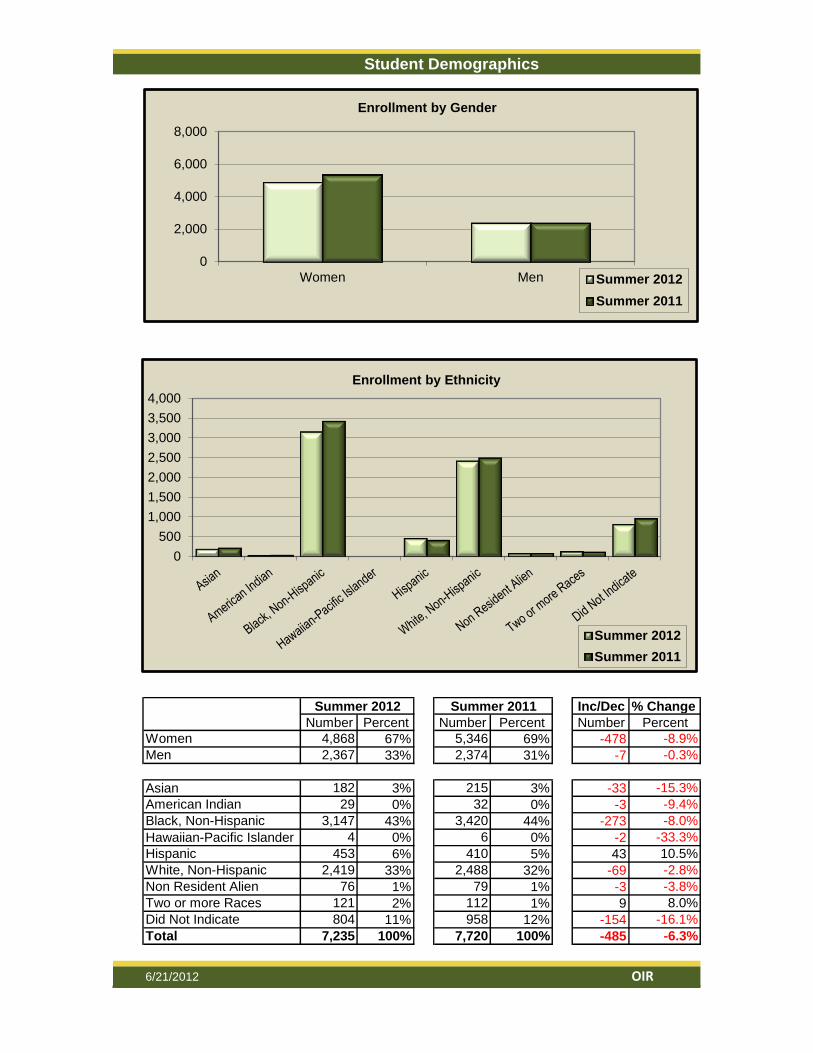
Summer 2012 Summer 2011 Inc/Dec % Change
Number Percent Number Percent Number Percent
Women 4,868 67% 5,346 69% -478 -8.9%
Men 2,367 33% 2,374 31% -7 -0.3%
182 3% 215 3% -33 -15.3%
American Indian 29 0% 32 0% -3 -9.4%
Black, Non-Hispanic 3,147 43% 3,420 44% -273 -8.0%
4 0% 6 0% -2 -33.3%
Hispanic 453 6% 410 5% 43 10.5%
White, Non-Hispanic 2,419 33% 2,488 32% -69 -2.8%
Non Resident Alien 76 1% 79 1% -3 -3.8%
Two or more Races 121 2% 112 1% 9 8.0%
Did Not Indicate 804 11% 958 12% -154 -16.1%
Total 7,235 100% 7,720 100% -485 -6.3%
6/21/2012 OIR
Asian
Hawaiian-Pacific Islander
Student Demographics
0
2,000
4,000
6,000
8,000
Women Men
Enrollment by Gender
Summer 2012
Summer 2011
0
500
1,000
1,500
2,000
2,500
3,000
3,500
4,000
Enrollment by Ethnicity
Summer 2012
Summer 2011
jren
Typewritten Text
1
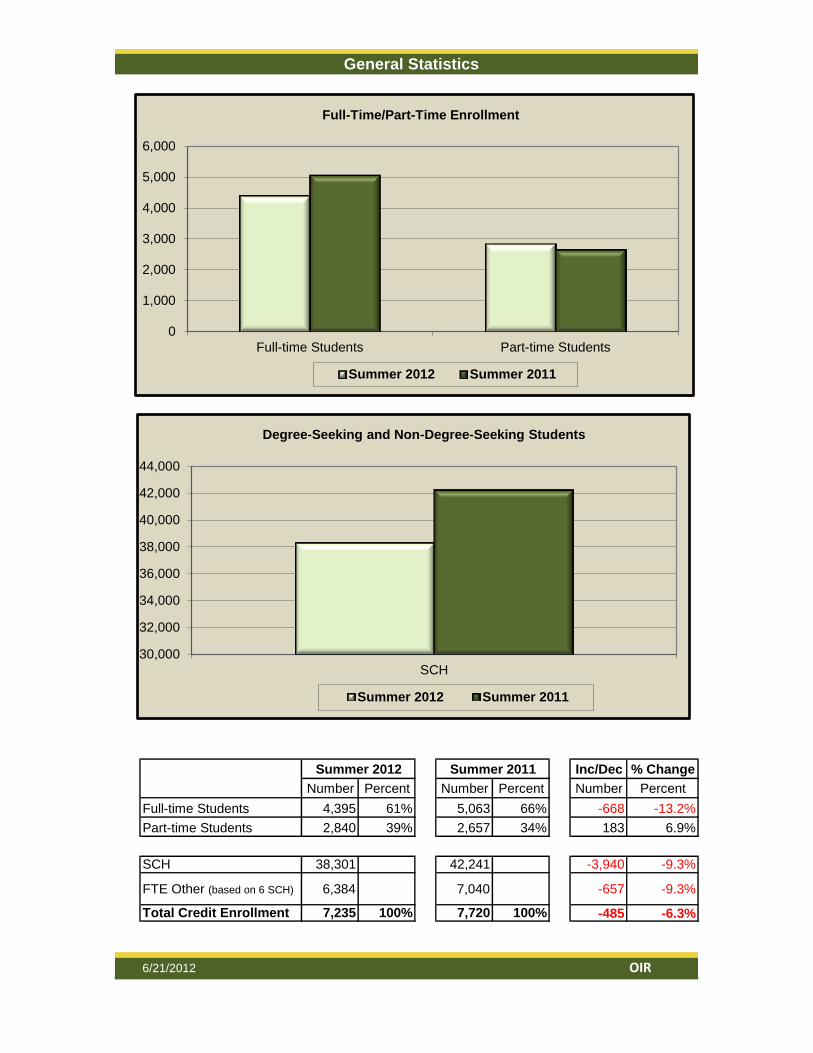
General Statistics
Summer 2012 Summer 2011 Inc/Dec % Change
Number Percent Number Percent Number Percent
Full-time Students 4,395 61% 5,063 66% -668 -13.2%
Part-time Students 2,840 39% 2,657 34% 183 6.9%
SCH 38,301 42,241 -3,940 -9.3%
FTE Other (based on 6 SCH) 6,384 7,040 -657 -9.3%
Total Credit Enrollment 7,235 100% 7,720 100% -485 -6.3%
6/21/2012 OIR
0
1,000
2,000
3,000
4,000
5,000
6,000
Full-time Students Part-time Students
Full-Time/Part-Time Enrollment
Summer 2012 Summer 2011
30,000
32,000
34,000
36,000
38,000
40,000
42,000
44,000
SCH
Degree-Seeking and Non-Degree-Seeking Students
Summer 2012 Summer 2011
jren
Typewritten Text
2
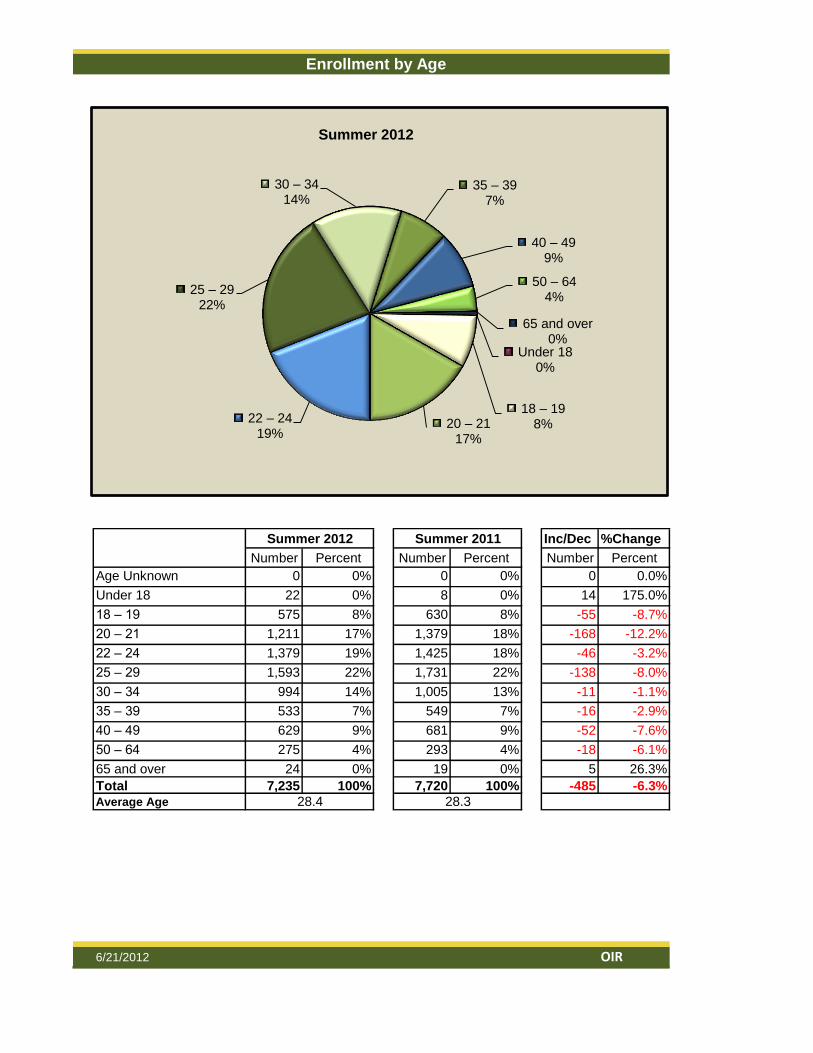
Enrollment by Age
Summer 2012 Summer 2011 Inc/Dec %Change
Number Percent Number Percent Number Percent
Age Unknown 0 0% 0 0% 0 0.0%
Under 18 22 0% 8 0% 14 175.0%
18 – 19 575 8% 630 8% -55 -8.7%
20 – 21 1,211 17% 1,379 18% -168 -12.2%
22 – 24 1,379 19% 1,425 18% -46 -3.2%
25 – 29 1,593 22% 1,731 22% -138 -8.0%
30 – 34 994 14% 1,005 13% -11 -1.1%
35 – 39 533 7% 549 7% -16 -2.9%
40 – 49 629 9% 681 9% -52 -7.6%
50 – 64 275 4% 293 4% -18 -6.1%
65 and over 24 0% 19 0% 5 26.3%
Total 7,235 100% 7,720 100% -485 -6.3%
Average Age
6/21/2012 OIR
28.4 28.3
Under 18 0%
18 – 19 8% 20 – 21
17%
22 – 24 19%
25 – 29 22%
30 – 34 14%
35 – 39 7%
40 – 49 9%
50 – 64 4%
65 and over 0%
Summer 2012
jren
Typewritten Text
3
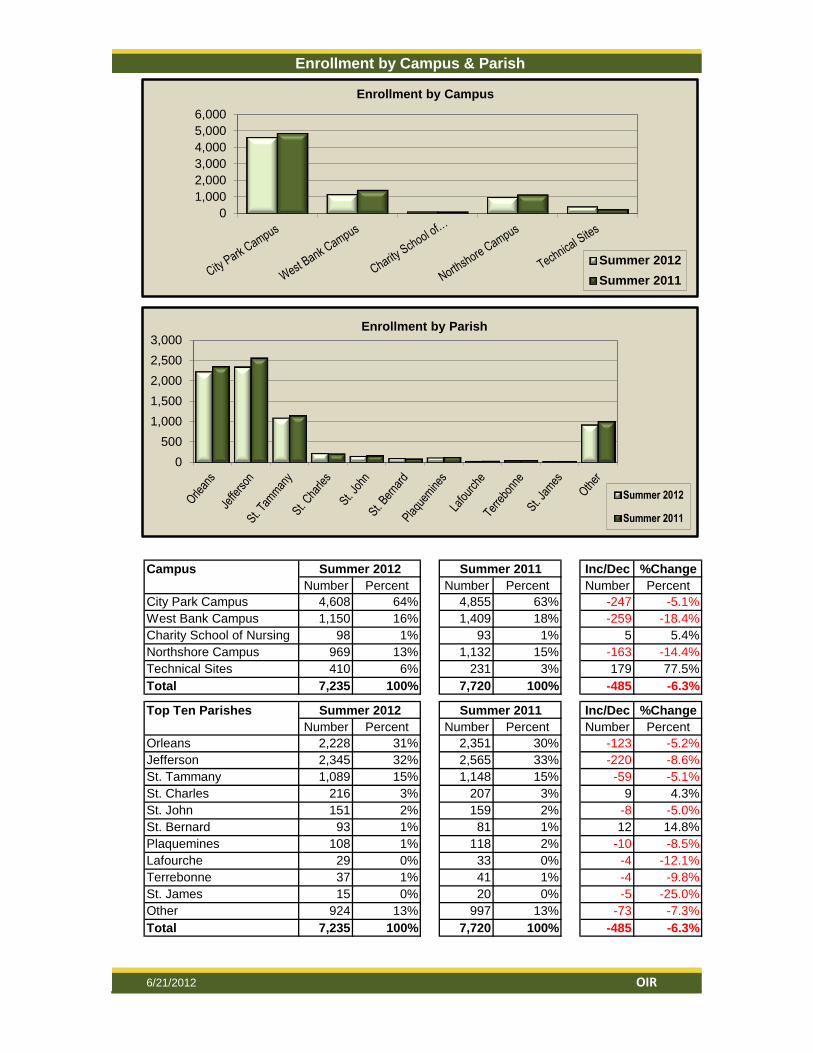
Enrollment by Campus & Parish
Campus Summer 2012 Summer 2011 Inc/Dec %Change
Number Percent Number Percent Number Percent
City Park Campus 4,608 64% 4,855 63% -247 -5.1%
West Bank Campus 1,150 16% 1,409 18% -259 -18.4%
Charity School of Nursing 98 1% 93 1% 5 5.4%
Northshore Campus 969 13% 1,132 15% -163 -14.4%
Technical Sites 410 6% 231 3% 179 77.5%
Total 7,235 100% 7,720 100% -485 -6.3%
Top Ten Parishes Summer 2012 Summer 2011 Inc/Dec %Change
Number Percent Number Percent Number Percent
Orleans 2,228 31% 2,351 30% -123 -5.2%
Jefferson 2,345 32% 2,565 33% -220 -8.6%
St. Tammany 1,089 15% 1,148 15% -59 -5.1%
St. Charles 216 3% 207 3% 9 4.3%
St. John 151 2% 159 2% -8 -5.0%
St. Bernard 93 1% 81 1% 12 14.8%
Plaquemines 108 1% 118 2% -10 -8.5%
Lafourche 29 0% 33 0% -4 -12.1%
Terrebonne 37 1% 41 1% -4 -9.8%
St. James 15 0% 20 0% -5 -25.0%
Other 924 13% 997 13% -73 -7.3%
Total 7,235 100% 7,720 100% -485 -6.3%
6/21/2012 OIR
0
1,000
2,000
3,000
4,000
5,000
6,000
Enrollment by Campus
Summer 2012
Summer 2011
0
500
1,000
1,500
2,000
2,500
3,000Enrollment by Parish
Summer 2012
Summer 2011
jren
Typewritten Text
4
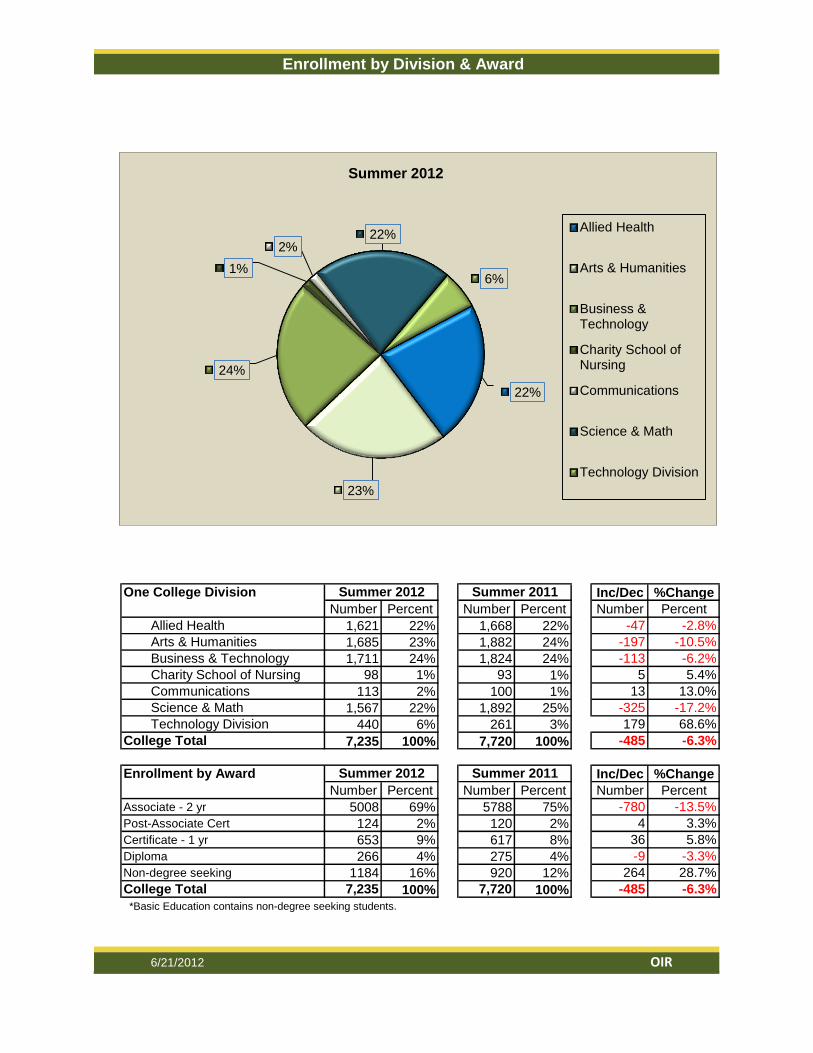
Enrollment by Division & Award
One College Division Inc/Dec %Change
Number Percent Number Percent Number Percent
Allied Health 1,621 22% 1,668 22% -47 -2.8%
Arts & Humanities 1,685 23% 1,882 24% -197 -10.5%
Business & Technology 1,711 24% 1,824 24% -113 -6.2%
Charity School of Nursing 98 1% 93 1% 5 5.4%
Communications 113 2% 100 1% 13 13.0%
Science & Math 1,567 22% 1,892 25% -325 -17.2%
Technology Division 440 6% 261 3% 179 68.6%
College Total 7,235 100% 7,720 100% -485 -6.3%
Inc/Dec %Change
Number Percent Number Percent Number Percent
Associate - 2 yr 5008 69% 5788 75% -780 -13.5%
Post-Associate Cert 124 2% 120 2% 4 3.3%
Certificate - 1 yr 653 9% 617 8% 36 5.8%
Diploma 266 4% 275 4% -9 -3.3%
Non-degree seeking 1184 16% 920 12% 264 28.7%
College Total 7,235 100% 7,720 100% -485 -6.3%
*Basic Education contains non-degree seeking students.
6/21/2012 OIR
Summer 2011
Enrollment by Award
Summer 2012
Summer 2012 Summer 2011
22%
23%
24%
1%
2% 22%
6%
Summer 2012
Allied Health
Arts & Humanities
Business &Technology
Charity School ofNursing
Communications
Science & Math
Technology Division
jren
Typewritten Text
5
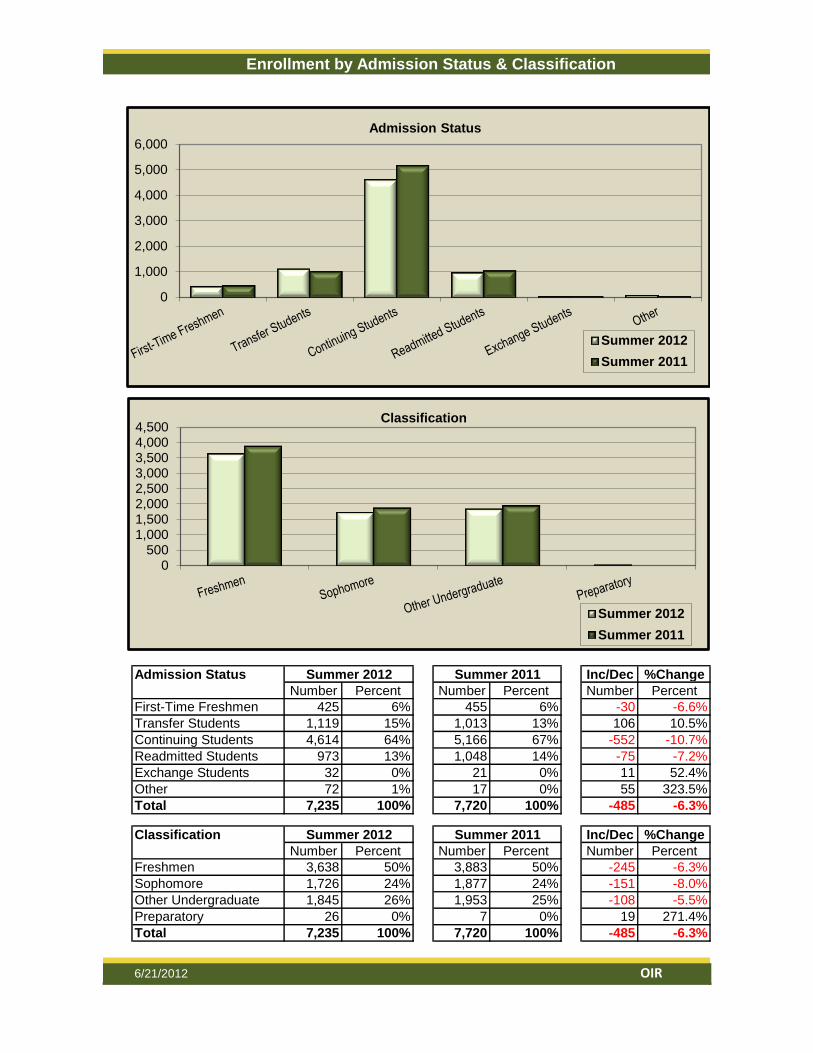
Enrollment by Admission Status & Classification
Admission Status Summer 2012 Summer 2011 Inc/Dec %Change
Number Percent Number Percent Number Percent
First-Time Freshmen 425 6% 455 6% -30 -6.6%
Transfer Students 1,119 15% 1,013 13% 106 10.5%
Continuing Students 4,614 64% 5,166 67% -552 -10.7%
Readmitted Students 973 13% 1,048 14% -75 -7.2%
Exchange Students 32 0% 21 0% 11 52.4%
Other 72 1% 17 0% 55 323.5%
Total 7,235 100% 7,720 100% -485 -6.3%
Classification Summer 2012 Summer 2011 Inc/Dec %Change
Number Percent Number Percent Number Percent
Freshmen 3,638 50% 3,883 50% -245 -6.3%
Sophomore 1,726 24% 1,877 24% -151 -8.0%
Other Undergraduate 1,845 26% 1,953 25% -108 -5.5%
Preparatory 26 0% 7 0% 19 271.4%
Total 7,235 100% 7,720 100% -485 -6.3%
6/21/2012 OIR
0
1,000
2,000
3,000
4,000
5,000
6,000
Admission Status
Summer 2012
Summer 2011
0500
1,0001,5002,0002,5003,0003,5004,0004,500
Classification
Summer 2012
Summer 2011
jren
Typewritten Text
6
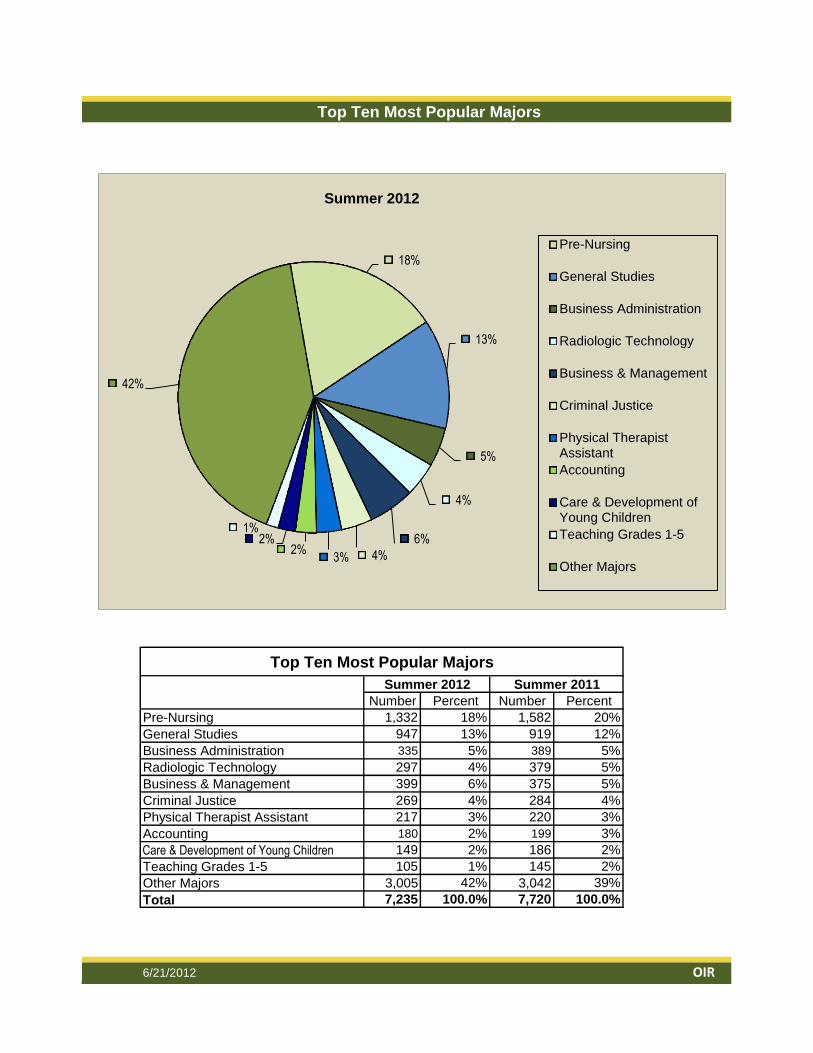
Top Ten Most Popular Majors
Top Ten Most Popular Majors
Summer 2012 Summer 2011
Number Percent Number Percent
Pre-Nursing 1,332 18% 1,582 20%
General Studies 947 13% 919 12%
Business Administration 335 5% 389 5%
Radiologic Technology 297 4% 379 5%
Business & Management 399 6% 375 5%
Criminal Justice 269 4% 284 4%
Physical Therapist Assistant 217 3% 220 3%
Accounting 180 2% 199 3%
Care & Development of Young Children 149 2% 186 2%
Teaching Grades 1-5 105 1% 145 2%
Other Majors 3,005 42% 3,042 39%
Total 7,235 100.0% 7,720 100.0%
6/21/2012 OIR
18%
13%
5%
4%
6%
4% 3% 2%
2% 1%
42%
Summer 2012
Pre-Nursing
General Studies
Business Administration
Radiologic Technology
Business & Management
Criminal Justice
Physical TherapistAssistant
Accounting
Care & Development ofYoung Children
Teaching Grades 1-5
Other Majors
jren
Typewritten Text
7
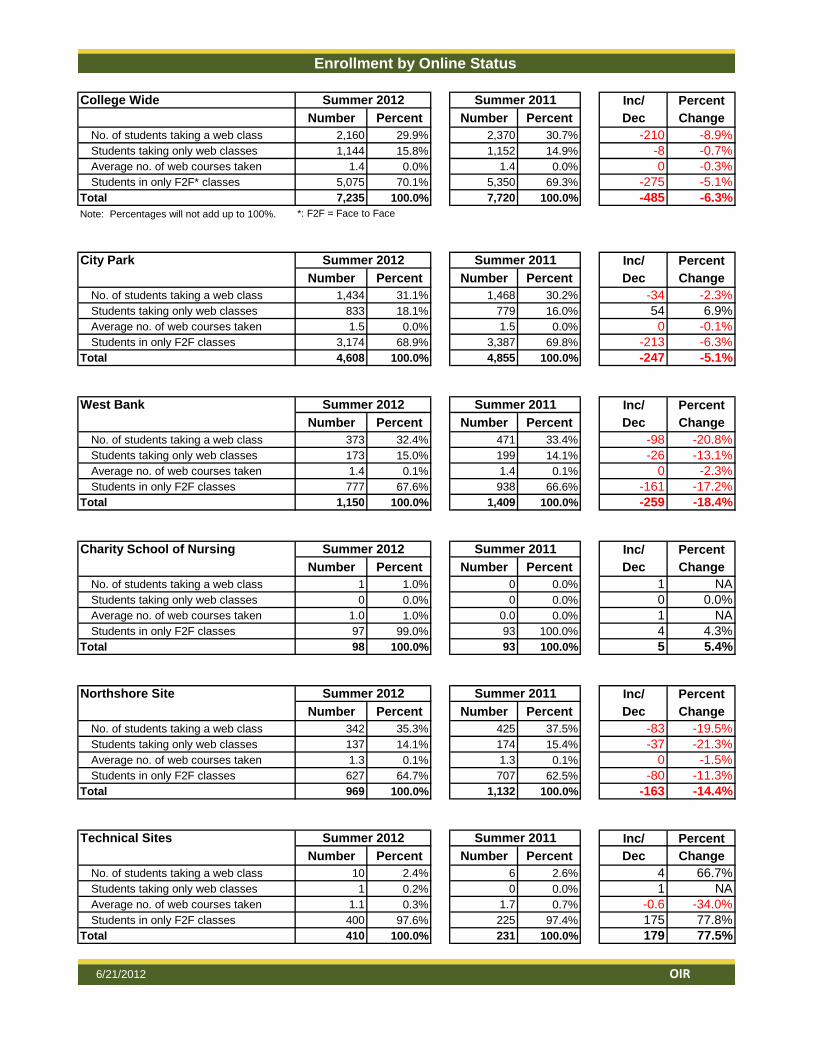
Enrollment by Online Status
College Wide Inc/ Percent
Number Percent Number Percent Dec Change
No. of students taking a web class 2,160 29.9% 2,370 30.7% -210 -8.9%
Students taking only web classes 1,144 15.8% 1,152 14.9% -8 -0.7%
Average no. of web courses taken 1.4 0.0% 1.4 0.0% 0 -0.3%
Students in only F2F* classes 5,075 70.1% 5,350 69.3% -275 -5.1%
Total 7,235 100.0% 7,720 100.0% -485 -6.3%
Note: Percentages will not add up to 100%. *: F2F = Face to Face
City Park Inc/ Percent
Number Percent Number Percent Dec Change
No. of students taking a web class 1,434 31.1% 1,468 30.2% -34 -2.3%
Students taking only web classes 833 18.1% 779 16.0% 54 6.9%
Average no. of web courses taken 1.5 0.0% 1.5 0.0% 0 -0.1%
Students in only F2F classes 3,174 68.9% 3,387 69.8% -213 -6.3%
Total 4,608 100.0% 4,855 100.0% -247 -5.1%
West Bank Inc/ Percent
Number Percent Number Percent Dec Change
No. of students taking a web class 373 32.4% 471 33.4% -98 -20.8%
Students taking only web classes 173 15.0% 199 14.1% -26 -13.1%
Average no. of web courses taken 1.4 0.1% 1.4 0.1% 0 -2.3%
Students in only F2F classes 777 67.6% 938 66.6% -161 -17.2%
Total 1,150 100.0% 1,409 100.0% -259 -18.4%
Charity School of Nursing Inc/ Percent
Number Percent Number Percent Dec Change
No. of students taking a web class 1 1.0% 0 0.0% 1 NA
Students taking only web classes 0 0.0% 0 0.0% 0 0.0%
Average no. of web courses taken 1.0 1.0% 0.0 0.0% 1 NA
Students in only F2F classes 97 99.0% 93 100.0% 4 4.3%
Total 98 100.0% 93 100.0% 5 5.4%
Northshore Site Inc/ Percent
Number Percent Number Percent Dec Change
No. of students taking a web class 342 35.3% 425 37.5% -83 -19.5%
Students taking only web classes 137 14.1% 174 15.4% -37 -21.3%
Average no. of web courses taken 1.3 0.1% 1.3 0.1% 0 -1.5%
Students in only F2F classes 627 64.7% 707 62.5% -80 -11.3%
Total 969 100.0% 1,132 100.0% -163 -14.4%
Technical Sites Inc/ Percent
Number Percent Number Percent Dec Change
No. of students taking a web class 10 2.4% 6 2.6% 4 66.7%
Students taking only web classes 1 0.2% 0 0.0% 1 NA
Average no. of web courses taken 1.1 0.3% 1.7 0.7% -0.6 -34.0%
Students in only F2F classes 400 97.6% 225 97.4% 175 77.8%
Total 410 100.0% 231 100.0% 179 77.5%
6/21/2012 OIR
Summer 2012 Summer 2011
Summer 2012
Summer 2012 Summer 2011
Summer 2011
Summer 2012 Summer 2011
Summer 2012 Summer 2011
Summer 2012 Summer 2011
jren
Typewritten Text
8
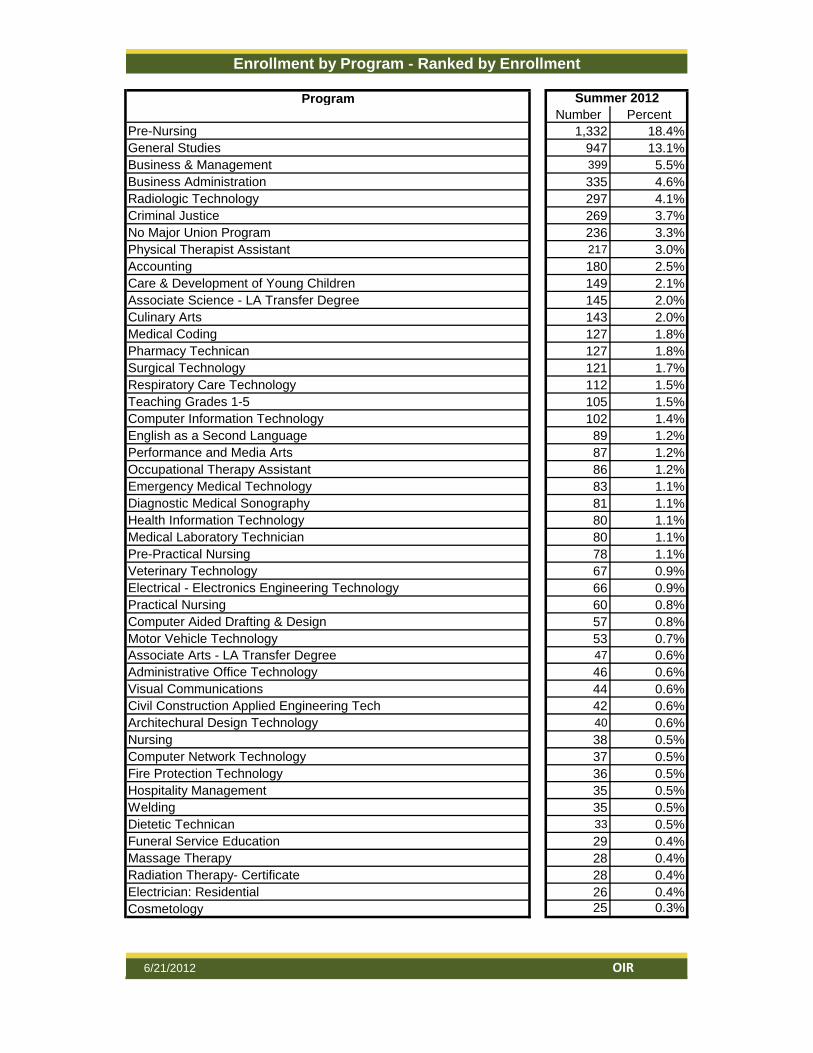
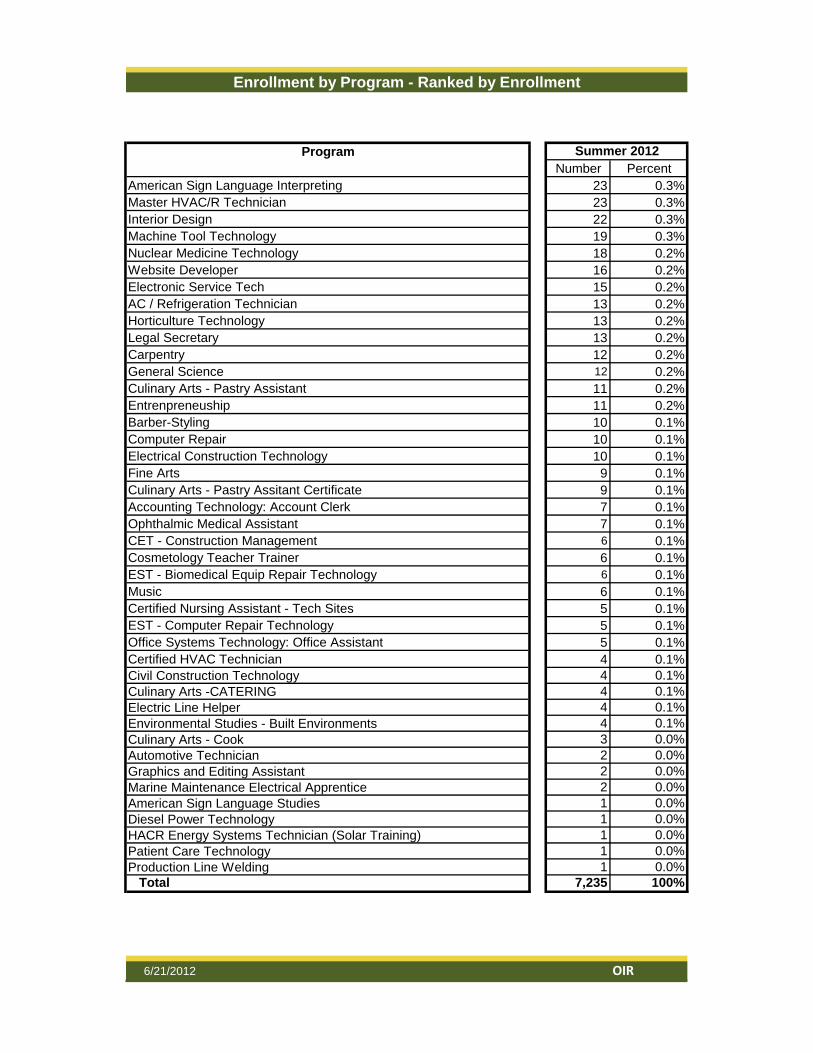
Enrollment by Program - Ranked by Enrollment
Program
Number Percent
Pre-Nursing 1,332 18.4%
General Studies 947 13.1%
Business & Management 399 5.5%
Business Administration 335 4.6%
Radiologic Technology 297 4.1%
Criminal Justice 269 3.7%
No Major Union Program 236 3.3%
Physical Therapist Assistant 217 3.0%
Accounting 180 2.5%
Care & Development of Young Children 149 2.1%
Associate Science - LA Transfer Degree 145 2.0%
Culinary Arts 143 2.0%
Medical Coding 127 1.8%
Pharmacy Technican 127 1.8%
Surgical Technology 121 1.7%
Respiratory Care Technology 112 1.5%
Teaching Grades 1-5 105 1.5%
Computer Information Technology 102 1.4%
English as a Second Language 89 1.2%
Performance and Media Arts 87 1.2%
Occupational Therapy Assistant 86 1.2%
Emergency Medical Technology 83 1.1%
Diagnostic Medical Sonography 81 1.1%
Health Information Technology 80 1.1%
Medical Laboratory Technician 80 1.1%
Pre-Practical Nursing 78 1.1%
Veterinary Technology 67 0.9%
Electrical - Electronics Engineering Technology 66 0.9%
Practical Nursing 60 0.8%
Computer Aided Drafting & Design 57 0.8%
Motor Vehicle Technology 53 0.7%
Associate Arts - LA Transfer Degree 47 0.6%
Administrative Office Technology 46 0.6%
Visual Communications 44 0.6%
Civil Construction Applied Engineering Tech 42 0.6%
Architechural Design Technology 40 0.6%
Nursing 38 0.5%
Computer Network Technology 37 0.5%
Fire Protection Technology 36 0.5%
Hospitality Management 35 0.5%
Welding 35 0.5%
Dietetic Technican 33 0.5%
Funeral Service Education 29 0.4%
Massage Therapy 28 0.4%
Radiation Therapy- Certificate 28 0.4%
Electrician: Residential 26 0.4%
Cosmetology 25 0.3%
6/21/2012 OIR
Summer 2012
jren
Typewritten Text
9
Enrollment by Program - Ranked by Enrollment
Program
Number Percent
American Sign Language Interpreting 23 0.3%
Master HVAC/R Technician 23 0.3%
Interior Design 22 0.3%
Machine Tool Technology 19 0.3%
Nuclear Medicine Technology 18 0.2%
Website Developer 16 0.2%
Electronic Service Tech 15 0.2%
AC / Refrigeration Technician 13 0.2%
Horticulture Technology 13 0.2%
Legal Secretary 13 0.2%
Carpentry 12 0.2%
General Science 12 0.2%
Culinary Arts - Pastry Assistant 11 0.2%
Entrenpreneuship 11 0.2%
Barber-Styling 10 0.1%
Computer Repair 10 0.1%
Electrical Construction Technology 10 0.1%
Fine Arts 9 0.1%
Culinary Arts - Pastry Assitant Certificate 9 0.1%
Accounting Technology: Account Clerk 7 0.1%
Ophthalmic Medical Assistant 7 0.1%
CET - Construction Management 6 0.1%
Cosmetology Teacher Trainer 6 0.1%
EST - Biomedical Equip Repair Technology 6 0.1%
Music 6 0.1%
Certified Nursing Assistant - Tech Sites 5 0.1%
EST - Computer Repair Technology 5 0.1%
Office Systems Technology: Office Assistant 5 0.1%
Certified HVAC Technician 4 0.1%
Civil Construction Technology 4 0.1%
Culinary Arts -CATERING 4 0.1%
Electric Line Helper 4 0.1%
Environmental Studies - Built Environments 4 0.1%
Culinary Arts - Cook 3 0.0%
Automotive Technician 2 0.0%
Graphics and Editing Assistant 2 0.0%
Marine Maintenance Electrical Apprentice 2 0.0%
American Sign Language Studies 1 0.0%
Diesel Power Technology 1 0.0%
HACR Energy Systems Technician (Solar Training) 1 0.0%
Patient Care Technology 1 0.0%
Production Line Welding 1 0.0%
Total 7,235 100%
6/21/2012 OIR
Summer 2012
jren
Typewritten Text
10
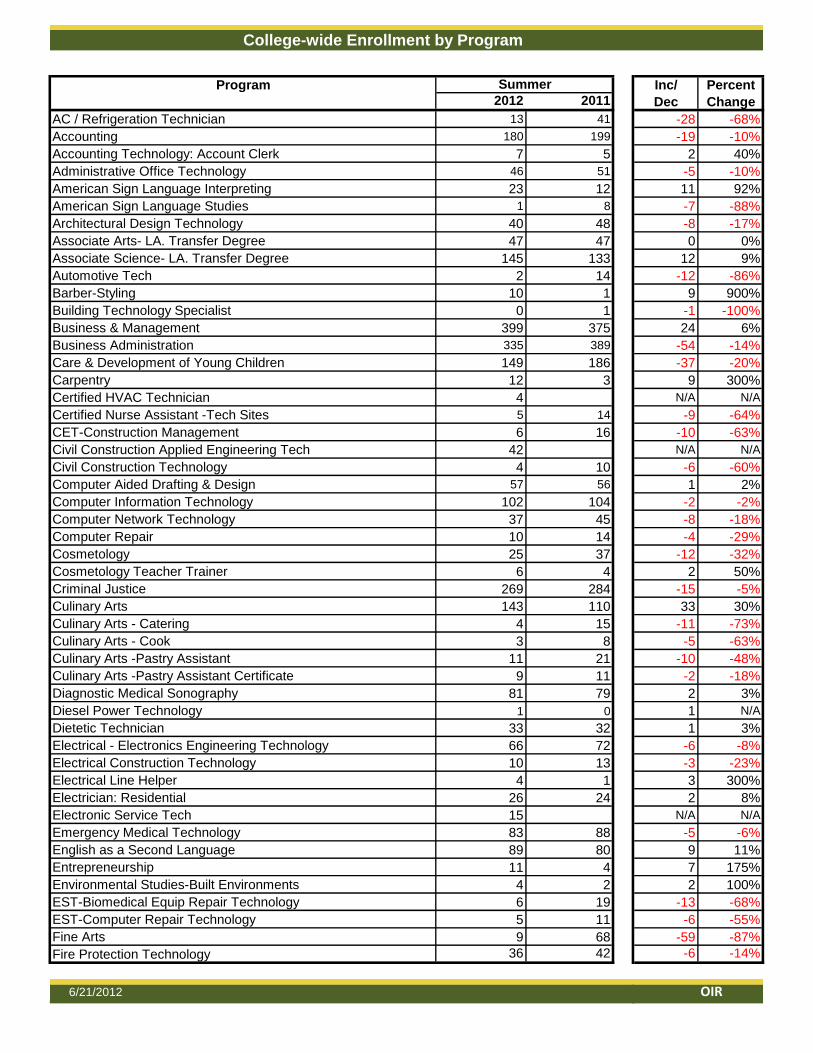
College-wide Enrollment by Program
Program Inc/ Percent
2012 2011 Dec Change
AC / Refrigeration Technician 13 41 -28 -68%
Accounting 180 199 -19 -10%
Accounting Technology: Account Clerk 7 5 2 40%
Administrative Office Technology 46 51 -5 -10%
American Sign Language Interpreting 23 12 11 92%
American Sign Language Studies 1 8 -7 -88%
Architectural Design Technology 40 48 -8 -17%
Associate Arts- LA. Transfer Degree 47 47 0 0%
Associate Science- LA. Transfer Degree 145 133 12 9%
Automotive Tech 2 14 -12 -86%
Barber-Styling 10 1 9 900%
Building Technology Specialist 0 1 -1 -100%
Business & Management 399 375 24 6%
Business Administration 335 389 -54 -14%
Care & Development of Young Children 149 186 -37 -20%
Carpentry 12 3 9 300%
Certified HVAC Technician 4 N/A N/A
Certified Nurse Assistant -Tech Sites 5 14 -9 -64%
CET-Construction Management 6 16 -10 -63%
Civil Construction Applied Engineering Tech 42 N/A N/A
Civil Construction Technology 4 10 -6 -60%
Computer Aided Drafting & Design 57 56 1 2%
Computer Information Technology 102 104 -2 -2%
Computer Network Technology 37 45 -8 -18%
Computer Repair 10 14 -4 -29%
Cosmetology 25 37 -12 -32%
Cosmetology Teacher Trainer 6 4 2 50%
Criminal Justice 269 284 -15 -5%
Culinary Arts 143 110 33 30%
Culinary Arts - Catering 4 15 -11 -73%
Culinary Arts - Cook 3 8 -5 -63%
Culinary Arts -Pastry Assistant 11 21 -10 -48%
Culinary Arts -Pastry Assistant Certificate 9 11 -2 -18%
Diagnostic Medical Sonography 81 79 2 3%
Diesel Power Technology 1 0 1 N/A
Dietetic Technician 33 32 1 3%
Electrical - Electronics Engineering Technology 66 72 -6 -8%
Electrical Construction Technology 10 13 -3 -23%
Electrical Line Helper 4 1 3 300%
Electrician: Residential 26 24 2 8%
Electronic Service Tech 15 N/A N/A
Emergency Medical Technology 83 88 -5 -6%
English as a Second Language 89 80 9 11%
Entrepreneurship 11 4 7 175%
Environmental Studies-Built Environments 4 2 2 100%
EST-Biomedical Equip Repair Technology 6 19 -13 -68%
EST-Computer Repair Technology 5 11 -6 -55%
Fine Arts 9 68 -59 -87%
Fire Protection Technology 36 42 -6 -14%
6/21/2012 OIR
Summer
jren
Typewritten Text
11
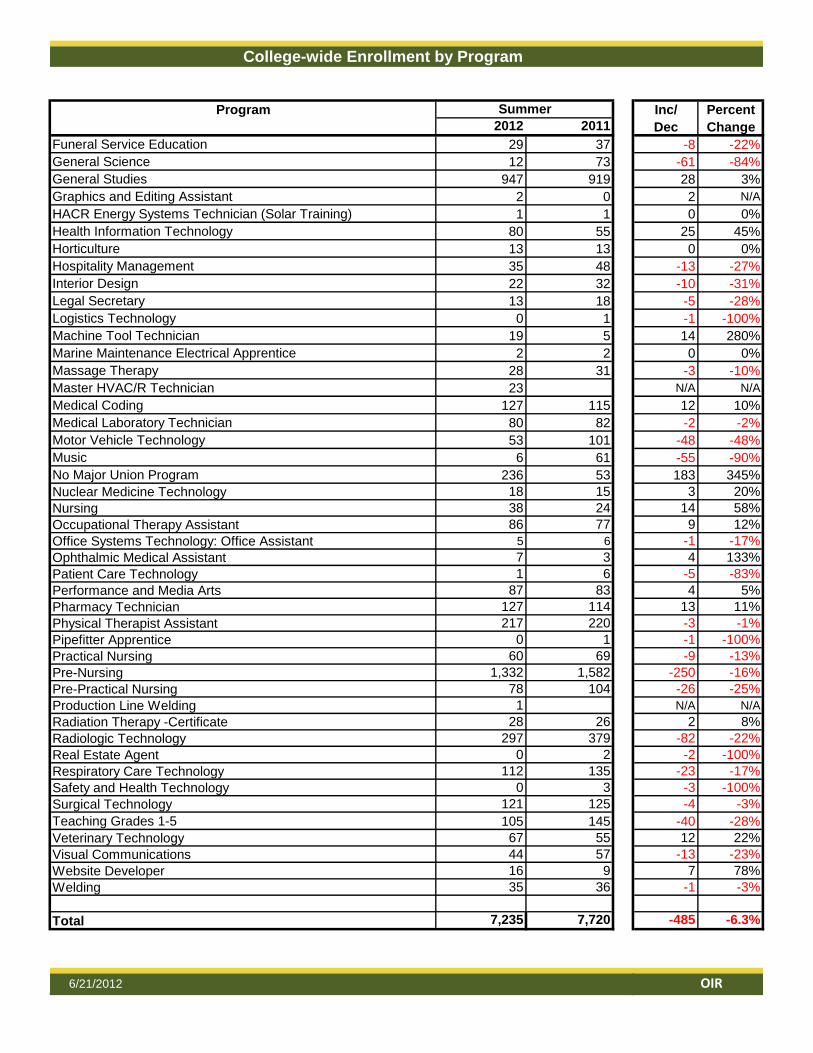
College-wide Enrollment by Program
Program Inc/ Percent
2012 2011 Dec Change
Funeral Service Education 29 37 -8 -22%
General Science 12 73 -61 -84%
General Studies 947 919 28 3%
Graphics and Editing Assistant 2 0 2 N/A
HACR Energy Systems Technician (Solar Training) 1 1 0 0%
Health Information Technology 80 55 25 45%
Horticulture 13 13 0 0%
Hospitality Management 35 48 -13 -27%
Interior Design 22 32 -10 -31%
Legal Secretary 13 18 -5 -28%
Logistics Technology 0 1 -1 -100%
Machine Tool Technician 19 5 14 280%
Marine Maintenance Electrical Apprentice 2 2 0 0%
Massage Therapy 28 31 -3 -10%
Master HVAC/R Technician 23 N/A N/A
Medical Coding 127 115 12 10%
Medical Laboratory Technician 80 82 -2 -2%
Motor Vehicle Technology 53 101 -48 -48%
Music 6 61 -55 -90%
No Major Union Program 236 53 183 345%
Nuclear Medicine Technology 18 15 3 20%
Nursing 38 24 14 58%
Occupational Therapy Assistant 86 77 9 12%
Office Systems Technology: Office Assistant 5 6 -1 -17%
Ophthalmic Medical Assistant 7 3 4 133%
Patient Care Technology 1 6 -5 -83%
Performance and Media Arts 87 83 4 5%
Pharmacy Technician 127 114 13 11%
Physical Therapist Assistant 217 220 -3 -1%
Pipefitter Apprentice 0 1 -1 -100%
Practical Nursing 60 69 -9 -13%
Pre-Nursing 1,332 1,582 -250 -16%
Pre-Practical Nursing 78 104 -26 -25%
Production Line Welding 1 N/A N/A
Radiation Therapy -Certificate 28 26 2 8%
Radiologic Technology 297 379 -82 -22%
Real Estate Agent 0 2 -2 -100%
Respiratory Care Technology 112 135 -23 -17%
Safety and Health Technology 0 3 -3 -100%
Surgical Technology 121 125 -4 -3%
Teaching Grades 1-5 105 145 -40 -28%
Veterinary Technology 67 55 12 22%
Visual Communications 44 57 -13 -23%
Website Developer 16 9 7 78%
Welding 35 36 -1 -3%
Total 7,235 7,720 -485 -6.3%
6/21/2012 OIR
Summer
jren
Typewritten Text
12

Enrollment by Zip Code
Zip Code
Summer
2012 Percent
Summer
2011 Percent Inc/Dec
%
Change
Metairie S of I-10 70001 233 4% 251 4% -18 -7%
Metairie 70002 104 2% 121 2% -17 -14%
West Metairie 70003 210 4% 216 3% -6 -3%
Old Metairie-Bucktown 70005 129 2% 137 2% -8 -6%
Metairie Clearview N of I-10 70006 82 1% 76 1% 6 8%
Belle Chasse 70037 101 2% 102 2% -1 -1%
Chalmette 70043 69 1% 45 1% 24 53%
Gretna 70053 70 1% 82 1% -12 -15%
Gretna/S of Whitney 70056 303 5% 302 5% 1 0%
Harvey 70058 344 6% 369 6% -25 -7%
South Kenner 70062 86 1% 80 1% 6 8%
North Kenner 70065 271 5% 294 5% -23 -8%
LaPlace 70068 153 3% 143 2% 10 7%
Marrero 70072 379 6% 448 7% -69 -15%
Westwego 70094 167 3% 213 3% -46 -22%
Algiers 70114 163 3% 196 3% -33 -17%
Uptown 70115 134 2% 168 3% -34 -20%
French Quarter-Marigny 70116 68 1% 43 1% 25 58%
Bywater/Lower 9th Ward 70117 127 2% 135 2% -8 -6%
Carrollton/Riverbend 70118 142 2% 144 2% -2 -1%
Mid City 70119 235 4% 273 4% -38 -14%
N.O. Postal Box Zone 70121 54 1% 60 1% -6 -10%
Lakefront/Gentilly 70122 253 4% 260 4% -7 -3%
Harahan-Jefferson 70123 125 2% 133 2% -8 -6%
Lakefront/Lakeview 70124 96 2% 97 2% -1 -1%
Broadmoor 70125 82 1% 95 2% -13 -14%
N.O. East Crowder 70126 201 3% 198 3% 3 2%
N.O. East Crowder to Wright Rd 70127 160 3% 186 3% -26 -14%
N.O. East Wright Rd to I-510 70128 154 3% 159 3% -5 -3%
N.O. East Past I-510 70129 56 1% 65 1% -9 -14%
N.O. CBD-Lwr Garden District 70130 69 1% 68 1% 1 1%
Lower Coast Algiers 70131 243 4% 226 4% 17 8%
Covington 70433 124 2% 121 2% 3 2%
Covington 70435 74 1% 72 1% 2 3%
Slidell 70458 205 4% 235 4% -30 -13%
Slidell 70460 134 2% 149 2% -15 -10%
Slidell 70461 170 3% 182 3% -12 -7%
St. Tammany 70471 77 1% 82 1% -5 -6%
Subtotal 5,847 80.8% 6,226 80.6% -379 -6.1%
Other Louisiana 1,333 18.4% 1,444 18.7% -111 -7.7%
Total Louisiana 7,180 99.2% 7,670 99.4% -490 -6.4%
Out-of-State 55 0.8% 50 0.6% 5 10.0%
Total 7,235 100% 7,720 100% -485 -6.3%
6/21/2012 OIR
jren
Typewritten Text
13
Related Documents