Summary Report Submitted for HCS Approach Peer Review Process HCS Study Project Title: HCS Assessment of PT. Persada Graha Mandiri West Kalimantan Company / Organisation: Golden-Agri Resources Ltd with support of The Forest Trust Indonesia Contact person: Gotz Martin/Hendi Hidayat Date: 25 January 2018

Welcome message from author
This document is posted to help you gain knowledge. Please leave a comment to let me know what you think about it! Share it to your friends and learn new things together.
Transcript

Summary Report Submitted for HCS Approach Peer Review Process
HCS Study Project Title:
HCS Assessment of
PT. Persada Graha Mandiri
West Kalimantan
Company / Organisation:
Golden-Agri Resources Ltd
with support of The Forest Trust Indonesia
Contact person: Gotz Martin/Hendi Hidayat
Date: 25 January 2018

2
Table of Contents
1. Project description ......................................................................................... 4
1.1 Location and size of assessment area ..................................................................................... 4
1.2 Overview of proposed plantation development .................................................................... 4
1.3 Description of surrounding landscape .................................................................................... 4
1.4 Map of the site within the region ........................................................................................... 5
1.5 Relevant data sets available.................................................................................................... 5
1.6 List of any reports/assessments used in the HCS assessment ................................................ 5
2. HCS assessment team and timeline ............................................................... 6
2.1 Names and qualifications ........................................................................................................ 6
2.2 Time period for major steps in the study ............................................................................... 7
3. Community engagement/ FPIC ...................................................................... 8
3.1 Summary of community engagement, FPIC, participatory mapping ...................................... 8
3.2 Summary of Social Impact Assessment (if any) .................................................................... 10
4. High Conservation Value assessment ........................................................... 11
4.1 Summary and link to public summary report ....................................................................... 11
5. Environmental Impact Assessment .............................................................. 12
5.1 Summary ............................................................................................................................... 12
6. Land cover image analysis ............................................................................ 13
6.1 Area of Interest and how it was defined .............................................................................. 13
6.2 Description of images used for classification ........................................................................ 13
6.3 Sample image ........................................................................................................................ 14
6.4 Method of stratification and software used ......................................................................... 15
6.5 Map of initial vegetation classes, with legend ...................................................................... 15
6.6 Table of total hectares per vegetation class ......................................................................... 16
6.7 Summary of which areas are potential HCS forest, subject to further analysis ................... 16
7. Forest inventory results ............................................................................... 17
7.1 Inventory sample design and plot rational ........................................................................... 17
7.2 Map indicating plots ............................................................................................................. 17
7.3 Forest inventory team members and roles .......................................................................... 18
7.4 Methodology used for forest sampling ................................................................................ 19
7.5 Methodology used for carbon calculations .......................................................................... 20

3
7.6 Indicative photos of each vegetation class ........................................................................... 20
7.7 Statistical analysis (allometric used, confidence tests, justification) .................................... 22
7.8 Summary of statistical analysis of carbon stock results per vegetation class ...................... 23
7.9 Forest inventory results ........................................................................................................ 24
8. Land Cover Classification.............................................................................. 25
8.1 Refined land cover map with title, date, legend, and any HCS forest patches identified .... 25
9. Patch Analysis Result.................................................................................... 26
9.1 Results of Decision Tree ........................................................................................................ 26
9.2 Comments on Decision Tree outcome .................................................................................. 27
10. Indicative Land Use Plan ............................................................................ 28
10.1 Summary of results of final ground verification (if any) ....................................................... 28
10.2 Final HCS map ....................................................................................................................... 28
10.3 Overview of forest conservation management and monitoring activities to be included in
the Conservation and Development (land use) Plan (Rencana Kerja dalam Dokumen PCP/Lebih
menitikberatkan di forest-nya) ......................................................................................................... 28
10.4 List of activities still to be carried out before Conservation and Development Plan can be
finalised ............................................................................................................................................. 29

4
1. Project description 1.1 Location and size of assessment area
High Carbon Stock (HCS) assessment was conducted in PT. Persada Graha Mandiri (PGM),
(111°38’51,548” – 111°50’57,082” E and 0°18’7,879” – 0°29’12,843” N). The area is located in Silat
Hilir Sub District (Kecamatan), Kapuas Hulu District (Kabupaten), West Kalimantan Province. The
latest concession permit is HGU (land tittle) SK HGU No. 34 dated 7th May 2015, covering an area of
12,844.24 ha. Initially, the HCS assessment was conducted based on concession permit of Ijin Lokasi
(ILOK) dated 12th May 2009, with an area of 19,429 ha. However, the Conservation Development
Plan (CDP) map will be designed based on the latest permit given to the concession area which is the
HGU. The surrounding features of this area and the location are described below:
North Oil palm plantation of PT. Paramitra Internusa Pratama (PIP)
East Oil palm plantation of PT. Anugerah Makmur Sejati (AMS)
South Oil palm plantation of PT. Riau Agrotama Plantation (RAP)
West Nanga Ketungau village, Sintang Regency
1.2 Overview of proposed plantation development
Based on the Ministry of Forestry Decree No. 733/Menhut-II/2004 and PT. PGM’s ILOK (2009), the
concession area of PT. PGM is situated in Areal Penggunaan Lain or APL (non-forest use) designated
land. In the area of PT PGM, there are agricultural lands, mining area, settlement areas, and
community forest area. All communities from surrounding villages of PT. PGM (Baru village, Penai
village, Sentabai village, and Perigi village) are willing to conserve those community forest areas.
Therefore, the plantation area will be developed on non-forest area (HCV, HCS, and peat) through a
free, prior, informed consent (FPIC) process with the communities.
1.3 Description of surrounding landscape
PT. PGM is located on the northern side of Kapuas River and it is situated mostly on flat, mineral soil
land. Peat swamp forests are found in the eastern and western part of the concession. The area’s
elevation ranges from 25 m to a maximum of 50 m above sea level (a.s.l).
Previously, the area of PT. PGM was a timber concession (HPH), therefore High Density Forest (HDF)
and Medium Density Forest (MDF) classes were not found. However, we identify there are four land
cover classes which are Low Density Forest (LDF), Young Regeneration Forest (YRF), Scrub (S), and
Open Land (OL). Based on HCS Approach Toolkit Ver.1 definitions, the PT. PGM concession is
considered to be of ‘low forest cover’. Thus, the HCS assesment through the patch analysis decision
tree adds more weight to the conservation of Medium and Low Priority HCS patches.
This concession is surrounded by four villages; Penai Village, Perigi Village, Baru Village and Sentabai
Village. Melayu and Dayak are the two main ethnic groups that are living in the assessment area. The
education level of the communities around PT. PGM is relatively moderate. Most of the villagers
completed their primary school and generally continued their education to high school level.
Community livelihood around PT. PGM is mostly depending on agriculture (paddy field and farming),
while hunting and fishing become their alternatives. As results of HPH and community activities in

5
the past, the area has less than 30% of forest cover, which are mostly peat swamp ecosystems and
dryland forests.
1.4 Map of the site within the region
Figure 1. Region map around PT. Persada Graha Mandiri
1.5 Relevant data sets available
• Carbon stock assessment raw data (data CSA PT. PGM on February 2015 – June 2016)
• Landsat 8 satellite imagery acquisition on February 27th, 2015 (path 120 row 60)
• Landsat 8 satellite imagery acquisition on February 29th, 2015 (path 120 row 60)
• Landsat 8 satellite imagery acquisition on July 16th, 2015 (path 120 row 60)
• Community forest, agricultural and community mining land boundary based on participatory mapping (November 2015 – September 2017)
1.6 List of any reports/assessments used in the HCS assessment
HCS assessments use relevant reports to support and enrich the perspective of discussion, including
• ESIA (Environmental and Sosial Impact Assessment)
• SIA (Sosial Impact Assessment)
• HCV (High Conservation Value)
• PM (Participatory Mapping)
• PCP (Participatory Conservation Planning)

6
2. HCS assessment team and timeline 2.1 Names and qualifications
The HCS aassessment was conducted by a collaborative team of TFT, GAR and Greenpeace staff. GAR
staff played an integral role in facilitating access to the community as well as supporting TFT in
conducting the forest inventory. Greenpeace also contributed to the forest inventory process of this
assessment.
Table 1. Team names, organisation and roles
Name Organization Role and responsibility
Samsul Ulum TFT Project coordinator, monitoring tally sheets,
maintaining documentation, GPS and other field
equipment, land cover verification, regulating sample
plot locations.
Abidin Lakadimu TFT Vegetation/flora identification, developing plots, field
data collection (photos and tally sheet).
Devis Rachmawan TFT Tree measurements, plot sample analysis, carbon
calculation statistics.
Gigih Pambudi TFT Satellite imagery analysis, forest classifications,
preparing operational field maps, storing and updating
the database according to field verification.
Williem Cahyadi GAR Project coordinator.
Candra Kurniawan GAR Satellite imagery analysis, forest classifications,
preparing operational field maps, storing and updating
the database according to field verification.
Devara P.
Adiningrat
GAR Tree measurements, plot sample analysis, carbon
calculation statistics.
Wahyu Pramonisidi GAR Satellite imagery analysis, forest classifications,
preparing operational field maps, storing and updating
the database according to field verification.
Bambang Setyaji GAR Community facilitator.
Agus Budianto GAR Tree measurements, plot sample analysis, carbon
calculation statistics.
Novita Anang
Prabowo
GAR Tree measurements, plot sample analysis, carbon
calculation statistics.

7
Leonard Soriano Greenpeace Satellite imagery analysis, forest classifications,
preparing operational field maps, storing and updating
the database according to field verification.
Farid Wajdi Greenpeace Satellite imagery analysis, forest classifications,
preparing operational field maps, storing and updating
the database according to field verification.
Kiki Taufik Greenpeace Satellite imagery analysis, forest classifications,
preparing operational field maps, storing and updating
the database according to field verification.
2.2 Time period for major steps in the study
• Field survey HCS: February 2015 – June 2016
• Pre-RBA: December 2015
• Participatory mapping: February 2015 - November 2015
• Participatory conservation planning: November 2015 – September 2016
• FPIC: December 2017
• ESIA : December 2006
• HCV : March 2010 – February 2011
• SIA: April 2016

8
3. Community engagement/ FPIC 3.1 Summary of community engagement, FPIC, participatory mapping
The HCSA Toolkit Ver.2 suggests conducting HCS and HCV after PM, on areas that the community has
not claimed for their own development or conservation. However, as the PT. PGM study was
conducted before the release of the second version of the HCSA Toolkit, the PM was conducted after
the HCS and HCV studies. This has led to HCV areas and HCS forest that are also claimed for
community use.
The dominant land uses are mixed gardens and rubber plantations, usually located near access
roads. Forests that the communities are willing to conserve are primarily located in Penai Village.
Most agricultural lands were near settlement areas. Community mines are found near areas which
the community willing to conserve as well as within forest areas.
Figure 2. Participatory Mapping Map
Figure 2. Participatory Mapping of PT. Persada Graha Mandiri

9
Table 2. Participatory Mapping Areas
PM-Land Use Total (Ha)
Areas Community Wish to Conserve 1,515
Community Forest 1,506
Water Body 83
Mixed Gardens 5,939
Rubber Plantations 2,119
Palm Oil Plantation 7,356
Fish Pond 1
Agricultural Land 11
Open Land 530
Football ground 1
Settlement 138
Mines 227
Total 19,426
Based on the results of integrating the current HCS, HCV and PM information, the potential land use
plan for PT PGM delineates a conservation area of 4,339 ha (22% of the total assessment area). The
conservation areas are concentrated in the south-west and south-east part of the concession,
adjacent to the Kapuas River and mostly located on peat forest. This conservation area would
benefit from further conservation programs such as a compensation mechanism as well as
collaborative partnerships between the company and the local community to protect these
conservation areas.
The current PM, HCV, HCS integration data also delineates a potential area for development of 7,323
ha (38% of the study area) of mixed gardens, rubber plantation, mining and open land that were not
identified as HCV area or HCS forest. These areas have the potential for palm oil development is FPIC
is secured along with consideration of having areas for food security and other economic
activities.This is in addition to the 7,122 ha (36.5%) of existing oil palm plantation, totalling a
development area of 14,804 ha (76% of the study site). Eventually the 1,164 ha of oil palm already
planted on HCV riparian zones and peat areas would be subtracted from this development area
total.
Priority areas for potential palm oil development are the areas of open land, unproductive rubber
plantations and mixed gardens located at the centre and northern part of PT. PGM. It is important to
secure FPIC with the communities and reserve areas to meet communities’ food security prior to any
development. These additional food production areas should be located on degraded land so it does
not result in encroachment of forest areas.

10
3.2 Summary of Social Impact Assessment (if any)
Baru, Penai, Perigi, and Sentabai are 4 villages in Silat Hilir sub-district which are affected by the
development of oil palm plantation PT. PGM. The four villages that rely on agriculture / plantation
sector are classified as villages with average population above poverty line. Their average income
about Rp. 658.108, which is above minimum income that is established by Badan Perencanaan
Nasional (BAPPENAS) for the province of West Kalimantan (Rp. 298.212).
The presence of PT PGM also encourages the growth of modernization in the villages. This modern
change is marked by the shift in the way of life of the local people. Initially, people only rely on crops
through shifting cultivation fields to meet their daily needs, but now people are beginning to
recognize other types of livelihoods that can be used to meet their needs. For example, the
emergence of the service sector in the village of study area, namely the transport of Fresh Fruit
Bunch (FFB), not only the economic but also the other sectors of life.
The company activities will influence public perception. Public perception is the way of community
view to company as an influence factor of environmental and social dynamics in the study area.
Public perception can be seen on how the community assessed the company’s contribution on their
quality of life, interaction between company and community, and company commitment on
environmental aspect.

11
4. High Conservation Value assessment 4.1 Summary and link to public summary report
In 2010, a HCV assessment was conducted by an external consultant which delineated 2,483 ha of
HCV areas, which some of the area are community forest and lake Sentabai. In 2016, GAR conducted
peat mapping of all peat areas equal to or more than 3 m in depth and delineated 3,526 ha of
peatland within the PT. PGM concession. All peat areas delineated by GAR have been integrated into
the HCV areas and included in all of the following analysis. The addition of these peat areas
increased the total HCV area to 4,218 ha.
In order to complete HCV assessment in 2010, PT. PGM conducted re-HCV mapping in 2017. The
results and map of the 2017 assessment will be integrated into the final Land Use Plan. This will
include all peat areas identified by GAR. This re-HCV mapping is conducted with Assesor License
Scheme (ALS) of HCV Resource Network (HCVRN).

12
5. Environmental Impact Assessment 5.1 Summary
The EIA document was prepared by AMDAL licensed consultant namely CV. Intergraha Citra Persada
in 2006. This document had been approved by the Regent of Kapuas Hulu No. 291/2006 dated 22
Desember 2006.
Some environmental impacts are identified such as water quality and quantity, community health,
and social anxiety. PT. PGM has developed the management and monitoring plan to mitigate all
those impacts and also got approval to implement this management plan called RKL/RPL (Rencana
Pengelolaan dan Pemantauan Lingkungan). The progress of this management plan is periodically
monitored and reported to the Badan Lingkungan Hidup (BLH).

13
6. Land cover image analysis 6.1 Area of Interest and how it was defined
The study area was based on the boundaries of PT. PGM’s Izin Lokasi (location permit); an area of
19,429 ha. Shape files for this area were provided by GAR for TFT to analyze. The additional 1 km
buffer away from the boundary was considered because of the status of forest around the PT PGM
in Northern regency also stated as a Areal Penggunaan Lain (APL)
Based on decisions tree and identification through the Participatory Conservation Planning
approach, there is a potential development area of 7,323 ha, or 38% of the study area (this includes
area types F and G) of mixed gardens, rubber plantation, mining and open land that are not HCV
area or HCS forest. Through PCP, PT. PGM can identify areas for further oil palm development and
food security of the community.
HCS forest patch analysis was conducted on the proposed area for development of 507 ha.
According to the land cover classification, the HCS land cover in t PT. PGM are LDF: 3,335 ha (17 % of
the study area), YRF: 664 ha (3% of the study area), S: 3,949 ha (20% of the study area), OL: 11,454
ha (59% of the study area).
6.2 Description of images used for classification
This assessment collated three Landsat 8 images, at 120 path/60 row, to ensure full coverage of the
area, as cloud cover in tropic region limits the use of satellite imagery. The images were then
analyzed through onscreen digitization using the ArcGIS software for an initial land cover
classification.
Table 3. Land cover stratification based on Above Ground Biomass (AGB) density
Stratum Description Criteria for density of AGC (t C/ha)*
Category
HDF (HK3) Forest remnants with relatively low disturbance; close to primary forests.
AGC > 250 HCS
MDF (HK2) Forest remnants with relatively medium disturbance; close to old secondary forests.
150 < AGC ≤ 250 HCS
LRF (HK1) Forest remnants with relatively high disturbance; close to logged-over forests.
75 < AGC ≤ 150 HCS
YRF (HRM) Forest regrowth from cleared areas at relatively long fallow period, close to young secondary forests.
35 < AGC ≤ 75 HCS
S (BM) Recently cleared areas at relatively short fallow period, composed by woody plants/shrubs and grasses.
15 < AGC ≤ 35 Non HCS
OL (LT) Very recently cleared land; dominated by grasses or crops; with few woody plants/shrubs.
AGC ≤ 15 Non HCS

14
6.3 Sample image
Figure 3. Shrub (Plot PGM.BM.7)
Figure 4. Young Regenerating Forest (Plot PGM.BT.16)
Figure 5. Low Density Forest (Plot PGM.HK1.9)
15
Figure 6. Medium Density Forest (Plot PGM.HK2.51)
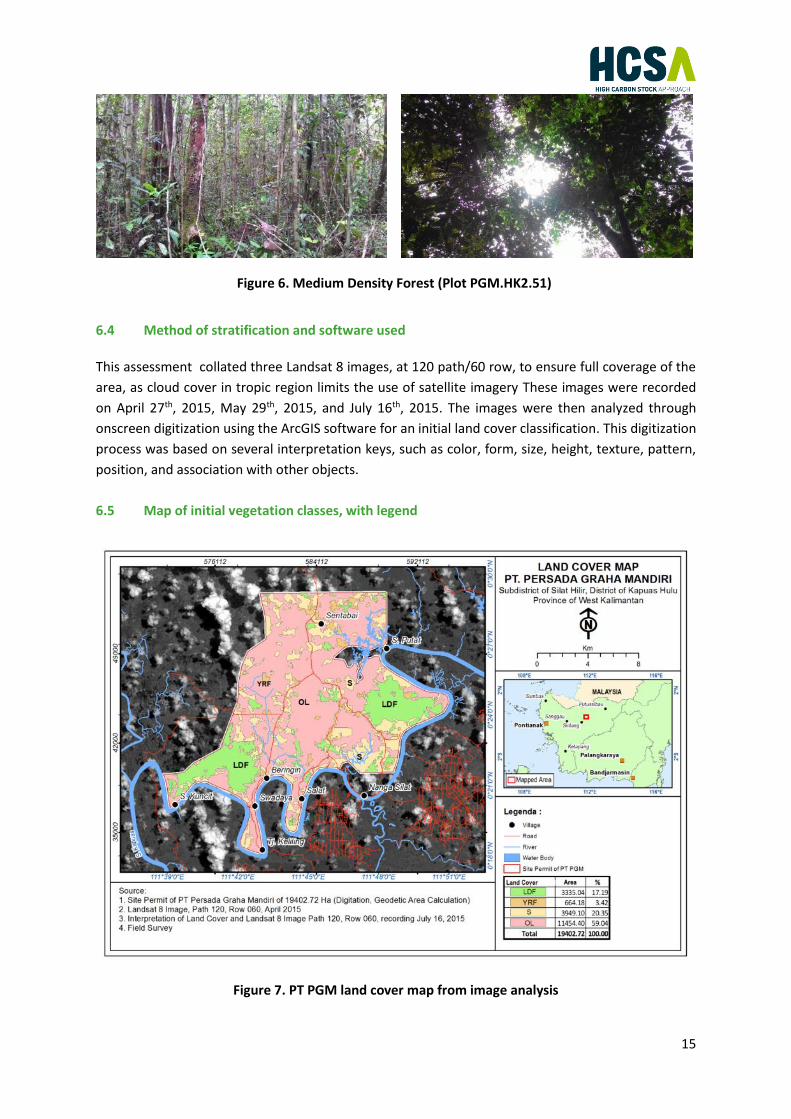
6.4 Method of stratification and software used
This assessment collated three Landsat 8 images, at 120 path/60 row, to ensure full coverage of the
area, as cloud cover in tropic region limits the use of satellite imagery These images were recorded
on April 27th, 2015, May 29th, 2015, and July 16th, 2015. The images were then analyzed through
onscreen digitization using the ArcGIS software for an initial land cover classification. This digitization
process was based on several interpretation keys, such as color, form, size, height, texture, pattern,
position, and association with other objects.
6.5 Map of initial vegetation classes, with legend
Figure 7. PT PGM land cover map from image analysis

16
6.6 Table of total hectares per vegetation class
Table 4. Total hectares per vegetation class
Land cover class Number of Hectares % of total concession
Potential HCS classes: High Density Forest - -
Medium Density Forest - -
Low Density Forest 3,335 ha 17%
Young Regenerating Forest 664 ha 3%
Sub-total 3,999 ha 20%
Non-HCS classes, e.g.: Scrub 3,949 ha 20%
Open Land 11,454 ha 59%
Mines, smallholder agriculture, plantation, etc. - -
Sub-total 14,403 ha 79%
TOTAL 18,402 ha 99%
6.7 Summary of which areas are potential HCS forest, subject to further analysis
The distribution of the four land cover classes of PT. PGM are described below:
• Low Density Forest (LDF): 3,335 ha (17 % of the study area) was found in two locations, at the western and the eastern corners of the study site, both adjacent to the Kapuas River. Both areas are located on silt/clay-rich mineral and peat swamps in the floodplains of the Kapuas river.
• Young Regenerating Forest (YRF): 664 ha (3% of the study area) was found in two locations, in the middle of the study site and at a border area of LDF towards the North of the study area.
• Scrub (S): 3,949 ha (20% of the study area) was mainly found in areas easily accessed by the community e.g. areas adjacent to settlements, village roads and along riverbanks.
• Open land (OL): 11,454 ha (59% of the study area) was found mostly in areas contiguous with settlements, the main road and banks of the larger rivers.

17
7. Forest inventory results 7.1 Inventory sample design and plot rational
The total number of sample plots (117) and the coefficient of variation for targeted classes were
calculated using Winrock’s Terrestrial Sampling Calculator with a sampling error of 10% (Pearson
2006). The sampling strategy was based on a stratified random sampling, generated by the ‘create
random point’ function in ArcGIS. Sample intensity (sample size) for each of the classes identified
during image analysis was also determined by:
1. The class itself – the primary focus of the study being on the HCS threshold between the
YRF and S classes, the secondary focus being on assessing the biodiversity of LDF areas,
2. The area of the class e.g. as YRF had only 664 ha, only 13 plots were made
3. Field work results from an HCS study in PT. Kartika Prima Cipta, in the same landscape
4. Local knowledge and a prudential approach
As OL was likely to contain very low levels of carbon, a limited number of sample plots were chosen
to ascertain whether this assumption is true. Land classes such as existing plantation (e.g. oil palm
and food crops) and community mining, were not a focus. The study distributed the 117 plots as
follows: LDF (63 plots), YRF (13 plots), S (34 plots) and OL (7 plots).
7.2 Map indicating plots
Figure 8. Plot sample distribution map

18
7.3 Forest inventory team members and roles
Table 5. Team names, organisation and roles
Name Organization Role and responsibility Qualification
Samsul Ulum TFT Project coordinator, monitoring
tally sheets, maintaining
documentation, GPS and other
field equipment, land cover
verification, regulating sample
plot locations
Forest and biodiversity
specialist
Abidin Lakadimu TFT Vegetation/flora identification,
developing plots, field data
collection (photos and tally sheet)
Forest and biodiversity
specialist
Devis
Rachmawan
TFT Tree measurements, plot sample
analysis, carbon calculation
statistics
Forest and carbon
specialist
Gigih Pambudi TFT Satellite imagery analysis, forest
classifications, preparing
operational field maps, storing
and updating the database
according to field verification
GIS specialist
Williem Chayadi GAR Project coordinator Project management
specialist
Chandra
Kurniawan
GAR Satellite imagery analysis, forest
classifications, preparing
operational field maps, storing
and updating the database
according to field verification
GIS and remote sensing
specialist
Devara P.
Adiningrat
GAR Tree measurements, plot sample
analysis, carbon calculation
statistics
GIS and remote sensing
specialist
Wahyu
Pramonosidi
GAR Satellite imagery analysis, forest
classifications, preparing
operational field maps, storing
and updating the database
according to field verification
GIS and remote sensing
specialist
Bambang Setyaji GAR Community facilitator HCV and social
community specialist

19
Agus Budianto GAR Tree measurements, plot sample
analysis, carbon calculation
statistics
Surveyor
Novita Anang
Prabowo
GAR Tree measurements, plot sample
analysis, carbon calculation
statistics
Surveyor
Leonard Soriano Greenpeace Satellite imagery analysis, forest
classifications, preparing
operational field maps, storing
and updating the database
according to field verification
GIS and remote sensing
specialist
Farid Wajdi Greenpeace Satellite imagery analysis, forest
classifications, preparing
operational field maps, storing
and updating the database
according to field verification
GIS and remote sensing
specialist
Kiki Taufik Greenpeace Satellite imagery analysis, forest
classifications, preparing
operational field maps, storing
and updating the database
according to field verification
GIS and remote sensing
specialist
7.4 Methodology used for forest sampling
The survey was designed with the aim of attaining carbon stock estimates with 90% confidence
intervals to within 10% of the total carbon stock for the designated carbon pools. Plots measured
using a 0.01 ha of circle plot as described on Figure. Only trees with diameter at breast height (DBH)
greater than 5 cm were measured. The species, a sample of soil type, and surrounding land cover
were also recorded.
Figure 9. HCS plot sample measurement

20
7.5 Methodology used for carbon calculations
The biomass was then converted to carbon using the IPCC guideline which provides a generic
conversion factor of biomass to carbon. This conversion factor is 0.47 (IPCC 2006).
7.6 Indicative photos of each vegetation class
Figure 10. Low Density Forest (LDF) (source: HCS inventory, 2015)

21
Figure 11. Young Regenerating Forest (YRF) (source: HCS inventory, 2015)
Figure 12. Scrub (S) (source: HCS inventory,2015)

22
Figure 13. Open Land (OL) (source: HCS inventory, 2015)
7.7 Statistical analysis (allometric used, confidence tests, justification)
For this study TFT determined the following allometric equation developed by Basuki (2009) and S.
Manuri (2014) to be the most suitable:
Basuki (2009): Ln Y = - 1.201 + 2.196 Ln D
Where Y = kilograms biomass per tree and D = diameter at breast height.
S. Manuri (2014): Ln Y = -1.974 + 2.475 Ln D
Where Y = kilograms biomass per tree and D = diameter at breast height
This biomass regression equation is developed from a set of data for broadleaf species from tropical
regions. The biomass regression equation provides estimates of biomass per tree in kg. Basuki (2009)
equation’s used for PT.PGM which covered by dry land forest ecosystem type, while when the plots
measured over peat-swamp area used s. Manuri (2014) equation. The biomass was then converted
to carbon using the IPCC guideline which provides a generic conversion factor of biomass to carbon.
This conversion factor is 0.47 (IPCC 2006).

23
7.8 Summary of statistical analysis of carbon stock results per vegetation class
Table 6. Summary of statistical analysis of carbon stock results per vegetation class
Land cover class
Number of Plots
Stems per
hectare
Basal Area
Average Carbon Stocks
Standard error of the mean
Confidence limits (90%)
Lower Upper
Open Land 7 246 11,454.40 2.75 1.31 0.21 5.28
Scrub 34 771 3,949.10 18.54 3.80 12.11 24.96
Young Regenerating Forest
13 1,929 664.18 85.30 21.70 46.56 123.96
Low Density Forest 63 1,817 3,335.04 124.17 8.59 109.82 138.52
Medium Density Forest - - - - - - -
High Density Forest - - - - - - -

24
7.9 Forest inventory results
Table 7. Forest inventory class
Land cover class
Average carbon value
Physical description of the land cover, e.g. species mix, forest type (pioneer, regenerating, primary etc.), diameter distribution, structural
indices, maturity indices, etc.
Open Land
2.75 Dominated by grasses (Imperata Cylindrical), ferns (Dicranopteris linearis) and pioneer vegetation species such as Macaranga Gigantea and Eugenia spp.
Scrub 18.54 Mostly dominated by pioneer vegetation species such as Macaranga Gigantea, Eugenia spp, Jangir and Cratoxylum arborescens. S had a very low dense canopy that had allowed the sunlight to easily touch the soil and accelerate the growth of ferns (Dicranopteris linearis). Ferns typically grow fast in scrub with mineral soil and can reach 25–100 cm in height.
Young Regenerating Forest
85.30 Dominated by old scrub mixed with old community rubber plantations and found in river buffer zones. Vegetation species found in this class were a mixture of core and pioneer vegetation from the Myrtaceae family (i.e. Eugenia spp). In sandy areas, the YRF was dominated by vegetation from Family of Hypericaceae (i.e. Cratoxylum arborescens).
Low Density Forest
124.17 Vegetation species originated from the flora families of Dipterocarpaceae (e.g. Shorea pauciflora, and S. belangeran). Other species vegetation included Dyera lowii, Gonystylus bancanus, Kompassia malaccensis, Palaquium spp., Melanorrhoea walichii and Clusiaceae (e.g. Callophylum spp.). These species only grow well in peat swamp habitats.
Medium Density Forest
- -
High Density Forest
- -

25
8. Land Cover Classification 8.1 Refined land cover map with title, date, legend, and any HCS forest patches identified
The results of the preliminary land cover stratification were validated against independently
collected data from ground surveys to produce the final land cover. Validation is an iterative process
and includes analysis of the following factors:
• Satellite imagery interpretation
• Carbon stock (ton per ha - from inventory data)
• Species mix (from inventory data), e.g. predominance of pioneer species such as
Macaranga spp, existence of planted trees (mixed garden, eg. rubber, fruit trees)
• Diameter distribution (from inventory data) and in particular the predominance of
larger diameter trees e.g. DBH 30cm up
• Plot photos
• Observations of inventory teams
• Discussions with Greenpeace and GAR
Figure 14. Land cover map of PT. PGM

26
9. Patch Analysis Result 9.1 Results of Decision Tree
Table 8. Results of Decision Tree
Number Total area (ha)
Of which core (ha)
Priority (Low-LP, Medium-MP, High-HP)
Description of Decision Tree results
1 20.89 0.17 Low Priority Develop
2 43.27 1.09 High Priority Conserve
3 25.3 1.14 Low Priority Develop
4 24.71 0.73 Low Priority Develop
5 48.95 13.67 Medium Priority Conserve
6 53.61 14.66 Medium Priority Conserve
7 20.02 1.68 Low Priority Develop
8 46 6.97 Low Priority Develop
9 76.18 15.78 Medium Priority Conserve
10 1378.38 961.18 High Priority Conserve
11 7.56 0 Low Priority Develop
12 33.29 1.46 Low Priority Develop
13 64.03 20.84 High Priority Conserve
14 18.22 0 High Priority Conserve
15 8.82 0.39 Low Priority Develop
16 10.72 0.24 High Priority Conserve
17 16 0.33 Low Priority Develop
18 5.77 0.1 Low Priority Develop
19 48.21 20.39 Medium Priority Conserve
20 8.84 0.14 Low Priority Develop
21 8.15 0.2 Low Priority Develop
22 77.06 6.34 Low Priority Develop
23 9.96 0.98 Low Priority Develop
24 13.87 0.14 Low Priority Develop
25 1315.88 984.03 High Priority Conserve
26 31.8 8.17 Low Priority Develop
27 6.47 0.02 Low Priority Develop
28 32.39 7.93 Low Priority Develop
29 42.42 12.41 Medium Priority Pre-RBA
30 23.9 5.75 Low Priority Develop
31 45.06 8.19 Low Priority Develop
32 16.45 0.32 Low Priority Develop
33 6.07 0.06 Low Priority Develop
34 117.92 18.19 High Priority Conserve
35 19.07 1.13 Low Priority Develop
36 77.89 5.95 Medium Priority Conserve
37 24.41 1.68 High Priority Conserve

27
9.2 Comments on Decision Tree outcome
With a natural forest cover of less than 30%, the PT PGM concession is considered to be of ‘low
forest cover’ (based on HCS Approach Toolkit Ver.1 definitions). Thus, the pathway through the
patch analysis decision tree adds more weight to the conservation of medium and low priority HCS
patches.
Each HCS forest patch is further classified according to the follow-up action that was taken (please
note that all patch analysis outcomes are subject to the results of the HCV assessment, and PM and
PCP processes and were therefore considered ‘indicative’, section 3.5);
• Indicative develop upon agreement in PM and PCP: Included areas of grasslands and
existing plantations, highly disturbed ecosystems not considered HCSA forest, or small low
priority patches that may have operational constraints.
• Indicative conserve upon agreement in PM and PCP: Areas identified as either high priority
patches during Step 3 or medium priority patches that fulfil the risk assessment
requirements of Step 7.
• Indicative conserve needing Pre-Rapid Biodiversity Assessment (RBA) then agreed through
PM and PCP: Patches within this class require a Pre-RBA, as seen in Steps 8-10 in the
decision tree.
The results of the patch analysis, all subject to HCV, PM and PCP, show;
• An area of 507 ha indicative for development,
• An area of 3,278 ha indicative for conservation
• An area of 42 ha requiring Pre-RBA
The results of the Pre-RBA indicate that the area is a rich mineral swamp forest, likely to be high in
biodiversity and should therefore be conserved. This result was also confirmed by the HCV
assessment (2010) and increases the total indicative conservation area to 3,320 ha. The indicative
development area remains the same at 507 ha.
The indicative development patches consist of disconnected, smaller core areas, distributed in the
middle of PT PGM, often contiguous with roads connecting villages and therefore in a high-risk
category. These areas are dominated by YRF. The results are presented in detail in Figure 13. The
total indicative development area (subject to PM) is the sum of the non-HCS areas and the indicative
development patches, and equals a total of 16,034 ha.
The indicative conservation patch areas are concentrated in the South-East and West of PT. PGM.
The areas are low-density forest growing in peat swamp and near riparian zones of the Kapuas River.
Indicative conservation patch areas are also found in the northern part of PT PGM concession and
are connected with the forest areas of PT. Paramitra Internusa Pratama (PT. PIP), another
concession managed by Golden-Agri Resources. The patch analysis also indicates that one patch with
the size of 42 ha requires a Pre-RBA survey. The Pre-RBA survey consists of a walk-through along a
predefined survey path, to which record the social and environmental attributes such as suitability
for plantation, indicative HCV areas, and evidence of human use. The spatial distribution of
indicative conservation and development areas is presented in detail in Figure 13.

28
10. Indicative Land Use Plan 10.1 Summary of results of final ground verification (if any)
No.
10.2 Final HCS map
Figure 15. HCS forest map
10.3 Overview of forest conservation management and monitoring activities to be included in
the Conservation and Development (land use) Plan (Rencana Kerja dalam Dokumen PCP/Lebih
menitikberatkan di forest-nya)
Management and monitoring plan and the supporting standard operational procedures would be
prepared as part of the land use plan. List of activities to be included in the land use plan are:
1. HCS boundary verification and marking 2. Threat and disturbance identification and patrol monitoring 3. Monitoring the growth of trees and update stratification 4. In the HCS area which overlap with HCV area, conduct biodiversity monitoring 5. Scheduled socialization to the community and worker

29
10.4 List of activities still to be carried out before Conservation and Development Plan can be
finalised
In order to fully inform future land use planning decisions, PT PGM will update maps with the
following information:
• The updated 2017 HCV maps
• Confirmation of whether the 1,418 ha historically identified as HCV area and/or HCS forests
that are now under community use, were indeed HCS forests or HCV areas at the time of the
original assessments
The latest information and maps are currently being discussed with communities through the PCP
approach. Once all of the information has been collated and communities are in agreement and
supportive of the areas for conservation, company use and community use, PT. PGM’s final Land Use
Plan will be developed.
In addition, PT. PGM will develop a rehabilitation, management and monitoring plan for the
conservation areas within its concession, engaging local communities, and will walk and clearly
demarcate the identified conservation areas from this assessment. PT PGM will also collaborate with
communities to establish similar interventions towards conservation areas outside the PT. PGM’s
HGU.
Related Documents