Summary of soil P levels and stratification GLPF Grant- Team meeting #5 July 23-24, 2013

Summary of soil P levels and stratification GLPF Grant- Team meeting #5 July 23-24, 2013.
Dec 14, 2015
Welcome message from author
This document is posted to help you gain knowledge. Please leave a comment to let me know what you think about it! Share it to your friends and learn new things together.
Transcript

Summary of soil P levels and stratification
GLPF Grant- Team meeting #5July 23-24, 2013
Lake Erie eutrophication and dissolved P loads
• Maumee and Sandusky Rivers are the two largest tributaries to Lake Erie 74-78% Agriculture
0
200
400
600
800
1000
Maumee River
1980 1990 2000 2010
Dis
solv
ed R
eact
ive
Pho
spho
rus
(met
ric t
ons)
0
50
100
150
200Sandusky River
Data from: Heidelberg Tributary Loading Program
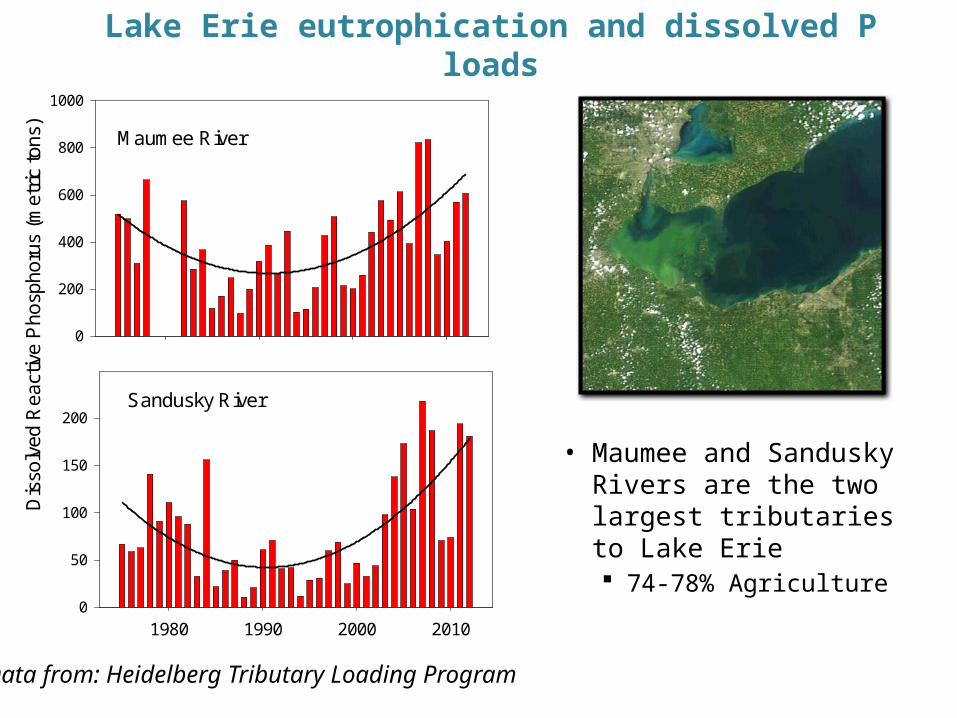
Conservation practices in the Lake Erie Watershed
• Large-scale conservation practices have been adopted throughout the Lake Erie basin to reduce soil erosion No-till or reduced till Conservation reserve program
• Has successfully reduced sediment loading (Richards et al. 2008, 2009)
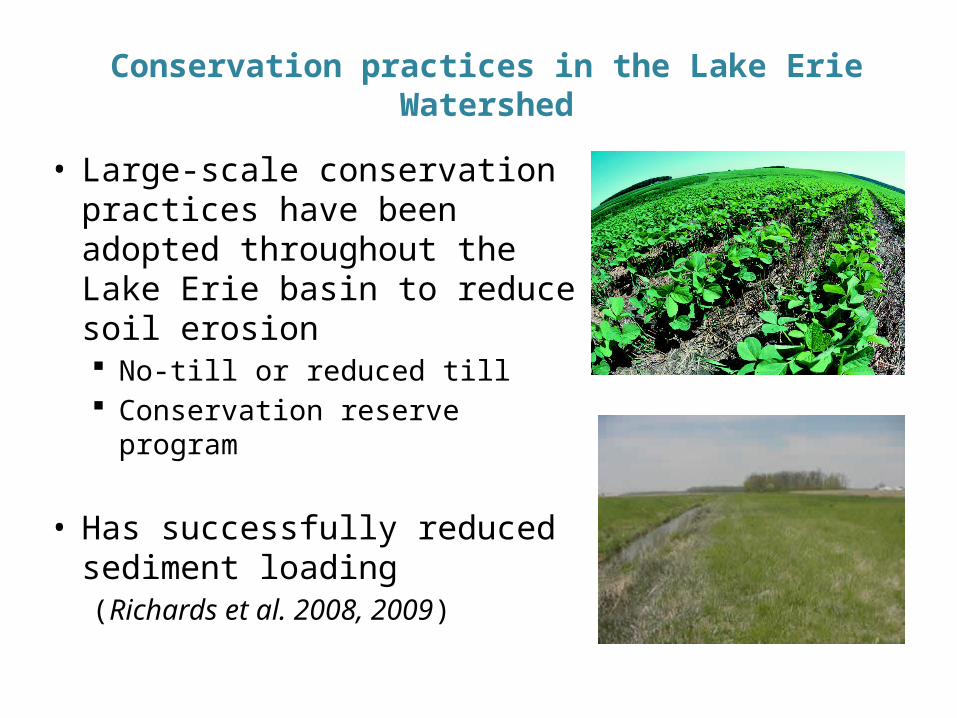
Why is dissolved P increasing?
• Typical agronomic soil tests use 0-8” cores• P stratification occurs under no-till practices from the lack of
soil mixing and application of surface fertilizers• Runoff in Maumee and Sandusky Rivers tend to be surficial and
interacts with the top 1-2” of soil
From Sharpley 2003From Vadas et al. 2005
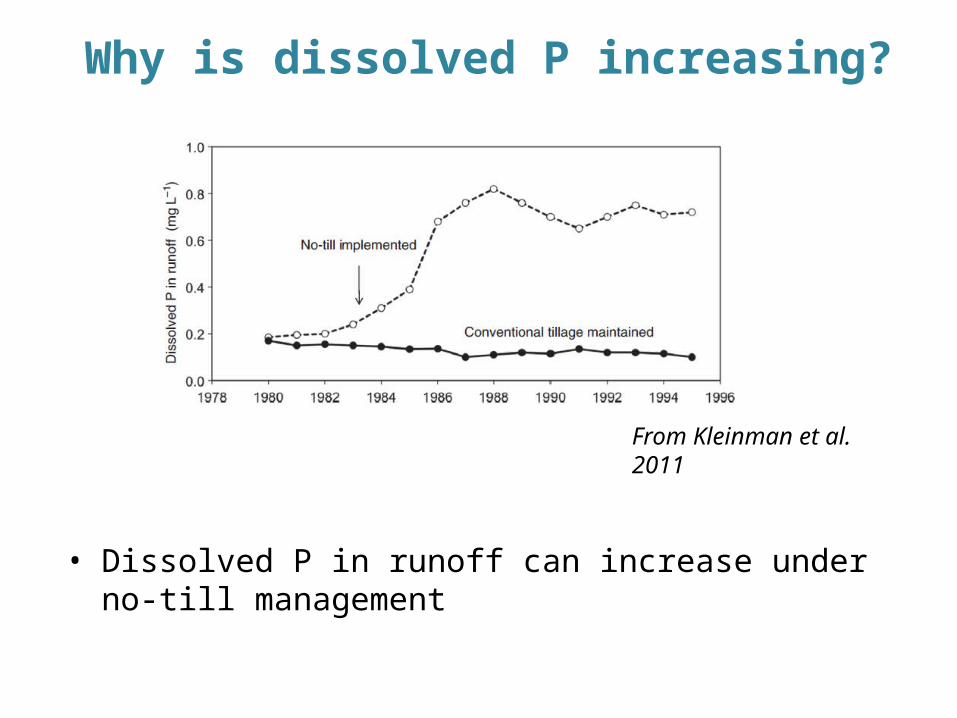
Why is dissolved P increasing?
• Dissolved P in runoff can increase under no-till management
From Kleinman et al. 2011
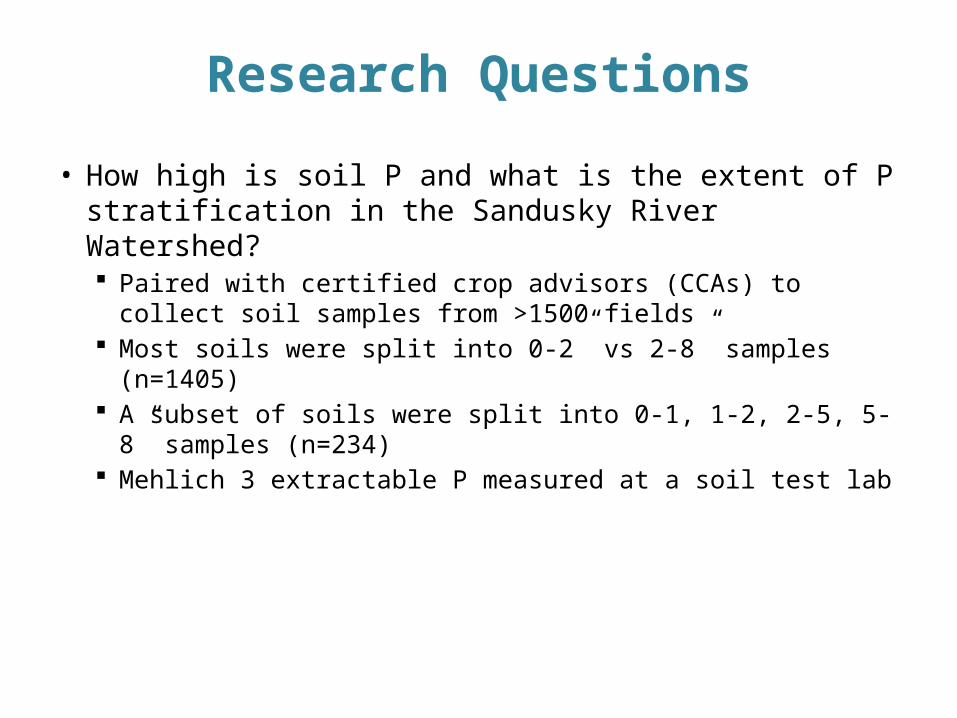
Research Questions
• How high is soil P and what is the extent of P stratification in the Sandusky River Watershed? Paired with certified crop advisors (CCAs) to collect soil
samples from >1500 fields Most soils were split into 0-2” vs 2-8” samples (n=1405) A subset of soils were split into 0-1, 1-2, 2-5, 5-8” samples
(n=234) Mehlich 3 extractable P measured at a soil test lab
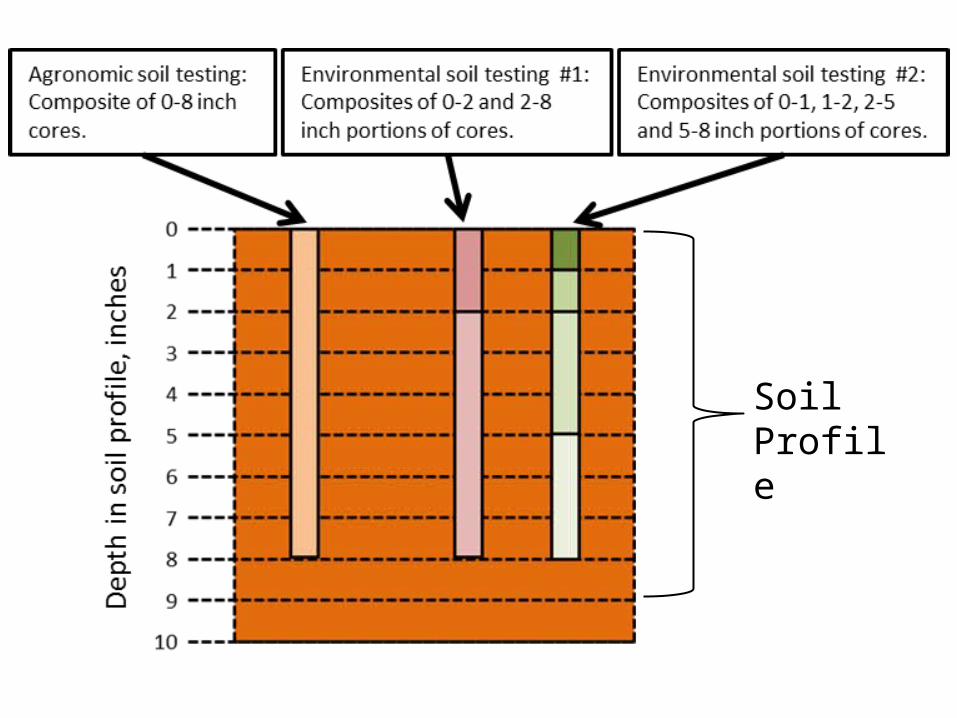
Soil Profile
Research Questions
• Does DRP readily exchange with the typical agricultural soil? Dilute Aqueous Soil Solution (DASS) Extracted DRP from 1 g of soil in 1 L of distilled water
Research Questions
• Does DRP readily exchange with the typical agricultural soil? Dilute Aqueous Soil Solution (DASS) Extracted DRP from 1 g of soil in 1 L of distilled water
• How variable is P stratification within a given field spatially and temporally? Select fields received gridded sampling every ~10 meters
to examine spatial variation (n=78) A subset of fields were sampled in 2009 and again in 2012
to examine temporal variation (n=74)
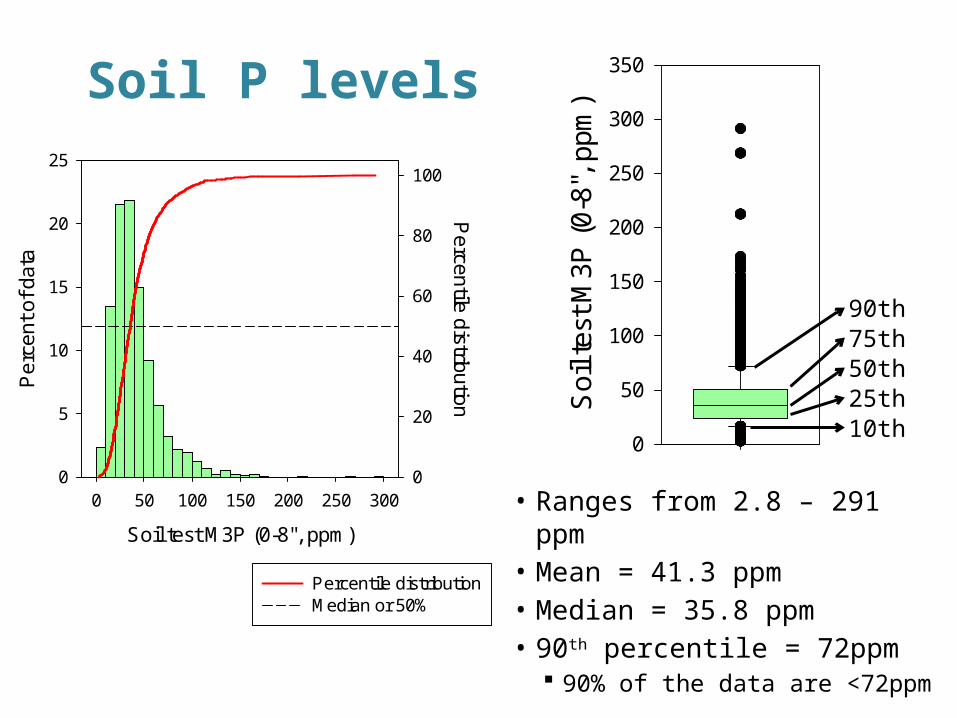
Soil P levels
• Ranges from 2.8 – 291 ppm• Mean = 41.3 ppm • Median = 35.8 ppm • 90th percentile = 72ppm
90% of the data are <72ppm
Soil test M3P (0-8", ppm)
0 50 100 150 200 250 300
Per
cent
of d
ata
0
5
10
15
20
25
Percentile distribution
0
20
40
60
80
100
Percentile distributionMedian or 50%
Soi
l tes
t M3P
(0-
8",
ppm
)
0
50
100
150
200
250
300
350
50th25th10th
75th90th
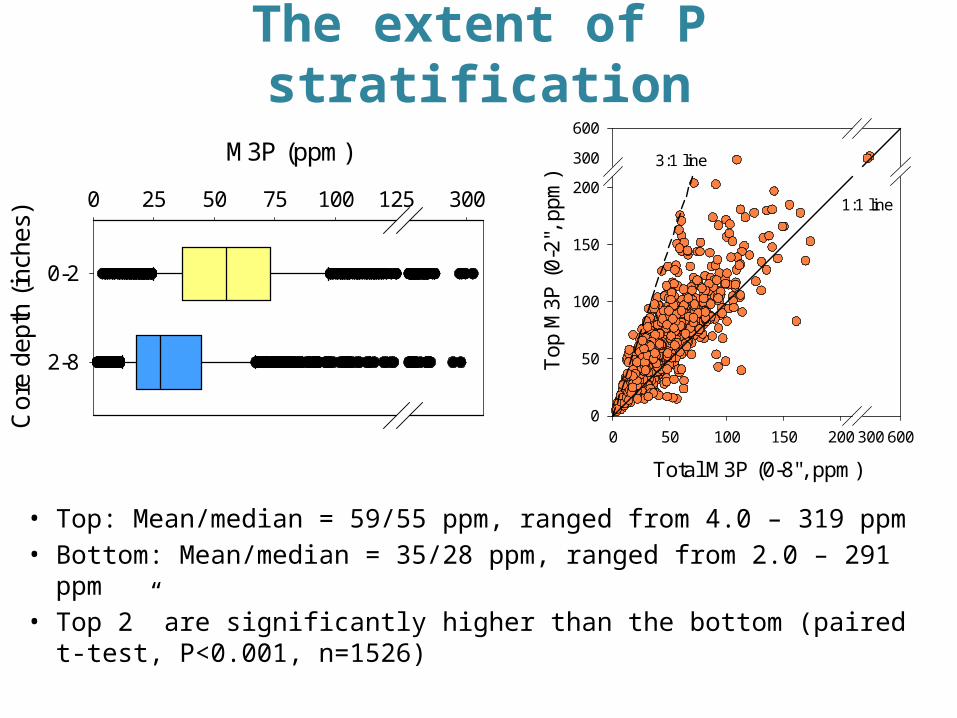
The extent of P stratification
• Top: Mean/median = 59/55 ppm, ranged from 4.0 – 319 ppm • Bottom: Mean/median = 35/28 ppm, ranged from 2.0 – 291 ppm• Top 2” are significantly higher than the bottom (paired t-test,
P<0.001, n=1526)
M3P (ppm)
0 25 50 75 100 125 300
Cor
e de
pth
(inch
es)
0-2
2-8
Total M3P (0-8", ppm)
0 50 100 150 200 300 600
Top
M3P
(0-
2", p
pm)
0
50
100
150
200
300
600
1:1 line
3:1 line
Rat
io o
f Top
:Tot
al M
3P
0
1
2
3
4
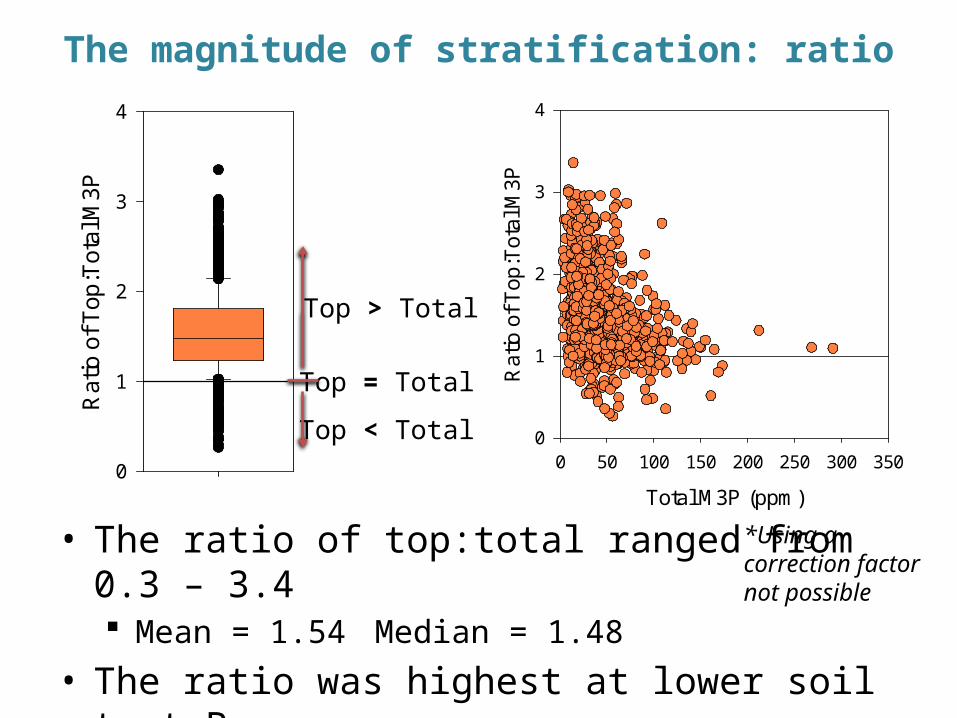
The magnitude of stratification: ratio
• The ratio of top:total ranged from 0.3 – 3.4 Mean = 1.54 Median = 1.48
• The ratio was highest at lower soil test P Dividing by a smaller # ?
Top > Total
Total M3P (ppm)
0 50 100 150 200 250 300 350
Ra
tio o
f To
p:T
ota
l M3
P
0
1
2
3
4
Top = Total
Top < Total
*Using a correction factor not possible
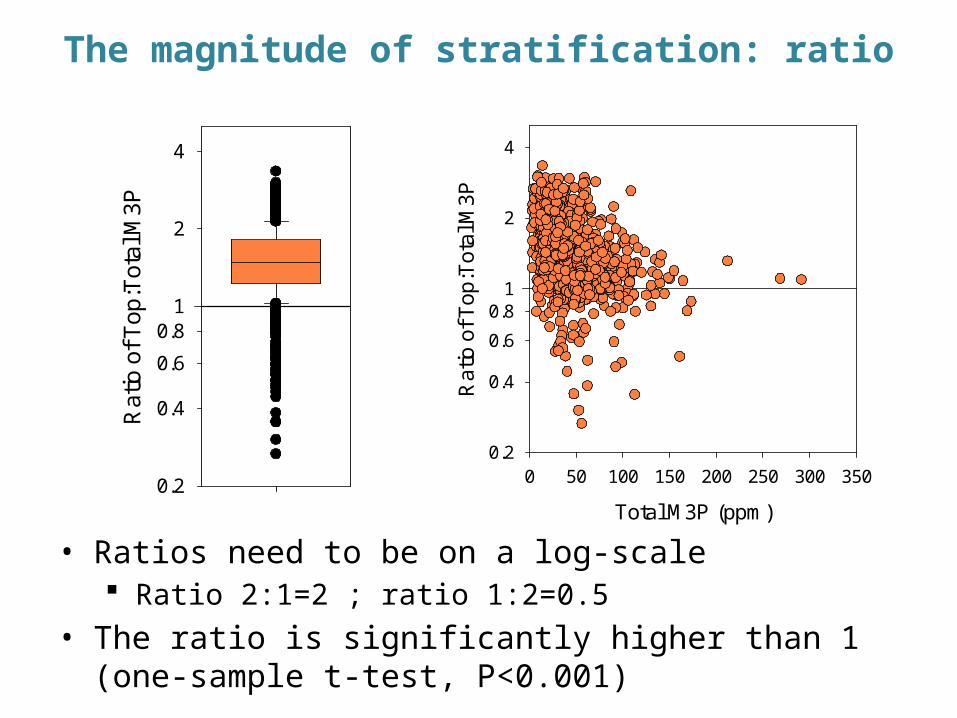
The magnitude of stratification: ratio
• Ratios need to be on a log-scale Ratio 2:1=2 ; ratio 1:2=0.5
• The ratio is significantly higher than 1 (one-sample t-test, P<0.001)
Rat
io o
f Top
:Tot
al M
3P
0.2
0.4
0.6
0.8
2
4
1
Total M3P (ppm)
0 50 100 150 200 250 300 350R
atio
of T
op:T
otal
M3P
0.2
0.4
0.6
0.8
2
4
1
M3P
diff
ere
nce
(top
- to
tal)
-100
-50
0
50
100
150
200
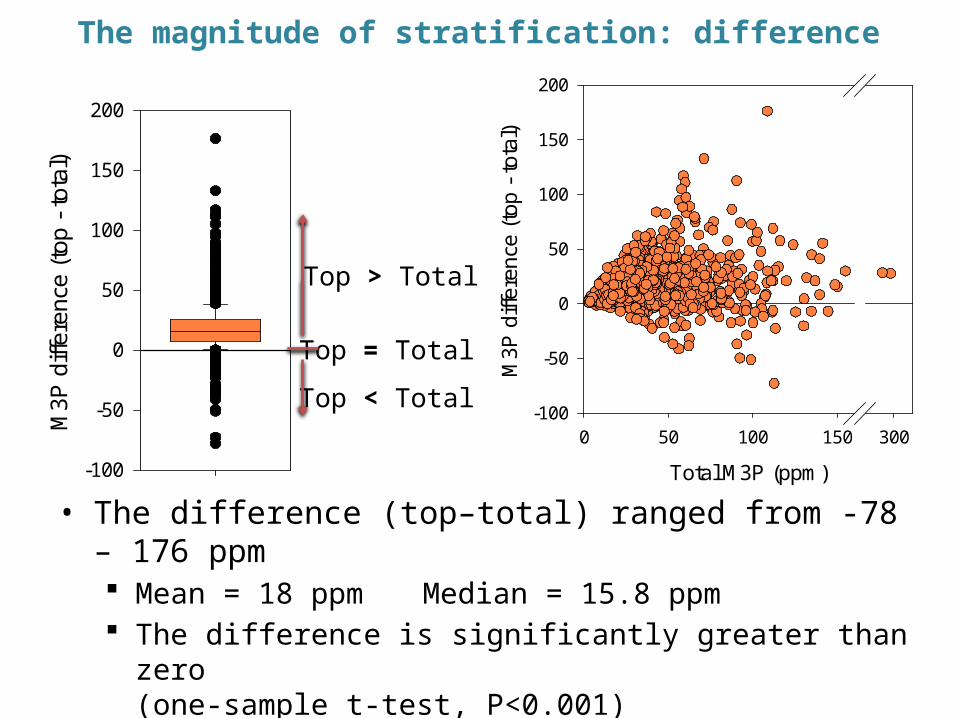
• The difference (top–total) ranged from -78 – 176 ppm Mean = 18 ppm Median = 15.8 ppm The difference is significantly greater than zero
(one-sample t-test, P<0.001)• The difference was highest at higher soil test P
Top > Total
Top = Total
Top < Total
Total M3P (ppm)
0 50 100 150 300
M3
P d
iffer
ence
(to
p -
tota
l)
-100
-50
0
50
100
150
200
The magnitude of stratification: difference
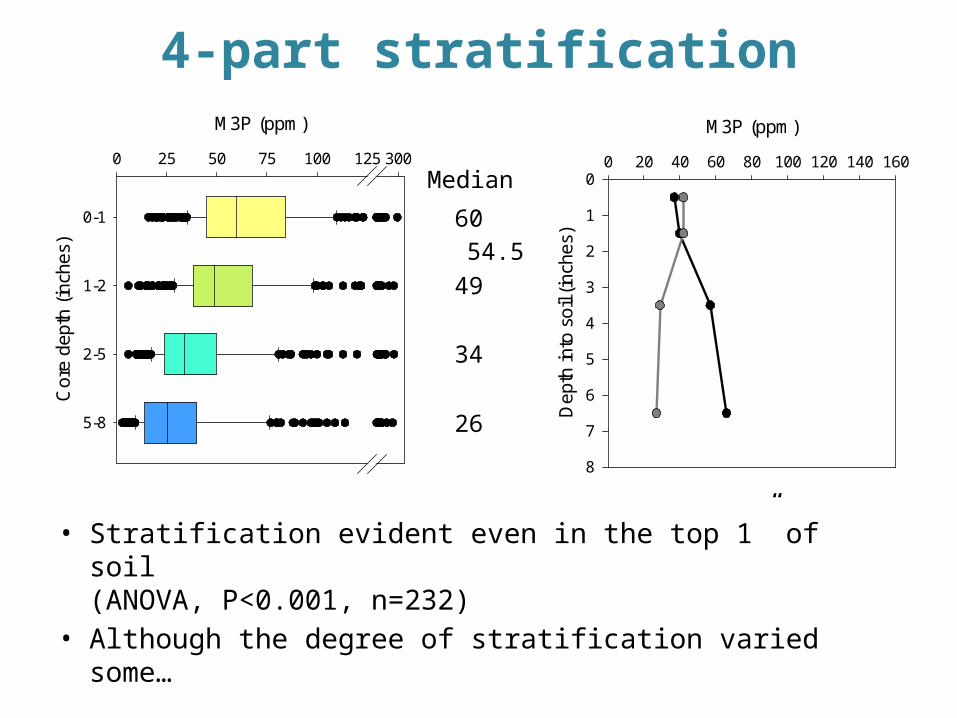
4-part stratification
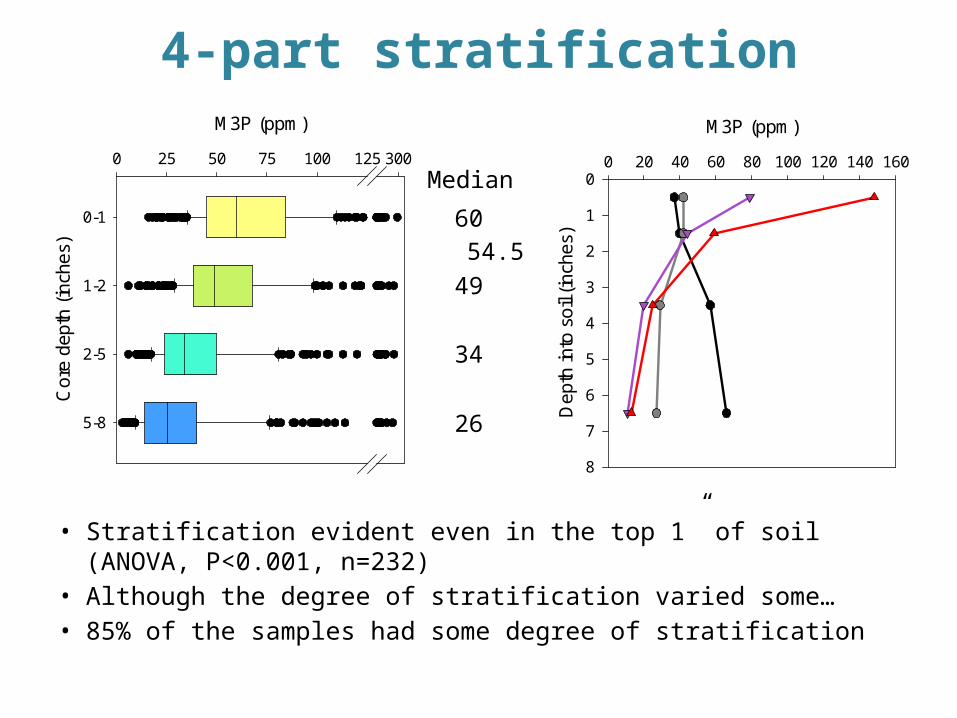
• Stratification evident even in the top 1” of soil (ANOVA, P<0.001, n=232)
• Although the degree of stratification varied some…
M3P (ppm)
0 25 50 75 100 125 300
Cor
e de
pth
(inch
es)
0-1
1-2
2-5
5-8
Median
60
49
34
26
54.5
M3P (ppm)
0 20 40 60 80 100 120 140 160
Dep
th in
to s
oil (
inch
es)
0
1
2
3
4
5
6
7
8
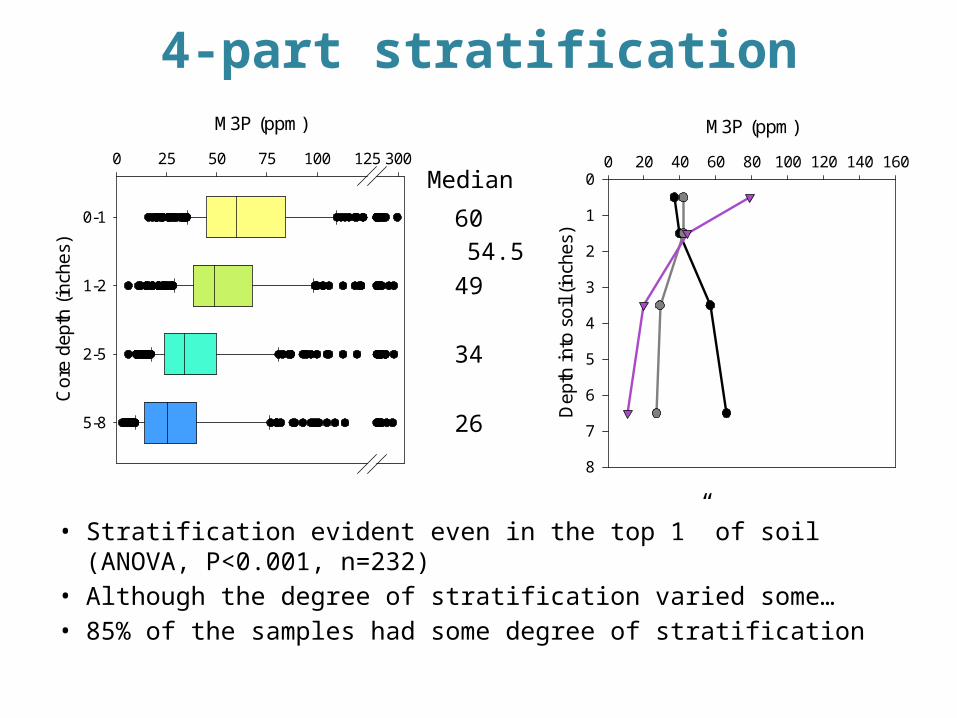
4-part stratification
• Stratification evident even in the top 1” of soil (ANOVA, P<0.001, n=232)
• Although the degree of stratification varied some… • 85% of the samples had some degree of stratification
M3P (ppm)
0 25 50 75 100 125 300
Cor
e de
pth
(inch
es)
0-1
1-2
2-5
5-8
Median
60
49
34
26
54.5
M3P (ppm)
0 20 40 60 80 100 120 140 160
Dep
th in
to s
oil (
inch
es)
0
1
2
3
4
5
6
7
8
4-part stratification
• Stratification evident even in the top 1” of soil (ANOVA, P<0.001, n=232)
• Although the degree of stratification varied some… • 85% of the samples had some degree of stratification
M3P (ppm)
0 20 40 60 80 100 120 140 160
Dep
th in
to s
oil (
inch
es)
0
1
2
3
4
5
6
7
8
M3P (ppm)
0 25 50 75 100 125 300
Cor
e de
pth
(inch
es)
0-1
1-2
2-5
5-8
Median
60
49
34
26
54.5
Total M3P (ppm)
0 20 40 60 80 100 120 140 160 180
DR
P in
dilu
te a
queo
us s
oil s
olut
ion
(mg
P/L
)
0.00
0.02
0.04
0.06
0.08
0.10
0.12
0.14
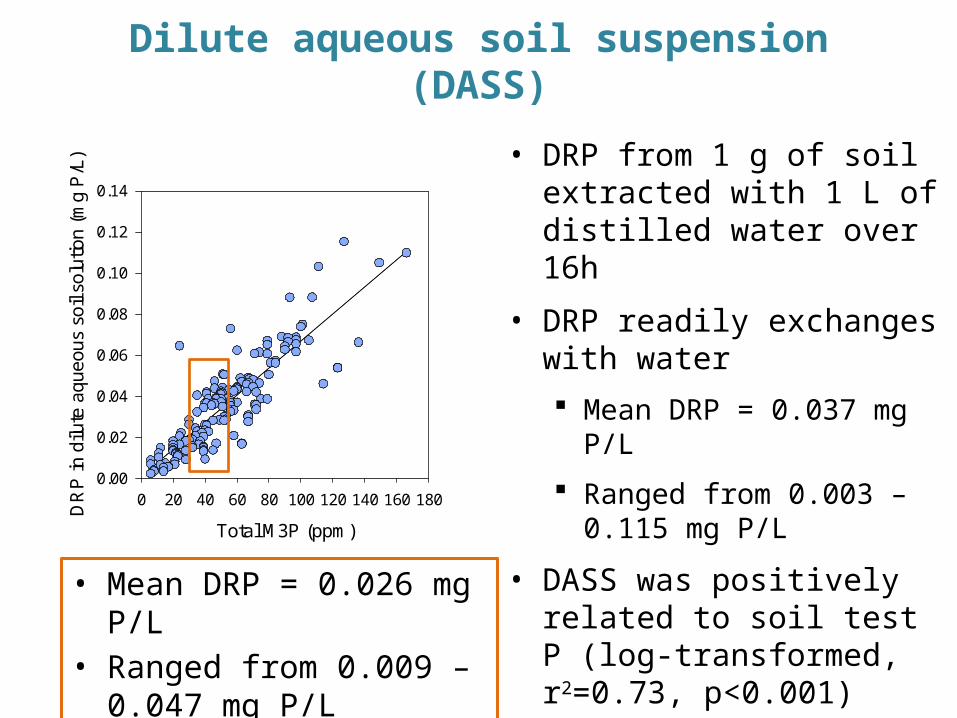
Dilute aqueous soil suspension (DASS)
• DRP from 1 g of soil extracted with 1 L of distilled water over 16h
• DRP readily exchanges with water Mean DRP = 0.037 mg P/L
Ranged from 0.003 – 0.115 mg P/L
• DASS was positively related to soil test P (log-transformed, r2=0.73, p<0.001)• Mean DRP = 0.026 mg P/L
• Ranged from 0.009 – 0.047 mg P/L
2009 Total M3P (ppm)
0 20 40 60 80 100 120140 160 180
2012
Tot
al M
3P (
ppm
)
0
20
40
60
80
100
120
140
160
180
2009 Ratio of Top:Total M3P
0 1 2 3 4 5
2012
Rat
io o
f T
op:T
otal
M3P
0
1
2
3
4
5
2009 M3P difference (top - total, ppm)
-50 0 50 100 150
2012
M3P
diff
eren
ce (
top
- to
tal,
ppm
)
-50
0
50
100
1501:1 line 1:1 line 1:1 line
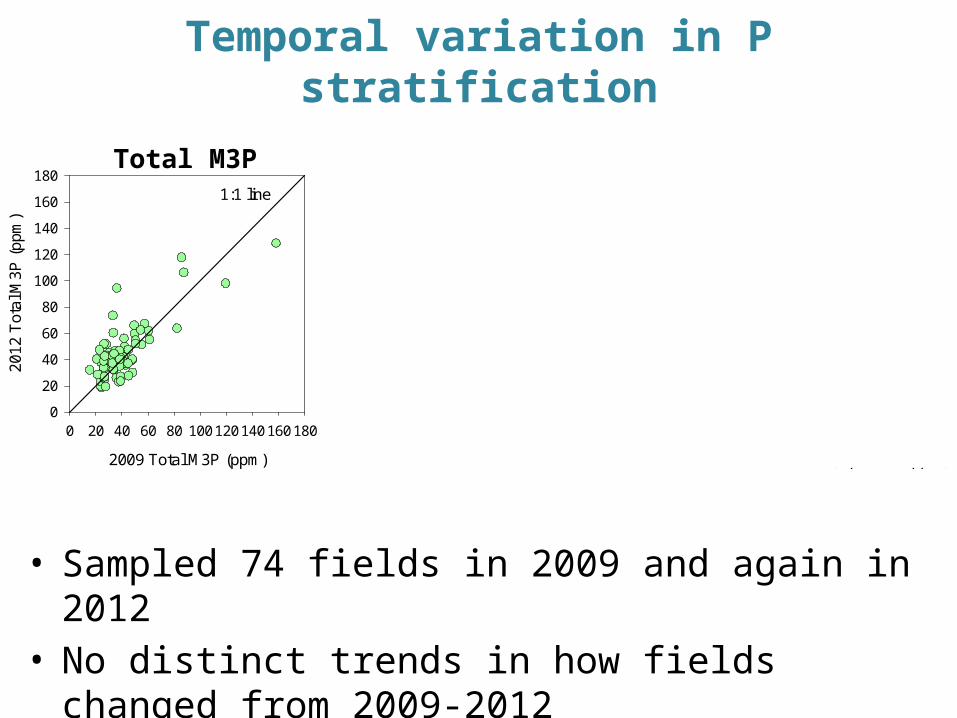
Temporal variation in P stratification
• Sampled 74 fields in 2009 and again in 2012• No distinct trends in how fields changed from 2009-2012
Total M3P Ratio Difference
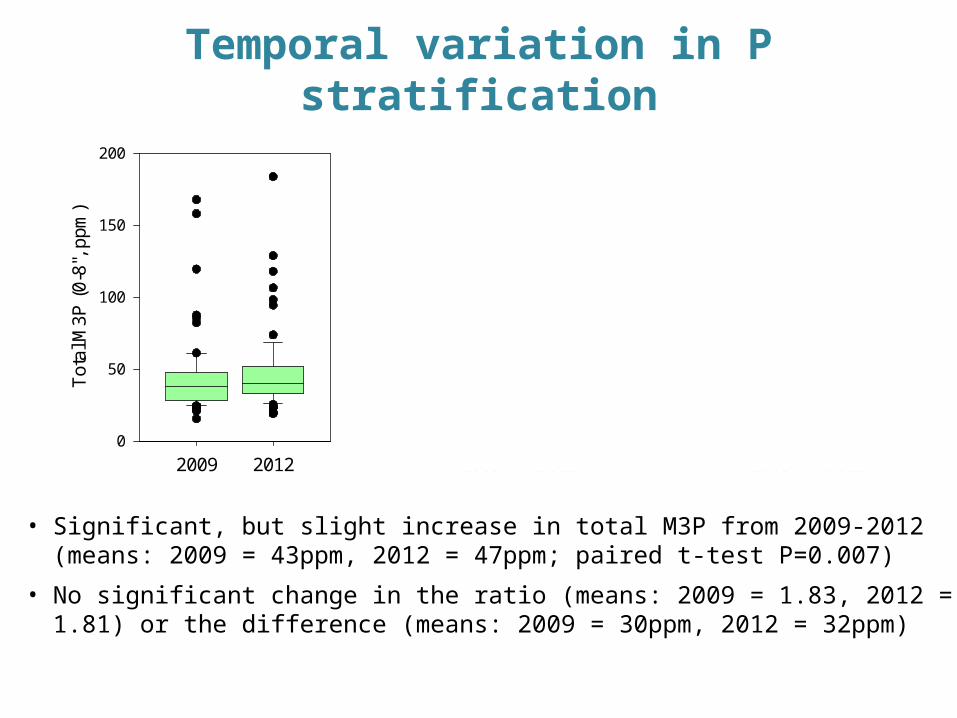
Temporal variation in P stratification
• Significant, but slight increase in total M3P from 2009-2012 (means: 2009 = 43ppm, 2012 = 47ppm; paired t-test P=0.007)
• No significant change in the ratio (means: 2009 = 1.83, 2012 = 1.81) or the difference (means: 2009 = 30ppm, 2012 = 32ppm)
2009 2012
Tot
al M
3P (
0-8"
, ppm
)
0
50
100
150
200
2009 2012
Rat
io o
f Top
:Tot
al M
3P
0.2
0.4
0.6
0.8
2
4
1
2009 2012
M3P
diff
eren
ce (
top
- to
tal,
ppm
)
-80
-60
-40
-20
0
20
40
60
80
100
120
Temporal variation in P stratification
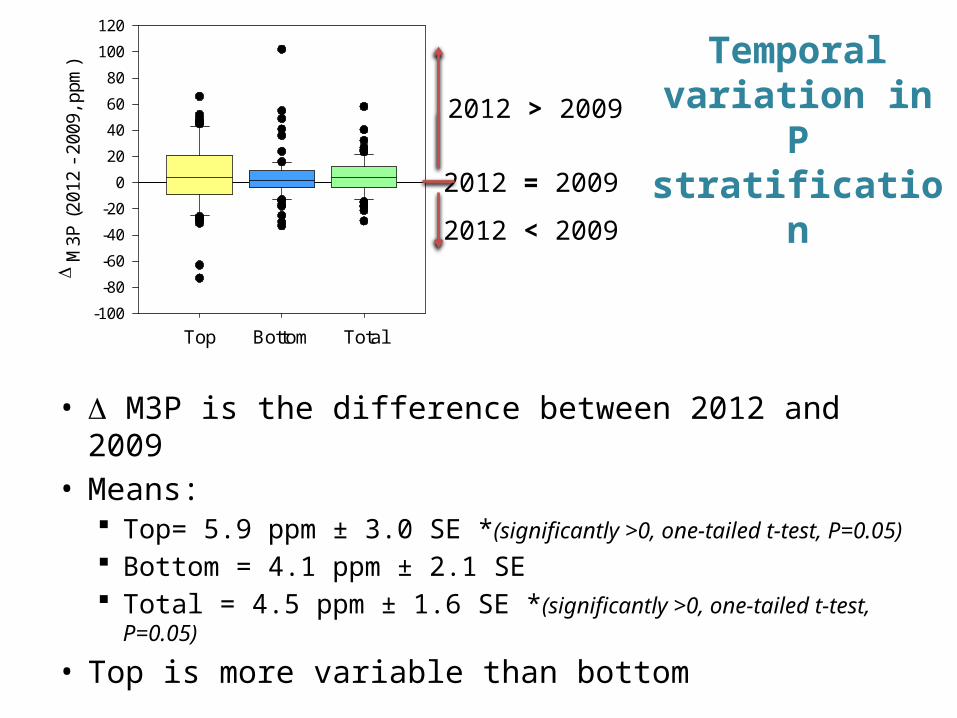
• D M3P is the difference between 2012 and 2009• Means:
Top= 5.9 ppm ± 3.0 SE *(significantly >0, one-tailed t-test, P=0.05) Bottom = 4.1 ppm ± 2.1 SE Total = 4.5 ppm ± 1.6 SE *(significantly >0, one-tailed t-test, P=0.05)
• Top is more variable than bottom
Top Bottom Total
M
3P (
2012
- 2
009,
ppm
)
-100
-80
-60
-40
-20
0
20
40
60
80
100
120
2012 > 2009
2012 = 2009
2012 < 2009
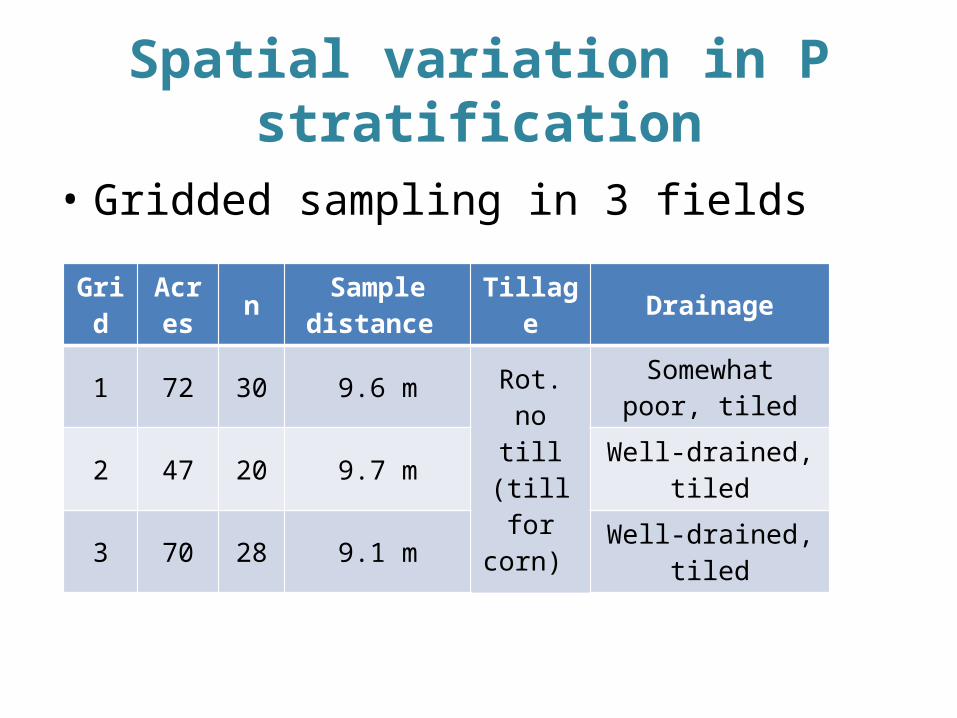
Spatial variation in P stratification
• Gridded sampling in 3 fields
Grid Acres n Sample distance Tillage Drainage
1 72 30 9.6 mRot. no till (till
for corn)
Somewhat poor, tiled
2 47 20 9.7 m Well-drained, tiled
3 70 28 9.1 m Well-drained, tiled
5 10 15 20 25 30 35
Met
ers
10
20
30
40
50
60
70
5 10 15 20 25 30 35
10
20
30
40
50
60
70
Meters
6 8 101214
20
40
60
80
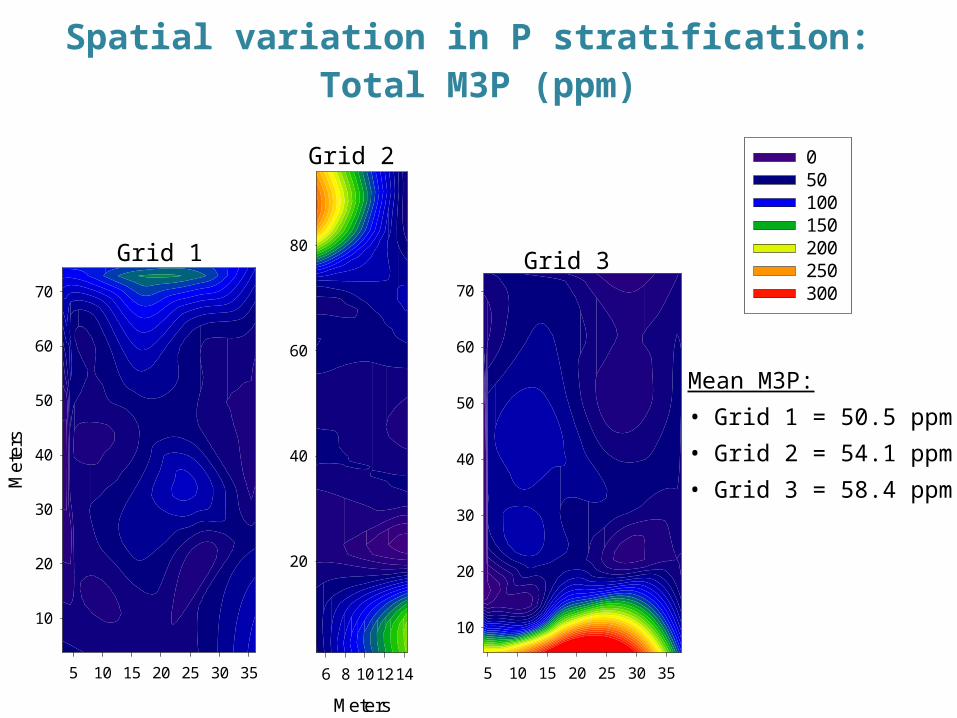
Spatial variation in P stratification: Total M3P (ppm)
Mean M3P:• Grid 1 = 50.5 ppm• Grid 2 = 54.1 ppm• Grid 3 = 58.4 ppm
0 50 100 150 200 250 300
Grid 1
Grid 2
Grid 3
5 10 15 20 25 30 35
10
20
30
40
50
60
70
Meters
6 8 101214
20
40
60
80
5 10 15 20 25 30 35
Met
ers
10
20
30
40
50
60
70
0.6 0.8 1.0 1.2 1.4 1.6 1.8 2.0
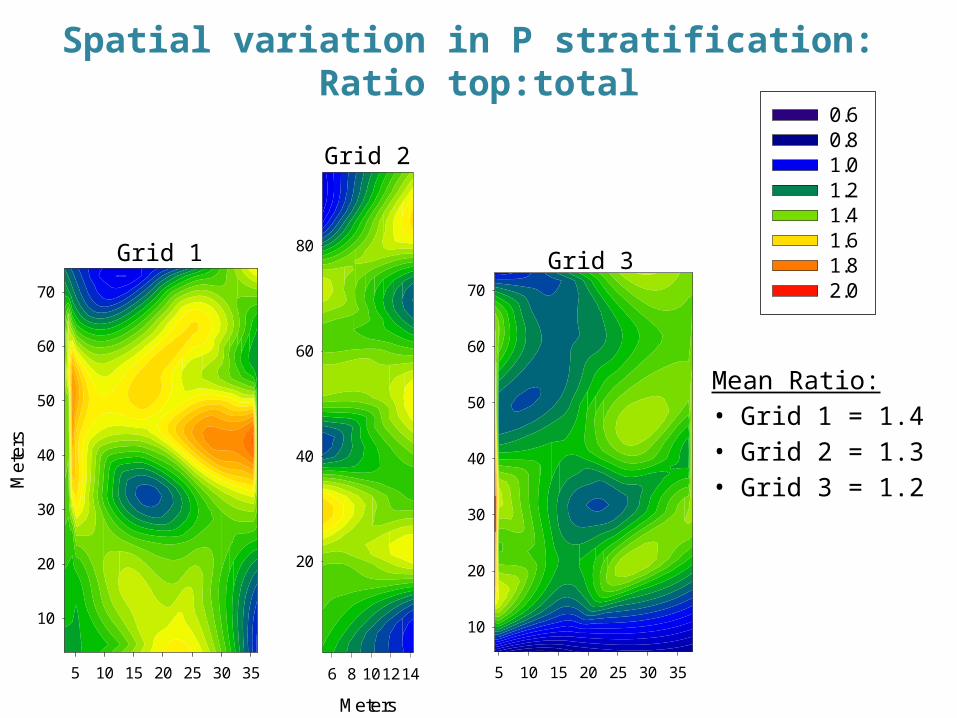
Spatial variation in P stratification: Ratio top:total
Mean Ratio:• Grid 1 = 1.4• Grid 2 = 1.3• Grid 3 = 1.2
Grid 1
Grid 2
Grid 3
0.6 0.8 1.0 1.2 1.4 1.6 1.8 2.0
Meters
6 8 101214
20
40
60
80
5 10 15 20 25 30 35
10
20
30
40
50
60
70
5 10 15 20 25 30 35
Met
ers
10
20
30
40
50
60
70
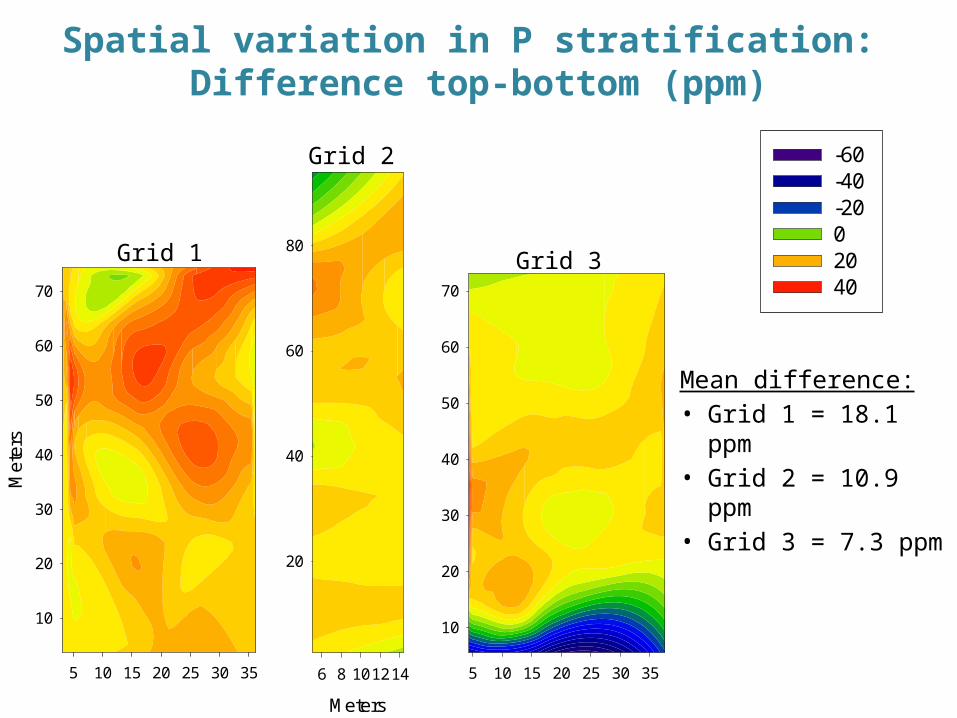
Spatial variation in P stratification: Difference top-bottom (ppm)
Mean difference:• Grid 1 = 18.1 ppm• Grid 2 = 10.9 ppm• Grid 3 = 7.3 ppm
Grid 1
Grid 2
Grid 3
-60 -40 -20 0 20 40
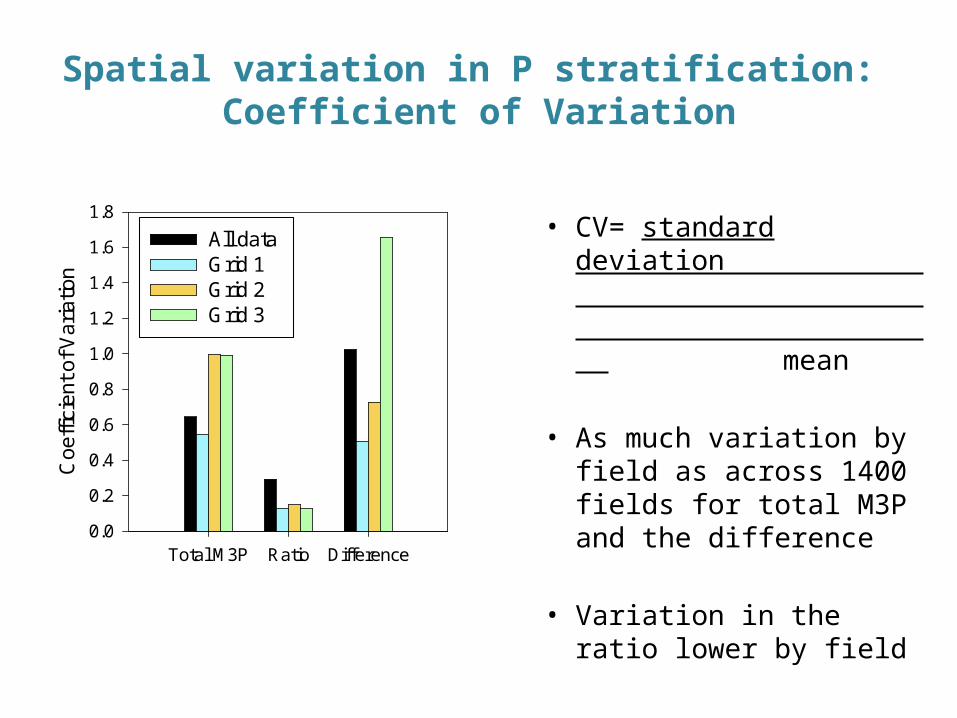
• CV= standard deviation mean
• As much variation by field as across 1400 fields for total M3P and the difference
• Variation in the ratio lower by field
Spatial variation in P stratification: Coefficient of Variation
Total M3P Ratio Difference
Coe
ffici
ent o
f Var
iatio
n
0.0
0.2
0.4
0.6
0.8
1.0
1.2
1.4
1.6
1.8
All data Grid 1 Grid 2 Grid 3
Summary
• Most (90%) total soil test P levels are <72ppm
• Soil P stratification is prevalent in the Sandusky River Watershed
• P in soil readily exchanges with water and this exchange is predicted by M3P
• Fields tend to accumulate P over time and this accumulation appears to be higher in the top 2” of soil
• Variation in P levels and stratification can be as high within a field as across 1400 fields
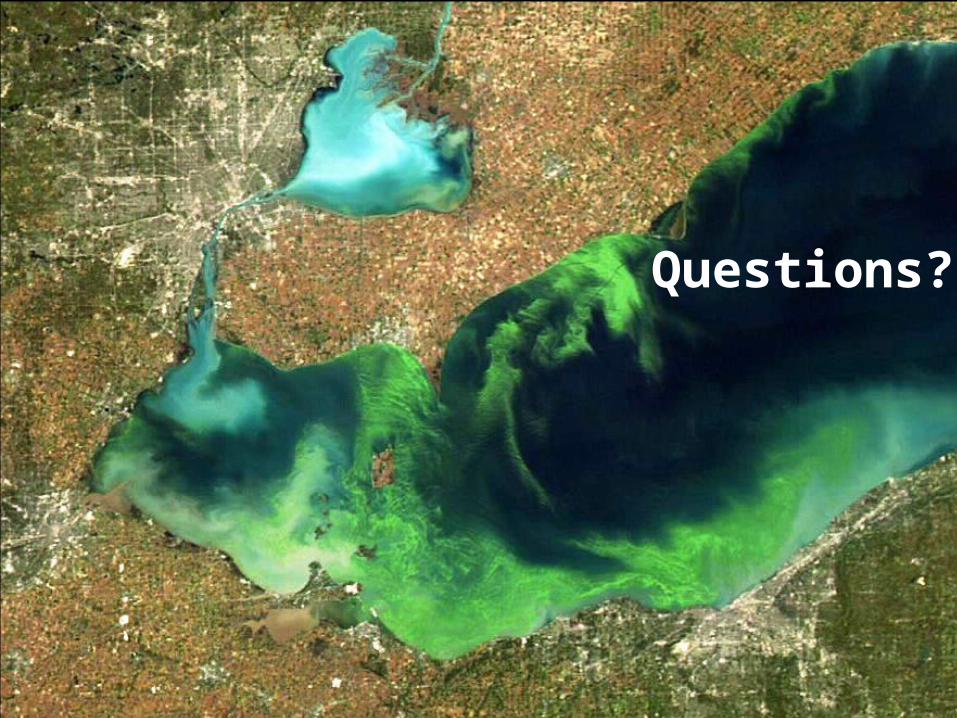
Questions?
Related Documents